1. Introduction
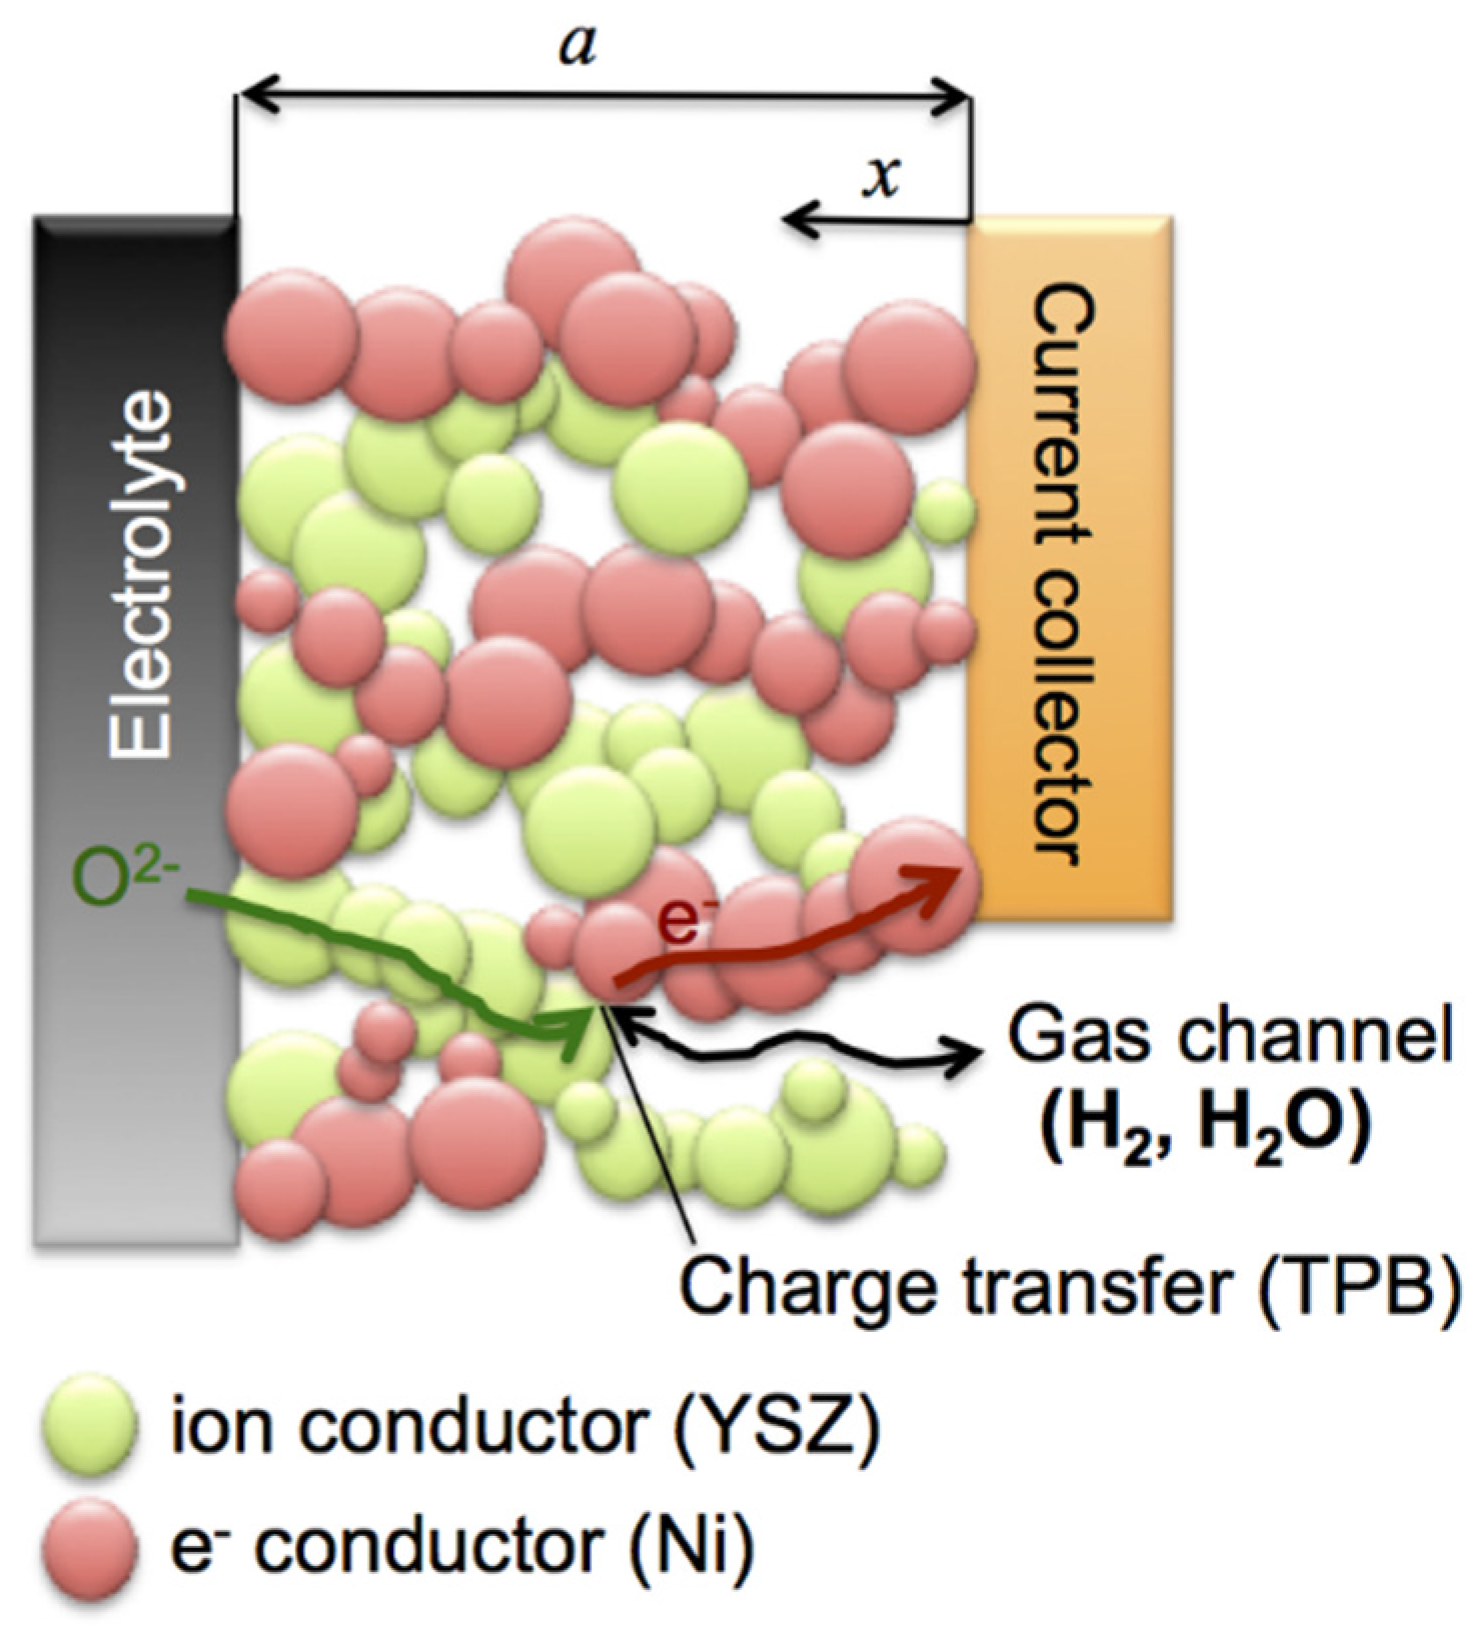
Porous Ni-YSZ is a state-of-the-art anode material for SOFC applications. The anode reaction mechanism includes a coupling of ionic and electronic charge transport with charge transfer, as illustrated in
Figure 1. Each phase is responsible for a specific transport process,
i.e., oxide ions in YSZ, electrons in Ni, and gas/fuel in the pores. The charge transfer reactions take place at the triple phase boundary (TPB). The microstructure of the fresh anode material has a strong impact on the initial performance as well as on the long-term stability and lifetime.
Figure 1.
Schematic representation of Ni-YSZ cermet anode and the mechanism of charge transport and charge transfer processes.
Figure 1.
Schematic representation of Ni-YSZ cermet anode and the mechanism of charge transport and charge transfer processes.
The aim of this study is to unravel the complex relationships among microstructure, anode performance, and degradation behavior upon redox cycling, with a strong focus on the influence from variations in TPB density. The complexity of this topic is mainly due to the fact that the anode performance results from coupled transfer and transport processes. Thereby the charge transfer and the associated ionic and electronic current densities may spread over the anode in different ways, depending on the microstructure and materials properties. For example, if TPB and associated charge transfer kinetics are rate limiting then the electrochemical reaction tends to spread over a relatively thick active layer. In contrast, if the ionic conductivity is relatively low, then the active zone tends to be restricted in a narrow active layer close to the electrolyte-anode interface. Microstructure degradation usually leads to a decrease of both ionic transport as well as charge transfer properties. It is thus not easy to predict how microstructure degradation affects the distribution of current densities and electrochemical activity. The property, which degrades less strongly, usually has a dominating influence on current distribution and in this way it buffers the more severe decrease of the other property and its influence on performance. Hence, knowledge about the distribution of current densities and electrochemical activity is a key to a profound understanding of the relationship between microstructure and anode performance.
Numerical modeling can be used to simulate coupled transport and transfer reactions in order to obtain profiles of current densities throughout the anode [
1,
2,
3]. However, in order to capture the influence of microstructure in a reliable way, the model requires input from detailed 3D-analysis. In our approach, the 3D investigations of fine-, medium-, and coarse-grained anodes are split into two separate publications. A previous paper was focusing on the relationship between topological parameters and effective transport properties [
4]. The present work is dealing with total and active triple phase boundary (TPB) and their relation with anode performance (
Rpol).
Since
Rpol is dependent on both TPB and transport properties, we briefly summarize the findings of the previous publication [
4]. It was shown that the effective ionic and electronic conductivities are related to three main topological factors (
i.e., effective volume fraction Φ
eff, constrictivity β and tortuosity τ) of YSZ and Ni, respectively. Thereby, it was also observed that degradation of fine and coarse anodes have very different characteristics:
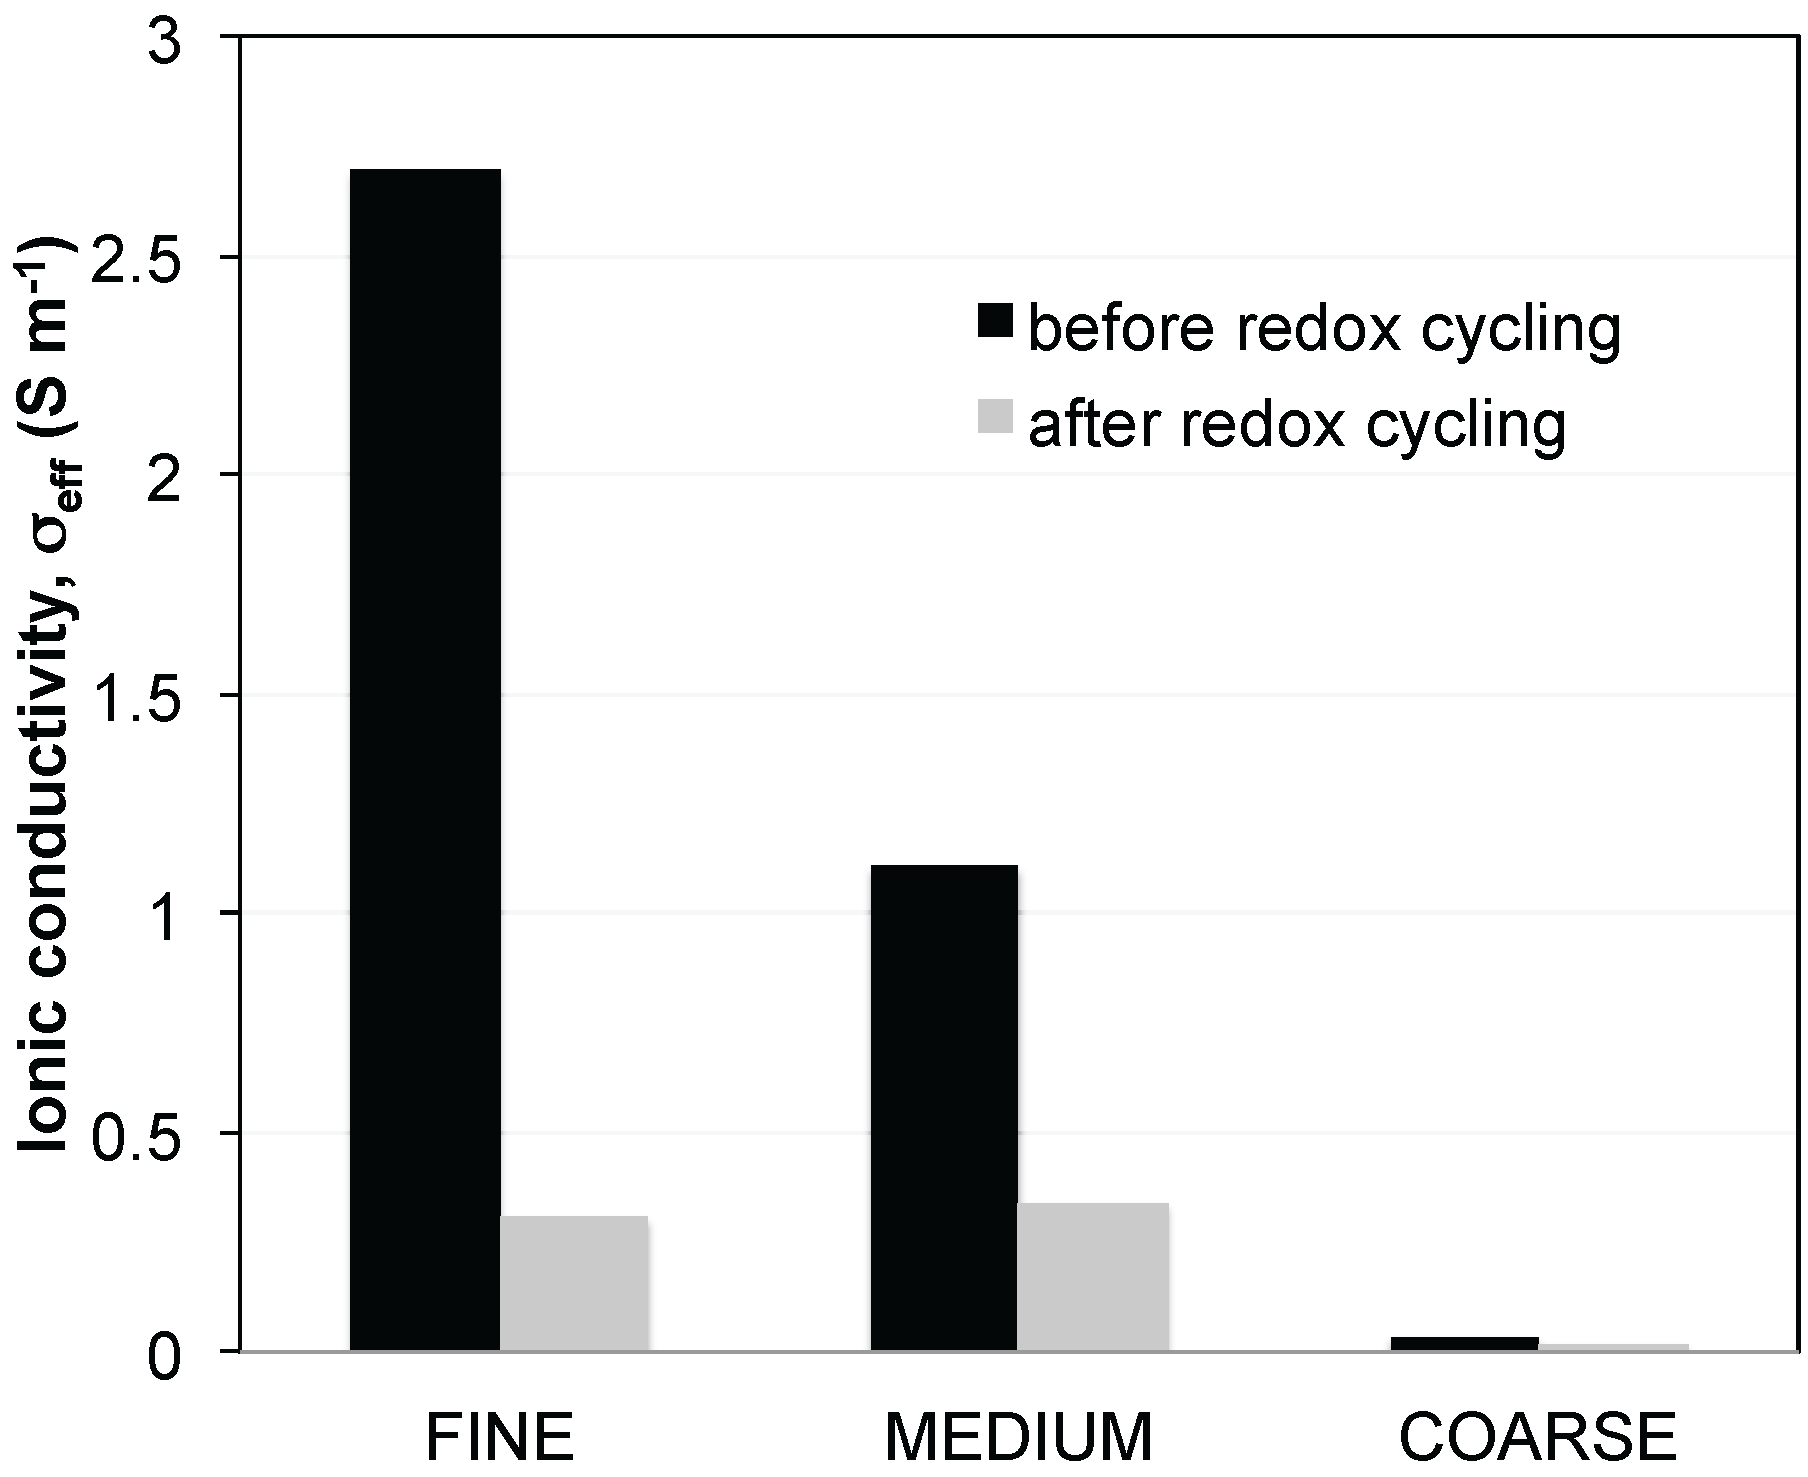
The fine anode initially has a dense microstructure due to its relatively high sintering activity of the fine YSZ grains. The two main degradation features upon redox cycling are irreversible volume expansion and Ni agglomeration. The ionic conductivity decreases in the fine anode, which is mainly due to a reduction of bottleneck dimensions in YSZ (
i.e., decrease of constrictivity β). The ionic conductivities of fine, medium, and coarse anodes are shown in
Figure 2. For the coarse anode the main degradation feature upon redox cycling is the loss of YSZ connectivity, which is attributed to weak bottlenecks associated with the low sintering activity of coarse YSZ grains. As shown in
Figure 2, the ionic conductivity is already very low in the initial state due to the low constrictivity (β). Redox cycling affects all three parameters (Φ
eff, β, and τ) of the coarse YSZ phase so that the ionic conductivity drops to almost 0 (S/m). In contrast, the electrical conductivity of the coarse anode does not degrade significantly upon redox cycling.
Figure 2.
Ionic conductivities in Ni-YSZ anodes as a function of microstructure coarseness. Conductivities (σ
eff) are predicted based on an empirical relationship using transport relevant topological parameters (σ
eff = σ
0 Φ
eff β
0.36/τ
5.17) [
5,
6]. These parameters are obtained from 3D-analysis. σ
0 = intrinsic ionic conductivity of YSZ (σ
0,YSZ@950 °C = 15.6 S·m
−1), Φ
eff = effective volume fraction, β = constrictivity, τ = tortuosity.
The present paper now focuses mainly on the relationship between TPB and anode performance, thereby also taking into account the main findings on effective conductivity. In this context it should be noted that the investigated cells are electrolyte-supported (ESC). Because of the small anode layer thickness (20 μm) used in ESC in combination with the high intrinsic conductivity of Ni (σ0,Ni@950 °C = 2.21 × 10⁶ S·m−1), limitations from electrical conductivity can usually be neglected. Hence in our cells the performance is mainly controlled by charge transfer kinetics (including TPB) and effective ionic conductivity.
In literature, the TPB length is often directly correlated with the electrochemical performance [
7,
8]. A simplistic view of this correlation is an inverse relationship between the polarization resistance and the TPB length. This kind of correlation was observed for first generation anodes, which consist only of a single electronically conductive phase (e.g., Pt). For example, works of Virkar
et al. on single-phase cathodes (
i.e., patterned Pt [
9] and Sr-doped LaMnO
3 (LSM) [
10]) show that the area-specific resistance (
Rpol, polarization resistance) is inversely proportional to TPB length. The linear relationship between 1/
Rpol and TPB is often also attributed to composite electrodes. However, in composite anodes, ionic and electronic transport resistances usually also contribute to
Rpol. The anode polarization thus contains two main contributions (in button cells) that are tightly coupled to each other:
where
Rtrans is the resistance from transport of electrons and oxide ions in the anode and
Ract is the resistance related to the electrochemical charge transfer at the TPB. For anodes with a large contribution from
Rtrans, the simplistic relationship between 1/
Rpol and TPB is no longer true.
In experimental studies using impedance spectroscopy the different contributions from transport and transfer are usually not easy to distinguish (see supplementary material,
Figure S1). However, it is well-understood that symmetrical semicircular curves indicate the absence of transport limitations (
i.e.,
Rpol =
Ract), whereas asymmetrical such as “teardrop” shapes may be the result of mixed limitations from transport and activation, or complete domination by transport resistances [
11,
12].
In our work we use a finite element model (DC, macrohomogeneous) for coupled charge transport and transfer [
2], which provides the distribution of current densities and electrochemical transfer rates throughout the anode layer. Based on these distribution profiles the two contributions (
Rtrans +
Ract) contained in the polarization resistance can be described quantitatively. In the present paper we use the model to describe some basic scenarios that correspond with typical microstructure characteristics of the investigated anodes.
In literature [
7,
8,
13,
14,
15,
16,
17,
18,
19,
20,
21,
22,
23,
24,
25,
26,
27,
28,
29,
30,
31,
32,
33,
34,
35,
36,
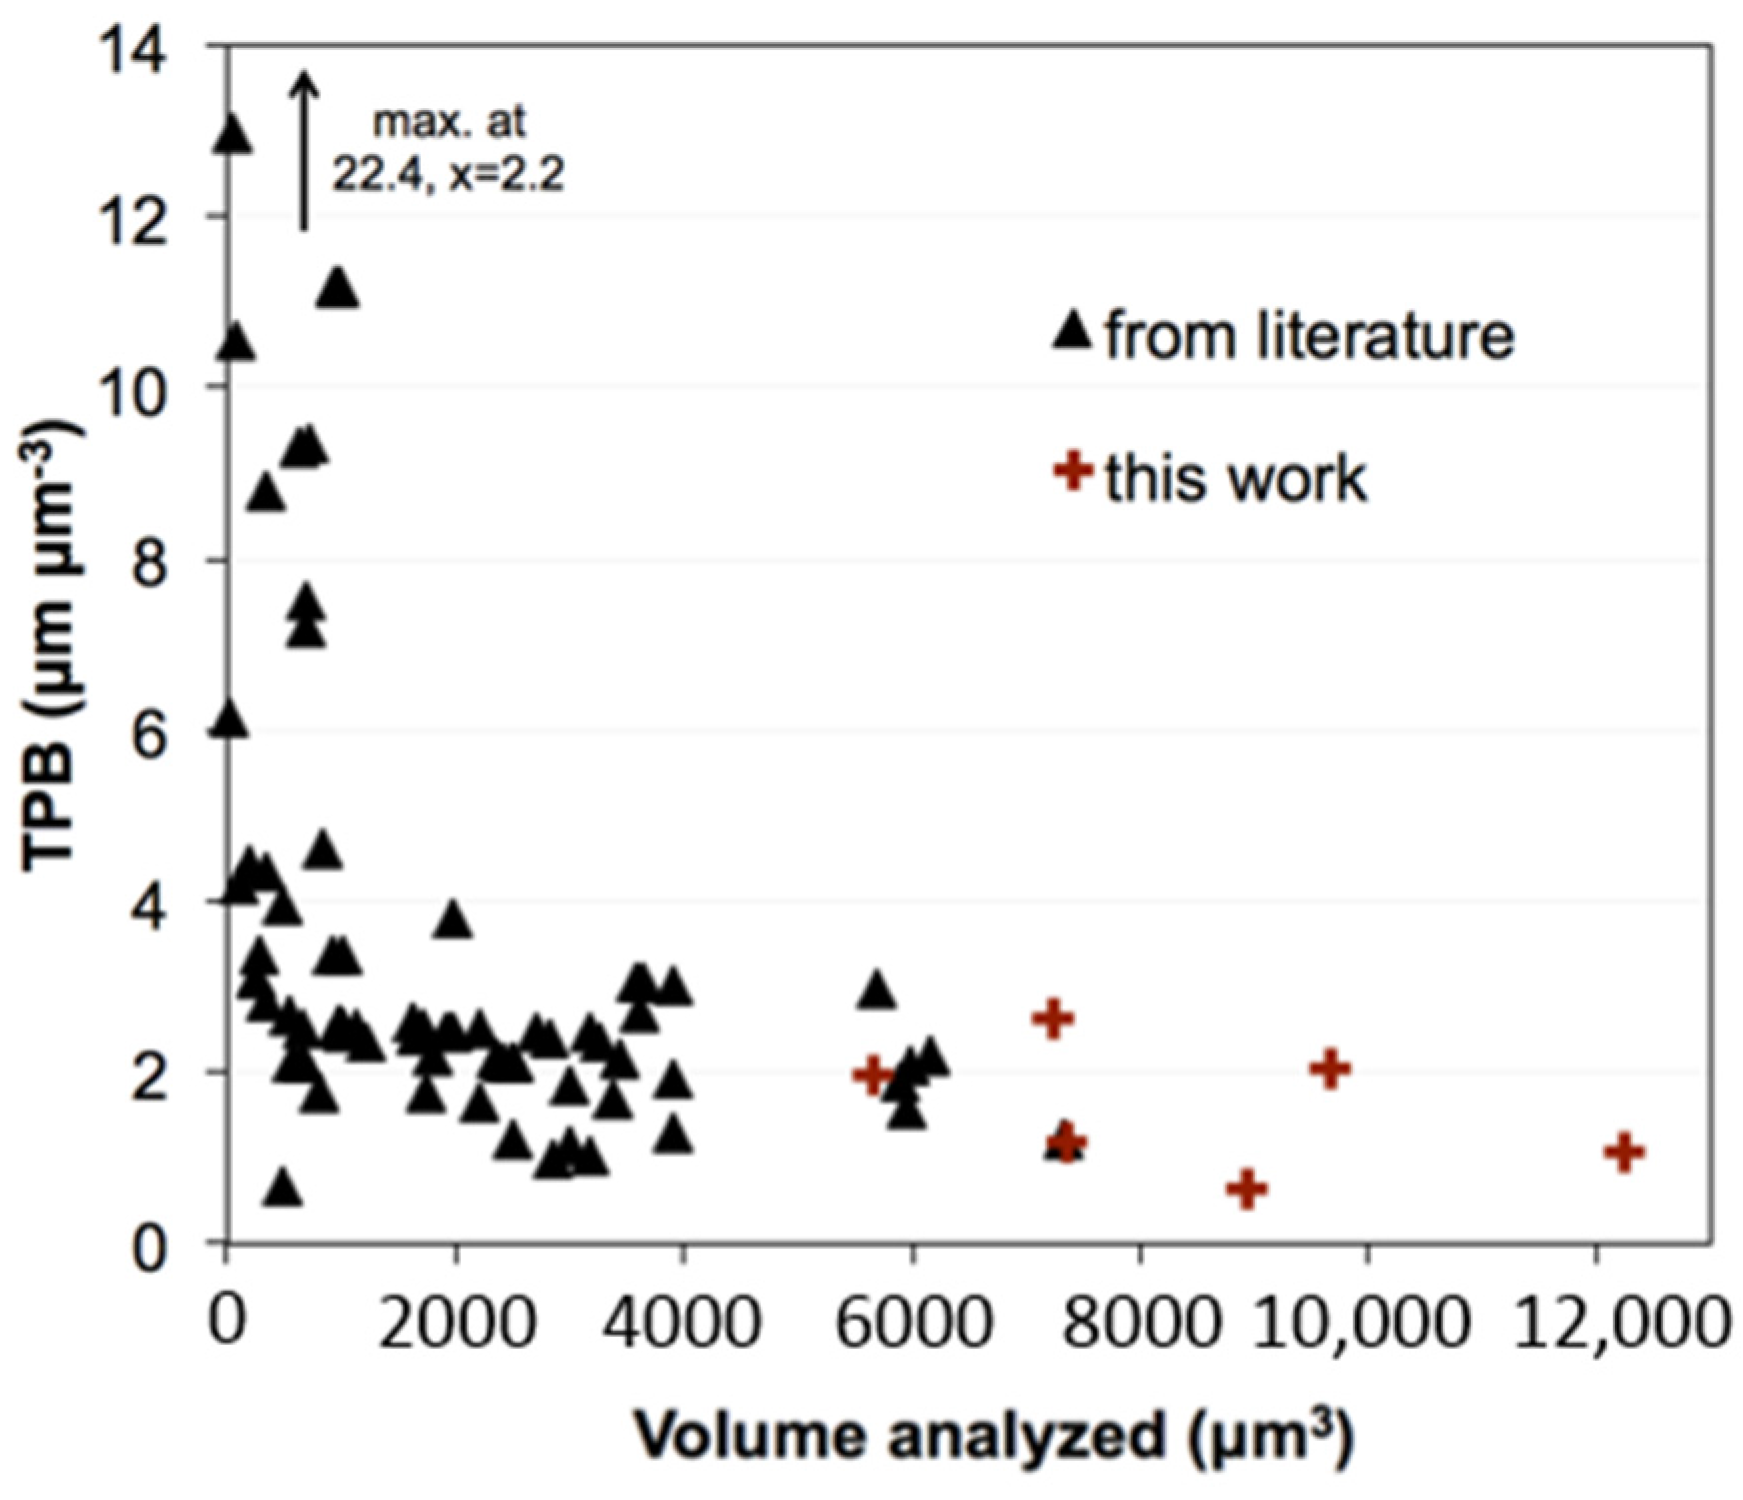
37] some very high TPB values (up to 22.4 μm
−2) are reported for Ni-YSZ anodes. As shown in
Figure 3, those high TPB values are exclusively measured for small sample volumes (<1000 μm
3). Therefore, the high TPB values are most probably an artifact from lack of representative elementary volume (REV). In fact, all data points from larger sample volumes (>1000 μm
3) exhibit TPB values in a relatively narrow range between 1 and 4 μm
−2. More explanation about compilation of
Figure 3 is given in the supplementary material.
Figure 3.
TPB lengths in Ni-YSZ anodes as a function of volume analyzed from literature [
7,
8,
13,
14,
15,
16,
17,
18,
19,
20,
21,
22,
23,
24,
25,
26,
27,
28,
29,
30,
31,
32,
33,
34,
35,
36,
37] (data table with references are given in the supplementary material,
Table S1). Independent from the fabrication method, the TPB lengths increase significantly for some of the analyses that are taken on a very small volume (which is probably due to limitations of representativeness).
In this study, we are particularly interested in the quantitative correlation between the electrochemical performance and TPB lengths. Therefore, active and total TPB lengths need to be distinguished from each other. The active TPB lengths are obtained considering the connectivity in each of the three phases (i.e., pores, Ni, and YSZ). The influence of redox cycling on the electrochemical performance and on the microstructure is established in order to unravel the degradation mechanisms. Furthermore, limitations to the transport of mobile species are discussed for three different microstructure scenarios. Thereby it is shown that the microstructure limitations strongly influence the distribution of electrochemical activity and also of ionic and electronic current densities within the anode. Overall, for composite Ni-YSZ anodes the relationships between electrochemical performance and microstructure, which is not a simple function of the active TPB length can be rationalized through the complex interplay of charge transport and transfer processes, and the mechanistic scenarios proposed in this work.
3. Results
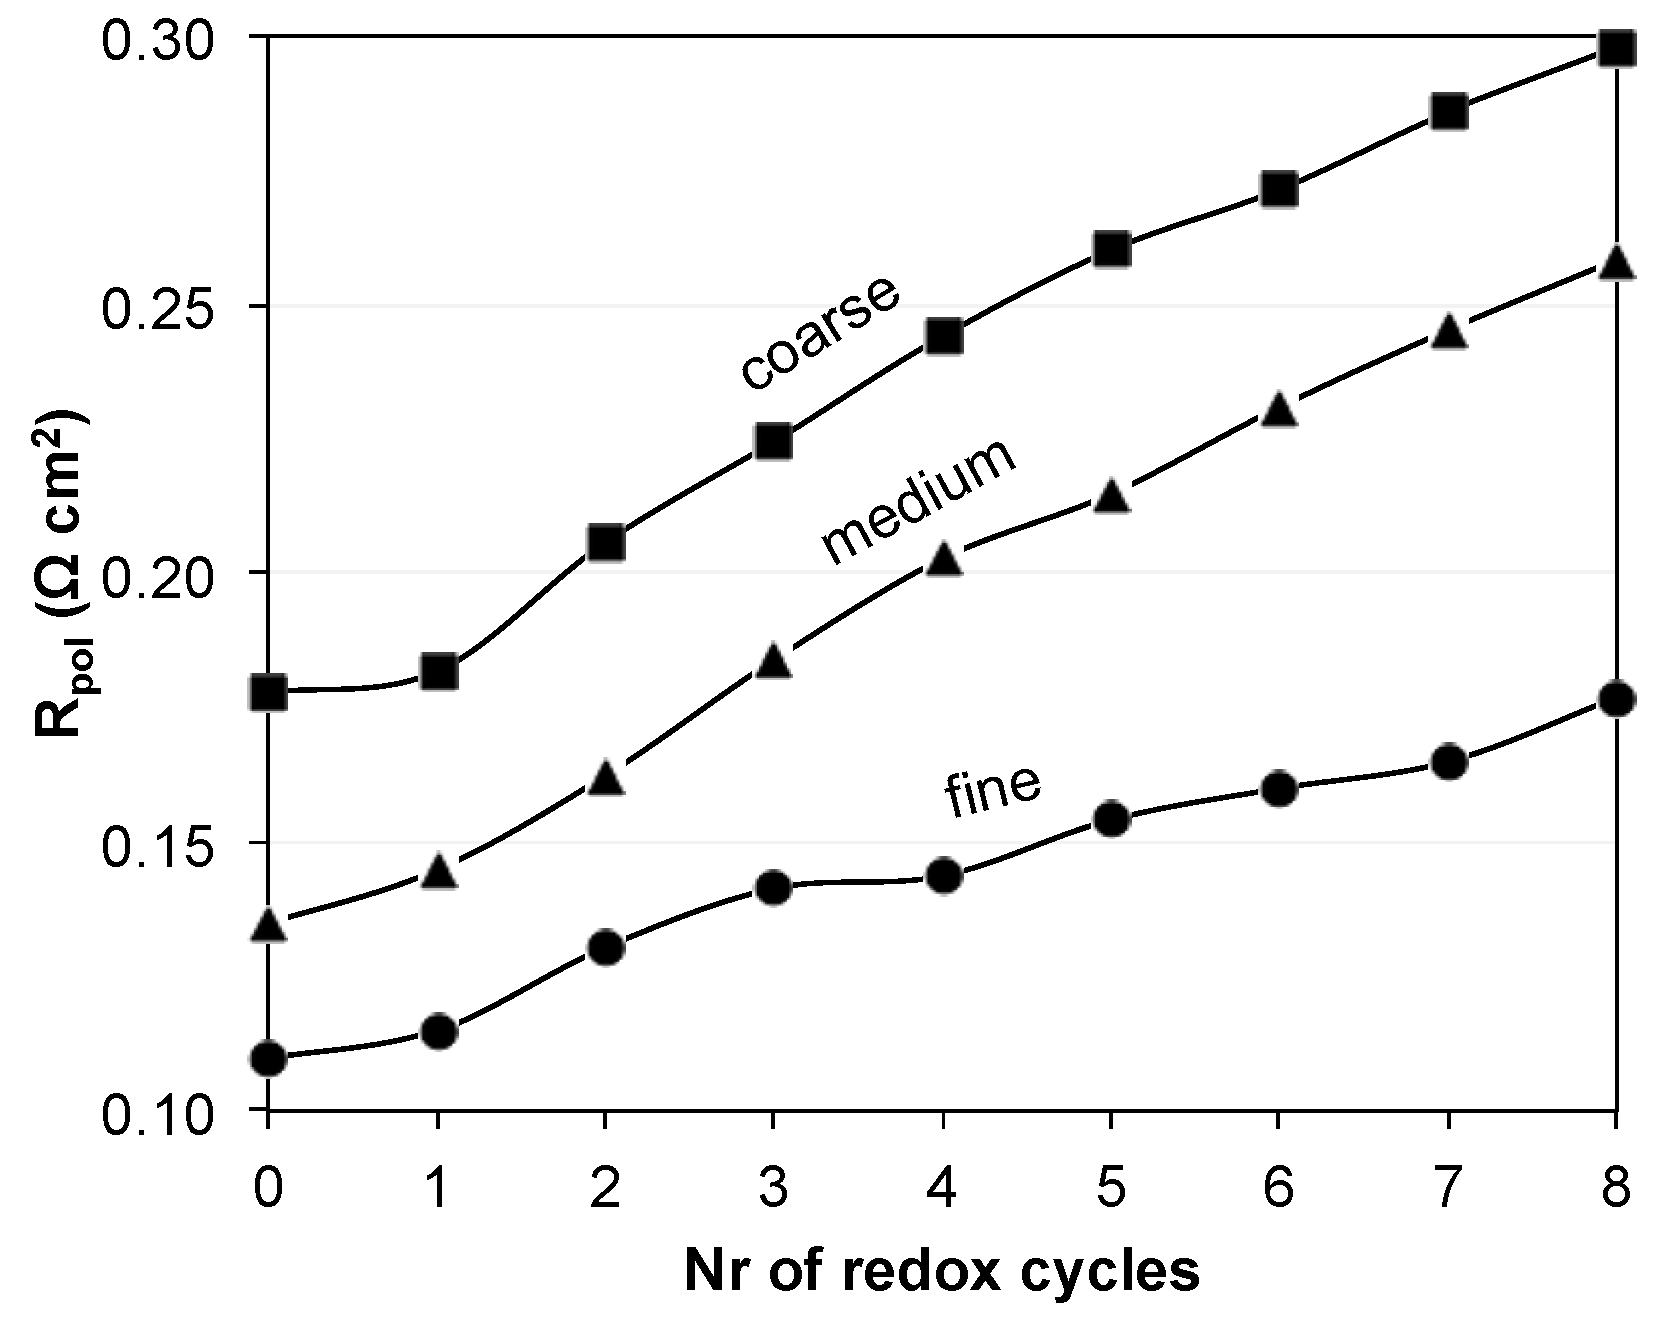
Figure 5 shows the evolution of the polarization resistance (
Rpol) of the fine, medium, and coarse anodes upon redox cycling. The degradation of
Rpol over eight redox cycles is stronger in coarse and medium samples compared to the fine one, which is indicated by steeper slopes for medium and coarse anodes in
Figure 5. The initial
Rpol (0th) increases from fine to coarse. The change in
Rpol, given by the difference between the 0
th and 8
th cycles (initial and final resistances) is similar for the medium and coarse anodes (
ca. 0.120 Ω·cm
2), while it is smaller for the fine anode (0.07 Ω·cm
2).
Figure 5.
Evolution of polarization resistance (
Rpol) of Ni-YSZ anodes during exposure to eight redox cycles at 950 °C (adapted from Iwanschitz [
38]). Degradation is stronger in medium and coarse samples compared to the fine anode.
Figure 5.
Evolution of polarization resistance (
Rpol) of Ni-YSZ anodes during exposure to eight redox cycles at 950 °C (adapted from Iwanschitz [
38]). Degradation is stronger in medium and coarse samples compared to the fine anode.
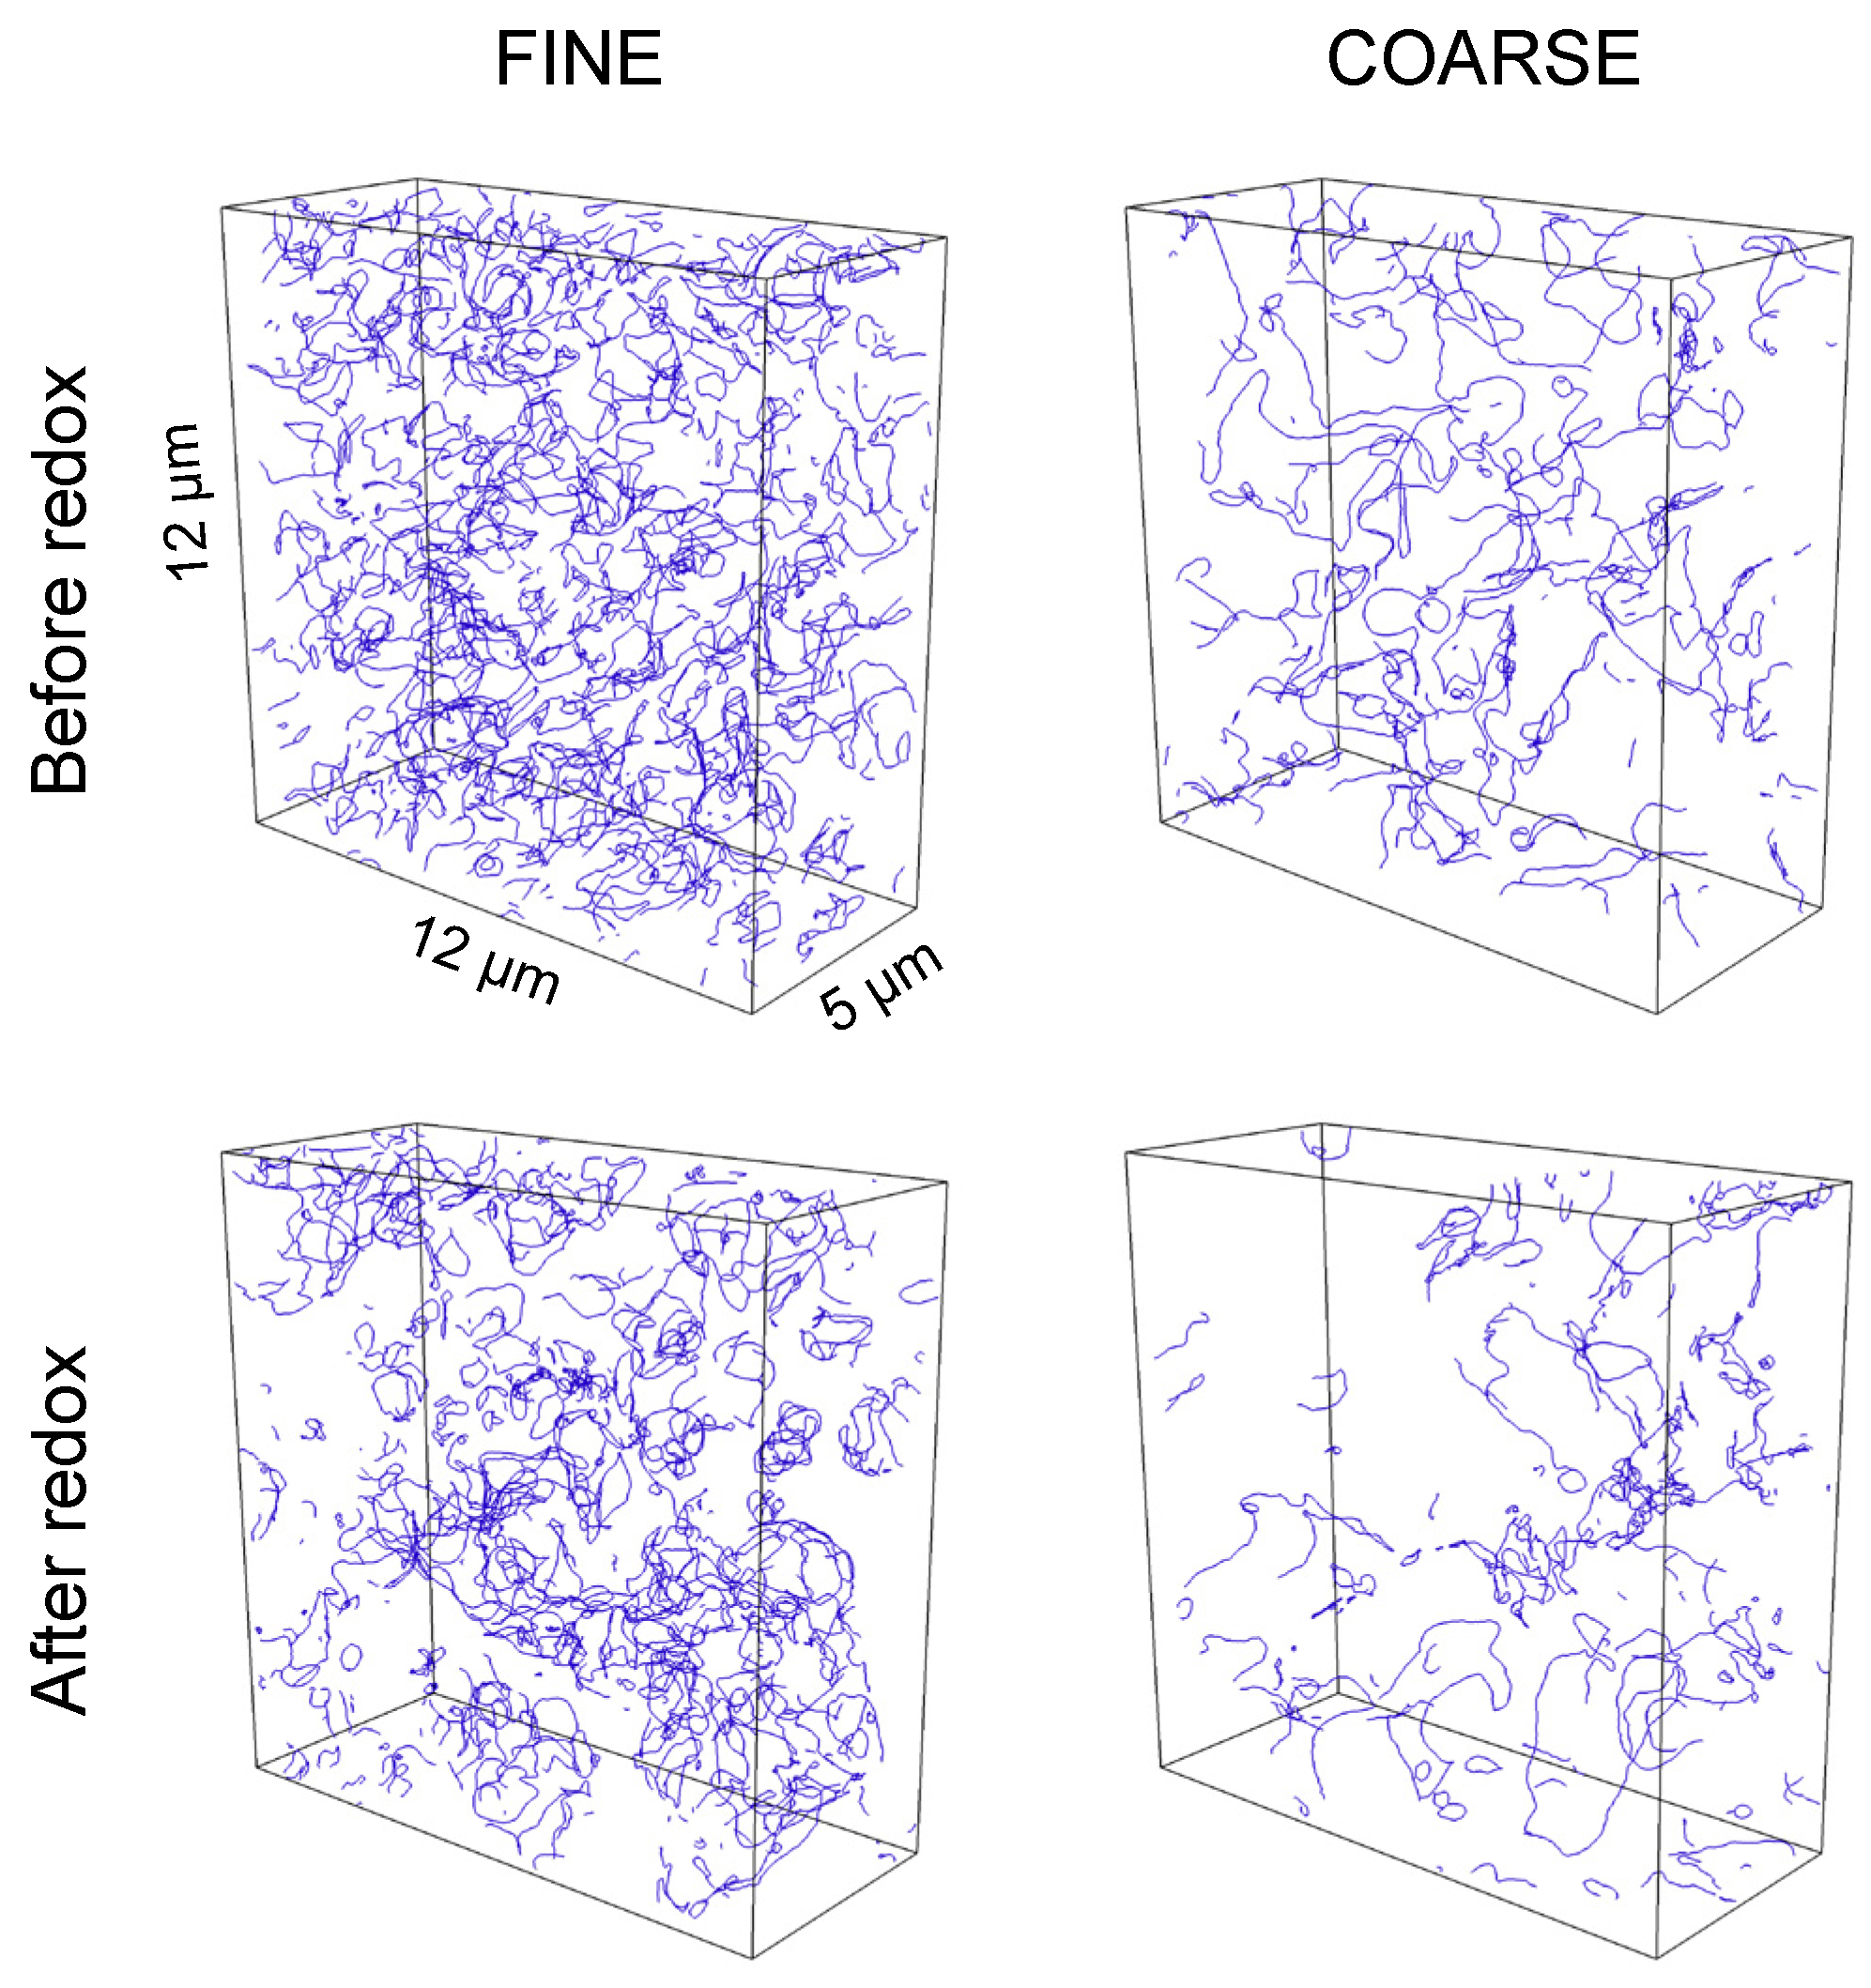
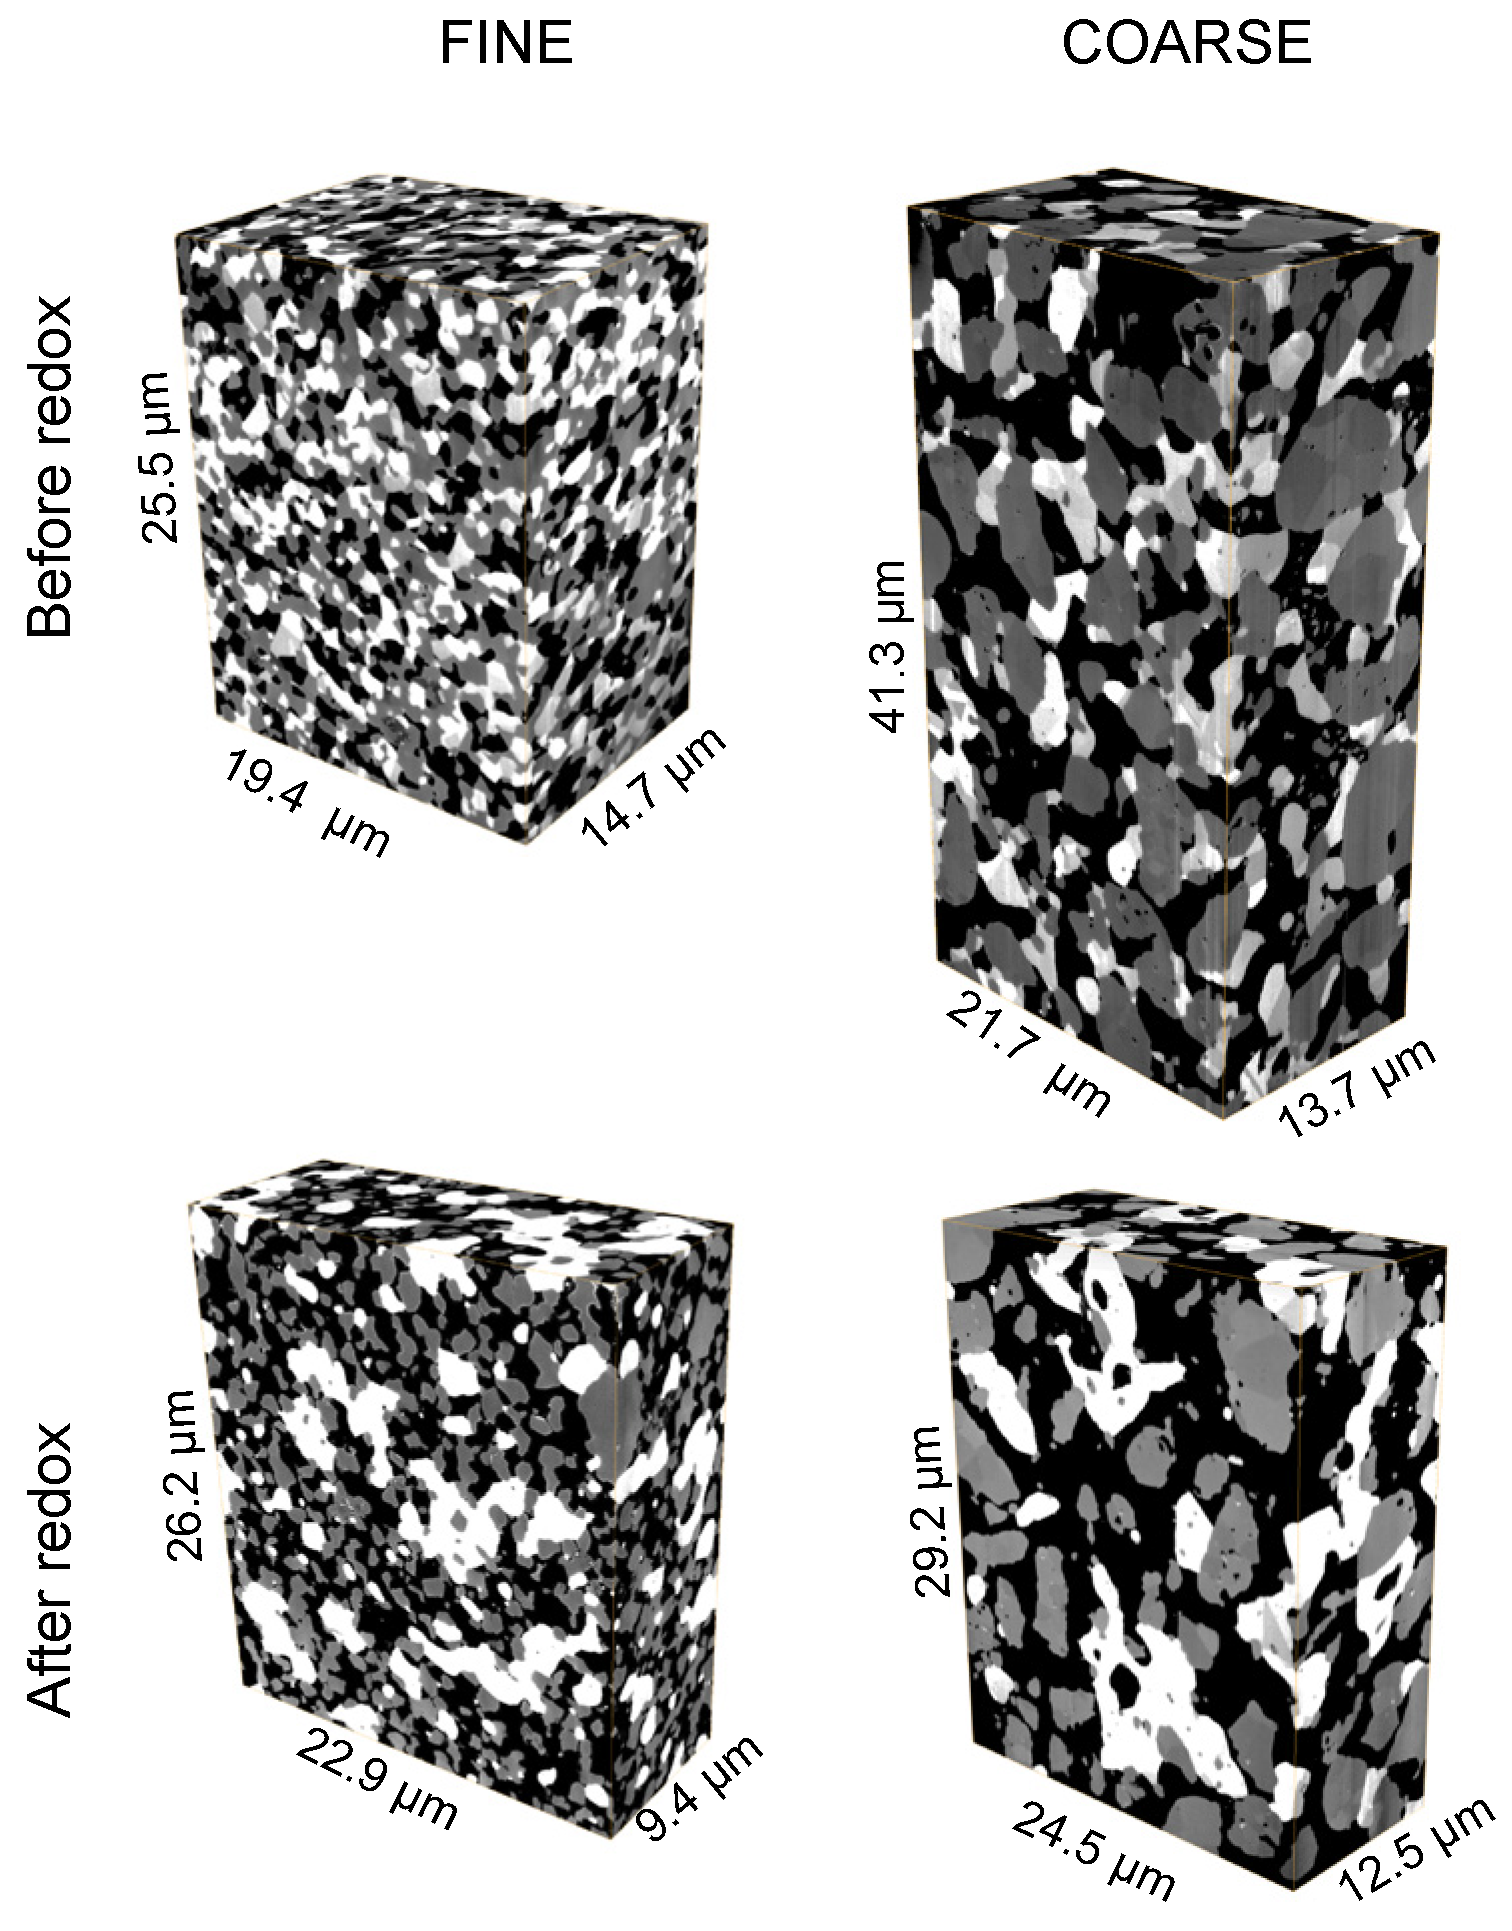
Figure 6 shows the TPB lines obtained from image analysis of Ni-YSZ tomographic data. There is a clear dependency of TPB density on the fineness of the initial microstructure. Moreover,
Figure 6 also illustrates a reduction of TPB density due to redox cycling. It must be emphasized that these TPB lines are only active for electrochemical reactions if all three phases merging at the TPB are connected to their base. For example YSZ has to be connected with the electrolyte (located on the left side of the cubes in
Figure 6) in order to enable transport of oxygen ions from the electrolyte to the TPB. Similarly the pores must be connected with the gas channel and Ni with the current collector (both on the right side of the cubes in
Figure 6).
Figure 6.
TPB lines (blue) determined from tomographic data for the fine and coarse anodes. Redox cycling obviously leads to a decrease of TPB density. Note: Some of the TPBs are not active, due to loss of phase connectivity in one of the transporting phases (not shown). Loss of connectivity is particularly strong for the YSZ phase in the coarse anode after redox cycling (bottom right). Total and active TPB lengths are given in
Figure 7.
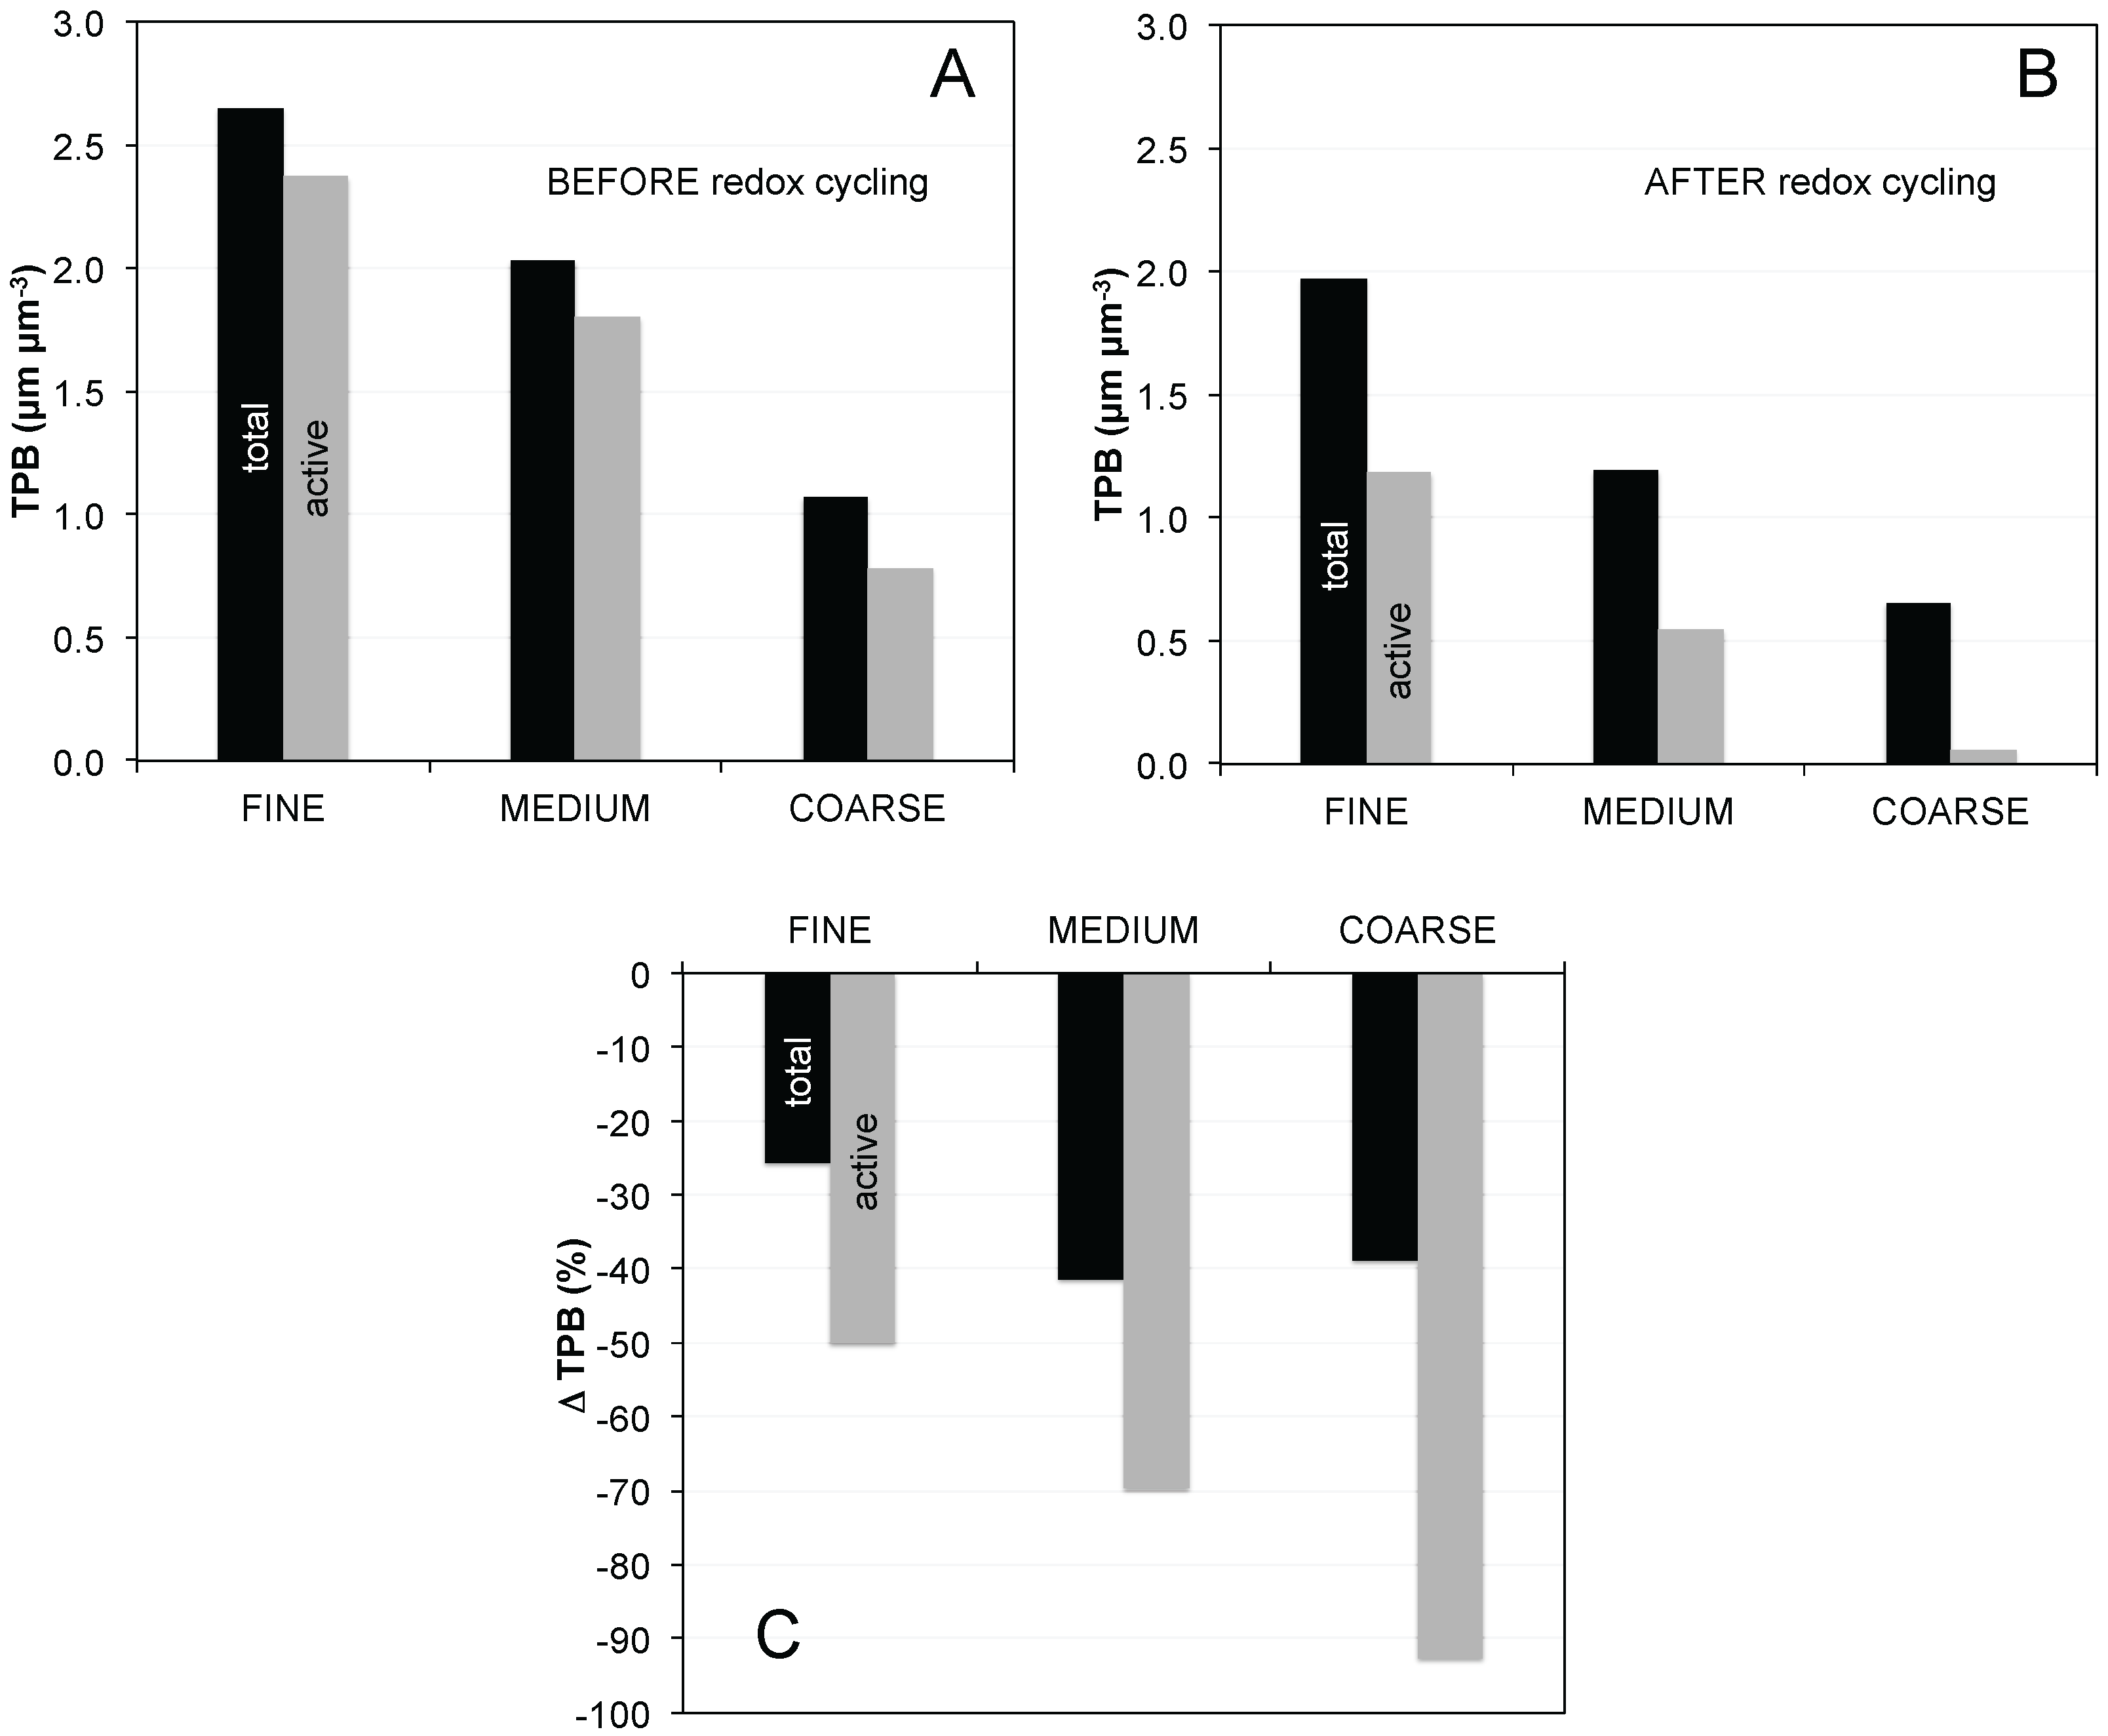
Figure 7A,B show the TPB
total and the corresponding TPB
active for the different anodes before and after eight redox cycles. In the initial microstructures (
Figure 7A), about 90% of TPB
total in fine and medium is active, while it is lower for the coarse anode (73%). After redox cycling (
Figure 7B), about 60% of the TPBs are still active in the fine anode, and 46% in the medium anode. However, only 9% remain active in the coarse anode. Hence, the effects from loss of connectivity upon redox cycling are much stronger in the coarse anode.
Upon redox cycling, the decrease of TPB
total in the medium and coarse samples are 41% and 39%, respectively, whereas for the fine anode the relative change is only 26% (
Figure 7C). The drop of TPB
active is significantly higher than the one measured for TPB
total. TPB
active decreases by
ca. 50% in the fine anode, 70% in medium, and 93% in the coarse anode.
The changes of TPB lengths presented in
Figure 7 are related to some characteristic features of redox degradation, which are strongly dependent on the initial anode microstructure. Some of these characteristics (including volume fractions, connectivity, bottleneck dimensions, constrictivity, and tortuosity) have been presented in a previous publication (see Ref. [
4]). Here we briefly summarize the most important characteristics of the initial microstructures and of the associated redox degradation. Thereby we define the fine and the coarse anodes as “end-members” with different degradation mechanisms.
Figure 7.
Densities of total and active triple phase boundary lengths (TPBtotal, TPBactive) for the different Ni-YSZ anodes before (A); and after (B) redox cycling; (C) change in TPBtotal and TPBactive before and after redox cycling (relative to before redox cycling).
Figure 7.
Densities of total and active triple phase boundary lengths (TPBtotal, TPBactive) for the different Ni-YSZ anodes before (A); and after (B) redox cycling; (C) change in TPBtotal and TPBactive before and after redox cycling (relative to before redox cycling).
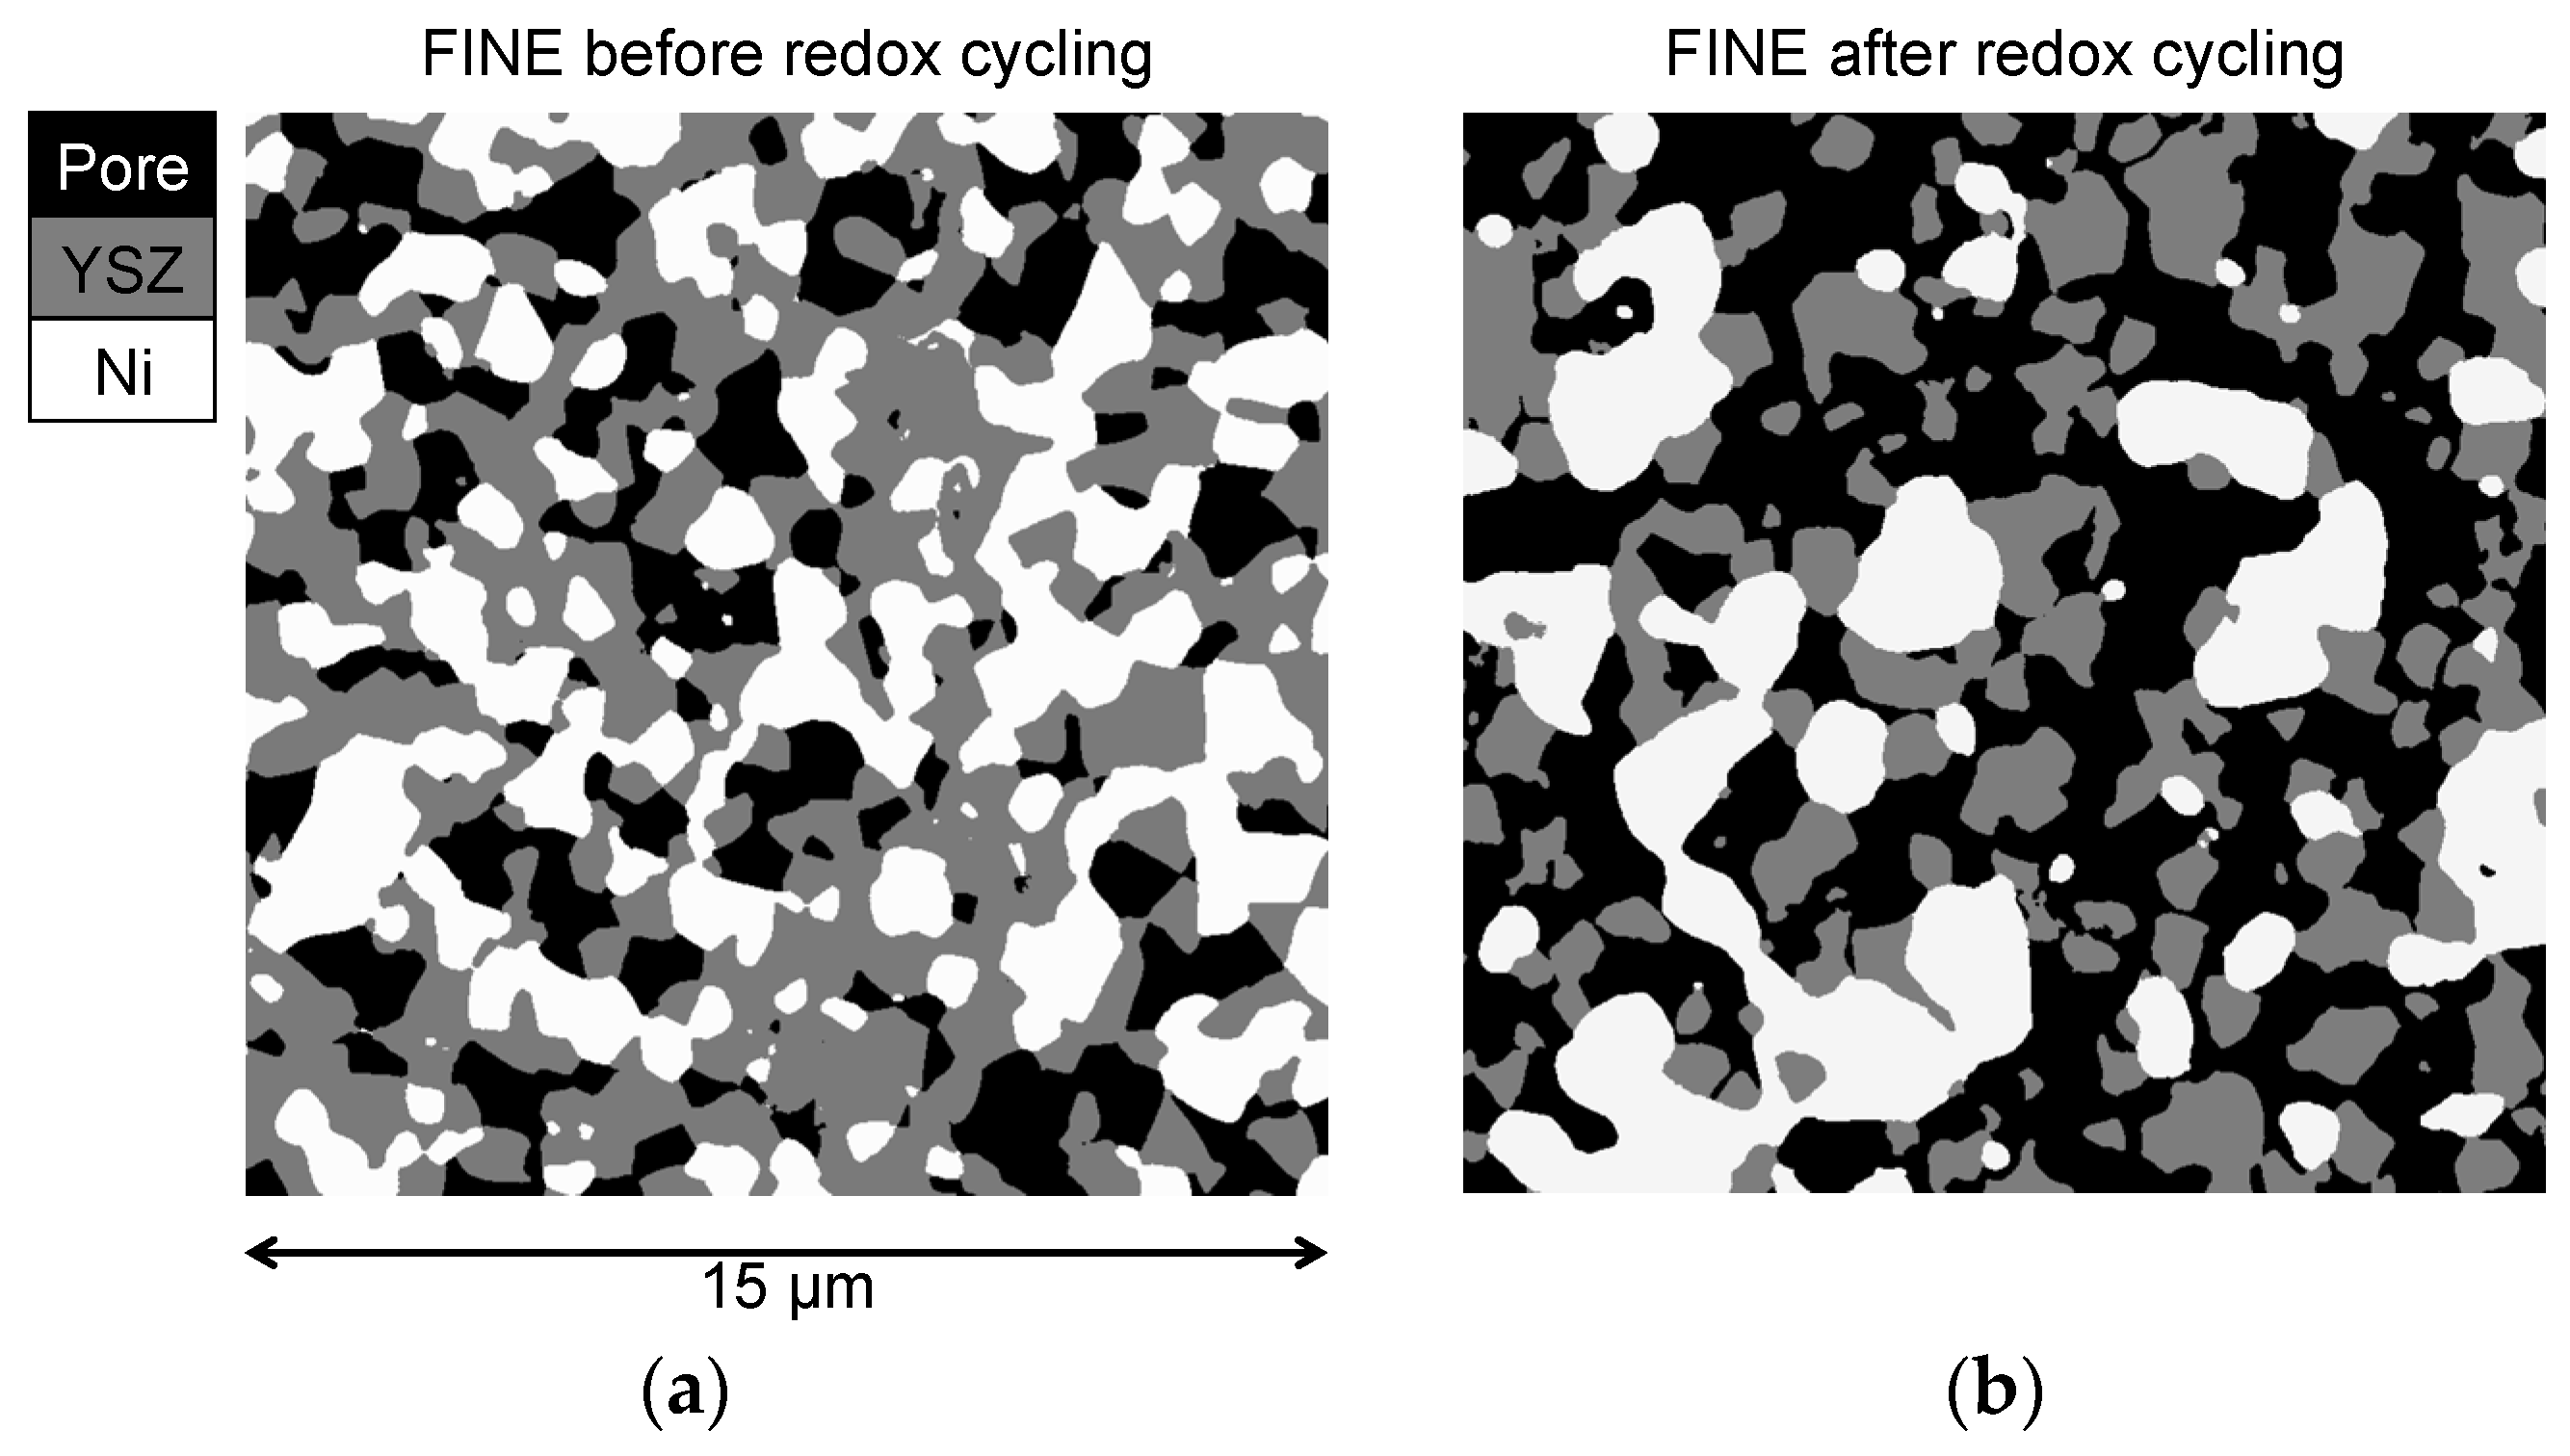
The microstructure characteristics for the fine anode are illustrated in
Figure 8. It shows 2D segmented images for the fine anode before and after redox cycling. The initial microstructure of the fine anode is relatively dense and has a porosity of 25 vol %. In the pristine sample the Ni phase (white) is homogeneously distributed. Repetitive redox cycling leads to irreversible volume expansion of the anode layer, so that the porosity increases to 47 vol %. After redox degradation Ni is concentrated in larger patches and also some isolated Ni particles exist. The coarsening and inhomogeneous redistribution of Ni results in a decrease of TPB
total. Nevertheless, a significant portion of the Ni phase is still connected (18% of Ni) and forms a percolating network. Therefore the loss of TPB
active in the fine anode is moderate (
i.e., 40%).
In contrast to the fine anode, the initial microstructure of the coarse anode is characterized by a relatively high porosity of 39 vol %. The lower density compared to the fine anode is due to a lower sintering activity of the large YSZ particles. This low sintering activity also leads to relatively narrow bottlenecks and to a low constrictivity (β) for the coarse YSZ (β
coarse = 0.01 β
fine = 0.37). The difference in the initial microstructure (coarse
vs. fine) also leads to a different degradation behavior. First of all, Ni agglomeration is less severe in the coarse. This is illustrated by lower loss of percolation and also by lower decrease of electrical conductivity (In fact, the electrical conductivity in the coarse anode even increases during the first eight redox cycles). The second important difference is the fact that connectivity of YSZ in the coarse anode is drastically reduced, which is visualized in
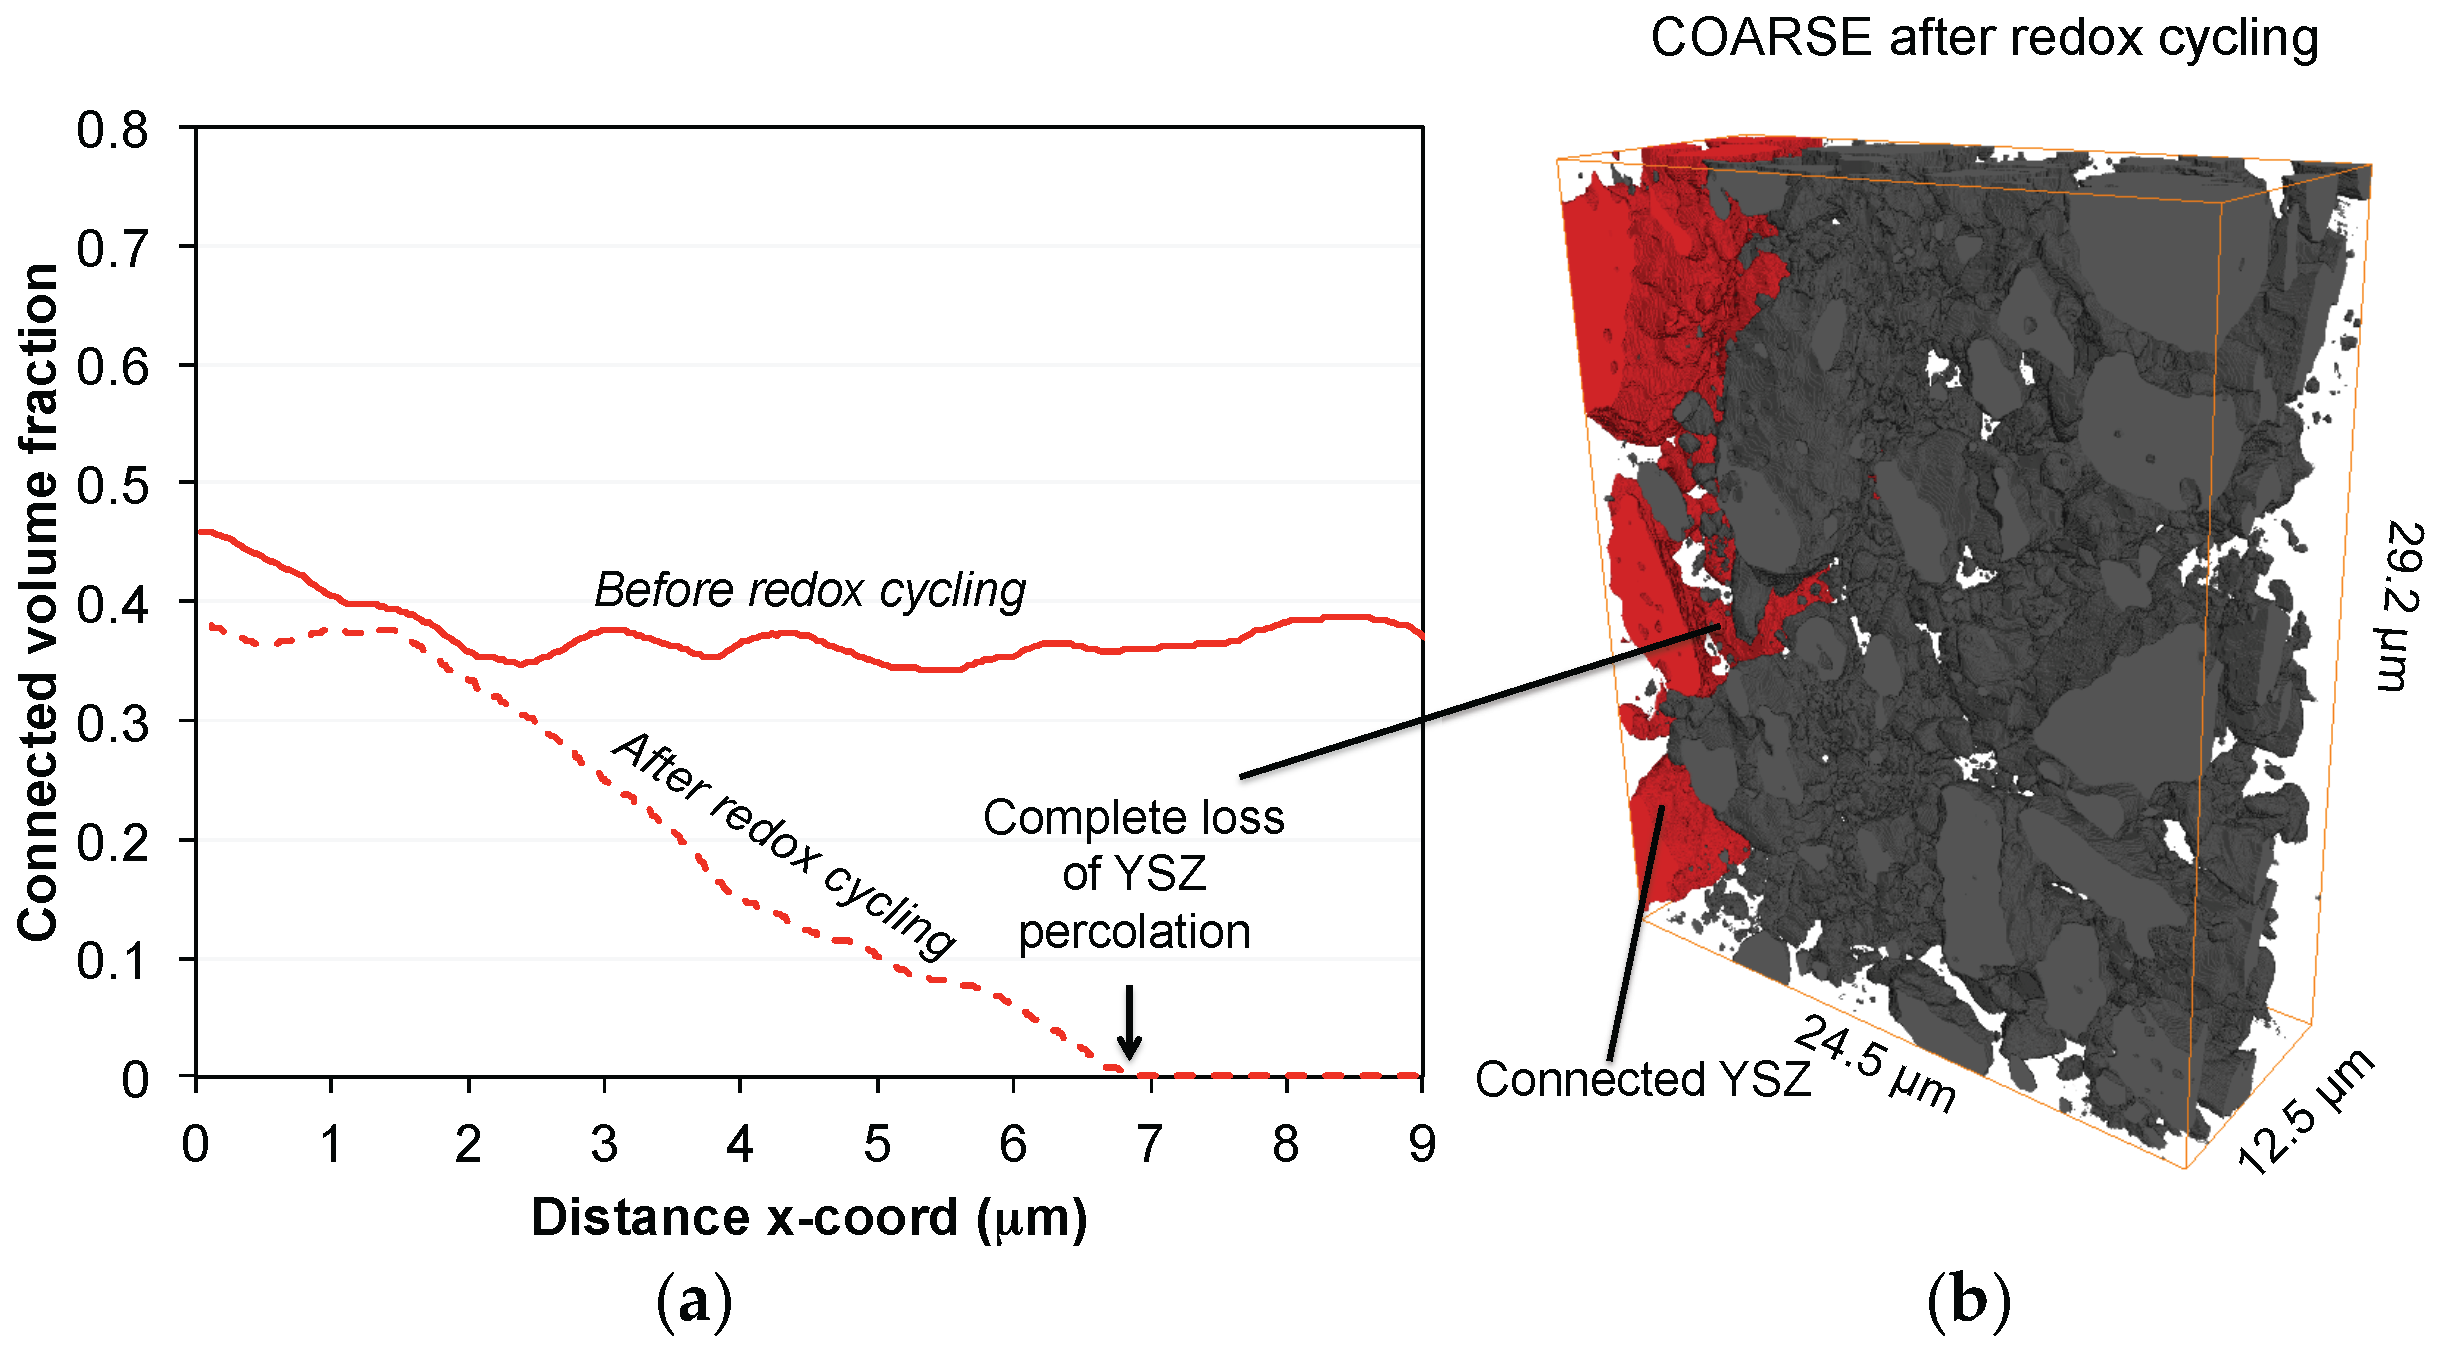
Figure 9. At a distance of
ca. 7 μm from the anode-electrolyte interface, the connected volume fraction of YSZ drops to 0. This loss of connectivity is attributed to strain localization at weak YSZ bottlenecks. Hence, although the Ni degradation is less severe in the coarse compared to the fine anode, the influence of Ni-NiO transformation on the YSZ-connectivity appears to be much more detrimental in the coarse anode. Due to the breakdown of the YSZ-connectivity also the TPB
active is reduced by 93%. Assuming a direct correlation between TPB
active and R
pol, significant performance degradation (>>100%) must be expected in the coarse anode. However, as shown in
Figure 5, the anode still exhibits an acceptable performance (increase of
Rpol by approximately 60%). These findings indicate that the complete loss of TPB
active does not necessarily lead to an anode failure. Possible explanations for such controversial observations shall be discussed below.
Figure 8.
Microstructures of the fine anode before (a); and after redox cycling (b). After redox cycling, Ni forms larger particles and some isolated islands, which results in a loss of TPBtotal and TPBactive.
Figure 8.
Microstructures of the fine anode before (a); and after redox cycling (b). After redox cycling, Ni forms larger particles and some isolated islands, which results in a loss of TPBtotal and TPBactive.
Figure 9.
(a) Profiles of connected volume fractions of YSZ in the coarse anode as a function of the distance to the electrolyte-anode interface (x-direction). After redox cycling, complete loss of percolation is observed at ca. 7 μm; (b) 3D reconstructed image of YSZ showing the connected particles (red) confined to a region near the electrolyte-anode interface.
4. Discussion
The results can be summarized by three main points: (1) The initial microstructure and the associated TPB lengths inversely correlate with
Rpol. Finer microstructures with higher TPB exhibit lower
Rpol, as shown in
Figure 10; (2) Such a correlation also exists for the samples that were exposed to redox cycling, in the sense that the decrease in anode performance scales with the decrease in TPB length. Thereby, the coarser the initial microstructures the higher are the degradation rates of both TPB and
Rpol; (3) However, TPB and anode polarization (
Rpol) are linked in a complex way, which cannot be directly expressed in a simple, linear relationship. The third point contradicts the frequent interpretation that
Rpol can be easily related to TPB length. This simplistic interpretation neglects the interplay of charge transfer reactions with the various charge transport processes (see
Figure 1).
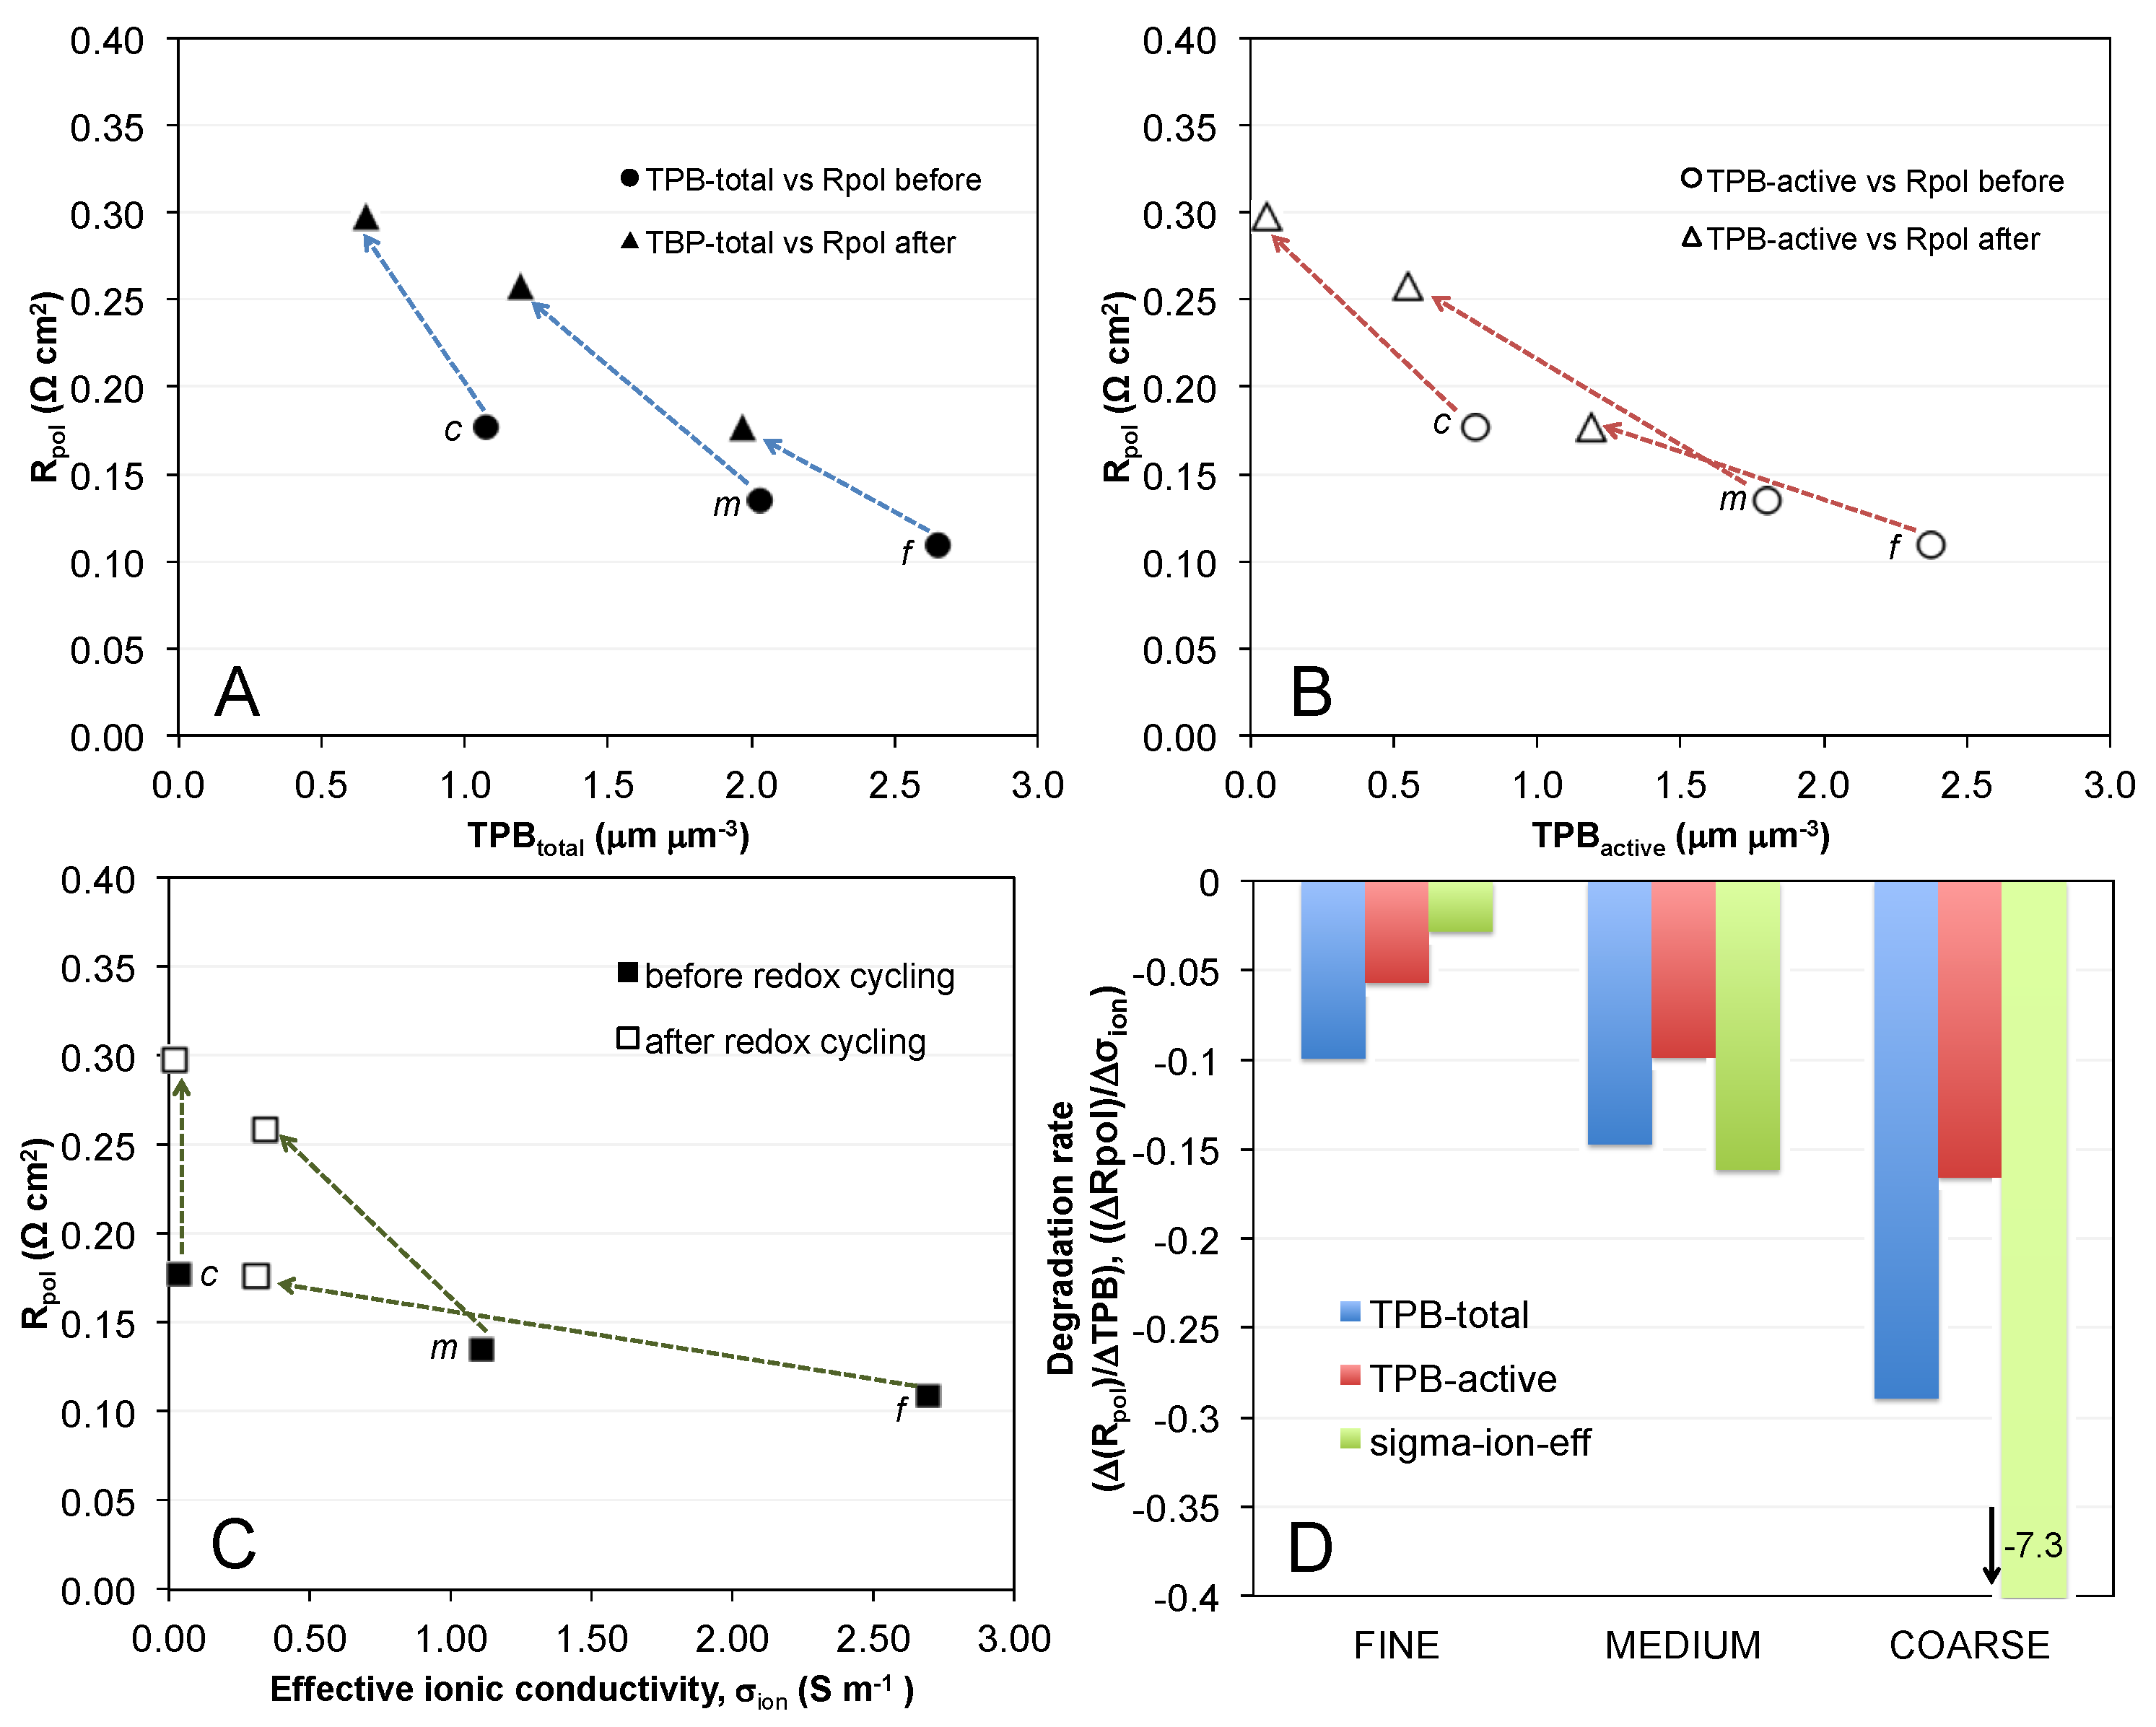
Figure 10.
Polarization resistance (Rpol) versus (A) TPBtotal; and (B) TPBactive before and after redox cycling. Degradation ratios (indicated by arrows) include a y-component for the changes in polarization resistance (Rpol) and an x-component for changes of TPB. The slopes of the degradation are shown as a bar plot (D). It documents that the influence of ΔTPB on ΔRpol does not follow a constant slope. The degradation ratios ΔRpol/ΔTPB increase from fine to coarse; (C) The relationship between Rpol and effective ionic conductivity shows a similar pattern of degradation ratios with steeper slopes for coarser microstructures.
Figure 10 represents a comparison of polarization resistances with (A) TPB
total length; (B) TPB
active length; and (C) the effective ionic conductivity (YSZ). (Note: Effective ionic conductivities are taken from a previous paper dealing with transport properties in the same Ni-YSZ anodes. See Ref. [
4]). We define the so-called degradation ratio (Δ
Rpol/Δx), where x is either TPB
total, TPB
active or the effective ionic conductivity. This ratio (shown in
Figure 10D) represents the sensitivity of
Rpol with respect to changes of TPB and conductivity, respectively. The decrease in TPB (both total and active) upon redox cycling is accompanied by the increase in
Rpol as shown in the degradation ratios (
Figure 10A,B, blue and red arrows). However this ratio is different for fine, medium, and coarse samples. It is worth noting that the degradation ratios for ionic conductivity (
Figure 10C) show a similar behavior as for TPB, with shallow slopes for the fine and steeper slopes for the coarser sample. Despite the strong degradation of ionic conductivity and TPB
active in the fine anode, the degradation of
Rpol is not very severe in this sample. In contrast, medium and coarse anodes show a strong increase of
Rpol.
Overall,
Figure 10 documents that
Rpol and TPB do not follow a simple linear relationship, otherwise the data points in
Figure 10A,B, would plot on straight lines and the degradation ratios would be equal for fine, medium, and coarse. The changing values of the degradation ratios indicate that there is no simple and linear micro-macro-relationship (Δ
Rpol/ΔTPB), neither for TPB
total nor for TPB
active.
The data points for the coarse anode in
Figure 7 require particular attention. As mentioned earlier the TPB
active drops to almost 0 upon redox cycling (see
Figure 7B). In addition, the effective ionic conductivity is very low already in the pristine state due to narrow bottlenecks and it drops to 0 upon redox cycling due to loss of percolation. The question arises, why low TPB
active combined with a breakdown of phase network for ionic conduction does not lead to a complete failure of the anode.
In order to answer this question, one would have to consider the distribution of ionic and electronic current densities throughout the anode, together with the associated electrochemical transfer activity. In electrochemical impedance measurements, the electrode contributions of transport processes and electrochemical reactions to the overall polarization usually cannot be easily distinguished from each other and are often reported as a single value (
Rpol). This corresponds to the width of the corresponding arc in the Nyquist plot. From numerical simulation, however, it is well understood that the anode resistance (
Rpol) results from a complex interplay between charge transport (ions, electrons, gas) as well as from charge transfer. Rüger
et al. [
1] for example has presented current density profiles through the anode for different microstructures. These profiles nicely document how current densities and associated electrochemical activities are distributed depending on the effective conductivities and on the TPB densities.
Since these coupled phenomena are hardly distinguishable by EIS measurements, we consider mechanistic scenarios with different limiting processes in order to explain the observed non-linear relationships between
Rpol and TPB. For this purpose we use a macro-homogeneous 1D finite-element model (FEM) to simulate the anode reaction mechanism. Ionic and electronic transport processes are described by Ohm’s law and charge transfer at the TPB is described with the Butler-Volmer equation (see Refs. [
2,
3]). This model takes into account microstructure characteristics of the anode due to the input of effective ionic and electric conductivities, as well as TPB from separate microstructure analyses. A detailed description of the model as well as a detailed discussion of simulation results will be presented in a follow-up paper. Here we summarize, in a simplistic way, some simulation results for basic scenarios that help to explain the observed non-ideal relationship between TPB and R
pol in Ni-YSZ anodes.
We distinguish the following three anode scenarios that are discussed on a qualitative level: (1) no transport limitation of mobile species, neither ionic nor electric; (2) limitation of ionic transport (i.e., low ionic conductivity); and (3) extreme limitation of ion transport and reduction of TPBactive due to complete loss of YSZ connectivity. Scenario 1 represents an idealized anode. Scenario 2 is comparable with the degradation phenomena observed in the fine anode, whereas scenario 3 corresponds with the degradation phenomena observed in the coarse anode.
For all scenarios we apply a constant voltage drop over the anode and consider the corresponding current (
j) profiles depending on TPB lengths and ionic conductivity. In any case, the total charge current density is constant:
jtotal,x =
jion,x +
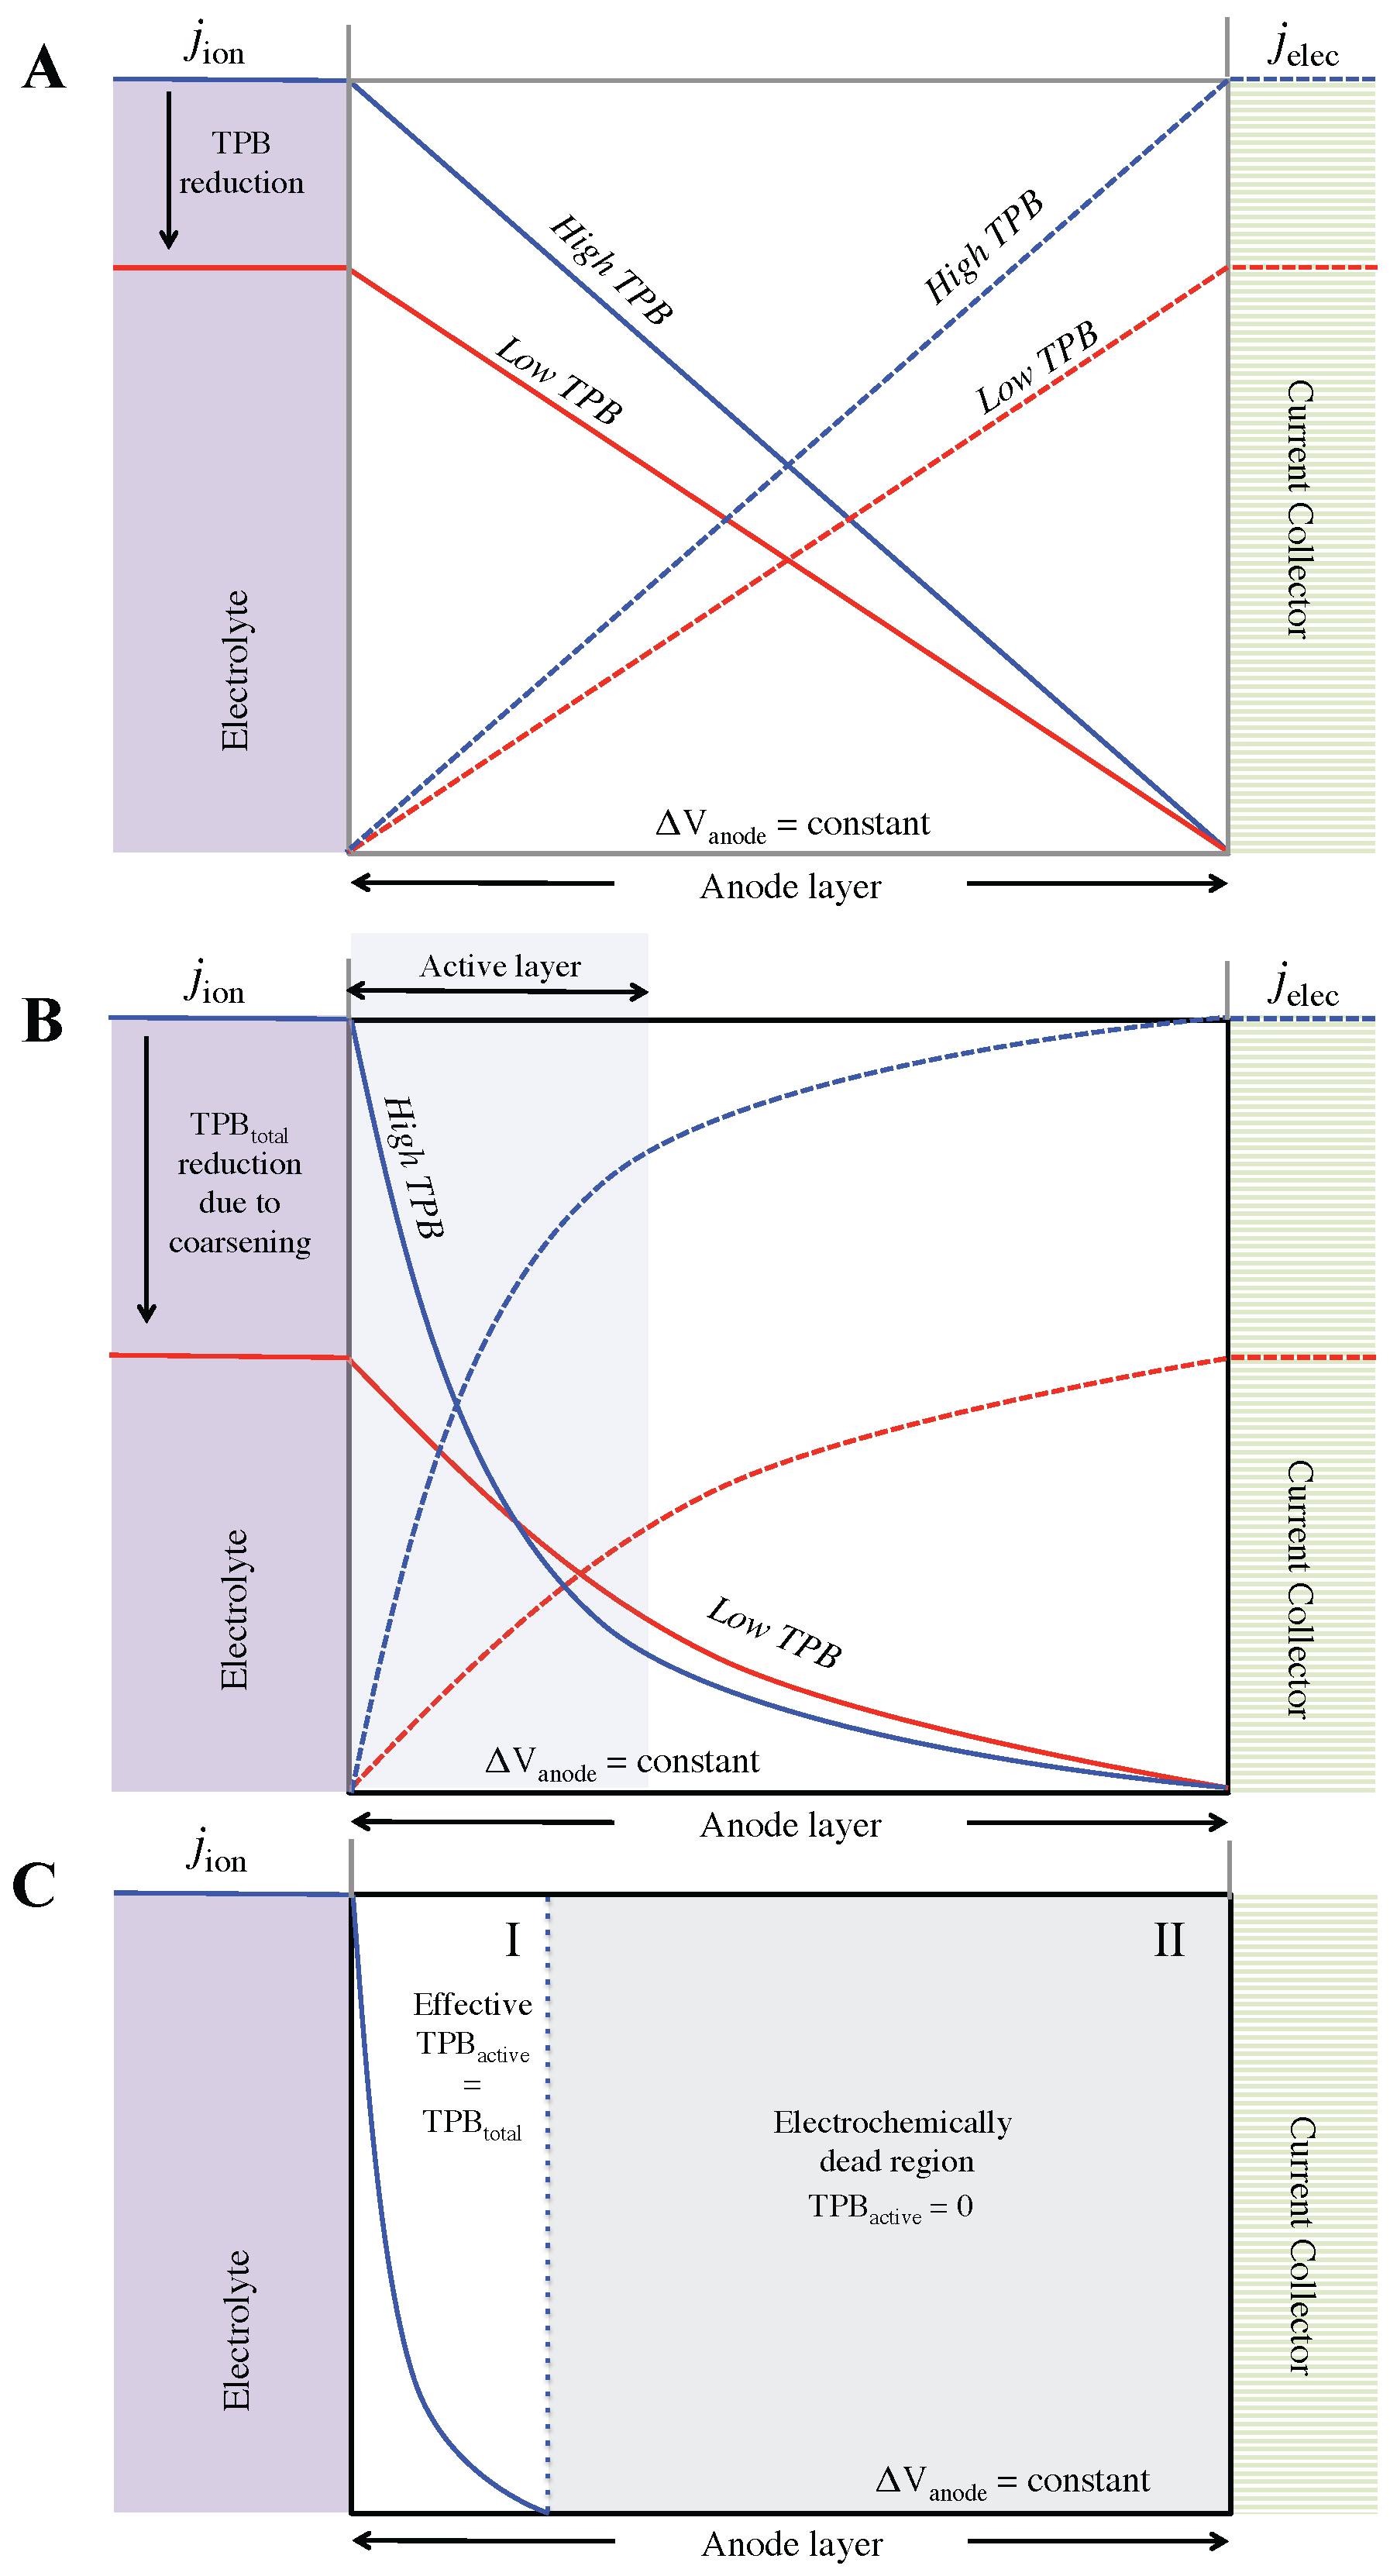
jelec,x. The current distribution profiles for the first case are shown in
Figure 11A. For scenario 1 there is no transport limitation. Therefore the entire anode is being used for the charge-transfer reaction. The slope (Δ
jion/Δ
x) is constant, which signifies constant electrochemical activity throughout the entire anode. The decrease of TPB length (as indicated with red color in
Figure 11), still assuming no transport limitation, leads to changes in total current density (
jtotal,x) and electrochemical activity, as indicated by a shallower slope (Δ
j/Δ
x). It must however be emphasized that this simplified scenario is not realistic. Indeed, in our anodes relatively strong transport limitations arise from the rather low intrinsic ionic conductivity of the ceramic phase (σ
0,YSZ@950 °C = 15.6 S·m
−1). These limitations are enhanced by microstructure effects, which lead to effective ionic conductivities in the range 0.02–2.7 S·m
−1, as documented in a previous study [
4]. In contrast, intrinsic electric conductivity of Ni is much higher (σ
0,Ni@950 °C = 2.21 × 10
6 S·m
−1), so that electric transport limitations can usually be neglected for thin anodes in electrolyte-supported cells.
The second scenario is more realistic since it takes into account the influence of ionic transport resistance. As shown in
Figure 11B, the system optimizes the distribution of transport and transfer reactions in order to minimize energy losses. In this second scenario (compared to the first one without transport limitations), the transport distances of ions are reduced and the electrochemical activity is concentrated within a limited zone called the active layer. The slope (Δ
j/Δ
x) also becomes steeper as the active layer moves closer to the electrolyte-anode interface and deviates from linearity, in contrast to the simplified scenario in
Figure 11A. Consequently, the charge-transfer activity is highest near the electrolyte-anode interface. Similar current density profiles are reported e.g., in the modeling work of Rüger
et al. [
1].
Figure 11.
Schematic representation of current density distributions for three different anode scenarios, where jion decreases and jelec increases from left to right (jtot = constant): (A) Idealized scenario where no limitation on transport of mobile species exists. The whole anode acts as an active layer with constant electrochemical activity; (B) Anode scenario with limitations for ionic transport. This leads to a concentration of charge transfer reactions in the active layer and associated inhomogeneous distribution of current densities. This scenario is representative for most Ni-YSZ anodes, including Ni-coarsening as observed in the fine anode; (C) Anode scenario with low ionic conductivity including a complete loss of percolation for YSZ in domain II. This scenario is representative for the coarse anode before and after redox cycling. (j = current density, ΔV = voltage drop).
Upon degradation the TPB
active decreases, which leads to a drop of the total current density (at constant cell voltage). Such a scenario corresponds with the case “fine anode degradation” in
Figure 7 and
Figure 8. The TBP degradation also leads to a shallower slope (Δ
j/Δ
x), as illustrated by the red curve in
Figure 11B. This implies lower electrochemical activity and as a result, the active layer is again spread (change in thickness of active layer) to compensate for the loss of TPB. Hence, qualitatively two opposing effects are identified from degradation: Ionic transport limitations have the tendency to decrease the active layer thickness (shorter transport distances), whereas loss of TPB leads to an increase of active layer thickness (increase of absolute TPB-number). Usually the redox degradation affects both transport properties as well as TPB-lengths. Thereby, the thickness-change of the active layer upon degradation cannot easily be predicted. This thickness and its change upon degradation can only be determined with a suitable model describing coupled transport and charge transfer processes, which also takes into account the relevant microstructure characteristics and effective properties of the anode.
Figure 11C shows the current distribution profiles for an anode where loss of YSZ connectivity is present. This setting is observed in the coarse anode after redox cycling, which is also illustrated in
Figure 9. At some distance away from the electrolyte-anode interface the loss of YSZ leads to a drop of TPB
active to zero. These distant regions are electrochemically dead (domain II in
Figure 11C). However, close to the electrolyte-anode interface (domain I in
Figure 11C) where ionic transport distances are short, the loss of percolation (at longer transport distances) has no detrimental effect so that the electrochemical activity is linked mainly with TPB
total (
i.e., effective TPB
active at short distances ≈TPB
total). This phenomenon is called “short-range effect”. It means that, close to the interface the influence of microstructure cannot be explained by volume averaged parameters such as TPB, constrictivity (β), tortuosity (τ), and effective conductivity (σ
eff,io). When transport distances are shorter than the size of the representative elementary volume (REV), then volume averaged microstructure characteristics and associated effective properties are not relevant for the reaction kinetics. Hence in the active layer close to the interface the microstructure limitations are overestimated if they are described by volume averaged parameters (TPB, β, τ, σ
eff). Some important microstructure limitations, which are due to tortuous pathways, narrow bottlenecks and loss of connectivity (and active TPB), require transport distances similar as the REV-dimensions, in order to become relevant. Consequently, in order to capture microstructure effects reliably in a macro-homogeneous model, one has to take into account this so-called short-range effect. This is of particular importance for electrode scenarios with a narrow active layer.
The postulation of a short-range effect provides an explanation for the complex pattern in the measurements as discussed earlier for the coarse Ni-YSZ anode after redox cycling. As shown in
Figure 7, TPB
active in the coarse anode decreases from 0.8 to 0.06 μm
−2 (
i.e., by 93%). Hence, with a simplistic view on TPB-performance relationships it would be expected that this anode should exhibit a very low electrochemical performance. Nevertheless, although a significant increase of
Rpol is measured (from 0.18 to 0.30 Ω·cm
2), this increase is much lower than expected based on the measured changes in TPB
active. The short-range effect thus provides an explanation, in the sense that Δ
Rpol does not correlate with ΔTPB
active, because loss of percolation in YSZ is only relevant at longer transport distances.
In contrast to TPB, Rpol is not a volume average property but it is the result of coupled transport and transfer processes that lead to uneven distributions of current densities throughout the anode. In particular, as shown in the third scenario, limitations due to loss of percolation are compensated by the concentration of the electrochemical activity in a narrow active layer close to the electrolyte, where (almost) all TPBs are active due to short transport distances for oxygen ions. Consequently it is assumed that the effective TPB activity changes across the anode layer—from the short distances, where all TPBs are active, to longer distances, where electrochemical activity correlates with TPBactive. The more limiting the TPBactive at long distances, the stronger the concentration of electrochemical activity close to the electrolyte-anode interface will be. But a complete loss of TPBactive (as a volume averaged microstructure characteristic) does not necessarily lead to anode failure, nor does a loss of effective ionic conductivity.


 and
and 