Article

Simple Response Surface Methodology: Investigation on Advance Photocatalytic Oxidation of 4-Chlorophenoxyacetic Acid Using UV-Active ZnO Photocatalyst

by
Kian Mun Lee
and
Sharifah Bee Abd Hamid
*
Nanotechnology & Catalysis Research Center (NANOCAT), Institute of Postgraduate Studies, University of Malaya, 50603 Kuala Lumpur, Malaysia
*
Author to whom correspondence should be addressed.
Materials 2015, 8(1), 339-354; https://doi.org/10.3390/ma8010339
Submission received: 20 October 2014 / Revised: 21 November 2014 / Accepted: 1 December 2014 / Published: 19 January 2015

Abstract

:
The performance of advance photocatalytic degradation of 4-chlorophenoxyacetic acid (4-CPA) strongly depends on photocatalyst dosage, initial concentration and initial pH. In the present study, a simple response surface methodology (RSM) was applied to investigate the interaction between these three independent factors. Thus, the photocatalytic degradation of 4-CPA in aqueous medium assisted by ultraviolet-active ZnO photocatalyst was systematically investigated. This study aims to determine the optimum processing parameters to maximize 4-CPA degradation. Based on the results obtained, it was found that a maximum of 91% of 4-CPA was successfully degraded under optimal conditions (0.02 g ZnO dosage, 20.00 mg/L of 4-CPA and pH 7.71). All the experimental data showed good agreement with the predicted results obtained from statistical analysis.

Graphical Abstract

1. Introduction

Recently, advanced oxidation processes (AOPs) have been studied extensively for both recalcitrant wastewater and dye wastewater. The reason is mainly attributed to a high capability to mineralize a wide range of recalcitrant contaminants and organic dye compounds via AOPs. In this case, AOPs have emerged as an efficient and cost-effective method in wastewater treatment. Theoretically, AOPs are based on the generation of highly reactive species, such as H2O2, ·OH, ·O2 and O3 for completing destruction of refractory organic compounds, including xylenols, pyridine, methylpyrrolidone, thiophene, etc. [1,2,3,4,5,6]. Among viable AOPs approaches, the use of heterogeneous photocatalysis system by employing semiconductor photocatalyst has become one of the most promising methods and has high potential to secure our green environment [7,8,9,10]. In order to bring the advanced heterogeneous photocatalysis system to the point of commercial readiness and establish a green economy for our next generation, substantial research on the development of an efficient semiconductor for wastewater treatment has been developed lately.
To date, zinc oxide (ZnO) has emerged as the leading candidate in the advanced heterogeneous photocatalysis system because of its unique characteristics, such as long-term photo-stability, excellent chemical stability, non-toxicity in nature, and outstanding charge transport property. It is a well-known fact that a ZnO photocatalyst has almost the same band gap energy (3.2 eV) as titanium dioxide (TiO2) and exhibited strong oxidation property under UV irradiation. Thus, ZnO can be acted as potential candidate in total mineralization of environmental contaminants, especially in wastewater treatment application [11,12,13,14,15]. Moreover, ZnO is relatively cost-effective compared to TiO2 whereby the usage of TiO2 is uneconomical for large scale water treatment operations [16]. Nevertheless, the greatest advantage of ZnO over TiO2 is the ability to absorb a wide range of UV spectrum with the corresponding threshold of 425 nm [17].
Nowadays, advanced crop protection technology has been received lots of scientific interest, which includes all pesticides, herbicides, insecticides, fungicides, as well as biotechnology products. This crop protection technology helps control the thousands of weed species, harmful insects and numerous plant diseases that afflict crops. However, the use of herbicides and pesticides in agricultural field on a large scale created severe environmental problems, especially water pollution. The most crucial issue is that all herbicides and pesticides compounds are chemically stable as well as resist to biodegradation. Moreover, the toxicity possessed by these organics may cause health problems. The widespread use of chlorophenoxy herbicides for agricultural purposes has raised public concern due to the accumulation of disposed residual in natural waters [18]. 4-chlorophenoxyacetic acid (4-CPA) is a widely used herbicide in controlling the sprout formation in mung beans [19]. A few reports have been carried out in removing 4-CPA [19,20,21], however, those studies only dealing with one-factor-at-a-time while holding others parameters constant. The optimization by this method is not adequate due to the combination effect of the parameters was not considered. Moreover, more time is needed and the true optimum conditions are hard to predict [22,23]. This will indirectly increase the cost of the overall process [24].
In order to overcome this problem, the optimization studies have been carried out by response surface methodology (RSM). RSM is a combination of statistical and mathematical method for optimization study in a complicated process [25]. RSM gives a lot of information from a small number of experiments compared to conventional methods. In addition, this statistical design of experiments taking into account the interaction effects between the studied parameters and can determine the combination of levels in order to optimize the process more accurately [26,27,28,29]. A central composite design (CCD) based on RSM was successfully applied in the optimization of photodegradation of various organics [30,31,32,33,34]. To the best of our knowledge, the literature regarding to the advance photocatalytic oxidation of 4-CPA using UV-active ZnO photocatalyst is still not available yet. Therefore, the well-designed and controlled of the critical parameters (ZnO loading, initial concentration of 4-CPA and initial pH) in heterogeneous photocatalysis system have been carried out using a simple RSM in order to maximize 4-CPA removal.

2. Materials and Methods

2.1. Materials

Zinc oxide (99%) and 4-chlorophenoxyacetic acid (4-CPA) (99%) in this study were purchased from Merck (Darmstadt, Germany). The chemicals were used as received without any purification. Deionized water (18.2 MΩ) was used throughout the studies to prepare the stock solutions and working solutions of 4-CPA. The specific surface area of ZnO particles was determined by the static BET method using a Thermo Finnigan Sorptomatic 1990 series analyzer (Thermo Fisher Scientific Inc., Milan, Italy). The band gap energy of ZnO was recorded by a Perkin Elmer Lambda 35 UV-vis-NIR spectrometer (Perkin Elmer, Waltham, MA, USA) equipped with an integrating sphere at room temperature. The particle size of ZnO was measured on the Nanophox facility (Sympatec, Clausthal-Zellerfeld, Germany).

2.2. Photocatalytic Degradation Studies

The photocatalytic studies were carried out in a rectangular photoreactor with five parallel quartz vessels. In a typical experiment, the ZnO photocatalyst was suspended in 100 mL of 4-CPA solution and was irradiated with a 96 W UV-A lamp with maximum wavelength of 365 nm. The initial pH of the solution was adjusted by a small amount of 0.01 M HNO3 or 0.01 M NaOH to the desired pH. The solution was allowed to stir for 20 min in the dark to attain adsorption equilibrium before irradiation. During irradiation, air was bubbled into the reaction medium to ensure a constant supply of oxygen (2 L/min). Stirring was applied to ensure a complete suspension of catalyst particles. The residual of 4-CPA in the test solution was filtered by using 0.22 μm Nylon filter to remove the ZnO particles. The concentration of 4-CPA in test samples was determined at λmax = 279 nm by a Perkin Elmer Lambda 35 UV-Vis spectrophotometer (Perkin Elmer, Waltham, MA, USA). All photodegradation experiments were done in triplicate to ensure the reproducibility of the experimental results. The Total Organic Carbon (TOC) content of degradation of 4-CPA was carried out (In House, based on HACH method) to evaluate the extent of mineralization.

2.3. Response Surface Methodology

In the optimization study, RSM was used to optimize the three parameters (ZnO loading, initial concentration of 4-CPA and initial pH). The three parameters were selected as independent variables while the degradation percentage of 4-CPA was the output response variable. Other factors such as stirring rate, temperature, light intensity and oxygen supply were held constant. Table 1 shows the ranges and level of independent variables. Central composite design (CCD) was chosen to investigate the combined effect of the three independent variables by 20 sets of experiments, including six replications at the center points. The experimental values of 4-CPA degradation percentage under various experimental conditions are shown in Table 2. Design Expert V.8.0.6 (Stat-Ease Inc., Minneapolis, MN, USA) was adopted to describe the response surface. In order to check the accuracy of the fitted model, a series of statistical analysis such as the normal plot, the residual analysis, the main and interaction effects, the contour plot and analysis of variance (ANOVA) was examined.
Table 1. Independent variables and experimental range for degradation of 4-chlorophenoxyacetic acid (4-CPA).
FactorsUnitSymbolRange
−2−10+1+2
ZnO loadinggx10.010.020.030.040.05
Initial 4-CPA concentrationmg/Lx210.0020.0030.0040.0050.00
pHx35.006.007.008.009.00
Table 2. Central composite design with predictive values and their experimental results.
RunExperimental conditions4-CPA degradation (%)
x1 ZnO loading (g)x2 Initial 4-CPA concentration (mg/L)x3 pHExperimentalPredictiveResidual
10.0220.006.0080.3280.070.25
20.0420.006.0076.4977.31−0.82
30.0240.006.0073.0373.25−0.22
40.0440.006.0066.4166.260.15
50.0220.008.0099.3299.99−0.67
60.0420.008.0098.8999.19−0.30
70.0240.008.0090.7390.430.30
80.0440.008.0084.6485.41−0.77
90.0130.007.0084.4384.52−0.094
100.0530.007.0077.3676.750.61
110.0310.007.00100.0099.490.51
120.0350.007.0078.9178.900.014
130.0330.005.0051.5051.440.059
140.0330.009.0090.9790.510.46
150.0330.007.0095.3295.150.17
160.0330.007.0094.8895.15−0.27
170.0330.007.0093.0295.15−2.13
180.0330.007.0095.6995.150.54
190.0330.007.0095.5095.150.35
200.0330.007.0097.0195.151.86

3. Results and Discussion

3.1. Preliminary Experiments

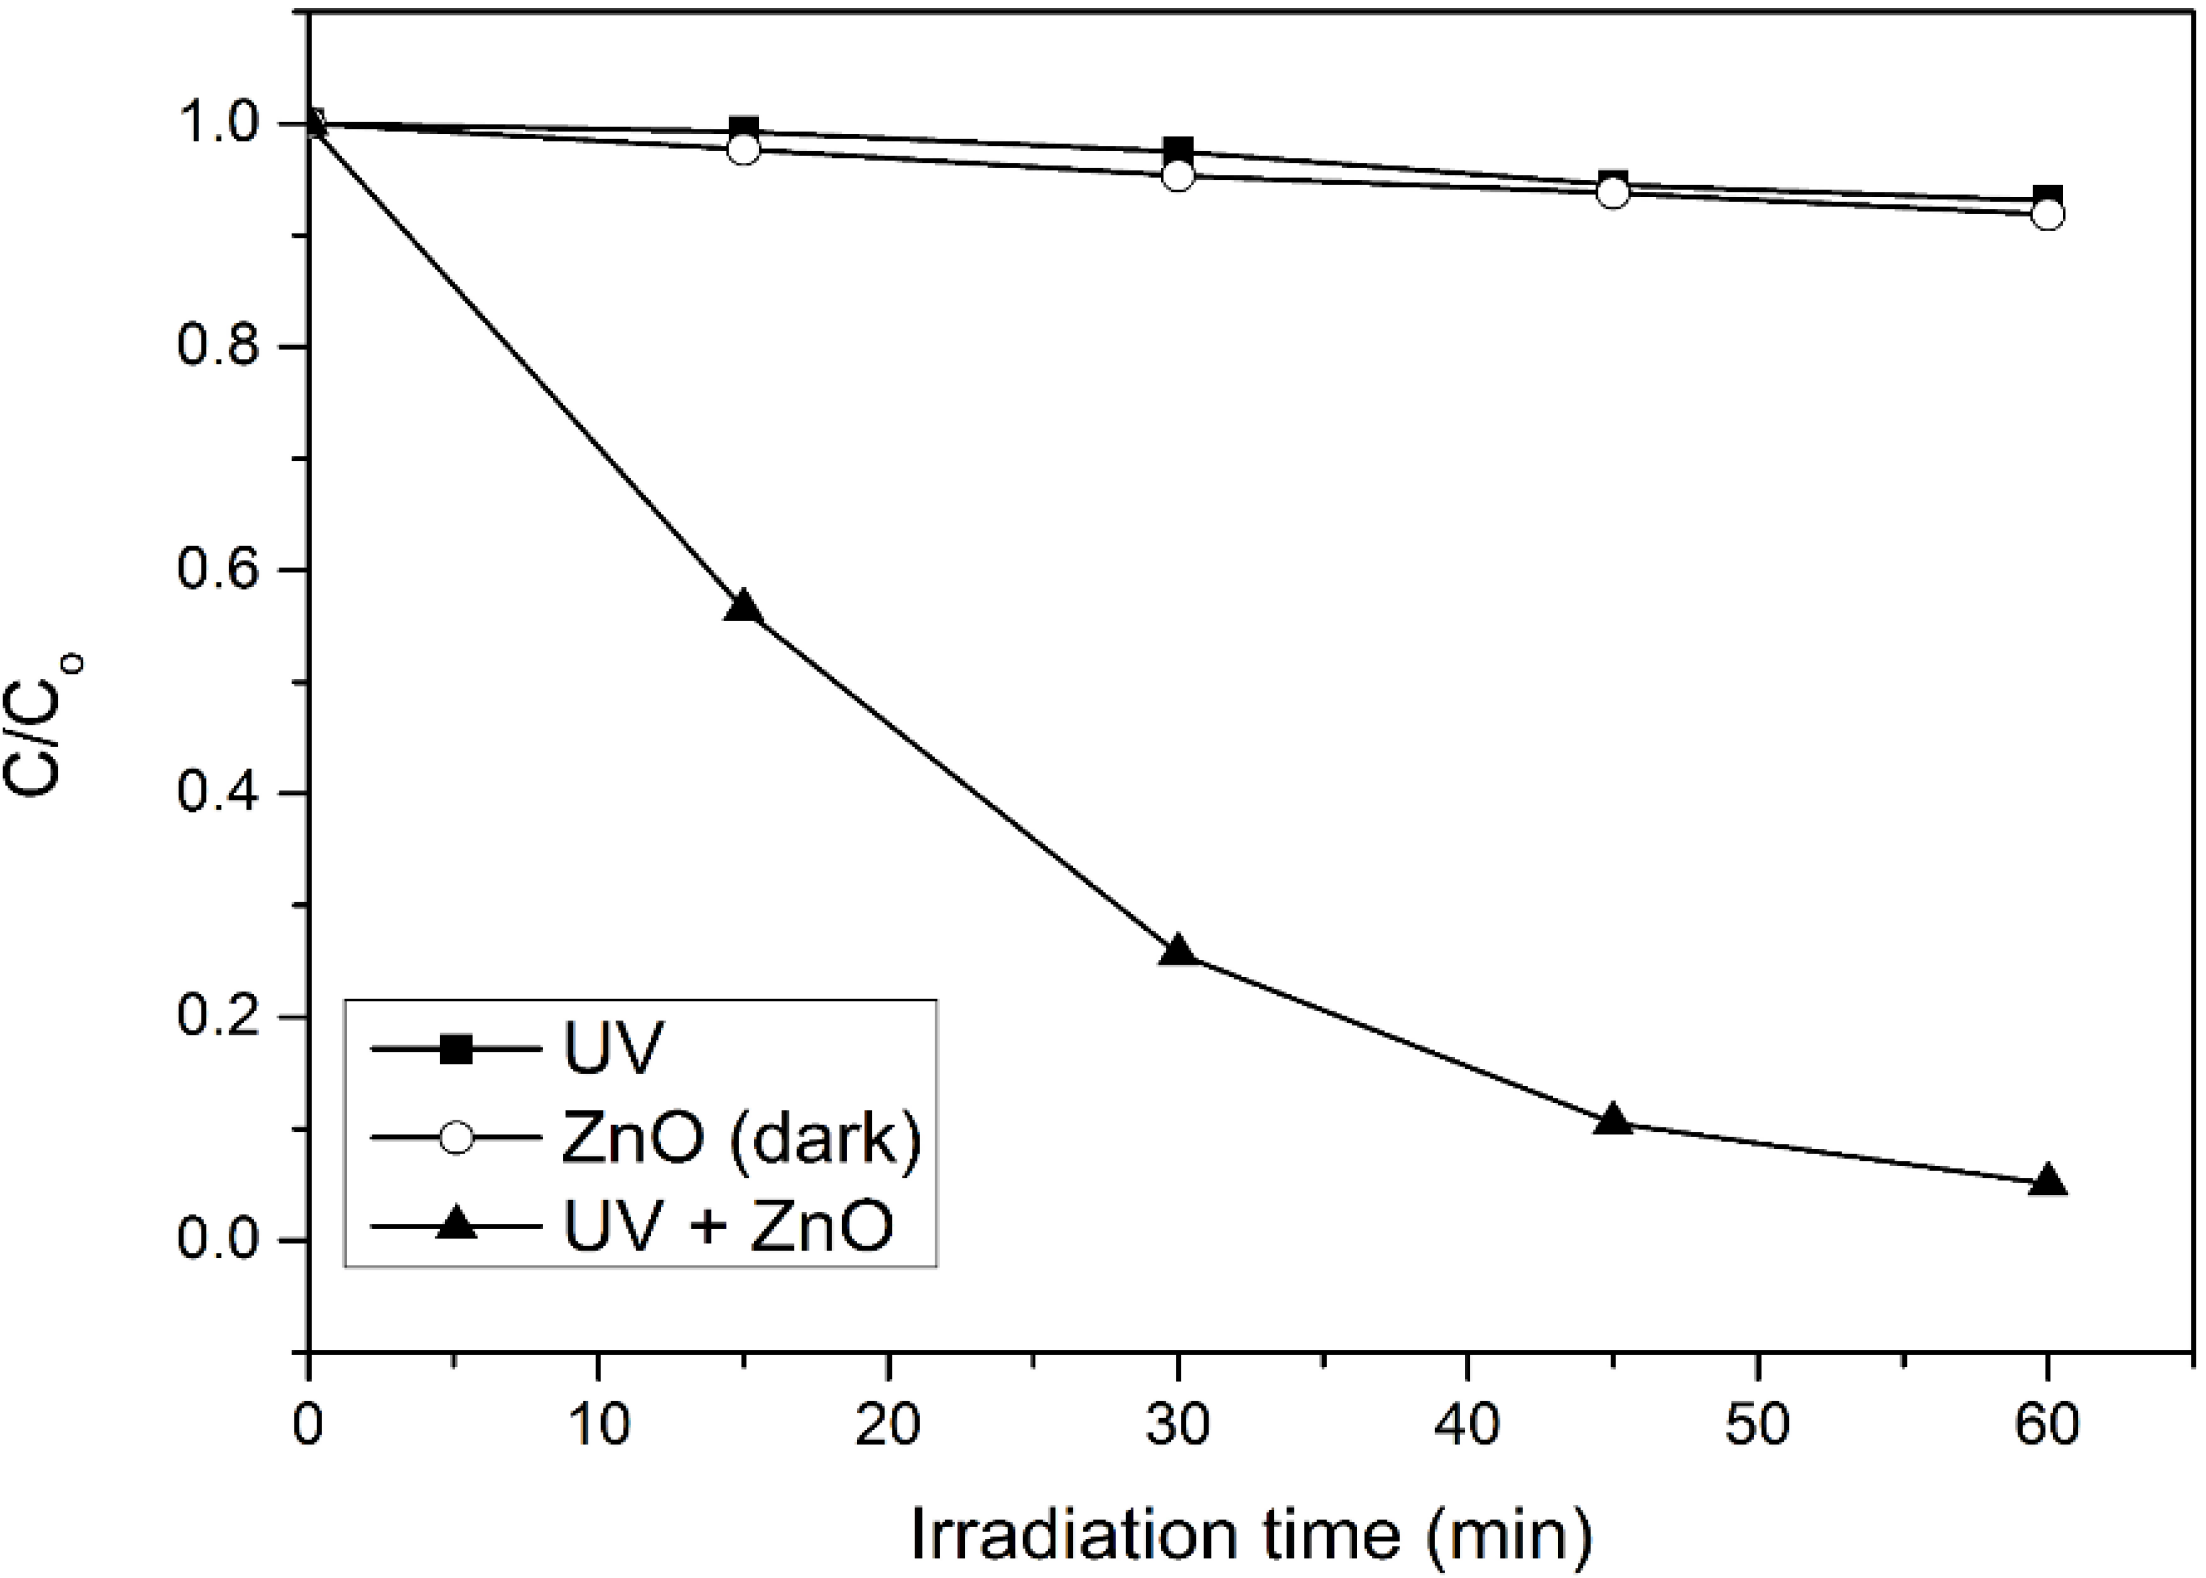
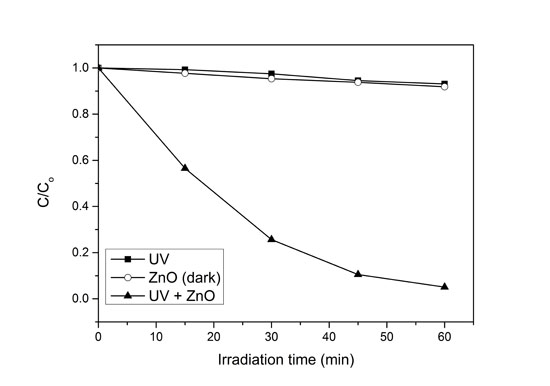
In order to evaluate the significant role of photocatalysis in the photodegradation process, photolysis and catalyst adsorption in dark condition were carried out. As shown in Figure 1, only 7% of 4-CPA was photolyzed by UV irradiation. The absorption of 4-CPA by ZnO photocatalyst was insignificant (8.2%). However, 94.9% of 4-CPA was degraded in the presence of ZnO under UV irradiation for an hour. This indicated the synergistic effect between ZnO photocatalyst and UV light for the photocatalytic degradation to work efficiently. 
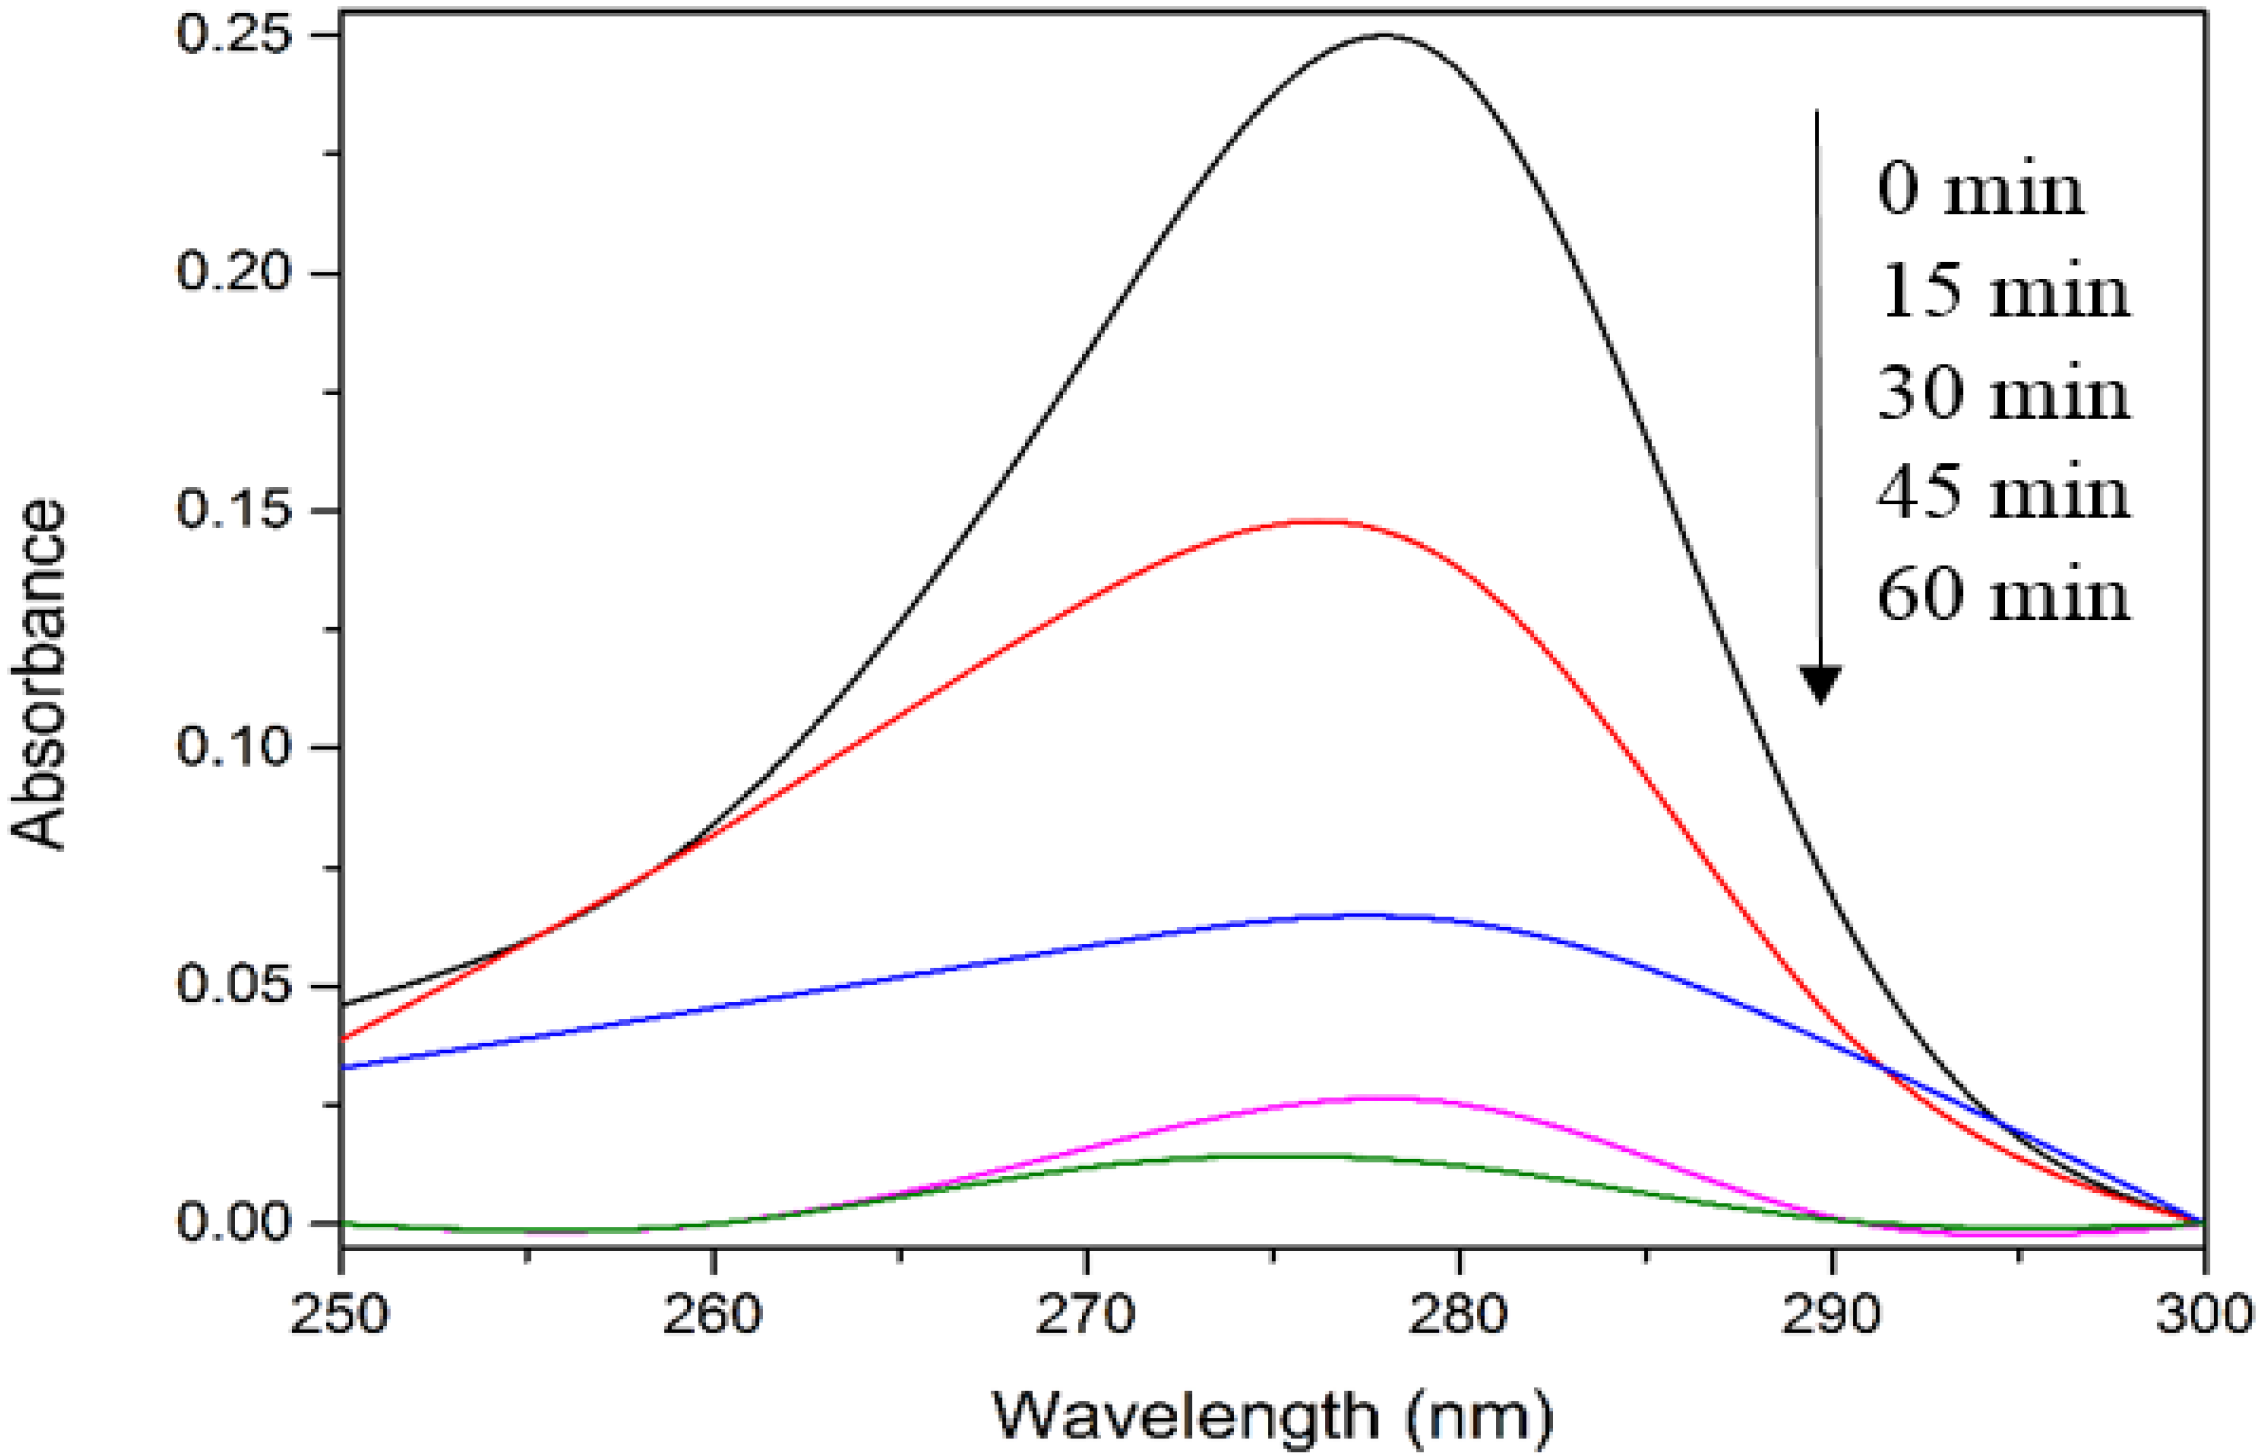
Figure 2 depicts the UV-vis spectra of 4-CPA during photocatalysis process. As evident from Figure 2, no obvious peak shift was observed.
Figure 1. Photocatalytic degradation of 4-CPA under various conditions. Conditions: ZnO loading = 0.03 g; [4-CPA] = 30 mg/L; pH = 7.
Materials 08 00339 g001
Figure 2. UV-vis spectra of 4-CPA during photocatalytic degradation process. Conditions: ZnO loading = 0.03 g; [4-CPA] = 30 mg/L; pH = 7.
Materials 08 00339 g002

3.2. Model Fitting and Statistically Analysis

In order to optimize the reaction conditions of 4-CPA degradation, CCD with a total number of 20 experiments was applied for the response surface modeling (Table 2). The experimental and predicted responses are shown as well. The software suggested quadratic model as shown in Table 3. Table 4 shows the ANOVA for response surface of quadratic model. The lack of fit indicates the variation of data around the fitted model and it will shows significant if the data does not fit well with the model [25]. The ANOVA implies that the model is significant with the F value of 301.23. There is only a 0.01% chance that a “Model F-Value” could occur due to noise. Moreover, the p value (<0.0001) is less than 0.05, which indicates the model terms are highly significant. It should be noted that values greater than 0.1000 indicate the model terms are not significant [35,36].
Table 3. Sequential model fitting for 4-CPA removal.
SourceSum of squaresDegree of freedomMean squareF Valuep ValueRemark
Mean1.487 × 10511.487 × 105
Linear2011.023670.349.850.0006
2 FI14.6034.870.0590.9805
Quadratic1063.203354.40311.05<0.0001Suggested
Cubic1.9340.480.310.8637Aliased
Residual9.4661.58
Total1.518 × 105207589.07
Table 4. ANOVA for the response surface quadratic model.
SourceSum of squaresDFMean squareF Valuep ValueSuggestion
Model3088.829343.20301.23<0.0001Significant
x160.49160.4953.09<0.0001
x2424.261424.26372.37<0.0001
x31526.2711526.271339.59<0.0001
x1x28.9318.937.830.0188
x1x31.9311.931.690.2222
x2x33.7413.743.280.1001
x12331.081331.08290.58<0.0001
x2255.73155.7348.91<0.0001
x32918.391918.39806.06<0.0001
Residual11.39101.14
Lack of fit2.9350.590.350.8658Not significant
Pure error8.4751.69
Std. dev. a1.07R20.9963
Mean86.22Adj. R2 b0.9930
C.V. c1.24Pred. R2 d0.9889
PRESS34.47Adeq. precision e64.317
a Standard deviation. b Adjusted R2. c Coefficient of variation. d Predicted R2. e Adequate precision.
The lack of fit value of 0.35 confirms the lack of fit is not significant relative to the pure error when p value is 0.8658, >0.05. The non-significant lack of fit shows good predictability of the model. The coefficient of variation (C.V. = 1.24) is low, indicated high precision and good reliability of the experimental values [37]. In addition, the “Pred. R2” of 0.9889 is in reasonable agreement with the “Adj. R2” of 0.9930 (within 0.2), which also implies good predictability of the model [38,39]. Adequate precision compares the range of predicted values at the design points to the average prediction error [40,41]. The adequate precision of 64.317 in this study, which is well above 4 indicates adequate model discrimination.
From the experimental results (Table 5), an empirical second-order polynomial equation was established and was written in terms of coded factors as follows:
y = 95.15 − 1.94x1 − 5.15x2 + 9.77x3 − 3.63x1x2 − 1.49x1x3 − 6.04x2x3 − 1.06x12 + 0.49x22 − 0.68x32
where y is the percentage degradation of 4-CPA (%), x1, x2 and x3 are terms for the coded values of ZnO loading, initial concentration of 4-CPA and pH, respectively. 
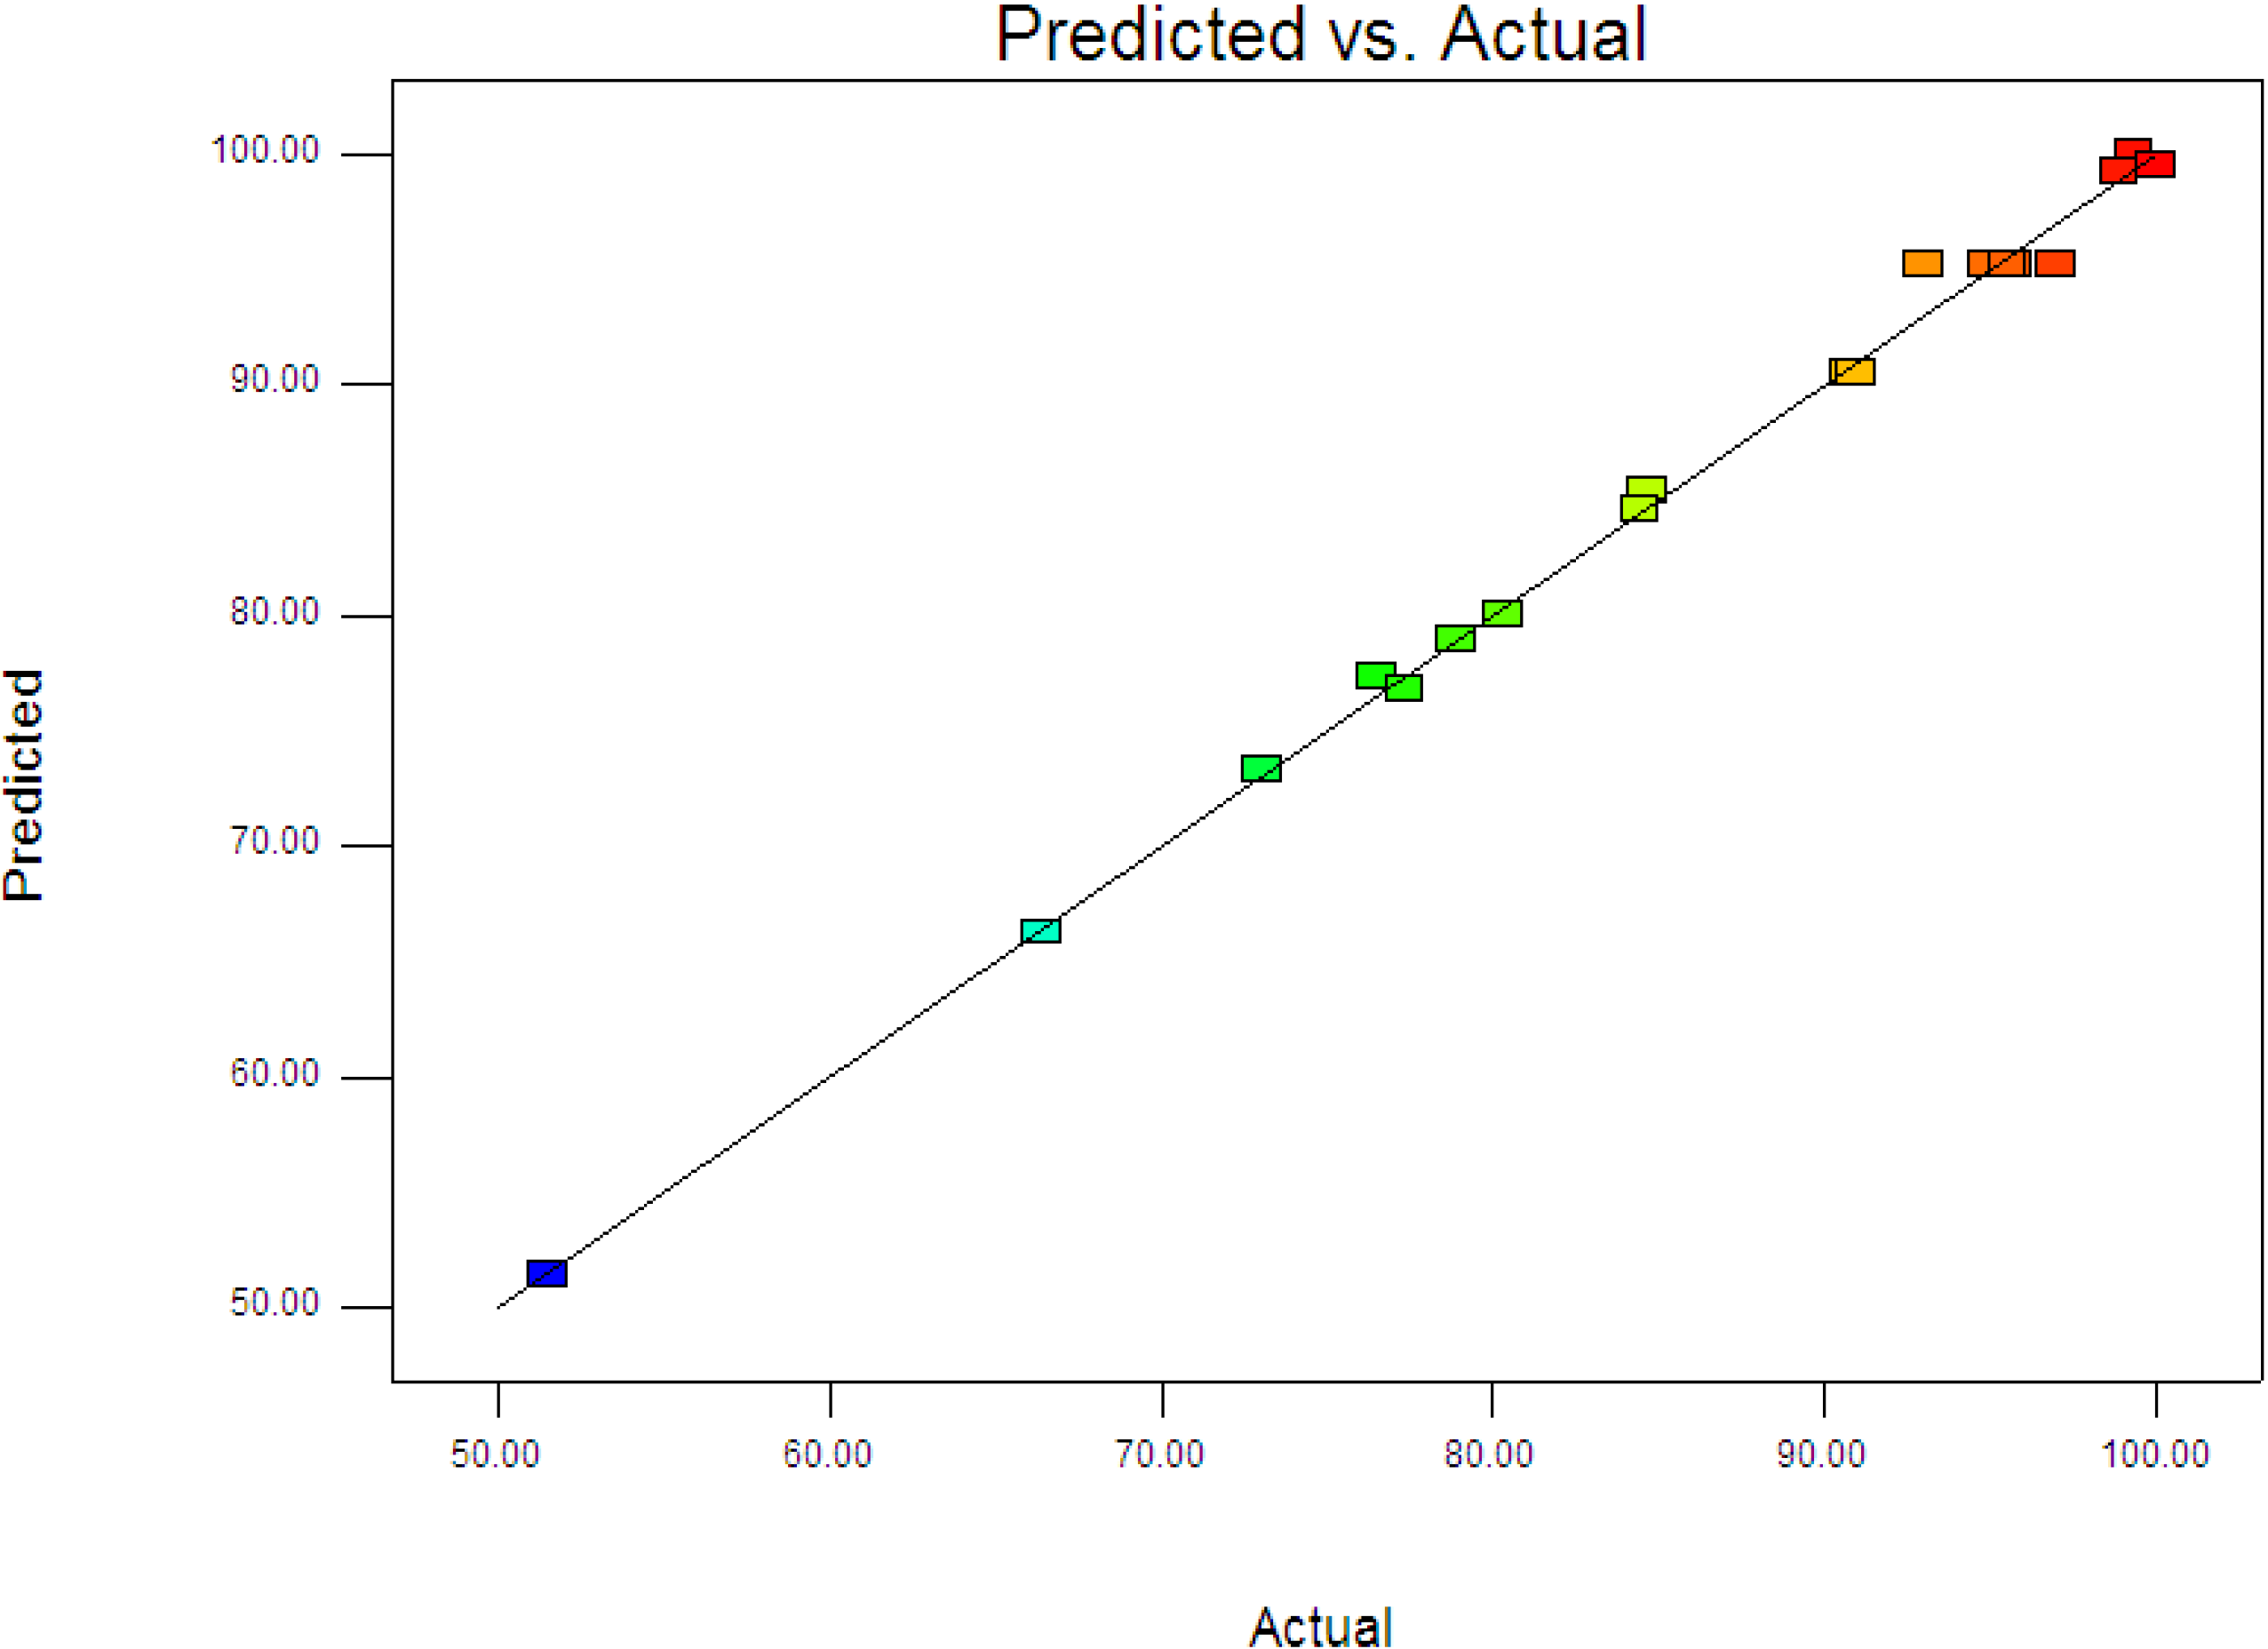
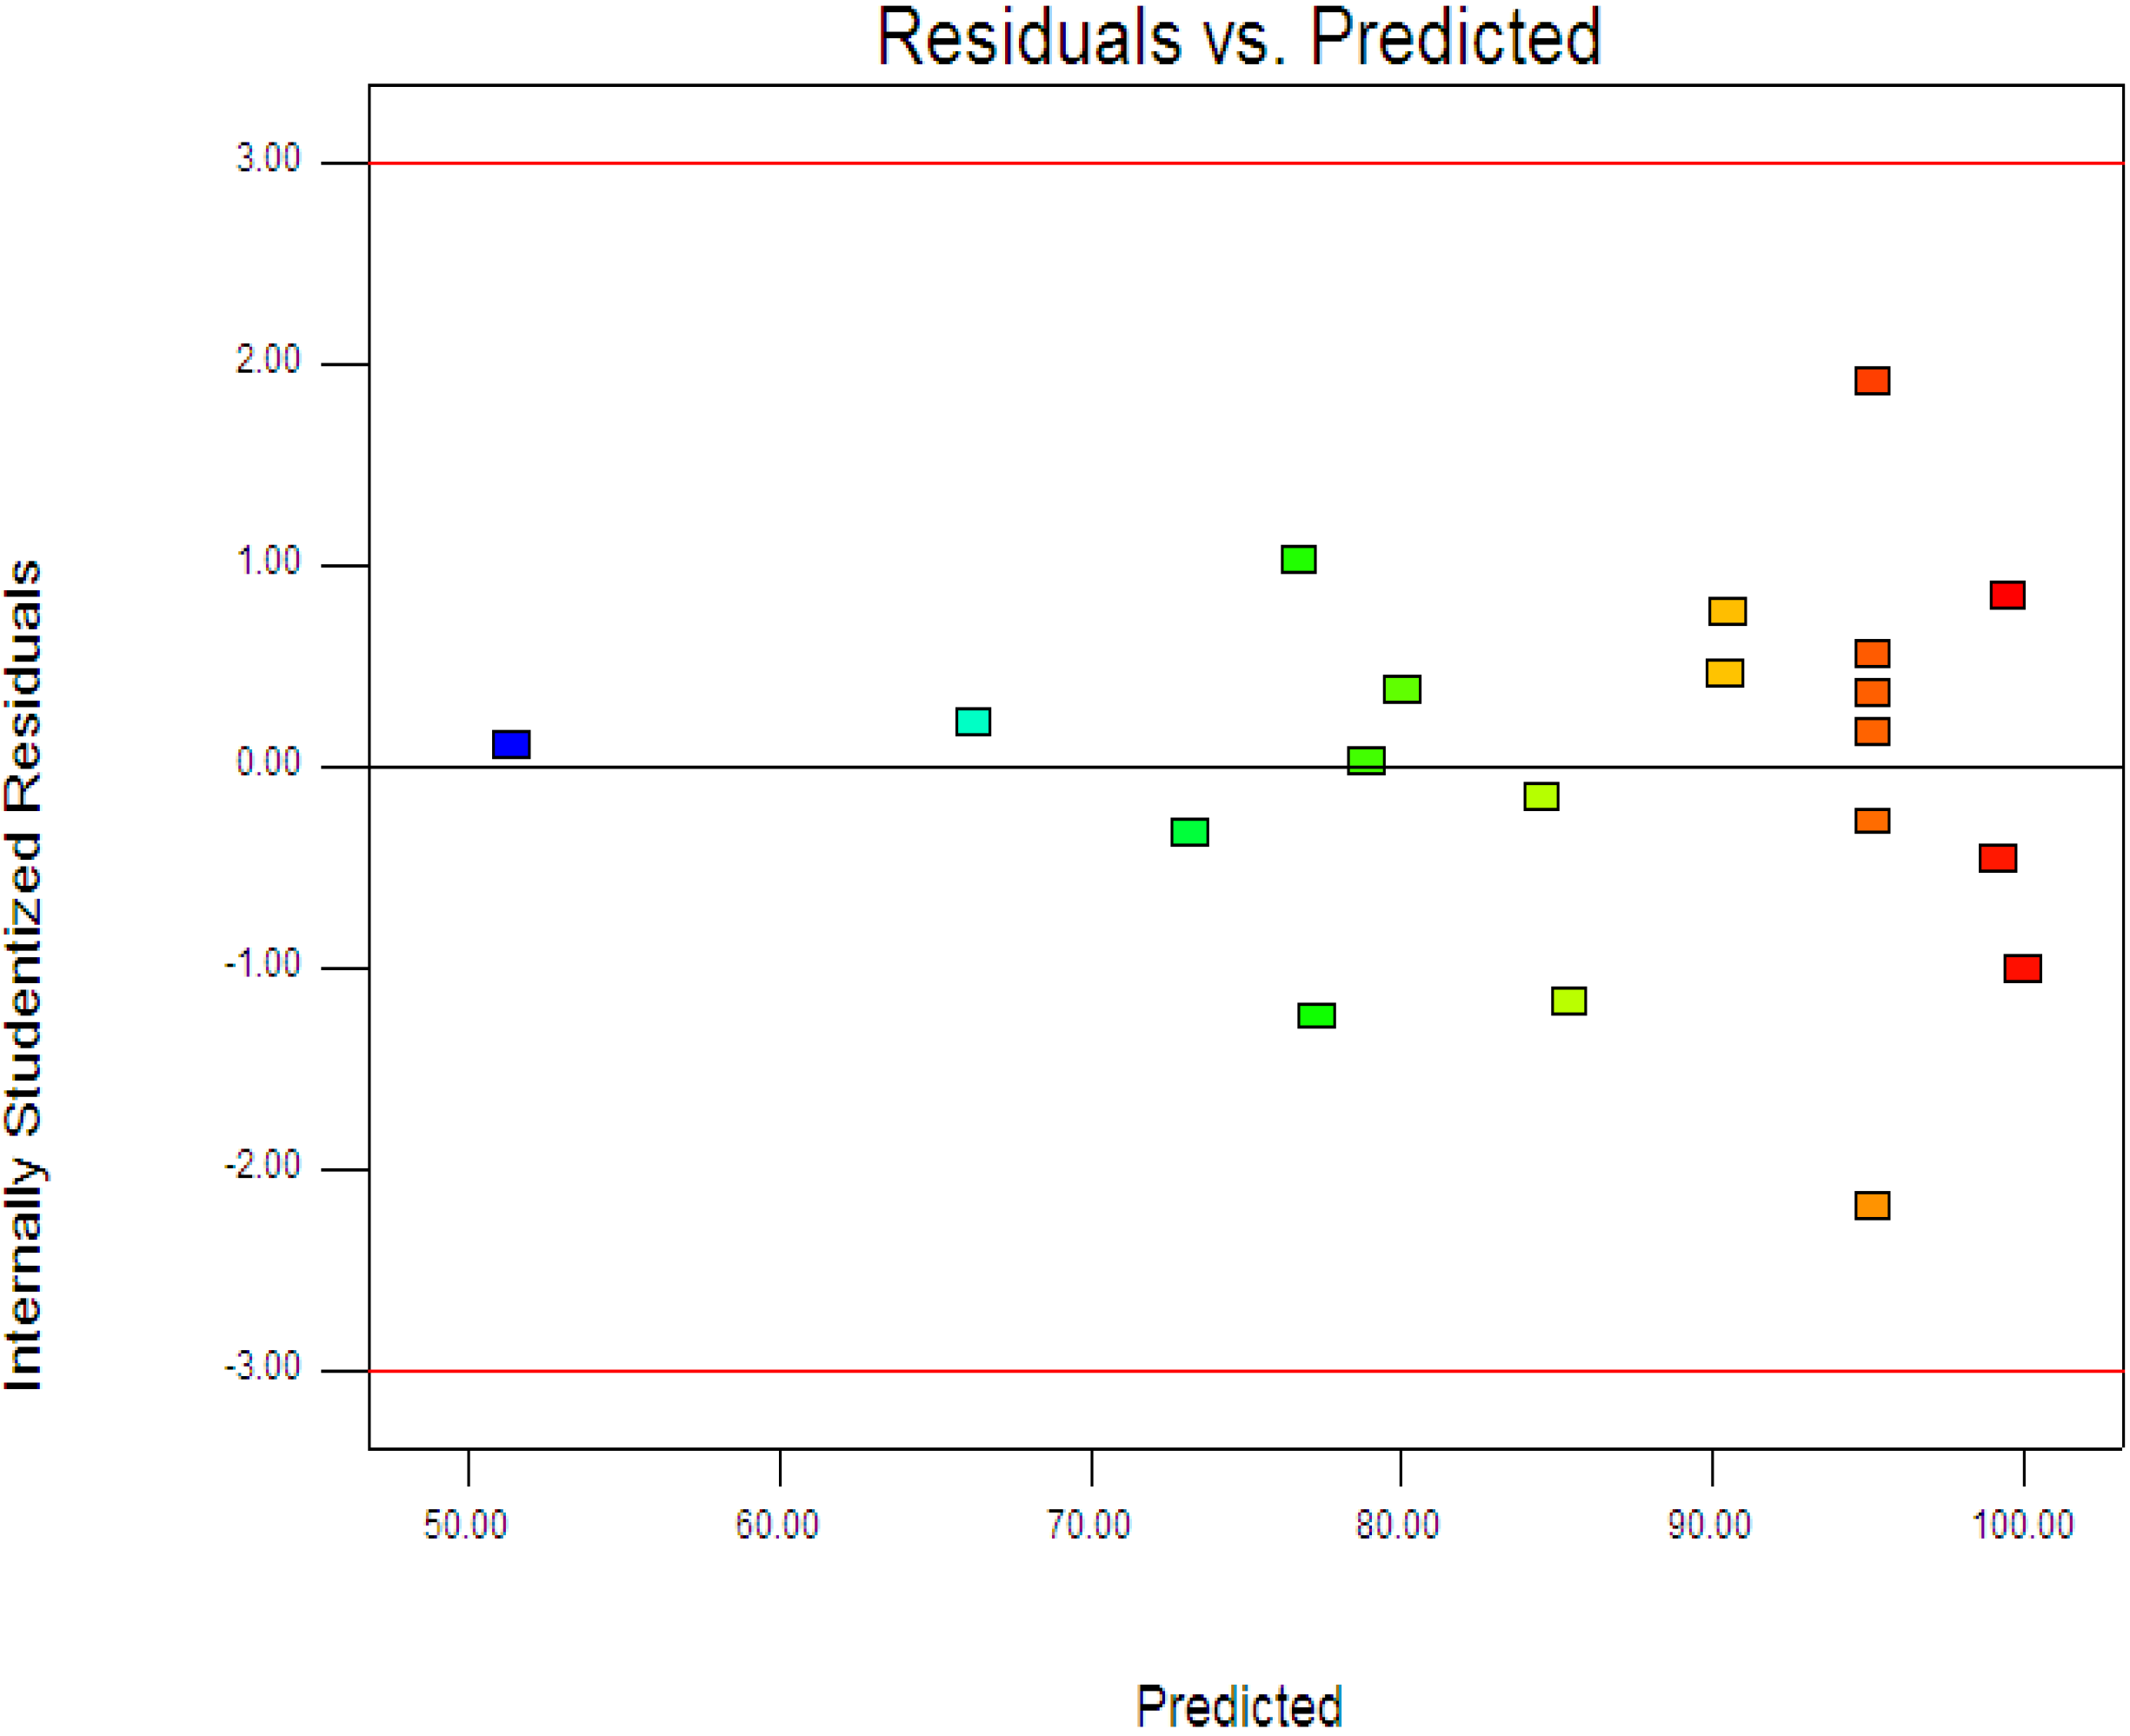
Figure 3 displays the experimental and predictive values for 4-CPA degradation. It can be seen that the high correlation between the experimental data and predicted values (
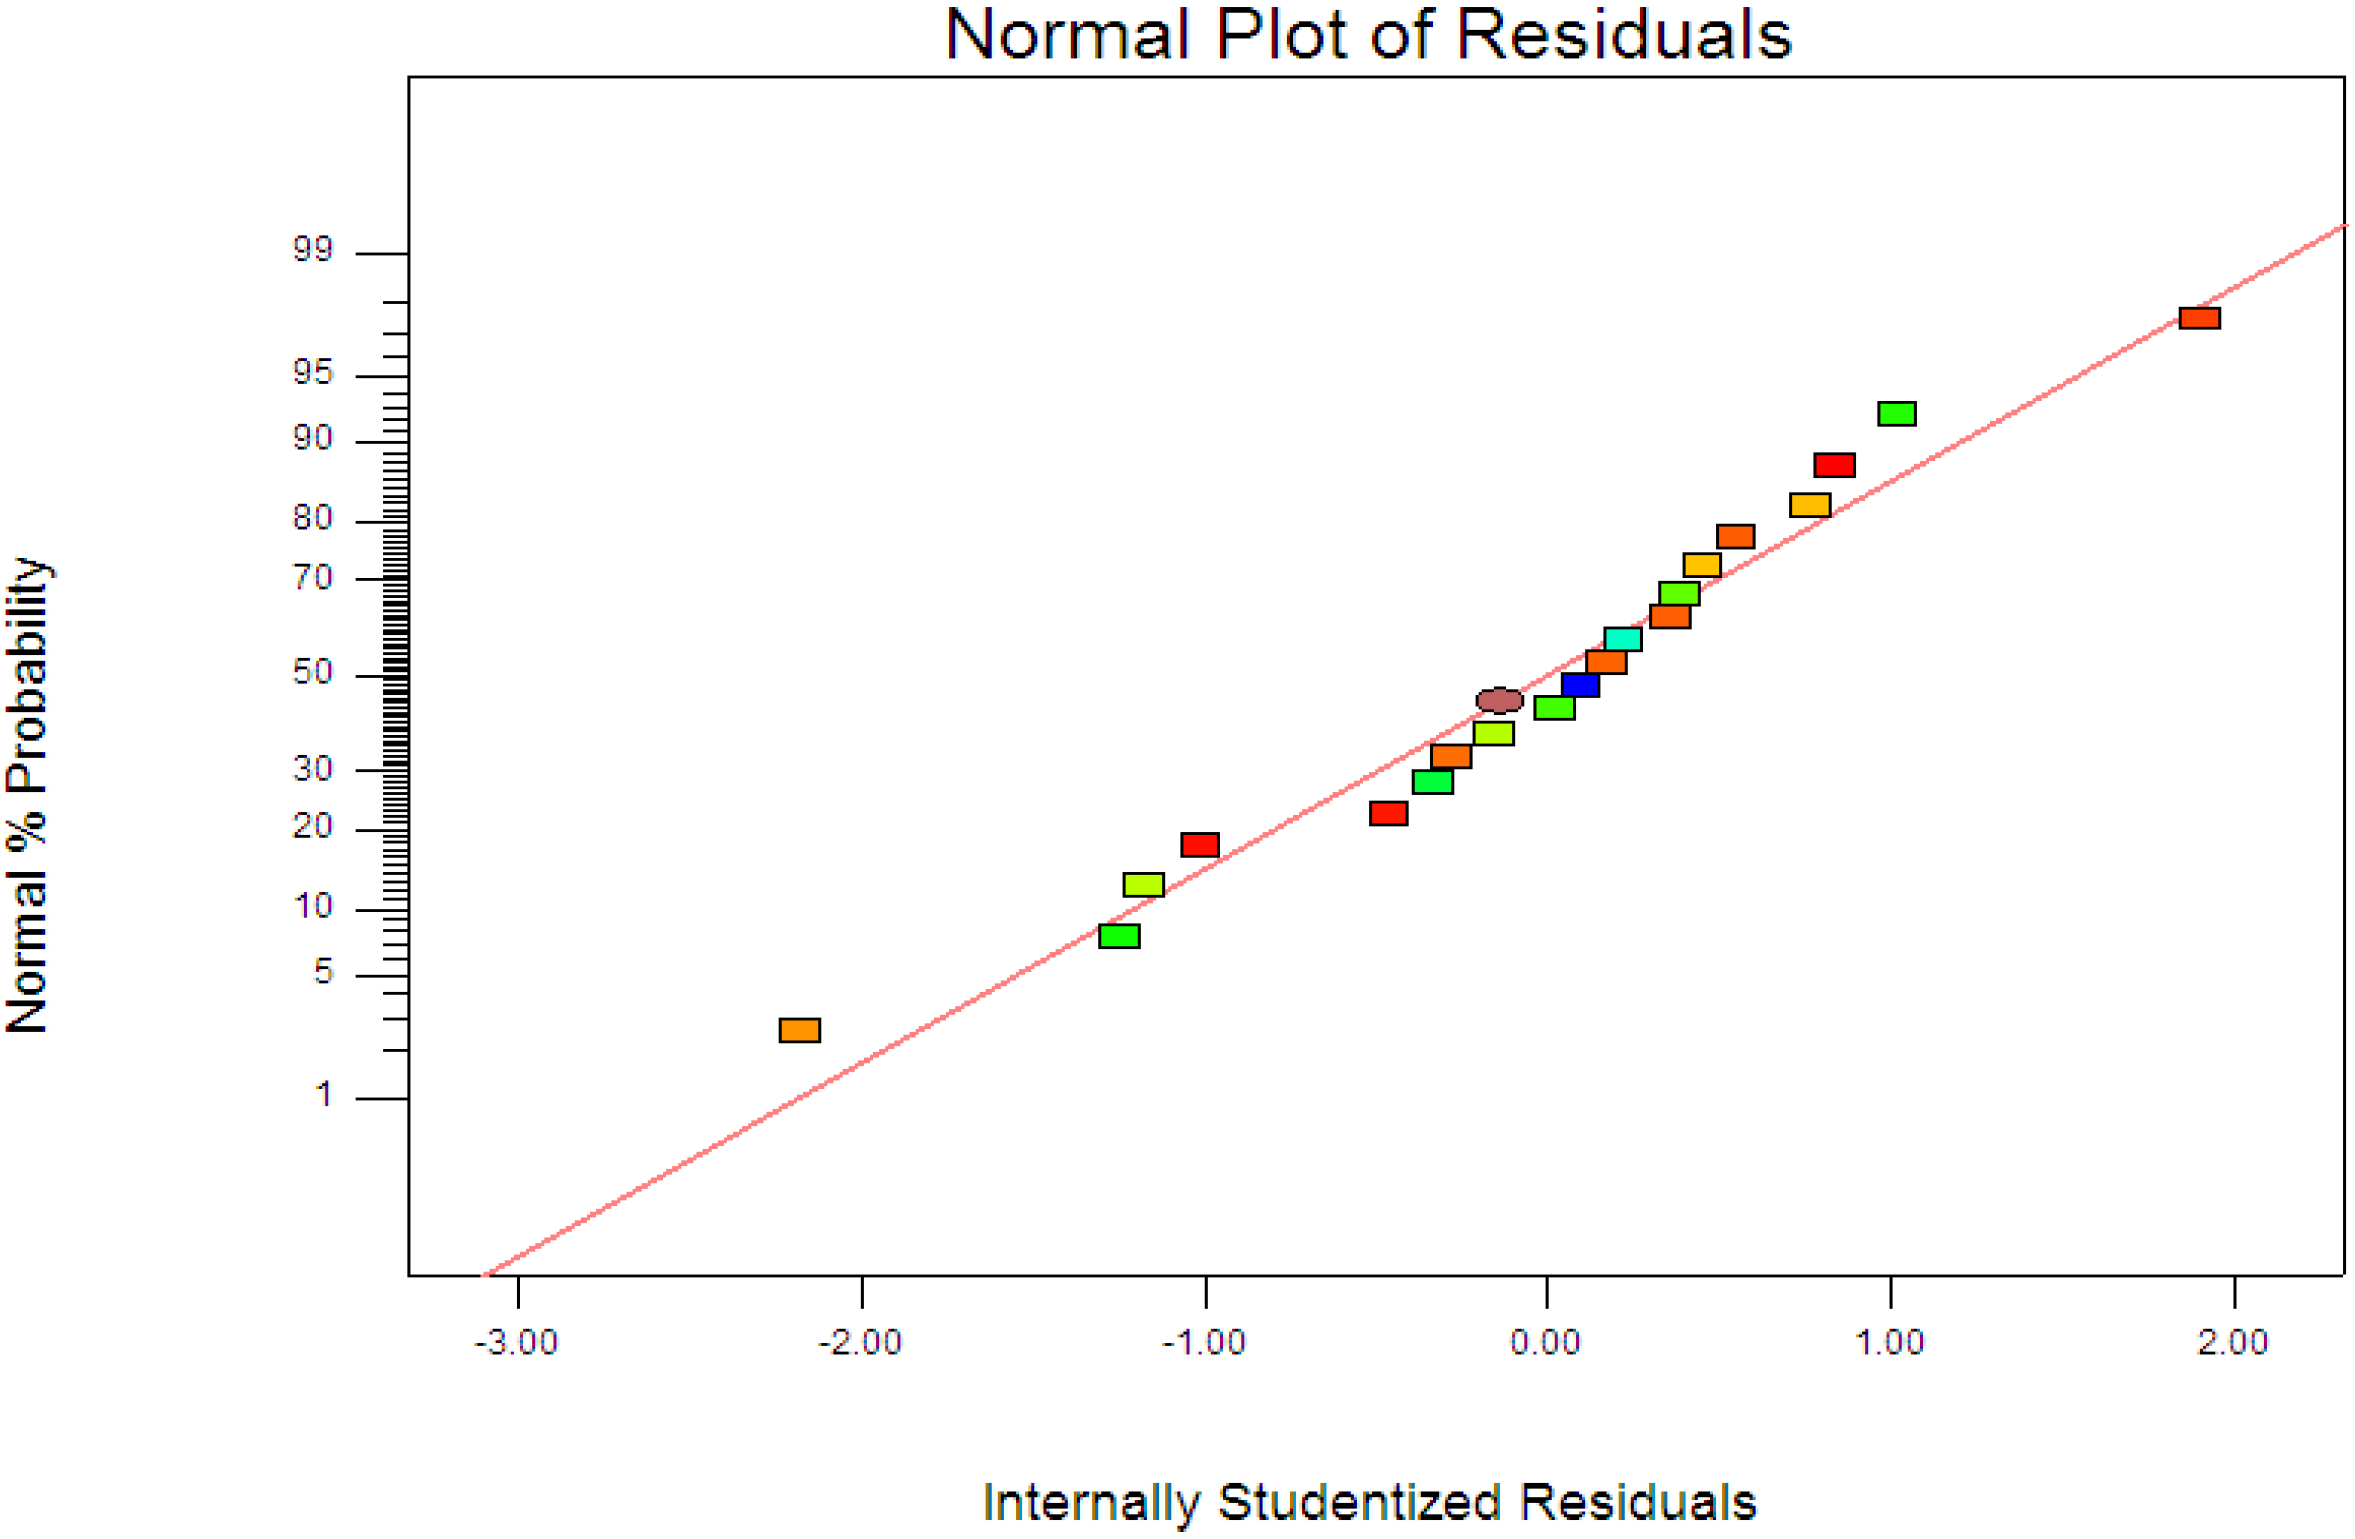
R2 = 0.9963) showed the data fit well with the model in the range studied. On the other hand, residuals analysis was carried out in order to confirm the adequacy of the model. This was done by observing the normal probability plot of the residuals (Figure 4) and the plot of the residuals vs. the predicted response (Figure 5). From Figure 4, the residuals were fall on a straight line suggested the errors are distributed normally [42]. Furthermore, structureless pattern in the plot of residuals vs. the predicted response indicated the model is adequate and the model does not show any violation of the independence or constant variance assumption [40].
Table 5. Coefficient of regression model and their significance.
FactorCoefficient estimateDegree of freedomStandard errorF Value95% Confidence interval low95% Confidence interval highp Value
Intercept95.1510.4394.2096.10
x1−1.9410.2753.09−2.54−1.35<0.0001
x2−5.1510.27372.37−5.74−4.55<0.0001
x39.7710.271339.599.1710.36<0.0001
x12−1.0610.387.83−1.90−0.220.0188
x220.4910.381.69−0.351.330.2222
x32−0.6810.383.28−1.520.160.1001
x1x2−3.6310.21290.58−4.10−3.15<0.0001
x1x3−1.4910.2148.91−1.96−1.01<0.0001
x2x3−6.0410.21806.06−6.52−5.57<0.0001
Figure 3. Predicted vs. actual values for photodegradation of 4-CPA.
Materials 08 00339 g003
Figure 4. Normal probability plots of the residuals.
Materials 08 00339 g004
Figure 5. Plot of the residuals against the predicted response.
Materials 08 00339 g005

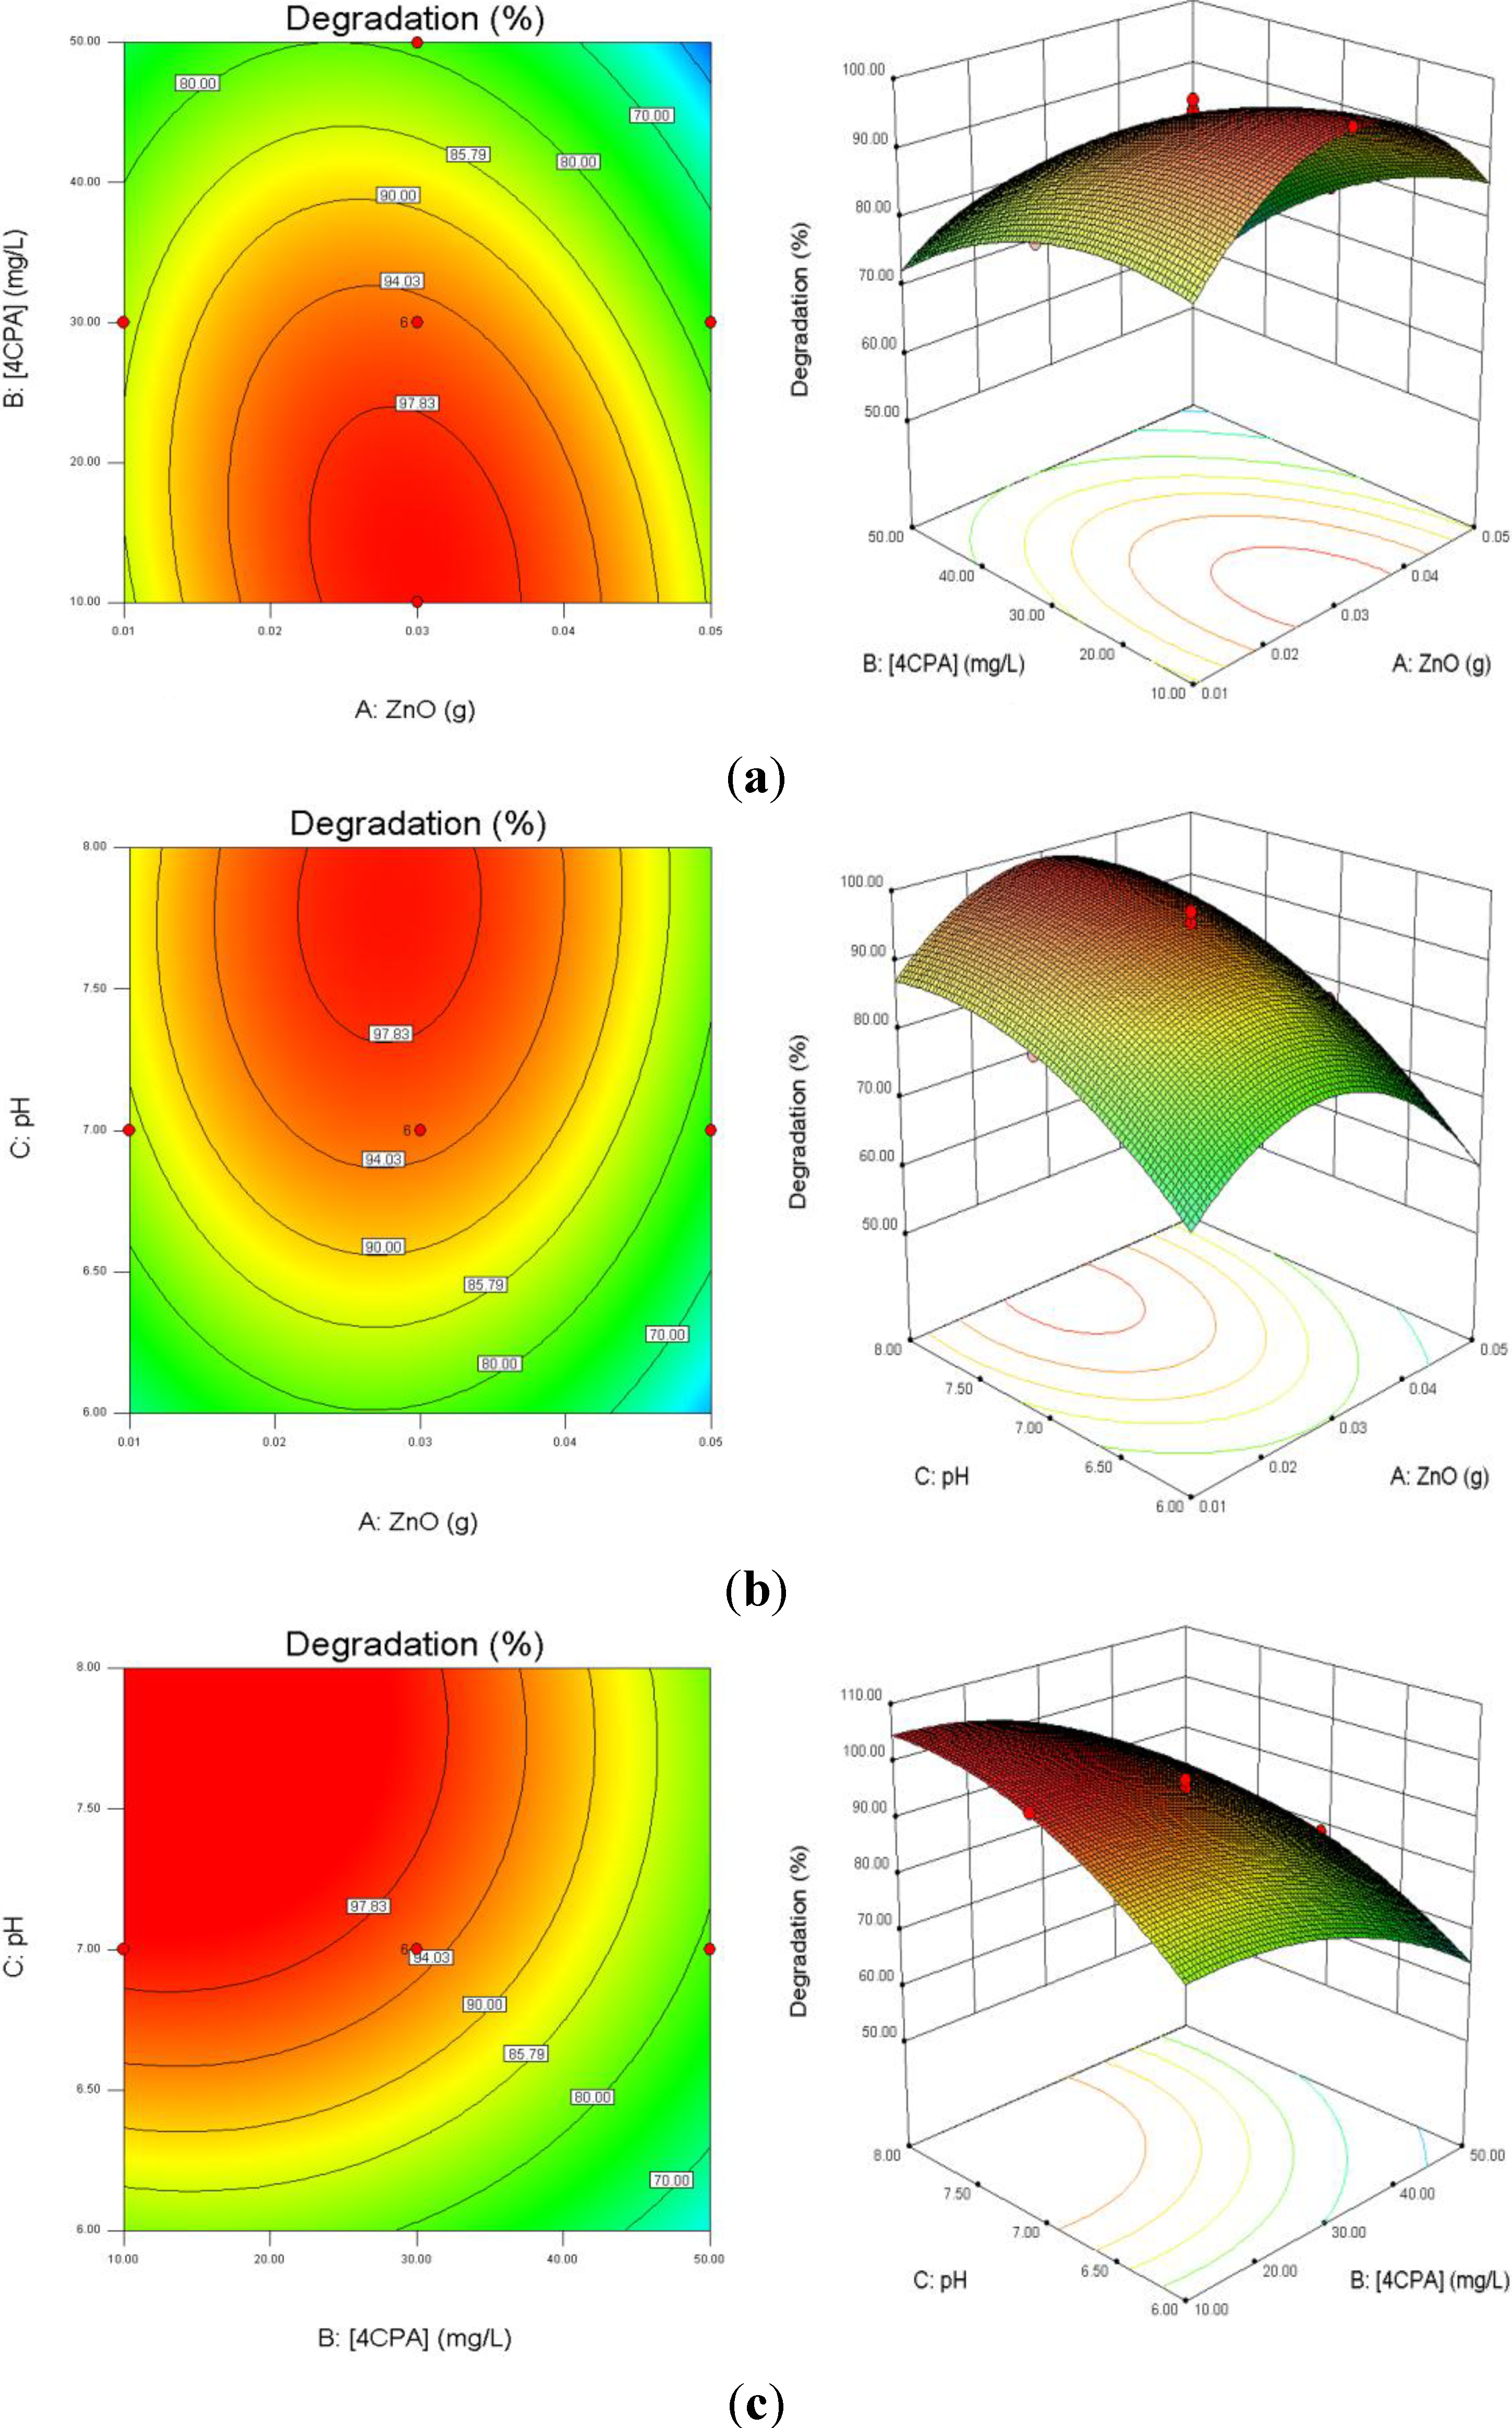
3.3. Response Surface Analysis

Figure 6a depicts the influence of ZnO loading and initial 4-CPA concentration on the degradation efficiency while keeping pH at 7.00. As illustrated in the plots, the degradation percentage increased with increasing catalyst dosage up to an optimum mass (0.30 g) and then decreased with excessive ZnO. This is based on the fact that an increase in the catalyst dosage will enhance the number of active site on the catalyst surface, which in turn increased the number of hydroxyl and superoxide radicals responsible for the degradation of 4-CPA molecules [43]. Further enhancement in the catalyst concentration resulted in lower percentage of degradation. This may be due to the solution becomes opaque which reduces the penetration of UV light into the solution and consequently lowers the degradation percentage [44]. On the other hand, the removal percentage of 4-CPA was lower when the concentration increased from 10 to 50 mg/L. This can be explained by as the concentration of substrate increases, more and more pollutant molecules are adsorbed on the catalyst surface. However, the catalyst dosage, light intensity and irradiation period are remaining constant. Hence, the numbers of hydroxyl radicals formed on the catalyst surface are constant as well. Consequently, the hydroxyl radicals formed are insufficient to degrade substrate molecules at higher concentrations, which decreased the degradation efficiency [45].
Figure 6. Effects of ZnO loading, initial concentration of 4-CPA and pH on the degradation percentage of 4-CPA. (a) pH was kept constant at 7.0; (b) 4-CPA initial concentration was kept constant at 30 mg/L; (c) ZnO loading was kept constant at 0.03 g.
Materials 08 00339 g006
Figure 6b presents the interaction effect of ZnO loading and initial solution pH on the removal of 4-CPA. It is evident that the removal increased as the pH and the amount of ZnO loaded up to an optimum value. The degradation rate decreased after achieved the optimal points. Higher catalyst loading does not favor the degradation process as it facilitates particle agglomeration leading to a reduction in catalyst surface area available for light absorption and pollutant adsorption, which in turn, reduced the photocatalytic efficiency [46]. The pKa of 4-CPA is 3.56 and the point of zero charge (pHzpc) of ZnO is 9.0. Therefore, the 4-CPA is negatively charged above its pKa value. As expected, the pH that shows optimal degradation must fall in between pKa < pH < pHzpc, due to the electrostatic interaction among the anions of 4-CPA and positively charged catalyst surface is enhanced [47].
The effect of initial concentration of 4-CPA and pH values on the removal of 4-CPA are shown in Figure 6c. It is obvious that increasing the 4-CPA concentration adversely affect the removal efficiency. This phenomenon may be due to the screening effect by 4-CPA molecules which reduced light penetration into the solution. Thus, the photoactivated volume is reduced, which lowers the percentage of degradation [48]. The competition between the pollutant molecules and the generated intermediates for hydroxyl radicals also reduced the degradation rate at higher concentration [49]. In addition, the percentage removal was low at lower medium pH regardless 4-CPA concentration due to substantial loss of ZnO particles [50].

3.4. Process Optimization and Confirmation

The goal of the optimization process is to achieve maximum degradation of 4-CPA by ZnO photocatalyst under UV irradiation. Therefore, the catalyst loading was set to minimum value, the concentration of 4-CPA was set to maximum value and the pH of the solution was set within the studied range, in order to obtain maximum degradation efficiency of 4-CPA. The optimum values of the influencing factors for the maximum 4-CPA removal under these circumstances are 0.02 g ZnO dosage, 20.00 mg/L 4-CPA and at pH 7.71 which gave 90.94% 4-CPA removal. Consequently, experiment was conducted in accordance to the optimized parameters and it showed 91.33% of 4-CPA removal. The good agreement between the predictive results and experimental results indicated that CCD design is feasible to optimize the degradation of 4-CPA. The photoactivity of ZnO (Merck) was compared with two other types of commercial ZnO (Alfa Aesar and PC lab) and the results were summarized in 
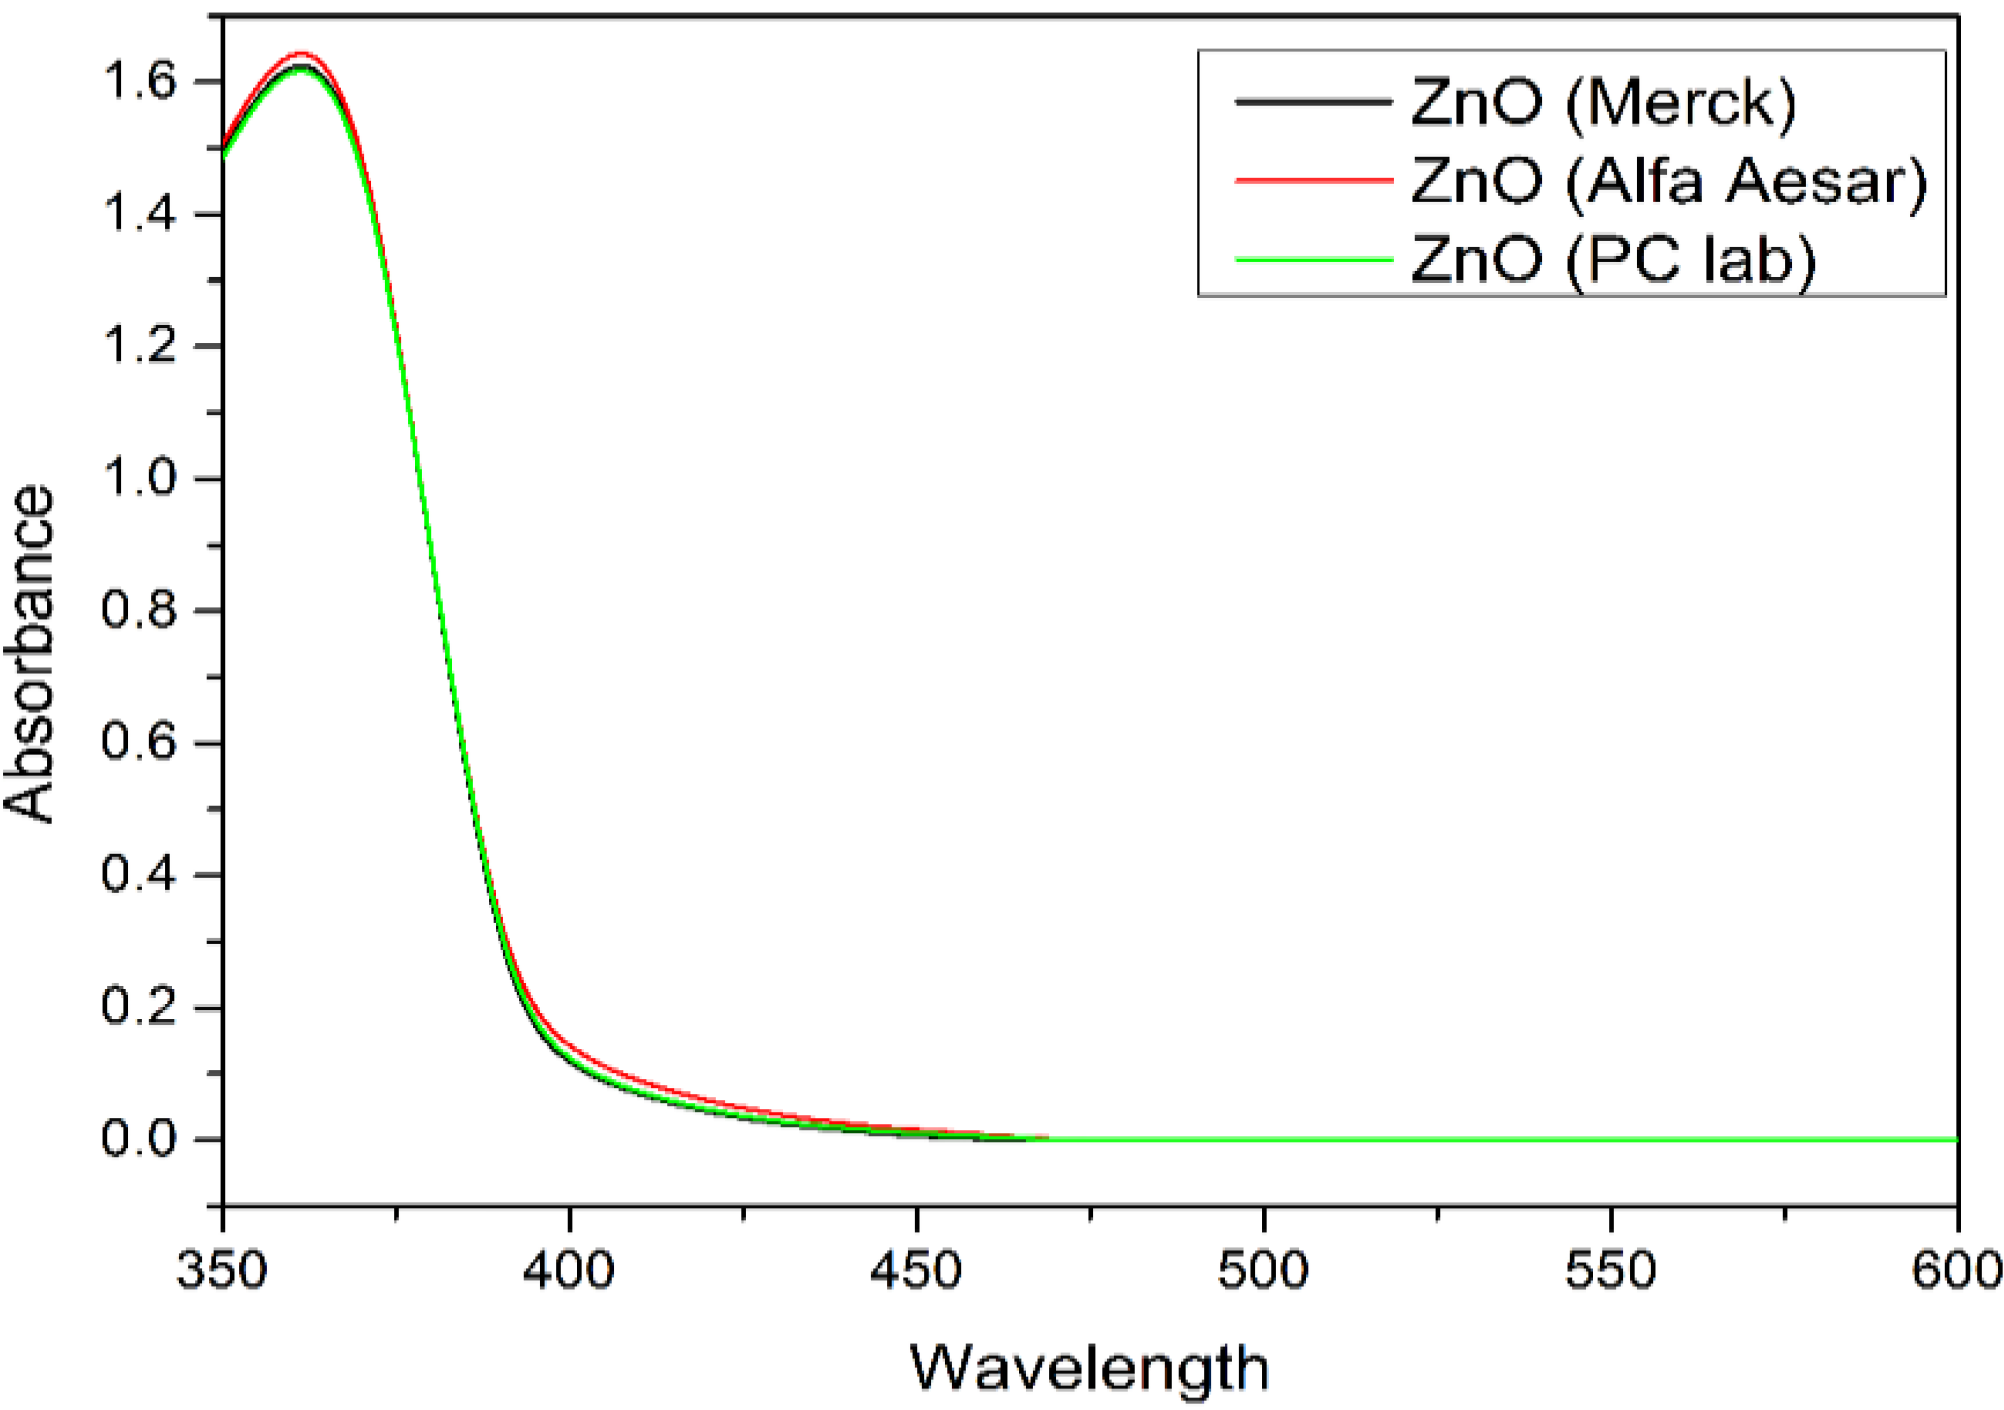
Table 6. It is obvious that the photocatalytic activity of ZnO powder was influenced by the surface area, where ZnO from Merck has the highest photoactivity compared to Alfa Aesar ZnO and PC lab ZnO. The UV-Vis spectra of ZnO photocatalyst (Merck, Alfa Aesar and PC lab) were shown in Figure 7.
Table 6. Characteristic of three types of commercial ZnO.
ZnO typeCharacteristic4-CPA degradation (%)
Surface area (m2/g)Particle size (μm)Band gap (eV)
Merck3.30.4–0.53.0291.33
PC lab2.30.1–0.63.0778.42
Alfa Aesar1.50.1–0.33.0476.23
Figure 7. UV-Vis spectra of three different types of ZnO photocatalyst.
Materials 08 00339 g007

3.5. Kinetic and Mineralization Studies

The reaction rate of 4-CPA in the presence of ZnO photocatalyst under UV irradiation was evaluated at different concentrations. The Langmuir-Hinshelwood (L-H) kinetic model was used to explain the kinetics of heterogeneous photocatalytic processes [51]:
r 1 =   d C d t = K 1 K 2 C 1 + K 2 K 0 = k 1 C
where C0 is the initial concentration of 4-CPA (mg·L−1), C is the 4-CPA concentration at time, t, k1 is the pseudo first-order rate constant, K1 is the surface reaction rate constant (mg·L−1·min−1), K2 is the Langmuir-Hinshelwood adsorption equilibrium constant (L·mg−1). Integration of Equation (2) gives Equation (3):
ln C C 0 + K 2 ( C 0 C ) = K 1 K 2 t
When the solution is highly diluted, C (mol·L−1) < 10−3 [52], the term K2C becomes < 1, thus the denominator of Equation (2) is neglected and the reaction is essentially an apparent first-order reaction (Equation (4)):
r 1 =   d C d t =   K 1 K 2 C = k 1 C
where k1 is the rate constant of a pseudo first-order reaction. Thus, Equation (3) can be simplified to a first-order reaction when C0 is very small gives Equation (5):
ln C 0 C = k 1 t
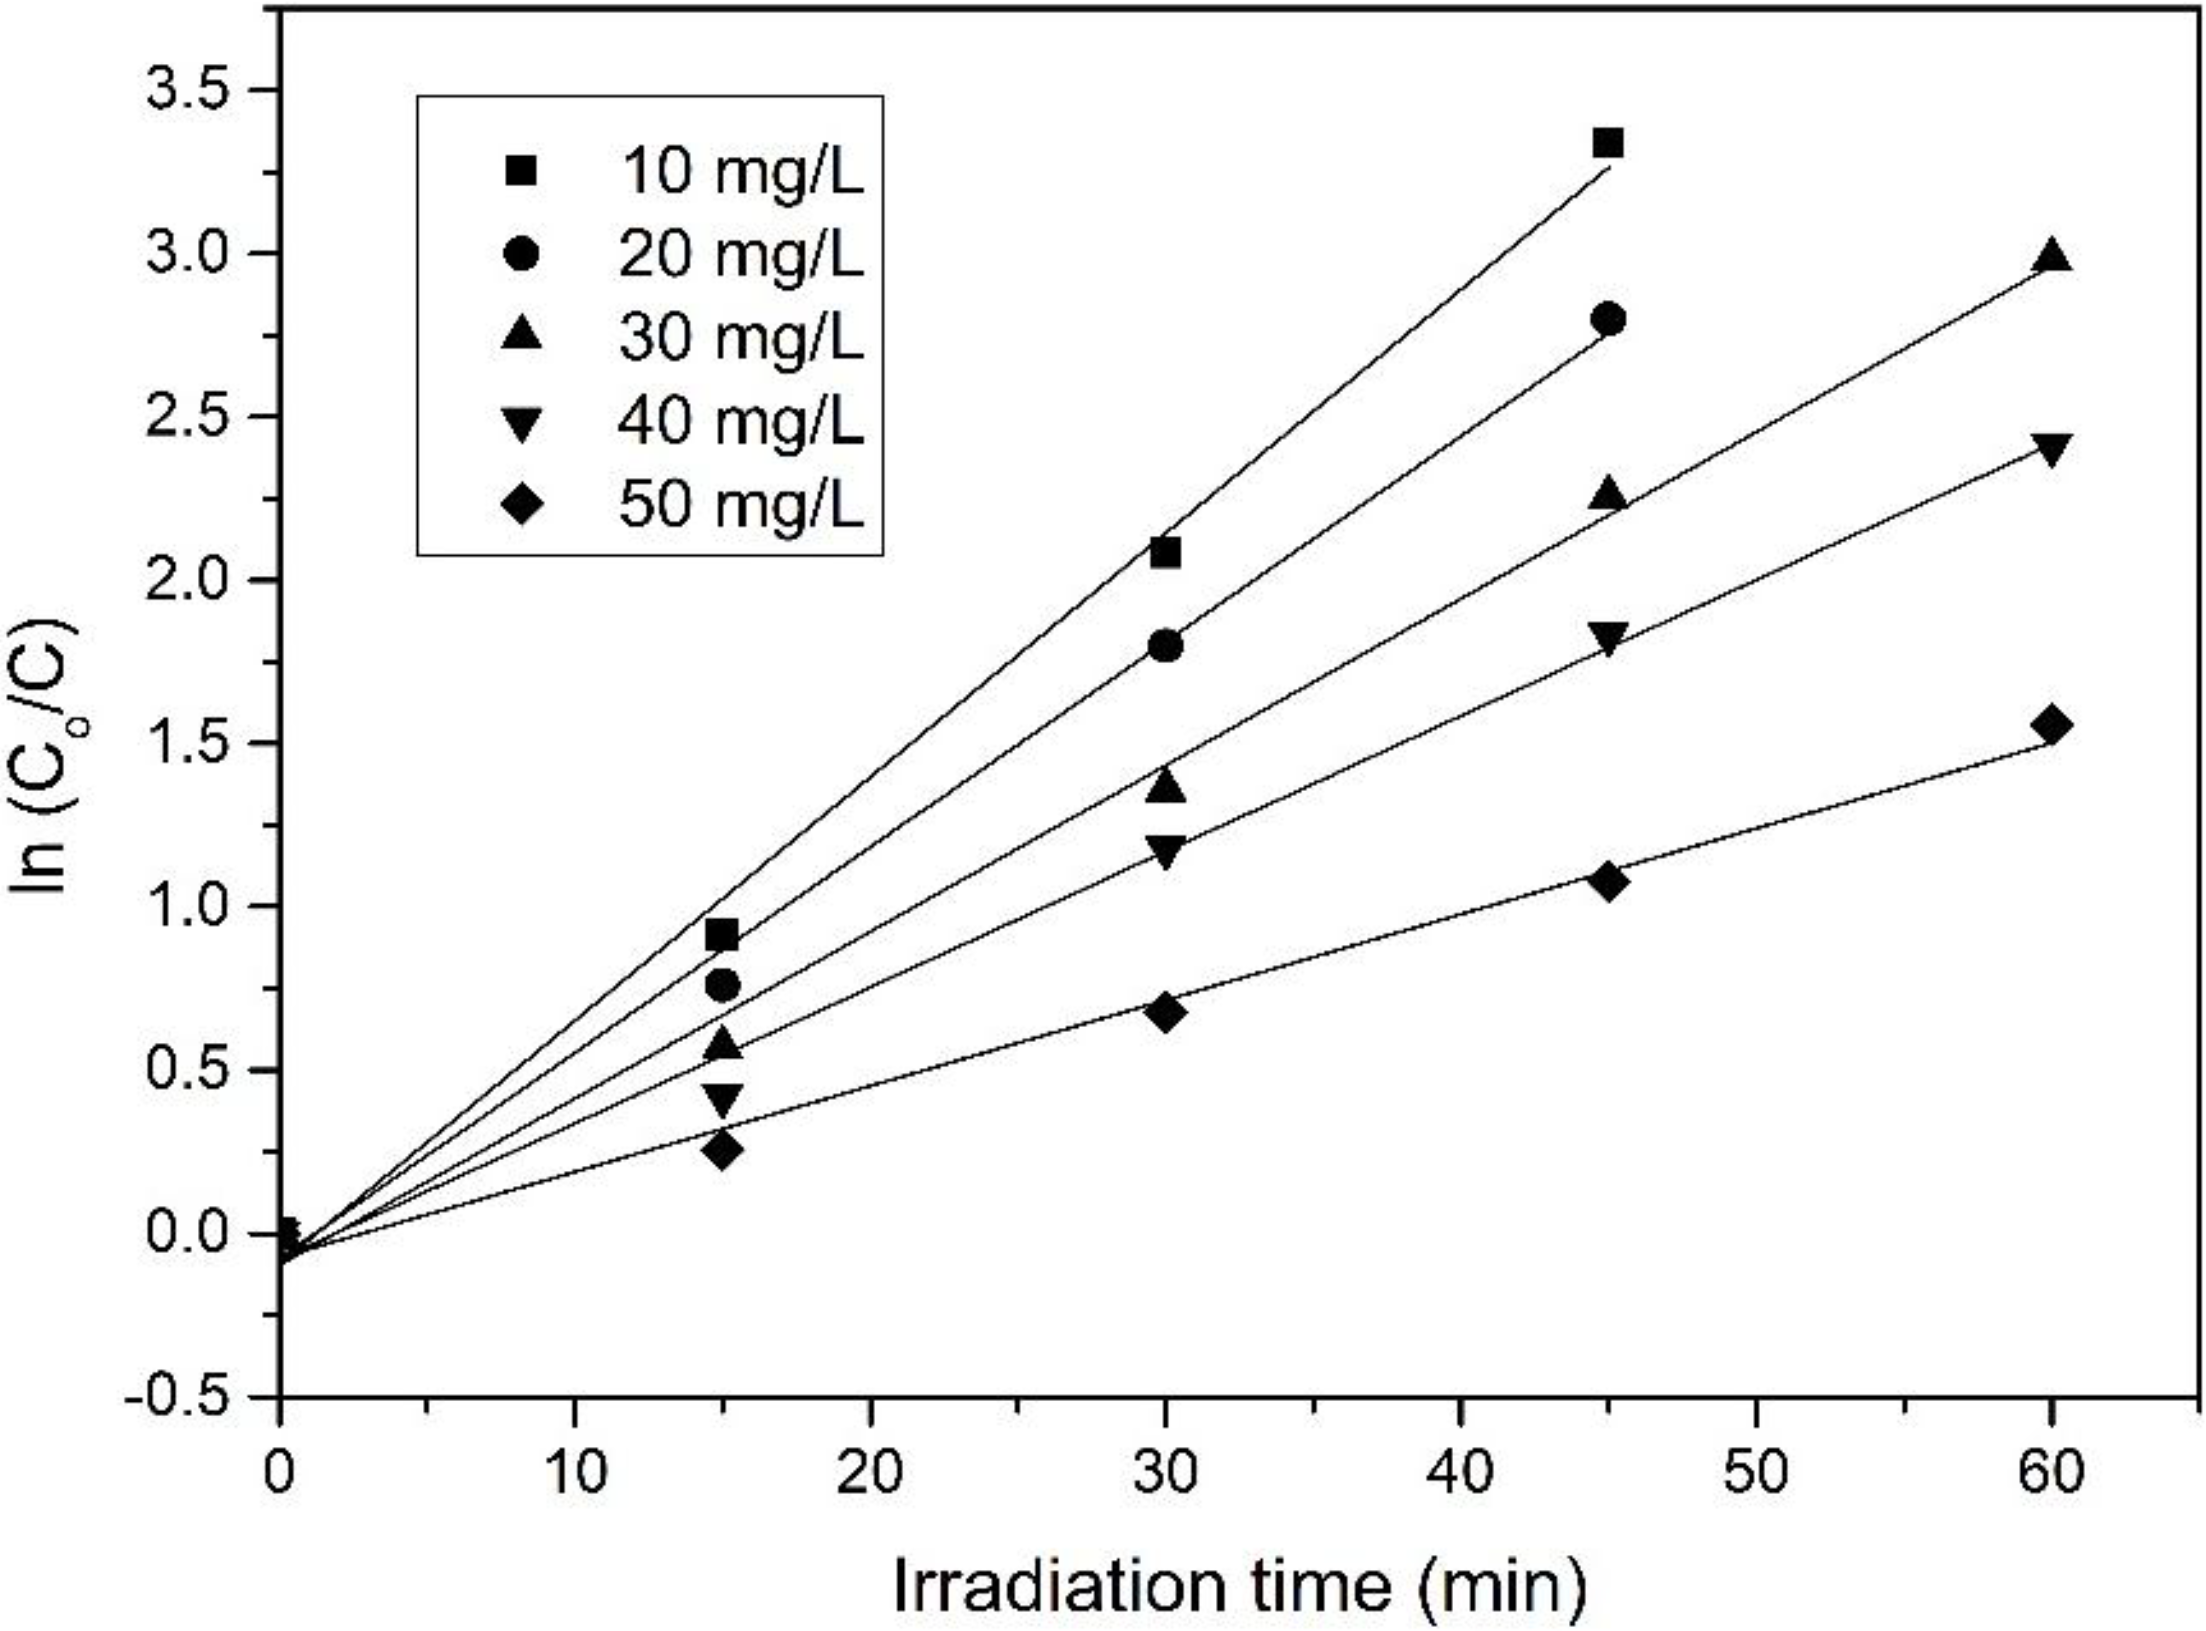
By plotting graph ln(C0/C) vs. t, the first-order rate constant (k1) can be determined from the slope of the straight line graph (Figure 8) and the values were tabulated in Table 7. A high regression coefficients (R2 > 0.99) implying that the results fitted well with the corresponding reaction kinetic. The rate of decomposition was the highest at low concentration of 4-CPA (10 mg/L) and gradually decreased at higher concentrations [53,54,55].
Table 7. First-order reaction rate, k1 of photodecompositon of 4-CPA.
Initial concentration of 4-CPA (mg/L)First-Order rate constant, k1 (×10−2 min−1)R2
107.460.9952
206.290.9957
305.100.9953
404.160.9940
502.630.9905
Figure 8. First-order rate graph of photocatalytic degradation on 4-CPA under UV illumination.
Materials 08 00339 g008
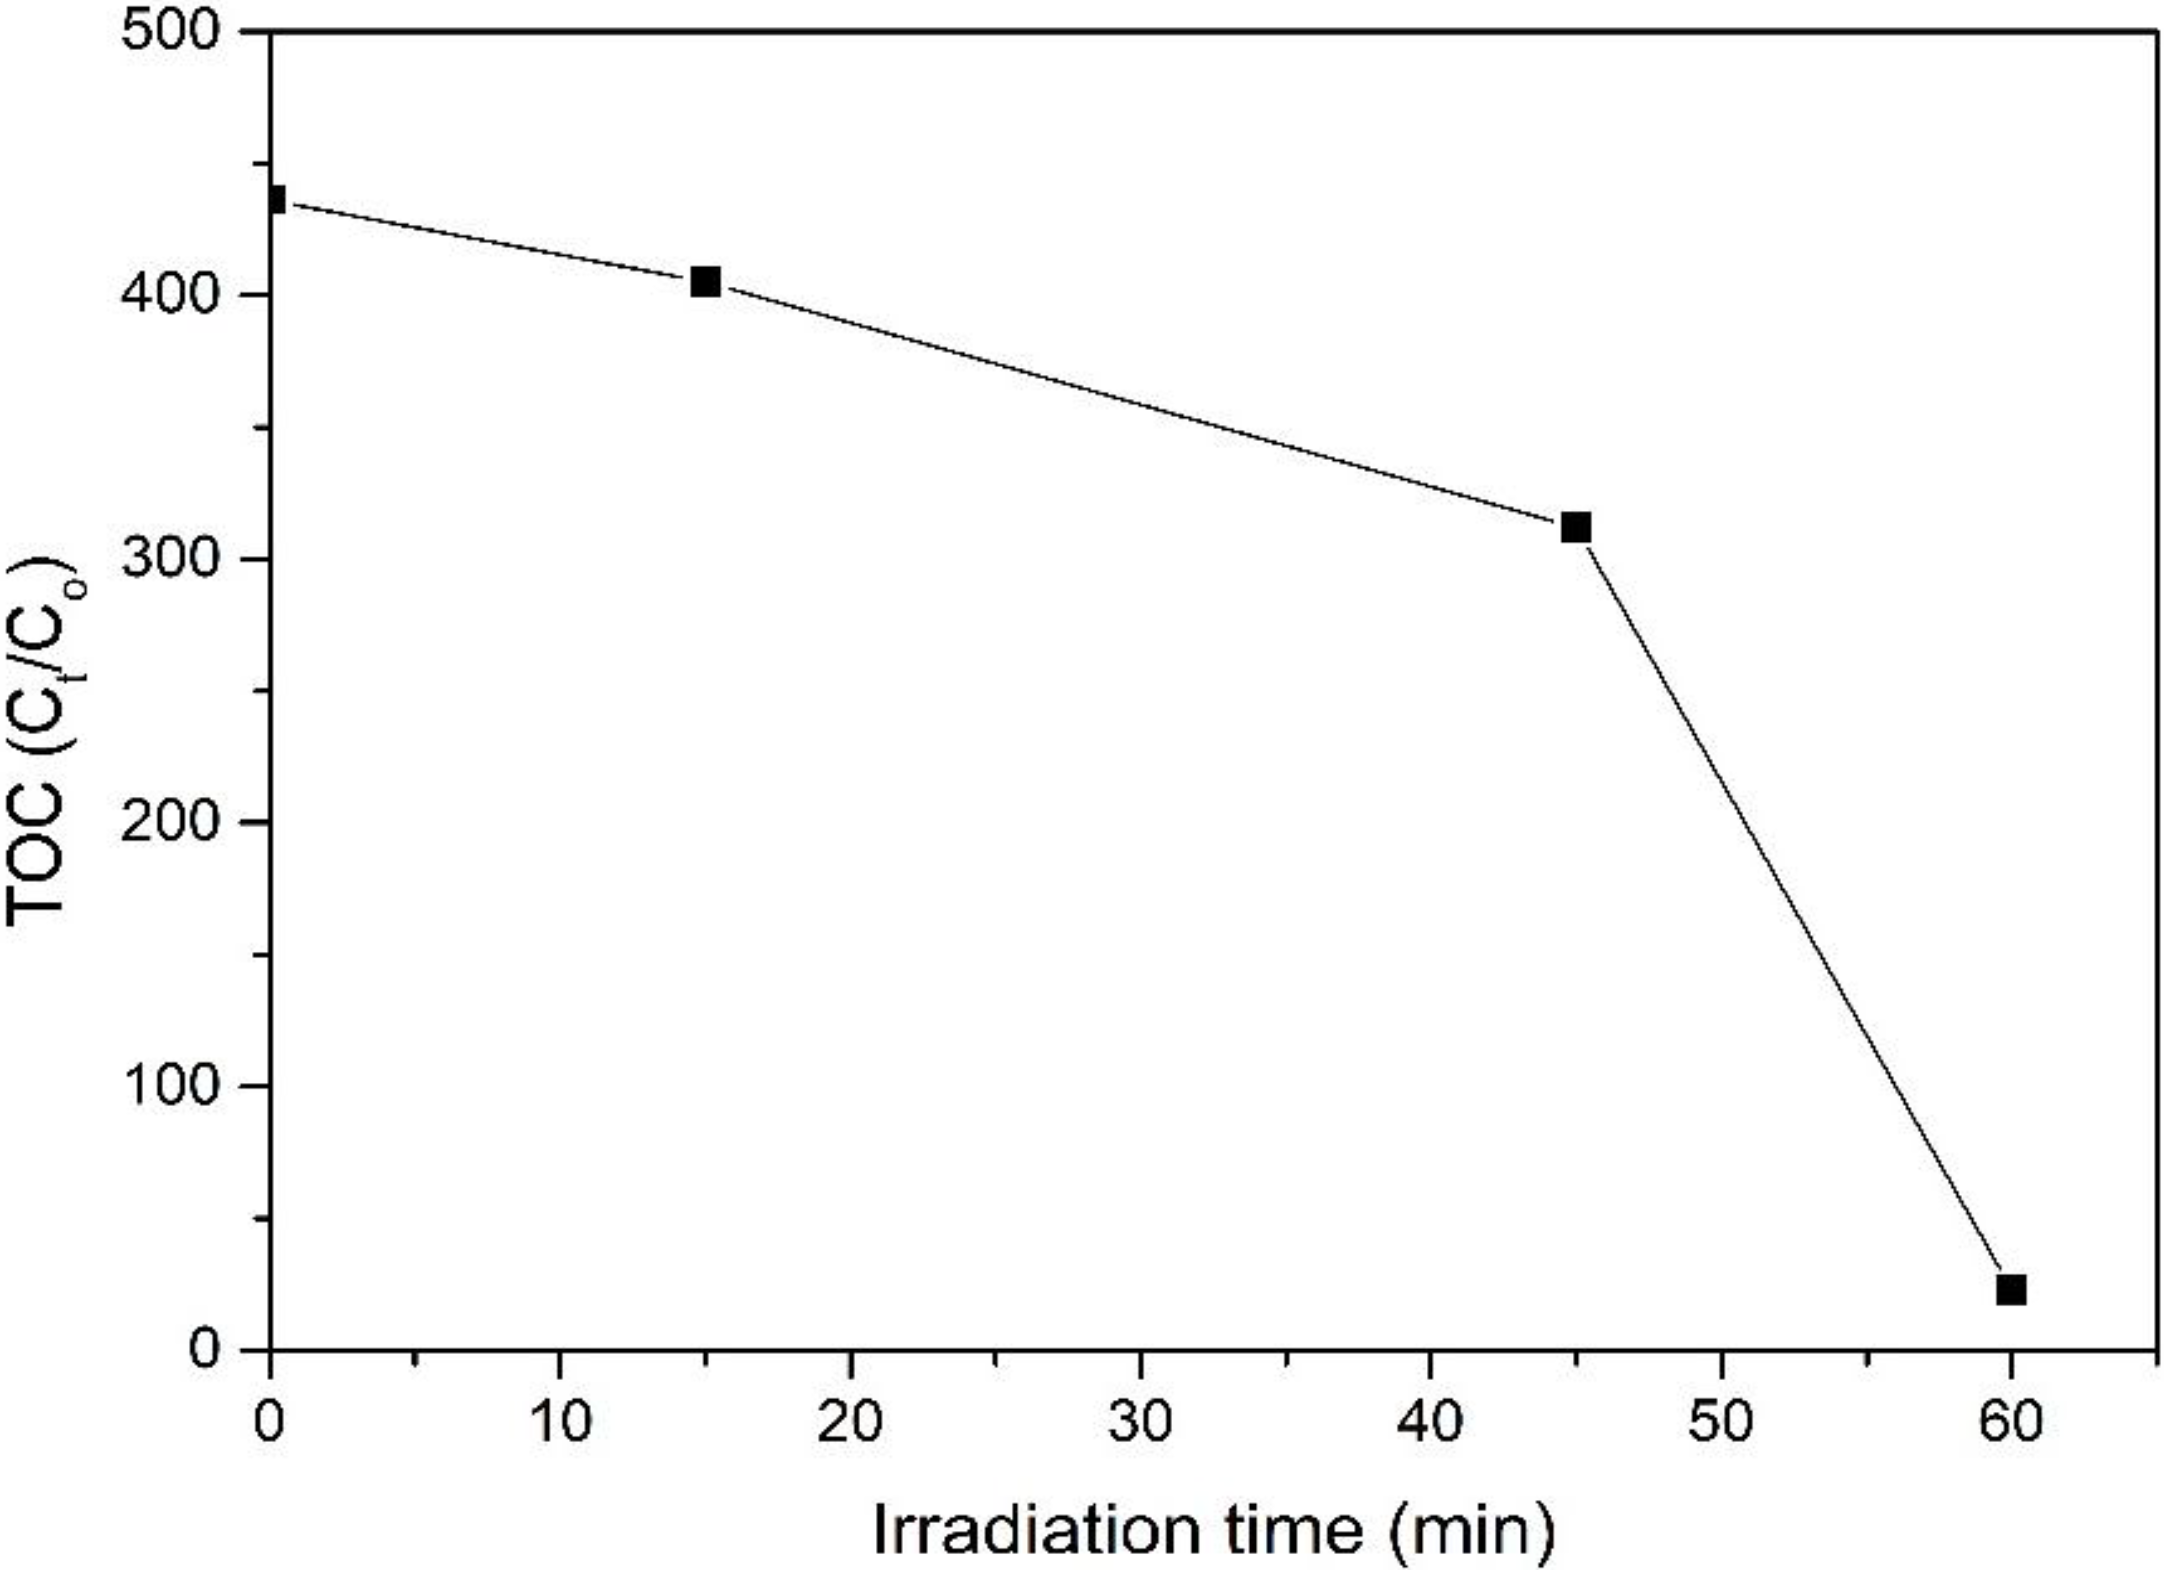
Figure 9 illustrates the relative TOC decay of 4-CPA over ZnO photocatalyst under UV irradiation. The mineralization rate increases with increasing irradiation time. It can be seen that the UV/ZnO system could mineralize 4-CPA effectively, achieved 94.7% mineralization with only 1 h, indicating most of the 4-CPA was mineralized during the photocatalytic degradation process.
Figure 9. Relative total organic carbon (TOC) decay of 4-CPA over ZnO photocatalyst.
Materials 08 00339 g009

4. Conclusions

The photocatalytic degradation of 4-CPA in aqueous medium has been examined by using ZnO under UV irradiation. A multivariate experimental design was employed to develop a quadratic model as the functional relationship between the studied factors, such as photocatalyst dosage, initial concentration of 4-CPA and pH of the solution to determine the optimum degradation percentage of 4-CPA. The removal of 4-CPA achieved 91.33% under optimal conditions (0.02 g ZnO loading, 20.00 mg/L 4CPA and at pH 7.71).

Acknowledgements

The authors would like to thank University of Malaya for funding this research work under University of Malaya Research Grant (UMRG: RP022-2012A).

Author Contributions

Kian Mun Lee carried out the experimental design and data analysis. Sharifah Bee Abd Hamid helped in drafting the manuscript. All authors read and approved the final manuscript.

Conflicts of Interest

The authors declare no conflicts of interest.

References

  1. Konstantinou, I.K.; Albanis, T.A. TiO2-assisted photocatalytic degradation of azo dyes in aqueous solution: Kinetic and mechanistic investigations: A review. Appl. Catal. B Environ. 2004, 49, 1–14. [Google Scholar] [CrossRef]
  2. Rao, A.N.; Sivasankar, B.; Sadasivam, V. Kinetic study on the photocatalytic degradation of salicylic acid using ZnO catalyst. J. Hazard. Mater. 2009, 166, 1357–1361. [Google Scholar] [CrossRef] [PubMed]
  3. Rathore, B.S.; Pathania, D. Styrene–tin (IV) phosphate nanocomposite for photocatalytic degradation of organic dye in presence of visible light. J. Alloys Compd. 2014, 606, 105–111. [Google Scholar] [CrossRef]
  4. Lopez-Alvarez, B.; Torres-Palma, R.A.; Penuela, G. Solar photocatalytical treatment of carbofuran at lab and pilot scale: Effect of classical parameters, evaluation of the toxicity and analysis of organic by-products. J. Hazard. Mater. 2011, 191, 196–203. [Google Scholar] [CrossRef] [PubMed]
  5. Wu, Y.L.; Yuan, H.X.; Jiang, X.X.; Wei, G.R.; Li, C.L.; Dong, W.B. Photocatalytic degradation of 4-tert-octylphenol in a spiral photoreactor system. J. Environ. Sci. 2012, 24, 1679–1685. [Google Scholar] [CrossRef]
  6. Jamil, T.S.; Ghaly, M.Y.; Fathy, N.A.; El-Halim, T.A.A.; Österlund, L. Enhancement of TiO2 behavior on photocatalytic oxidation of MO dye using TiO2/AC under visible irradiation and sunlight radiation. Sep. Purif. Technol. 2012, 98, 270–279. [Google Scholar] [CrossRef]
  7. Bai, X.; Zhang, X.; Hua, Z.; Ma, W.; Dai, Z.; Huang, X.; Gu, H. Uniformly distributed anatase TiO2 nanoparticles on graphene: Synthesis, characterization, and photocatalytic application. J. Alloys Compd. 2014, 599, 10–18. [Google Scholar] [CrossRef]
  8. Teh, C.M.; Mohamed, A.R. Roles of titanium dioxide and ion-doped titanium dioxide on photocatalytic degradation of organic pollutants (phenolic compounds and dyes) in aqueous solutions: A review. J. Alloys Compd. 2011, 509, 1648–1660. [Google Scholar] [CrossRef]
  9. Martínez, C.; Vilariño, S.; Fernández, M.I.; Faria, J.; Canle, M.L.; Santaballa, J.A. Mechanism of degradation of ketoprofen by heterogeneous photocatalysis in aqueous solution. Appl. Catal. B Environ. 2013, 142–143, 633–646. [Google Scholar] [CrossRef]
  10. Zsilák, Z.; Szabó-Bárdos, E.; Fónagy, O.; Horváth, O.; Horváth, K.; Hajós, P. Degradation of benzenesulfonate by heterogeneous photocatalysis combined with ozonation. Catal. Today 2014, 230, 55–60. [Google Scholar] [CrossRef]
  11. Peternel, I.T.; Koprivanac, N.; Božić, A.M.L.; Kušić, H.M. Comparative study of UV/TiO2, UV/ZnO and photo-fenton processes for the organic reactive dye degradation in aqueous solution. J. Hazard. Mater. 2007, 148, 477–484. [Google Scholar] [CrossRef] [PubMed]
  12. Hasnat, M.A.; Uddin, M.M.; Samed, A.J.F.; Alam, S.S.; Hossain, S. Adsorption and photocatalytic decolorization of a synthetic dye erythrosine on anatase TiO2 and ZnO surfaces. J. Hazard. Mater. 2007, 147, 471–477. [Google Scholar] [CrossRef] [PubMed]
  13. Anandan, S.; Ohashi, N.; Miyauchi, M. ZnO-based visible-light photocatalyst: Band-gap engineering and multi-electron reduction by co-catalyst. Appl. Catal. B Environ. 2012, 100, 502–509. [Google Scholar] [CrossRef]
  14. Bansal, P.; Sud, D. Photodegradation of commercial dye, CI Reactive Blue 160 using ZnO nanopowder: Degradation pathway and identification of intermediates by GC/MS. Sep. Purif. Technol. 2012, 85, 112–119. [Google Scholar] [CrossRef]
  15. Lam, S.M.; Sin, J.C.; Abdullah, A.Z.; Mohamed, A.R. Transition metal oxide loaded ZnO nanorods: Preparation, characterization and their UV–Vis photocatalytic activities. Sep. Purif. Technol. 2014, 132, 378–387. [Google Scholar] [CrossRef]
  16. Daneshvar, N.; Salari, D.; Khataee, A.R. Photocatalytic degradation of azo dye acid red 14 in water on ZnO as an alternative catalyst to TiO2. J. Photochem. Photobiol. A Chem. 2004, 162, 317–322. [Google Scholar] [CrossRef]
  17. Behnajady, M.A.; Modirshahla, N.; Hamzavi, R. Kinetic study on photocatalytic degradation of C.I. Acid Yellow 23 by ZnO photocatalyst. J. Hazard. Mater. 2006, 133, 226–232. [Google Scholar] [CrossRef] [PubMed]
  18. Boye, B.; Dieng, M.M.; Brillas, E. Degradation of herbicide 4-chlorophenoxyacetic acid by advanced electrochemical oxidation methods. Environ. Sci. Technol. 2002, 36, 3030–3035. [Google Scholar] [CrossRef] [PubMed]
  19. Bucheli, T.D.; Grüebler, F.C.; Müller, S.R.; Schwarzenbach, R.P. Simultaneous determination of neutral and acidic pesticides in natural waters at the low nanogram per liter level. Anal. Chem. 1997, 69, 1569–1576. [Google Scholar] [CrossRef]
  20. Lang, K.; Lunak, S. Photocatalytic degradation of 4-chlorophenoxyacetic acid in the presence of an iron complex and hydrogen peroxide. Photochem. Photobiol. Sci. 2002, 1, 588–591. [Google Scholar] [CrossRef] [PubMed]
  21. Singh, H.K.; Saquib, M.; Haque, M.M.; Muneer, M. Heterogeneous photocatalyzedcatalyzed degradation of 4-chlorophenoxyacetic acid in aqueous suspensions. J. Hazard. Mater. 2007, 142, 374–380. [Google Scholar] [CrossRef] [PubMed]
  22. Bas, D.; Boyaci, I.H. Modeling and optimization I: Usability of response surface methodology. J. Food Eng. 2007, 78, 836–845. [Google Scholar] [CrossRef]
  23. An, T.; An, J.; Yang, H.; Li, G.; Feng, H.; Nie, X. Photocatalytic degradation kinetics and mechanism of antivirus drug-lamivudine in TiO2 dispersion. J. Hazard. Mater. 2011, 197, 229–236. [Google Scholar] [CrossRef] [PubMed]
  24. Bezerra, M.A.; Santelli, R.E.; Oliveira, E.P.; Villar, L.S.; Escaleira, L.A. Response surface methodology (RSM) as a tool for optimization in analytical chemistry. Talanta 2008, 76, 965–977. [Google Scholar] [CrossRef] [PubMed]
  25. Myers, R.H.; Montgomery, D.C. Response Surface Methodology, Process and Product Optimization Using Designed Experiments, 2nd ed.; John Wiley and Sons: New York, NY, USA, 2002. [Google Scholar]
  26. Yücel, E.; Güler, N.; Yücel, Y. Optimization of deposition conditions of CdS thin films using response surface methodology. J. Alloys Compd. 2014, 589, 207–212. [Google Scholar] [CrossRef]
  27. Sakkas, V.A.; Islam, M.A.; Stalikas, C.; Albanis, T.A. Photocatalytic degradation using design of experiments: A review and example of the Congo red degradation. J. Hazard. Mater. 2010, 175, 33–44. [Google Scholar] [CrossRef] [PubMed]
  28. Zhang, J.; Fu, D.; Xu, Y.; Liu, C. Optimization of parameters on photocatalytic degradation of chloramphenicol using TiO2 as photocatalyst by response surface methodology. J. Environ. Sci. 2010, 22, 1281–1289. [Google Scholar] [CrossRef]
  29. Babaei, A.A.; Mesdaghiniai, A.R.; Haghighi, N.J.; Nabizadeh, R.; Mahvi, A.H. Modeling of nonylphenol degradation by photo-nanocatalytic process via multivariate approach. J. Hazard. Mater. 2011, 185, 1273–1279. [Google Scholar] [CrossRef] [PubMed]
  30. Cho, I.H.; Zoh, K.D. Photocatalytic degradation of azo dye (Reactive Red 120) in TiO2/UV system: Optimization and modeling using a response surface methodology (RSM) based on the central composite design. Dyes Pigment. 2007, 75, 533–543. [Google Scholar] [CrossRef]
  31. Fathinia, M.; Khataee, A.R.; Zarei, M.; Aber, S. Comparative photocatalytic degradation of two dyes on immobilized TiO2 nanoparticles: Effect of dye molecular structure and response surface approach. J. Mol. Catal. A Chem. 2010, 333, 73–84. [Google Scholar] [CrossRef]
  32. Abdullah, A.H.; Moey, H.J.M.; Yusof, N.Z. Response surface methodology analysis of the photocatalytic removal of Methylene Blue using bismuth vanadate prepared via polyol route. J. Environ. Sci. 2012, 24, 1694–1701. [Google Scholar] [CrossRef]
  33. Yang, H.; Zhou, S.; Liu, H.; Yan, W.; Yang, L.; Yi, B. Photocatalytic degradation of carbofuran in TiO2 aqueous solution: Kinetics using design of experiments and mechanism by HPLC/MS/MS. J. Environ. Sci. 2013, 25, 1680–1686. [Google Scholar] [CrossRef]
  34. Lopez-Munoz, M.J.; Revilla, A.; Aguado, J. Heterogeneous photocatalytic degradation of isoproturon in aqueous solution: Experimental design and intermediate products analysis. Catal. Today 2013, 209, 99–107. [Google Scholar] [CrossRef]
  35. Körbahti, B.K.; Tanyolaç, A. Electrochemical treatment of simulated textile wastewater with industrial components and Levafix Blue CA reactive dye: Optimization through response surface methodology. J. Hazard. Mater. 2008, 151, 422–431. [Google Scholar] [CrossRef] [PubMed]
  36. Zarei, M.; Niaei, A.; Salari, D.; Khataee, A. Application of response surface methodology for optimization of peroxi-coagulation of textile dye solution using carbon nanotube-PTFE cathode. J. Hazard. Mater. 2010, 173, 544–551. [Google Scholar] [CrossRef] [PubMed]
  37. Amini, M.; Younesi, H.; Bahramifar, N.; Lorestani, A.A.Z.; Ghorbani, F.; Daneshi, A.; Sharifzadeh, M. Application of response surface methodology for optimization of lead biosorption in an aqueous solution by Aspergillus niger. J. Hazard. Mater. 2008, 154, 694–702. [Google Scholar] [CrossRef] [PubMed]
  38. Ray, S.; Lalman, J.A.; Biswas, N. Using the Box-Benkhen technique to statistically model phenol photocatalytic degradation by titanium dioxide nanoparticles. Chem. Eng. J. 2009, 150, 15–24. [Google Scholar] [CrossRef]
  39. Chatterjee, S.; Kumar, A.; Basu, S.; Dutta, S. Application of response surface methodology for methylene blue dye removal from aqueous solution using low cost adsorbent. Chem. Eng. J. 2012, 181–182, 289–299. [Google Scholar] [CrossRef]
  40. Noordin, M.Y.; Venkatesh, V.C.; Sharif, S.; Elting, S.; Abdullah, A. Application of response surface methodology in describing the performance of coated carbide tools when turning AISI 1045 steel. J. Mater. Process. Technol. 2004, 145, 46–58. [Google Scholar] [CrossRef] [Green Version]
  41. Soltani, R.D.C.; Rezaee, A.; Godini, H.; Khataee, A.R.; Hasanbeiki, A. Photoelectrochemical treatment of ammonium using seawater as a natural supporting electrolyte. Chem. Ecol. 2013, 29, 72–85. [Google Scholar] [CrossRef]
  42. Körbahti, B.K.; Rauf, M.A. Determination of optimum operating conditions of carmine decoloration by UV/H2O2 using response surface methodology. J. Hazard. Mater. 2009, 161, 281–286. [Google Scholar] [CrossRef] [PubMed]
  43. Liu, W.; Chen, S.; Zhao, W.; Zhang, S. Titanium dioxide mediated photocatalytic degradation of methamidophos in aqueous phase. J. Hazard. Mater. 2009, 164, 154–160. [Google Scholar] [CrossRef] [PubMed]
  44. Pardeshi, S.K.; Patil, A.B. Solar photocatalytic degradation of resorcinol a model endocrine disrupter in water using zinc oxide. J. Hazard. Mater. 2009, 163, 403–409. [Google Scholar] [CrossRef] [PubMed]
  45. Lu, C.; Wu, Y.; Mai, F.; Chung, W.; Wu, C.; Lin, W.; Chen, C. Degradation efficiencies and mechanisms of the ZnO-mediated photocatalytic degradation of Basic Blue 11 under visible light irradiation. J. Mol. Catal. A Chem. 2009, 310, 159–165. [Google Scholar] [CrossRef]
  46. Hayat, K.; Gondal, M.A.; Khaled, M.M.; Ahmed, S.; Shemsi, A.M. Nano ZnO synthesis by modified sol gel method and its application in heterogeneous photocatalytic removal of phenol from water. Appl. Catal. A Gen. 2011, 393, 122–129. [Google Scholar] [CrossRef]
  47. Daneshvar, N.; Aber, S.; Dorraji, M.S.S.; Khataee, A.R.; Rasoulifard, M.H. Photocatalytic degradation of the insecticide diazinon in the presence of prepared nanocrystalline ZnO powders under irradiation of UV-C light. Sep. Purif. Technol. 2007, 58, 91–98. [Google Scholar] [CrossRef]
  48. Kansal, S.K.; Singh, M.; Sud, D. Studies on TiO2/ZnO photocatalyzedcatalyzed degradation of lignin. J. Hazard. Mater. 2008, 153, 412–417. [Google Scholar] [CrossRef] [PubMed]
  49. Khataee, A.R.; Zarei, M. Photocatalysis of a dye solution using immobilized ZnO nanoparticles combined with photoelectrochemical process. Desalination 2011, 273, 453–460. [Google Scholar] [CrossRef]
  50. Gaya, U.I.; Abdullah, A.H.; Zainal, Z.; Hussein, M.Z. Photocatalytic treatment of 4-chlorophenol in aqueous ZnO suspensions: Intermediates, influence of dosage and inorganic anions. J. Hazard. Mater. 2009, 168, 57–63. [Google Scholar] [CrossRef] [PubMed]
  51. Kumar, K.V.; Porkodi, K.; Rocha, F. Langmuir-Hinshelwood kinetics—A theoretical study. Catal. Commun. 2008, 9, 82–84. [Google Scholar] [CrossRef]
  52. Herrmann, J.M. Heterogeneous photocatalysis: Fundamentals and applications to the removal of various types of aqueous pollutants. Catal. Today 1999, 53, 115–129. [Google Scholar] [CrossRef]
  53. Kansal, S.K.; Ali, A.H.; Kapoor, S. Photocatalytic decolorization of biebrich scarlet dye in aqueous phase using different nanophotocataltsys. Desalination 2010, 259, 147–155. [Google Scholar] [CrossRef]
  54. Shafaei, A.; Nikazar, M.; Arami, M. Photocatalytic degradation of terephthalic acid using titania and zinc oxide photocatalysts: Comparative study. Desalination 2010, 252, 8–16. [Google Scholar] [CrossRef]
  55. Elmolla, E.S.; Chaudhuri, M. Degradation of amoxicillin, ampicillin and cloxacillin antibiotics in aqueous solution by the UV/ZnO photocatalytic process. J. Hazard. Mater. 2010, 173, 445–449. [Google Scholar] [CrossRef] [PubMed]

