3.1. Preliminary Experiments
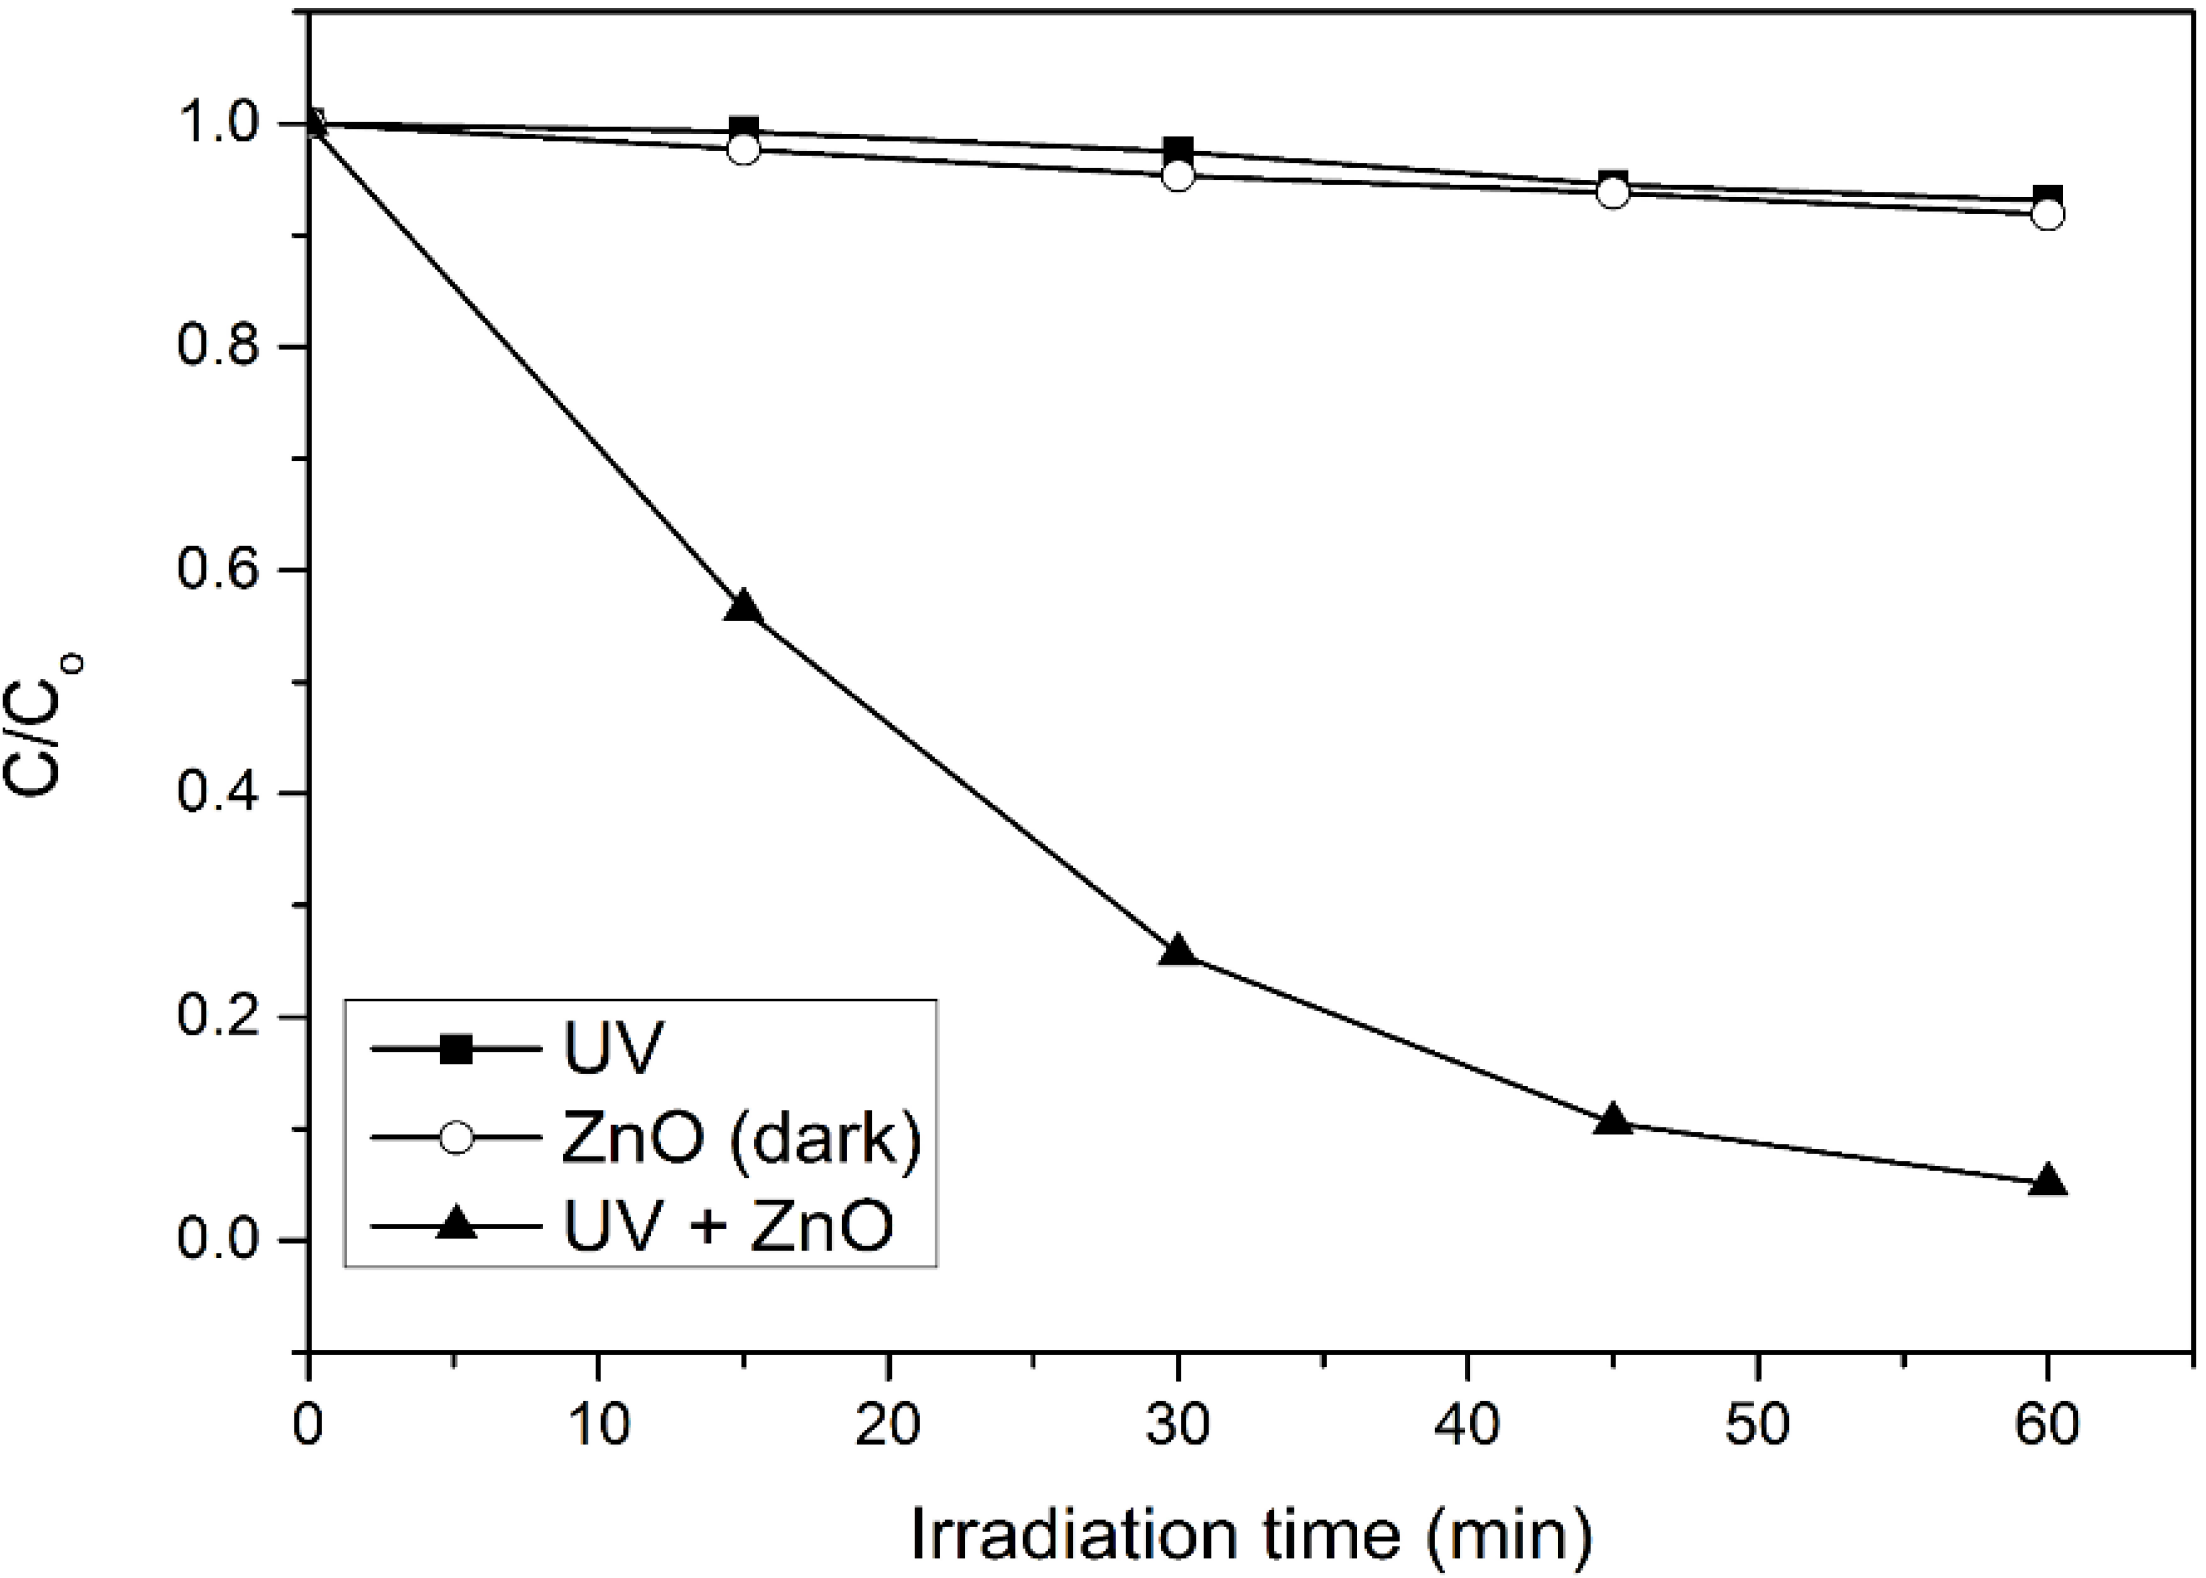
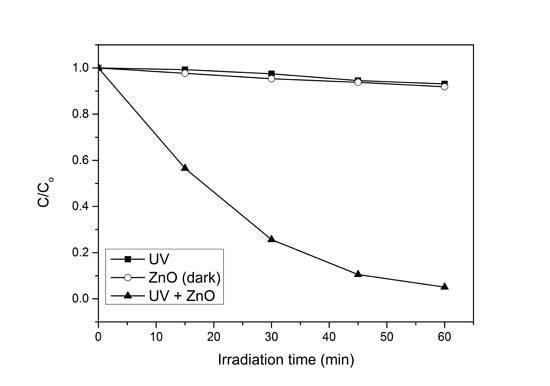
In order to evaluate the significant role of photocatalysis in the photodegradation process, photolysis and catalyst adsorption in dark condition were carried out. As shown in
Figure 1, only 7% of 4-CPA was photolyzed by UV irradiation. The absorption of 4-CPA by ZnO photocatalyst was insignificant (8.2%). However, 94.9% of 4-CPA was degraded in the presence of ZnO under UV irradiation for an hour. This indicated the synergistic effect between ZnO photocatalyst and UV light for the photocatalytic degradation to work efficiently.
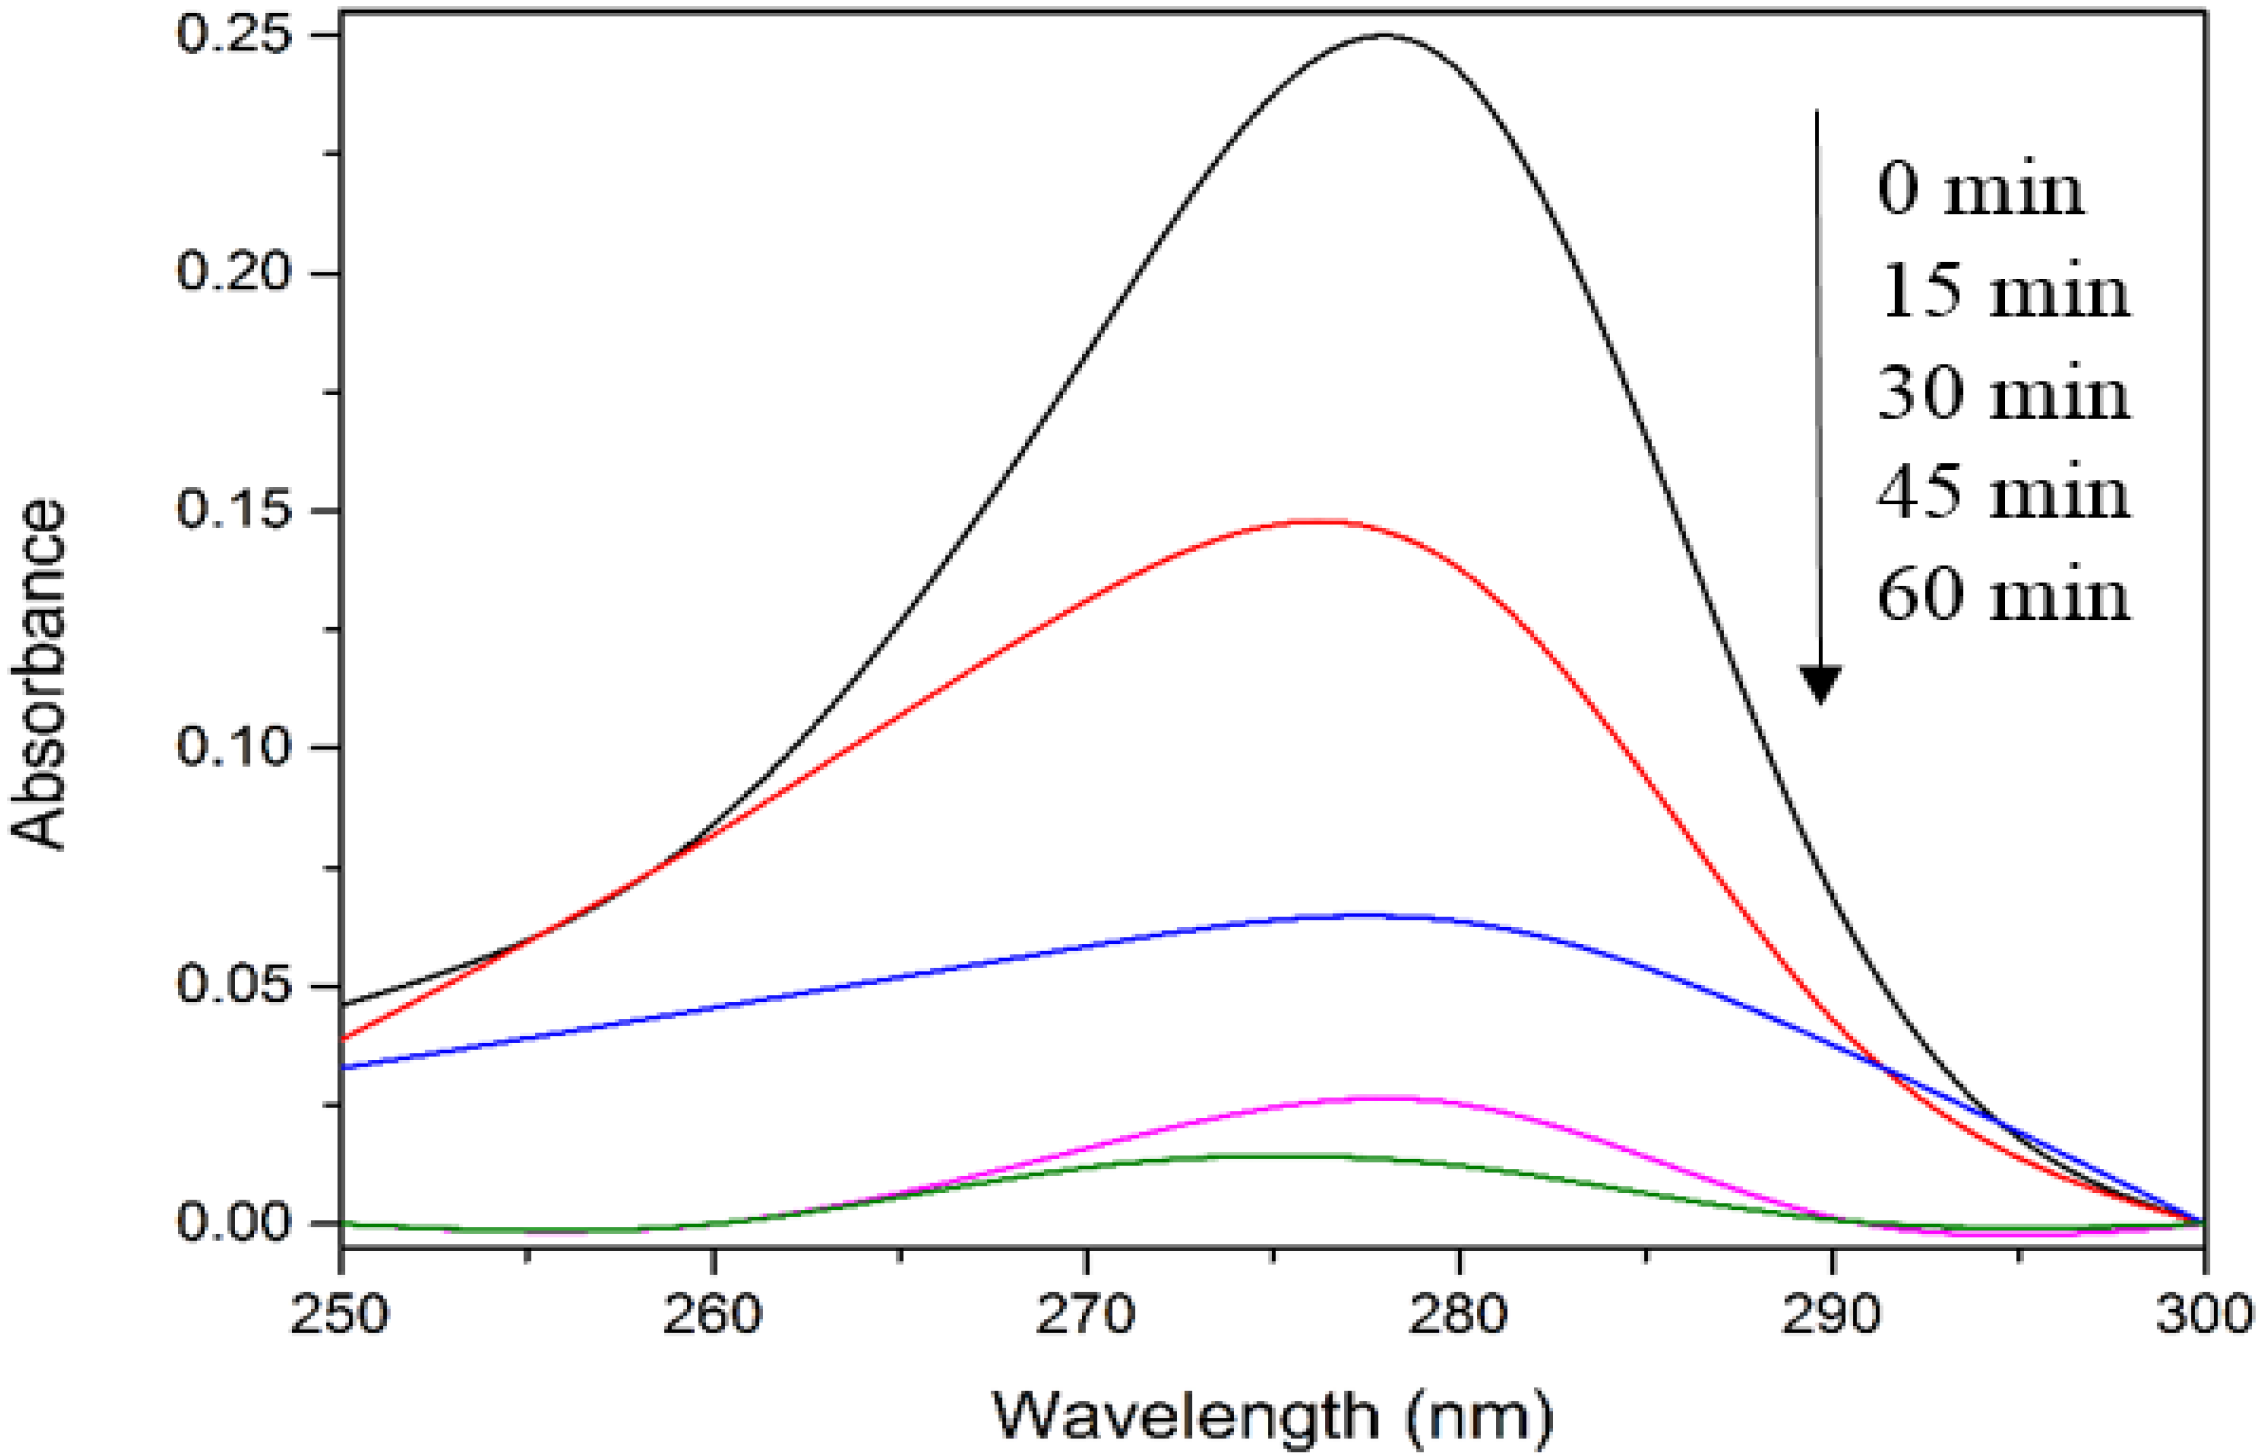
Figure 2 depicts the UV-vis spectra of 4-CPA during photocatalysis process. As evident from
Figure 2, no obvious peak shift was observed.
Figure 1.
Photocatalytic degradation of 4-CPA under various conditions. Conditions: ZnO loading = 0.03 g; [4-CPA] = 30 mg/L; pH = 7.
Figure 1.
Photocatalytic degradation of 4-CPA under various conditions. Conditions: ZnO loading = 0.03 g; [4-CPA] = 30 mg/L; pH = 7.
Figure 2.
UV-vis spectra of 4-CPA during photocatalytic degradation process. Conditions: ZnO loading = 0.03 g; [4-CPA] = 30 mg/L; pH = 7.
Figure 2.
UV-vis spectra of 4-CPA during photocatalytic degradation process. Conditions: ZnO loading = 0.03 g; [4-CPA] = 30 mg/L; pH = 7.
3.2. Model Fitting and Statistically Analysis
In order to optimize the reaction conditions of 4-CPA degradation, CCD with a total number of 20 experiments was applied for the response surface modeling (
Table 2). The experimental and predicted responses are shown as well. The software suggested quadratic model as shown in
Table 3.
Table 4 shows the ANOVA for response surface of quadratic model. The lack of fit indicates the variation of data around the fitted model and it will shows significant if the data does not fit well with the model [
25]. The ANOVA implies that the model is significant with the
F value of 301.23. There is only a 0.01% chance that a “Model
F-Value” could occur due to noise. Moreover, the
p value (<0.0001) is less than 0.05, which indicates the model terms are highly significant. It should be noted that values greater than 0.1000 indicate the model terms are not significant [
35,
36].
Table 3.
Sequential model fitting for 4-CPA removal.
Table 3.
Sequential model fitting for 4-CPA removal.
| Source | Sum of squares | Degree of freedom | Mean square | F Value | p Value | Remark |
|---|
| Mean | 1.487 × 10⁵ | 1 | 1.487 × 10⁵ | – | – | – |
| Linear | 2011.02 | 3 | 670.34 | 9.85 | 0.0006 | – |
| 2 FI | 14.60 | 3 | 4.87 | 0.059 | 0.9805 | – |
| Quadratic | 1063.20 | 3 | 354.40 | 311.05 | <0.0001 | Suggested |
| Cubic | 1.93 | 4 | 0.48 | 0.31 | 0.8637 | Aliased |
| Residual | 9.46 | 6 | 1.58 | – | – | – |
| Total | 1.518 × 10⁵ | 20 | 7589.07 | – | – | – |
Table 4.
ANOVA for the response surface quadratic model.
Table 4.
ANOVA for the response surface quadratic model.
| Source | Sum of squares | DF | Mean square | F Value | p Value | Suggestion |
|---|
| Model | 3088.82 | 9 | 343.20 | 301.23 | <0.0001 | Significant |
| x1 | 60.49 | 1 | 60.49 | 53.09 | <0.0001 | – |
| x2 | 424.26 | 1 | 424.26 | 372.37 | <0.0001 | – |
| x3 | 1526.27 | 1 | 1526.27 | 1339.59 | <0.0001 | – |
| x1x2 | 8.93 | 1 | 8.93 | 7.83 | 0.0188 | – |
| x1x3 | 1.93 | 1 | 1.93 | 1.69 | 0.2222 | – |
| x2x3 | 3.74 | 1 | 3.74 | 3.28 | 0.1001 | – |
| x12 | 331.08 | 1 | 331.08 | 290.58 | <0.0001 | – |
| x22 | 55.73 | 1 | 55.73 | 48.91 | <0.0001 | – |
| x32 | 918.39 | 1 | 918.39 | 806.06 | <0.0001 | – |
| Residual | 11.39 | 10 | 1.14 | – | – | – |
| Lack of fit | 2.93 | 5 | 0.59 | 0.35 | 0.8658 | Not significant |
| Pure error | 8.47 | 5 | 1.69 | – | – | – |
| Std. dev. a | 1.07 | – | R2 | 0.9963 | – | – |
| Mean | 86.22 | – | Adj. R2 b | 0.9930 | – | – |
| C.V. c | 1.24 | – | Pred. R2 d | 0.9889 | – | – |
| PRESS | 34.47 | – | Adeq. precision e | 64.317 | – | – |
The lack of fit value of 0.35 confirms the lack of fit is not significant relative to the pure error when
p value is 0.8658, >0.05. The non-significant lack of fit shows good predictability of the model. The coefficient of variation (C.V. = 1.24) is low, indicated high precision and good reliability of the experimental values [
37]. In addition, the “Pred.
R2” of 0.9889 is in reasonable agreement with the “Adj.
R2” of 0.9930 (within 0.2), which also implies good predictability of the model [
38,
39]. Adequate precision compares the range of predicted values at the design points to the average prediction error [
40,
41]. The adequate precision of 64.317 in this study, which is well above 4 indicates adequate model discrimination.
From the experimental results (
Table 5), an empirical second-order polynomial equation was established and was written in terms of coded factors as follows:
where
y is the percentage degradation of 4-CPA (%),
x1,
x2 and
x3 are terms for the coded values of ZnO loading, initial concentration of 4-CPA and pH, respectively.
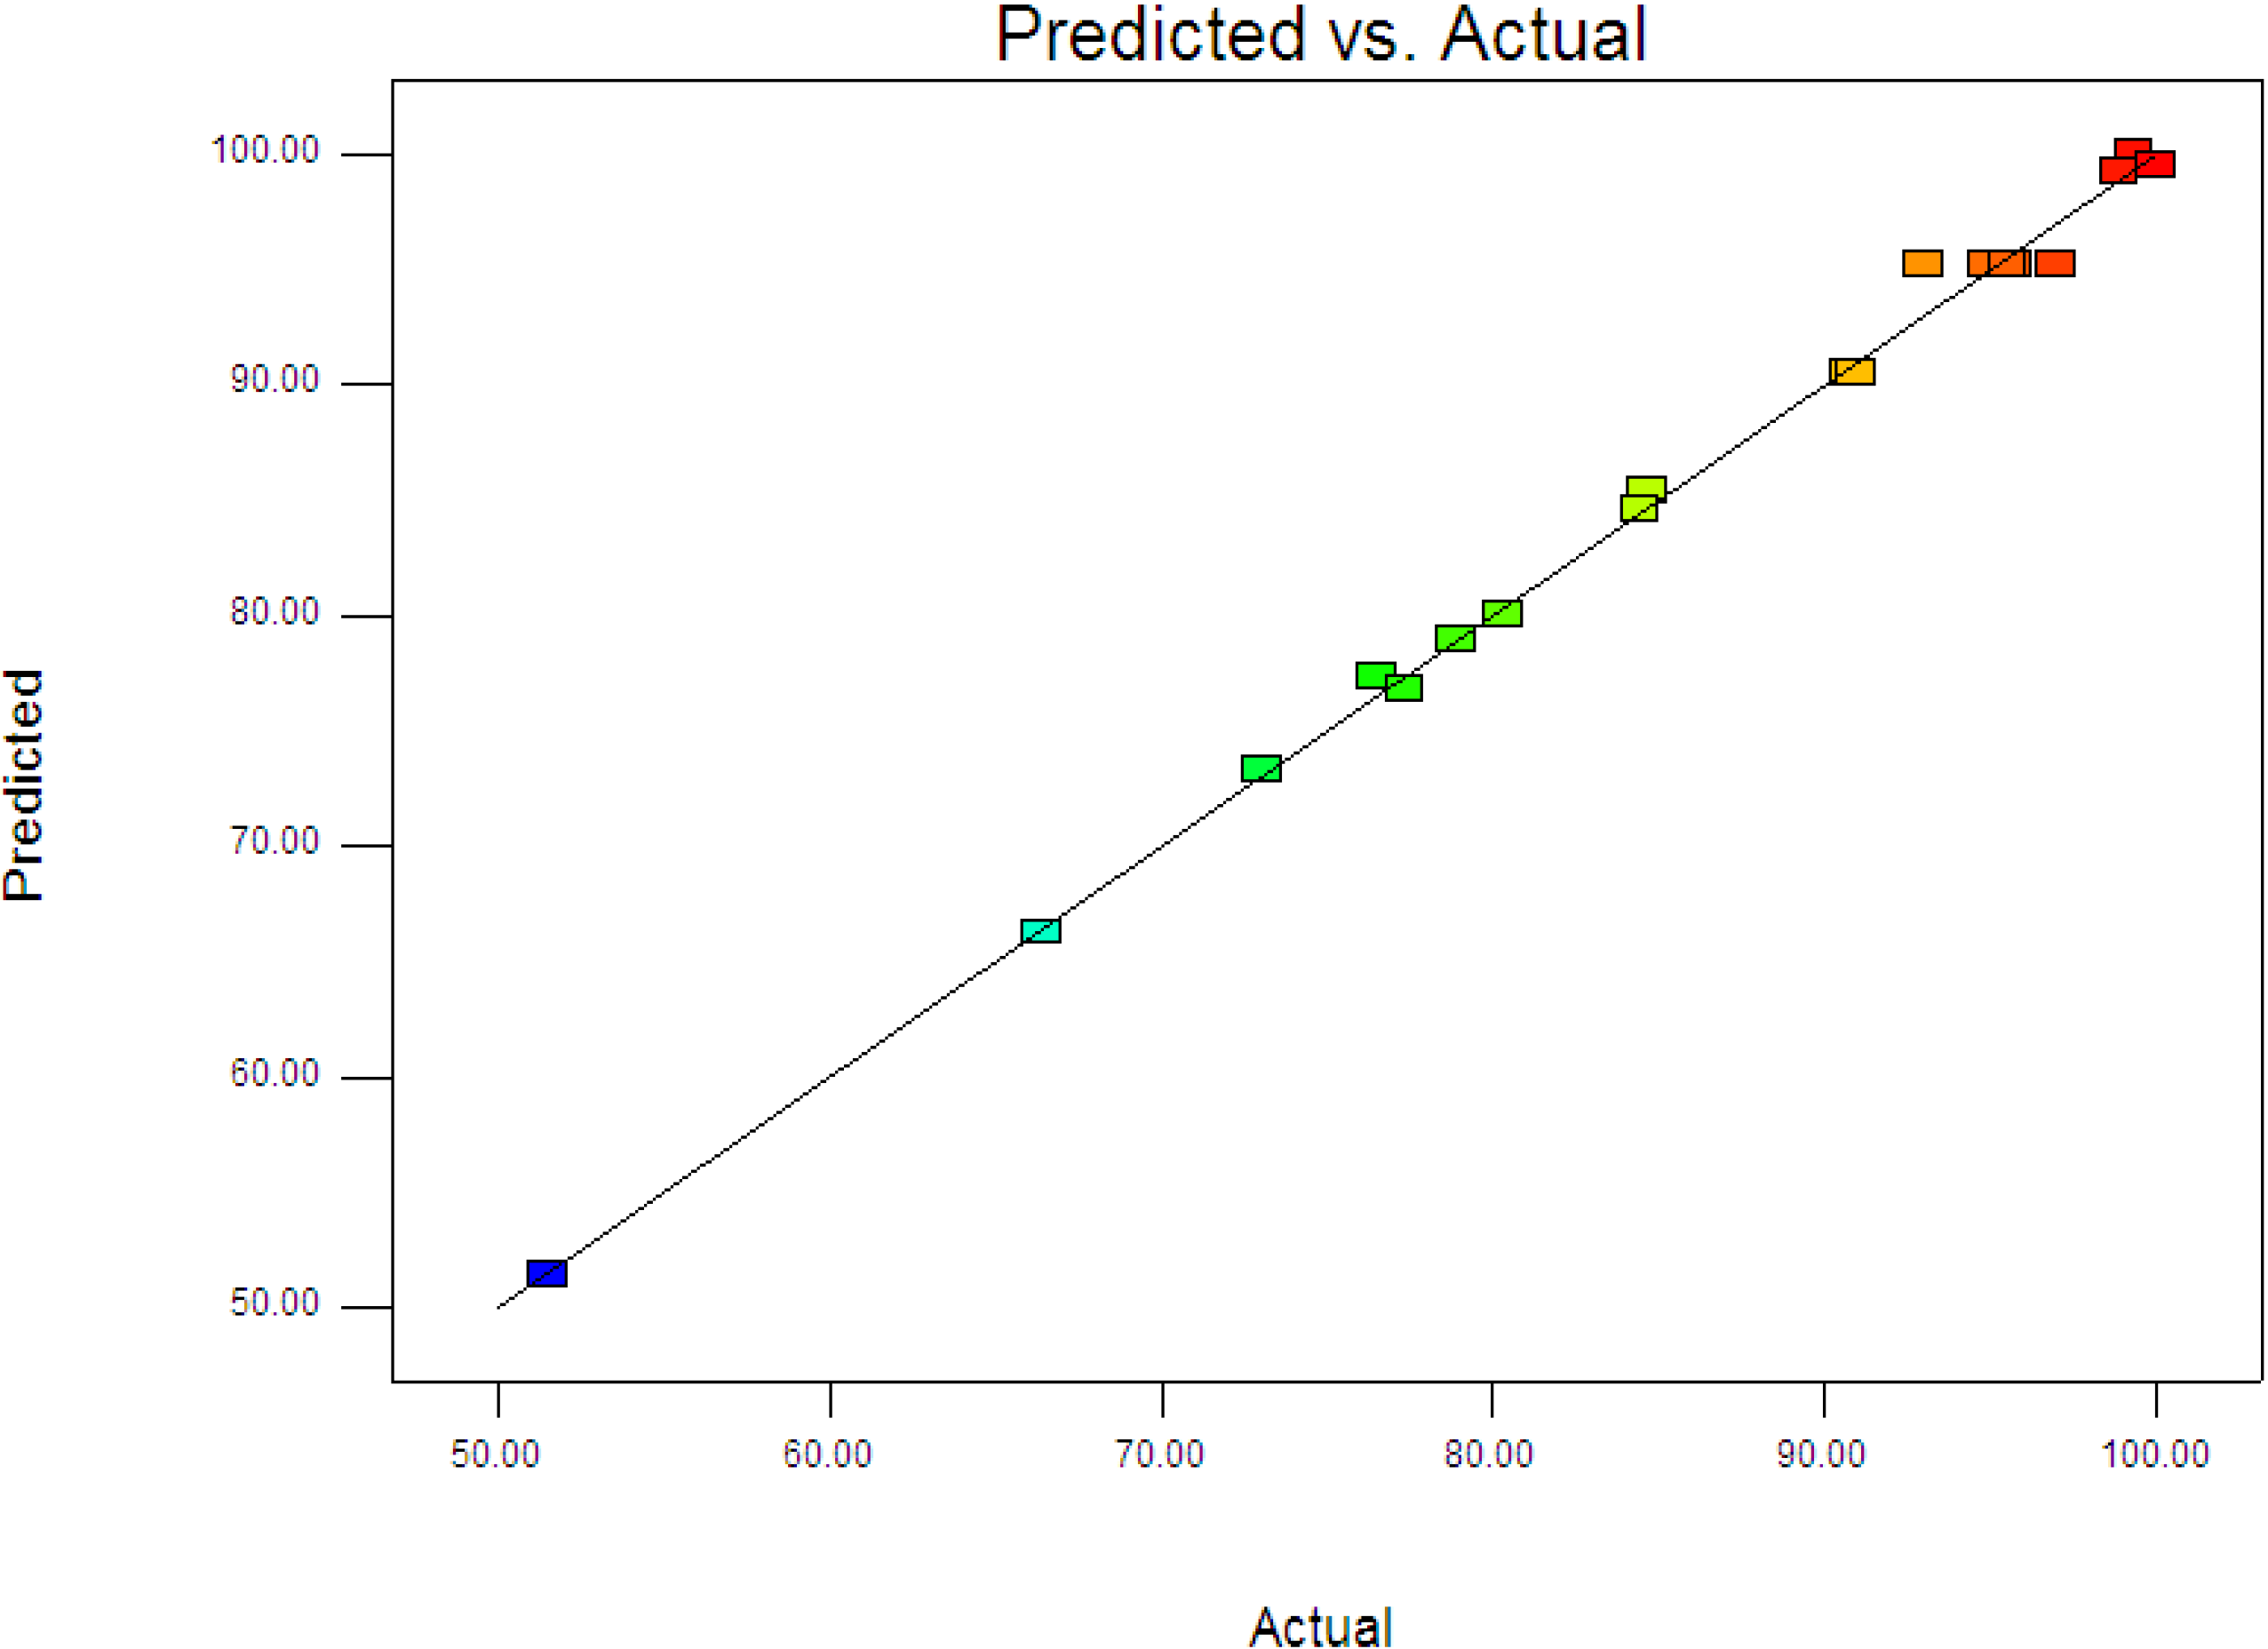
Figure 3 displays the experimental and predictive values for 4-CPA degradation. It can be seen that the high correlation between the experimental data and predicted values (
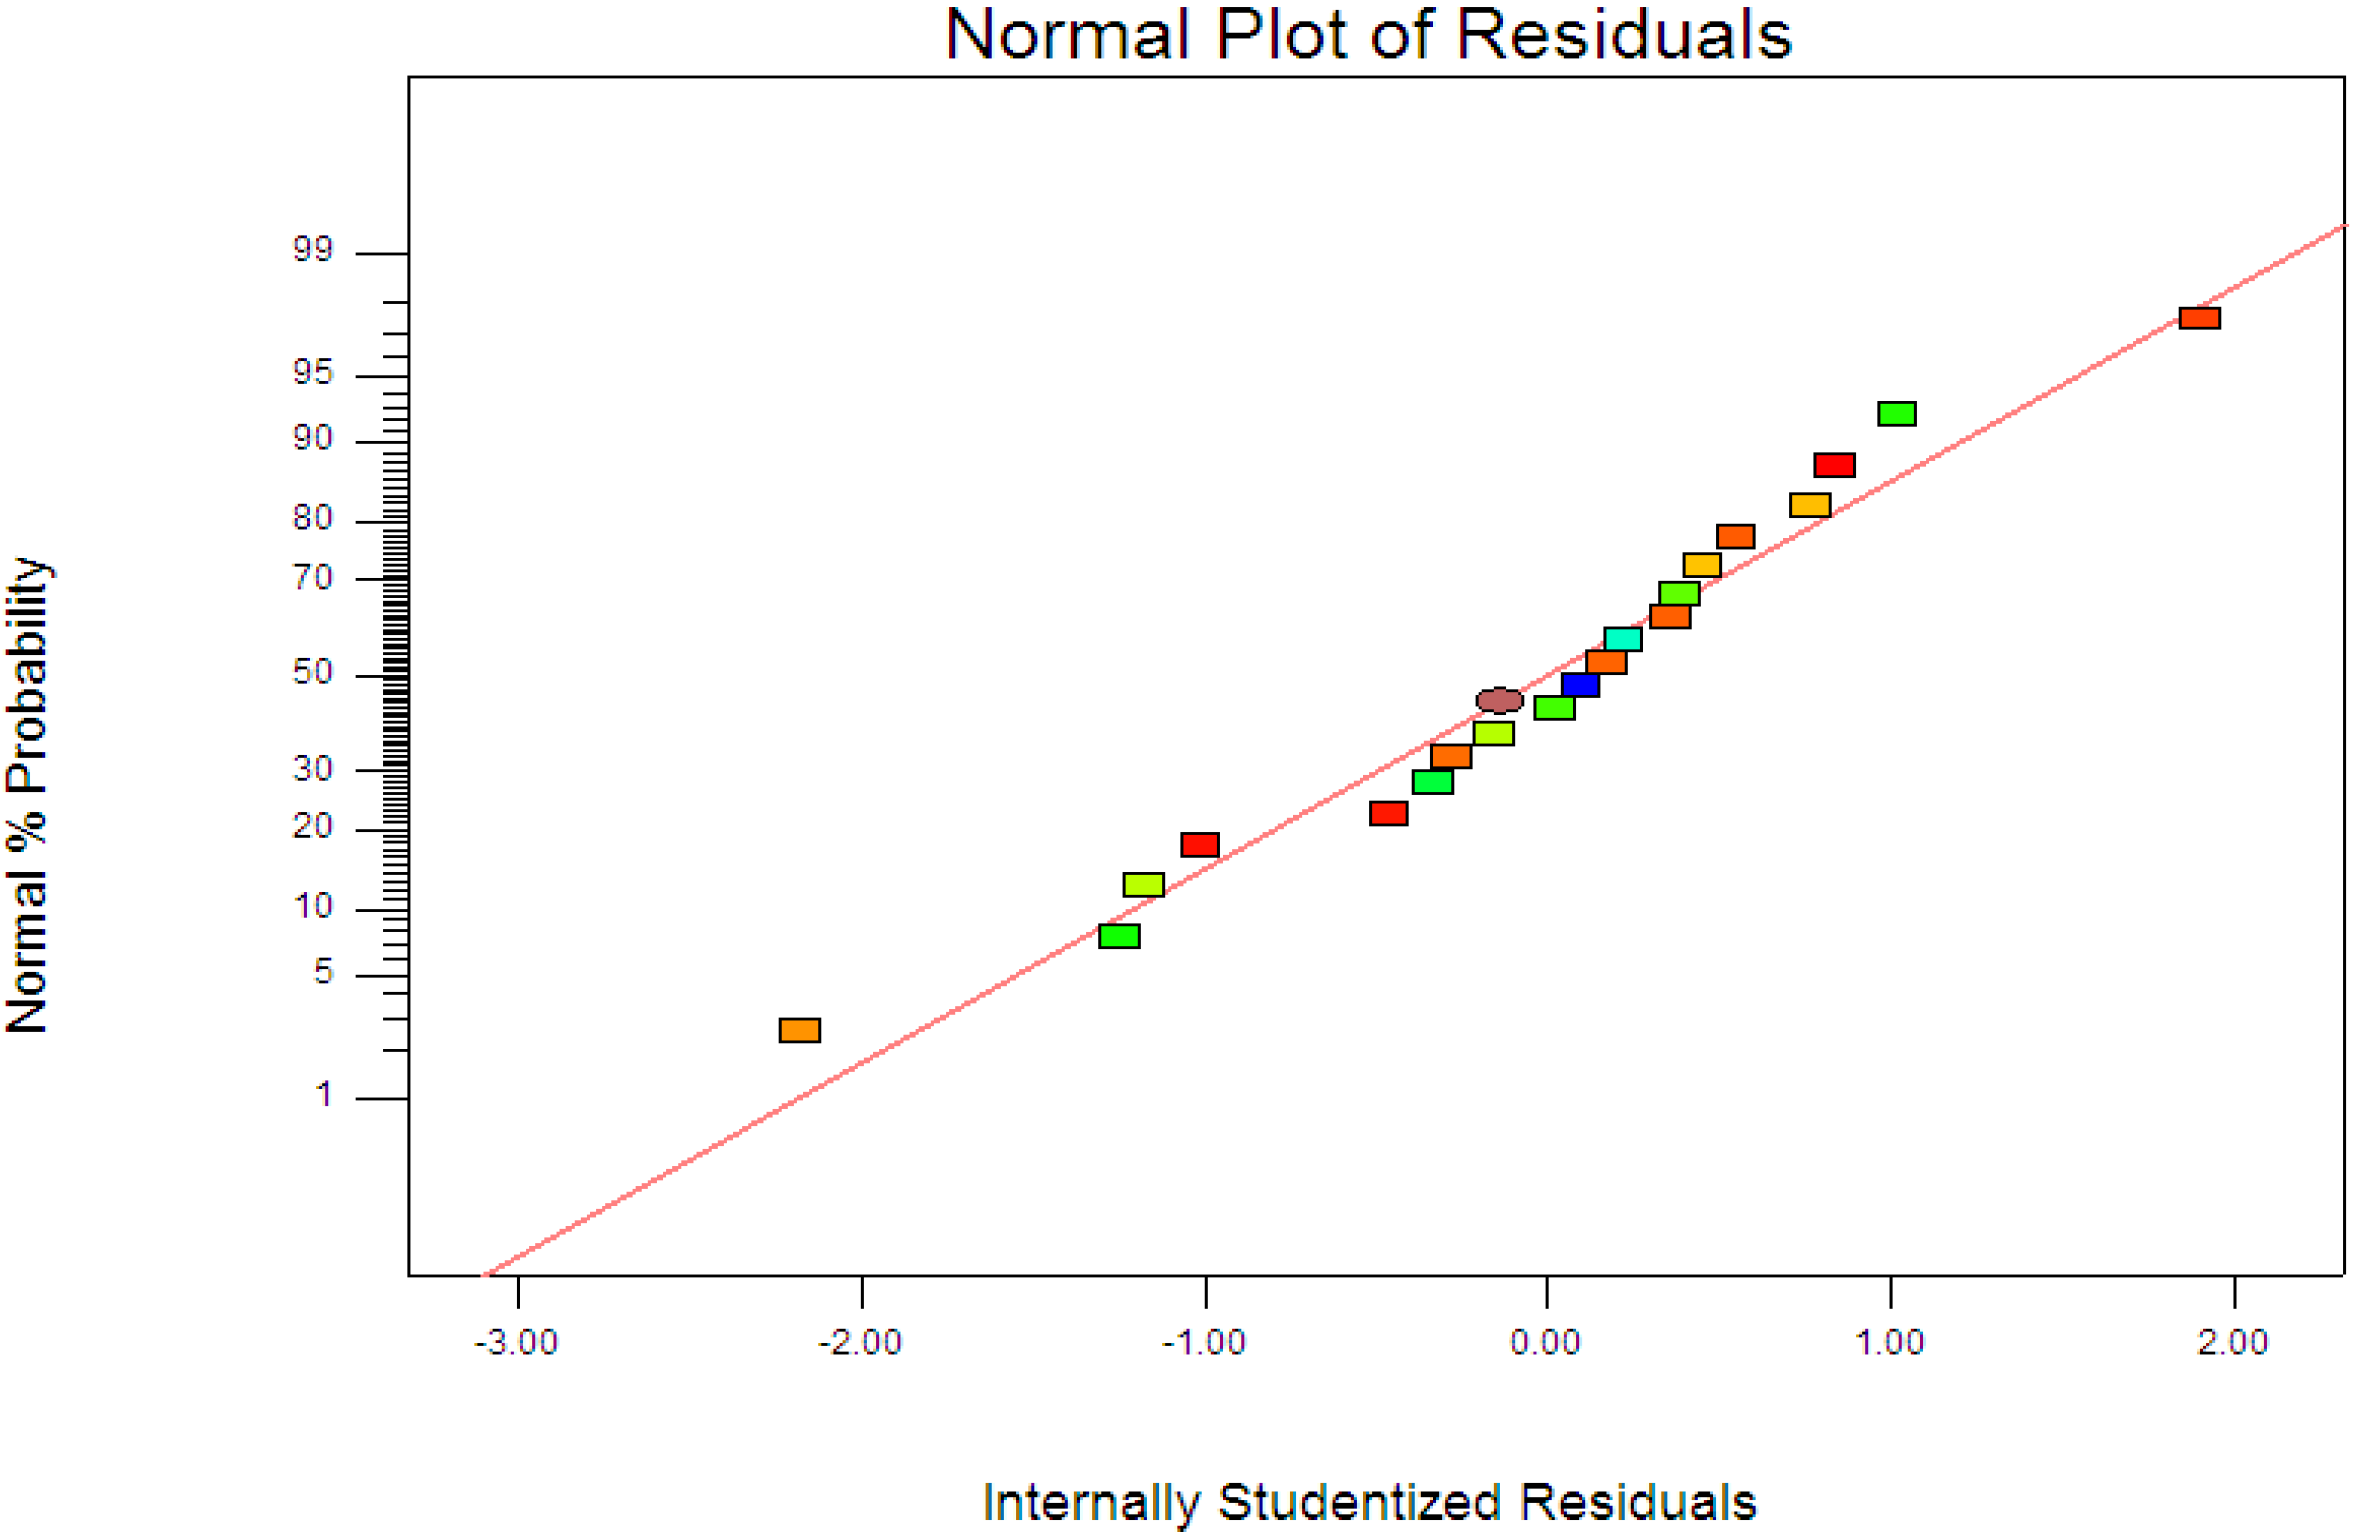
R2 = 0.9963) showed the data fit well with the model in the range studied. On the other hand, residuals analysis was carried out in order to confirm the adequacy of the model. This was done by observing the normal probability plot of the residuals (
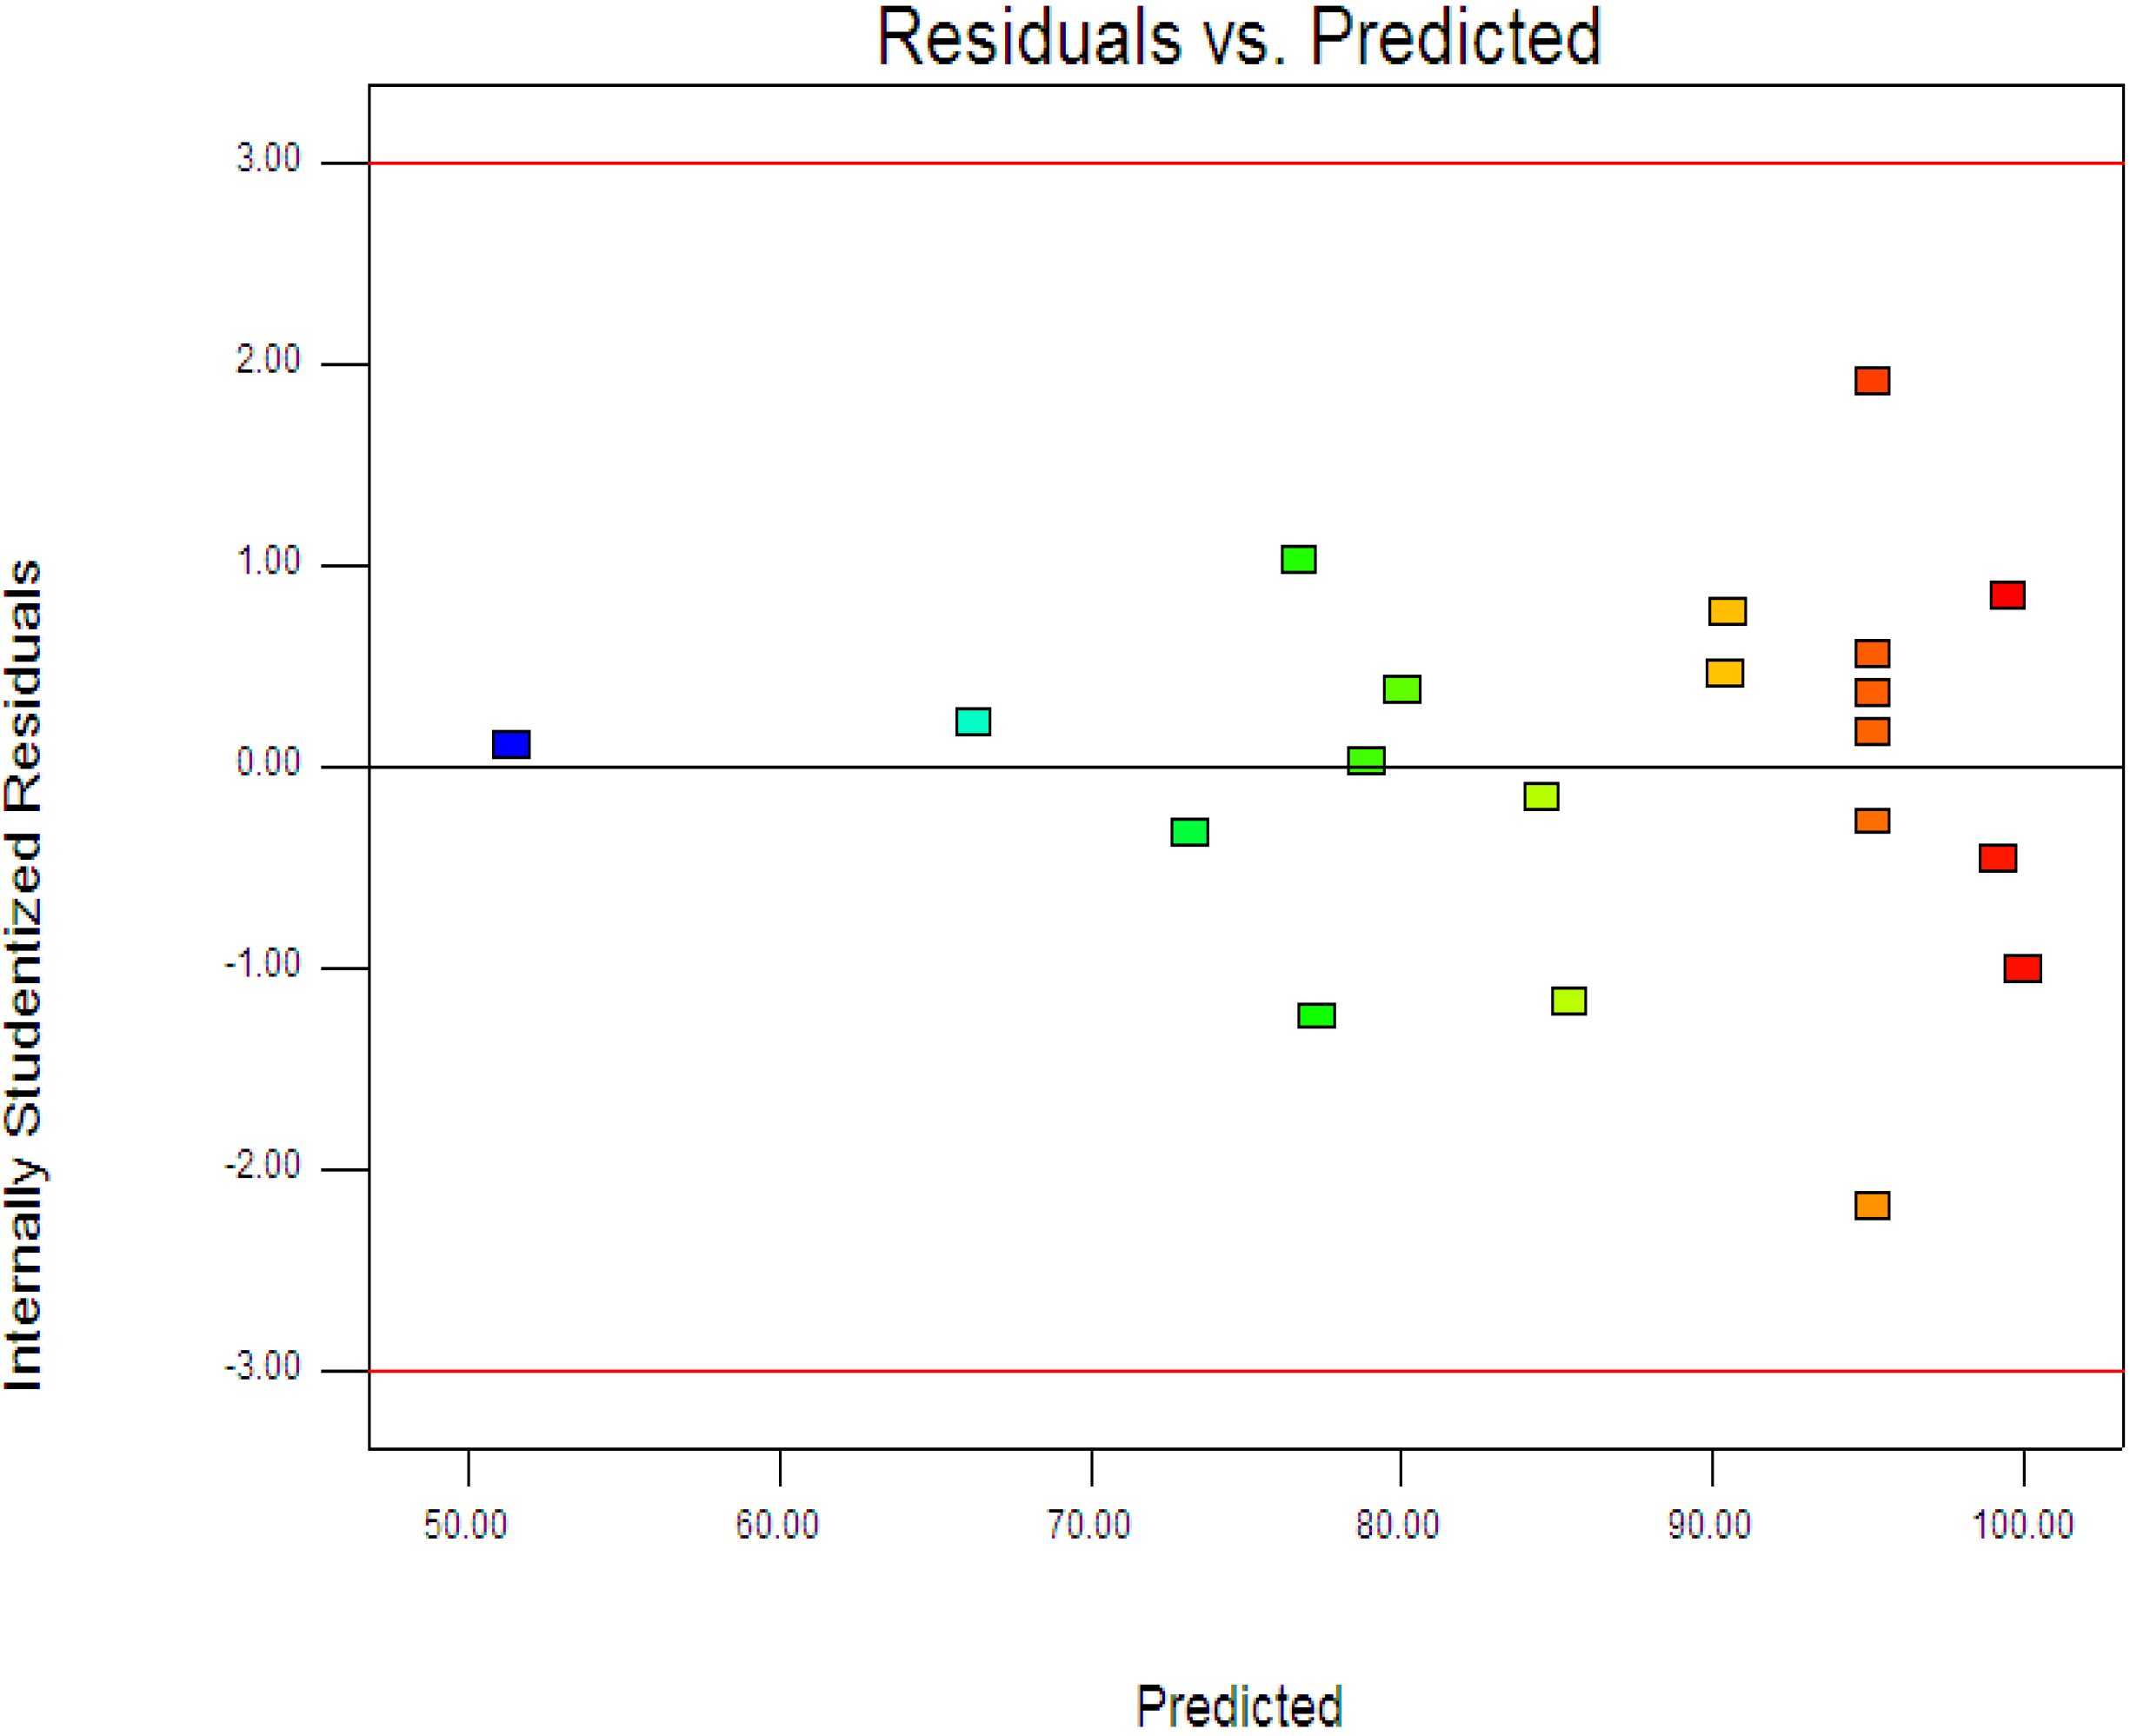
Figure 4) and the plot of the residuals
vs. the predicted response (
Figure 5). From
Figure 4, the residuals were fall on a straight line suggested the errors are distributed normally [
42]. Furthermore, structureless pattern in the plot of residuals
vs. the predicted response indicated the model is adequate and the model does not show any violation of the independence or constant variance assumption [
40].
Table 5.
Coefficient of regression model and their significance.
Table 5.
Coefficient of regression model and their significance.
| Factor | Coefficient estimate | Degree of freedom | Standard error | F Value | 95% Confidence interval low | 95% Confidence interval high | p Value |
|---|
| Intercept | 95.15 | 1 | 0.43 | – | 94.20 | 96.10 | – |
| x1 | −1.94 | 1 | 0.27 | 53.09 | −2.54 | −1.35 | <0.0001 |
| x2 | −5.15 | 1 | 0.27 | 372.37 | −5.74 | −4.55 | <0.0001 |
| x3 | 9.77 | 1 | 0.27 | 1339.59 | 9.17 | 10.36 | <0.0001 |
| x12 | −1.06 | 1 | 0.38 | 7.83 | −1.90 | −0.22 | 0.0188 |
| x22 | 0.49 | 1 | 0.38 | 1.69 | −0.35 | 1.33 | 0.2222 |
| x32 | −0.68 | 1 | 0.38 | 3.28 | −1.52 | 0.16 | 0.1001 |
| x1x2 | −3.63 | 1 | 0.21 | 290.58 | −4.10 | −3.15 | <0.0001 |
| x1x3 | −1.49 | 1 | 0.21 | 48.91 | −1.96 | −1.01 | <0.0001 |
| x2x3 | −6.04 | 1 | 0.21 | 806.06 | −6.52 | −5.57 | <0.0001 |
Figure 3.
Predicted vs. actual values for photodegradation of 4-CPA.
Figure 3.
Predicted vs. actual values for photodegradation of 4-CPA.
Figure 4.
Normal probability plots of the residuals.
Figure 4.
Normal probability plots of the residuals.
Figure 5.
Plot of the residuals against the predicted response.
Figure 5.
Plot of the residuals against the predicted response.
3.3. Response Surface Analysis
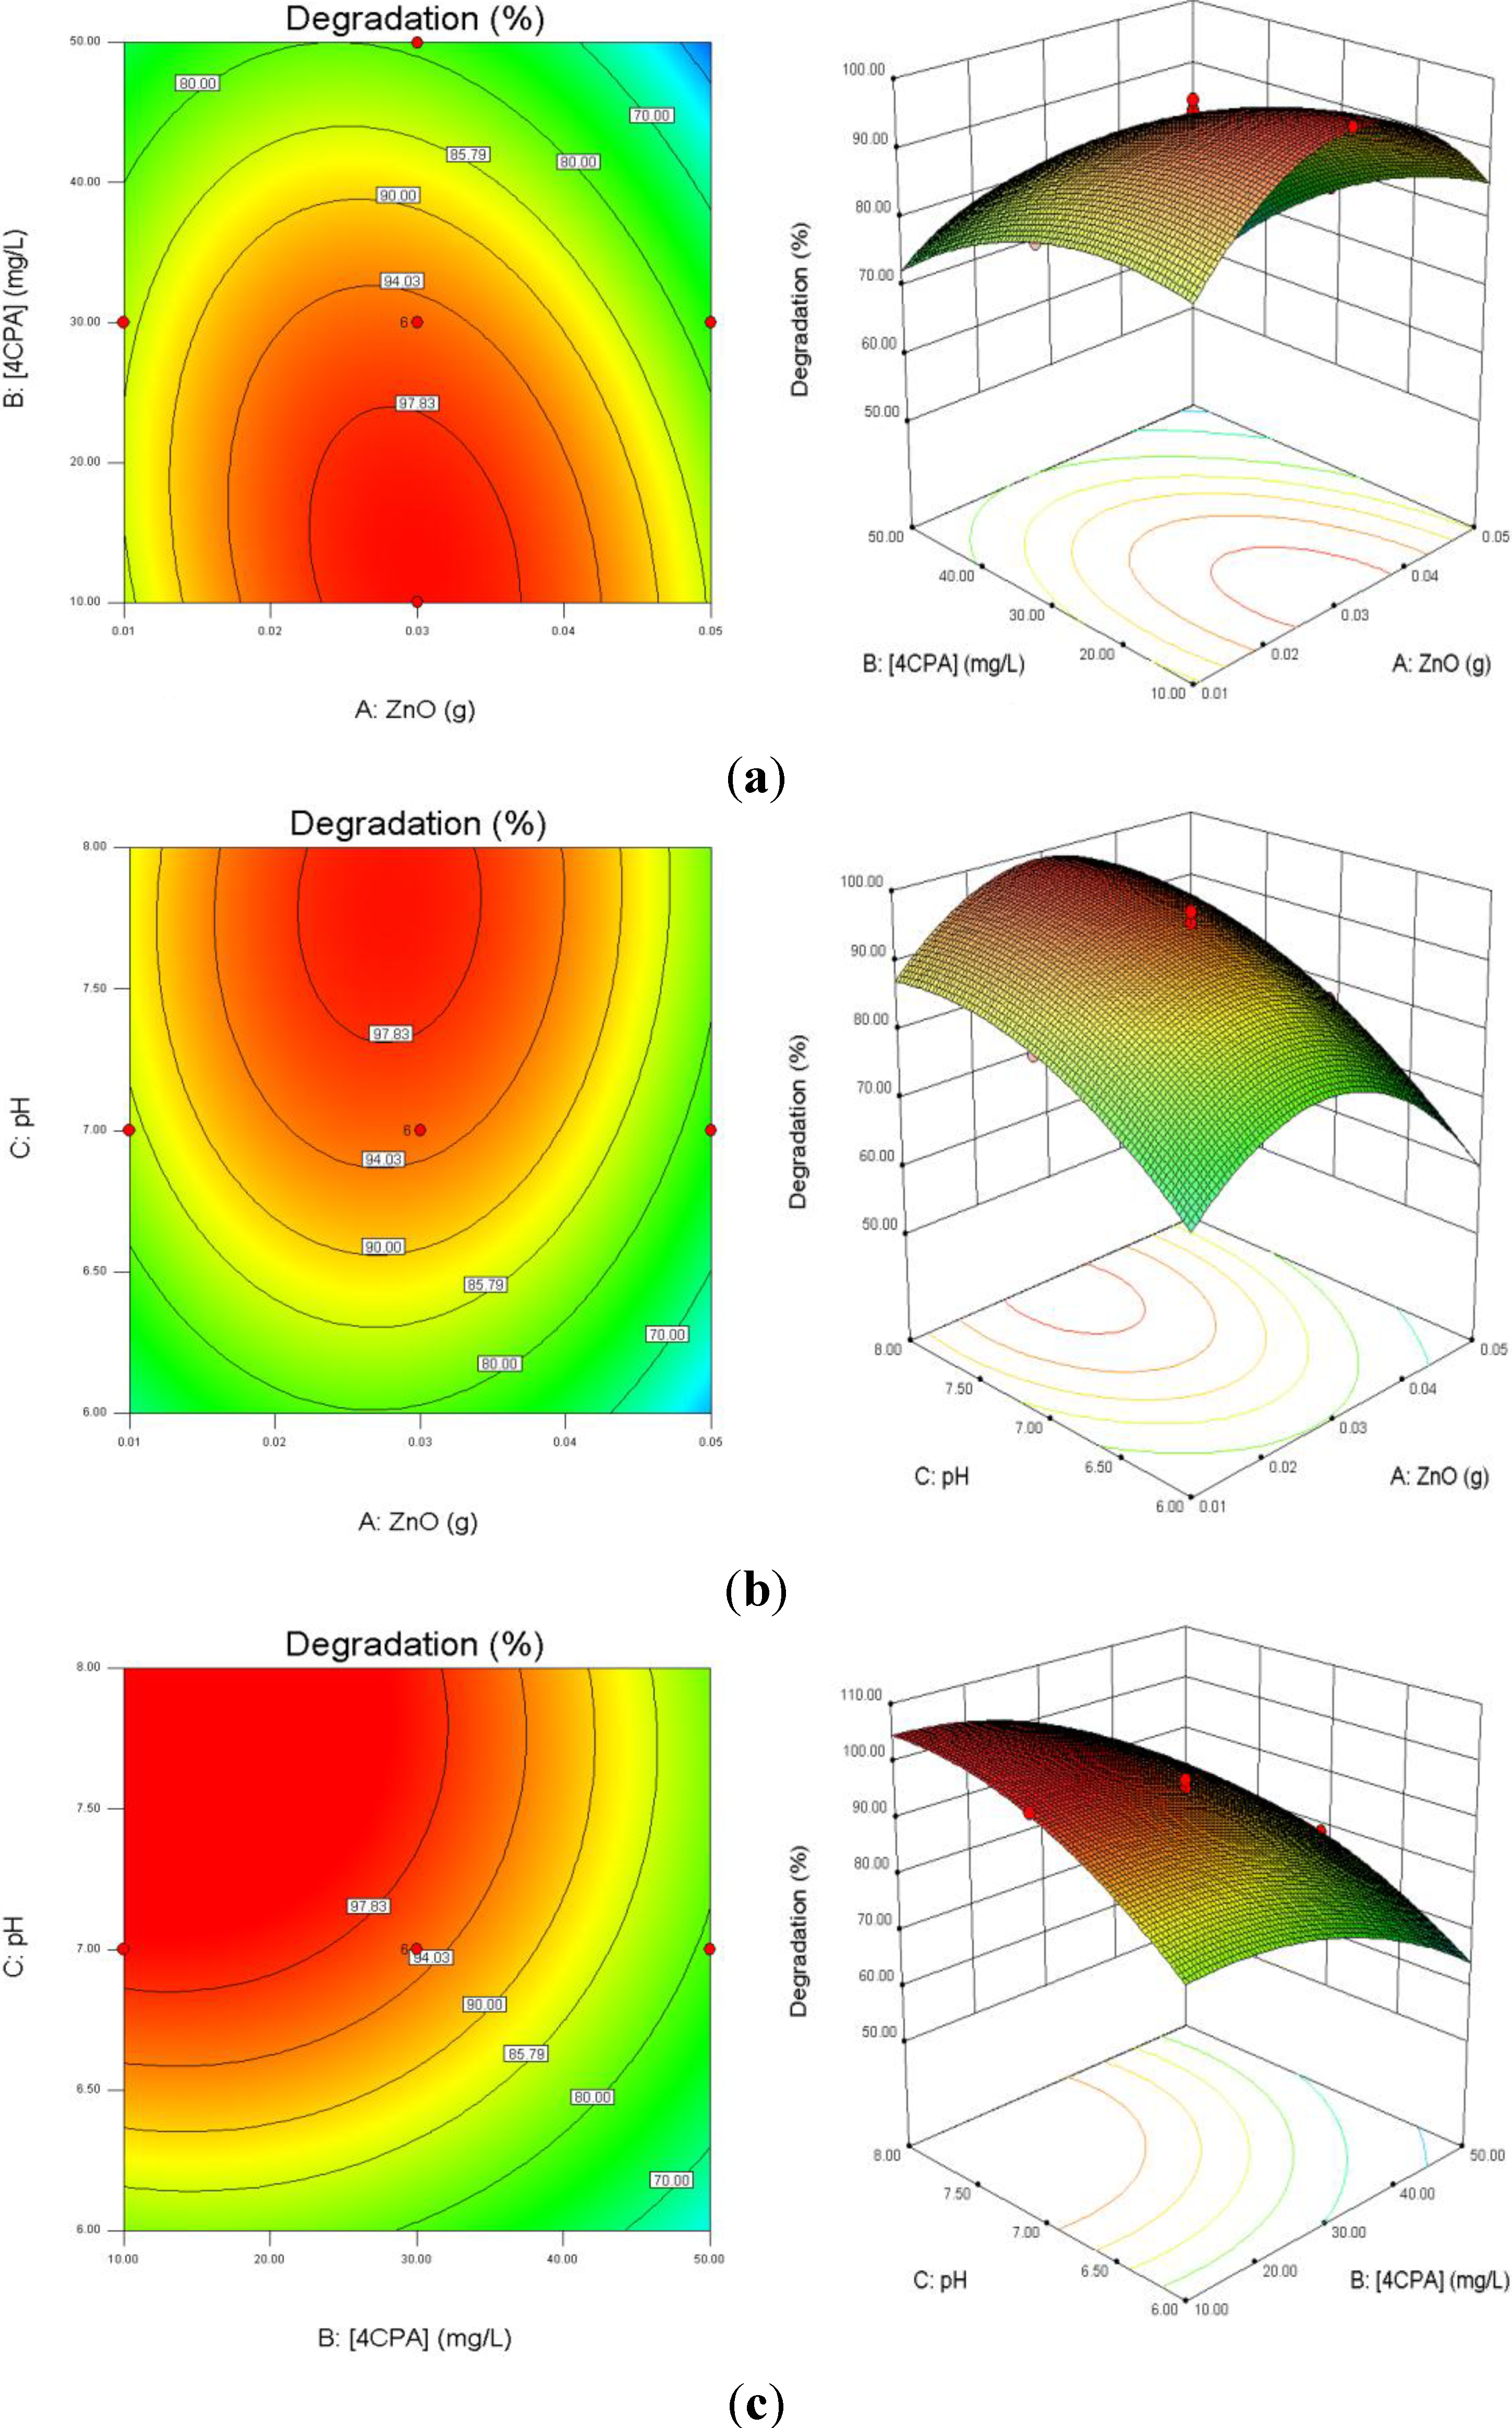
Figure 6a depicts the influence of ZnO loading and initial 4-CPA concentration on the degradation efficiency while keeping pH at 7.00. As illustrated in the plots, the degradation percentage increased with increasing catalyst dosage up to an optimum mass (0.30 g) and then decreased with excessive ZnO. This is based on the fact that an increase in the catalyst dosage will enhance the number of active site on the catalyst surface, which in turn increased the number of hydroxyl and superoxide radicals responsible for the degradation of 4-CPA molecules [
43]. Further enhancement in the catalyst concentration resulted in lower percentage of degradation. This may be due to the solution becomes opaque which reduces the penetration of UV light into the solution and consequently lowers the degradation percentage [
44]. On the other hand, the removal percentage of 4-CPA was lower when the concentration increased from 10 to 50 mg/L. This can be explained by as the concentration of substrate increases, more and more pollutant molecules are adsorbed on the catalyst surface. However, the catalyst dosage, light intensity and irradiation period are remaining constant. Hence, the numbers of hydroxyl radicals formed on the catalyst surface are constant as well. Consequently, the hydroxyl radicals formed are insufficient to degrade substrate molecules at higher concentrations, which decreased the degradation efficiency [
45].
Figure 6.
Effects of ZnO loading, initial concentration of 4-CPA and pH on the degradation percentage of 4-CPA. (a) pH was kept constant at 7.0; (b) 4-CPA initial concentration was kept constant at 30 mg/L; (c) ZnO loading was kept constant at 0.03 g.
Figure 6.
Effects of ZnO loading, initial concentration of 4-CPA and pH on the degradation percentage of 4-CPA. (a) pH was kept constant at 7.0; (b) 4-CPA initial concentration was kept constant at 30 mg/L; (c) ZnO loading was kept constant at 0.03 g.
Figure 6b presents the interaction effect of ZnO loading and initial solution pH on the removal of 4-CPA. It is evident that the removal increased as the pH and the amount of ZnO loaded up to an optimum value. The degradation rate decreased after achieved the optimal points. Higher catalyst loading does not favor the degradation process as it facilitates particle agglomeration leading to a reduction in catalyst surface area available for light absorption and pollutant adsorption, which in turn, reduced the photocatalytic efficiency [
46]. The pK
a of 4-CPA is 3.56 and the point of zero charge (pH
zpc) of ZnO is 9.0. Therefore, the 4-CPA is negatively charged above its pK
a value. As expected, the pH that shows optimal degradation must fall in between pK
a < pH < pH
zpc, due to the electrostatic interaction among the anions of 4-CPA and positively charged catalyst surface is enhanced [
47].
The effect of initial concentration of 4-CPA and pH values on the removal of 4-CPA are shown in
Figure 6c. It is obvious that increasing the 4-CPA concentration adversely affect the removal efficiency. This phenomenon may be due to the screening effect by 4-CPA molecules which reduced light penetration into the solution. Thus, the photoactivated volume is reduced, which lowers the percentage of degradation [
48]. The competition between the pollutant molecules and the generated intermediates for hydroxyl radicals also reduced the degradation rate at higher concentration [
49]. In addition, the percentage removal was low at lower medium pH regardless 4-CPA concentration due to substantial loss of ZnO particles [
50].
3.4. Process Optimization and Confirmation
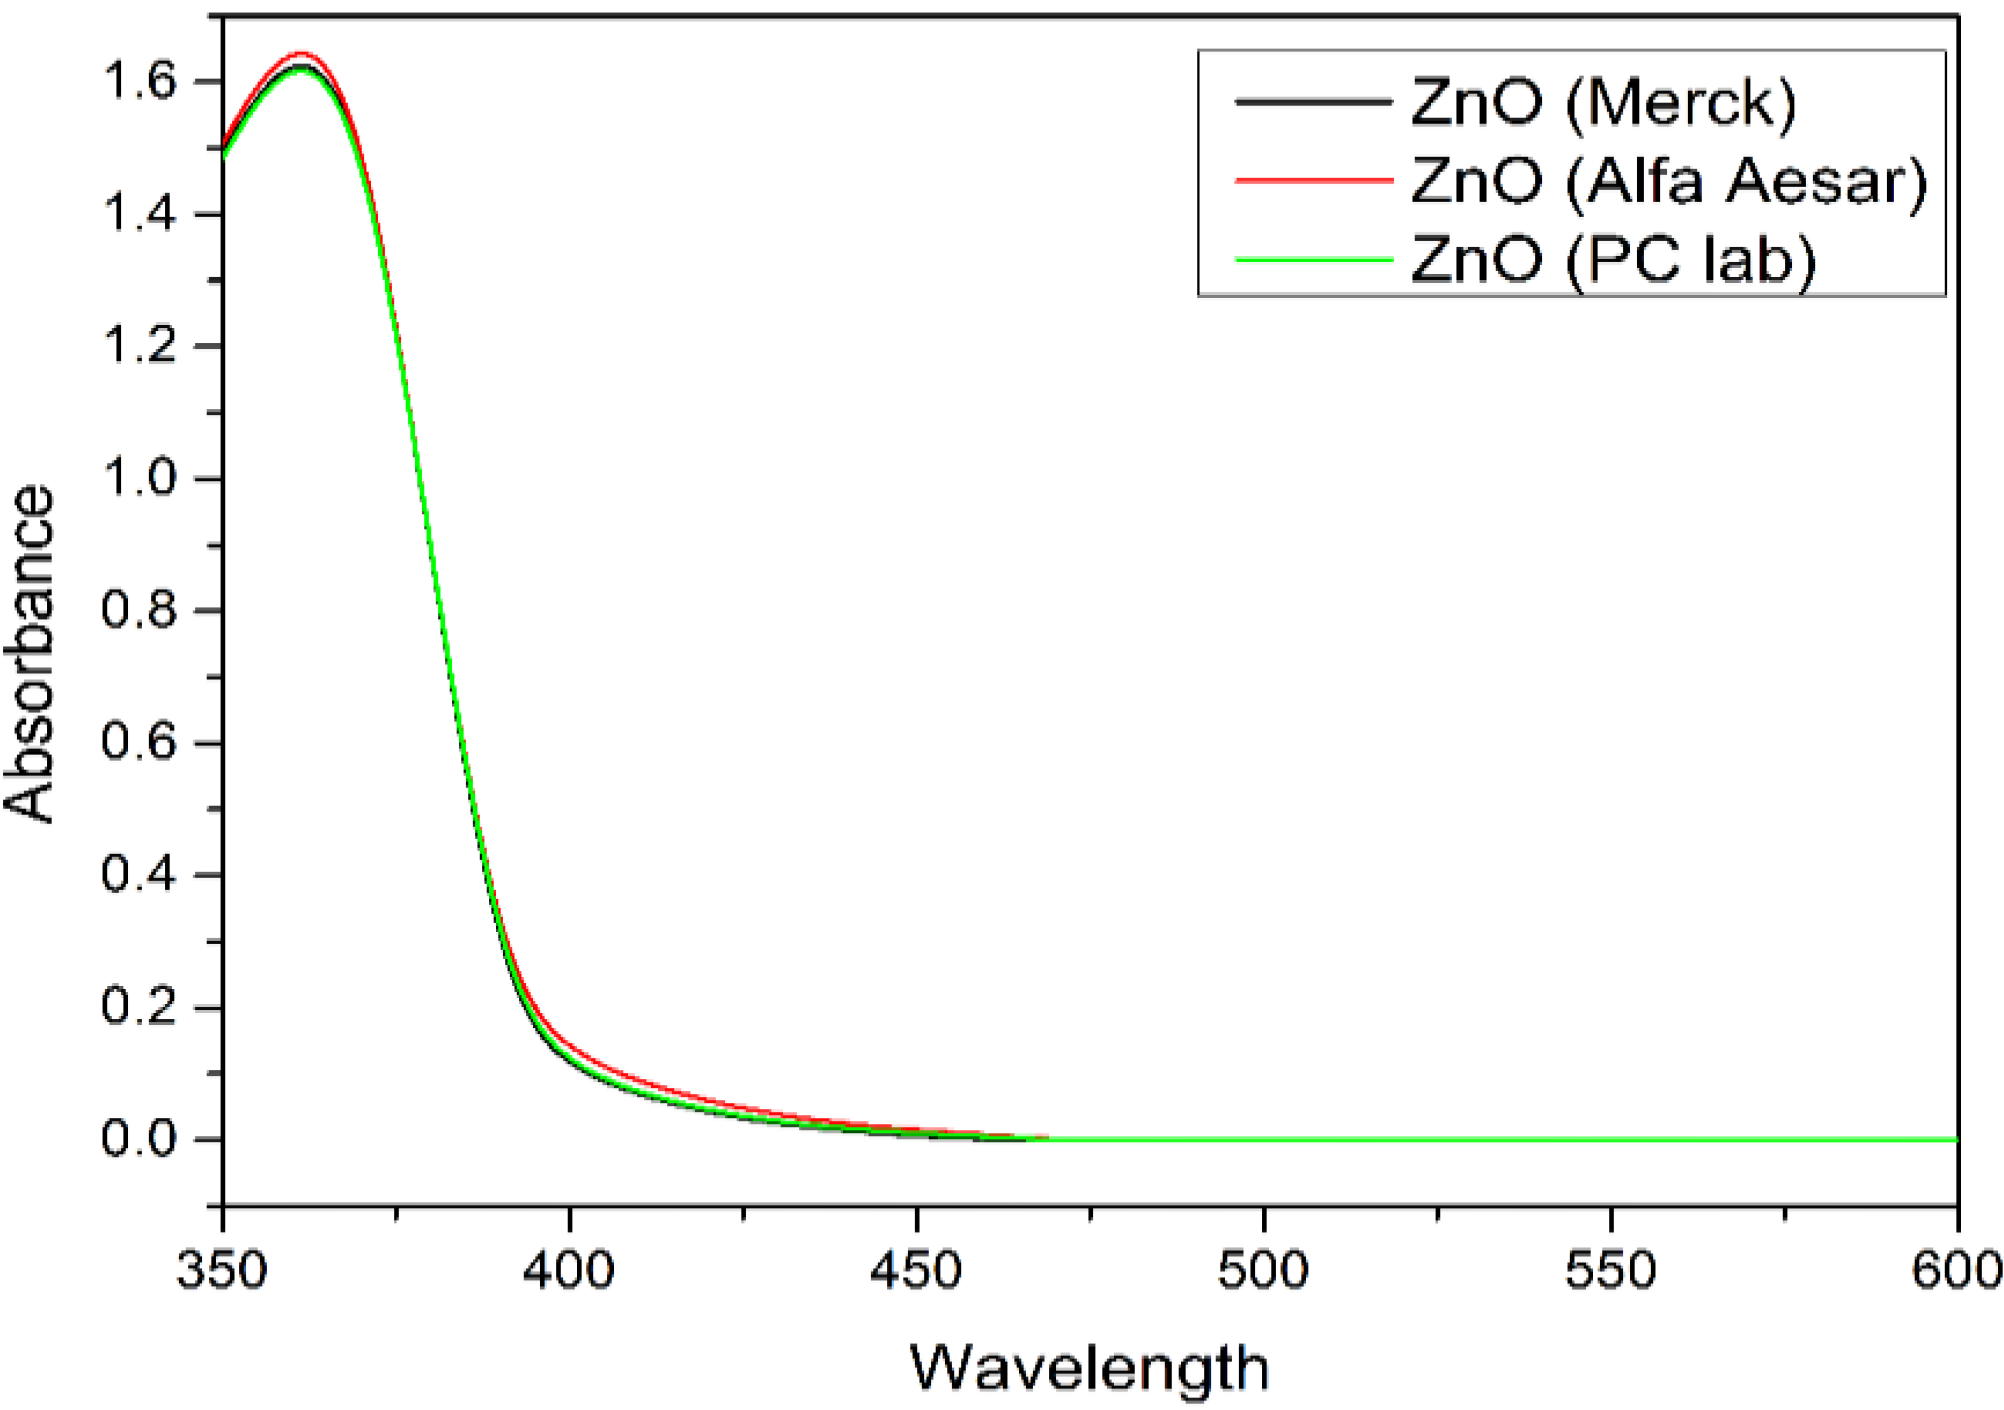
The goal of the optimization process is to achieve maximum degradation of 4-CPA by ZnO photocatalyst under UV irradiation. Therefore, the catalyst loading was set to minimum value, the concentration of 4-CPA was set to maximum value and the pH of the solution was set within the studied range, in order to obtain maximum degradation efficiency of 4-CPA. The optimum values of the influencing factors for the maximum 4-CPA removal under these circumstances are 0.02 g ZnO dosage, 20.00 mg/L 4-CPA and at pH 7.71 which gave 90.94% 4-CPA removal. Consequently, experiment was conducted in accordance to the optimized parameters and it showed 91.33% of 4-CPA removal. The good agreement between the predictive results and experimental results indicated that CCD design is feasible to optimize the degradation of 4-CPA. The photoactivity of ZnO (Merck) was compared with two other types of commercial ZnO (Alfa Aesar and PC lab) and the results were summarized in
Table 6. It is obvious that the photocatalytic activity of ZnO powder was influenced by the surface area, where ZnO from Merck has the highest photoactivity compared to Alfa Aesar ZnO and PC lab ZnO. The UV-Vis spectra of ZnO photocatalyst (Merck, Alfa Aesar and PC lab) were shown in
Figure 7.
Table 6.
Characteristic of three types of commercial ZnO.
Table 6.
Characteristic of three types of commercial ZnO.
| ZnO type | Characteristic | 4-CPA degradation (%) |
|---|
| Surface area (m2/g) | Particle size (μm) | Band gap (eV) |
|---|
| Merck | 3.3 | 0.4–0.5 | 3.02 | 91.33 |
| PC lab | 2.3 | 0.1–0.6 | 3.07 | 78.42 |
| Alfa Aesar | 1.5 | 0.1–0.3 | 3.04 | 76.23 |
Figure 7.
UV-Vis spectra of three different types of ZnO photocatalyst.
Figure 7.
UV-Vis spectra of three different types of ZnO photocatalyst.
3.5. Kinetic and Mineralization Studies
The reaction rate of 4-CPA in the presence of ZnO photocatalyst under UV irradiation was evaluated at different concentrations. The Langmuir-Hinshelwood (L-H) kinetic model was used to explain the kinetics of heterogeneous photocatalytic processes [
51]:
where
C0 is the initial concentration of 4-CPA (mg·L
−1),
C is the 4-CPA concentration at time,
t,
k1 is the pseudo first-order rate constant,
K1 is the surface reaction rate constant (mg·L
−1·min
−1),
K2 is the Langmuir-Hinshelwood adsorption equilibrium constant (L·mg
−1). Integration of Equation (2) gives Equation (3):
When the solution is highly diluted,
C (mol·L
−1) < 10
−3 [
52], the term
K2C becomes < 1, thus the denominator of Equation (2) is neglected and the reaction is essentially an apparent first-order reaction (Equation (4)):
where
k1 is the rate constant of a pseudo first-order reaction. Thus, Equation (3) can be simplified to a first-order reaction when
C0 is very small gives Equation (5):
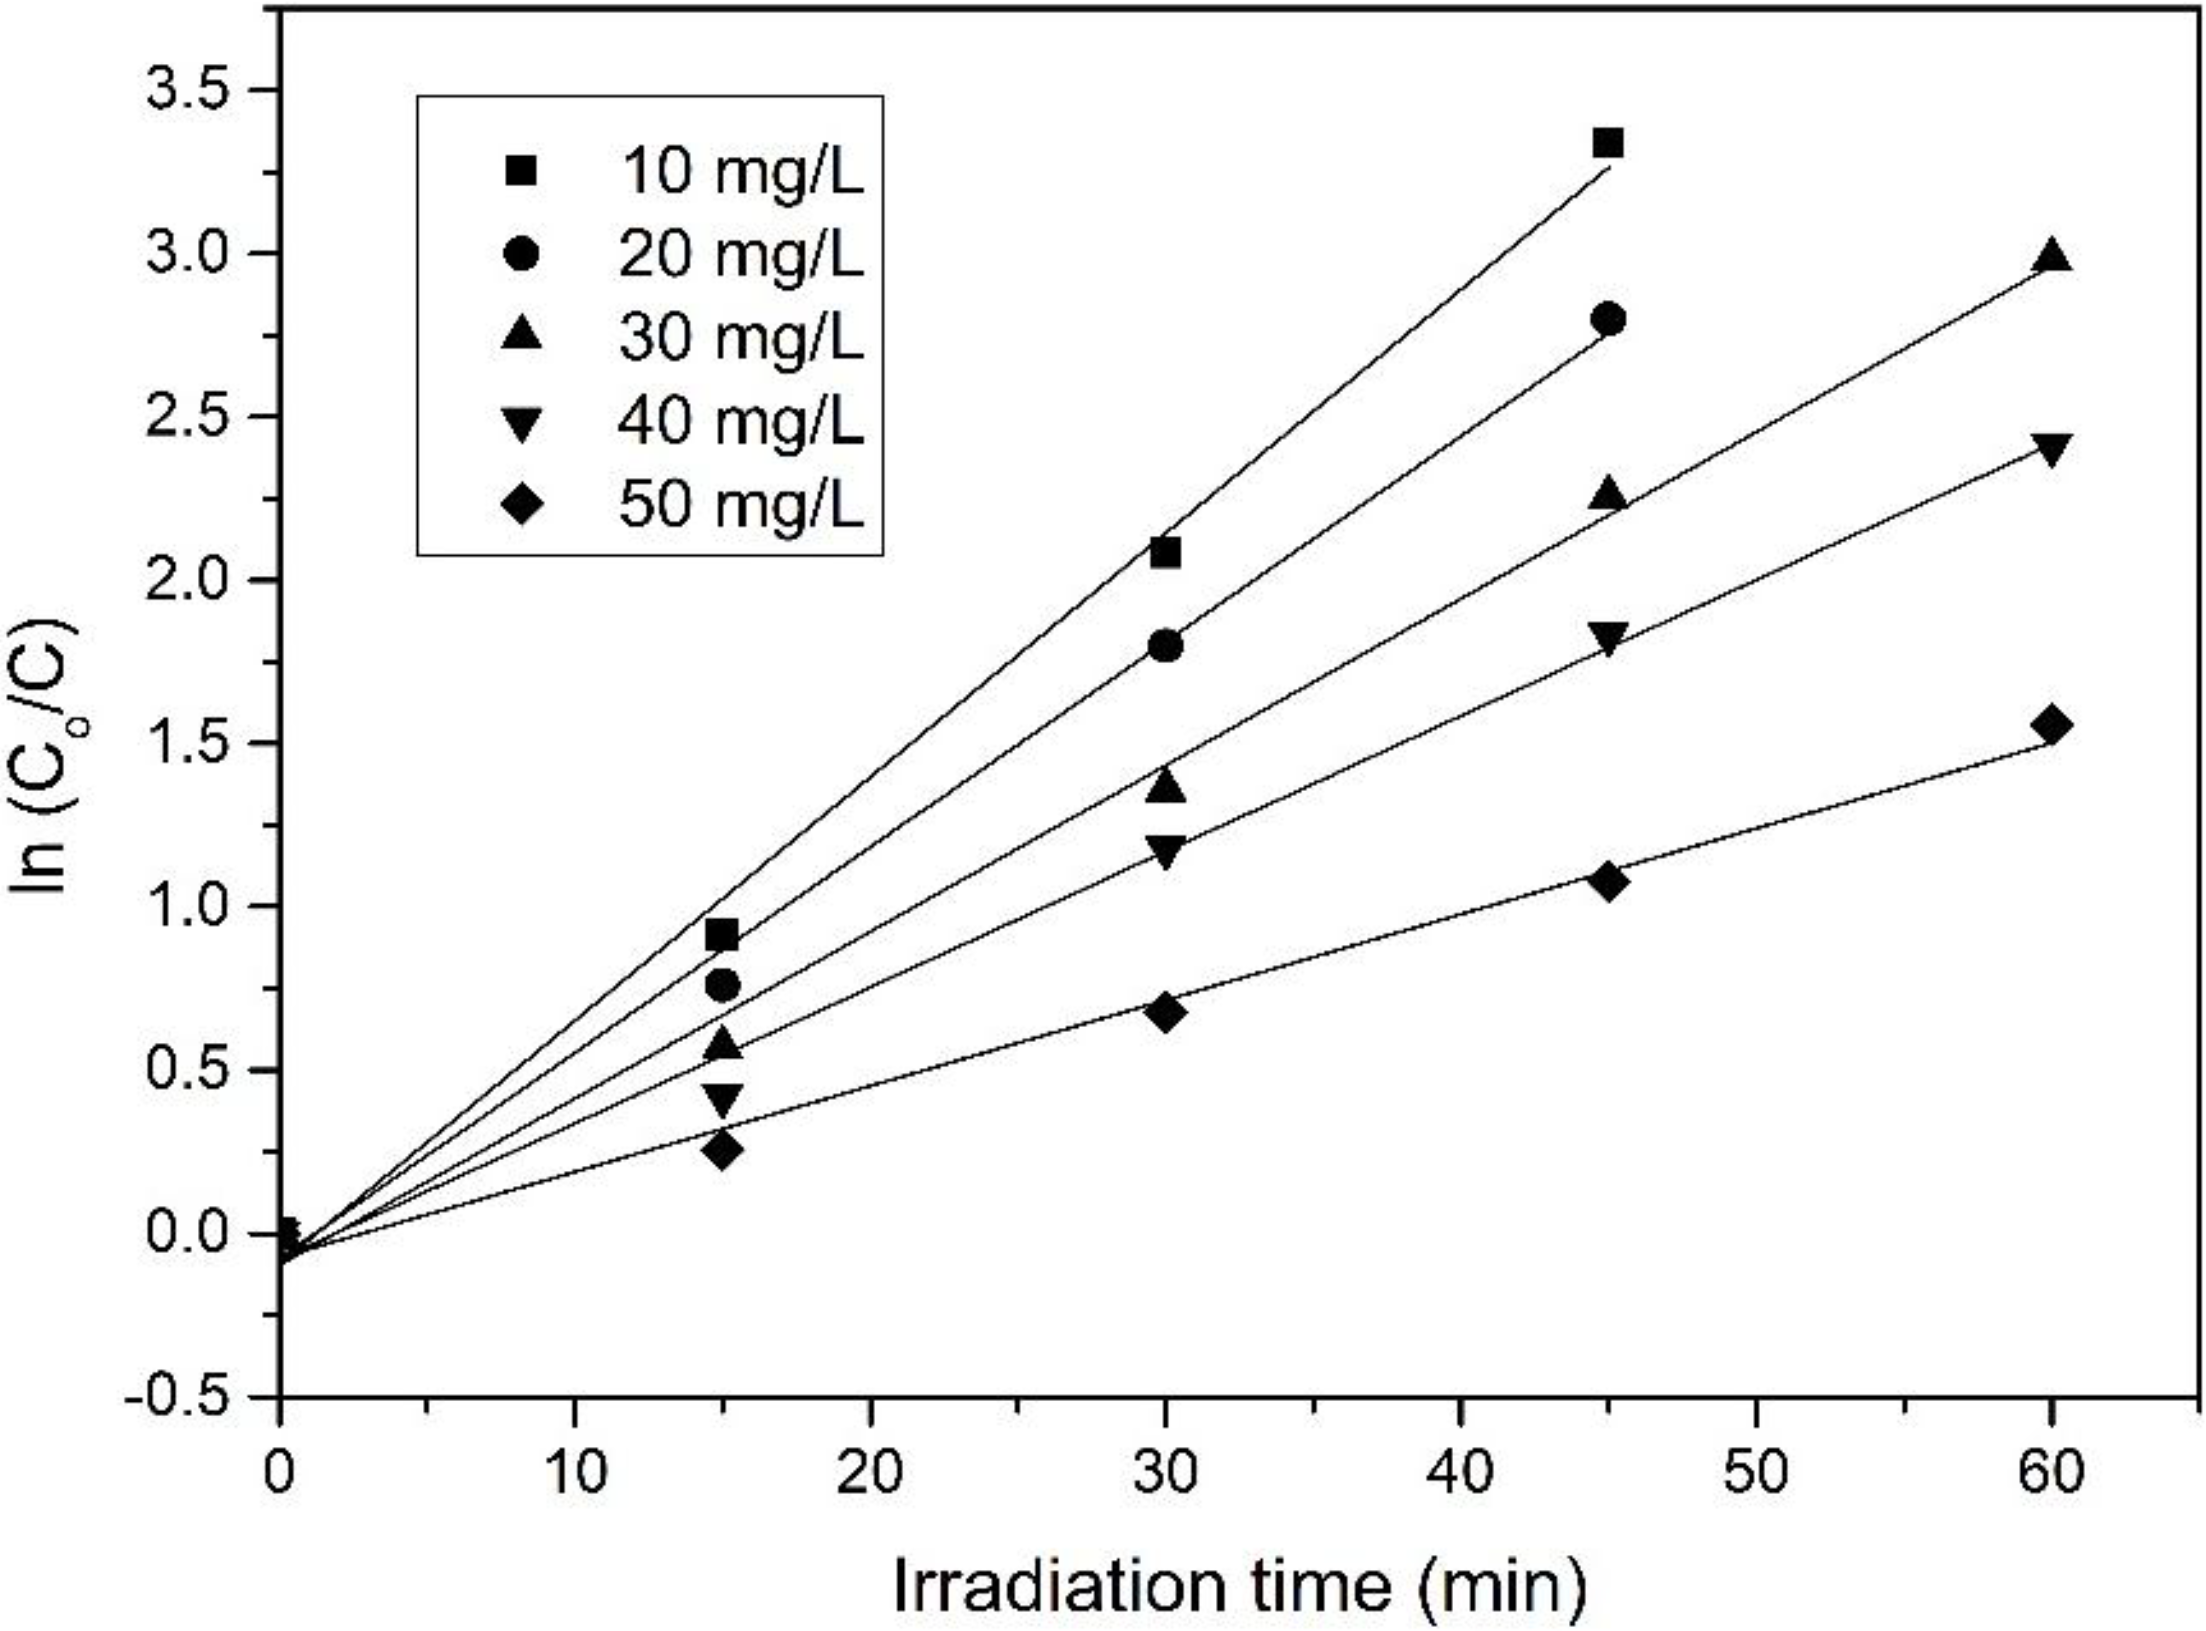
By plotting graph ln(
C0/
C)
vs. t, the first-order rate constant (
k1) can be determined from the slope of the straight line graph (
Figure 8) and the values were tabulated in
Table 7. A high regression coefficients (
R2 > 0.99) implying that the results fitted well with the corresponding reaction kinetic. The rate of decomposition was the highest at low concentration of 4-CPA (10 mg/L) and gradually decreased at higher concentrations [
53,
54,
55].
Table 7.
First-order reaction rate, k1 of photodecompositon of 4-CPA.
Table 7.
First-order reaction rate, k1 of photodecompositon of 4-CPA.
| Initial concentration of 4-CPA (mg/L) | First-Order rate constant, k1 (×10−2 min−1) | R2 |
|---|
| 10 | 7.46 | 0.9952 |
| 20 | 6.29 | 0.9957 |
| 30 | 5.10 | 0.9953 |
| 40 | 4.16 | 0.9940 |
| 50 | 2.63 | 0.9905 |
Figure 8.
First-order rate graph of photocatalytic degradation on 4-CPA under UV illumination.
Figure 8.
First-order rate graph of photocatalytic degradation on 4-CPA under UV illumination.
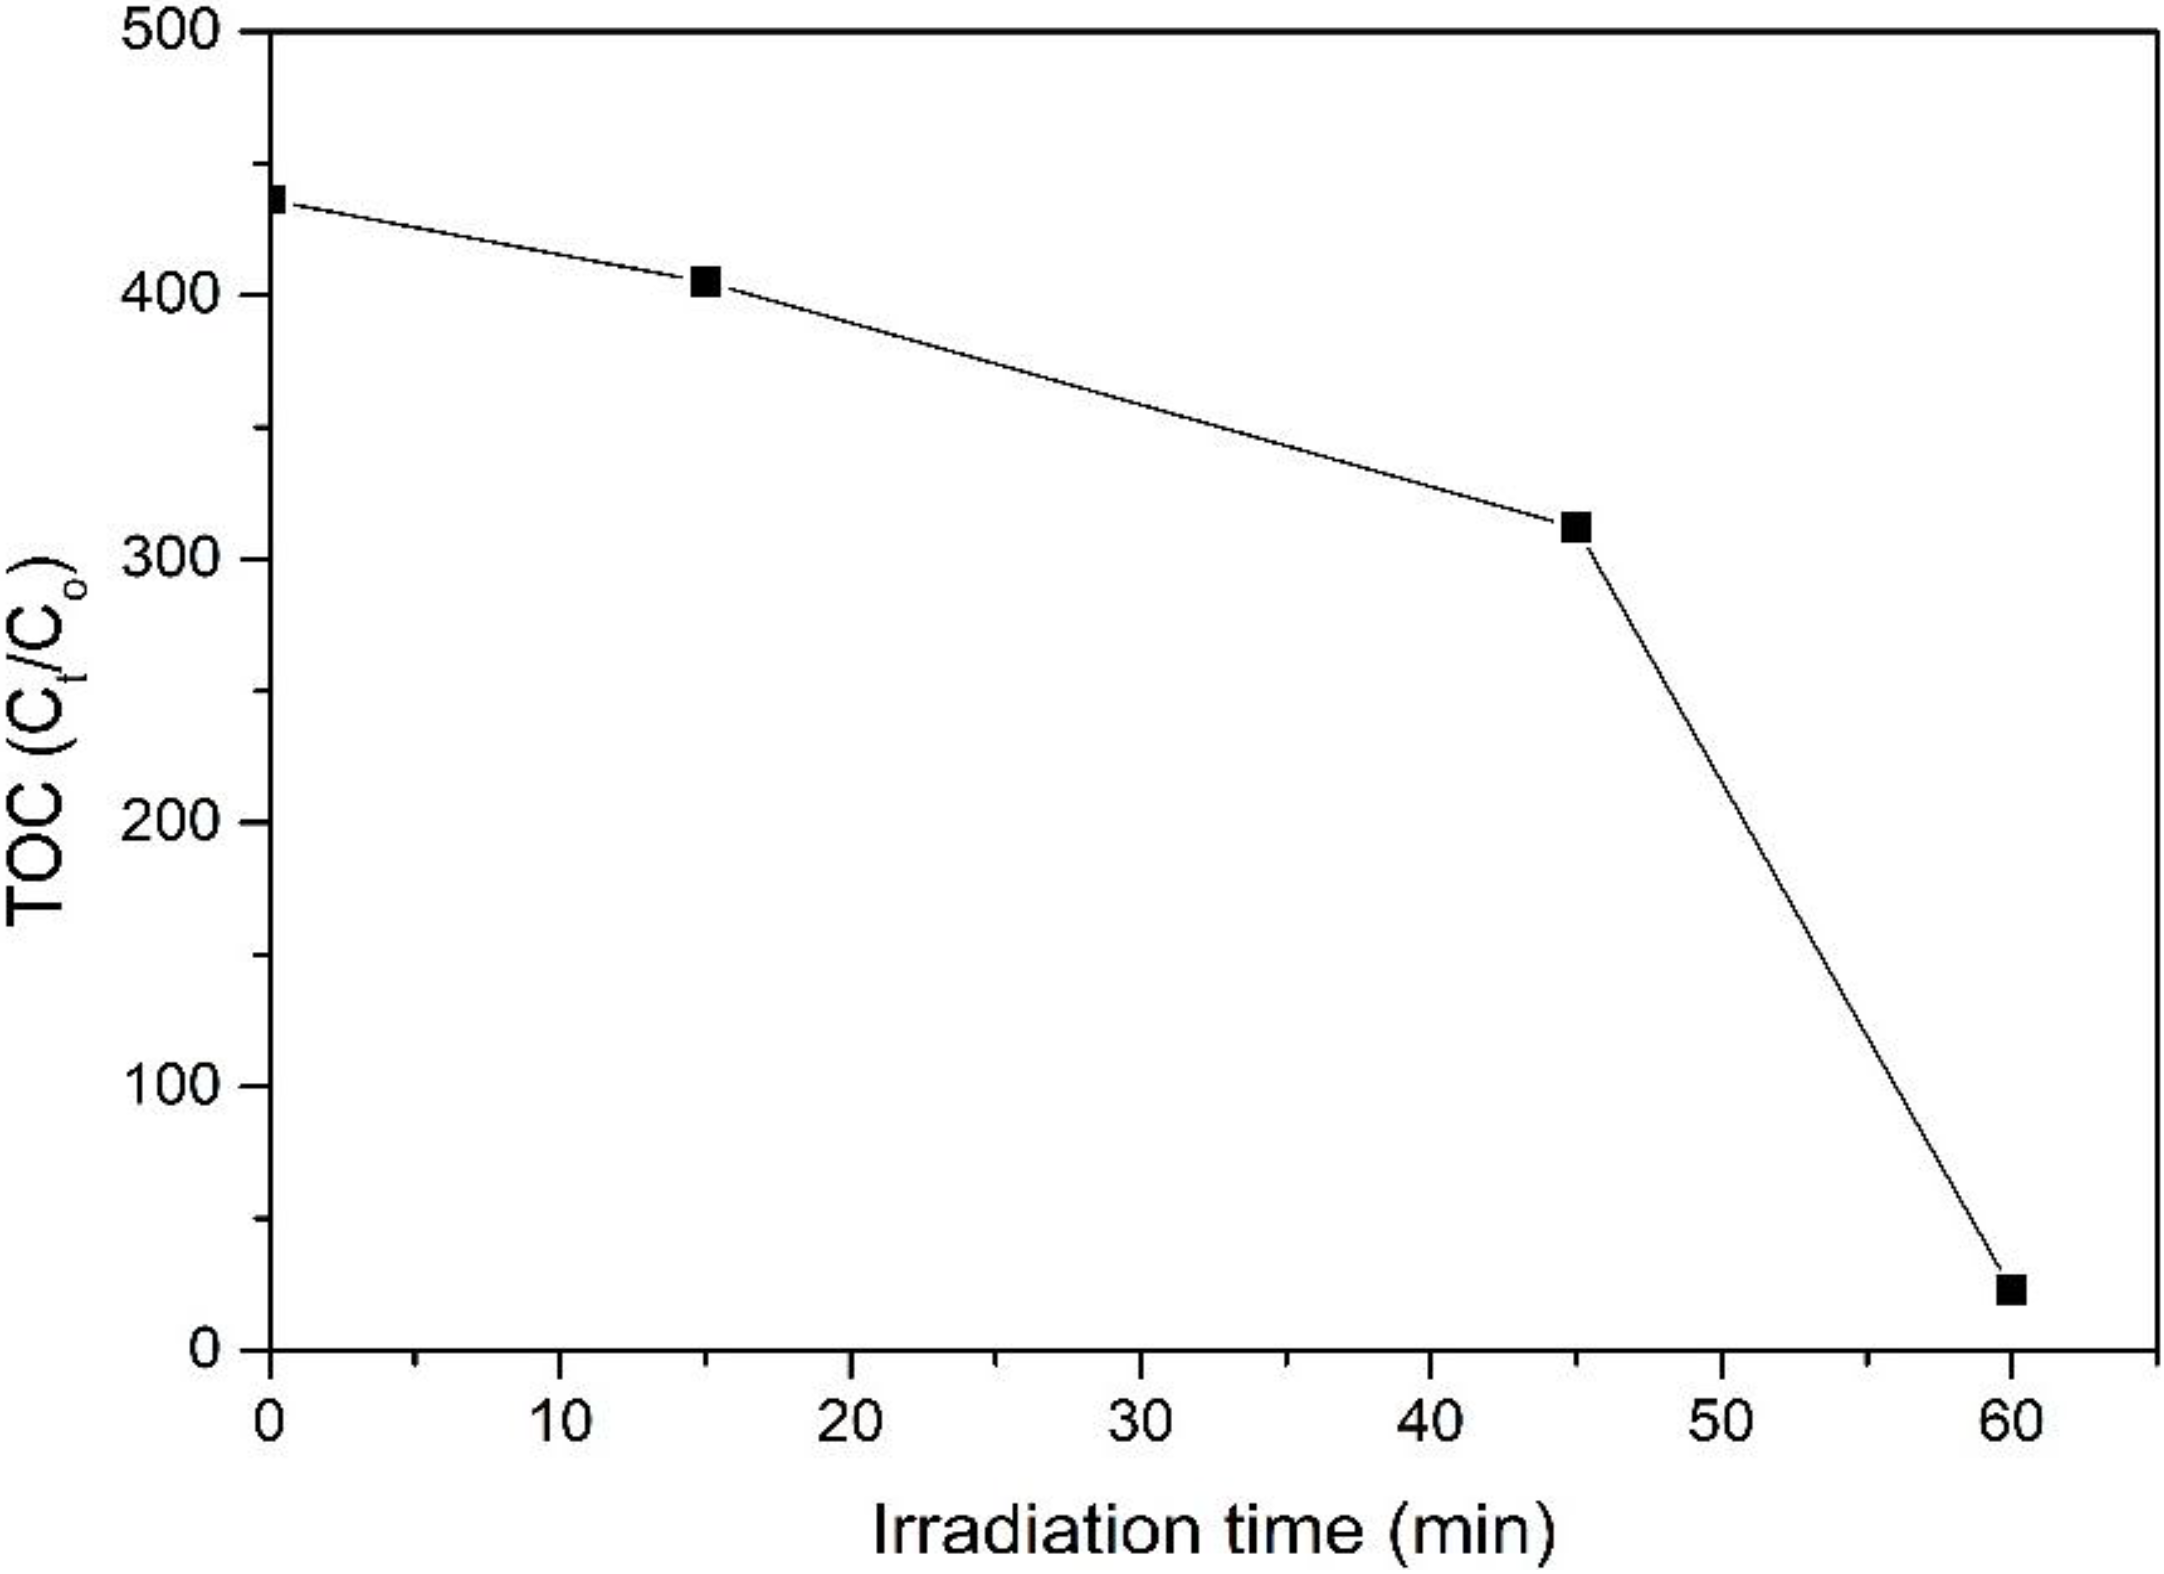
Figure 9 illustrates the relative TOC decay of 4-CPA over ZnO photocatalyst under UV irradiation. The mineralization rate increases with increasing irradiation time. It can be seen that the UV/ZnO system could mineralize 4-CPA effectively, achieved 94.7% mineralization with only 1 h, indicating most of the 4-CPA was mineralized during the photocatalytic degradation process.
Figure 9.
Relative total organic carbon (TOC) decay of 4-CPA over ZnO photocatalyst.
Figure 9.
Relative total organic carbon (TOC) decay of 4-CPA over ZnO photocatalyst.
