4.1. Mechanical Properties
In general, solution heat-treated and quenched tempers are non-stable tempers. Strength increases with storage time due to natural ageing, and this is attributed to the clustering of solute atoms (Mg, Si and also Cu, if contained in the alloys) [
15]. Pre-aging treatments can decrease hardening during natural ageing (clustering) due to a decrease of the concentration of quenched-in vacancies and the formation of larger clusters [
16,
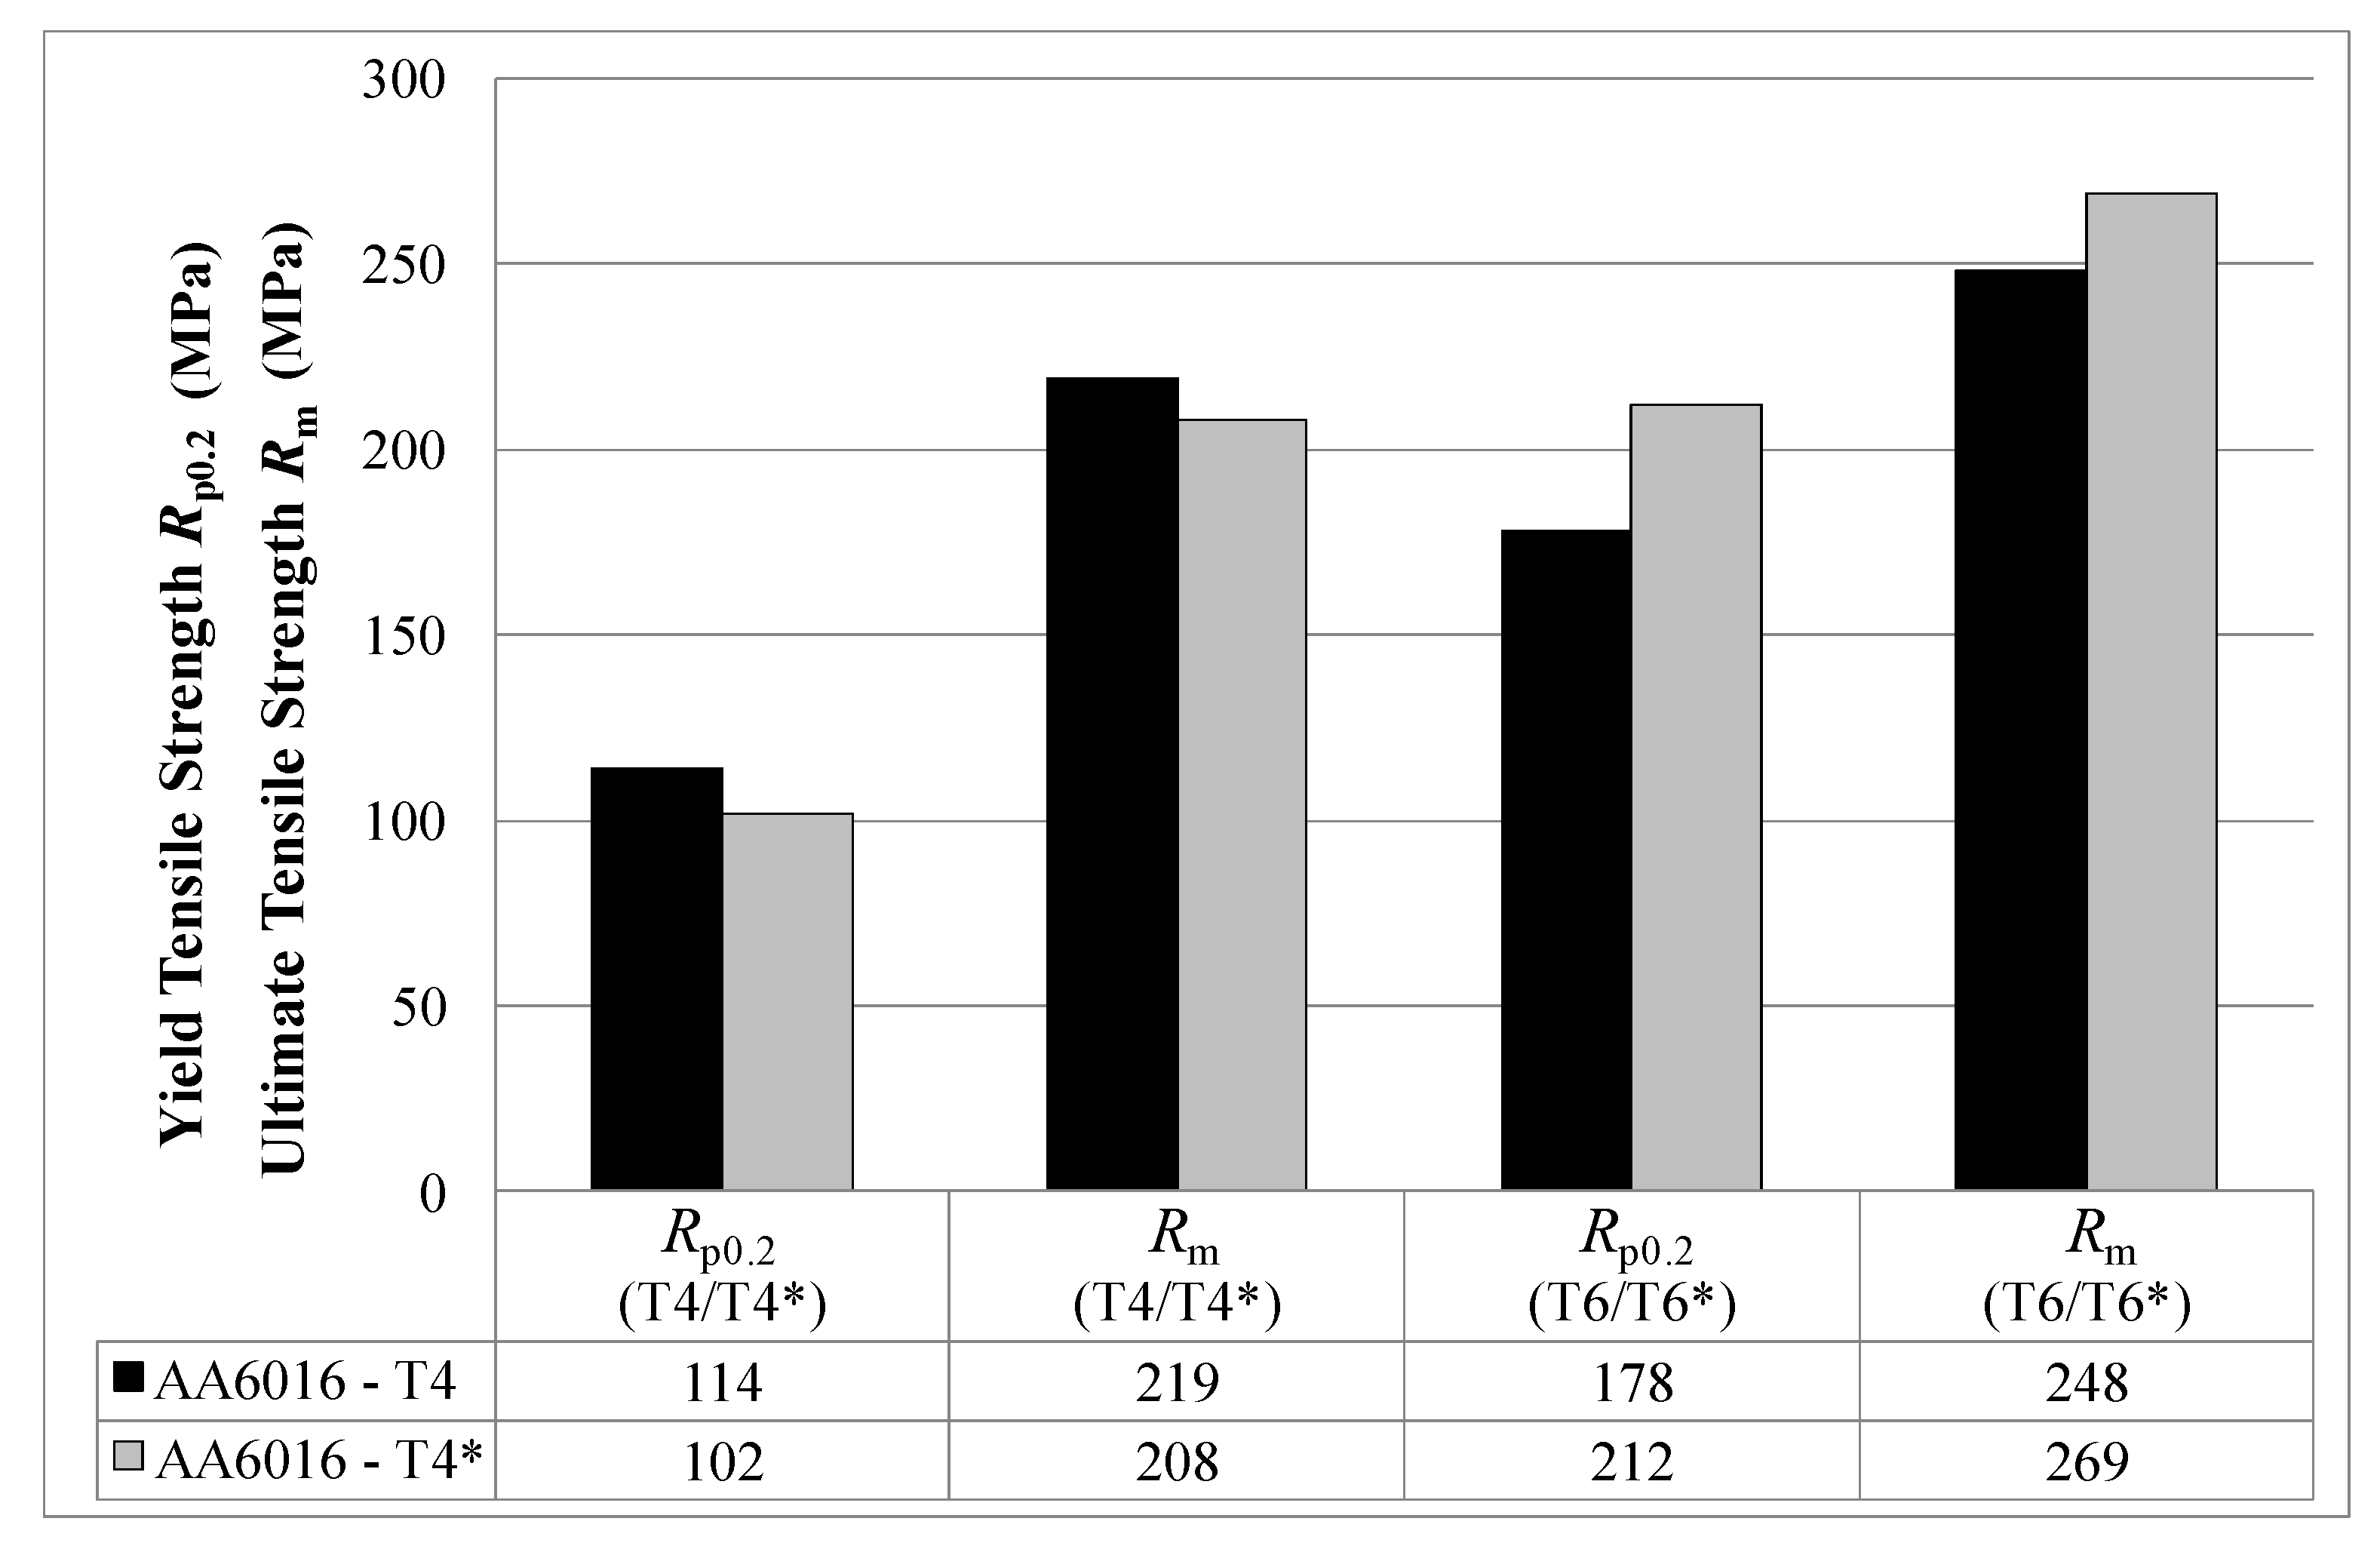
17]. This explanation is assumed to be the reason why the initial strength level of T4 is higher than for T4* (see
Figure 7). However, further atom probe analysis would be necessary to explain this more precisely.
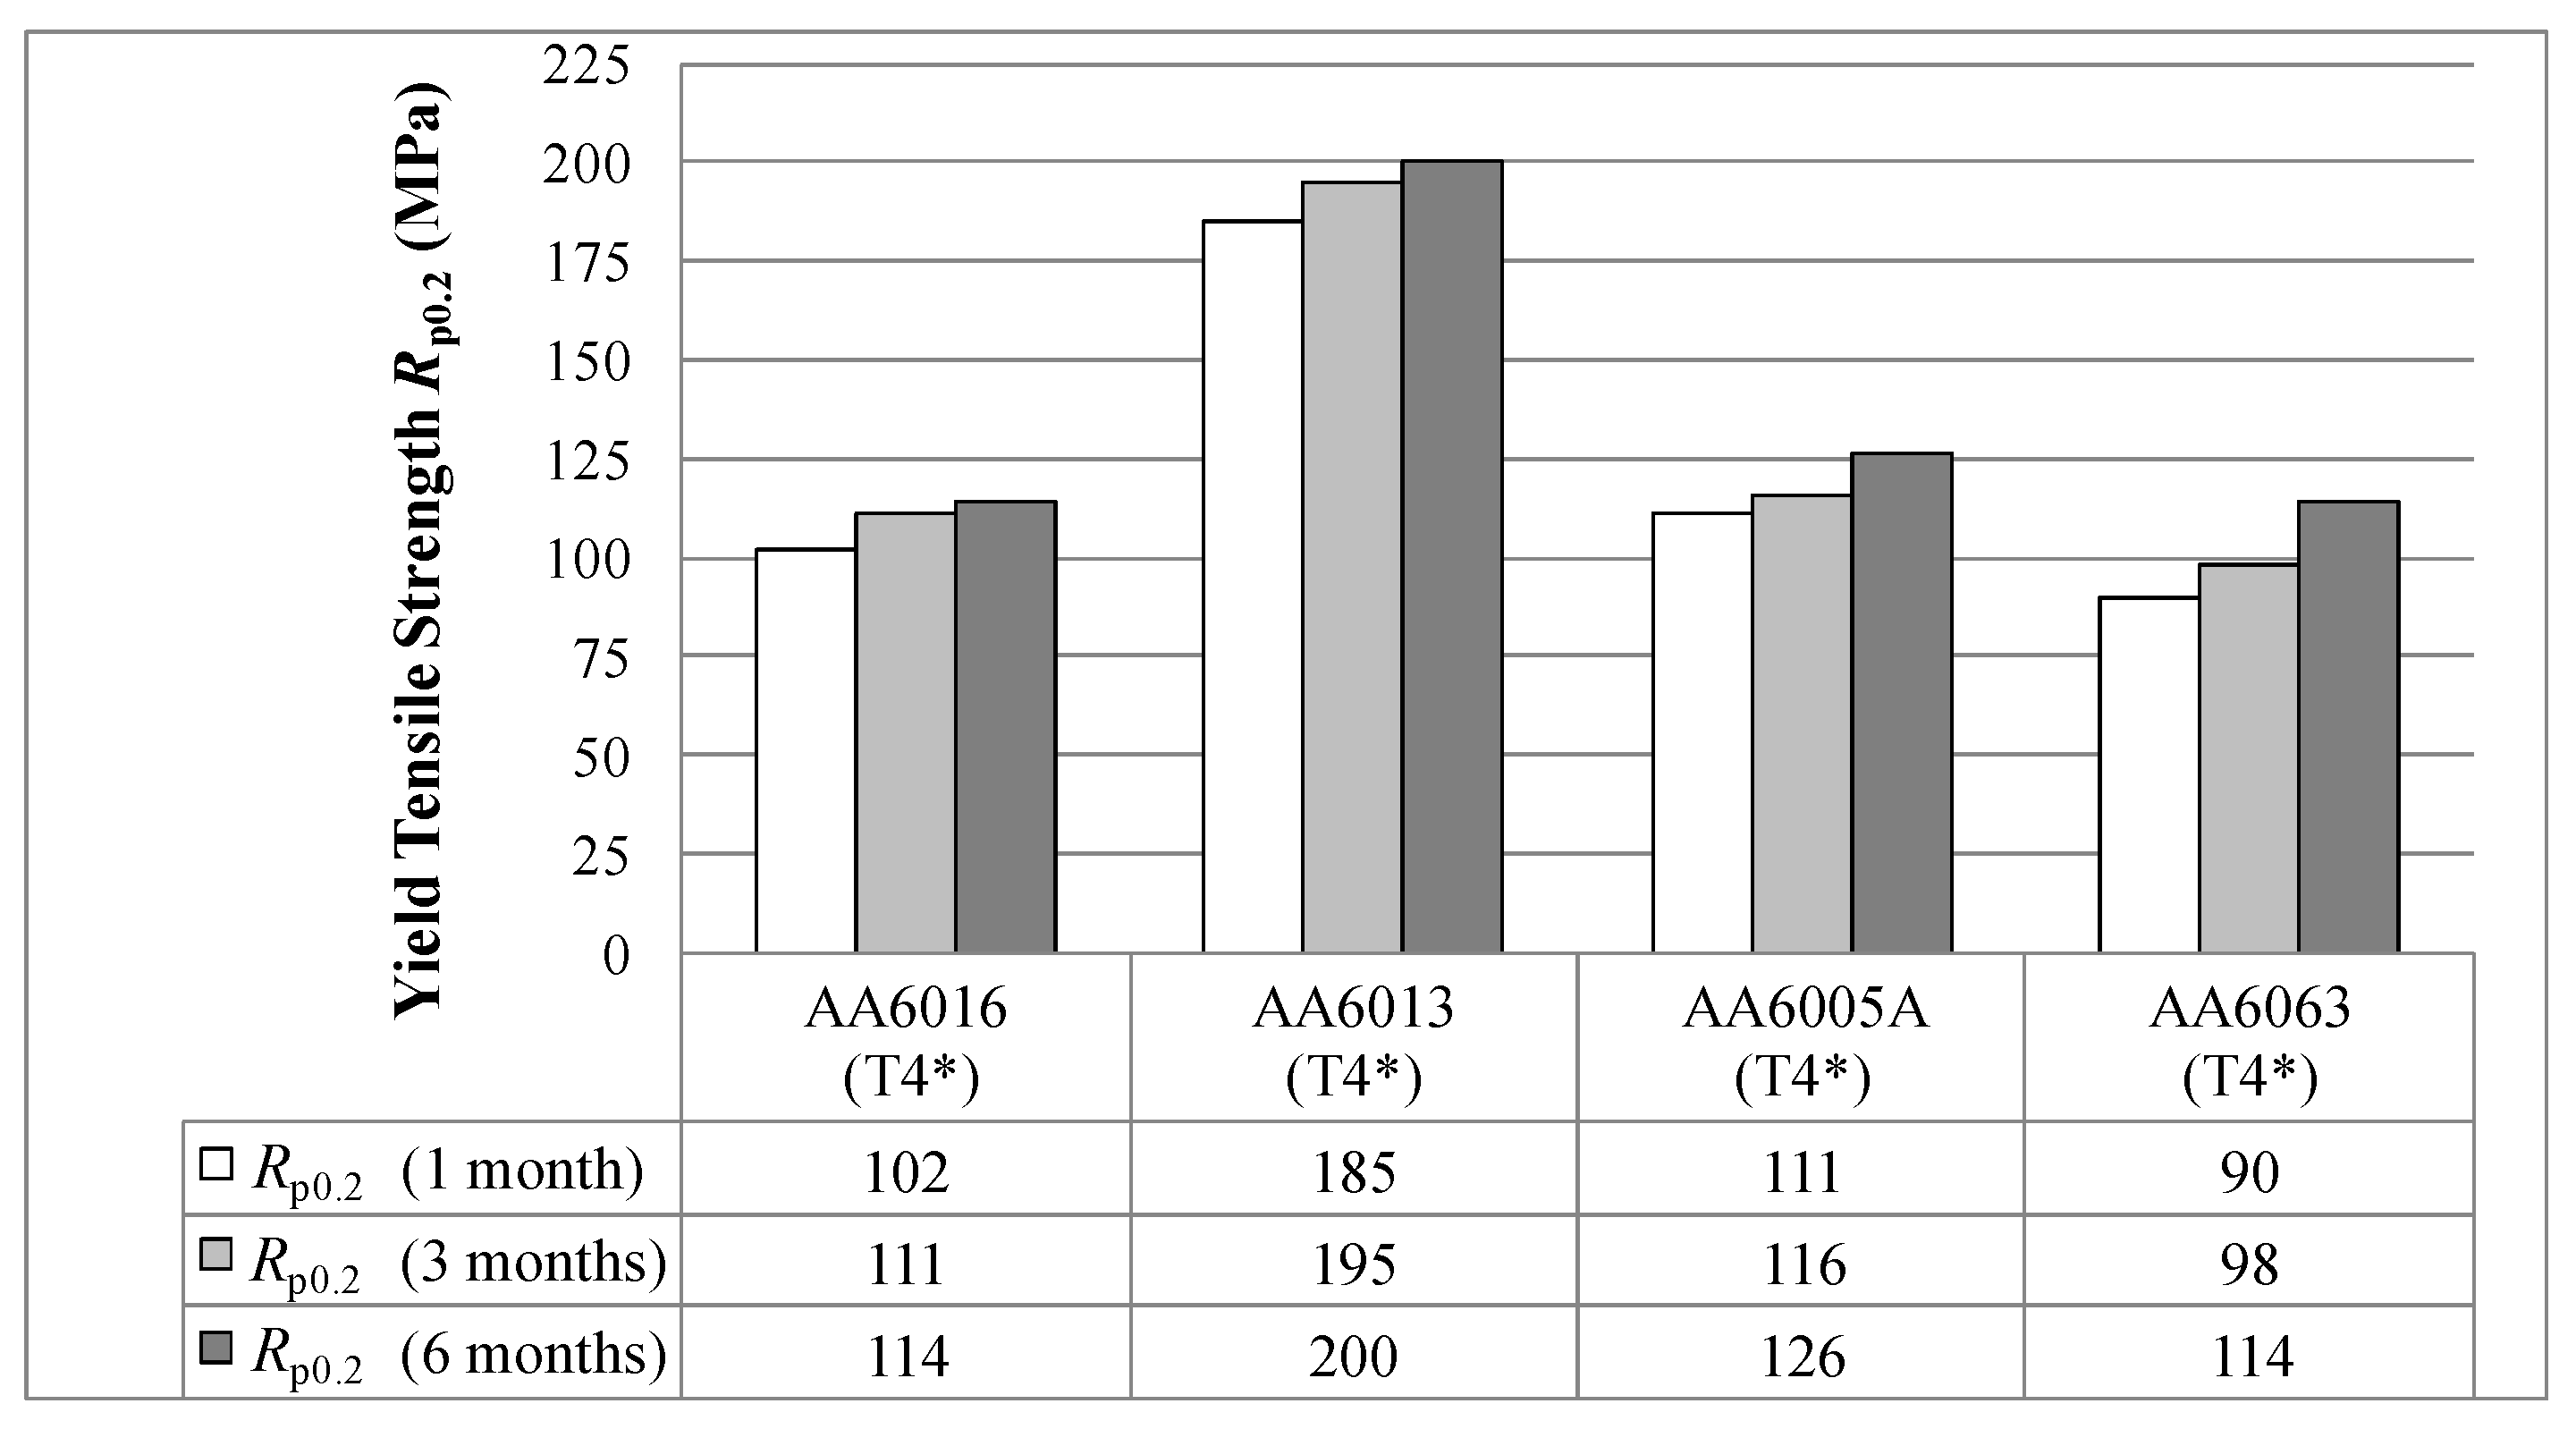
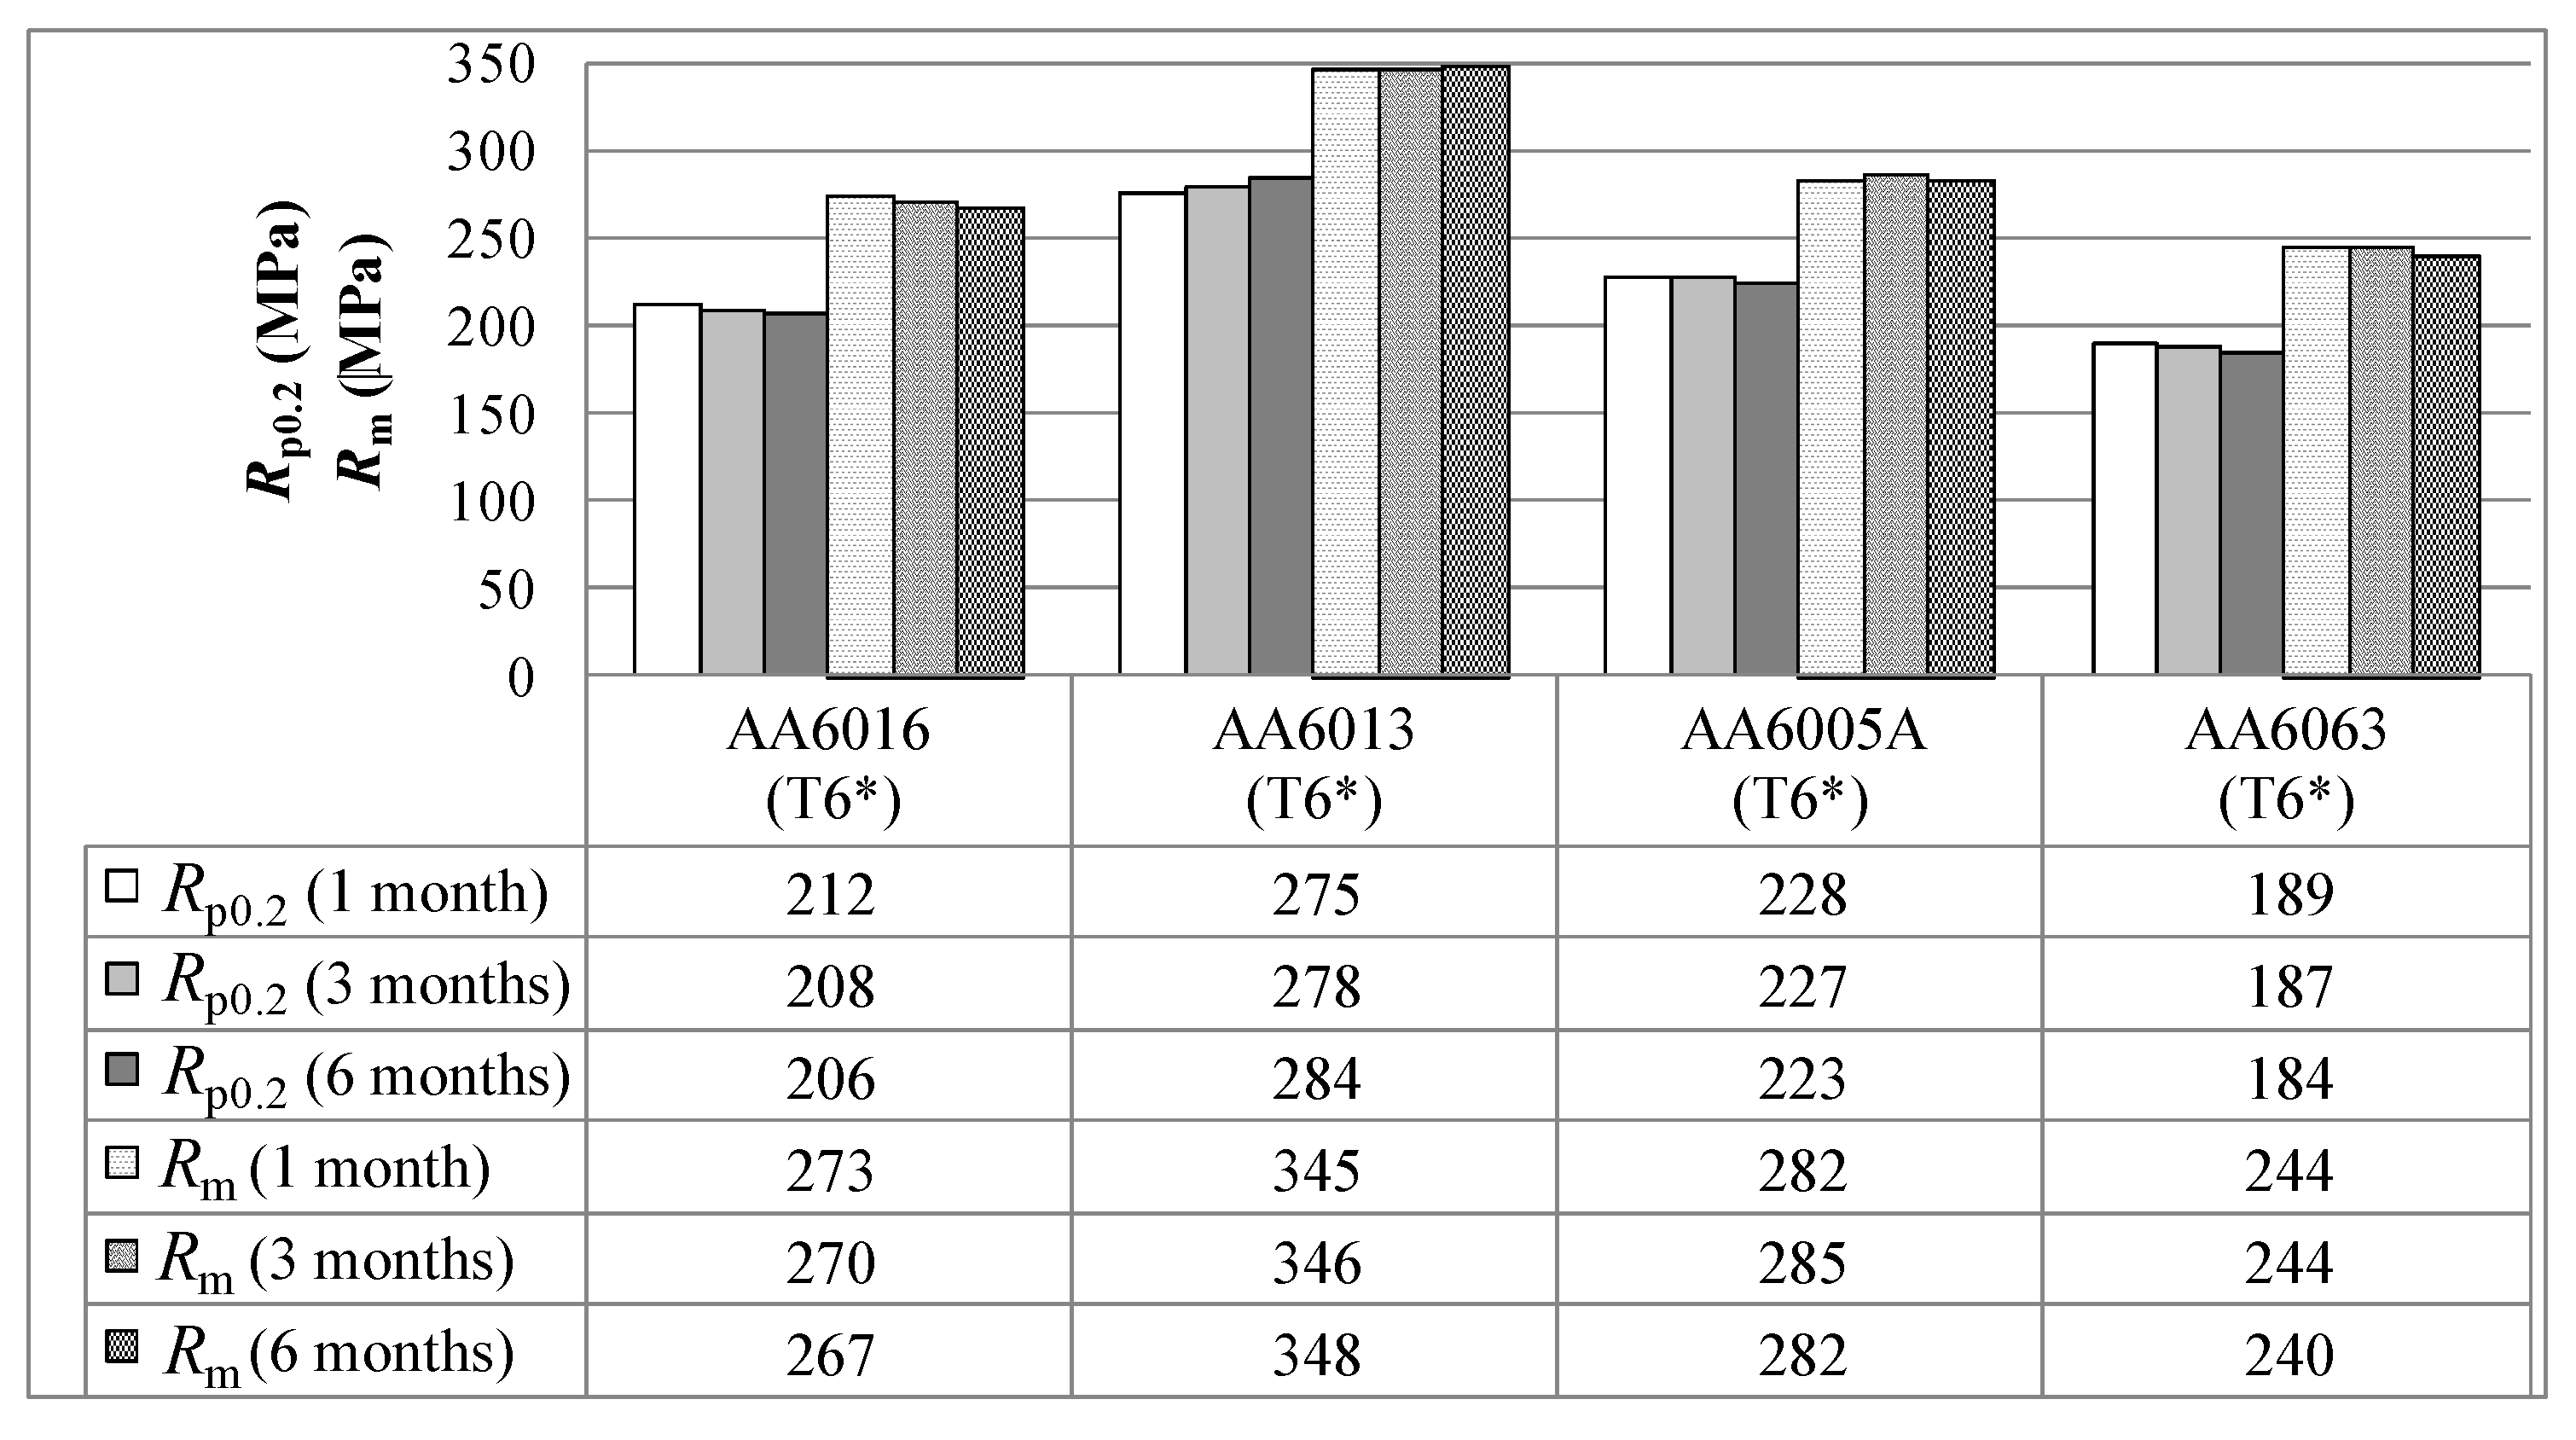
Pre-aging has been shown to reduce the effect of natural ageing, but it cannot be fully prevented during RT storage (see
Figure 5). The automotive industry must ensure quality restrictions for at least six months. Within this period, mechanical properties must remain within the specification limits and variations should be as low as is physically possible. For this purpose, the most “stable” of our alloys is AA6016 (in terms of absolute values), which does not change its yield strength significantly upon long-term storage (
Figure 5).
The 6xxx series aluminum alloys are characterized by their main alloying elements, Si and Mg, and the additions of Cu, Mn and Fe. As
Table 2 shows, the alloys studied exhibit different Si/Mg ratios. AA6016 shows the highest and, in consequence, also a high amount of Si in excess of the equilibrium precipitate phase Mg
2Si [
18], which forms in Al-Mg-Si alloys. It is known that a high Si/Mg ratio produces an increased strengthening coefficient, which improves the formability of the alloy [
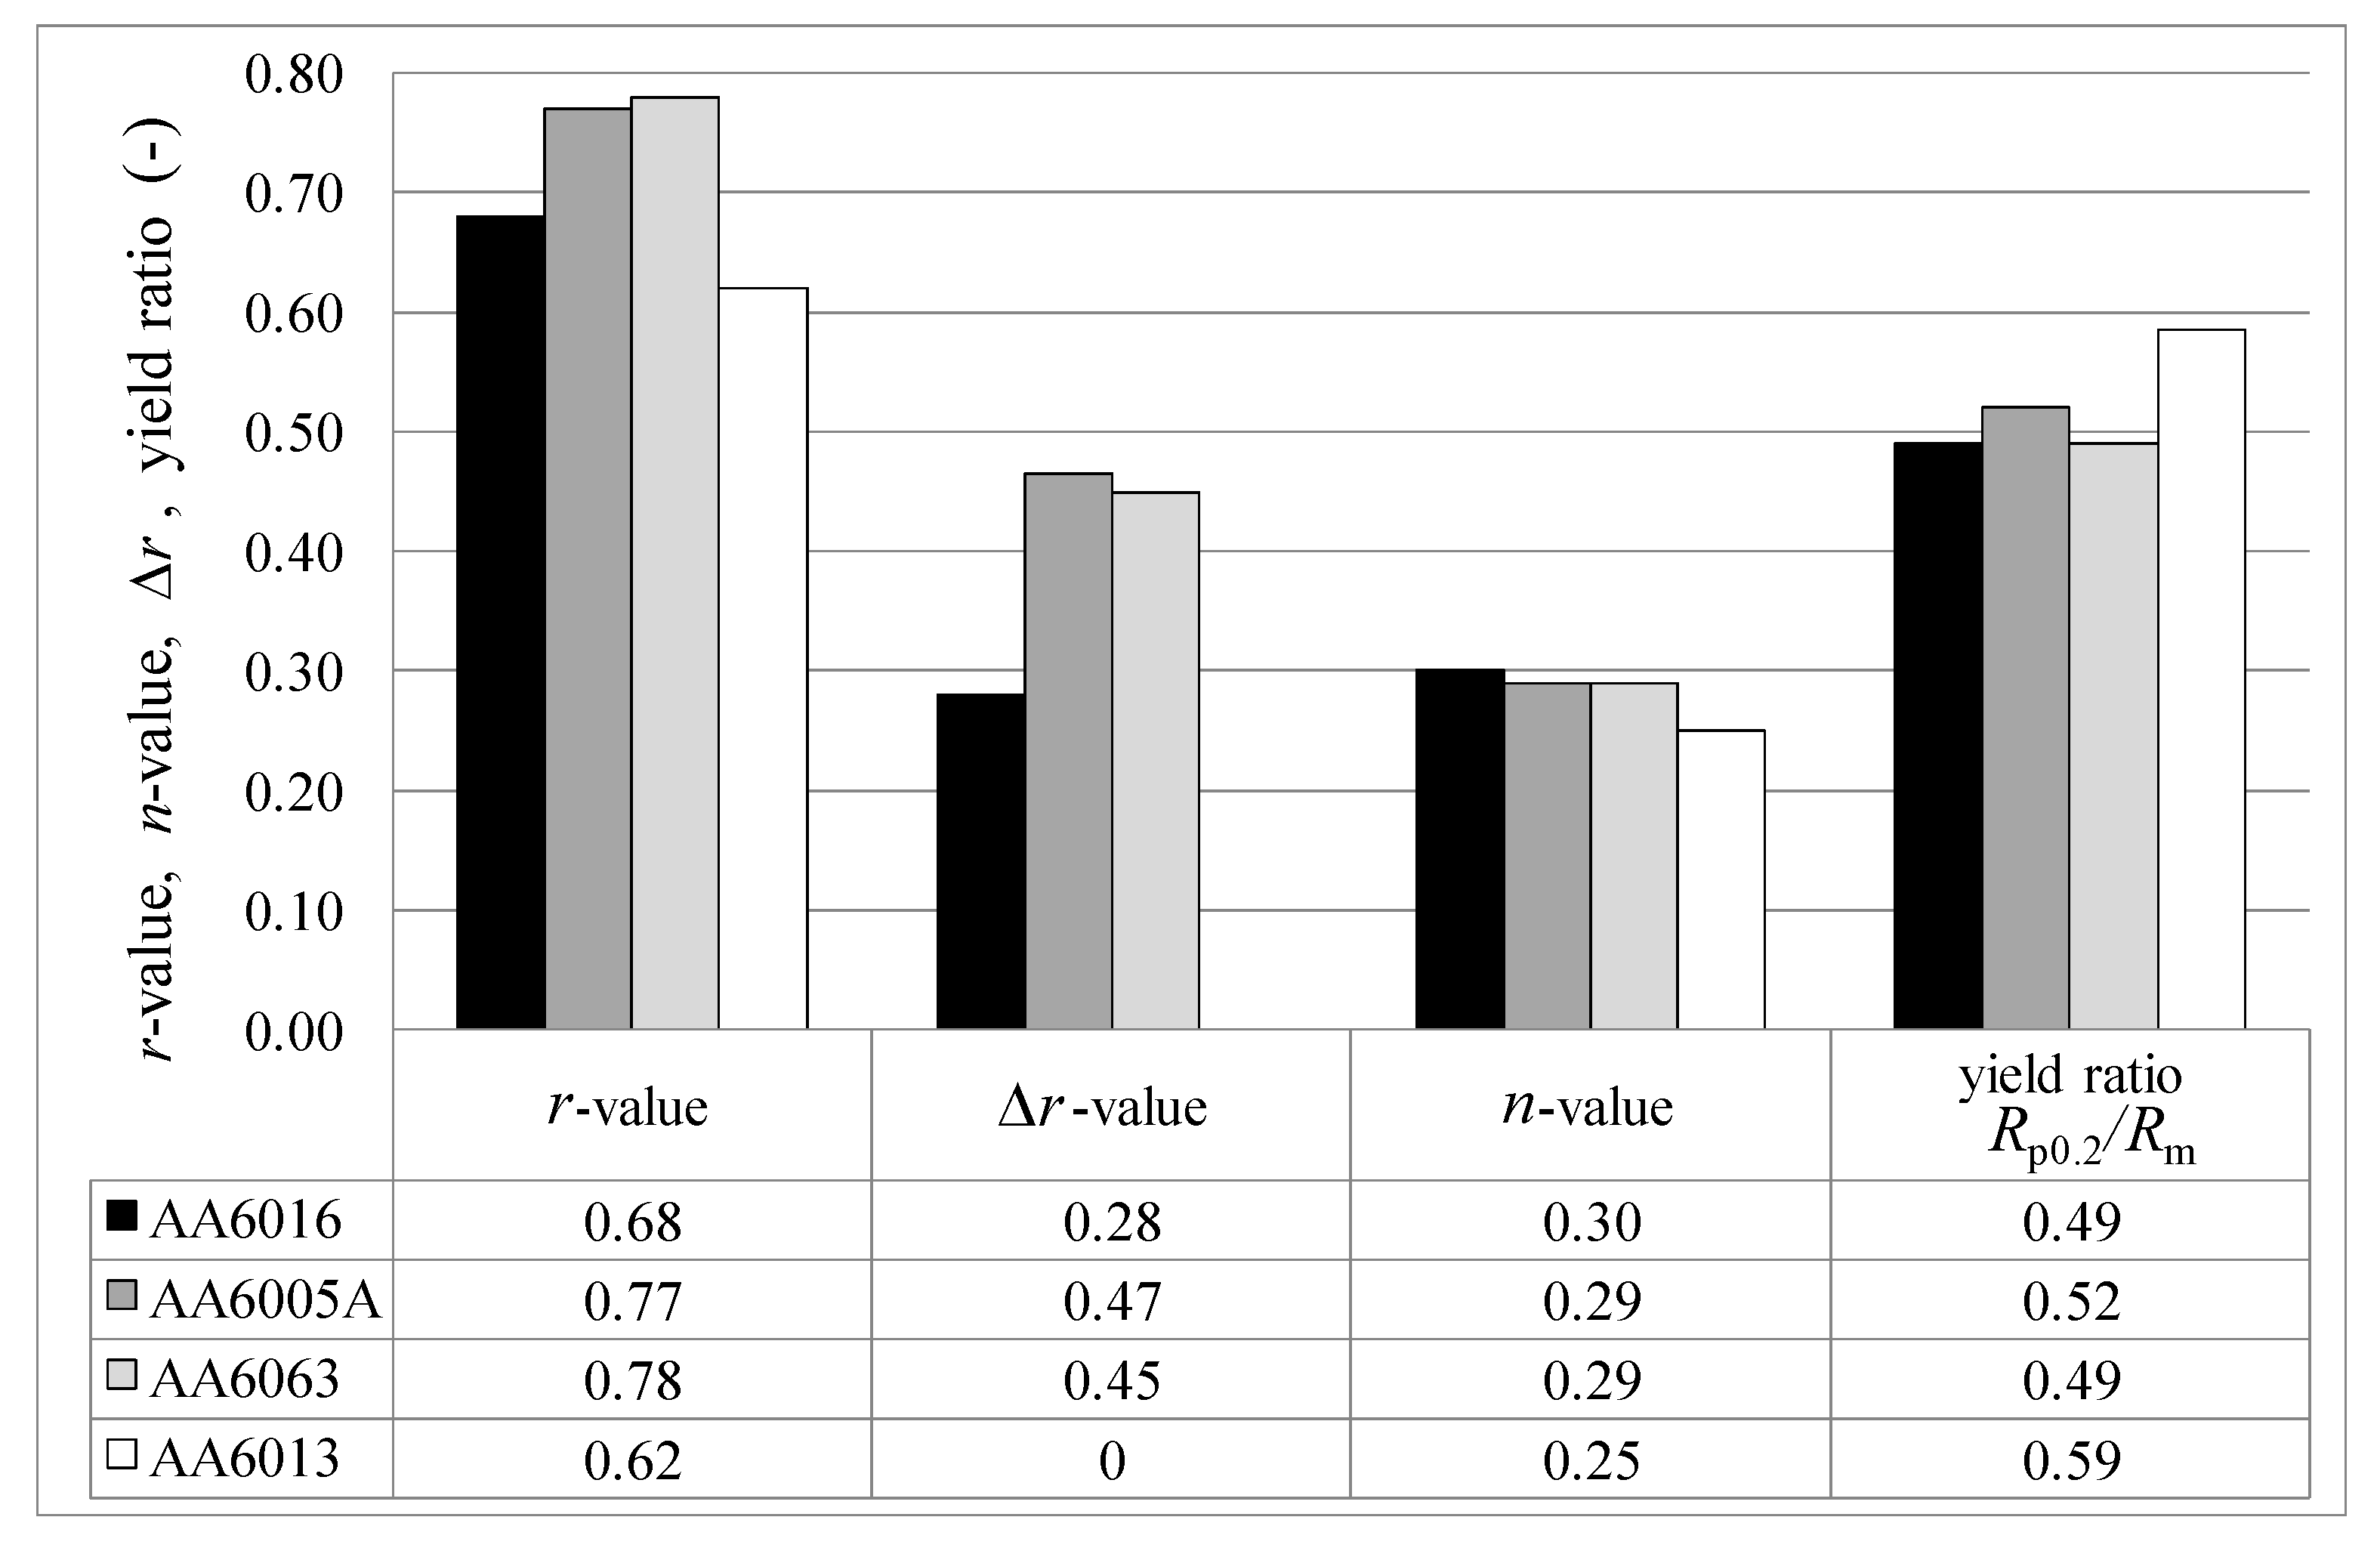
19]. This effect was also observed in the present study. Accordingly, AA6016 reaches the highest
n-value, whereas AA6013, which exhibits a higher amount of Mg than Si, exhibits a lower
n-value (
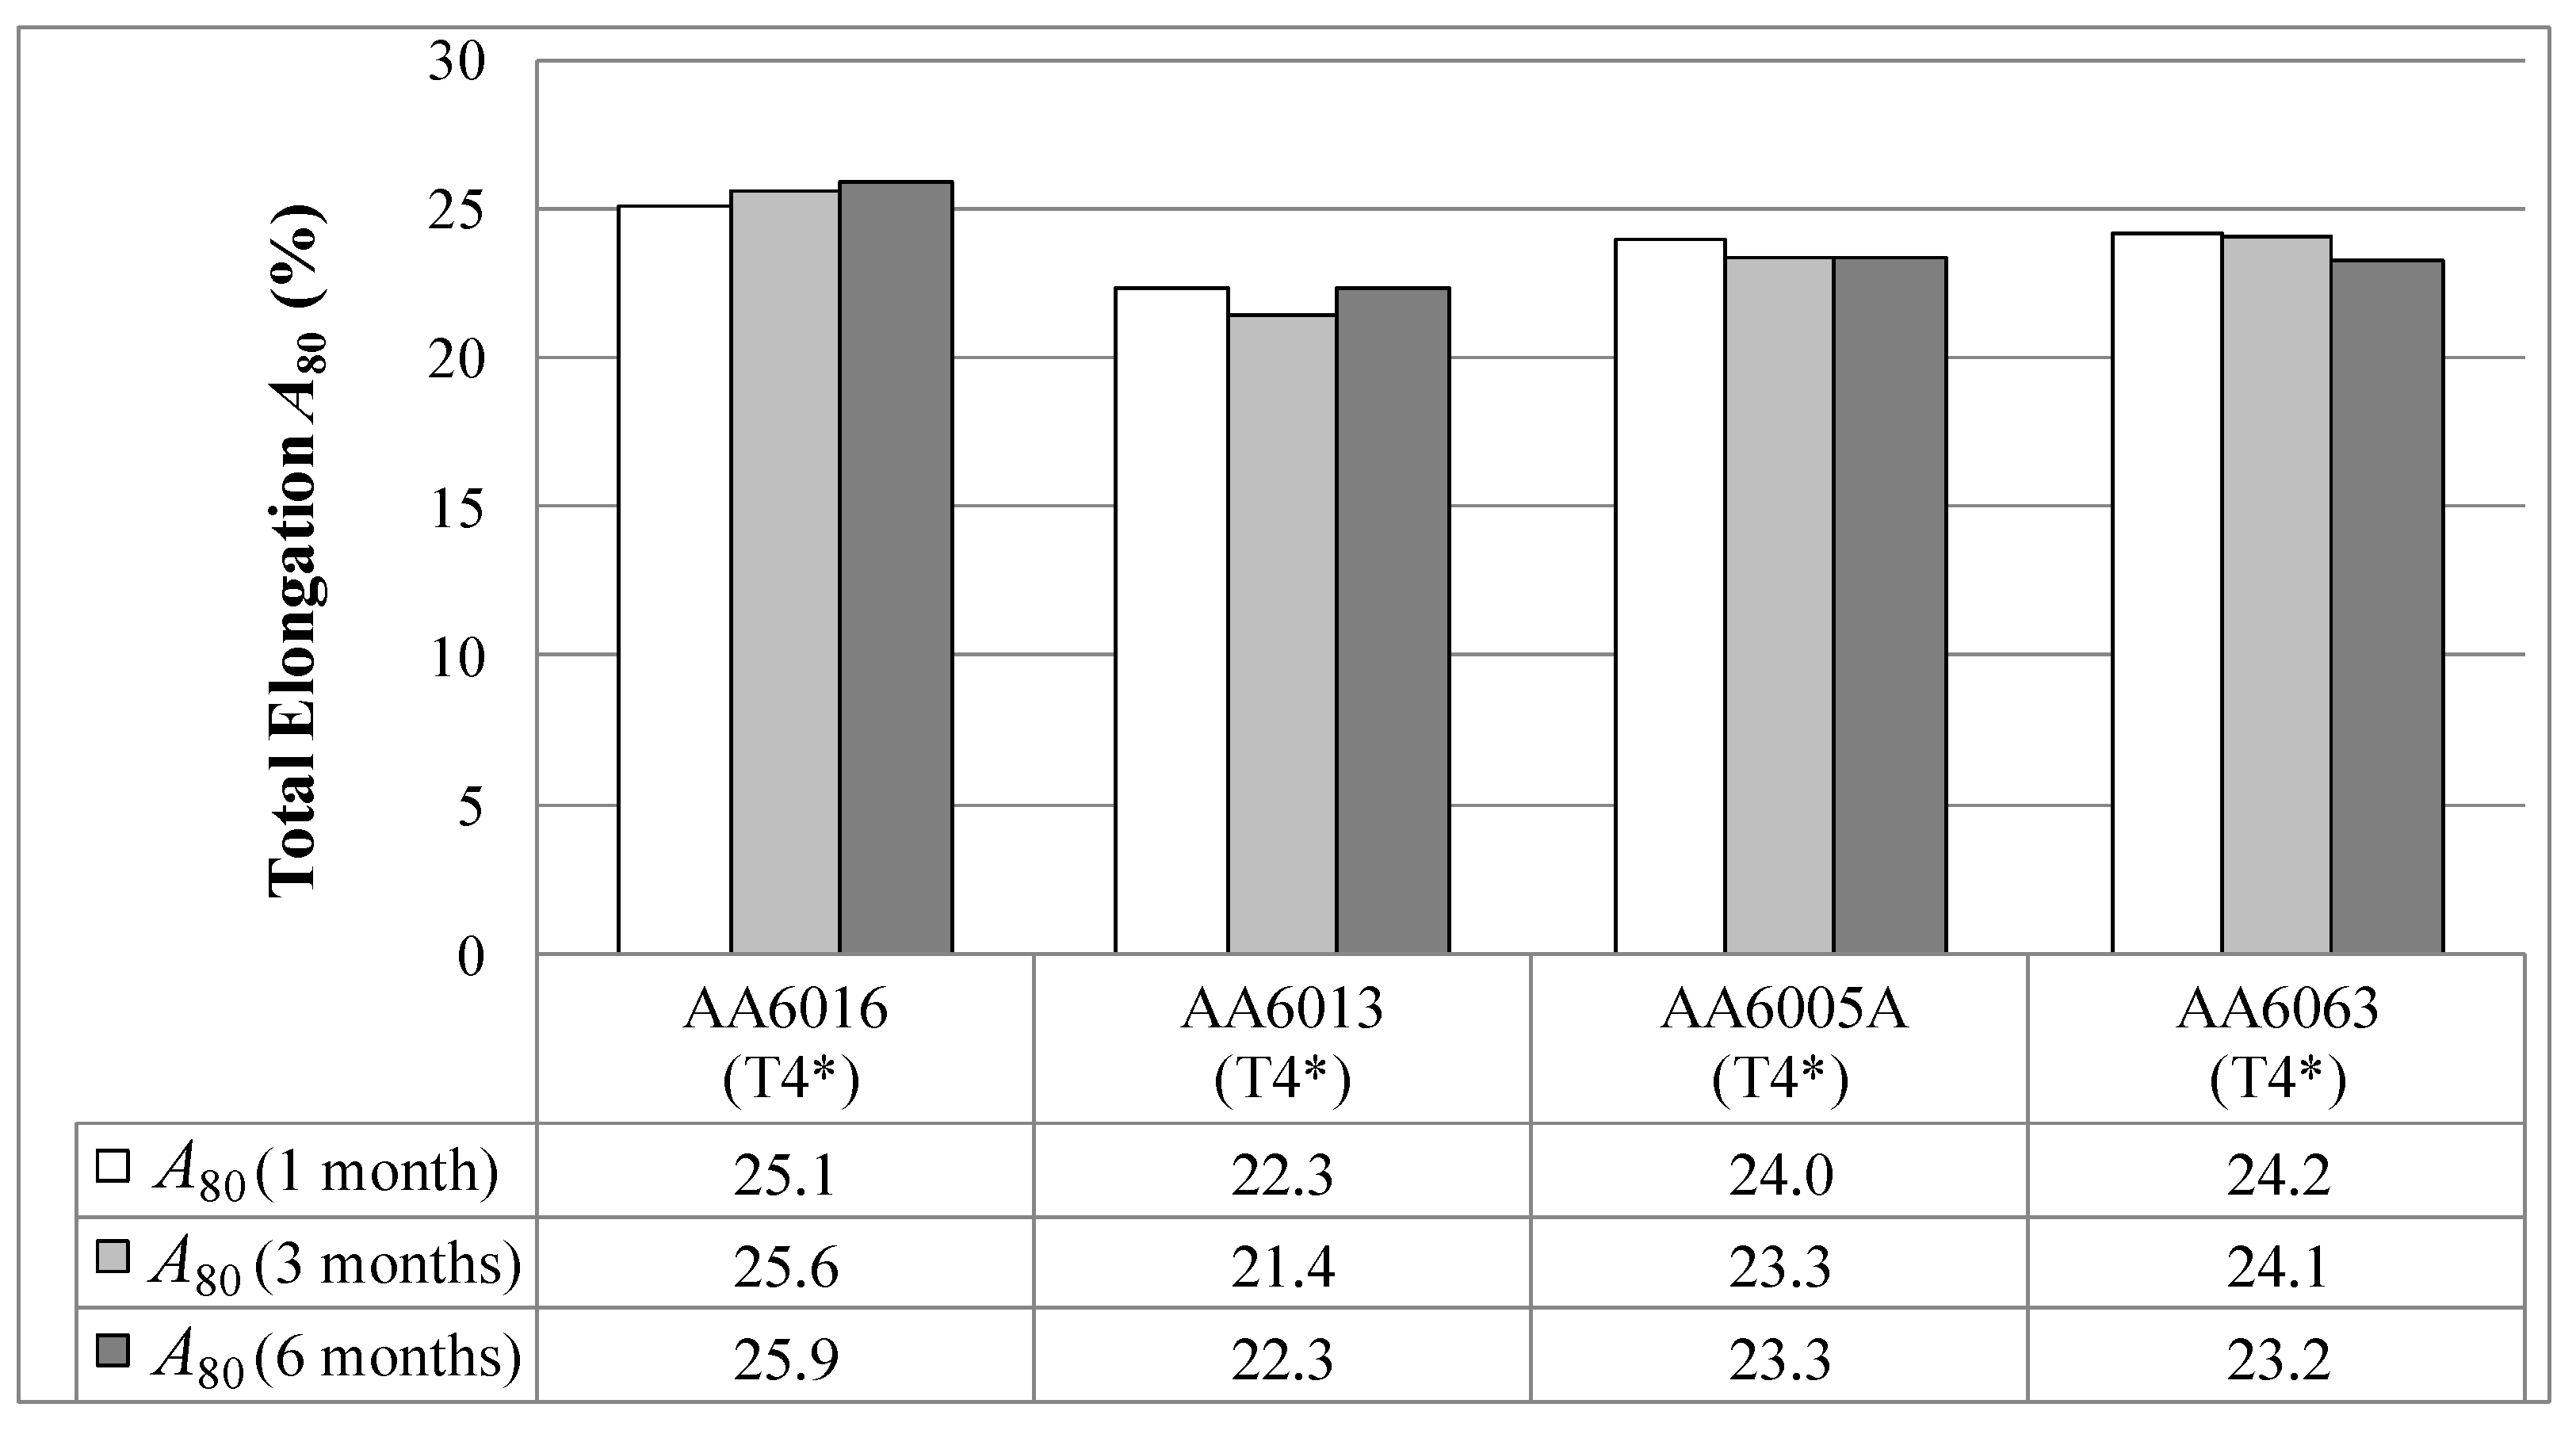
Figure 9). Due to the observed lower elongation of AA6005A and AA6063 in comparison to AA6016, a lower Si/Mg ratio may also generate lower elongation values (
Figure 8).
Alloy AA6013 was found to exhibit better strength levels than the other alloys in tempers T4* and T6*. This is simply because of its chemical composition. Adding copper to Al-Mg-Si alloys refines the precipitate structure, induces the strengthening phase Q’ (Cu-containing phase) and, therefore, increases the strength level [
20]. The relatively high Mn-content in AA6013 was also shown to increase its initial strength, presumably due to solid solution hardening [
21]. In contrast, AA6063 provides the lowest strength, both in tempers T4* and in T6*. This alloy contains nearly no Cu and Mn, and the Mg and Si content is also comparably low.
The higher T6* strength of alloy AA6005A compared to AA6063 can be dedicated to its higher content of hardening elements. Although the amount of Mg + Si is comparable in AA6005 and AA6016, AA6005 offers a higher T6* strength. This might be related to its well-balanced Si/Mg ratio. It is assumed that because of the close compositional relationship between alloy AA6005 and the major hardening precipitate (probably β'' = Mg
5Si
6 [
22]), a higher number density is formed, which, in turn, generates higher strength in T6* temper [
23]. Note that the paint bake response of the investigated alloys is better if pre-ageing was carried out directly after solution annealing (compare T6 and T6* in
Figure 7). It is assumed that the Mg,Si clusters formed during the pre-aging with subsequent natural aging exceed a critical size, which makes them more stable than those in the naturally aged T4 state [
24]. The stable clusters can act as nuclei for the β'' precipitation during subsequent artificial aging and, therefore, enhance the artificial aging kinetics [
16]. We have discussed T4* and T6* tempers in more detail than tempers T4 and T6, because T4* and T6* are more important conditions for future applications.
Anisotropy plays an important role during forming processes and can lead to earing during deep drawing. Some characteristics of anisotropy can already be deduced from tensile tests, as shown in
Section 3.1. Materials with a high vertical anisotropy
r-value possess high resistance to plastic flow in the direction of the sheet thickness. The strain-hardening exponent
n can be considered as an indicator of the maximum attainable deformation during cold forming. The higher the n-value and, consequently, the higher the uniform strain, the lower the tendency of the material to neck locally. AA6013 shows the most uniform
r-value in all rolling directions, with a plane anisotropy of zero (
Figure 9). Normally the
r-value in the 45° direction is much lower than the values for 0° and 90° in Al-Mg-Si alloys, but AA6013 exhibits a very high
r-value at 45° to the rolling direction of 0.78. Because
r-values correlate with the rolling texture, it can be assumed that the high Cu-content and the low Si/Mg ratio in AA6013 influence the rolling texture positively. Further, texture investigations would be necessary to address this result more precisely.
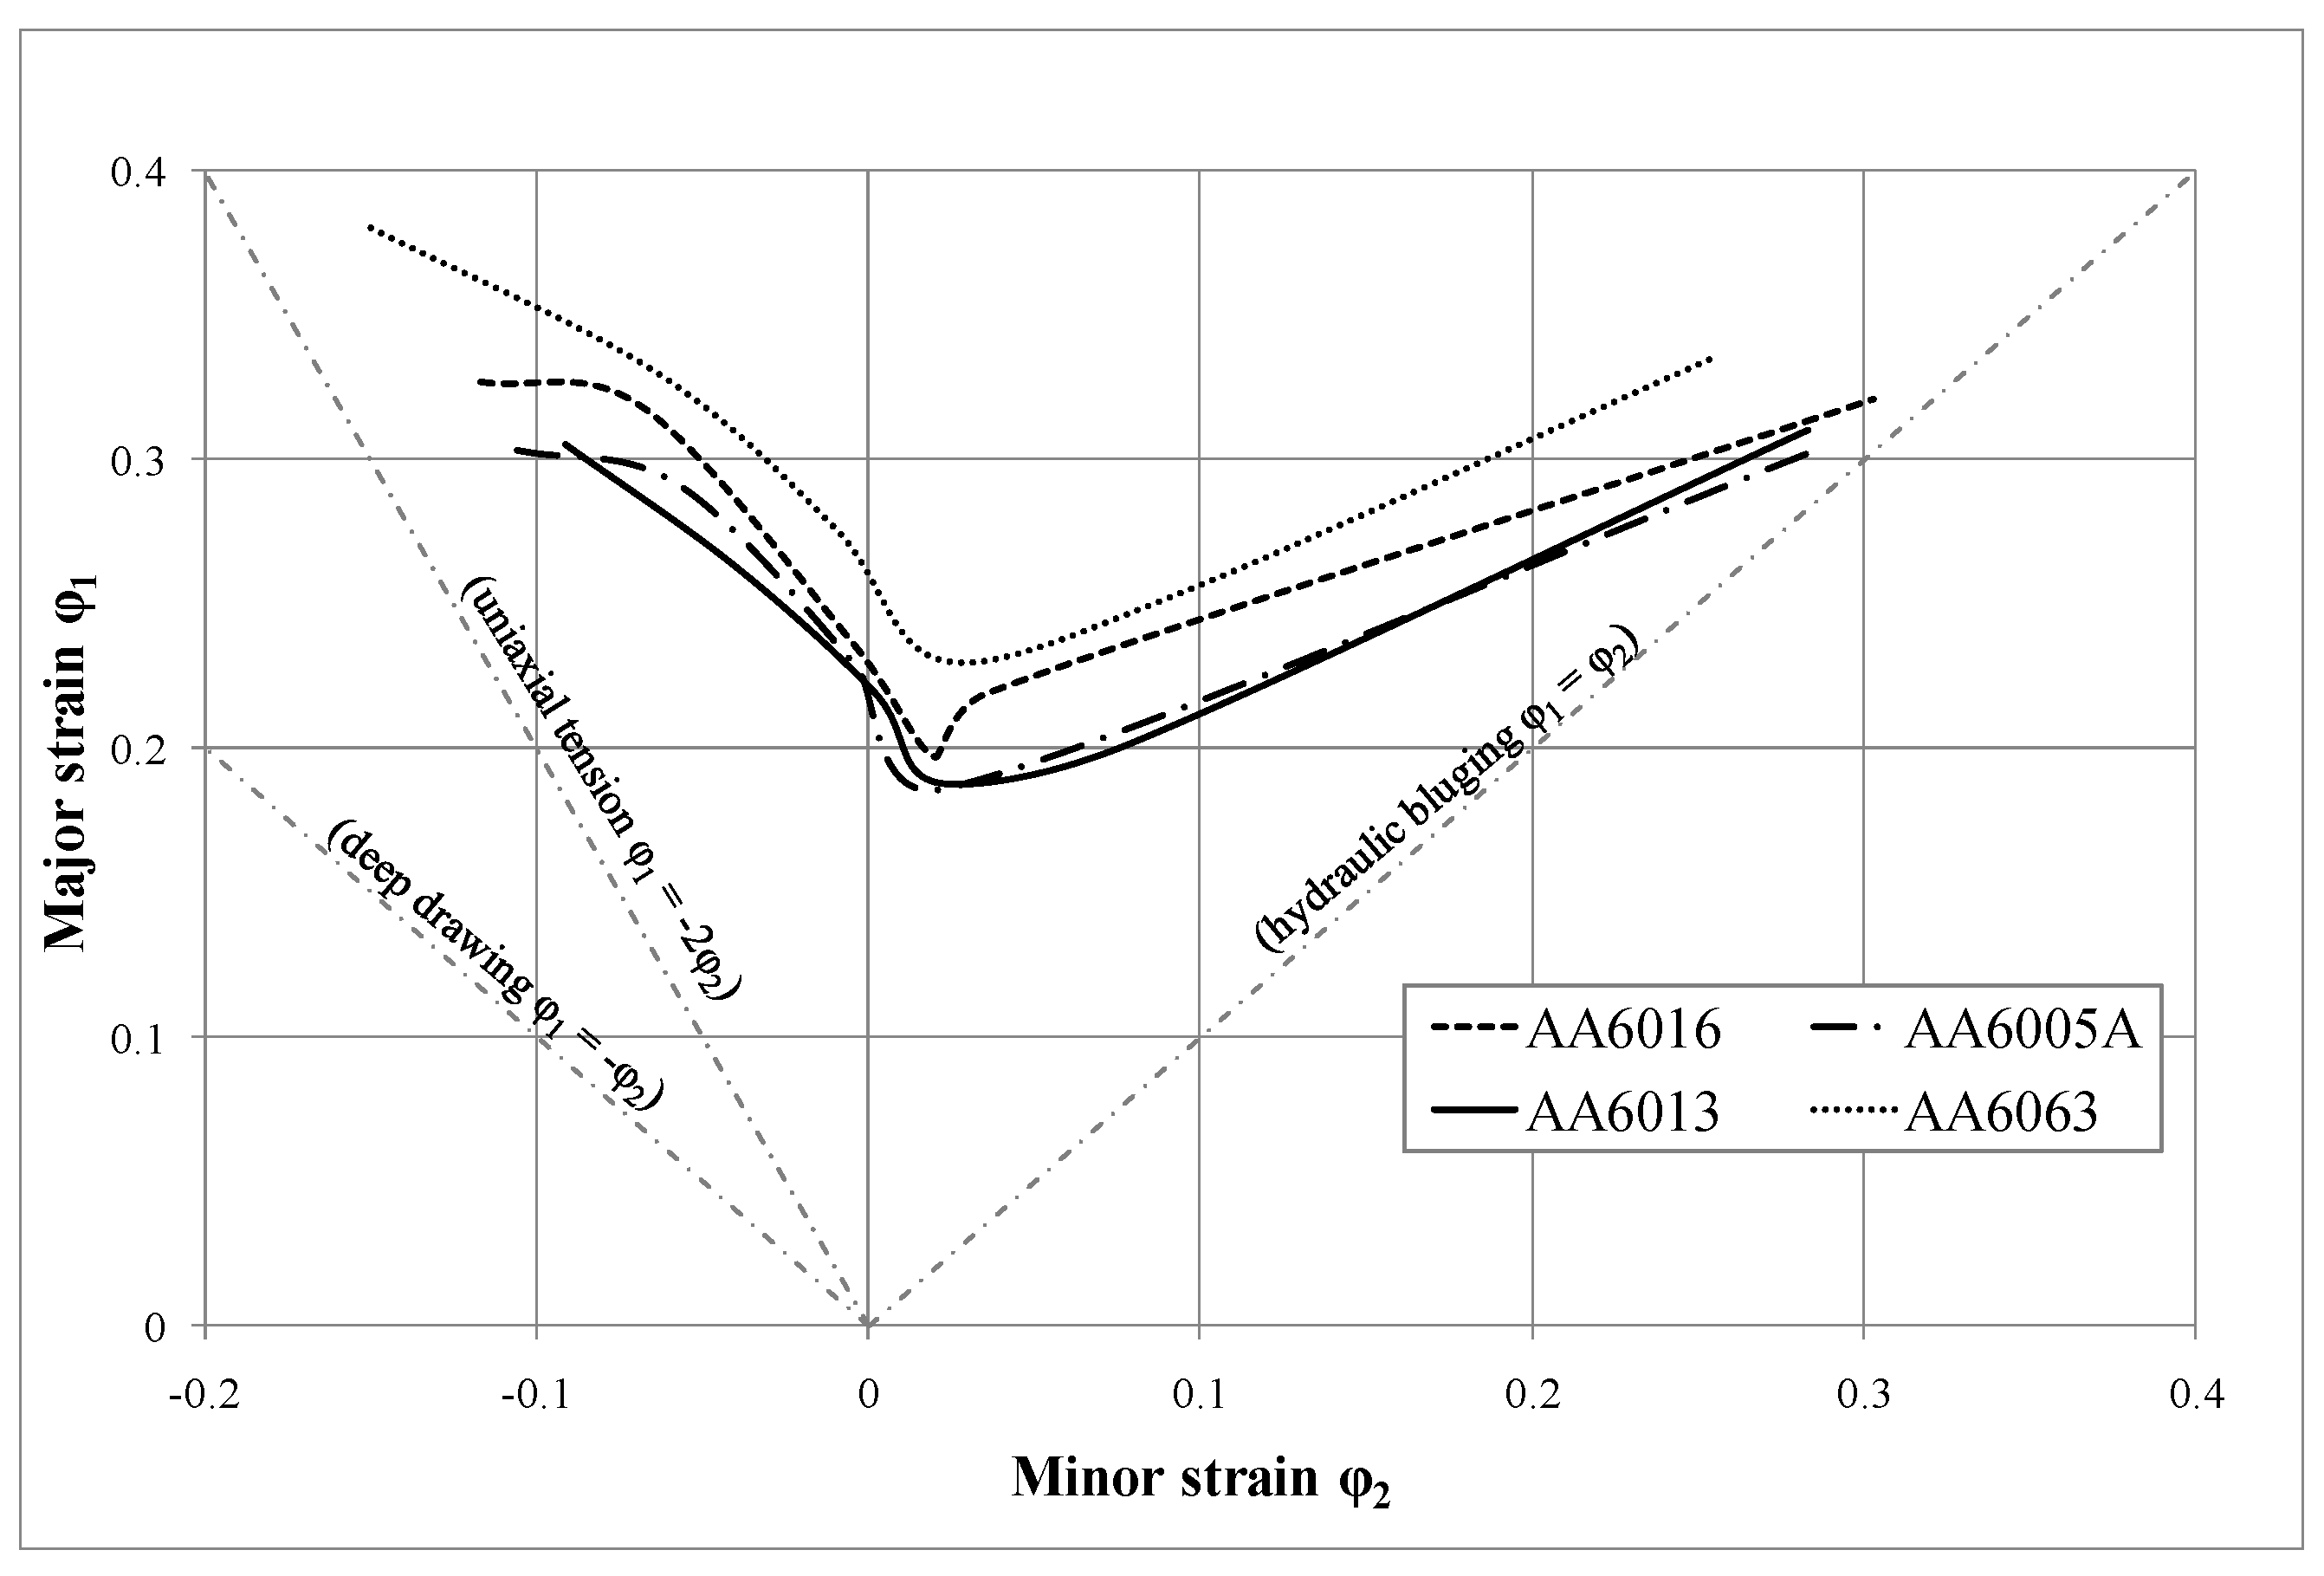
4.2. Formability
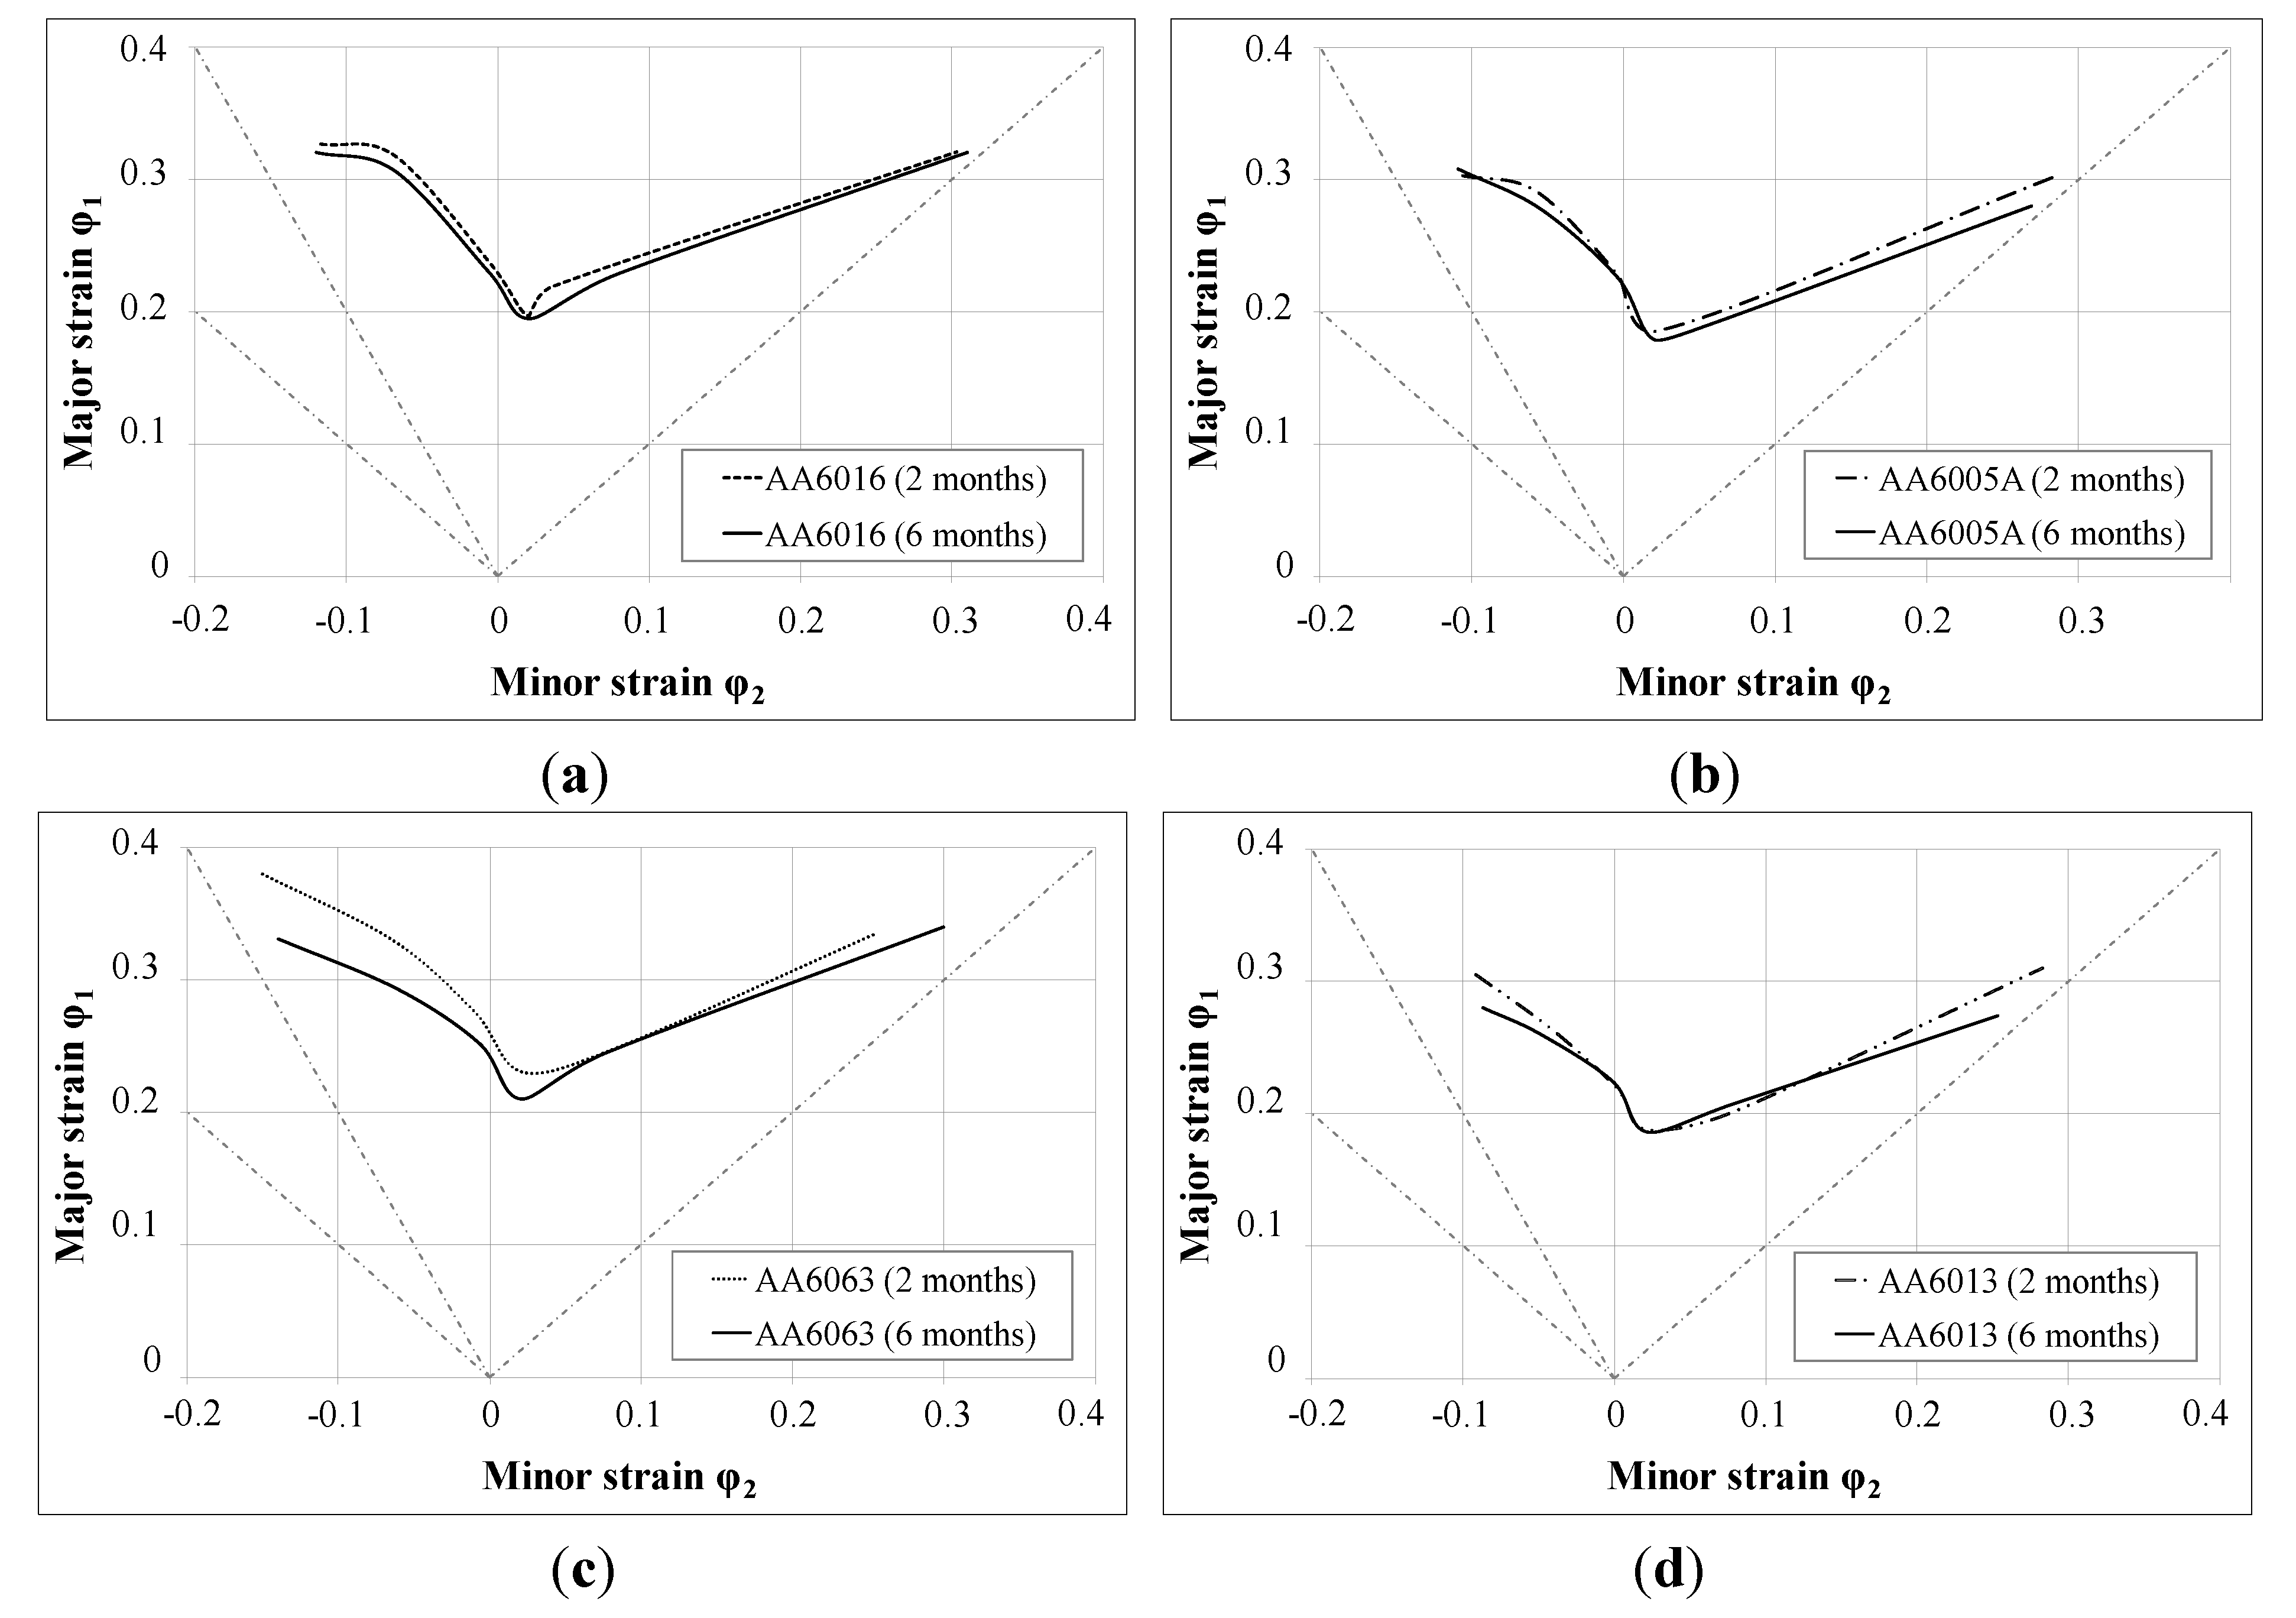
Using forming limit curves (illustrated for the investigated alloys in the T4* temper in
Figure 10 and
Figure 11), it is possible to determine process limitations in sheet metal forming in the case of a linear strain path (e.g., necking and tearing). AA6063 provides the most promising FLC, which is presumably related to its lower strength level and lower amount of main alloying in comparison to the other alloys (
Figure 5). Although AA6013 shows the highest strength during tensile testing (
Figure 5), the FLC is almost comparable to AA6005A. A detailed explanation of this result is outside the scope of this paper, but a correlation with the very low plane anisotropy
∆r of AA6013 (due to the high
r-value at 45°) is assumed. In general, FLCs are not strongly influenced by RT storage after sheet production, which is a rather satisfying result in view of the requirements of the automotive industry (
Figure 11). However, alloy AA6063 showed the strongest, though moderate, influence of storage, which can be related to the yield strength increase upon storage, which was also highest for AA6063 (
Figure 5).
In addition to the Nakazima tests (FLC), hole-expansion tests, bending tests and deep-drawing tests in a cross-die were conducted to characterize the forming behavior of the materials investigated in this study. Test procedure limitations make it necessary to carry out more than one forming test to analyze the formability of a sheet metal and to predict its behavior during industrial forming processes.
Hemming is a typical assembly method used in the automotive industry to join the outer sheet to the inner part of hang-on body panels. The requirements on an alloy that is subjected to hemming are tough, because the material has to withstand strong bending over a radius equal to half of the sheet thickness. Therefore, high aluminum sheet bendability is a desirable property in the production of an automotive body panel. It has been shown that a high yield strength in temper T4* generates low bendability [
25,
26]. Failure during bending of Al-Mg-Si alloys can occur through intergranular fracture due to the presence of grain boundary particles [
27]. Strain localization and intense shearing in relation to micro-void formation around large phase particles can also cause fracture during bending [
28]. AA6016 and AA6063 showed the best bending performance (they exhibit the lowest
Rp0.2 in T4*; see
Figure 5) compared to AA6005A and AA6013 (
Table 3). The poor bending performance of AA6013 may be related, on the one hand, to its Cu-content: copper tends to form grain boundary precipitates. On the other hand, large intermetallic particles can also influence the bendability negatively [
19]. Industrially produced Al-Mg-Si alloys always contain iron. This governs the formation of intermetallic Al-Fe-Si-(Mn) particles, which influence the formability negatively. In Al-Mg-Si alloys, β-AlFeSi and α-AlFeSi particles are mainly present. These particles form during solidification and homogenization of as-cast ingots and do not dissolve when the alloy is further heat-treated. The α-particles have a more globular morphology than the plate-like β-particles, which are known to promote the formation of voids during deformation [
29,
30,
31,
32]. AA6013 and AA6005A contain more Fe and Mn, which also matches the observed trend in the bending angle (
Table 3).
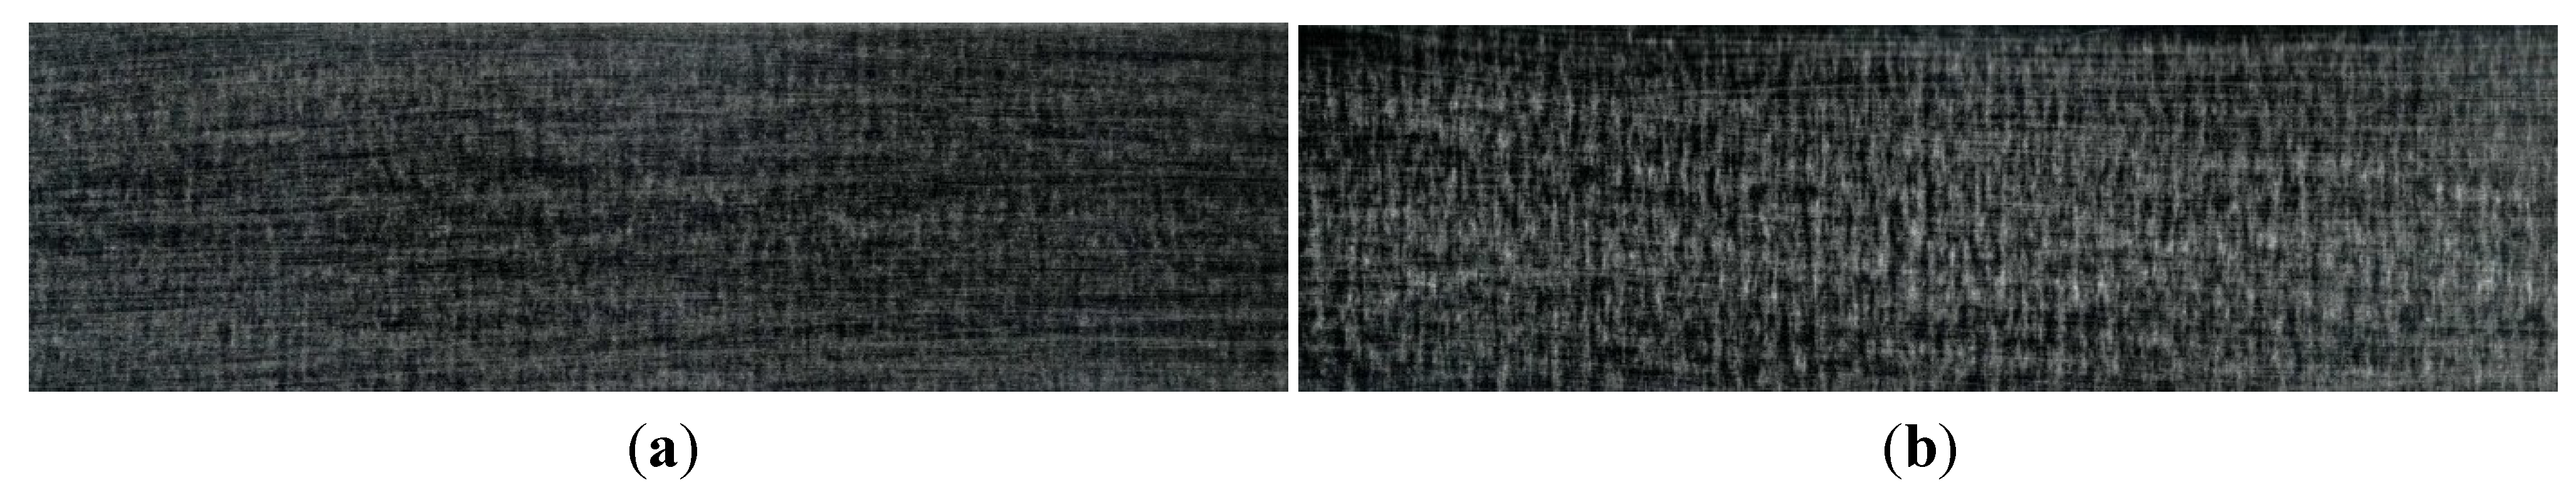
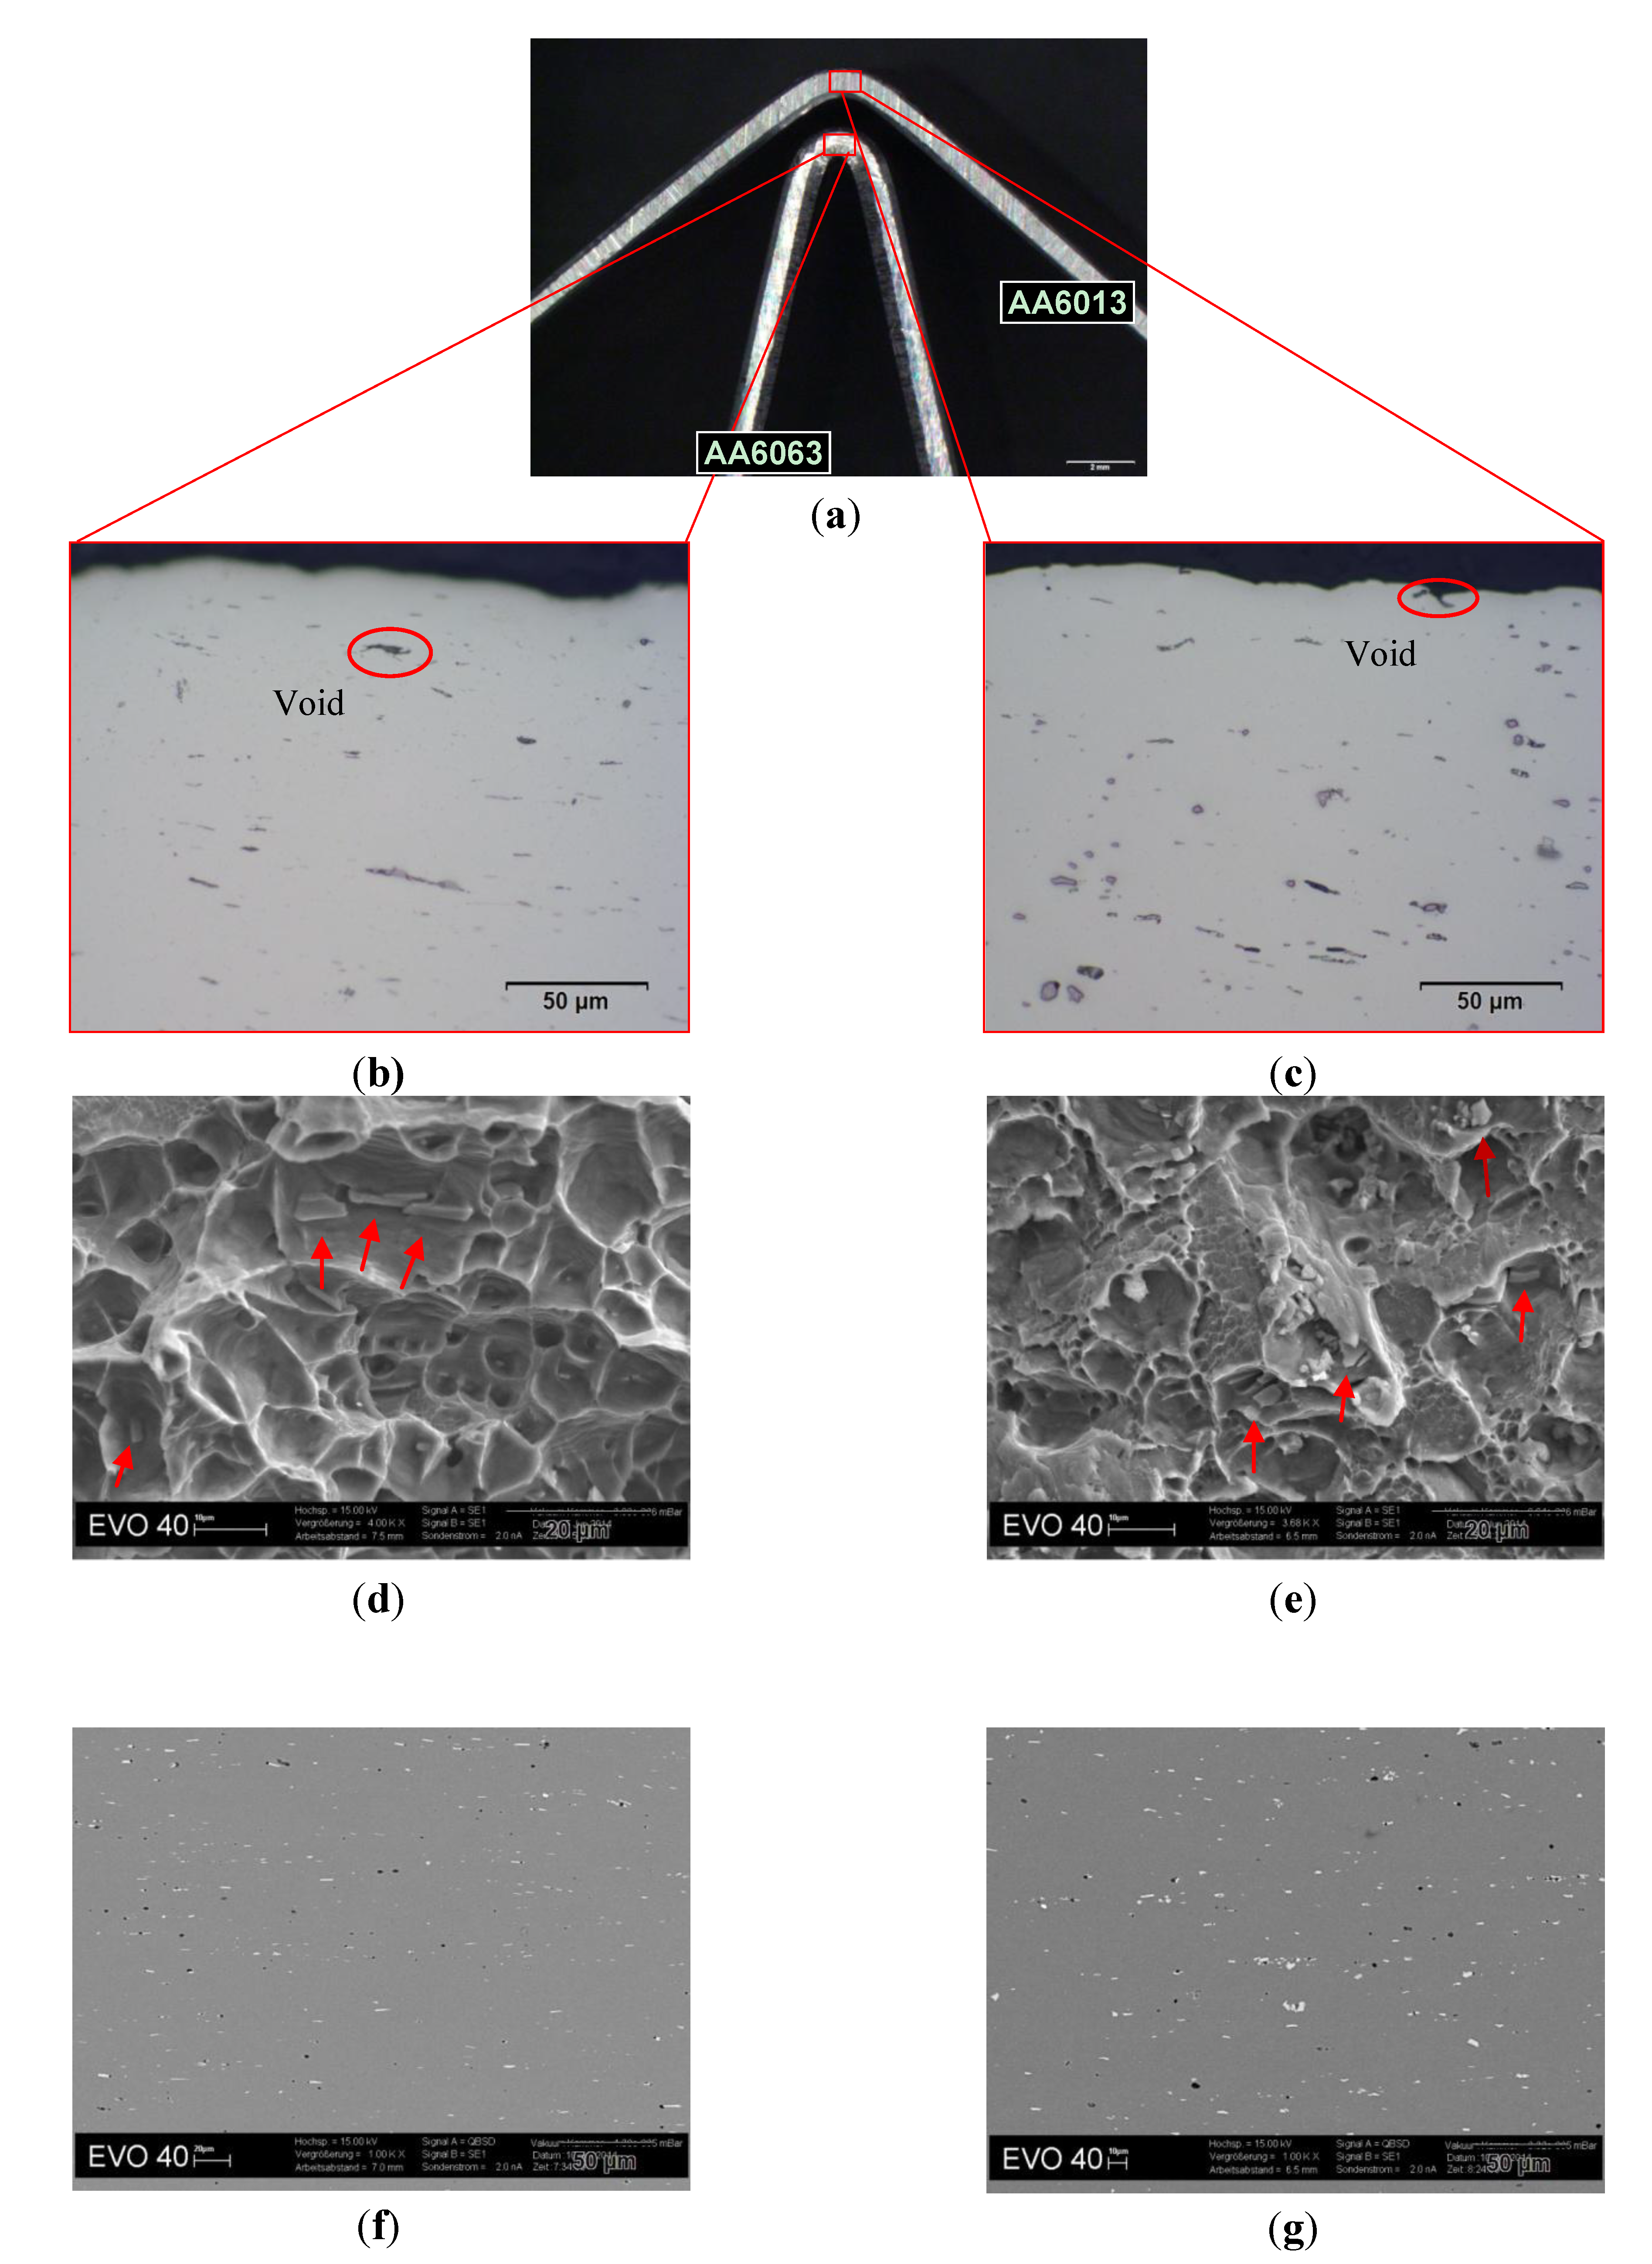
To strengthen the above-mentioned correlations,
Figure 15 shows a comparison between AA6063 (good bendability) and AA6013 (poor bendability) in terms of microstructure. For this observation, micrographs were taken from bending samples (
Figure 15a).
Figure 15b,c show the microstructure near the fracture surface of the bending samples. It was found that AA6063 exhibits a more homogenous microstructure in comparison to 6013. Alloy AA6013 shows large particles of high density, mainly Al-Fe-Si-Mn-Cu constituents. Cracks appeared due to void formation in regions of maximum strain. To illustrate fracture surfaces (
Figure 15d,e), the samples were bent until complete fracture occurred. AA6063 showed a ductile, homogenous forced fracture. In contrast, AA6013 was again more inhomogeneous (shear fracture areas were observed). To investigate the microstructure of both alloys in more detail, also the undeformed material was analyzed (
Figure 15f,g). AA6063 showed less constituents and more plate-like Al-Fe-Si particles (6063 has nearly no Mn, which would be required to promote the formation of globular α-AlFeSi). In comparison AA6013 exhibited more globular particles (due to the high Mn-content), but showed an inhomogeneous and denser distribution of large constituents.
The design requirements of automotive parts often demand the presence of holes on the surface. Because hole-expansion tests measure the elongation of the material near the holes, calculating the hole-expansion ratio is of great interest in generating information about the material’s susceptibility to edge cracking or edge stretching. The stress field in the formed edge where the cracks appear is similar to the stress field in the sheared edge during flanging operations. The edge condition before flanging, sheet-deformation during hole preparation, punch shape and microstructure (volume fraction and morphology of different phases) can affect the ability of the hole flange to stretch [
33]. The alloy AA6013 shows the lowest hole expansion ratio, around 41% (
Table 4), which was predicted due to the high strength level of this alloy in temper T4* (
Figure 5). AA6013 also contains high amounts of alloying elements, which form different intermetallic phases (e.g., Al-Fe-Si-Mn, Mg-Si, Al-Cu-Mg-Si) with a high volume fraction through the thermo-mechanical processing. These phases can cause grain boundary precipitations (mainly Cu-rich precipitates). Fracture during deformation can then be initiated in the grain boundary through void initiation [
34].
Figure 15.
Microstructure observations on bending test samples of AA6063 and AA6013 in T4*. (a) Bending samples of AA6063 and AA6013 in temper T4*; (b) optical micrograph in the L-direction of AA6063 in T4* near the fracture surface, 500×; (c) optical micrograph in the L-direction of AA6013 in T4* near the fracture surface, 500×; (d) SEM micrograph of the fracture surface of AA6063 in T4*, red arrows = Al-Fe-Si, 4,000×; (e) SEM micrograph of the fracture surface of AA6013 in T4*, red arrows = Al-Fe-Si-Mn-Cu 4000×; (f) SEM micrograph of the undeformed microstructure of AA6063 in T4*, 1,000×, white = Al-Fe-Si particles dark = Al-Si-Mg particles; (g) SEM micrograph of the undeformed microstructure of AA6013 in T4*, 1,000×, white = Al-Fe-Si-Mn-Cu particles black = Al-Mg-Si-Cu particles.
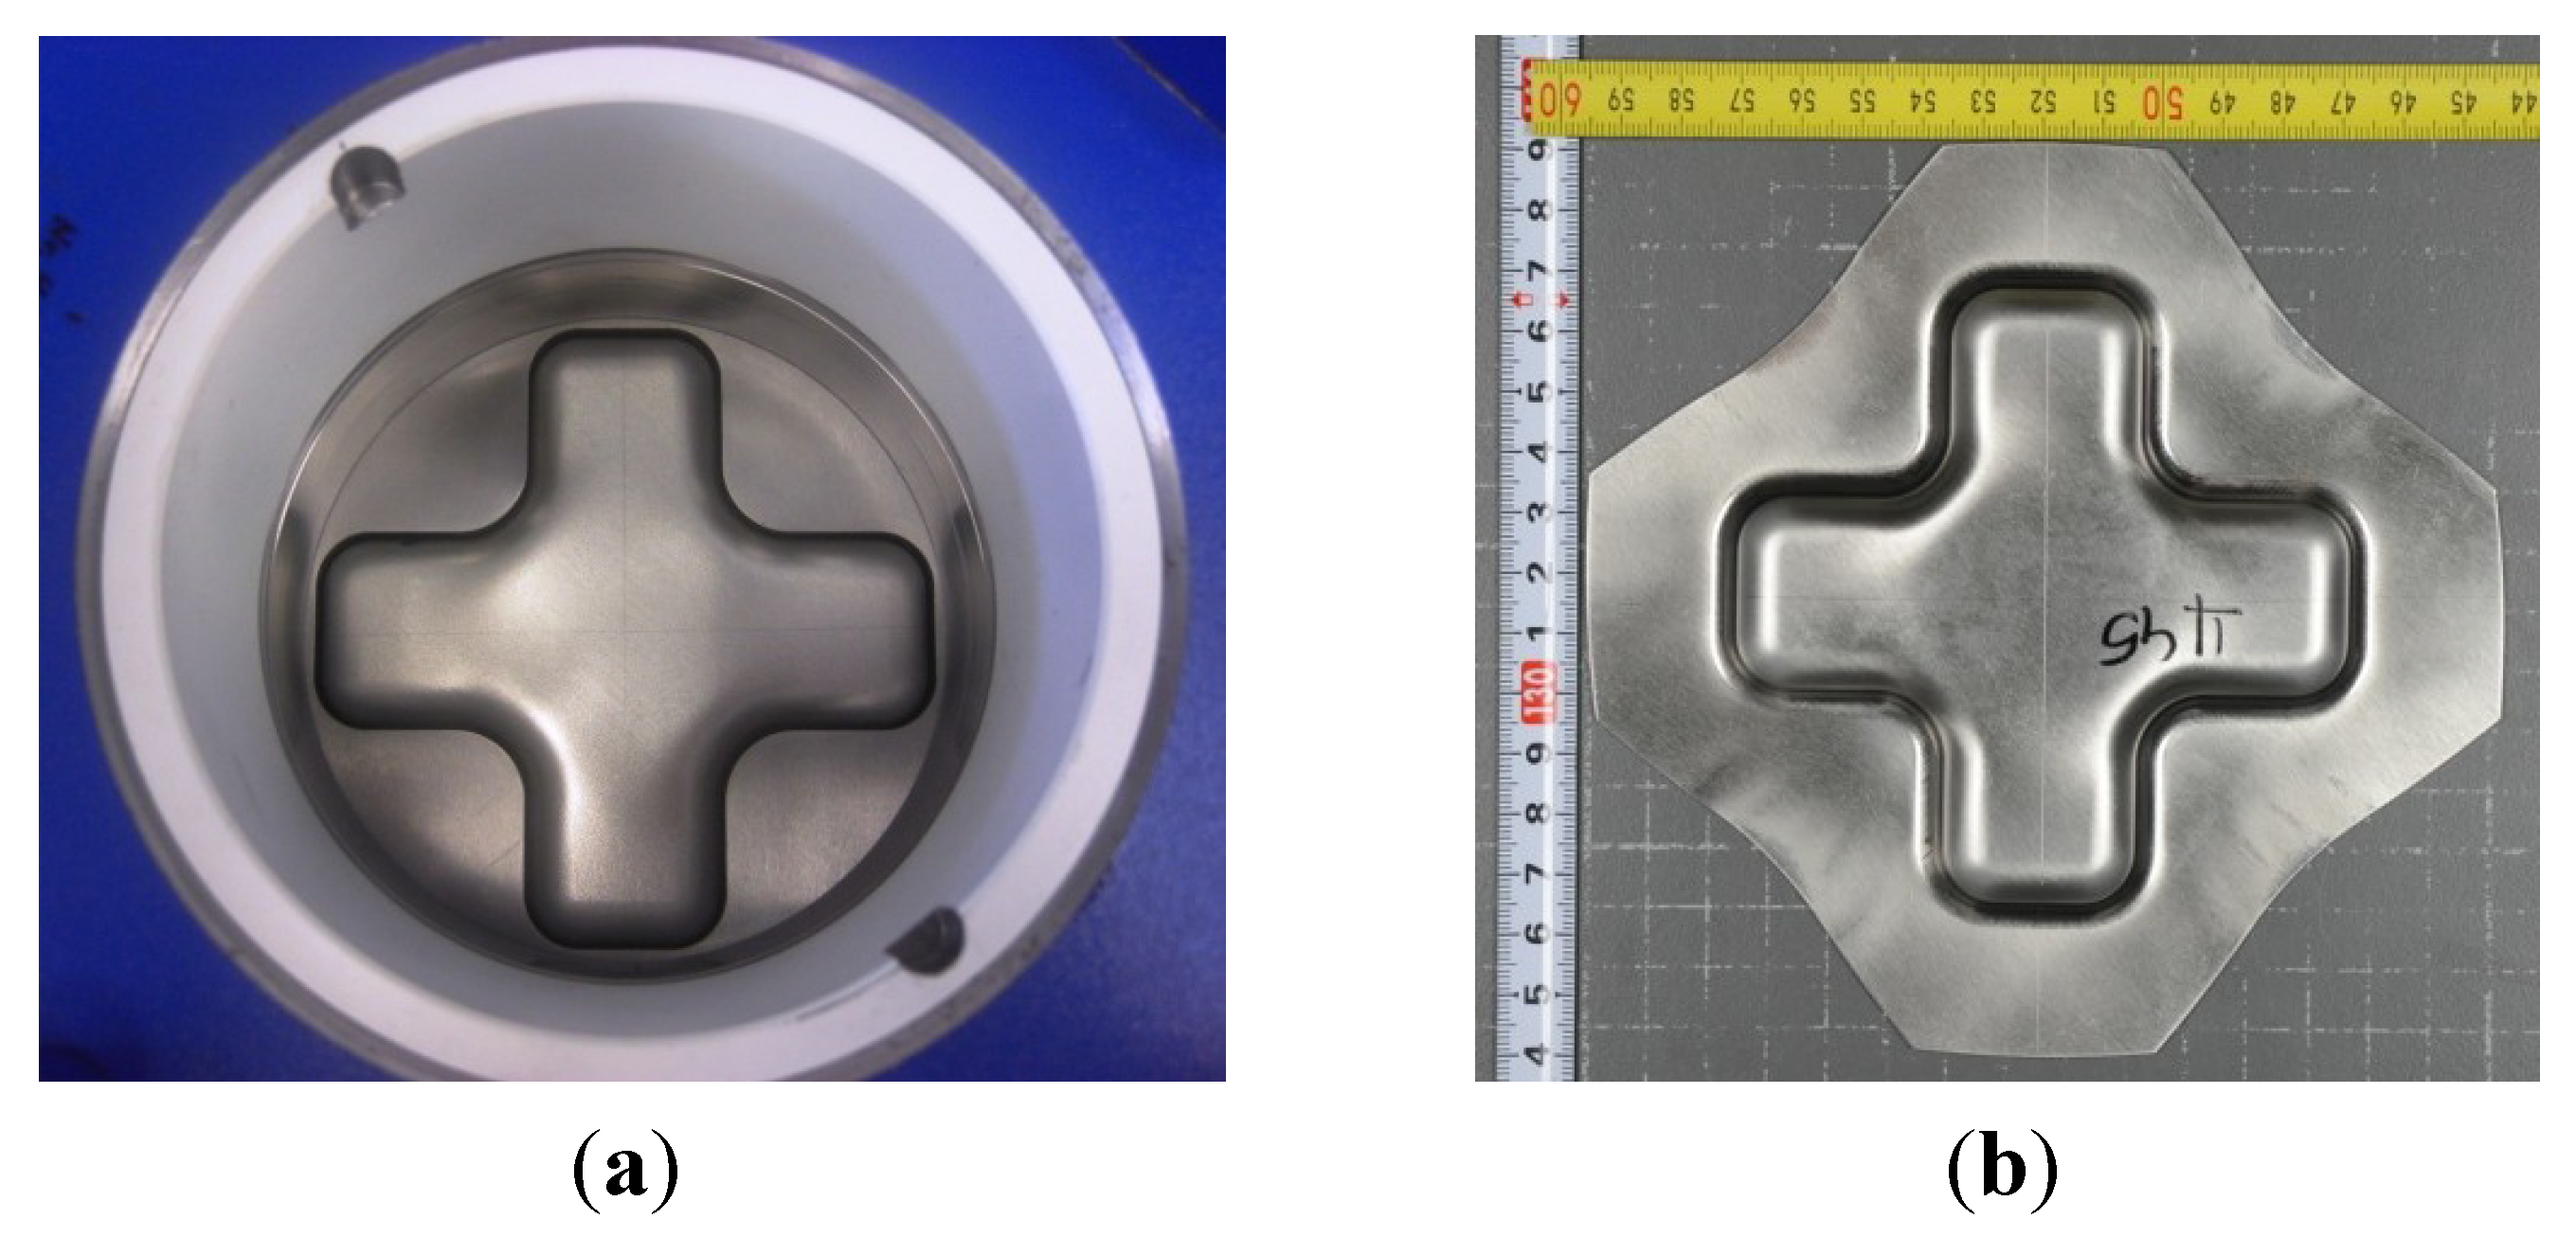
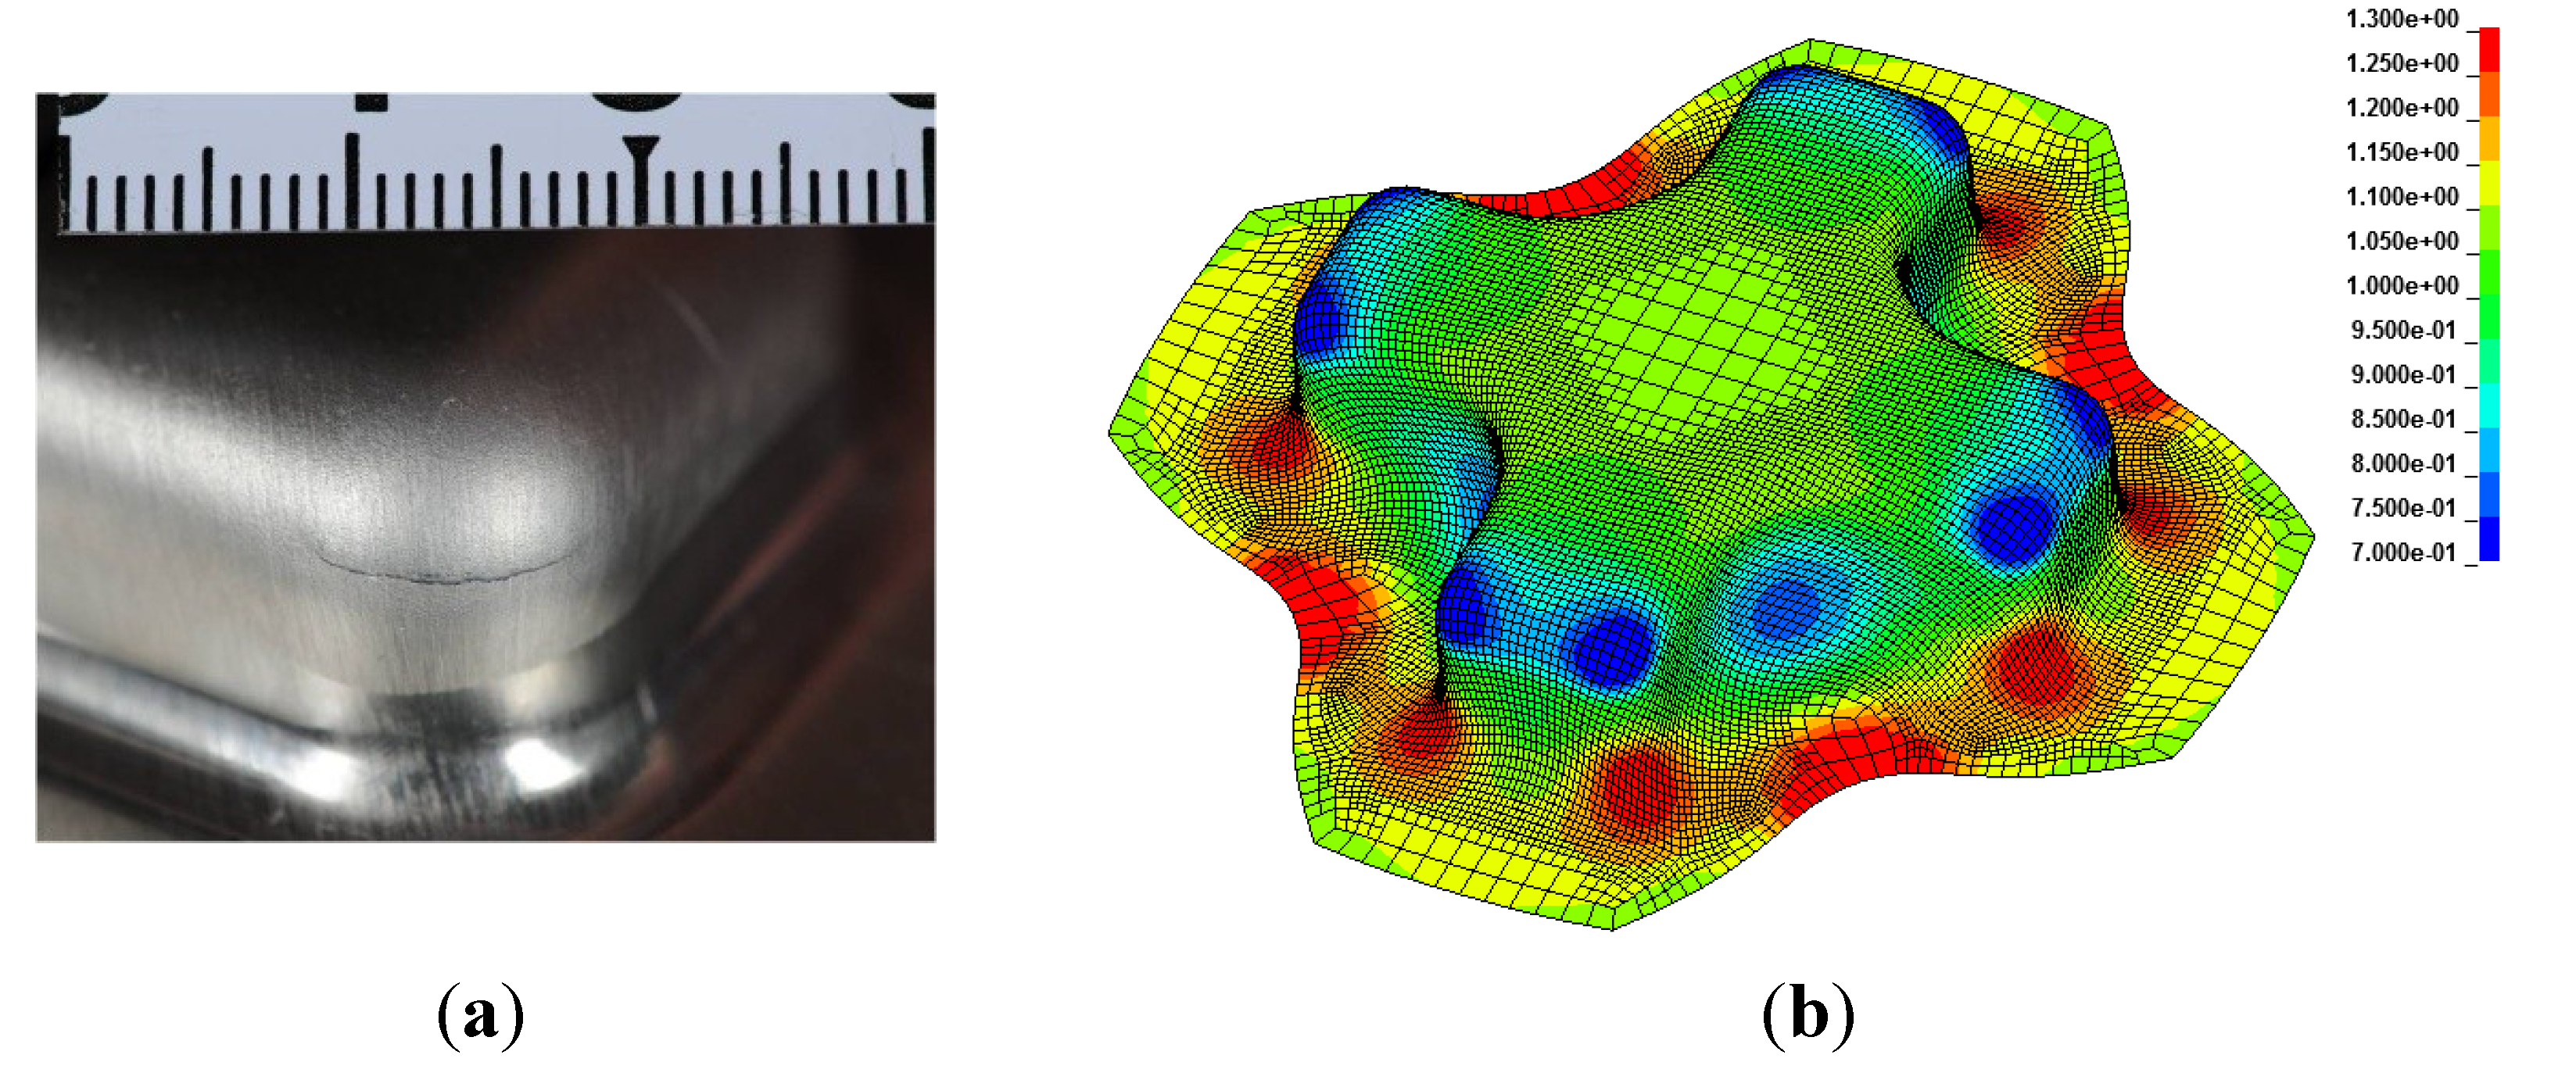
The forming test in a cross-die has been used extensively in the automotive industry to assess the formability of sheet material. The geometry of the cross-die displays typical stress states, which predominate during the manufacture of real automotive parts. Qualitatively the results of this test, summarized in
Table 5, compare well with the results of the hole-expansion test (
Table 4).
Overall, the forming results were found to depend on the chemical composition of the alloy and the specific testing procedure used. For example AA6013, which is widely used in the aerospace industry, showed poor forming performance during bending and hole-expansion, probably because of its very high strength level in temper T4*. However, despite its high strength, AA6013 was almost competitive in the other forming tests.
4.4. Corrosion Behavior
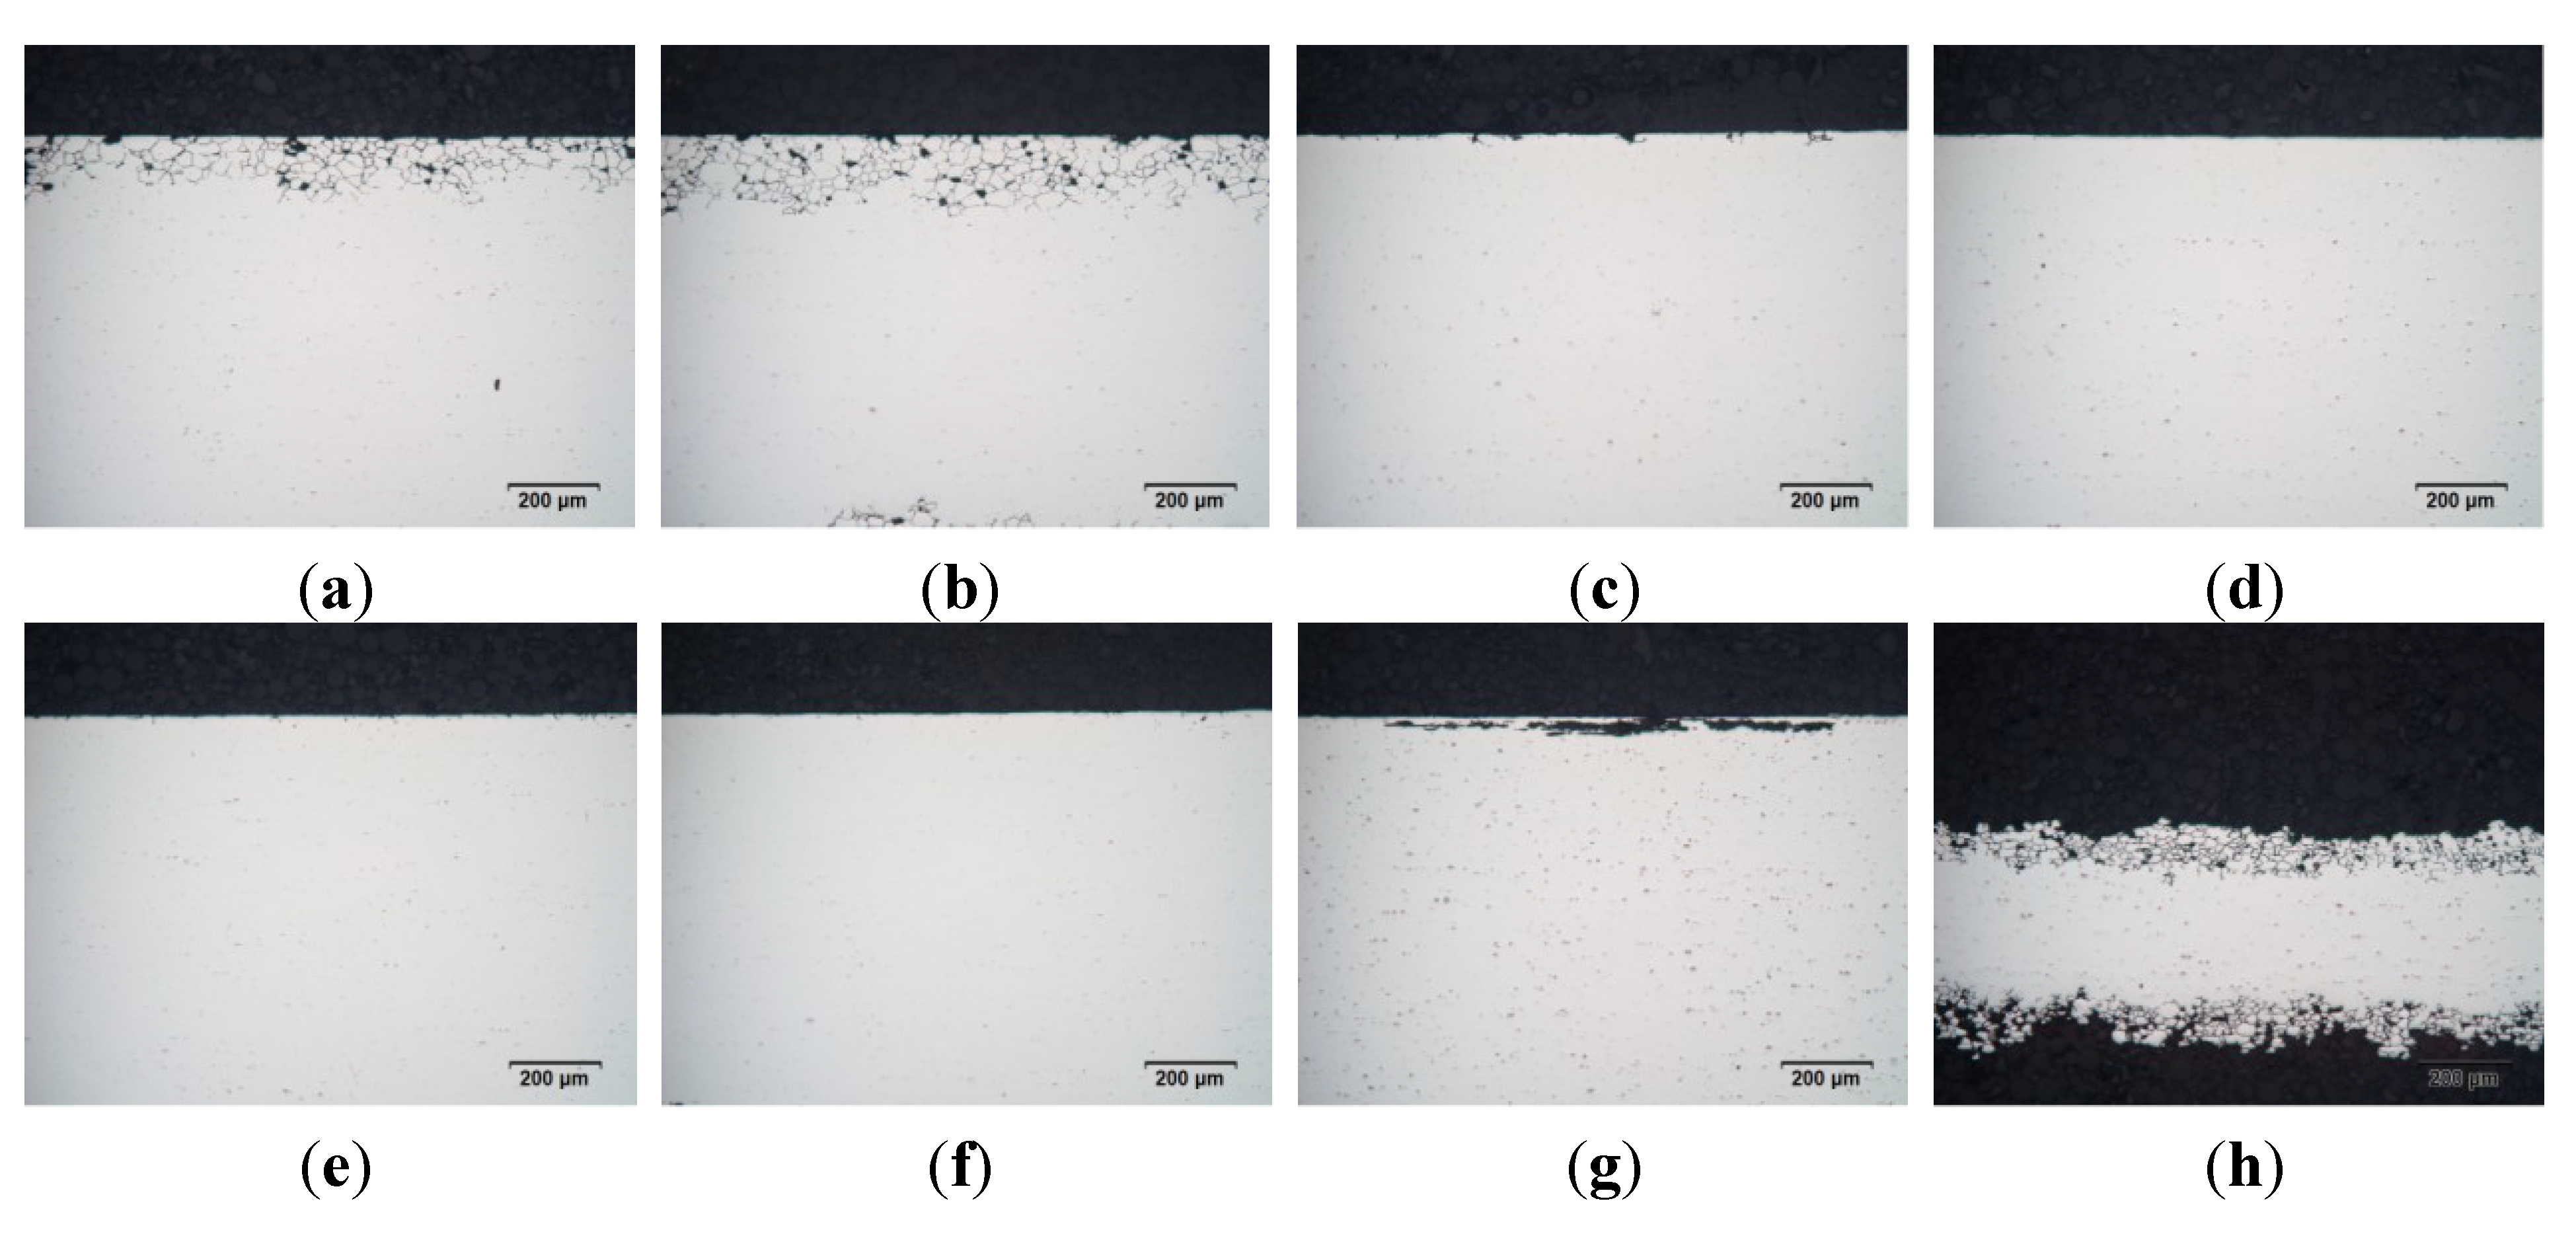
Nearly every car manufacturer has its own extensive long-term corrosion test procedure for analyzing the corrosion behavior of aluminum sheet alloys. In this study, intergranular corrosion (IGC) tests were performed according to ISO 11846 method B [
14]. This testing method makes possible the relatively quick classification of different Al-Mg-Si alloys. Here, several car manufacturers require a maximum IGC-depth of 300 µm for body panels. Intergranular corrosion of 6xxx series alloys has been attributed to the depletion of Si and/or Cu along grain boundaries [
43]. Susceptibility to IGC is, in general, strongly dependent on the thermal history during fabrication. For Al-Mg-Si alloys containing Cu, it has been shown that the formation of a nano-scaled Cu-enriched layer along the grain boundaries due to ageing contributes to IGC. It has been assumed that the layer serves as a precursor of the Q phase [
44]. With increasing ageing temperature and time, the layer transforms into Q precipitates, and the IGC susceptibility decreases. Precipitated Si on grain boundaries is also claimed to act as a local cathodic site in alloys containing excess Si [
43]. In this study (
Table 7 and
Figure 14), it was found that AA6013 is highly susceptible to IGC after the simulated paint bake process. This was no surprise, because of its relatively high Cu content and the fact that paint bake treatment is relatively brief. Therefore, the above-mentioned Cu-layer at the grain boundaries is assumed to remain present in T6* temper. The good corrosion resistance of AA6063 and AA6005A in comparison to AA6016 can be related to their low Si/Mg ratio, which goes hand in hand with a low amount of Si in excess. However, the results of corrosion tests on AA6016 would be sufficient for its use in outer car body panels, because the automotive manufacturers require a maximum IGC-depth of 300 µm, and AA6016 exhibits a maximum IGC-depth of 180 µm.


 and
and 
