From Cellulosic Based Liquid Crystalline Sheared Solutions to 1D and 2D Soft Materials


Abstract
:1. Introduction

2. Liquid Crystalline Solutions Studied by Nuclear Magnetic Resonance (NMR) Methods
2.1. Liquid Crystalline Cellulose Solutions Flow in Capillaries
 = 20 s−1) and frozen before MRI measurements. (A1), (B1) and (C1) show the time sequence illustrating the jet escaping of the free capillary end generated by different shear rates (in all three cases for the liquid crystalline solution). Reproduced from [33] with permission from The Royal Society of Chemistry.
= 20 s−1) and frozen before MRI measurements. (A1), (B1) and (C1) show the time sequence illustrating the jet escaping of the free capillary end generated by different shear rates (in all three cases for the liquid crystalline solution). Reproduced from [33] with permission from The Royal Society of Chemistry.
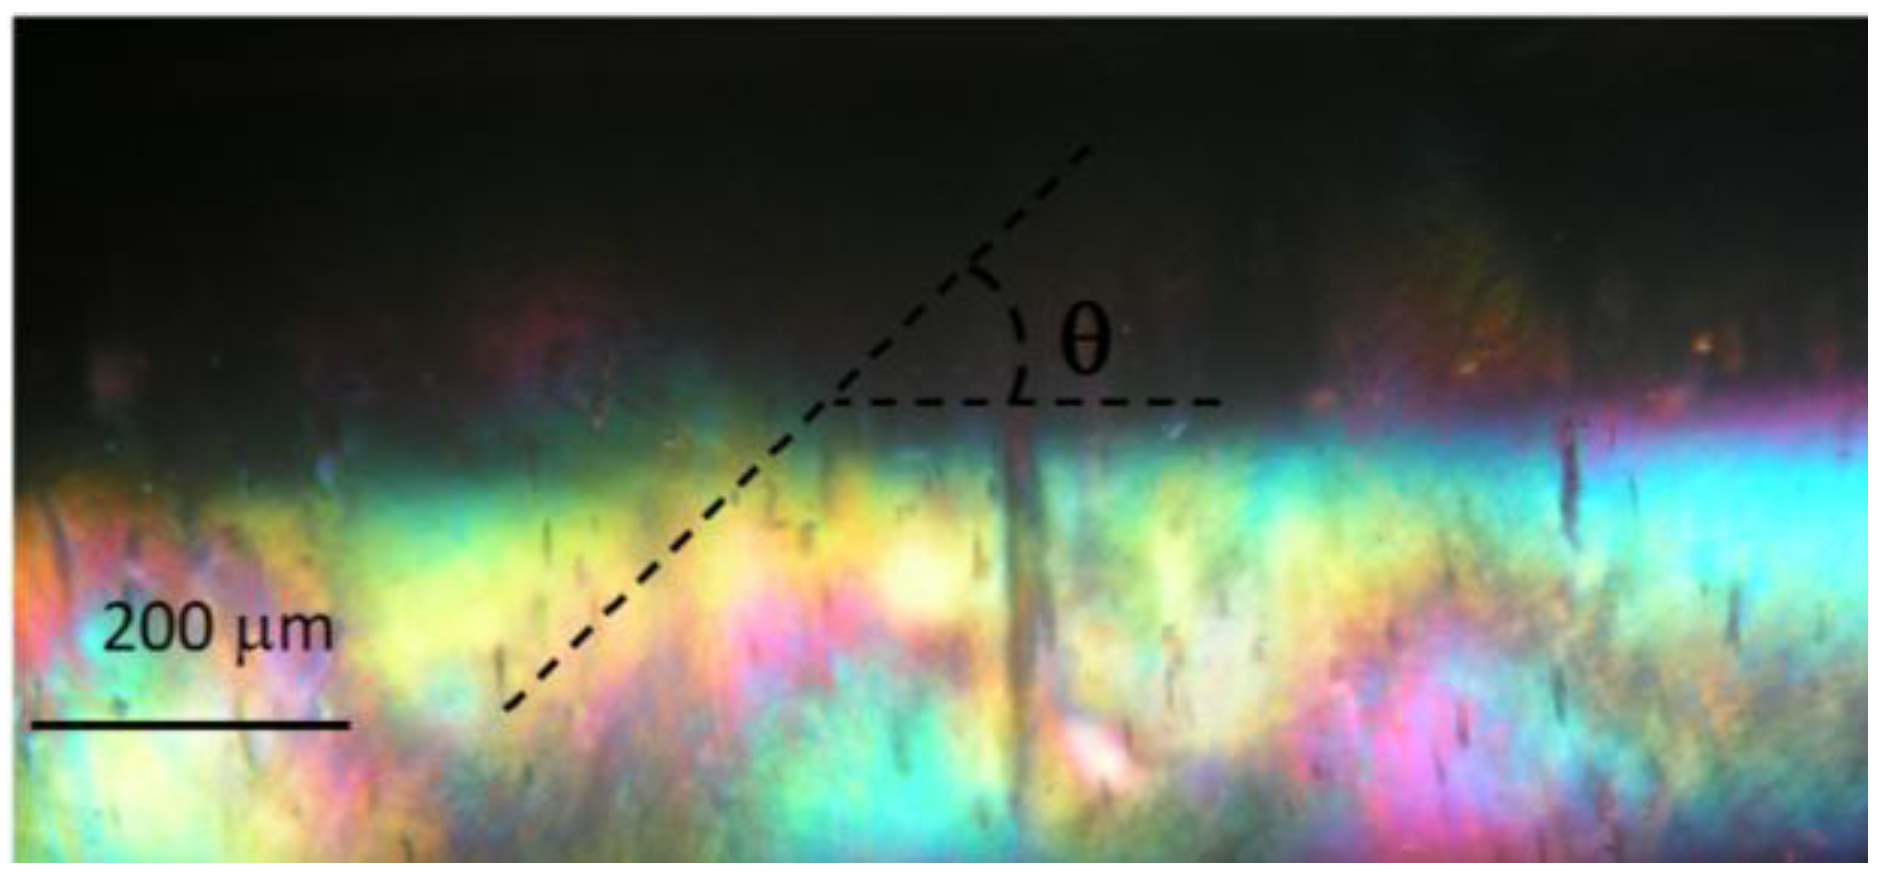
= 20 s−1) and frozen before MRI measurements. (A1), (B1) and (C1) show the time sequence illustrating the jet escaping of the free capillary end generated by different shear rates (in all three cases for the liquid crystalline solution). Reproduced from [33] with permission from The Royal Society of Chemistry. = 18 s−1) for 10 min. The axis of the tube is parallel to one of the polarizers. The helix radius, R, pitch P = 2πR/tanθ and the helical angle θ are marked on the image. The natural curvature and twist parameters are set by k = 1/R and τ = P/2πR2, respectively. Reproduced with permission from [33]. Copyright 2010, The Royal Society of Chemistry.
= 18 s−1) for 10 min. The axis of the tube is parallel to one of the polarizers. The helix radius, R, pitch P = 2πR/tanθ and the helical angle θ are marked on the image. The natural curvature and twist parameters are set by k = 1/R and τ = P/2πR2, respectively. Reproduced with permission from [33]. Copyright 2010, The Royal Society of Chemistry.
= 18 s−1) for 10 min. The axis of the tube is parallel to one of the polarizers. The helix radius, R, pitch P = 2πR/tanθ and the helical angle θ are marked on the image. The natural curvature and twist parameters are set by k = 1/R and τ = P/2πR2, respectively. Reproduced with permission from [33]. Copyright 2010, The Royal Society of Chemistry.
2.2. Rheo-NMR Studies of Precursor Cellulosic Solutions
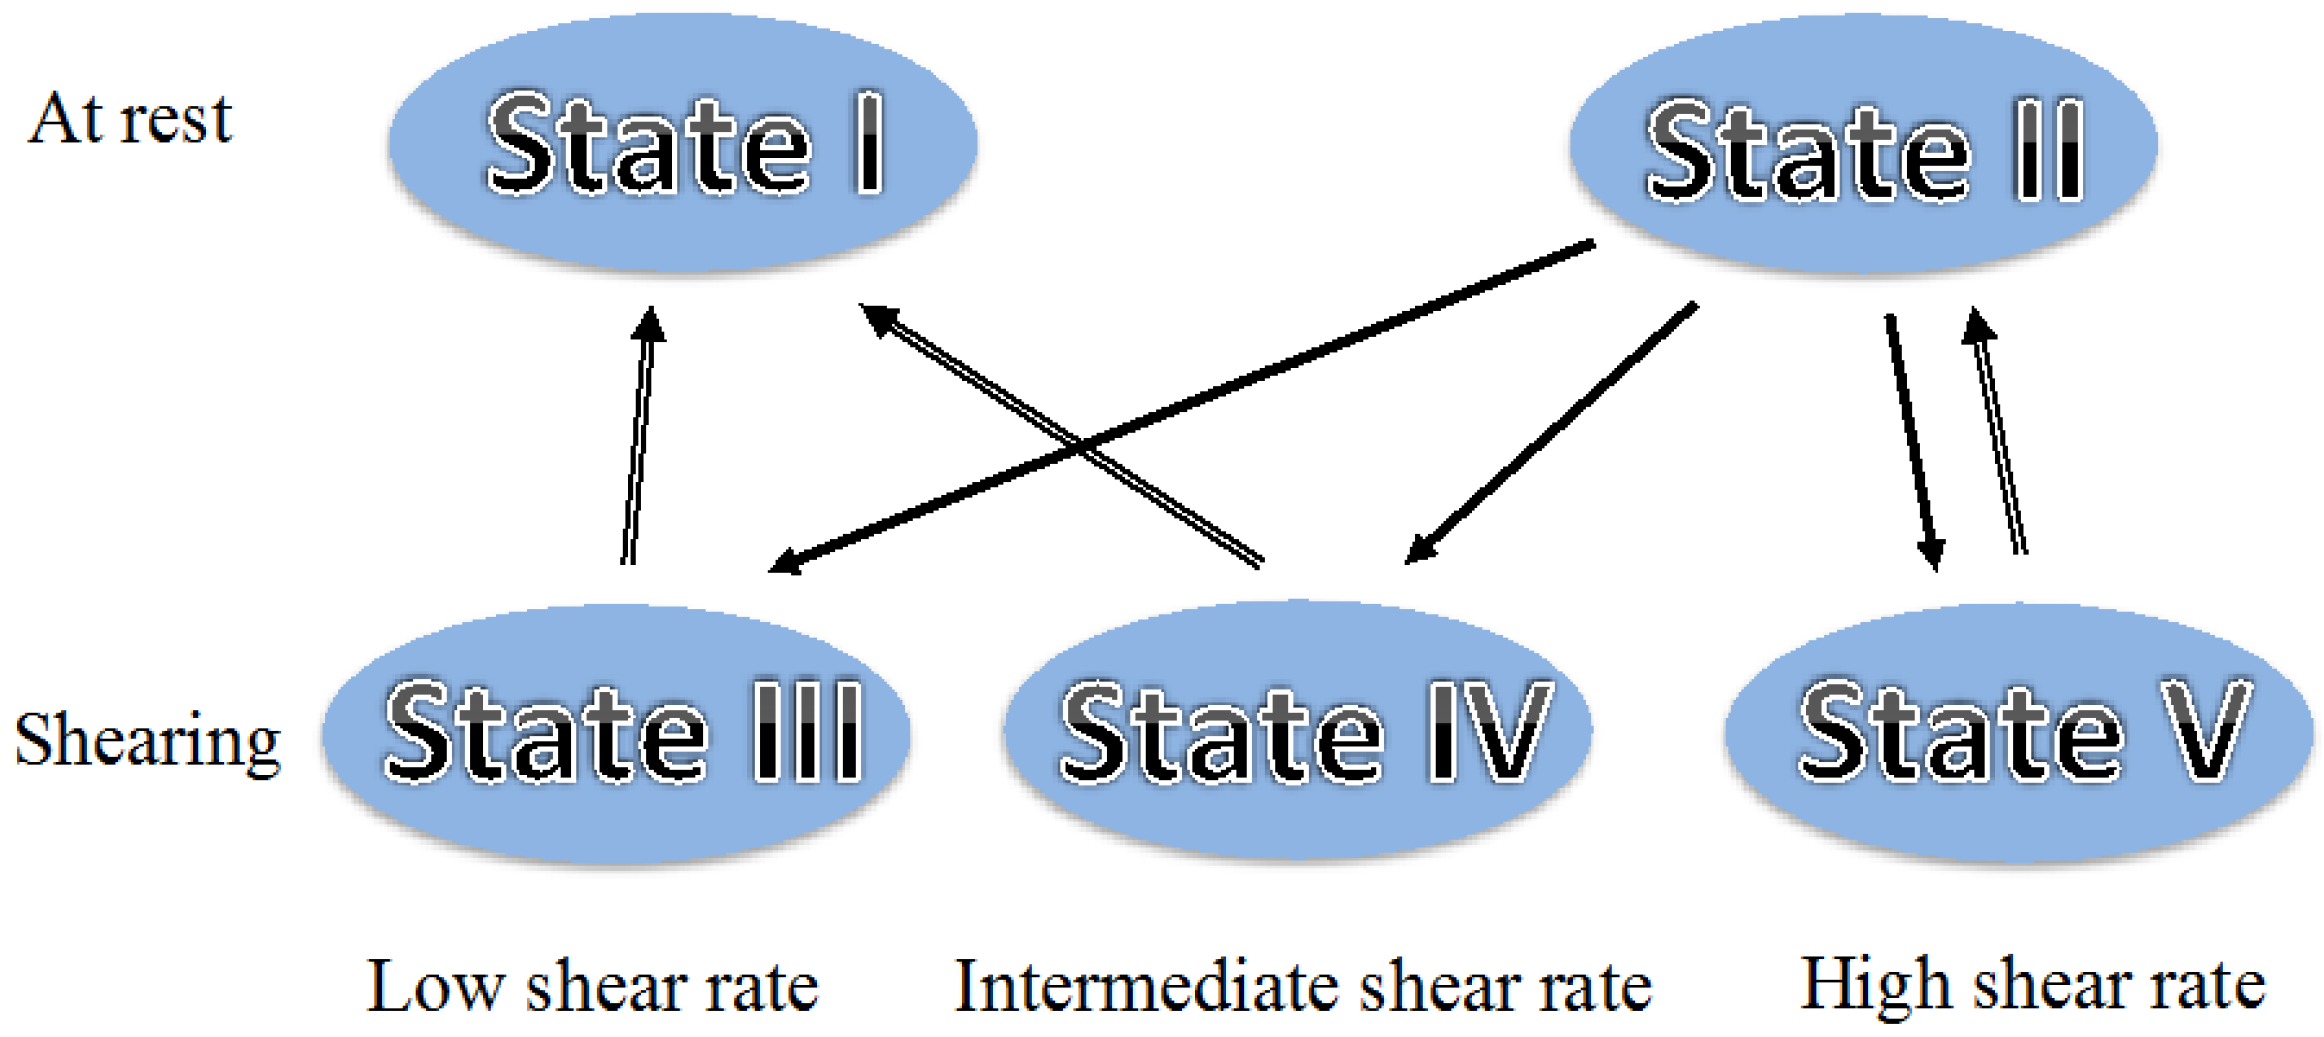
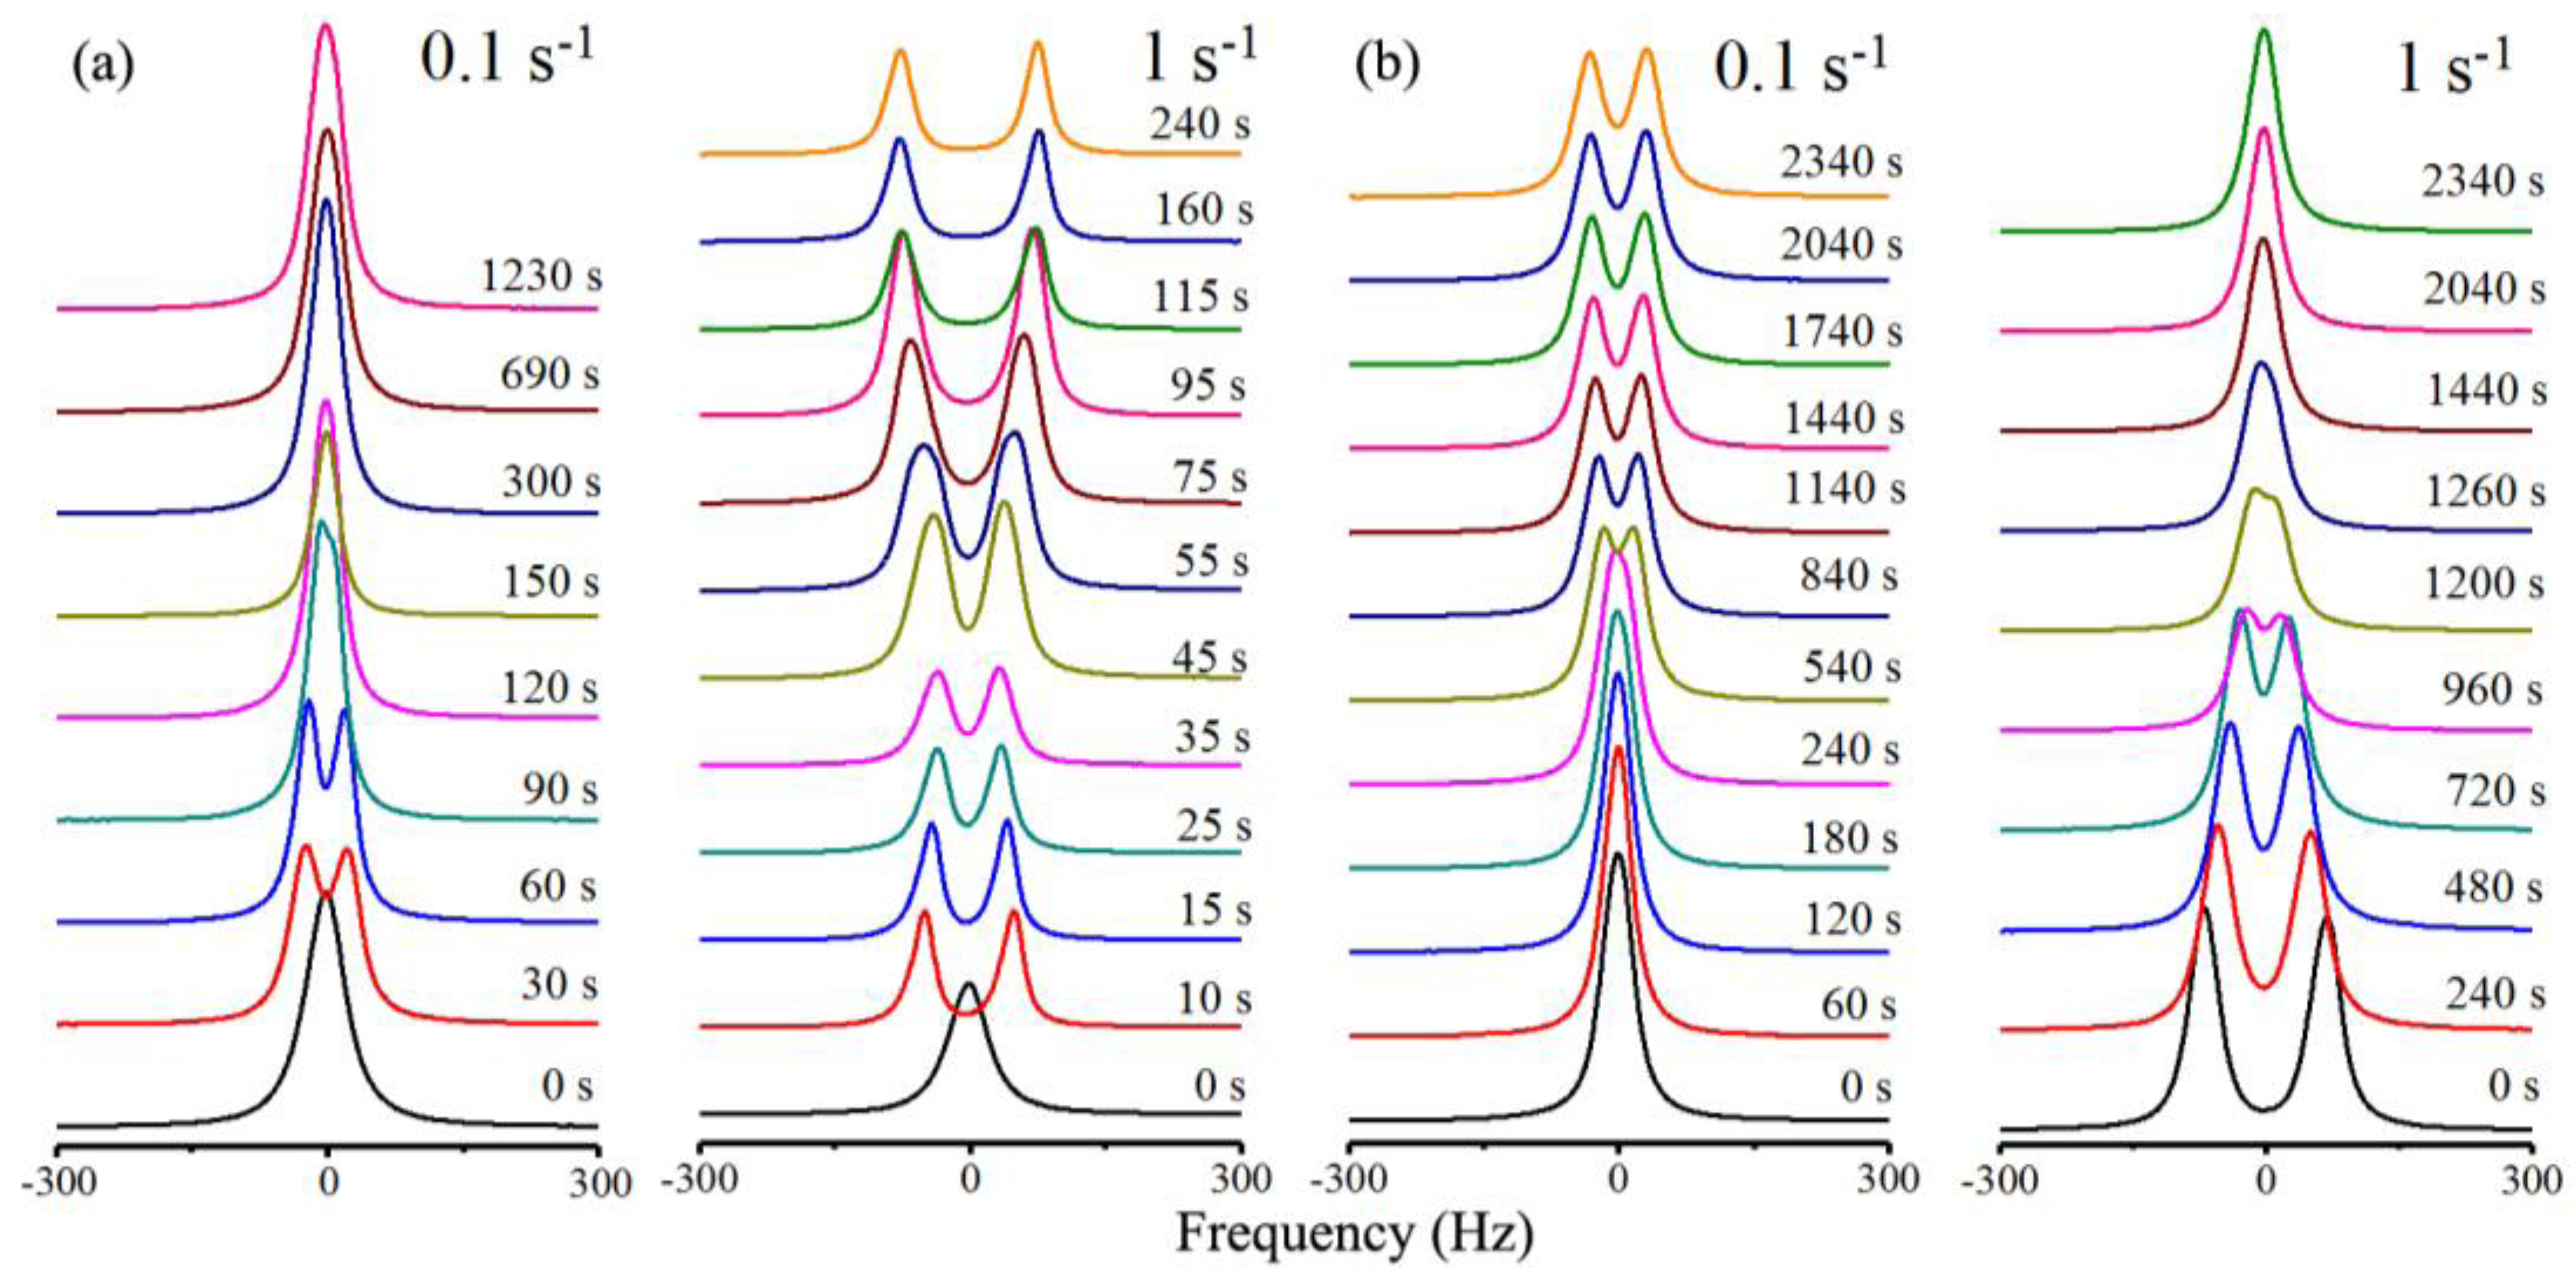 = 0.1 s−1 where the system order is low, to a regime of director flow alignment with partial or total helix suppression for shear rates of the order of 1 s−1 or above. The three distinct flow regimes introduced by Onogi and Asada [46] in the context of shear flow of LC polymers were directly identified in the Rheo-NMR [47] results and were ascribed to the tumbling of cholesteric domains, the partial flow alignment of the director and helix deformation and the director flow alignment with partial or total helix suppression. Relaxation data in the different regimes show that the system moves towards the reformation of the cholesteric domains and depending upon the starting point where the system is left in to relax this process may be more or less involved. When relaxation initiates from the tumbling cholesteric domains regime the cholesteric domains grow and possibly accrete giving rise to an immediate increase in order. When relaxation initiates from the flow director aligning regime, cholesteric helices start to form from the aligned director state, producing a significant decrease in order that only reverts when the reformed cholesteric domains start to accrete and grow, a process that takes significantly longer times to develop.
3. Liquid Crystalline Cellulose Networks Characterized by Different Experimental Techniques
3.1. Solid State NMR Spectroscopy of APC Networks With Nematic 5CB Inclusions
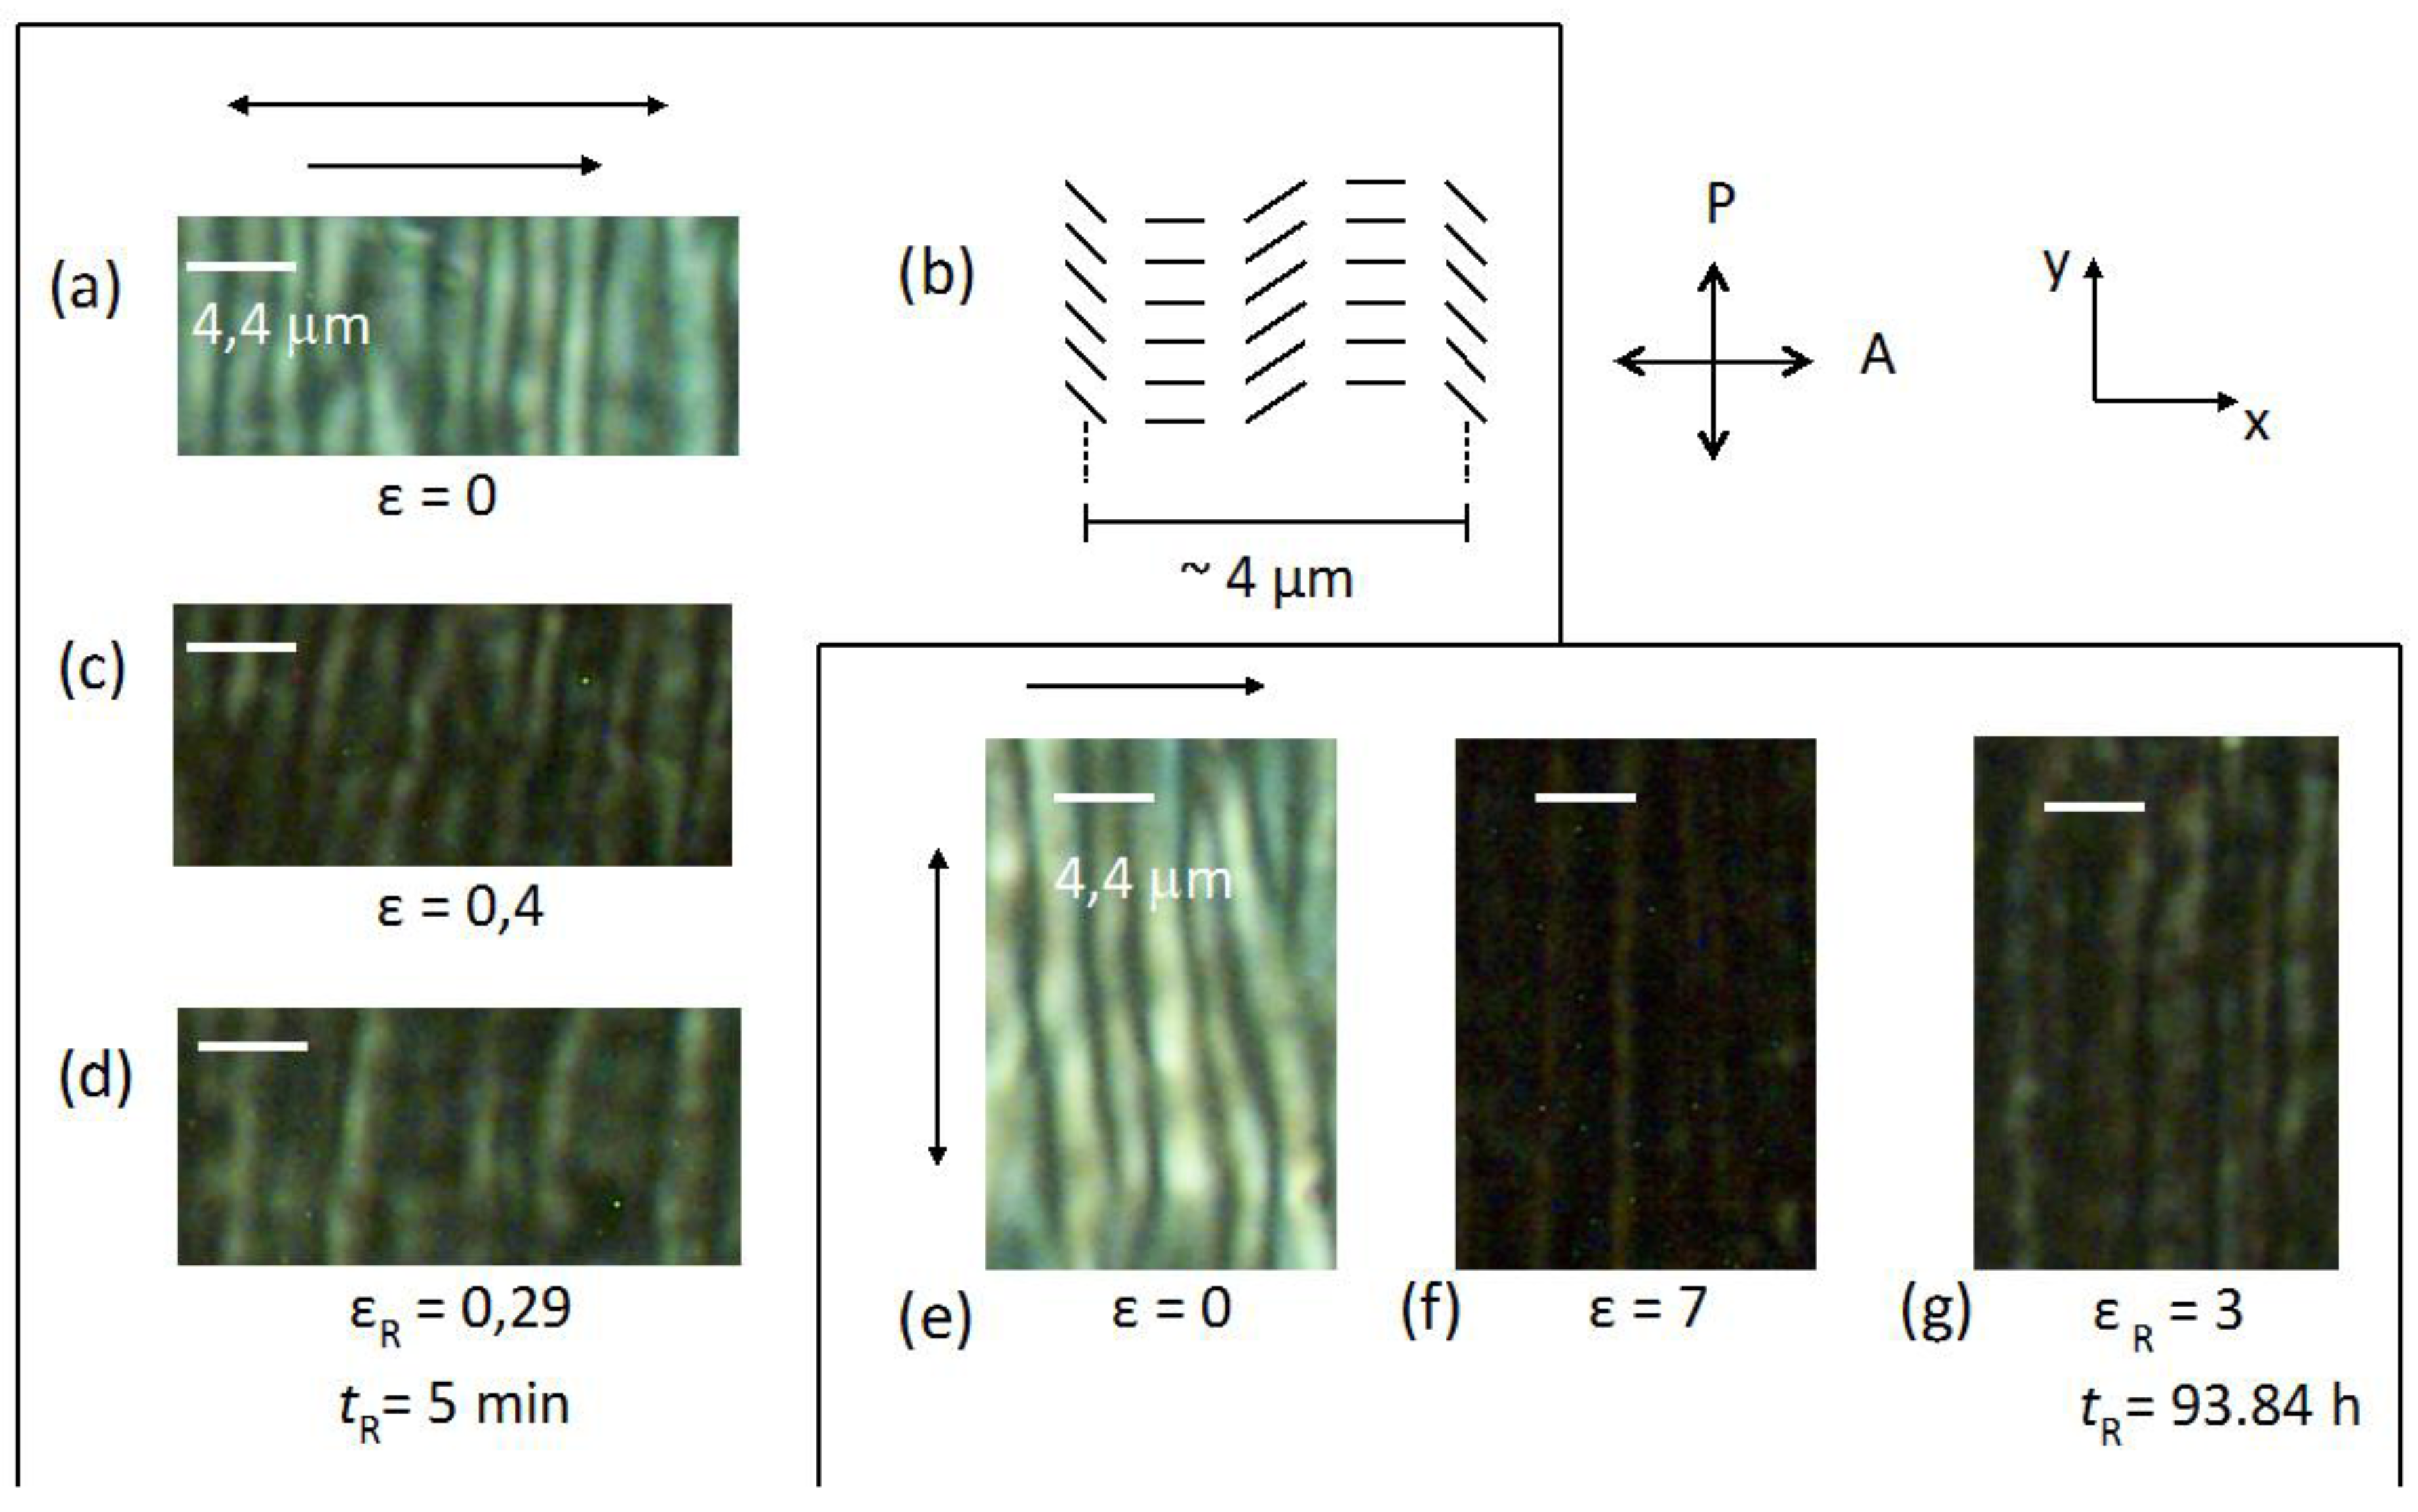
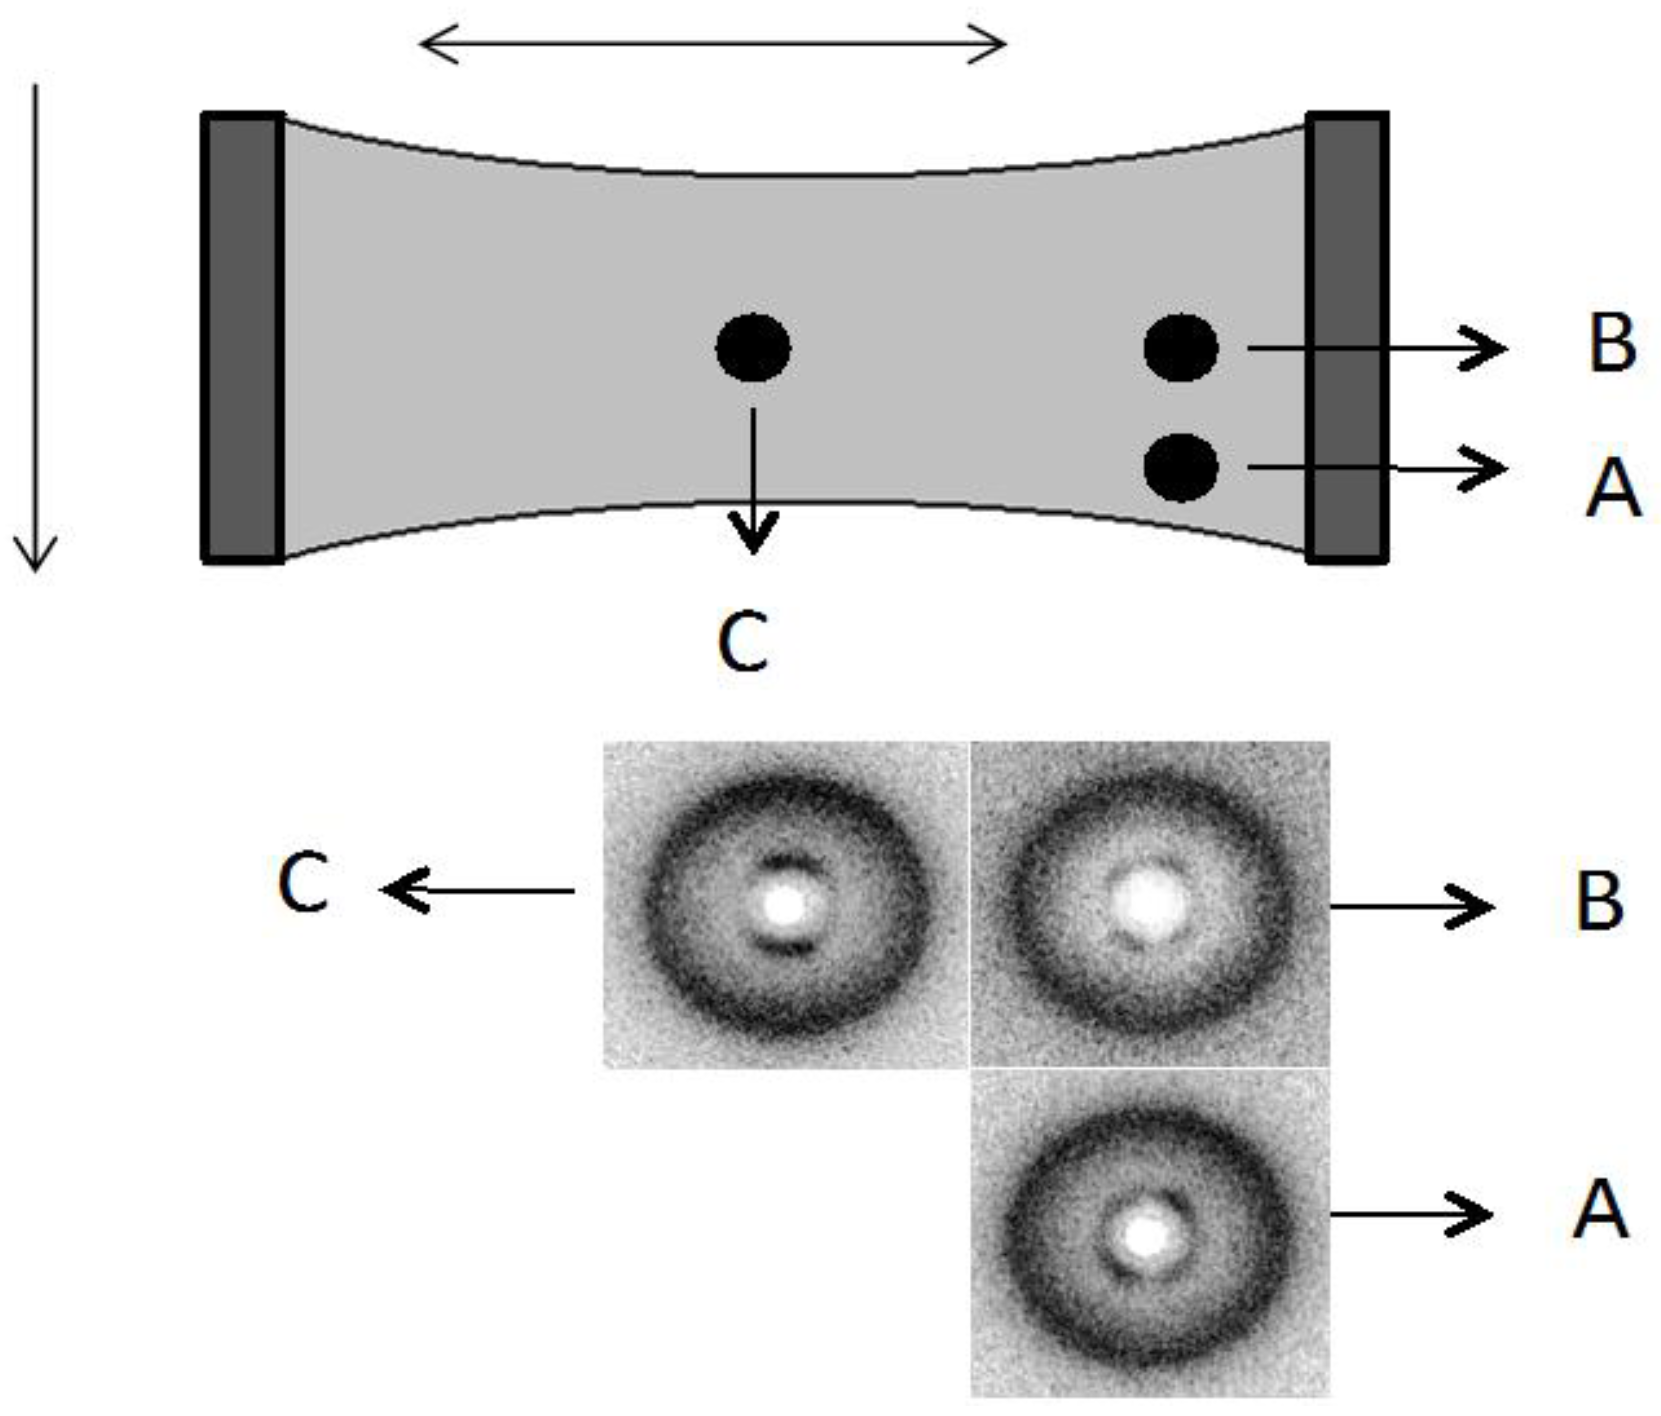
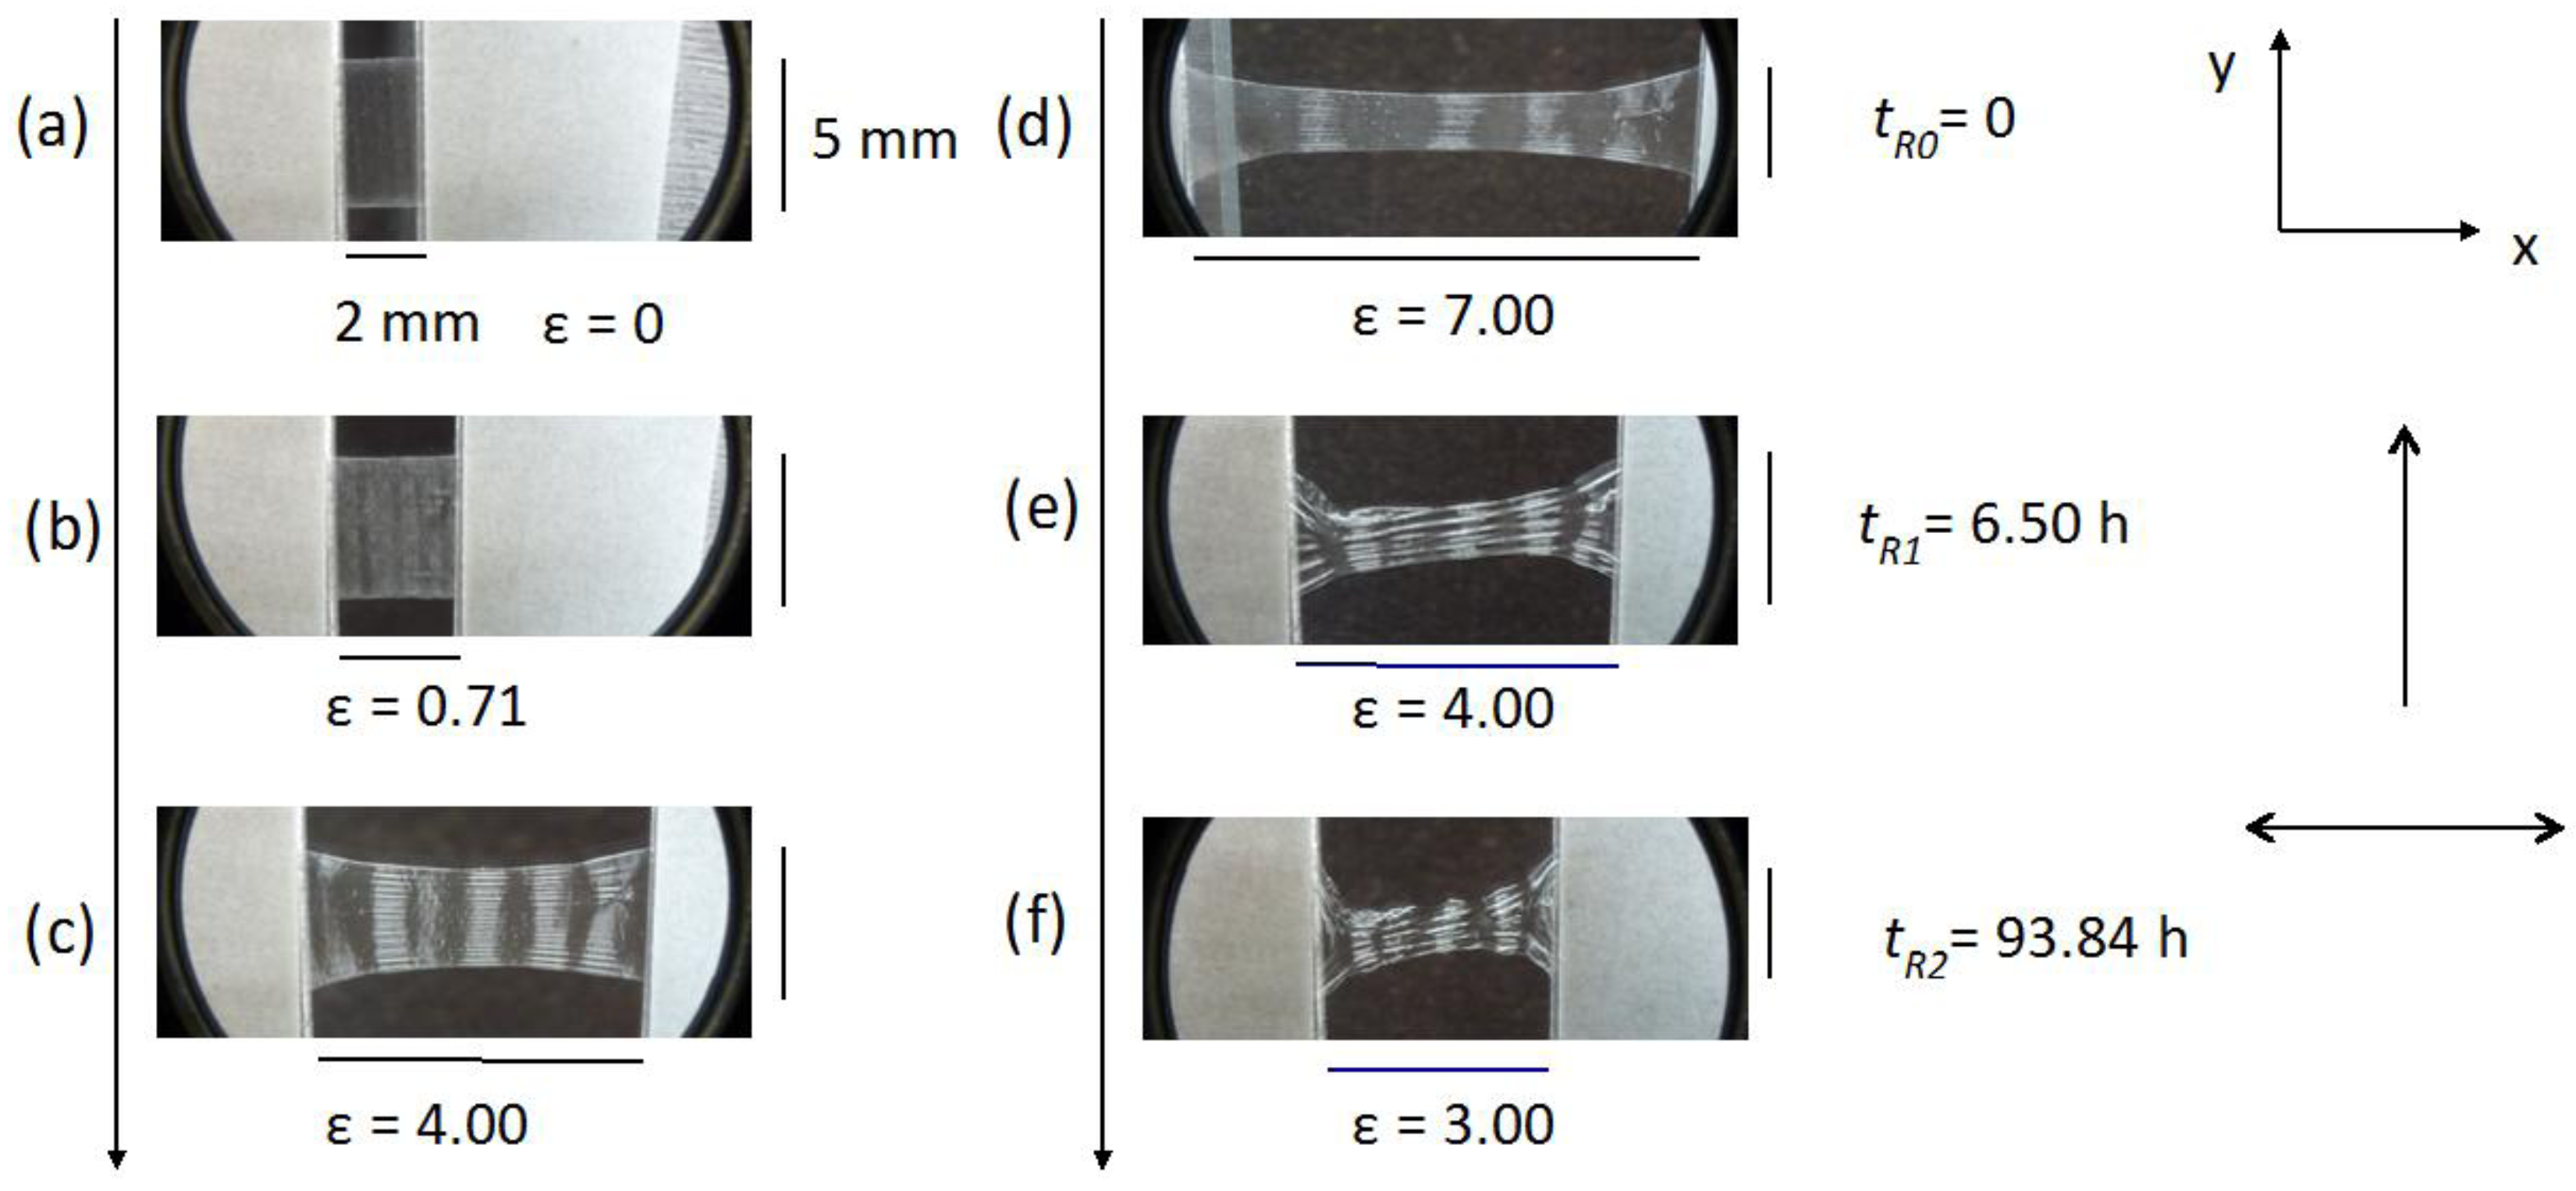
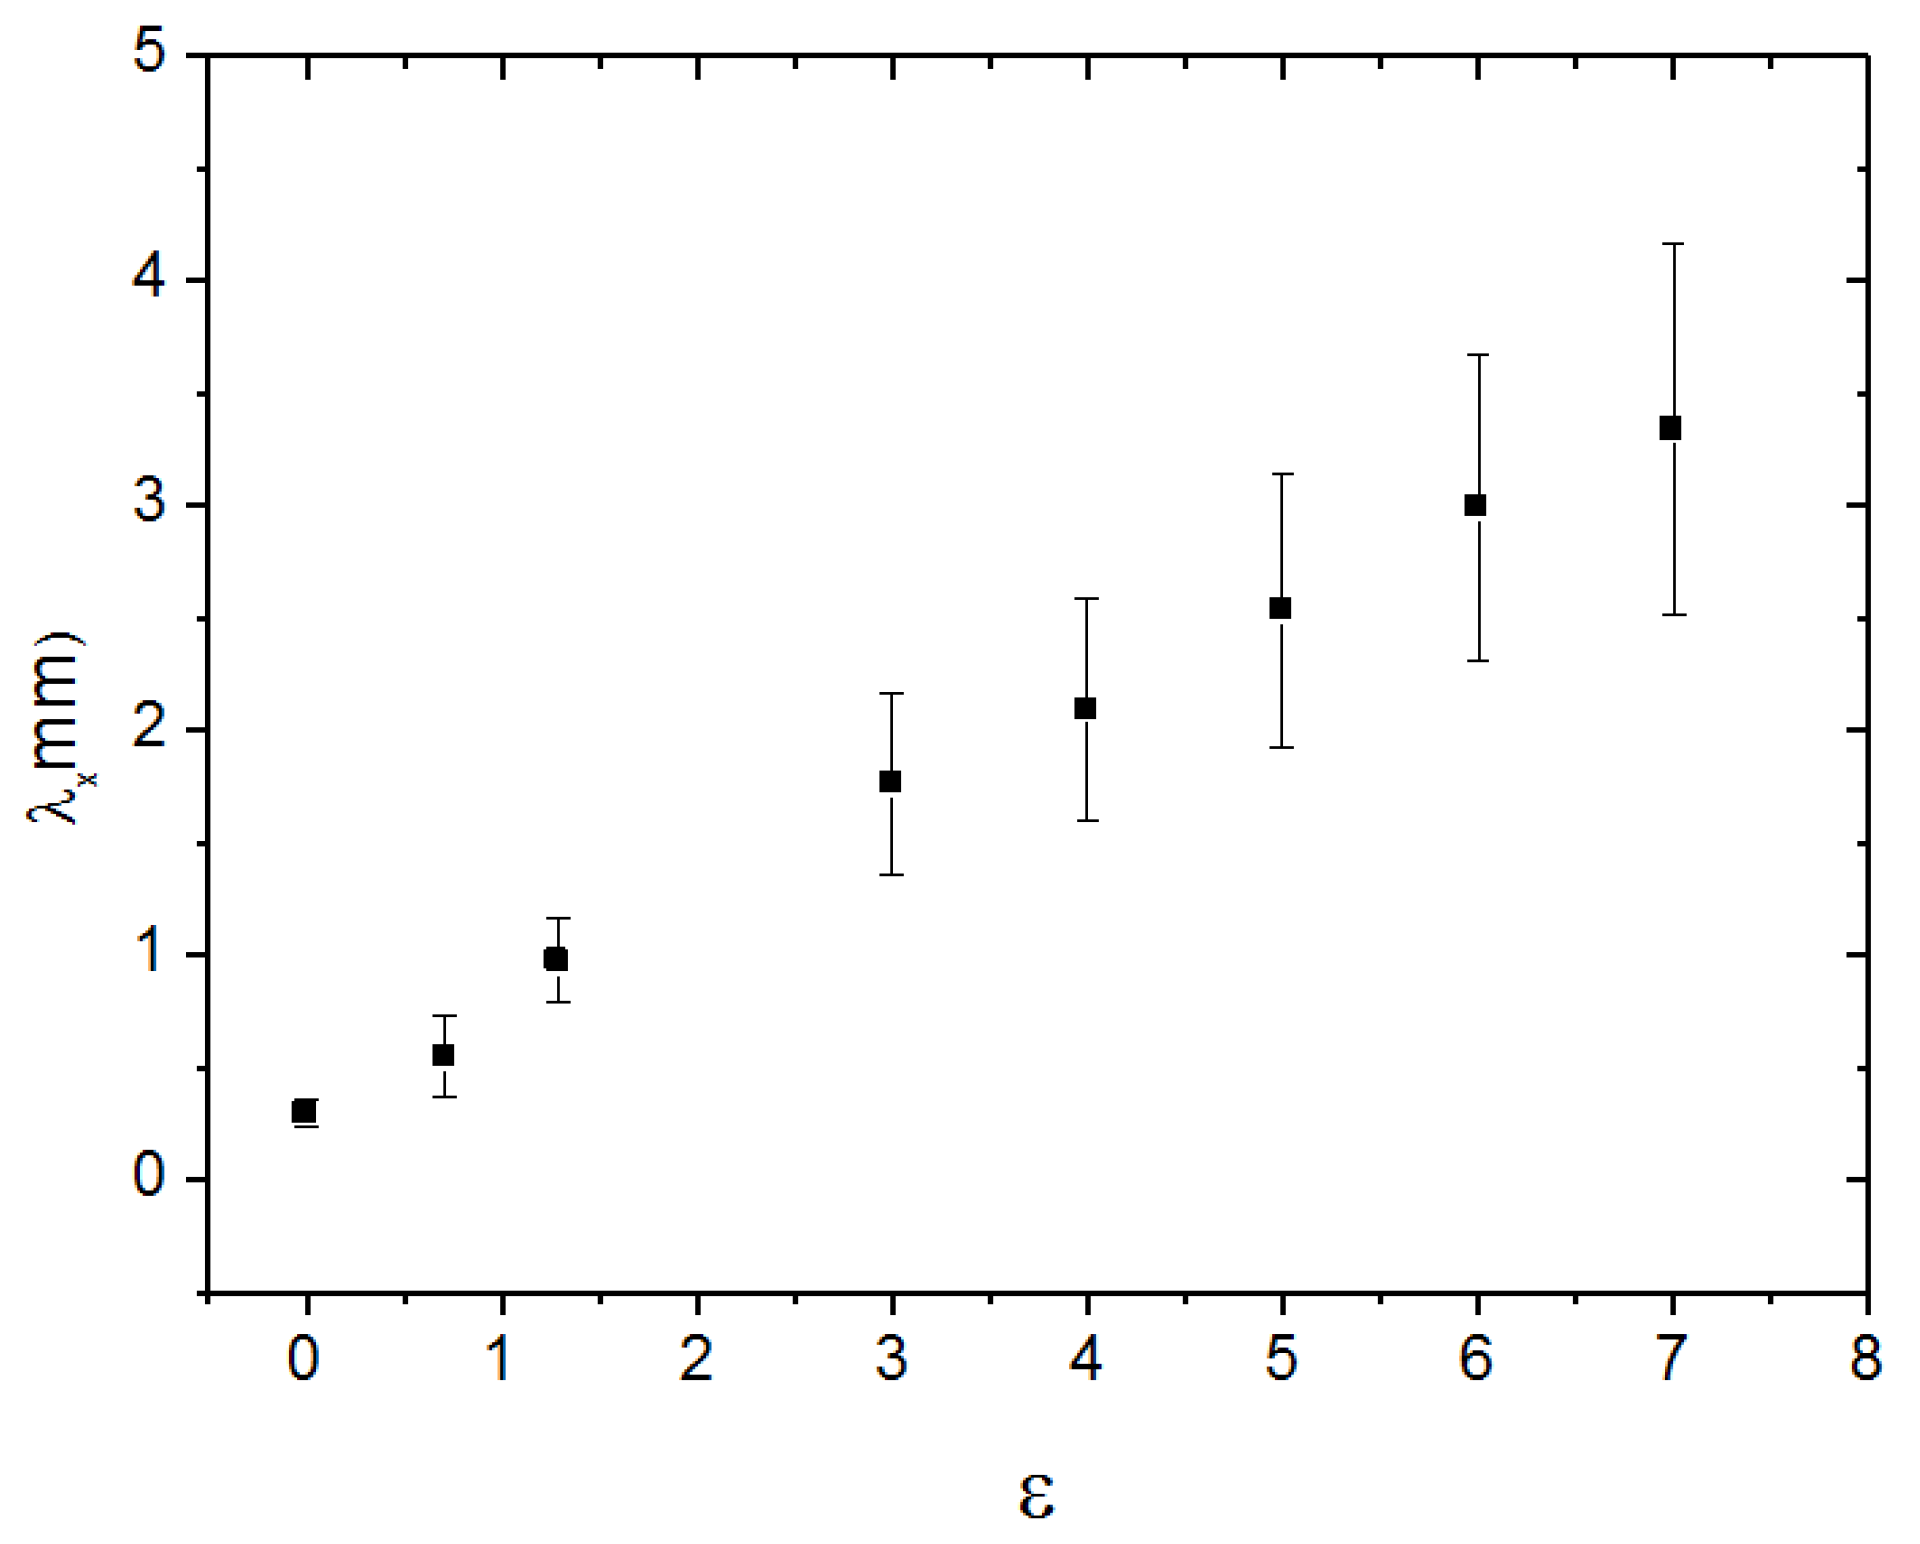
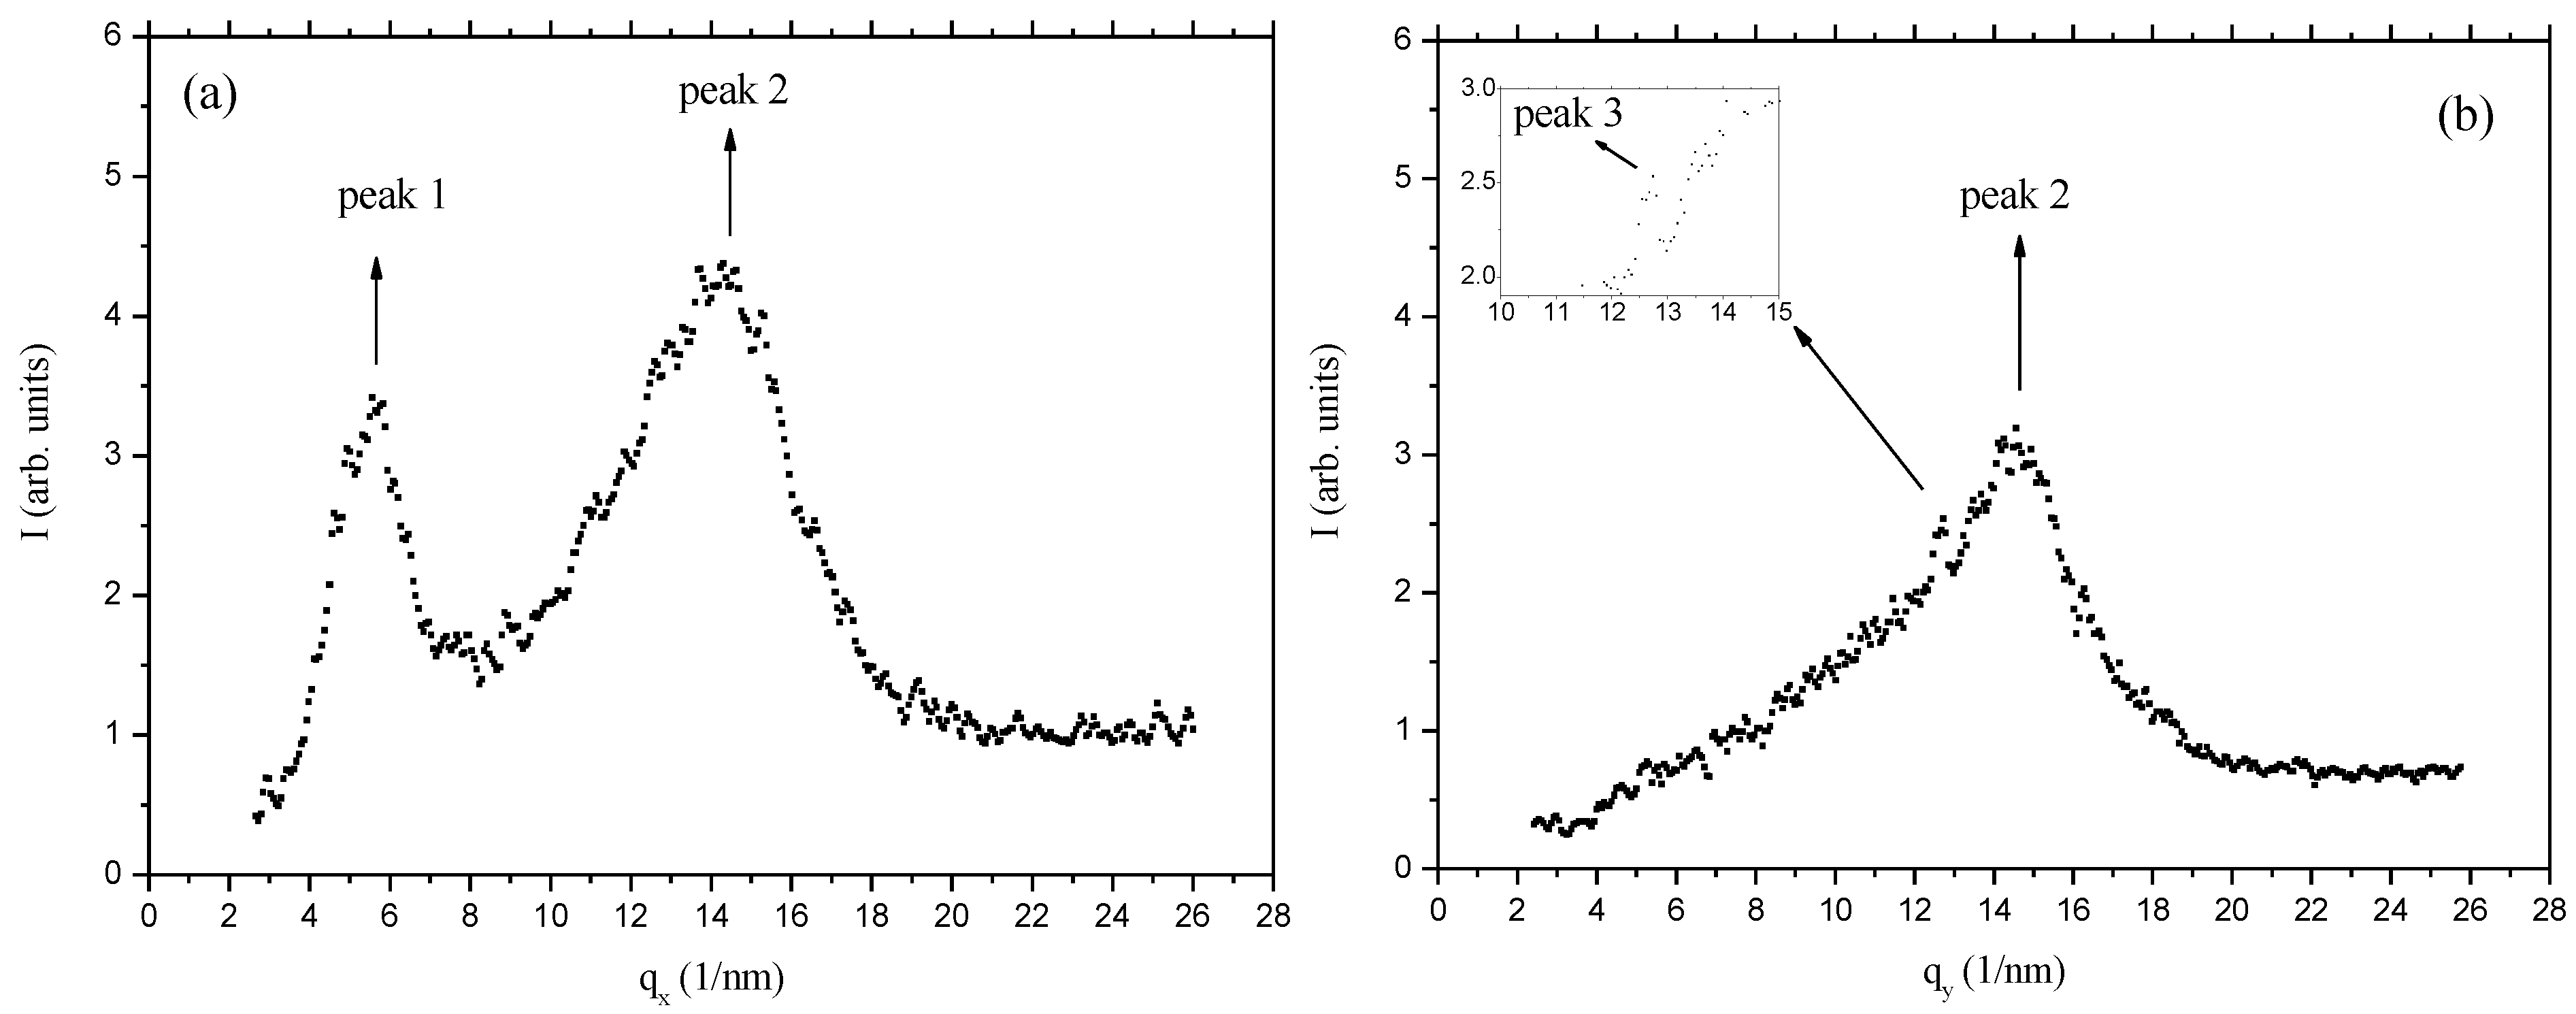
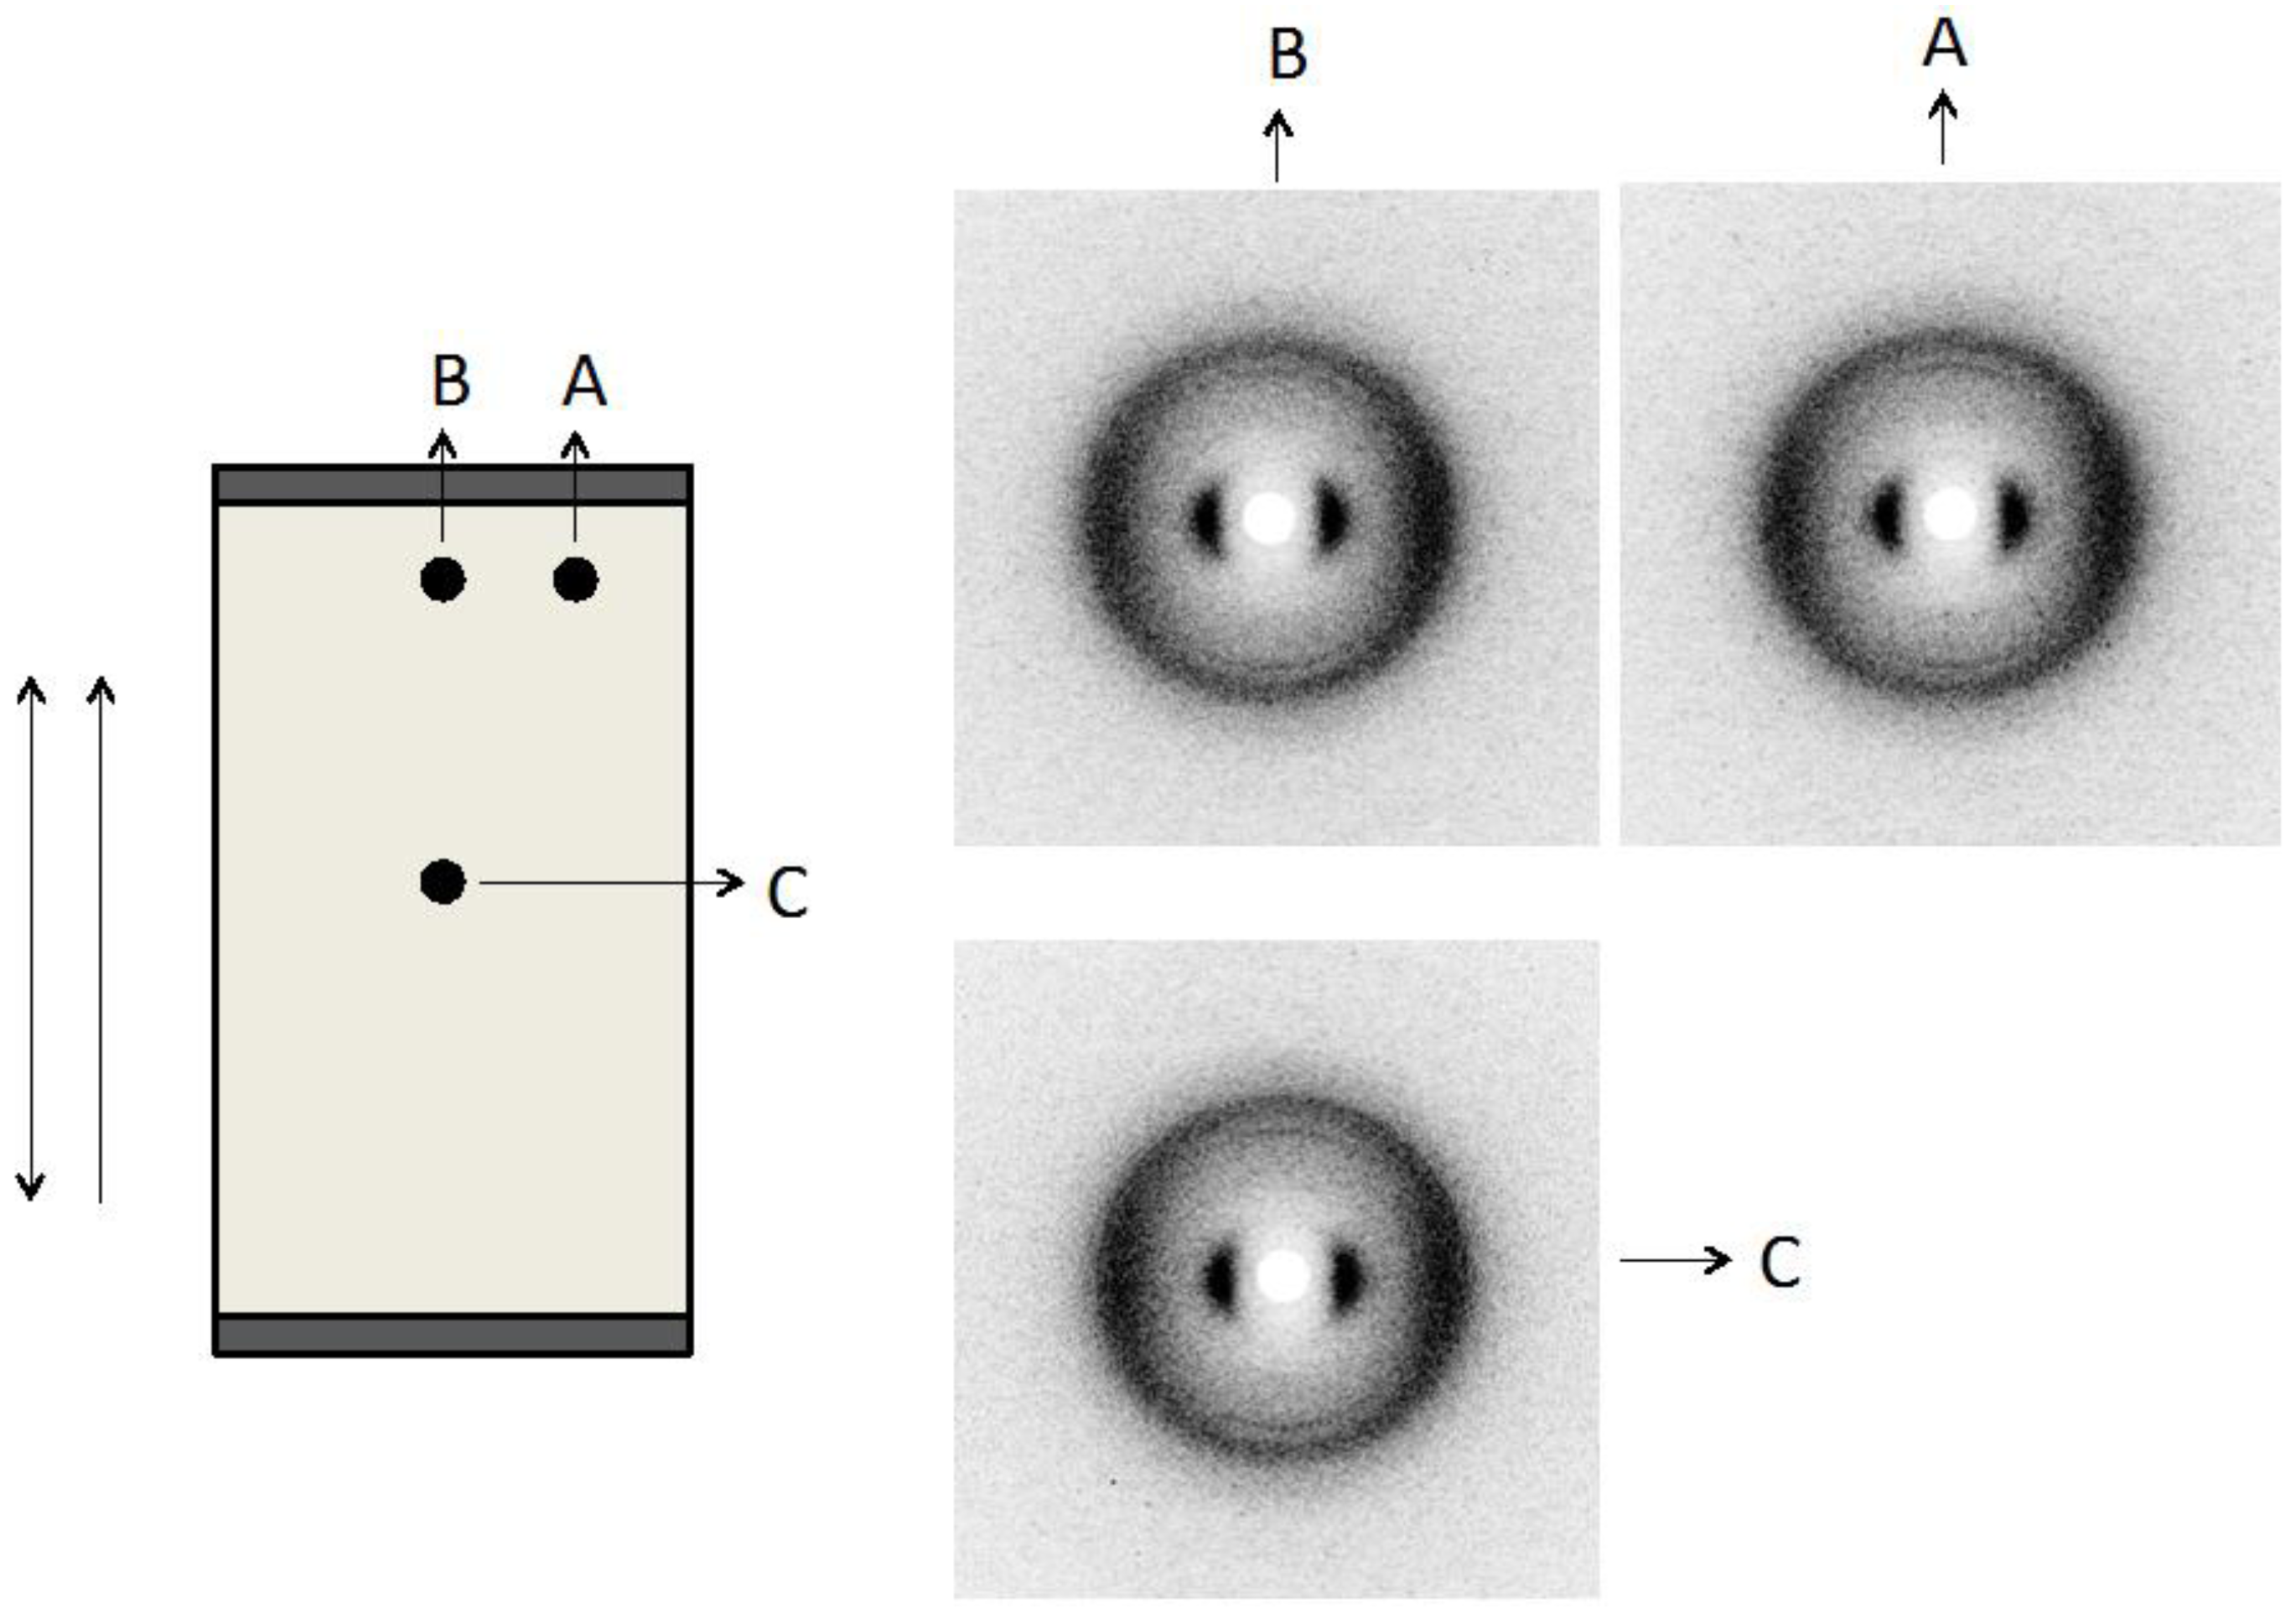
3.2. Wide Angle X-ray Scattering and Polarized Optical Microscopy of Crosslinked APC Films under Strain


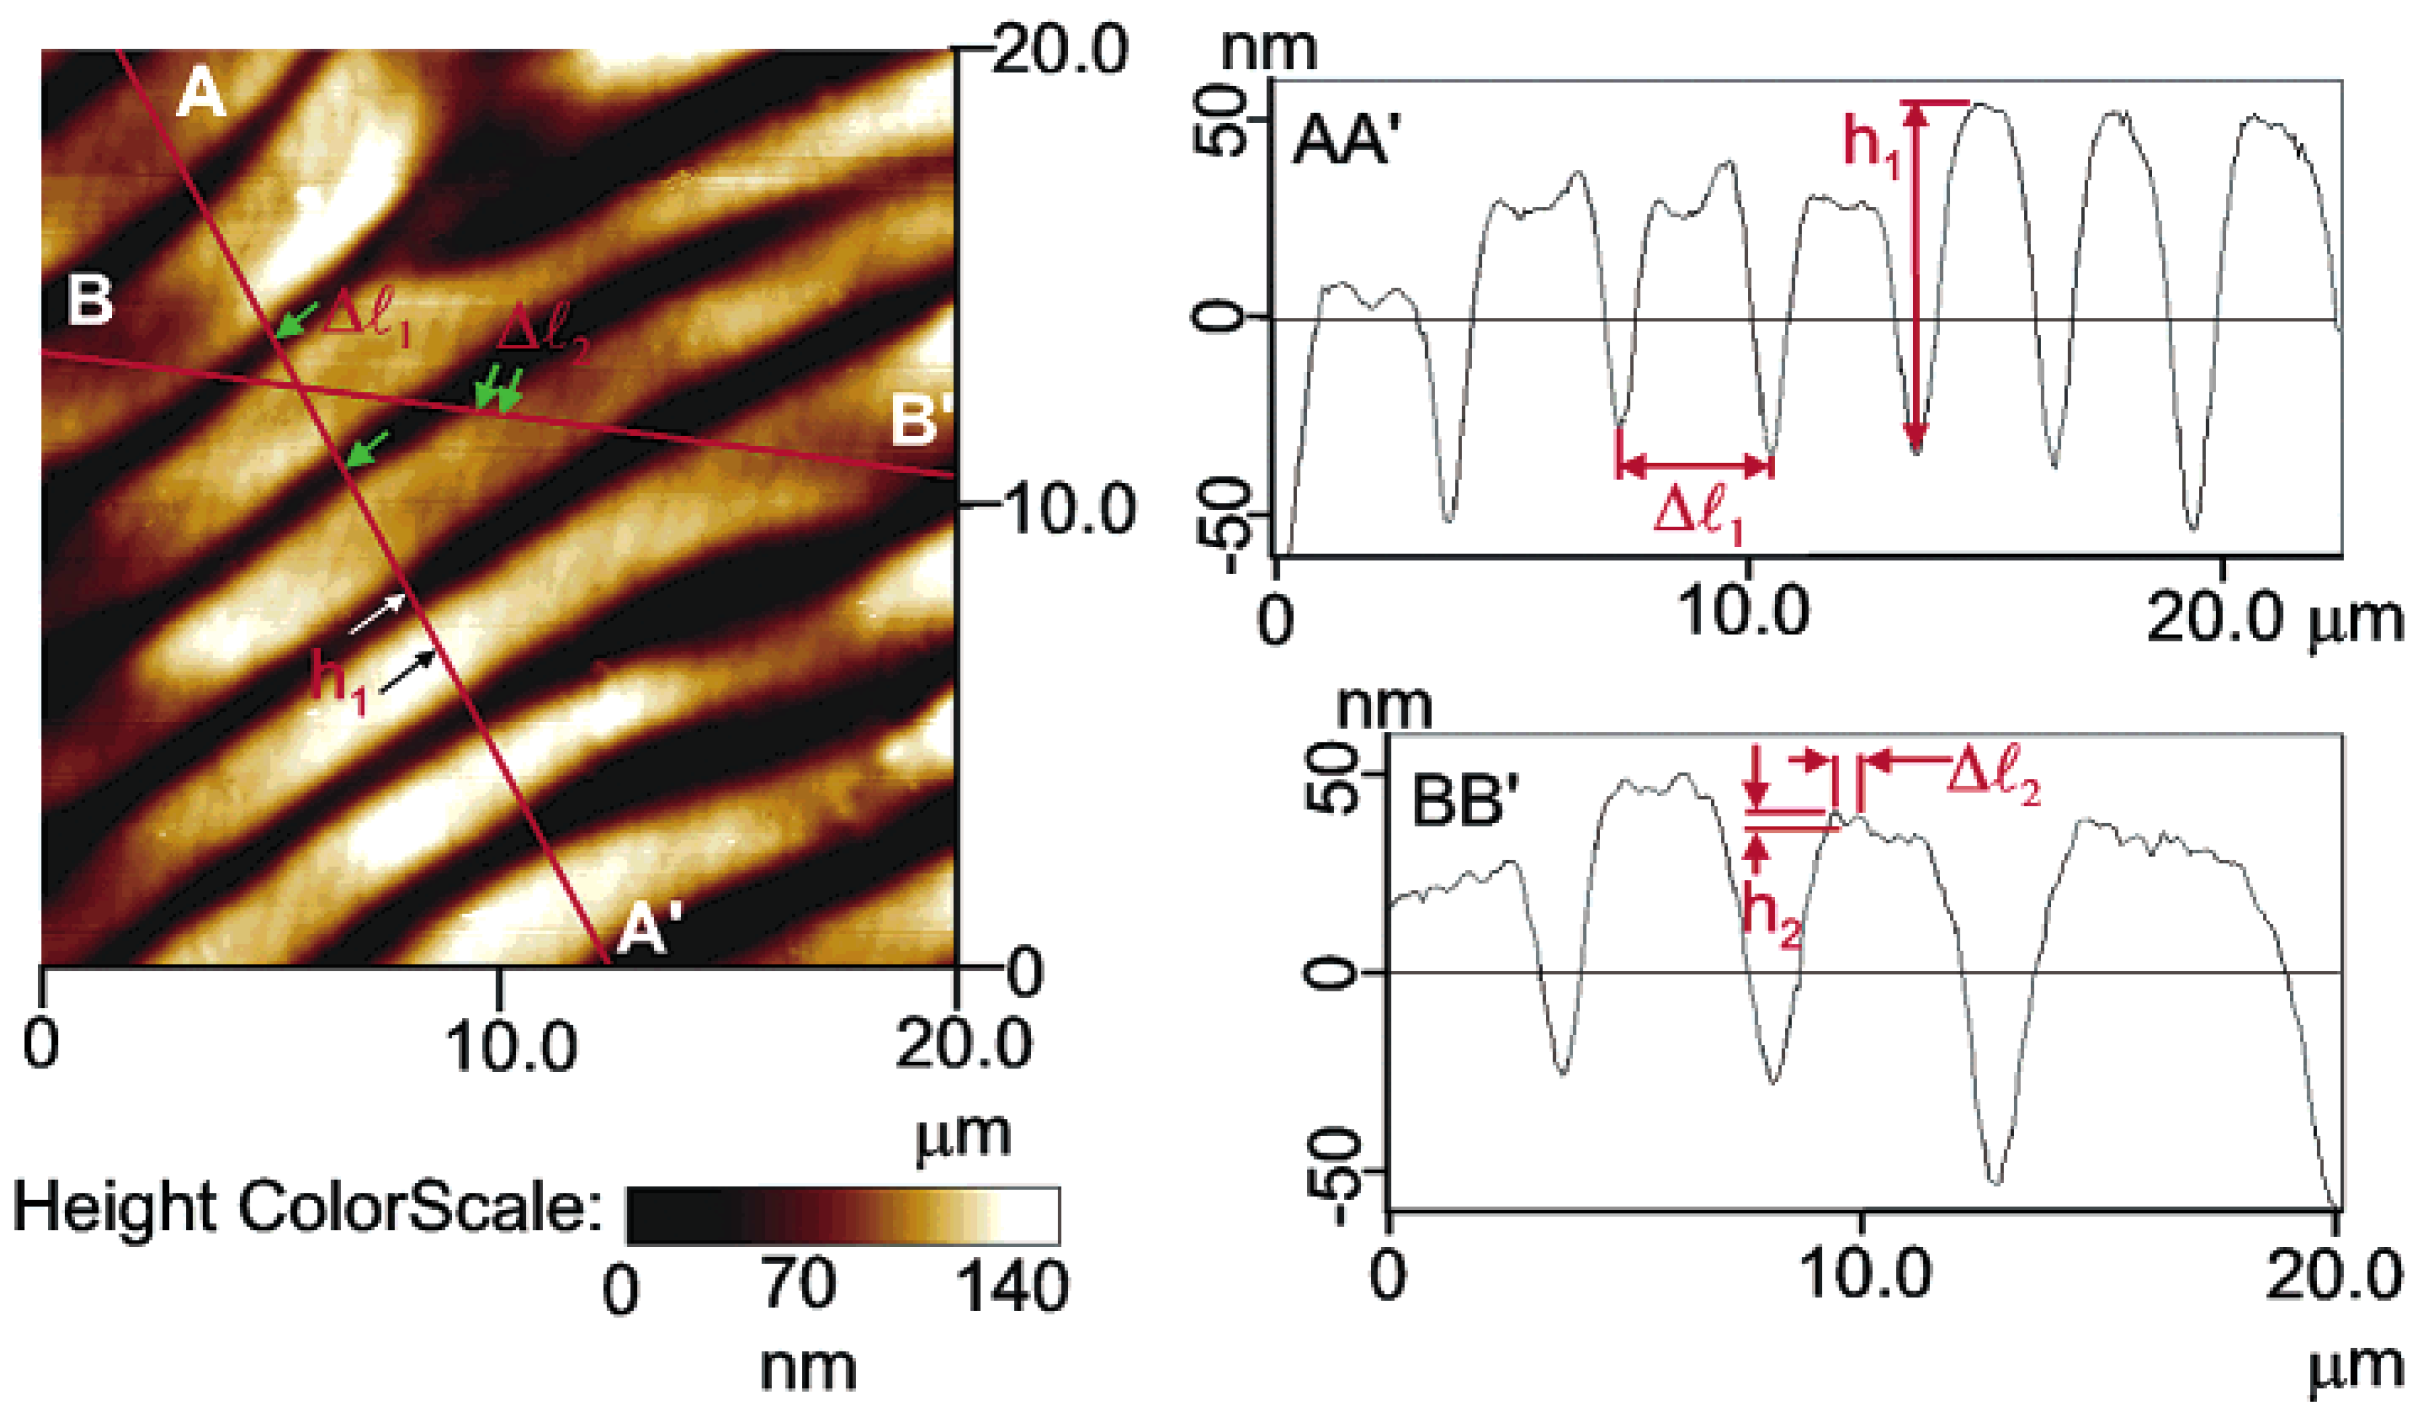
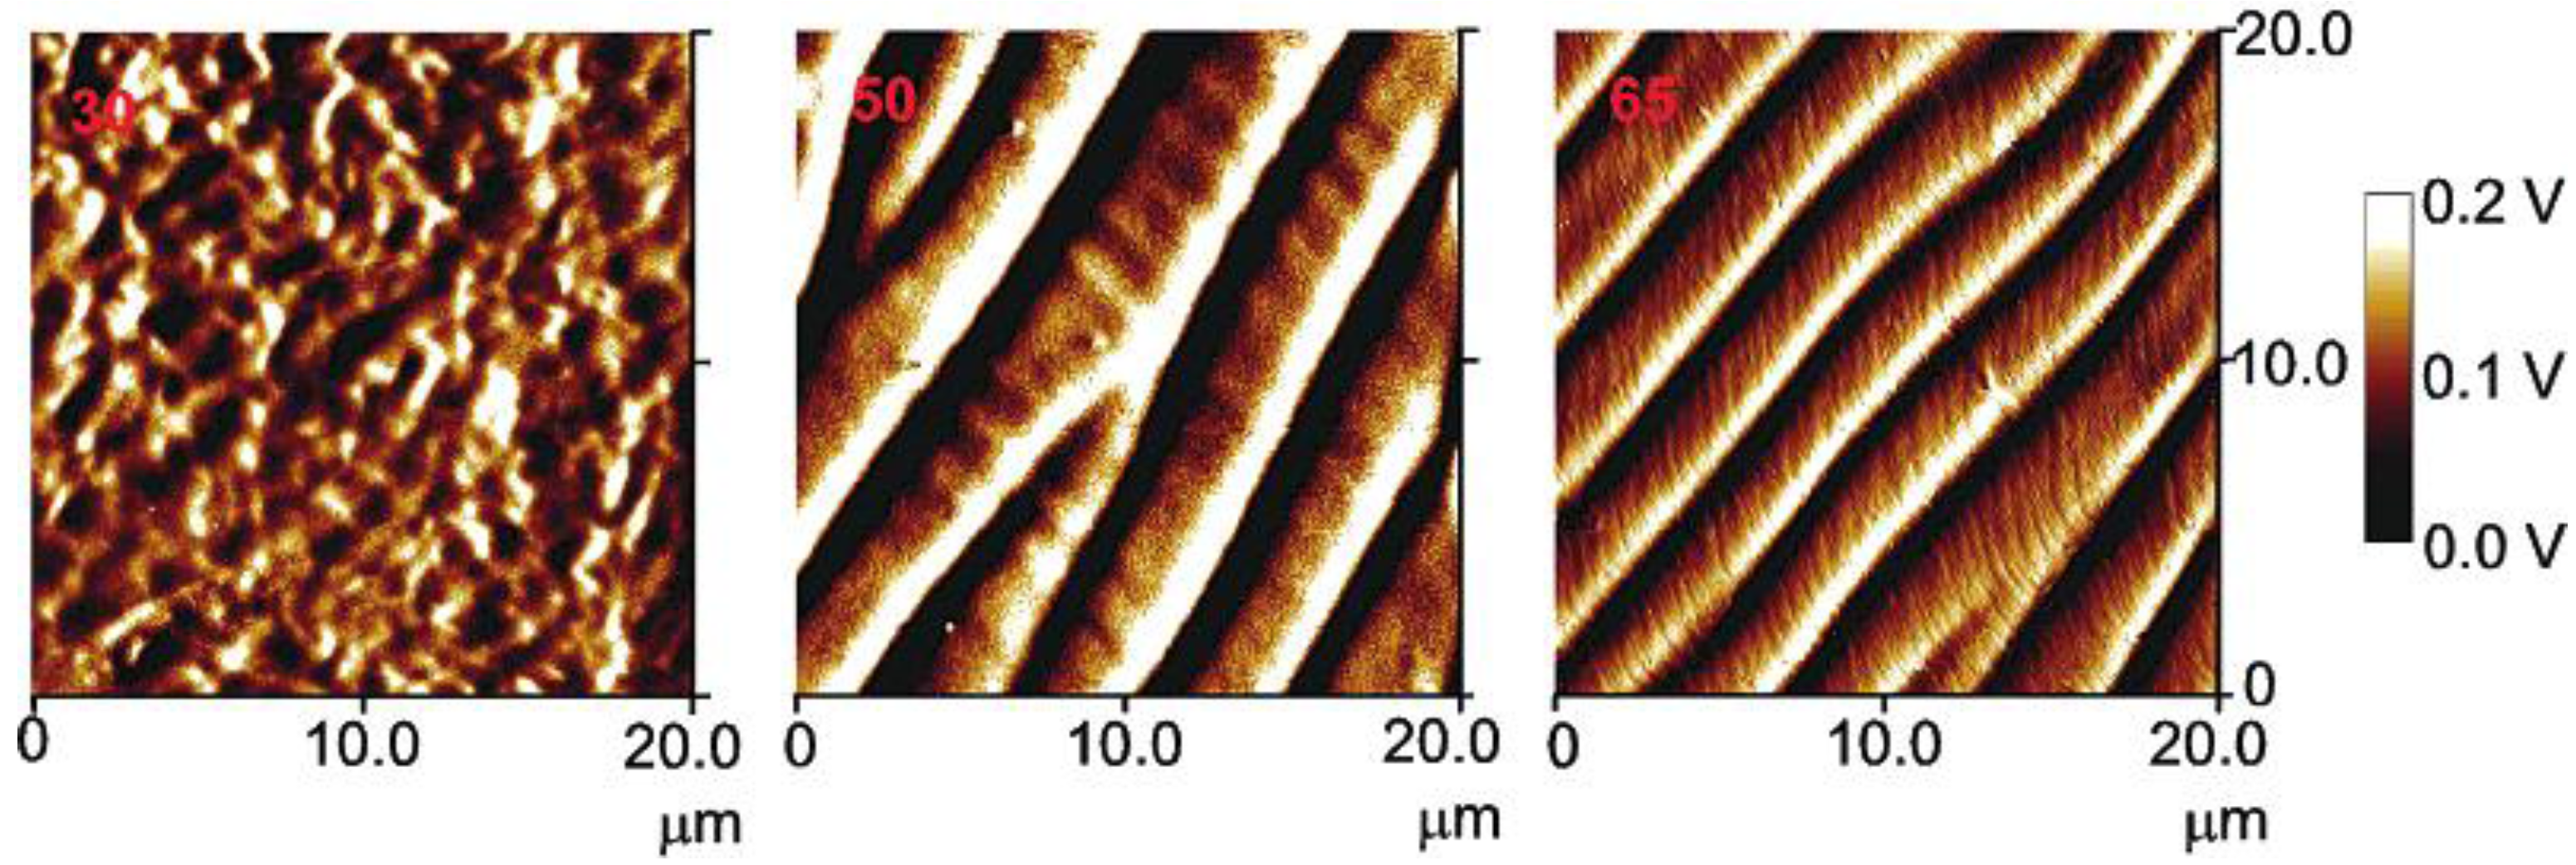
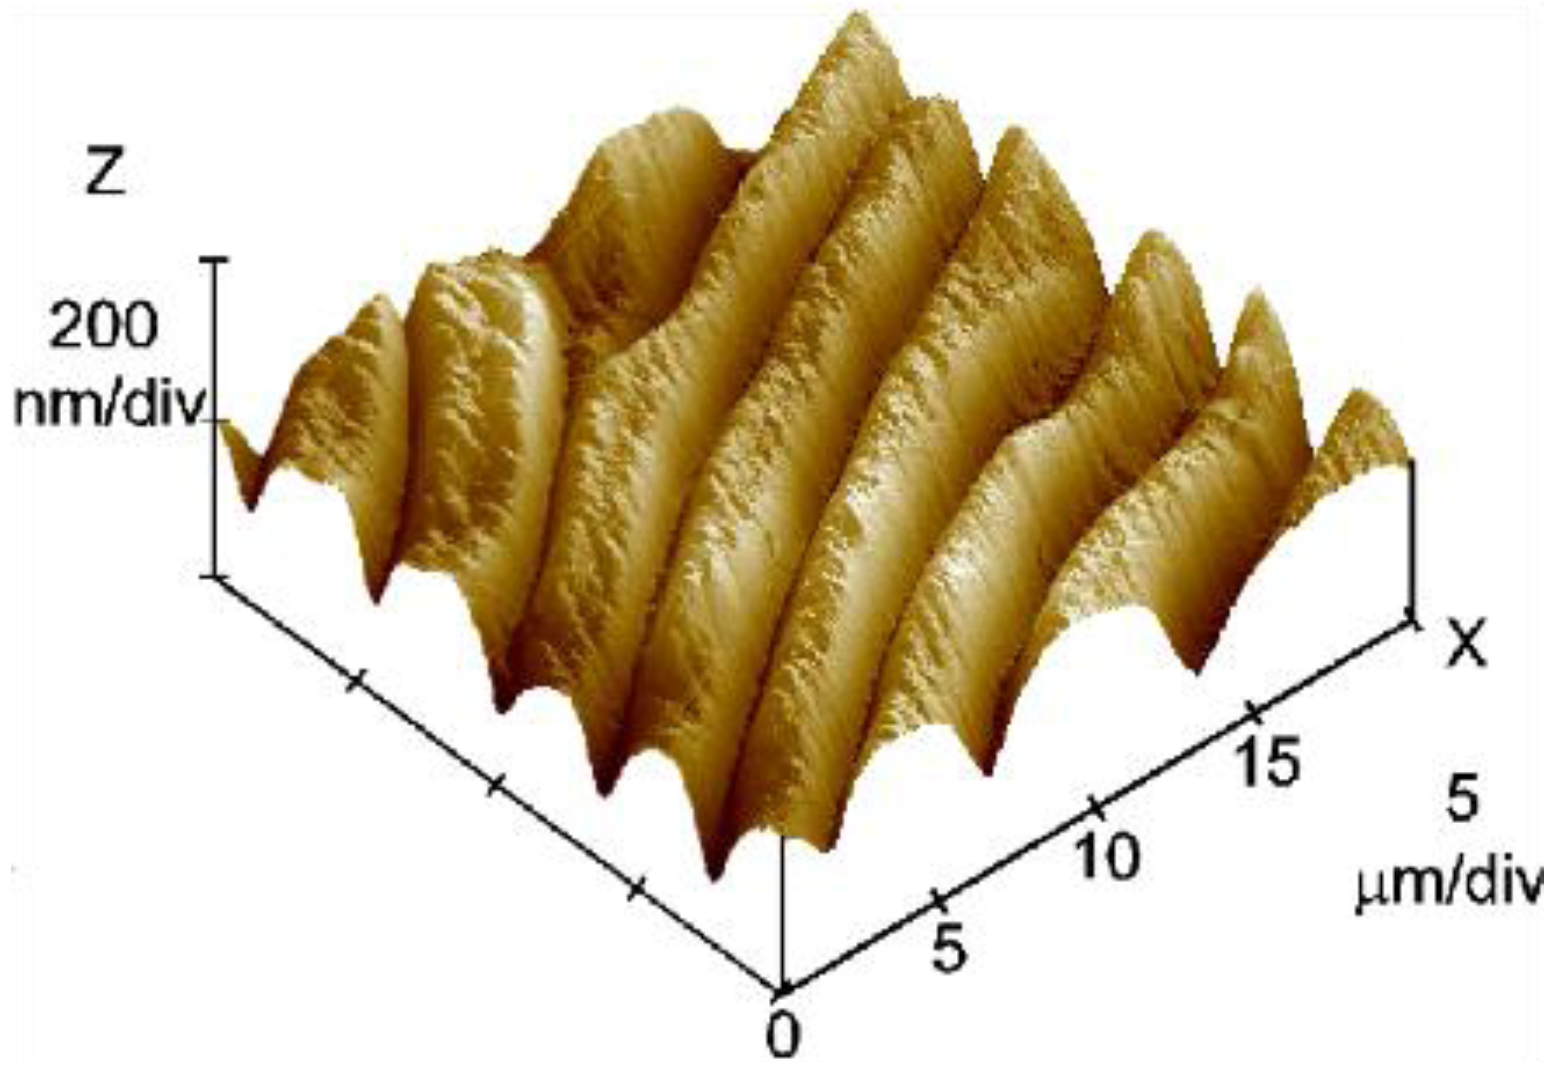
3.3. Atomic Force Microscopy of HPC Films


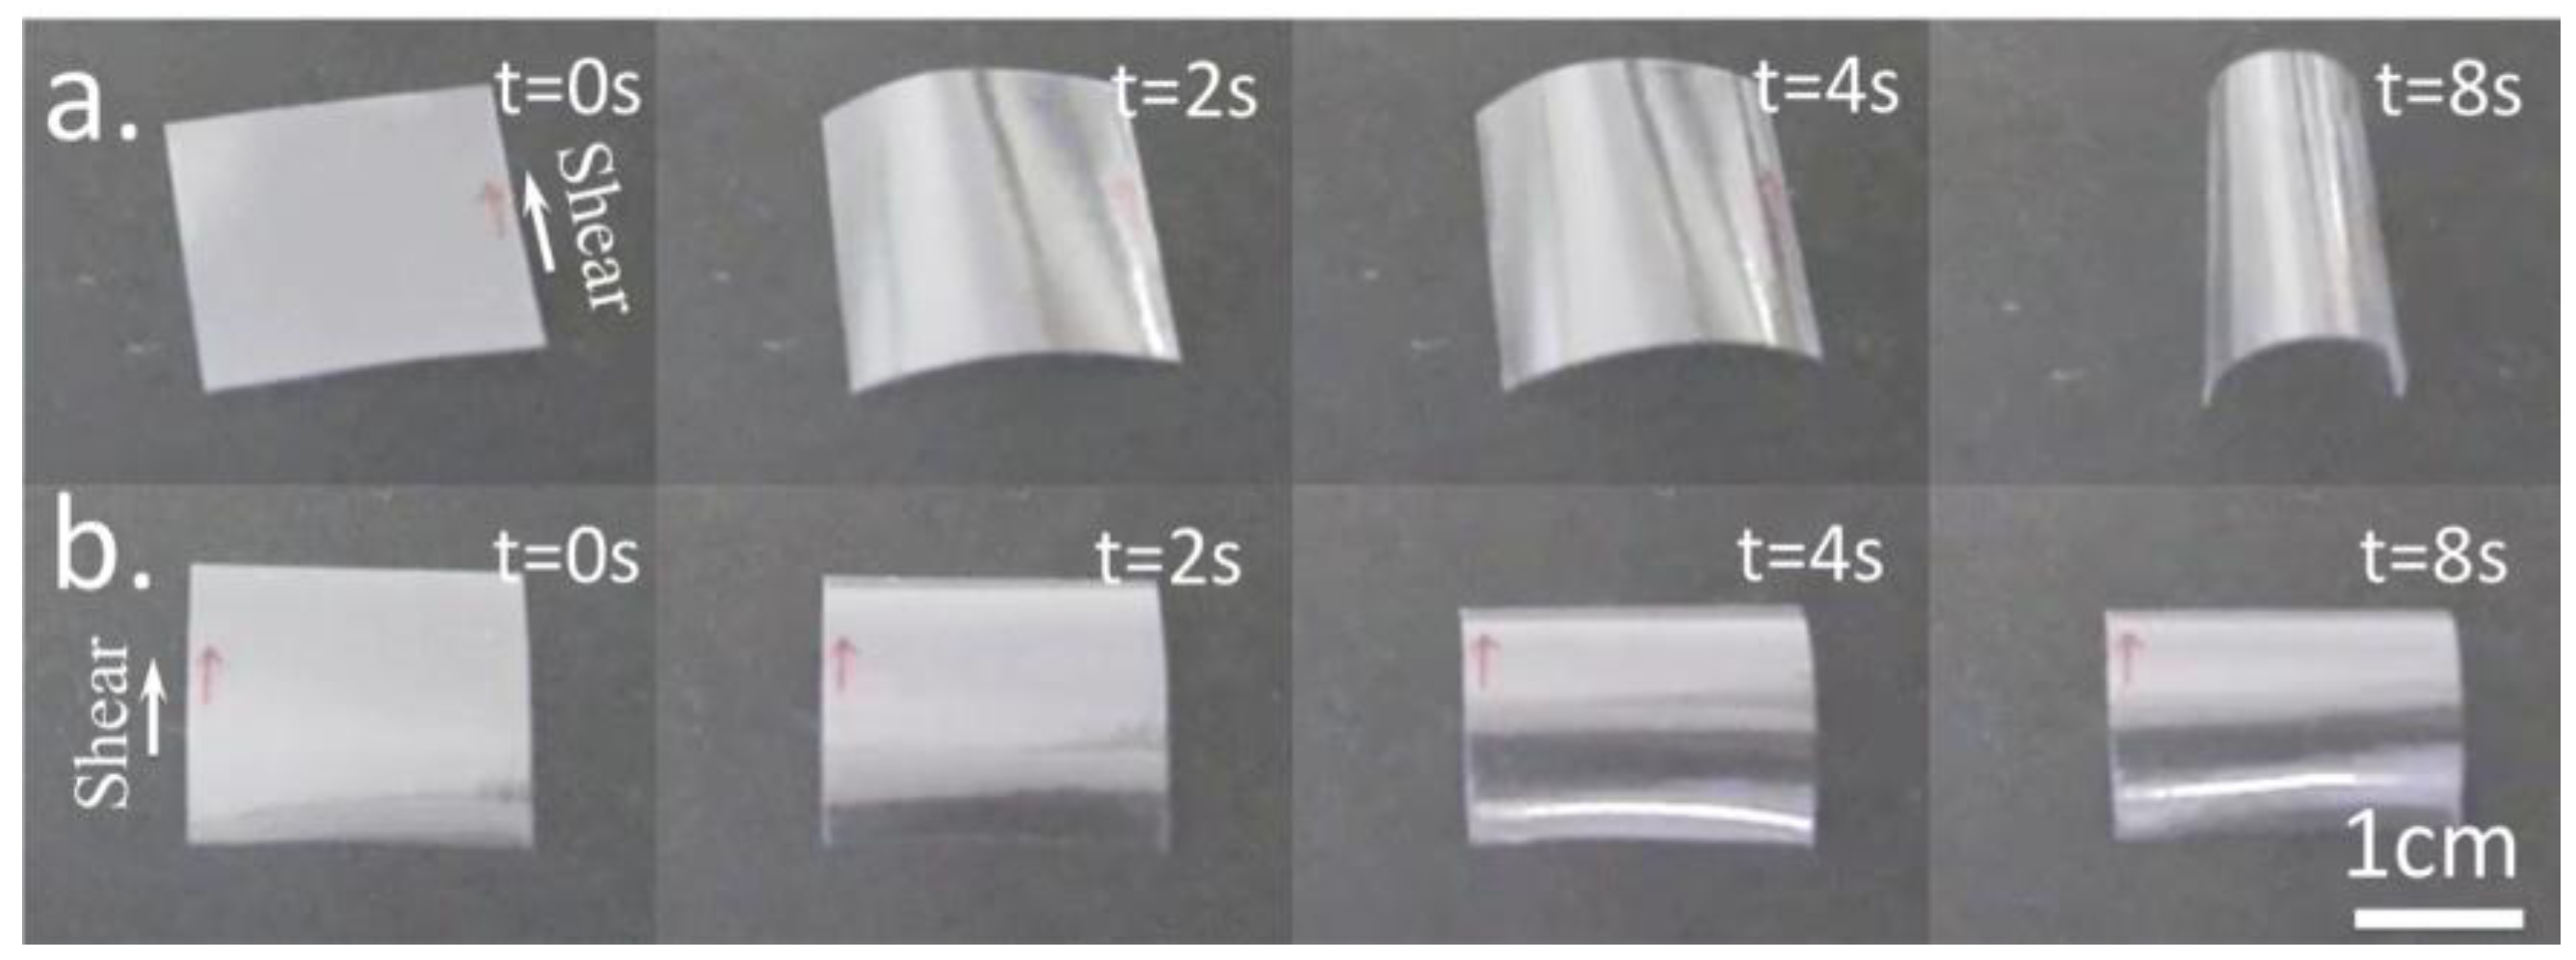
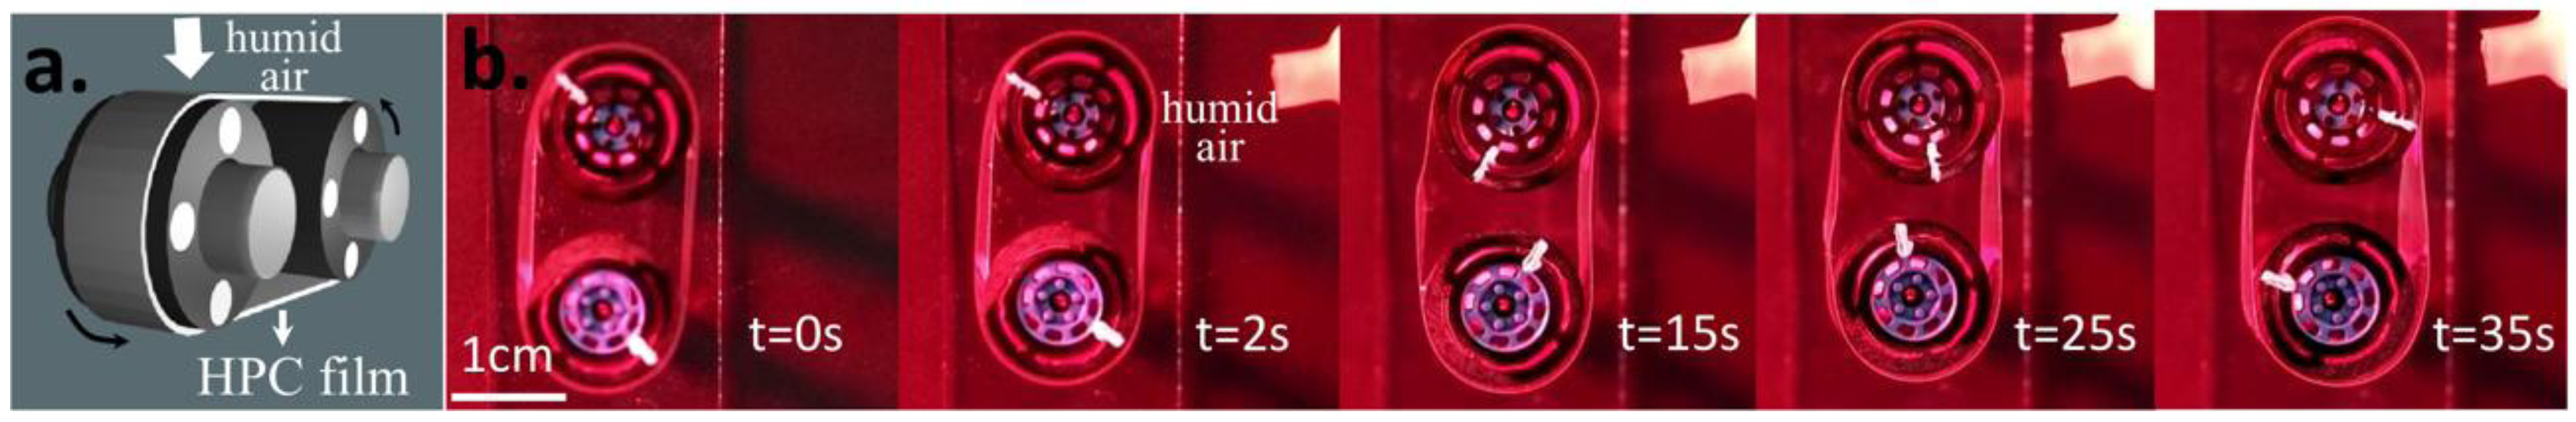
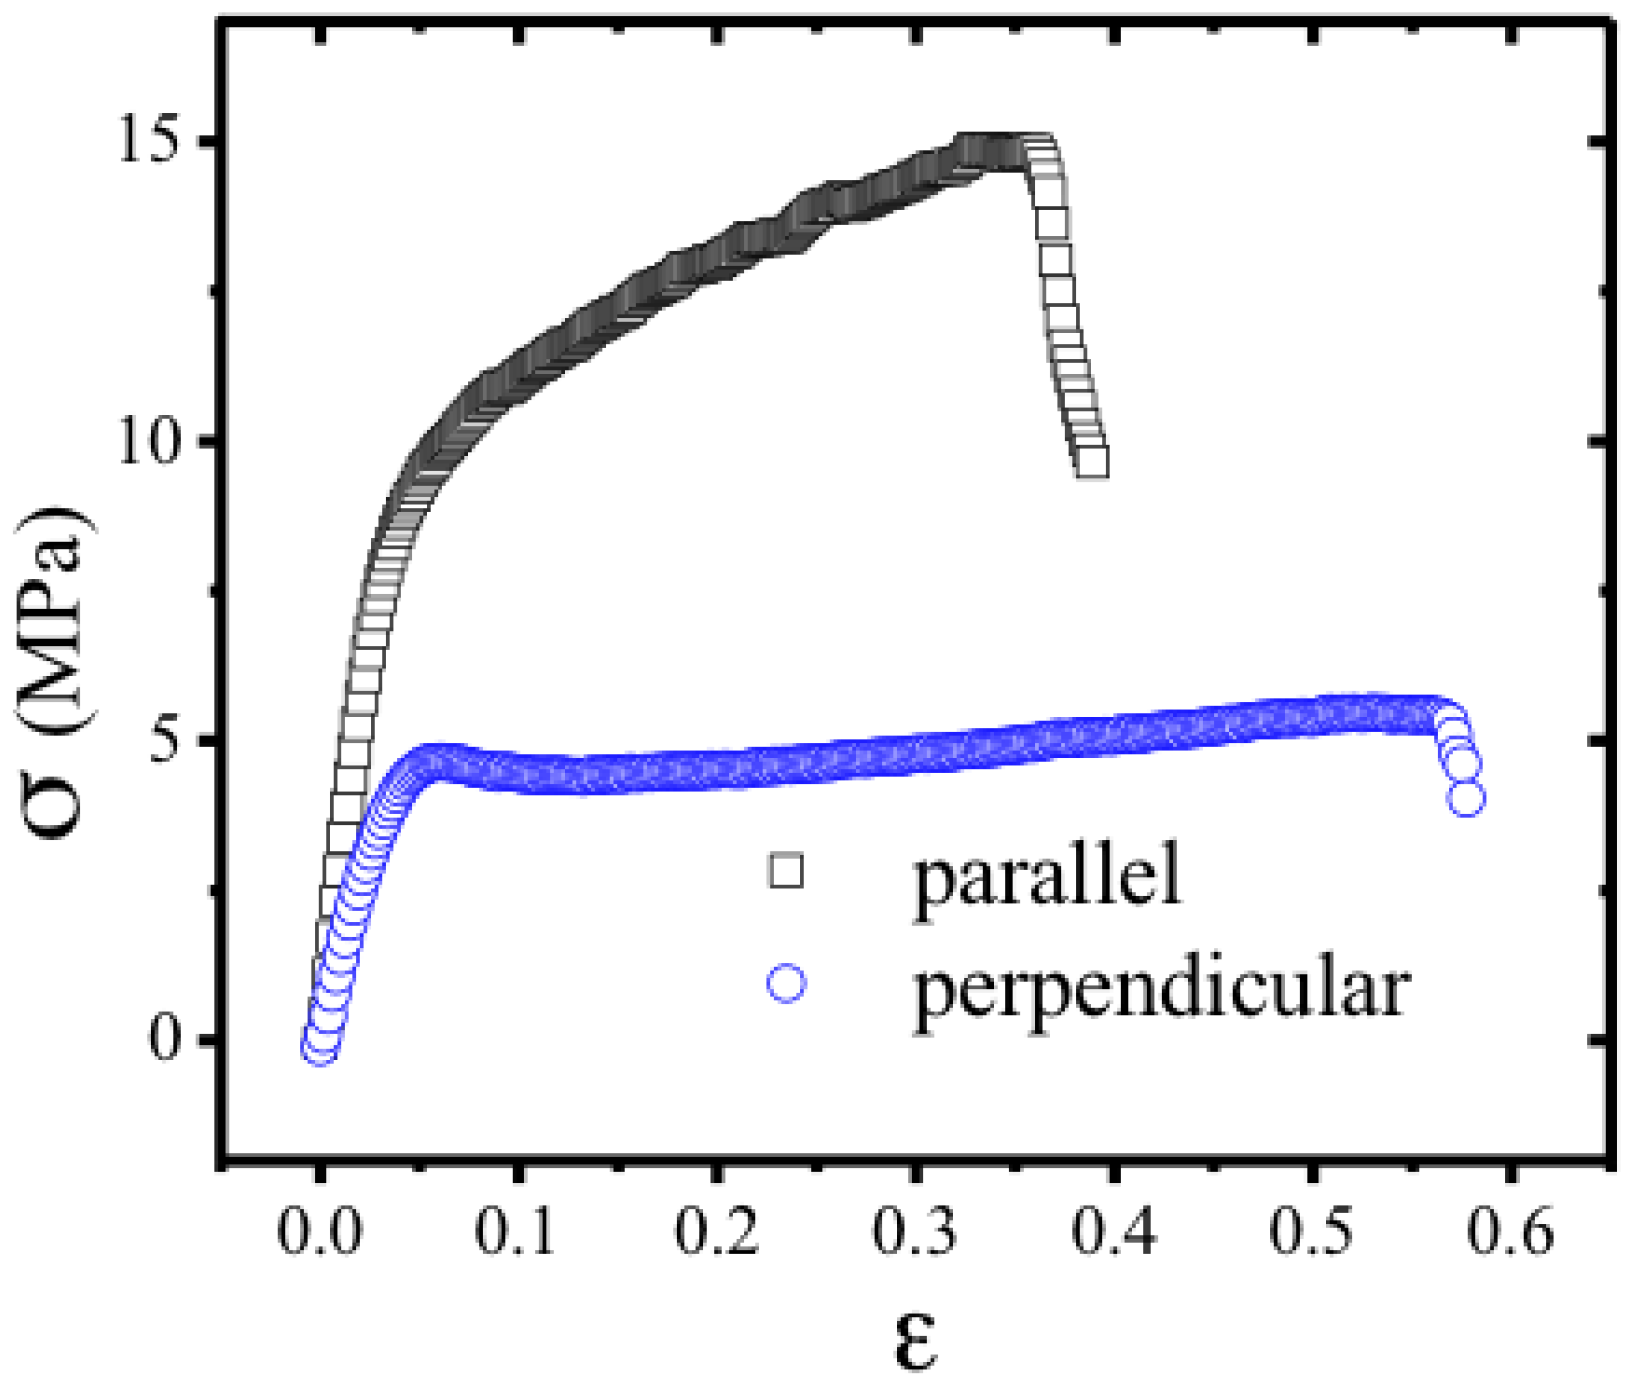
3.4. Mechanical Behavior of Solid Cellulose Derivatives Films


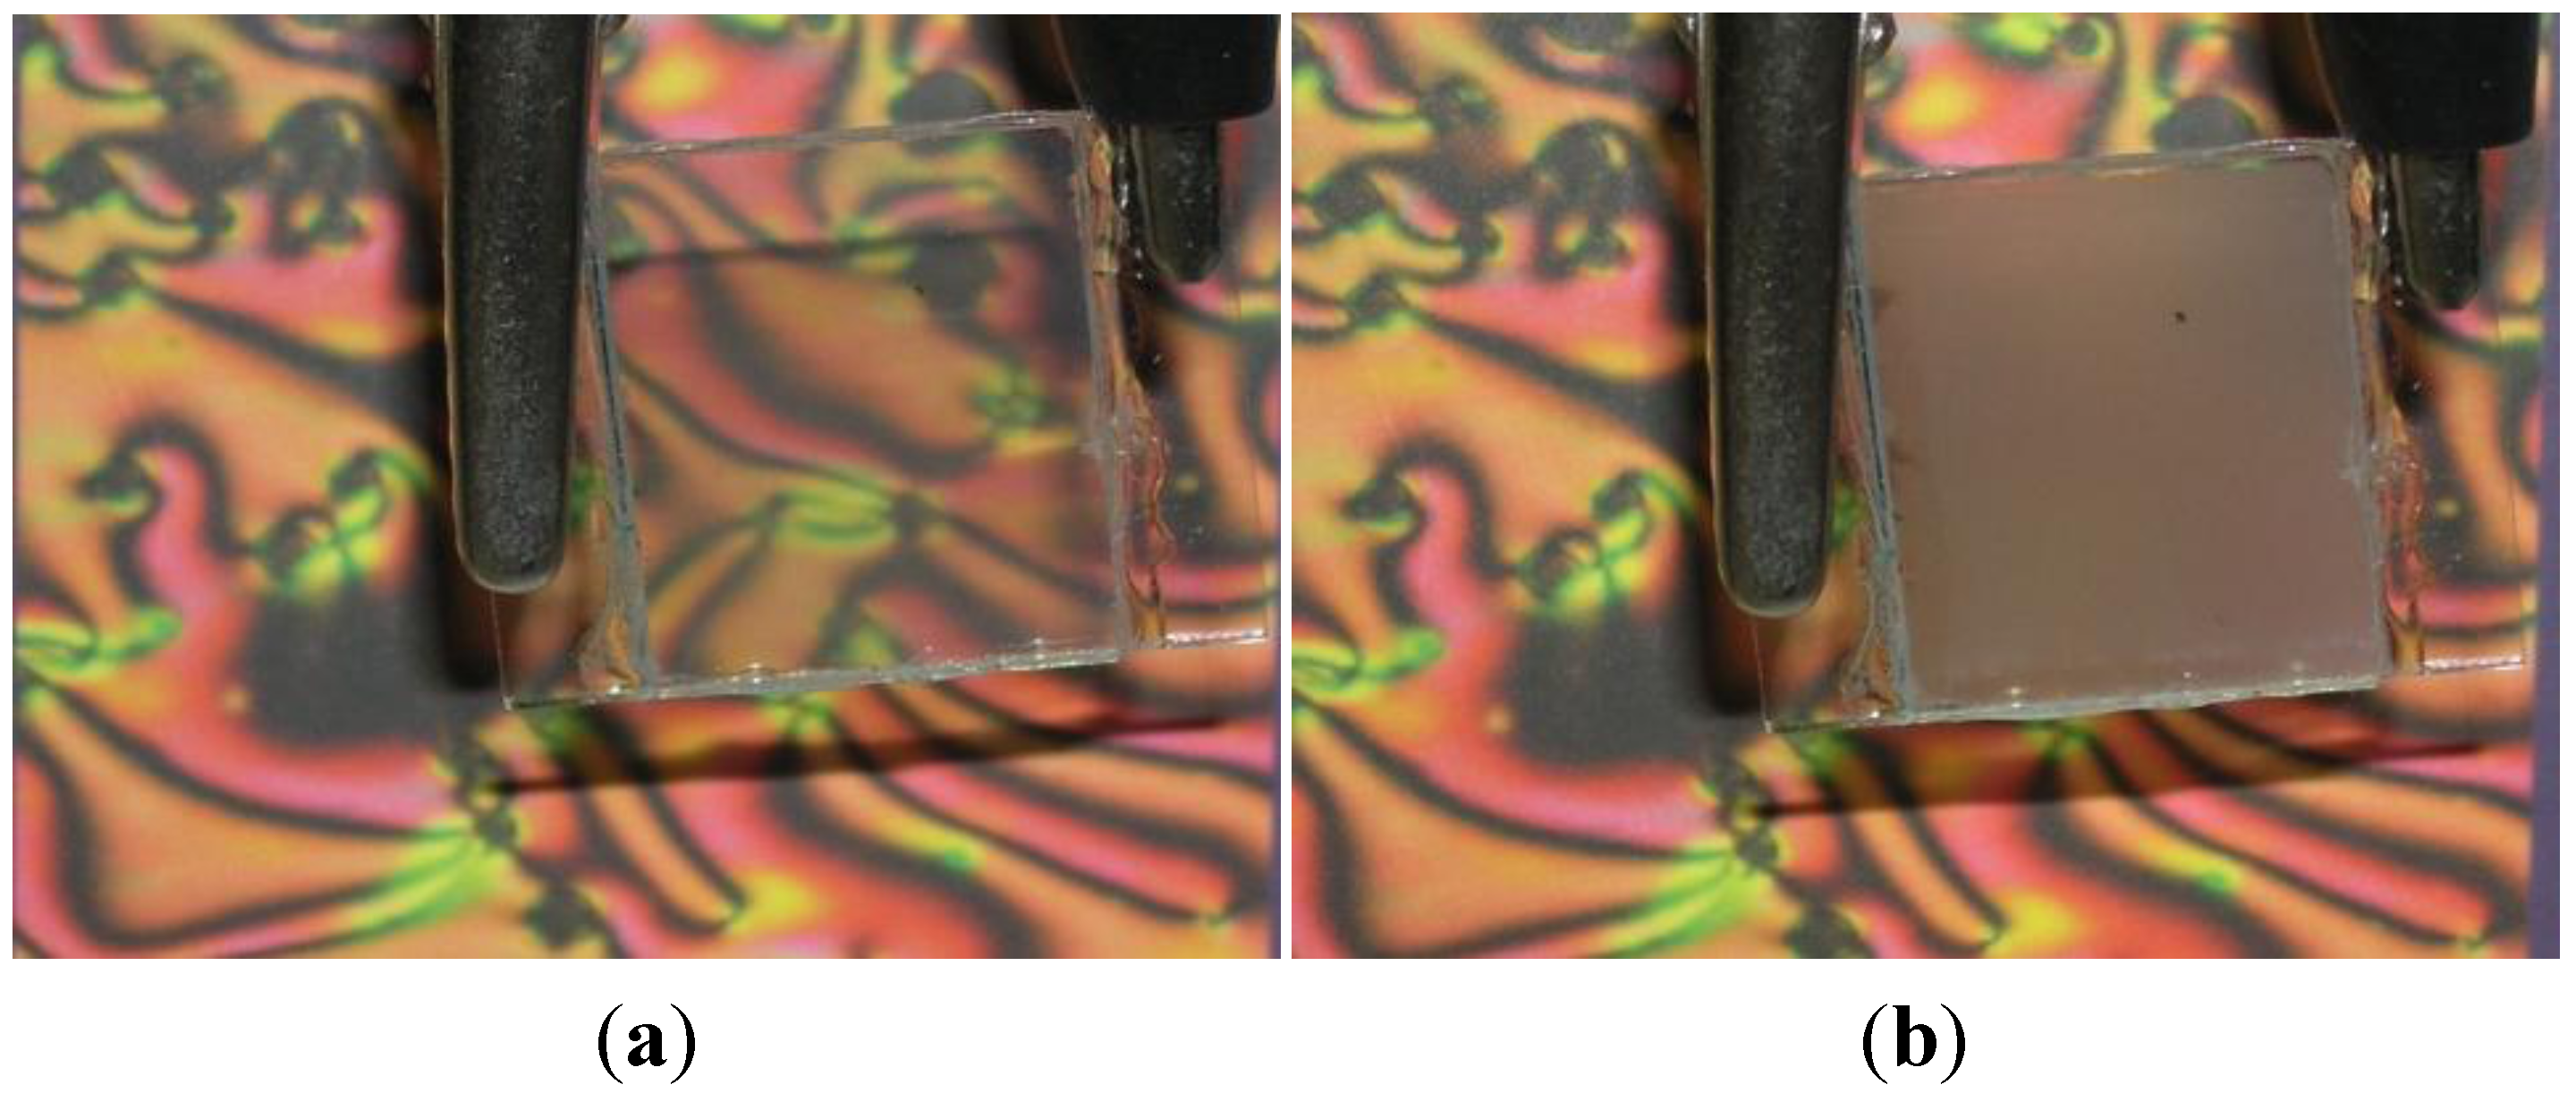
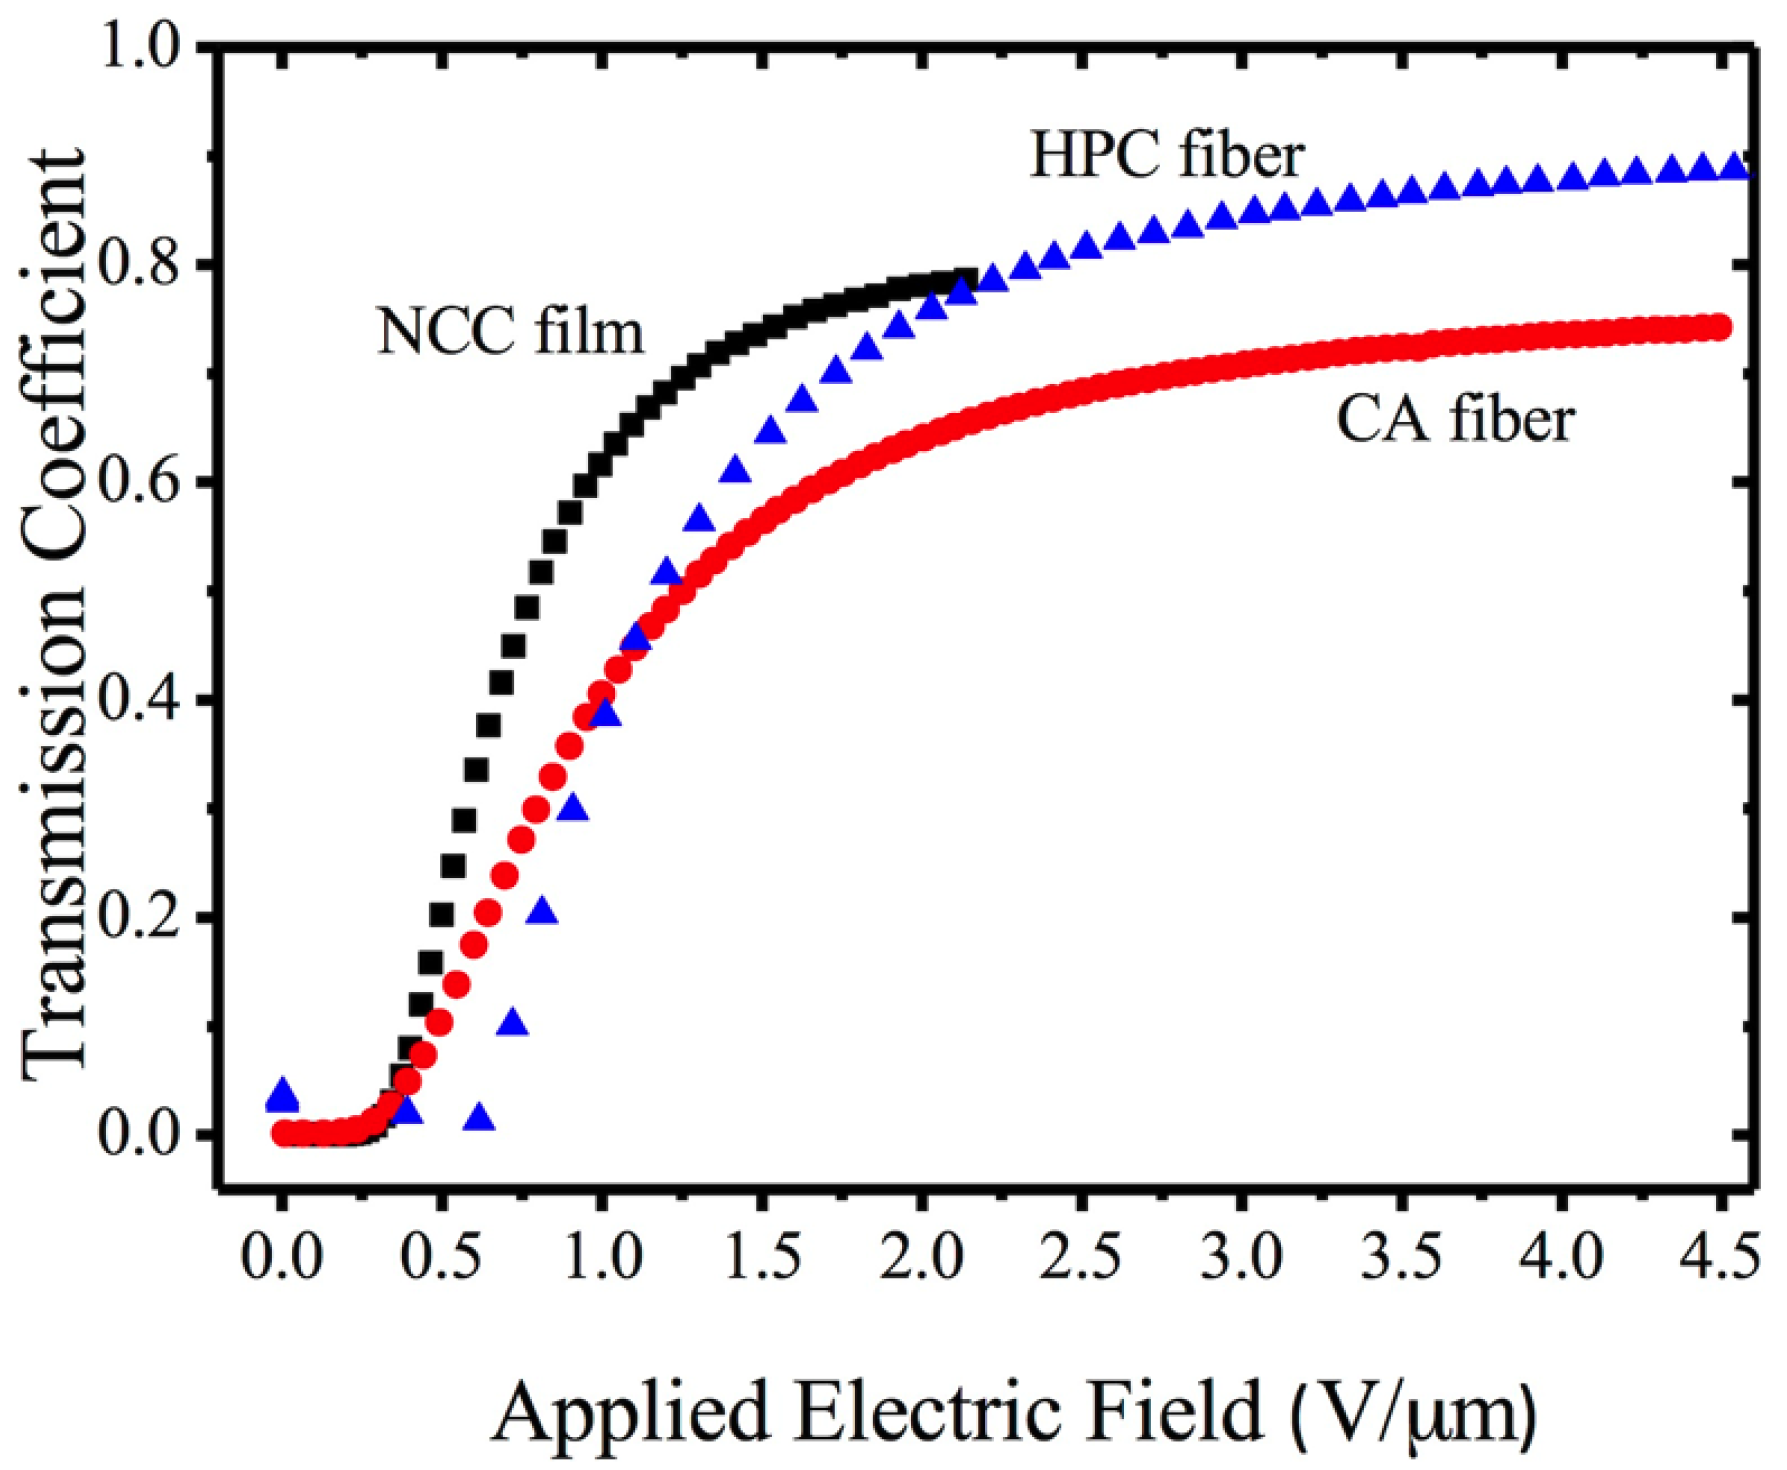
3.5. Cellulose Derivatives Composites in Electro-Optical Applications


4. Summary
Acknowledgments
Conflicts of Interest
Author Contributions
References
- Werbowyj, R.S.; Gray, D.G. Liquid crystalline structure in aqueous hydroxypropyl cellulose solutions. Mol. Cryst. Liq. Cryst. 1976, 34, 97–103. [Google Scholar] [CrossRef]
- Werbowyj, R.S.; Gray, D.G. Optical-properties of (hydroxypropyl) cellulose liquid-crystals—Cholesteric pitch and polymer concentration. Macromolecules 1984, 17, 1512–1520. [Google Scholar] [CrossRef]
- Kimura, H.; Hosino, M.; Nakano, H. Temperature dependent pitch in cholesteric. J. Phys. Soc. Jpn. 1982, 51, 1584–1590. [Google Scholar] [CrossRef]
- Werbowyj, R.S.; Gray, D.G. Ordered phase formation in concentrated hydroxypropylcellulose solutions. Macromolecules 1980, 13, 69–73. [Google Scholar] [CrossRef]
- Charlet, G.; Gray, D.G. Solid cholesteric films cast from aqueous (hydroxypropy1). Cellulose 1987, 20, 33–38. [Google Scholar]
- Nishio, Y.; Kai, T.; Kimura, N.; Oshima, K.; Suzuki, H. Controlling the selective light reflection of a cholesteric liquid crystal of (hydroxypropyl)cellulose by electrical stimulation. Macromolecules 1998, 31, 2384–2386. [Google Scholar] [CrossRef]
- Chiba, R.; Nishio, Y.; Miyashita, Y. Electrooptical behavior of liquid-crystalline (hydroxypropyl)cellulose/inorganic salt aqueous solutions. Macromolecules 2003, 36, 1706–1712. [Google Scholar]
- Nishio, Y.; Chiba, R.; Miyashita, Y.; Oshima, K.; Miyajima, T.; Kimura, N.; Suzuki, H. Salt addition effects on mesophase structure and optical properties of aqueous hydroxypropyl cellulose solutions. Polym. J. 2002, 34, 149–157. [Google Scholar] [CrossRef]
- Shimamoto, S.; Uraki, Y.; Sano, Y. Optical properties and photopolymerization of liquid crystalline (acetyl) (ethyl) cellulose/acrylic acid system. Cellulose 2000, 7, 247–358. [Google Scholar] [CrossRef]
- Guo, J.X.; Gray, D.G. Effect of degree of acetylation and solvent on the chiroptical properties of lyotropic (acetyl)(ethyl) cellulose solutions. J. Polym. Sci. Part B Polym. Phys. 1994, 32, 2529–2537. [Google Scholar] [CrossRef]
- Gray, D.G. Chiral nematic ordering of polysaccharides. Carbohydr. Polym. 1994, 25, 277–284. [Google Scholar]
- Ito, M.; Teramoto, Y.; Nishio, Y. Electrooptical behavior of aqueous (hydroxypropyl)cellulose liquid crystals containing imidazolium salts. Biomacromolecules 2012, 13, 565–569. [Google Scholar] [CrossRef]
- Chiba, R.; Ito, M.; Nishio, Y. Addition effects of imidazolium salts on mesophase structure and optical properties of concentrated hydroxypropylcellulose aqueous solutions. Polym. J. 2010, 42, 232–241. [Google Scholar] [CrossRef]
- Muller, M.; Zentel, R. Cholesteric phases and films from cellulose derivatives. Macromol. Chem. Phys. 2000, 201, 2055–2063. [Google Scholar] [CrossRef]
- Wenzlik, D.; Zentel, R. High optical quality films of liquid crystalline cellulose derivatives in acrylates. Macromol. Chem. Phys. 2013, 214, 2405–2414. [Google Scholar] [CrossRef]
- Bhadani, S.N.; Gray, D.G. Crosslinked cholesteric network from the acrylic-acid ester of (hydroxypropyl) cellulose. Mol. Cryst. Liq. Cryst. 1984, 102, 255–260. [Google Scholar] [CrossRef]
- Muller, M.; Zentel, R.; Keller, H. Solid opalescent films originating from urethanes of cellulose. Adv. Mater. 1997, 9, 159–162. [Google Scholar] [CrossRef]
- Zhao, C.T.; Cai, B.L. UV-Initiated solidification of liquid crystalline ethylcellulose/acrylic acid films and bands formed in this process. Macromol. Rapid Commun. 1995, 16, 323–328. [Google Scholar] [CrossRef]
- Wenzlik, D.; Varanytsia, A.; Munoz, A.; Kosa, T.; Taheri, B.; Zentel, R.; Palffy-Muhoray, P. Distributed feedback lasing in cellulose films. Opt. Mater. Express 2014, 4, 162–171. [Google Scholar] [CrossRef]
- Wenzlik, D.; Ohm, C.; Serra, C.; Zentel, R. Preparation of cholesteric particles from cellulose derivatives in a microfluidic setup. Soft Matter 2011, 7, 2340–2344. [Google Scholar] [CrossRef]
- Shopsowitz, K.E.; Qi, H.; Hamad, W.Y.; MacLachlan, M.J. Free-standing mesoporous silica with tunable chiral nematic structures. Nature 2010, 468, 422–425. [Google Scholar] [CrossRef]
- Mostofa, K.; Hamad, W.Y.; MacLachlan, M.J. Tunable mesoporous bilayer photonic resins with chiral nematic structures and actuator properties. Adv. Mater. 2014, 26, 2323–2328. [Google Scholar] [CrossRef]
- Klemm, D.; Friederike, K.; Moritz, S.; Lindstrom, T.; Ankerfors, M.; Gray, D.; Dorris, A. Nanocelluloses: A new family of nature-based materials. Angew. Chem. Int. Ed. 2011, 50, 5438–5466. [Google Scholar] [CrossRef]
- Fernandes, S.N.; Geng, Y.; Vignolini, S.; Glover, B.J.; Trindade, A.C.; Canejo, J.P.; Almeida, P.L.; Brogueira, P.; Godinho, M.H. Structural color and iridescence in transparent sheared cellulosic films. Macromol. Chem. Phys. 2013, 214, 25–32. [Google Scholar] [CrossRef]
- Habibi, Y. Key advances in the chemical modification of nanocelluloses. Chem. Soc. Rev. 2014, 43, 1519–1542. [Google Scholar] [CrossRef]
- Gaspar, D.; Fernandes, S.N.; de Oliveira, A.G.; Fernandes, F.G.; Grey, P.; Pontes, R.V.; Pereira, L.; Martins, R.; Godinho, M.H.; Fortunato, E. Nanocrystalline cellulose applied simultaneously as the gate dielectric and the substrate in flexible field effect transistors. Nanotechnology 2014, 25, 094008:1–094008:11. [Google Scholar]
- Geng, Y.; Brogueira, P.; Figueirinhas, J.L.; Godinho, M.H.; Almeida, P.L. Light shutters from nanocrystalline cellulose rods in a nematic liquid crystal. Liq. Cryst. 2013, 40, 769–773. [Google Scholar] [CrossRef]
- Godinho, M.H.; Fonseca, J.G.; Ribeiro, A.C.; Melo, L.V.; Brogueira, P. Atomic force microscopy study of hydroxypropylcellulose films prepared from liquid crystalline aqueous solutions. Macromolecules 2002, 35, 5932–5936. [Google Scholar] [CrossRef]
- Sena, C.; Godinho, M.H.; Oliveira, C.L.P.; Neto, A.M.F. Liquid crystalline cellulosic elastomers: Free standing anisotropic films under stretching. Cellulose 2011, 18, 1151–1163. [Google Scholar] [CrossRef]
- Godinho, M.H.; Filip, D.; Costa, I.; Carvalho, A.-L.; Figueirinhas, J.L.; Terentjev, E.M. Liquid crystalline cellulose derivative elastomer films under uniaxial strain. Cellulose 2009, 16, 199–205. [Google Scholar] [CrossRef]
- Canejo, J.P.; Borges, J.P.; Godinho, M.H.; Brogueira, P.; Teixeira, P.I.C.; Terentjev, E.M. Helical twisting of electrospun liquid crystalline cellulose micro- and nanofibres. Adv. Mater. 2008, 20, 4821–4825. [Google Scholar] [CrossRef]
- Canejo, J.P.; Godinho, M.H. Cellulose perversions. Materials 2013, 6, 1377–1390. [Google Scholar] [CrossRef]
- Godinho, M.H.; Canejo, J.P.; Feio, G.; Terentjev, E.M. Self-winding of helices in plant tendrils and cellulose liquid crystal fibres. Soft Matter 2010, 6, 5965–5970. [Google Scholar] [CrossRef]
- Guo, J.X.; Gray, D.G. Preparation and liquid-crystalline properties of (acetyl)(ethyl) cellulose. Macromolecules 1989, 22, 2082–2086. [Google Scholar] [CrossRef]
- Bertails, F.; Audoly, B.; Cani, M.-P.; Querleux, B.; Leroy, F.; Leveque, J.-L. Super-helices for predicting the dynamics of natural hair. ACM Trans. Graph. 2006, 25, 1180–1187. [Google Scholar] [CrossRef]
- Goriely, A.; Tabor, M. Spontaneous helix hand reversal and tendril perversion in climbing plants. Phys. Rev. Lett. 1998, 80, 1564–1567. [Google Scholar] [CrossRef]
- Hongladarom, K.; Secakusuma, V.; Burghardt, W.R. Relation between molecular orientation and rheology in lyotropic hydroxypropylcellulose solutions. J. Rheol. 1994, 38, 1505–1523. [Google Scholar] [CrossRef]
- Riti, J.B.; Navard, P. Textures during recoil of anisotropic hydroxypropylcellulose solutions. J. Rheol. 1998, 42, 225–237. [Google Scholar] [CrossRef]
- Kundu, S.; Feio, G.; Pinto, L.F.V.; Almeida, P.L.; Figueirinhas, J.L.; Godinho, M.H. Deuterium NMR study of orientational order in cellulosic network microfibres. Macromolecules 2010, 43, 5749–5755. [Google Scholar] [CrossRef]
- Hongladarom, K.; Ugaz, V.M.; Cinader, D.K.; Burghardt, W.R.; Quintana, J.P.; Hsiao, B.S.; Dadmun, M.D.; Hamilton, W.A.; Butler, P.D. Birefringence, X-ray scattering, and neutron scattering measurements of molecular orientation in sheared liquid crystal polymer solutions. Macromolecules 1996, 29, 5346–5355. [Google Scholar] [CrossRef]
- Keates, P.; Mitchell, G.R.; Peuvrel, D.E.; Navard, P. Insitu X-ray-scattering study of anisotropic solutions of hydroxypropylcellulose subjected to shear-flow. Polymer 1993, 34, 1316–1319. [Google Scholar] [CrossRef]
- Geng, Y.; Almeida, P.L.; Feio, G.M.; Figueirinhas, J.L.; Godinho, M.H. Water-Based Cellulose Liquid Crystal System Investigated by Rheo-NMR. Macromolecules 2013, 46, 4296–4302. [Google Scholar] [CrossRef]
- Godinho, M.H.; van der Klink, J.J.; Martins, A.F. Shear-history dependent “equilibrium” states of liquid-crystalline hydroxypropylcellulose solutions detected by rheo-nuclear magnetic resonance. J. Phys.-Condensed Matter 2003, 15, 5461–5468. [Google Scholar]
- Burghardt, W.R.; Fuller, G.G. Role of director tumbling in the rheology of polymer liquid crystal solutions. Macromolecules 1991, 24, 2546–2555. [Google Scholar] [CrossRef]
- Marrucci, G. Tumbling regime of liquid-crystalline polymers. Macromolecules 1991, 24, 4176–4182. [Google Scholar] [CrossRef]
- Onogi, S.; Asada, T. Rheology and rheoptics of polymer liquid crystals. Rheology 1980, 1, 127–147. [Google Scholar] [CrossRef]
- Grabowski, D.A.; Schmidt, C. Simultaneous measurement of shear viscosity and director orientation of a side-chain liquid-crystalline polymer by Rheo-NMR. Macromolecules 1994, 27, 2632–2634. [Google Scholar] [CrossRef]
- Samuels, R.J. Solid-state characterization of the structure and deformation behavior of water-soluble hydroxypropylcellulose. J. Polym. Sci. Part A 2 Polym. Phys. 1969, 7, 1197–1258. [Google Scholar] [CrossRef]
- Evmenenko, G.; Yu, C.J.; Kewalramani, S.; Dutta, P. Structural characterization of thin hydroxypropylcellulose films. X-ray reflectivity studies. Langmuir 2004, 20, 1698–1703. [Google Scholar] [CrossRef]
- Patnaik, S.S.; Bunning, T.J.; Adams, W.W.; Wang, J.; Labes, M.M. Atomic-force microscopy and high-resolution scanning electron-microscopy study of the banded surface-morphology of hydroxypropylcellulose thin-films. Macromolecules 1995, 28, 393–395. [Google Scholar] [CrossRef]
- Nishio, Y.; Takahashi, T. Morphological study of hydroxypropyl cellulose films prepared from thermotropic melt under shear. J. Macromol. Sci. Phys. 1984, B23, 483–495. [Google Scholar] [CrossRef]
- Mori, N.; Morimoto, M.; Nakamura, K. Hydroxypropylcellulose films as alignment layers for liquid crystals. Macromolecules 1999, 32, 1488–1492. [Google Scholar] [CrossRef]
- Wang, J.; Labes, M.M. Control of the anisotropic mechanical-properties of liquid-crystal polymer-films by variations in their banded texture. Macromolecules 1992, 25, 5790–5793. [Google Scholar] [CrossRef]
- Wang, J.; Bhattacharya, S.; Labes, M.M. Solvent evaporation induced torsad texture of sheared liquid-crystalline polymers. Macromolecules 1991, 24, 4942–4947. [Google Scholar] [CrossRef]
- Geng, Y.; Almeida, P.L.; Fernandes, S.N.; Cheng, C.; Palffy-Muhoray, P.; Godinho, M.H. A cellulose liquid crystal motor: A steam engine of the second kind. Sci. Rep. 2013, 3, 1028. [Google Scholar]
- Bladon, P.; Warner, M.; Terentjev, E.M. Orientational order in strained nematic networks. Macromolecules 1994, 27, 7067–7075. [Google Scholar] [CrossRef]
- Andresen, E.M.; Mitchell, G.R. Orientational behaviour of thermotropic and lyotropic liquid crystal polymer systems under shear flow. Europhys. Lett. 1998, 43, 296–301. [Google Scholar] [CrossRef]
- Favier, V.; Canova, G.R.; Cavaille, J.Y.; Chanzy, H.; Dufresne, A.; Gauthier, C. Nanocomposite materials from latex and cellulose whiskers. Polym. Adv. Technol. 1995, 6, 351–355. [Google Scholar] [CrossRef]
- Almeida, P.L.; Kundu, S.; Beja, D.; Fonseca, J.; Figueirinhas, J.L.; Godinho, M.H. Deformation of isotropic and anisotropic liquid droplets dispersed in a cellulose liquid crystalline derivative. Cellulose 2009, 16, 427–434. [Google Scholar] [CrossRef]
- Borges, J.P.; Godinho, M.H.; Martins, A.F.; Trindade, A.C.; Belgacem, M.N. Cellulose based composite films. Mech. Compos. Mater. 2001, 37, 257–264. [Google Scholar] [CrossRef]
- Borges, J.P.; Godinho, M.H.; Belgacem, M.N.; Martins, A.F. New bio-composites based on short fibre reinforced hydroxypropylcellulose films. Compos. Interfaces 2001, 8, 233–241. [Google Scholar] [CrossRef]
- Craighead, H.V.; Cheng, J.; Hackwood, S. New display based on electrically induced index matching in an inhomogeneous medium. Appl. Phys. Lett. 1982, 40, 22–24. [Google Scholar] [CrossRef]
- Godinho, M.H.; Figueirinhas, J.L.; Martins, A.F. Novel PDLC type display based on cellulose derivatives. Liq. Cryst. 1996, 20, 373–376. [Google Scholar] [CrossRef]
- Godinho, M.H.; Martins, A.F.; Figueirinhas, J.L. Composite systems for display applications from cellulose elastomers and nematic liquid crystals. Opt. Mater. 1998, 9, 226–229. [Google Scholar] [CrossRef]
- Almeida, P.L.; Godinho, M.H.; Cidade, M.T.; Figueirinhas, J.L. Electro-optical properties of cellulose based PDLC type cells: Dependence on the type of diisocyanate cross-linking agent used. Mol. Cryst. Liq. Cryst. 2001, 368, 121–128. [Google Scholar] [CrossRef]
- Almeida, P.L.; Kundu, S.; Borges, J.P.; Godinho, M.H.; Figueirinhas, J.L. Electro-optical light scattering shutter using electrospun cellulose-based nano- and microfibers. Appl. Phys. Lett. 2009, 95. [Google Scholar] [CrossRef]
- Kato, T. Self-assembly of phase-segregated liquid crystal structures. Science 2002, 295, 2414–2418. [Google Scholar] [CrossRef]
© 2014 by the authors; licensee MDPI, Basel, Switzerland. This article is an open access article distributed under the terms and conditions of the Creative Commons Attribution license (http://creativecommons.org/licenses/by/3.0/).
Share and Cite
Godinho, M.H.; Almeida, P.L.; Figueirinhas, J.L. From Cellulosic Based Liquid Crystalline Sheared Solutions to 1D and 2D Soft Materials. Materials 2014, 7, 4601-4627. https://doi.org/10.3390/ma7064601
Godinho MH, Almeida PL, Figueirinhas JL. From Cellulosic Based Liquid Crystalline Sheared Solutions to 1D and 2D Soft Materials. Materials. 2014; 7(6):4601-4627. https://doi.org/10.3390/ma7064601
Chicago/Turabian StyleGodinho, Maria Helena, Pedro Lúcio Almeida, and João Luis Figueirinhas. 2014. "From Cellulosic Based Liquid Crystalline Sheared Solutions to 1D and 2D Soft Materials" Materials 7, no. 6: 4601-4627. https://doi.org/10.3390/ma7064601
APA StyleGodinho, M. H., Almeida, P. L., & Figueirinhas, J. L. (2014). From Cellulosic Based Liquid Crystalline Sheared Solutions to 1D and 2D Soft Materials. Materials, 7(6), 4601-4627. https://doi.org/10.3390/ma7064601