1. Introduction
In traditional hydrogen production methods, such as natural gas steam reforming, catalytic biomass gasification, and coal gasification, the processes are connected with generation of by-products, for example carbon oxides. The by-products may be harmful not only for the environment but also for hydrogen cells. Ammonia is a good source of pure hydrogen. In comparison with hydrogen, it is easy to store and to transport, because it is liquid at the temperature of 25 °C under the pressure of 8 atm. Nitrogen and hydrogen are the unique products of the ammonia decomposition. Ruthenium supported on a carbon carrier is the most active catalyst in the ammonia decomposition reaction so far. Nevertheless, ruthenium is very expensive and its availability is limited, which inhibits its widespread use in industry [
1]. Catalytic decomposition of ammonia over transition metals is an alternative for systems based on noble metals such as Ru, Pt, Pd, and Rh. Transition metals, Fe [
2,
3,
4,
5,
6,
7,
8], Ni [
5,
6,
9], and Co [
5,
7], and also their nitrides and carbides are being intensively investigated as potential catalytic systems for the ammonia decomposition reaction.
Sorensen
et al. [
7] performed investigations in which four non-promoted catalysts, Fe, Ru, Co, and Pd, were compared one another. At process conditions (575 and 650 °C, a gas mixture containing 50 vol % of ammonia and 50 vol % of argon), they found that cobalt was the most effective catalyst in the ammonia decomposition reaction. At both temperatures reaction rates, given as mole of H
2/mole of metal/s, were five times higher for cobalt than those for iron.
Zhang
et al. [
6] found that commercial carbon nanotubes containing Co nanoparticles were highly active in the ammonia decomposition reaction. At 700 °C and under the flow of 2000 cm
3·g
−1·h
−1, complete conversion of ammonia was almost reached over the carbon nanotubes based catalyst containing 4.1% of Co.
In our previous work, we compared a cobalt-based catalyst promoted with calcium, aluminium, and potassium with an industrial iron catalyst [
10]. A composition of the prepared cobalt catalyst corresponded to the industrial iron catalyst for the ammonia synthesis (similar content of structural promoters), however a slight difference in a specific surface area working to the advantage of the cobalt catalyst was observed. Under conditions of the experiments (temperatures from 400 to 550 °C, an atmospheric pressure, an ammonia concentration in the mixture with hydrogen about 6 vol %), it was found that the cobalt catalyst was more effective than the iron one in the ammonia decomposition reaction. An apparent activation energy of the ammonia decomposition was determined: 111 kJ/mol and 138 kJ/mol for the cobalt and the iron catalyst, respectively. However, it should be taken into account, that the described investigations concerned kinetics measurements and they were carried out for low ammonia concentrations. Conditions of these investigations differed markedly from those required for fuel cell applications.
On the basis of the model developed for assessing the active surface of the iron catalyst for the ammonia synthesis [
11], the theoretical assumptions were made in order to prepare a cobalt catalyst being active in the ammonia decomposition. According to the model [
11] the iron surface is wetted by oxides of promoters, which form a two-layer structure. The first layer, in direct contact with iron, is composed of oxygen atoms. Atoms of promoter are located above oxygen atoms. In the case of the triple promoted catalyst, the surface of the catalyst is dominantly covered by a two-dimension Fe–O–K layer, whereas the rest of the promoters are located in a three-dimension bridge structure, which are bound by single iron crystallites. The basic assumption of the model is the existence of the chemical equilibrium between iron crystallites, promoters wetting the iron surface and promoters that form three-dimension structures (oxygen bridges) connecting individual iron crystallites. Not covered iron atoms (–O–M) are the sites where N
2 molecules can be adsorbed and hydrogenated to obtain ammonia. The surface layer structure is determined by the character of elements occurring on the surface. In accordance with the model, a specific surface area of a catalyst is proportional to amount of iron atoms located on the surface and to their bond energy with oxygen. A catalyst activity is proportional to the number of free, uncovered iron atoms on the catalyst surface.
The idea of a new catalyst preparation was to replace iron atoms by cobalt atoms. For cobalt the dissociative adsorption heat of nitrogen, 134 kJ/mol [
12], is lower, than that of iron 205 kJ/mol [
12]. Co–O bond enthalpy is lower than Fe–O bond enthalpy, therefore according to the model, specific surface area of pure cobalt is lower. However, cobalt may be expected to be more resistant against poisoning.
One can assume that introducing into the system elements bonding oxygen strongly than cobalt, for example manganese and/or chromium, an increase in the specific surface area of the catalysts is expected.
In this work, preparation and characterization of cobalt catalysts for the ammonia decomposition are presented. The influence of the composition of hydrogen-ammonia gas mixtures on the kinetics of the ammonia decomposition was examined.
2. Experimental
2.1. Preparation of Catalysts
Cobalt(II) hydroxide was precipitated with an NH4OH solution from a water solution of cobalt(II) nitrate (Co(NO3)2·6H2O, Merck). During the precipitation, the reaction was being controlled continuously to maintain the pH at a constant value, (pH = 8.5). The obtained suspension was washed with demineralized water to remove nitrate ions; then dried at 105 °C for 12 h and calcined at 200 °C for 2 h. In the next stage promoters were introduced by wet co-impregnation with adequate water solutions of calcium, potassium, and aluminium nitrates. In the same way, chromium and manganese were introduced into the catalysts. Manganese acetate and chromium nitrate were used to prepare a solution for the impregnation. The impregnation was carried out in a vacuum evaporator (Rotavapor R-210, BUCHI). Concentrations of the respective salts were calculated to reach established contents of the promoters in the catalyst: CaO—2.6%, Al2O3—3.0%, K2O—0.6% and from 0.2% to 0.4% MnO2 or Cr2O3—from 0.2% to 0.4%. After the impregnation, the calcination process was carried out for 4 h at 200 °C and for 2 h at 500 °C.
2.2. Characterization of Catalysts
A quantitative analysis of elements in the catalysts was determined with atomic emission spectroscopy with inductively coupled plasma ICP-OES (spectrometer Optima 5300 DV, Perkin Elmer) and using scanning an electron microscope SEM (DSM 962, Zeiss) with an X-ray analyser EDS (detector X-flash 4010, Bruker).
A phase composition and an average crystallite size of cobalt oxide crystallites were determined by using an X-ray diffraction method XRD (X’Pert PRO Philips diffractometer with CuKα radiation). Line (440) of Co3O4 and Scherrer’s equation were used in order to calculate an average size of crystallites.
Specific surface area (BET) of the oxidized form of the catalysts was determined by nitrogen adsorption-desorption measurements at 77 K using a Micromeritics ASAP 2010 instrument. The reduction behaviours of samples were examined by a temperature-programmed reduction with H2 (H2-TPR) technique using a Micromeritics AutoChem 2920 instrument. The same equipment was used to determine specific surface area of the catalysts after reduction at 600 °C and heating in hydrogen atmosphere.
2.3. Catalytic Tests
Catalytic tests were carried out in a differential quartz reactor connected to a gas analyser and a thermogravimetric mass changes recorder. The samples of the oxidized form of the catalysts, approximately 0.5 g, were used in tests. They were placed in the reactor as a monolayer of grains (1–1.2 mm) in a platinum basket. Blank tests were performed to confirm a lack of influence of platinum on the reaction; they indicated that the ammonia conversion in the empty reactor was less than 1%. Prior to kinetics measurements of the ammonia decomposition reaction, the catalysts were reduced with hydrogen, purity of 99.999%, at 600 °C and a flow rate of 200 cm3 min−1. When the reduction process had been finished, the catalysts were heated for 3 h in hydrogen atmosphere, at the same temperature. For kinetics tests, pure ammonia (99.998%) was used; its flow rate varied in the range from 30 to 200 cm3/min. In order to determine the influence of hydrogen on the kinetics of the ammonia decomposition reaction various ammonia-hydrogen mixtures were used, with the ammonia content from 10 to 100 vol %. Gaseous mixture composition was varied, but GHSV (gas hourly space velocity) remained unchanged, at the level of 24,000 cm3·g−1·h. Gas flow rates were being controlled by mass flow controllers. Activities of the catalysts were examined under atmospheric pressure, at 500 and 550 °C.
On the basis of balance of reaction system, in which the reaction NH
3 = 1.5H
2 + 0.5N
2 takes place, one obtains [
3]:
After transformations of Equations (1–5) the expression describing the conversion degree of ammonia was obtained as follows:
Where:
F0 is total gases flow at the reactor inlet mol·s
−1,
F0H2 and
F0NH3 are hydrogen and ammonia molar flows at the reactor inlet, mol·s
−1,
XH2 is mole fraction of hydrogen in the reactor in stationary state.
On the basis of the ammonia conversion degree under given conditions of temperature and the ammonia flow rate at the reactor inlet, the rate of the ammonia decomposition related to mass of the catalyst was calculated from an Equation (7).
where: m
cat is mass of catalyst, g.
3. Results and discussion
As the result of the precipitation of cobalt hydroxide and then the calcination at 200 °C for 2 h, a catalyst precursor, cobalt (II, III) oxide, was obtained,. Such obtained cobalt oxide (Co), with specific surface area ca. 64 m2/g, was impregnated with promoter solutions.
The nomenclature of the catalysts, compositions, average crystallite sizes of Co
3O
4, and specific surface areas (BET) are summarized in
Table 1.
Table 1.
Chemical composition and specific surface areas of the catalysts.
Table 1.
Chemical composition and specific surface areas of the catalysts.
| catalyst | content [wt %] | dCo3O4 | So | S600 |
|---|
| Al2O3 | CaO | K2O | Cr2O3 | MnO2 | Co3O4 | (nm) | (m2/g) | (m2/g) |
|---|
| Co | – | – | – | – | – | 100 | 11 | 64 | 4 |
| Co(0) [13] | 2.6 a/2.3 b | 1.5 a/1.7 b | 0.5 a | – | – | 95.4 | 23 | 29 | 13 |
| CoMn(0.25) [13] | 2.8 a/2.6 b | 1.4 a/2.4 b | 0.6 a | – | 0.39 a | 94.8 | 20 | 37 | 14 |
| CoCr(0.16) | 2.9 a/2.7 b | 1.6 a/1.9 b | 0.5 a | 0.23 a | – | 94.8 | 34 | 33 | 14 |
| CoCr(0.28) | 2.5 a/2.3 b | 1.4 a/1.2 b | 0.5 a | 0.41 a/0.55 b | – | 95.2 | 30 | 39 | 17 |
Numbers given in parentheses in the names of the catalysts determine the contents of chromium or manganese. Calcination at 500 °C caused a drop in specific surface area of the prepared catalysts in comparison with specific surface area of the starting cobalt oxide. A little chromium addition brought on an increase in specific surface area,
Table 1. The similar phenomenon took place for catalysts with manganese addition [
13]. The incorporation of small amounts of manganese into the system, the element bonding oxygen stronger than cobalt, influenced on the development of specific surface area. Specific surface areas of the catalysts decreased dramatically after reduction and calcination. It was especially observed for the cobalt catalyst without addition of promoters when its specific surface area decreased from 64 just to 4 m
2/g after reduction and heating. An addition of promoter oxides stabilizes the surface area of the catalysts. The observed decrease in the surface area is significantly lower. In our previous works [
14,
15], we informed about thermostabilizing properties of calcium and aluminum.
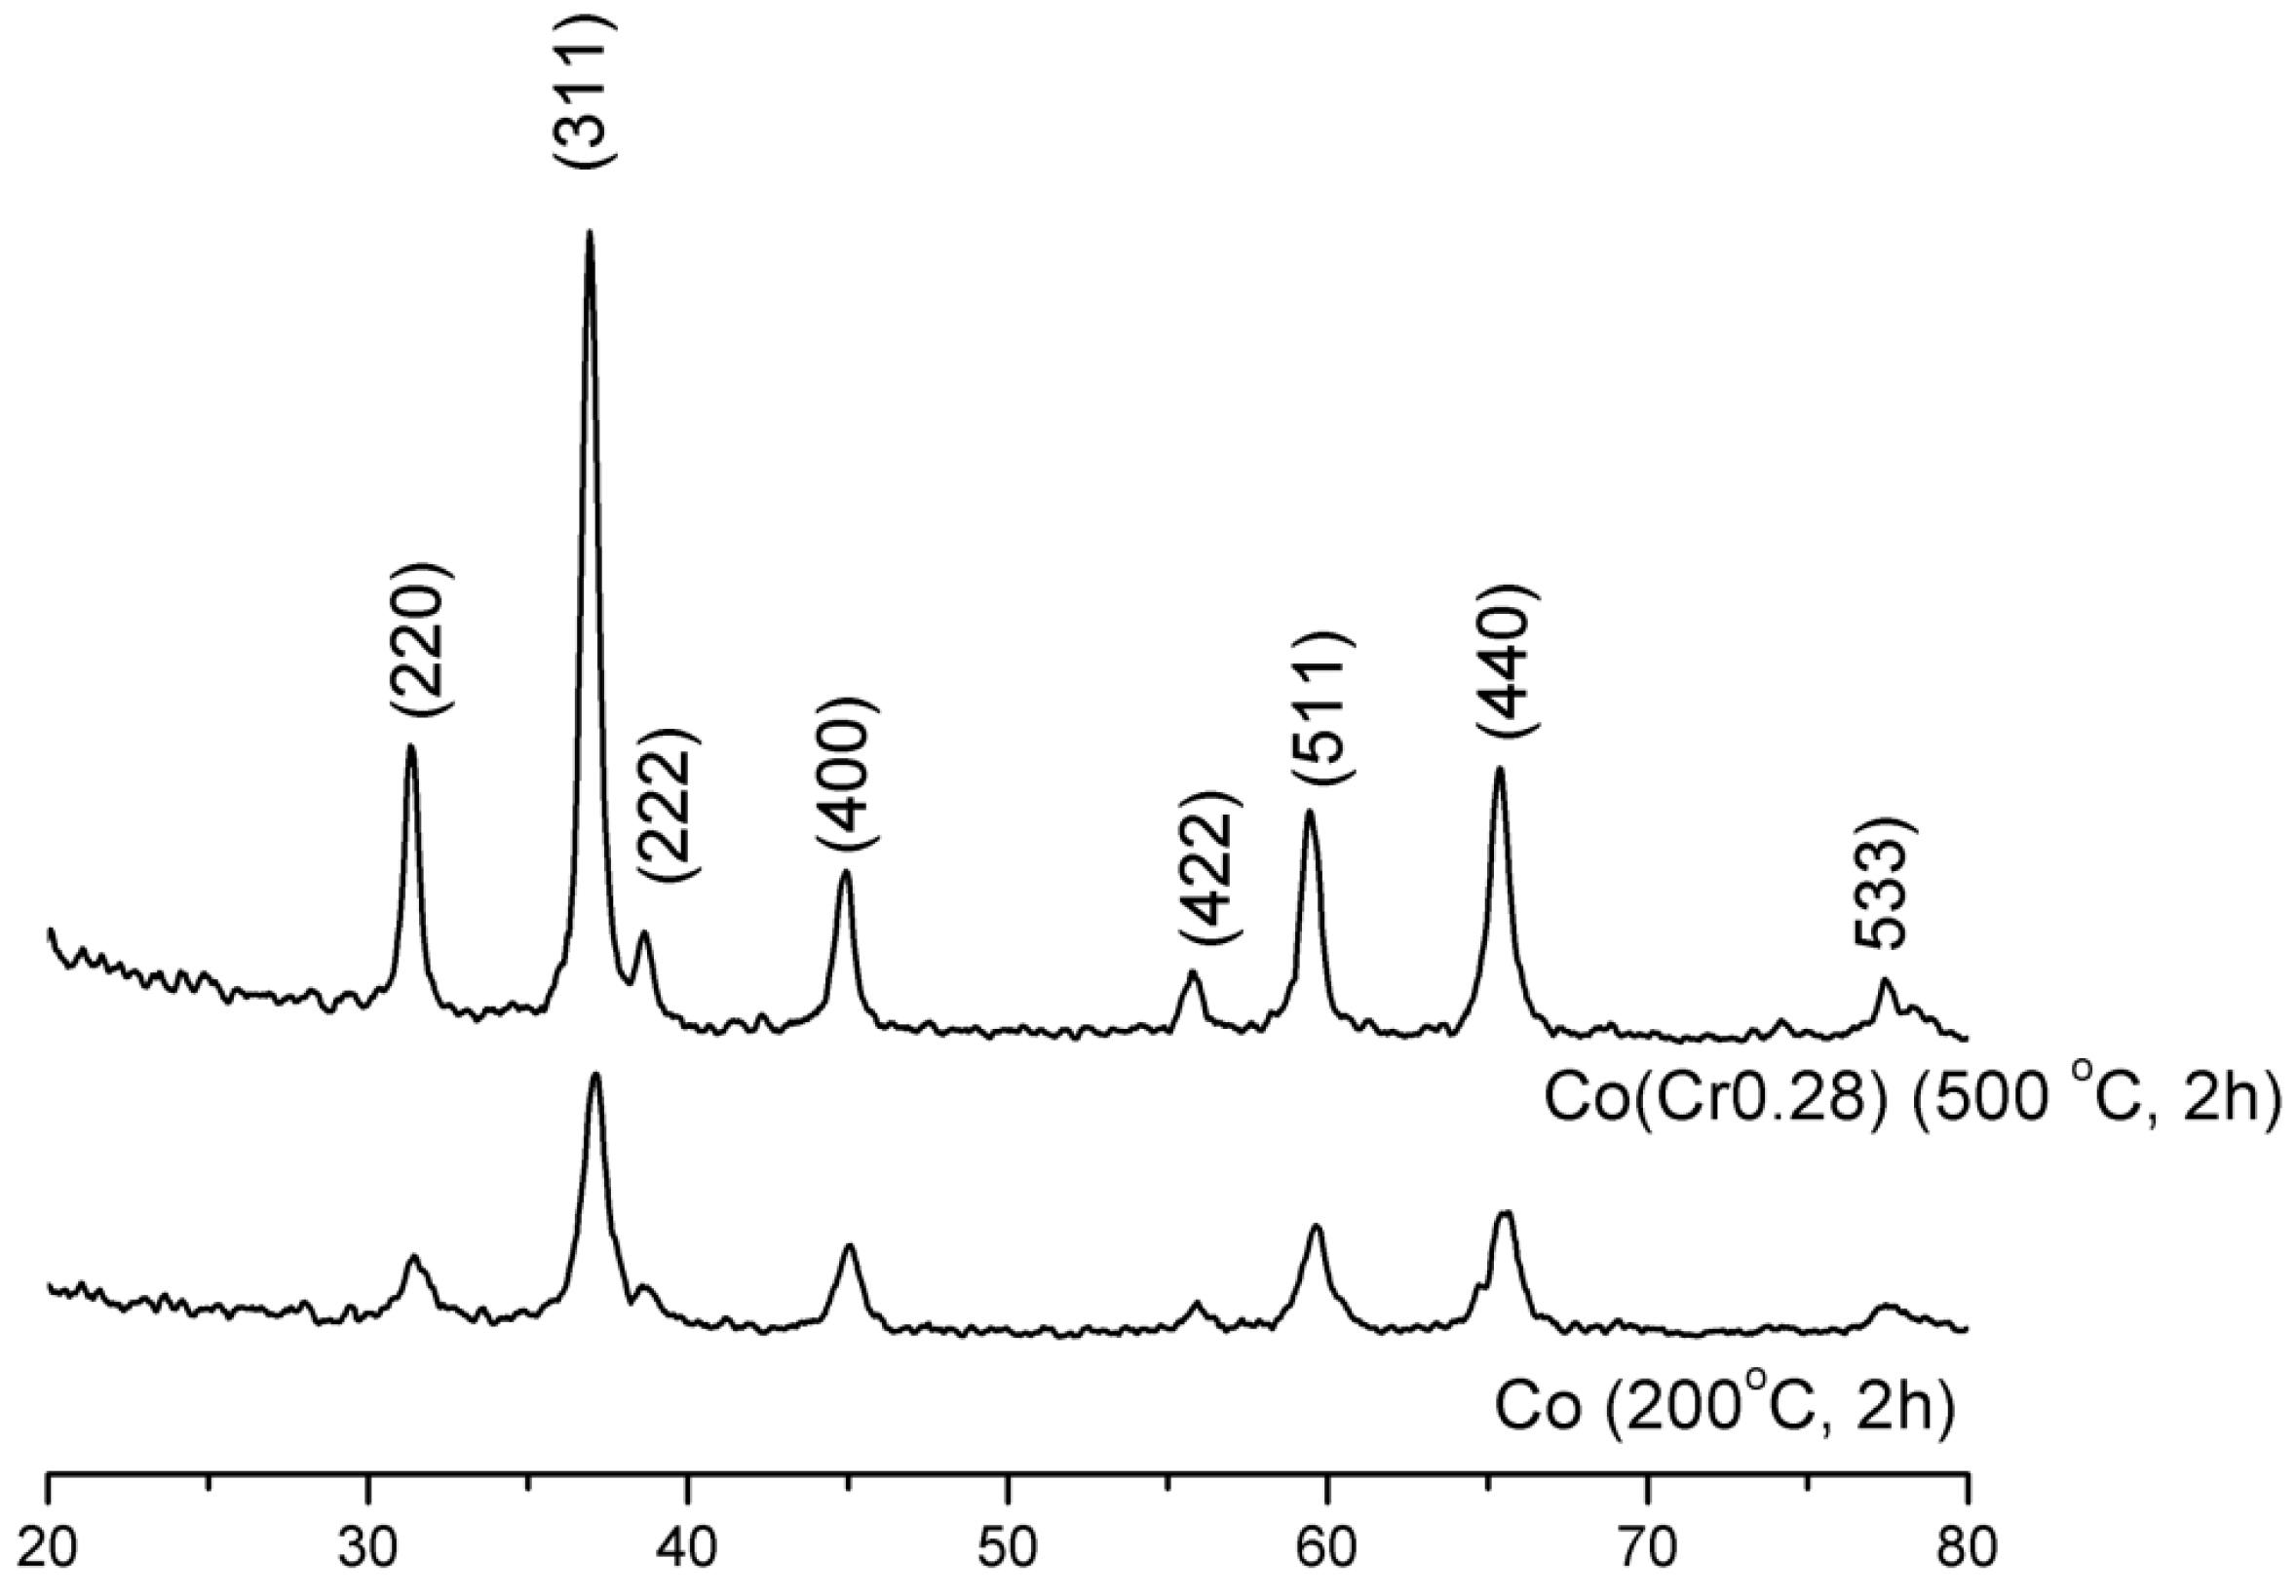
It follows from XRD analysis that cobalt oxide Co
3O
4 is the main crystallographic phase in the oxidized form of the prepared catalysts,
Figure 1. The example X-ray pattern of CoCr(0.28) sample was compared with the X-ray pattern of pure cobalt oxide,
Figure 1. An average size of Co
3O
4 crystallites of pure cobalt oxide, calculated from Scherrer’s equation, was 11 nm while about 30 nm for the CoCr(0.28) catalyst. Calcination carried out at 500 °C, after the impregnation with solutions of the salt of the promoters, resulted in an increase in the average size of cobalt oxide crystallites.
Figure 1.
X-ray diffraction (XRD) patterns of the cobalt oxide and the cobalt catalyst.
Figure 1.
X-ray diffraction (XRD) patterns of the cobalt oxide and the cobalt catalyst.
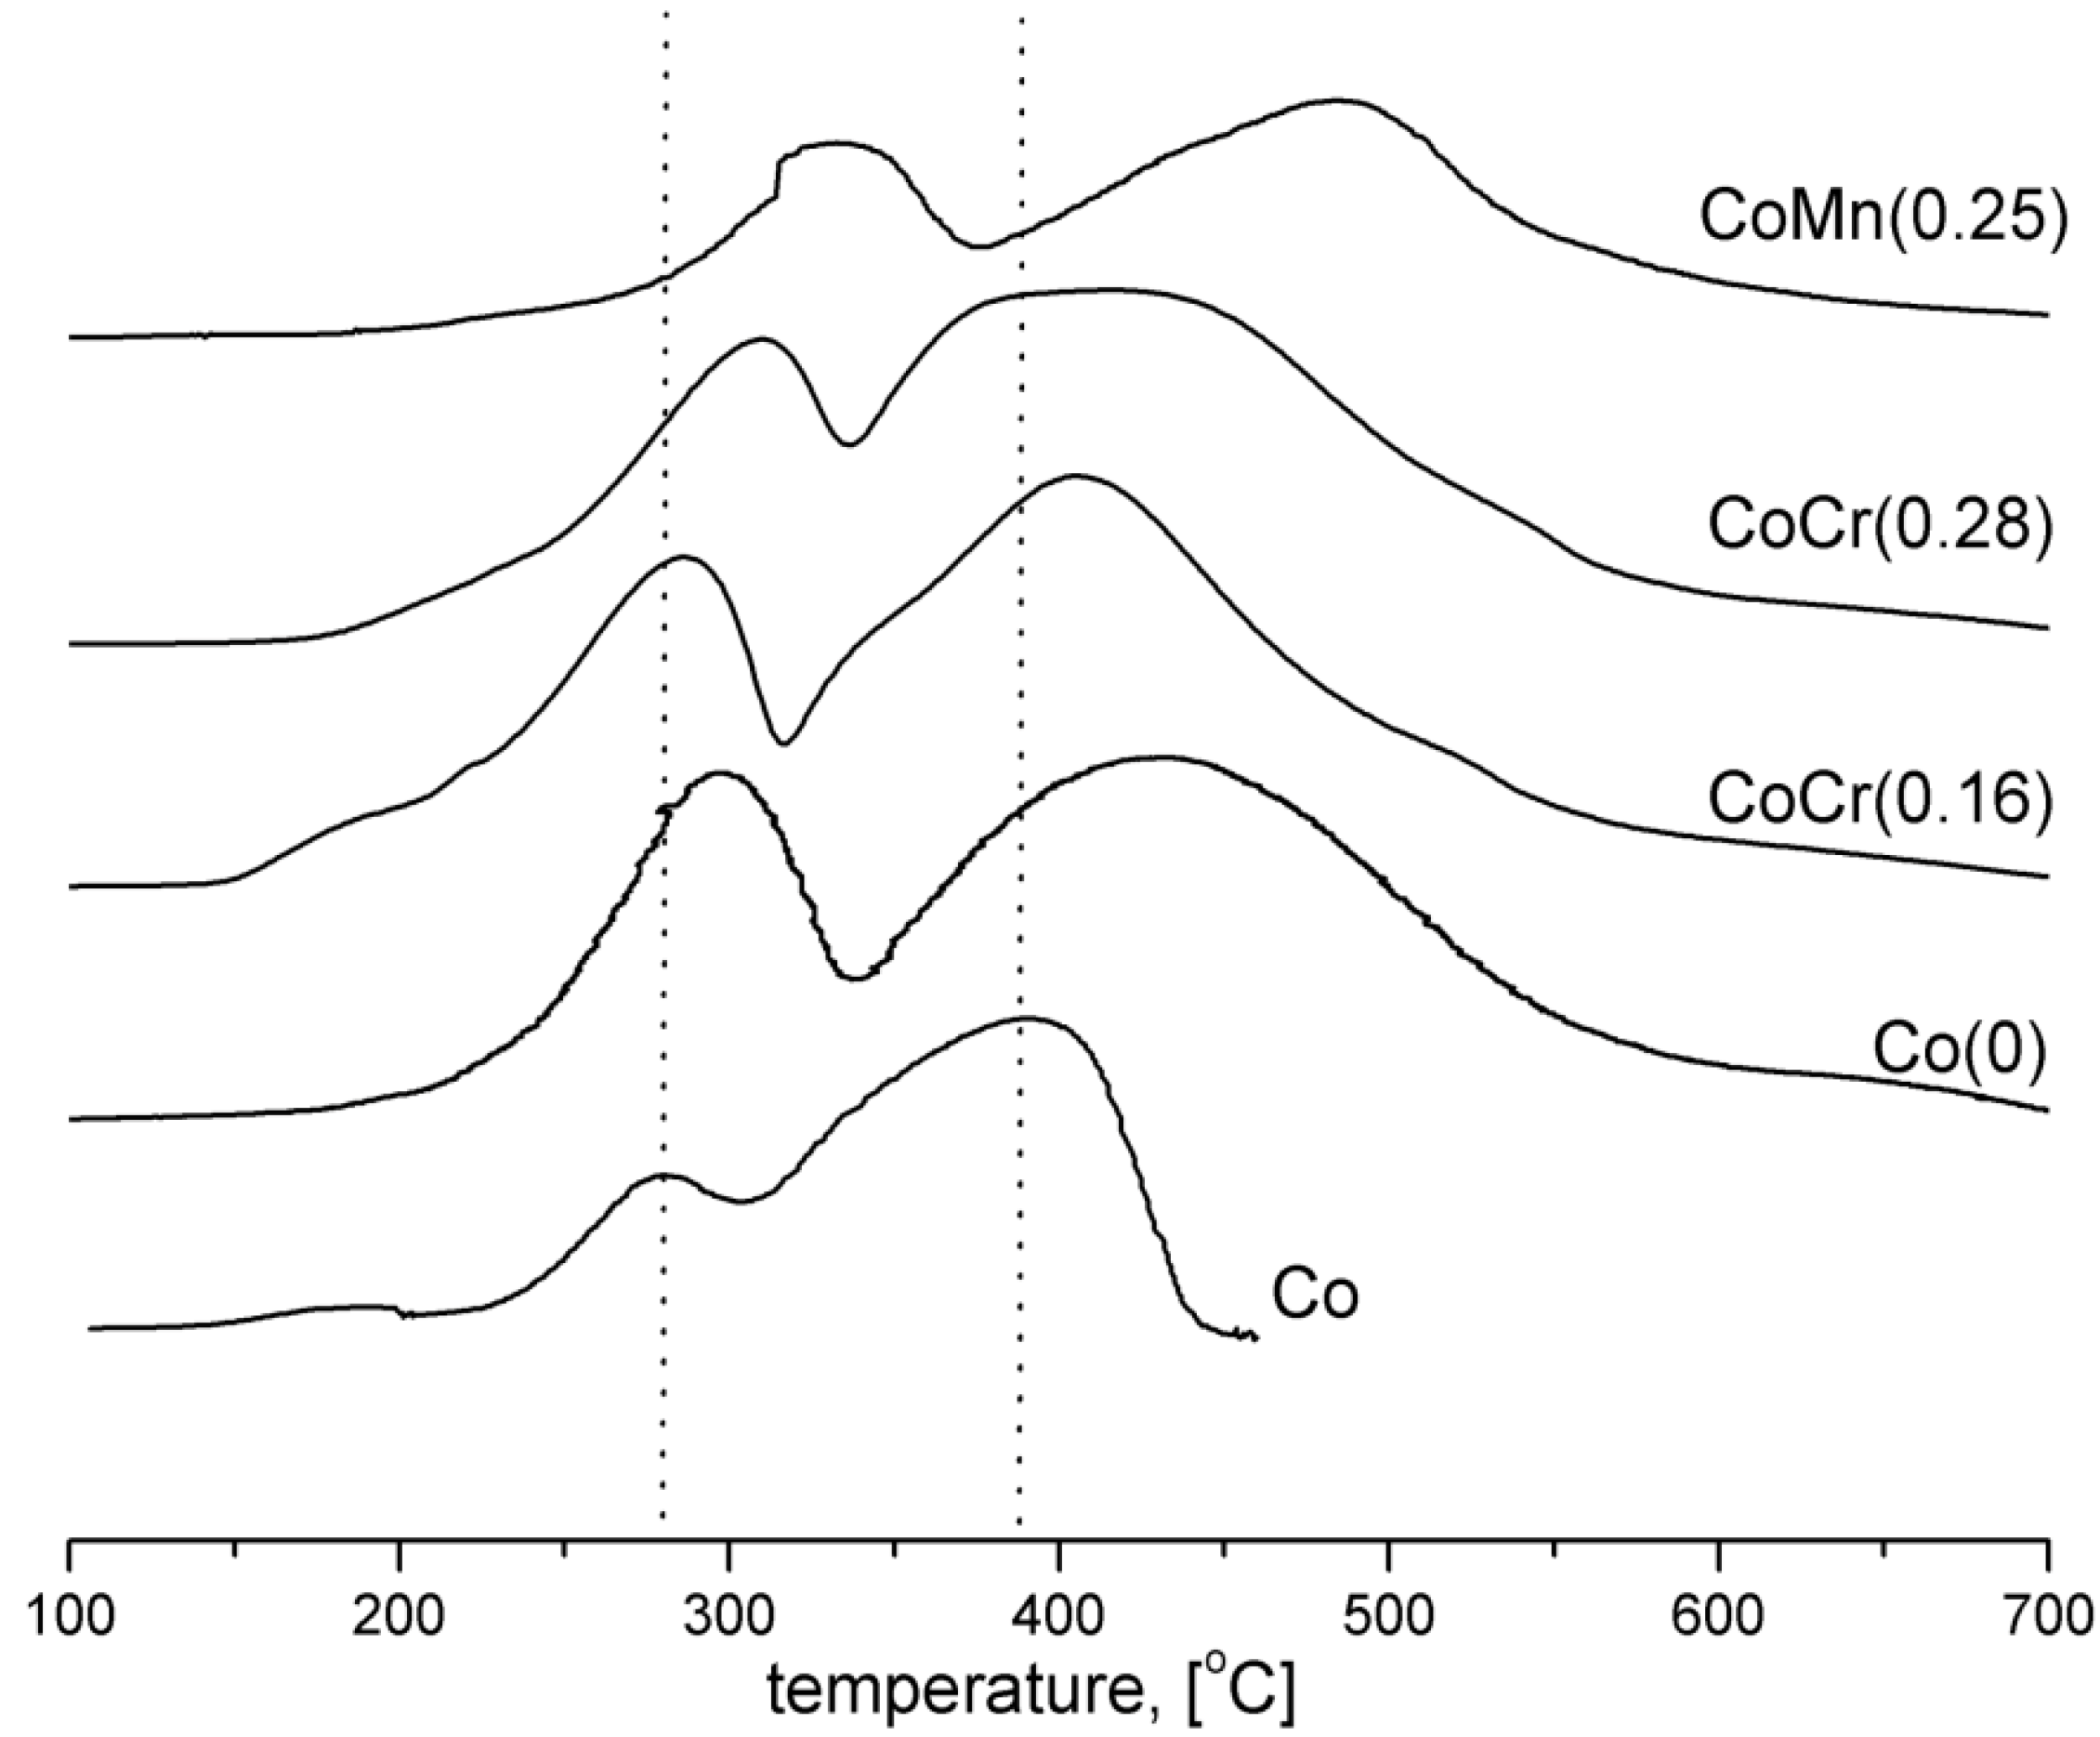
The H
2-TPR profiles of the catalysts are shown in
Figure 2. The H
2-TPR profile of the pure cobalt oxide (Co) illustrates two overlapping reduction peaks, at 280 °C and 380 °C, associated with the two-step reduction of Co
3O
4 (Co
3O
4 → CoO → Co) [
14]. The H
2-TPR profile of the Co(0) catalyst, with an addition of promoters, was shifted toward higher temperatures. Profile maxima for other catalysts were systematically shifted to higher temperatures than that of pure Co
3O
4. Reduction of CoMn(0.25) catalyst, with the addition of manganese oxide, was the slowest. An addition of chromium into CoCr(0.16) and CoCr(0.28) catalysts decreased the temperature in which the reduction began. It is in accordance with previous investigations [
16].
Figure 2.
H2-TPR profiles of the cobalt catalysts (flow 10% H2/Ar, 10°/min from 100 to 700 °C).
Figure 2.
H2-TPR profiles of the cobalt catalysts (flow 10% H2/Ar, 10°/min from 100 to 700 °C).
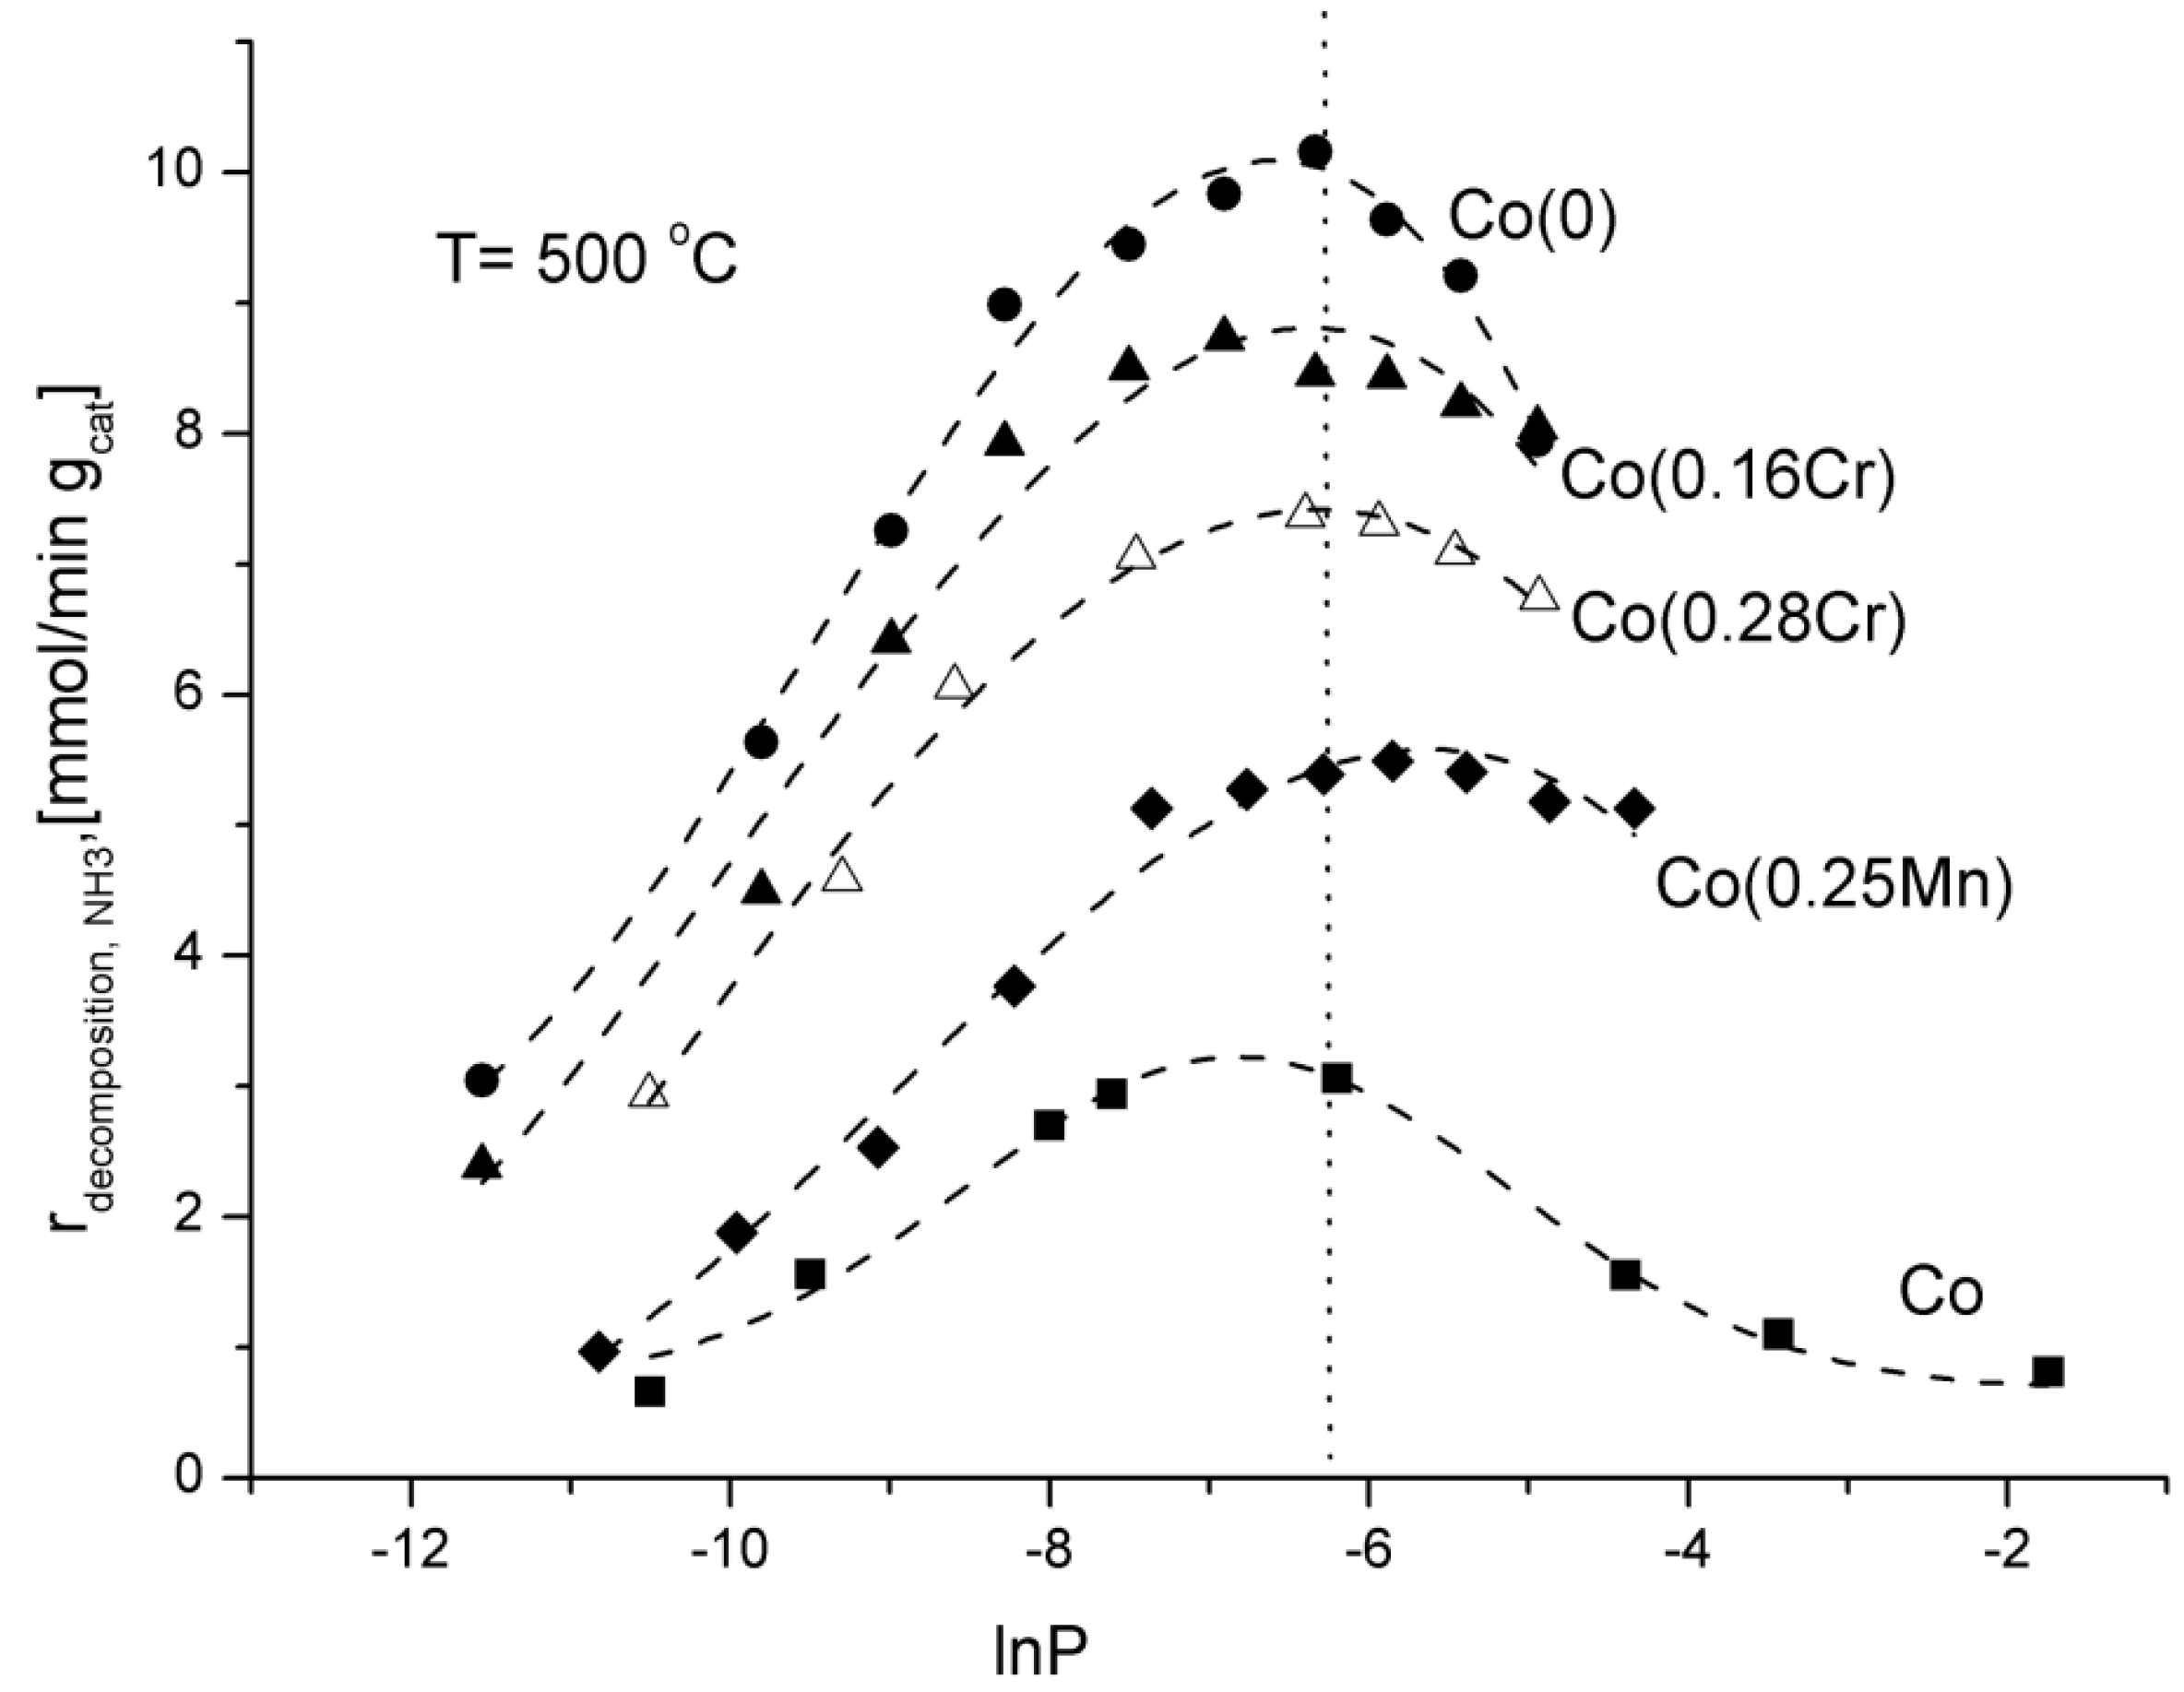
Changes of the ammonia decomposition rate as a function of natural logarithm of nitriding potential, lnP, were shown in
Figure 3.
Figure 3.
Dependence of the rate of the ammonia decomposition reaction on the logarithm of nitriding potential at the temperature of 500 °C.
Figure 3.
Dependence of the rate of the ammonia decomposition reaction on the logarithm of nitriding potential at the temperature of 500 °C.
The nitriding potential, P, was defined in our previous work [
3] as the ratio of partial pressures of ammonia and hydrogen, P = p
NH3/p
H21.5. This parameter has a significant impact on the ammonia decomposition kinetics. The values of partial pressures were calculated on the basis of the material balance of the reactor and hydrogen concentrations at the outlet of the reactor in stationary states.
Ammonia decomposition rate increased while potential P increased to about P = 0.0019 Pa
−0.5 reaching the maximum value at that point. Having reached the maximum value, ammonia decomposition rate diminished while ammonia partial pressure increased in the reaction atmosphere. In the previous investigations, the same phenomenon was observed for an iron catalyst [
3]. According to K. Kielbasa
et al., a decrease in the ammonia decomposition rate is connected with an iron nitriding reaction and a formation of a new solid phase. In the case of cobalt catalysts, mass changes were not registered. That may exclude the nitriding process. After activity tests, also XRD phase analysis did not show any new phase.
It is known from scientific literature that the grain structure of Co
4N is very similar to the structure of Co, which might easily lead to misinterpretation [
17,
18]. Although, there is a conjecture that reconstruction of the surface takes place by interaction between nitrogen and cobalt atoms. Such surface changes, not observed using the thermogravimetric and XRD methods, may have significant impact on the ammonia decomposition rate.
Among the investigated catalysts, the Co(0) one (promoted with calcium oxide, aluminium oxide, and potassium oxide) showed the highest activity, expressed as the ammonia decomposition rate. The lowest activity was shown by the non-promoted Co catalyst, which should be connected with a relatively low specific surface area of 4 m
2/g after the reduction process. An addition of manganese and chromium slowed down the ammonia decomposition. The Co(0) catalyst showed the highest activity (
Table 2), for pure ammonia at the reactor inlet and GHSV
NH3 = 24,000 mL·h
−1·g
cat−1, at temperatures of 500 and 550 °C. The ammonia conversion degree was 40.1% and 50%, respectively.
Table 2.
NH3 conversion degree and H2 formation rate over cobalt catalysts (GHSVNH3 = 24,000 mL·h−1·gcat−1, at temperatures 500 and 550°C).
Table 2.
NH3 conversion degree and H2 formation rate over cobalt catalysts (GHSVNH3 = 24,000 mL·h−1·gcat−1, at temperatures 500 and 550°C).
| catalyst | NH3 conversion degree (%) | | H2 formation rate (mmol/min gcat) |
|---|
| 500 °C | 550 °C | | 500 °C | 550 °C |
|---|
| Co | 4.5 | 26.2 | | 1.2 | 5.5 |
| Co(0) | 40.1 | 50.0 | | 8.3 | 9.5 |
| CoMn(0.25) | 23.0 | – | | 6.2 | – |
| CoCr(0.16) | 35.0 | 45.0 | | 7.3 | 8.3 |
| CoCr(0.28) | 32.0 | 41.0 | | 6.8 | 7.7 |
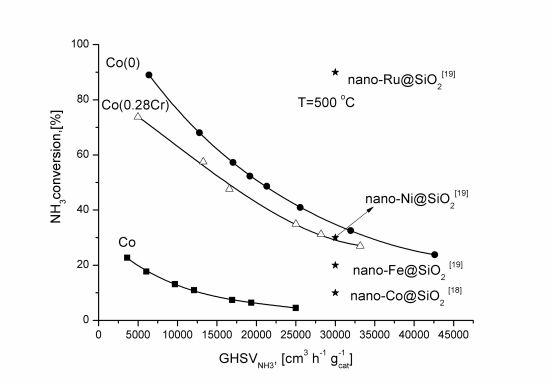
Adjusting the reactor feed, it is possible to reach high ammonia conversion degrees over the cobalt catalyst promoted with aluminium, calcium, and potassium oxides.
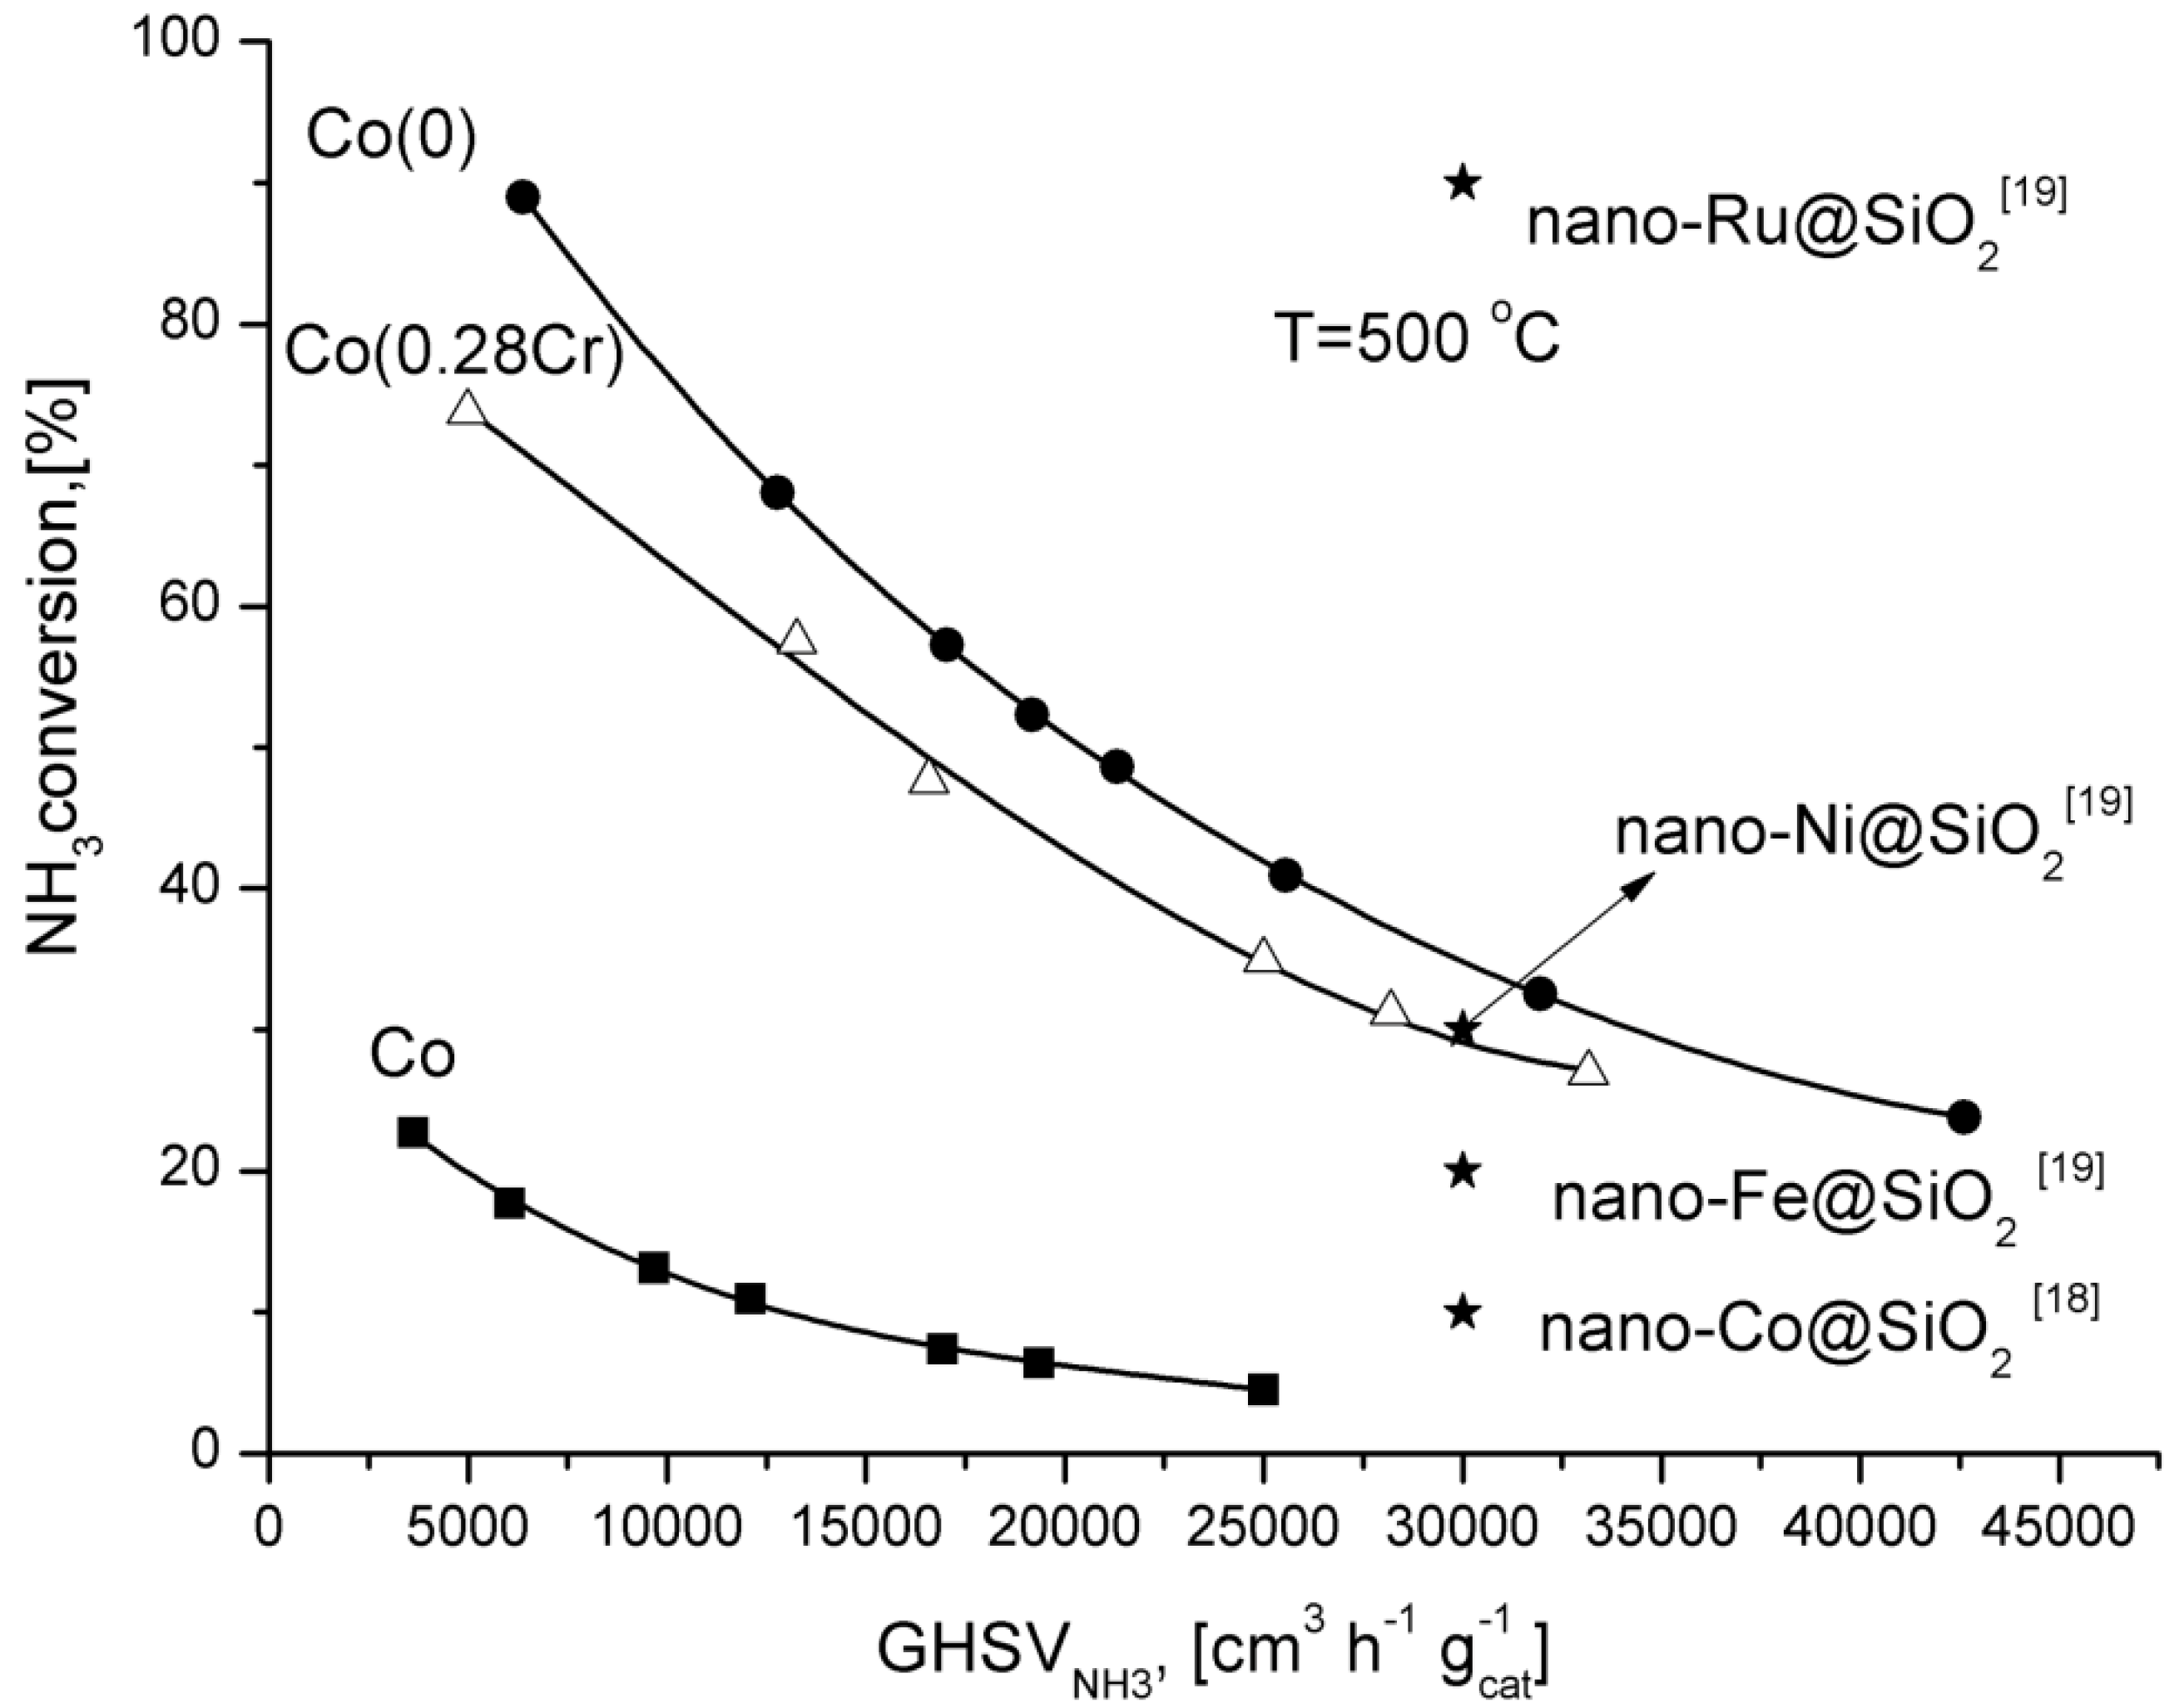
For comparison, ammonia conversion degrees obtained over supported catalysts promoted with various metals are shown in
Figure 4. Only the ruthenium catalyst was more active than Co(0) catalyst.
Figure 4.
Dependence of the ammonia conversion degree at 500 °C as a function of GHSV.
Figure 4.
Dependence of the ammonia conversion degree at 500 °C as a function of GHSV.


