4.1. A profile model to understand the formation of cavities on SMC surfaces
Though SMC surfaces are not periodic surfaces, i.e., they do not show any repeating units, some periodicity due to regular polish of the metallic mold permits the use of a periodic profile model in order to understand the formation of cavities as a result of the combination of the mold irregularities with molding and post-molding conditions.
The following approach to develop a structural model does not take into account the short waviness; only mean roughness and arithmetic roughness are considered to suit the total SMC topography (
Figure 1). Modeled profiles consist of triangular periodical waves of two length scales: the first scale describes the mean roughness R
z and the second one the arithmetic mean roughness R
a filtered by Fast Fourier Transformation [
5], as shown in
Figure 2. Using calculated values of surface Wenzel roughness factor (r), defined as the quotient
real area/projected area [
6], the number of long waves (N
z) and short waves (N
a) can be obtained:
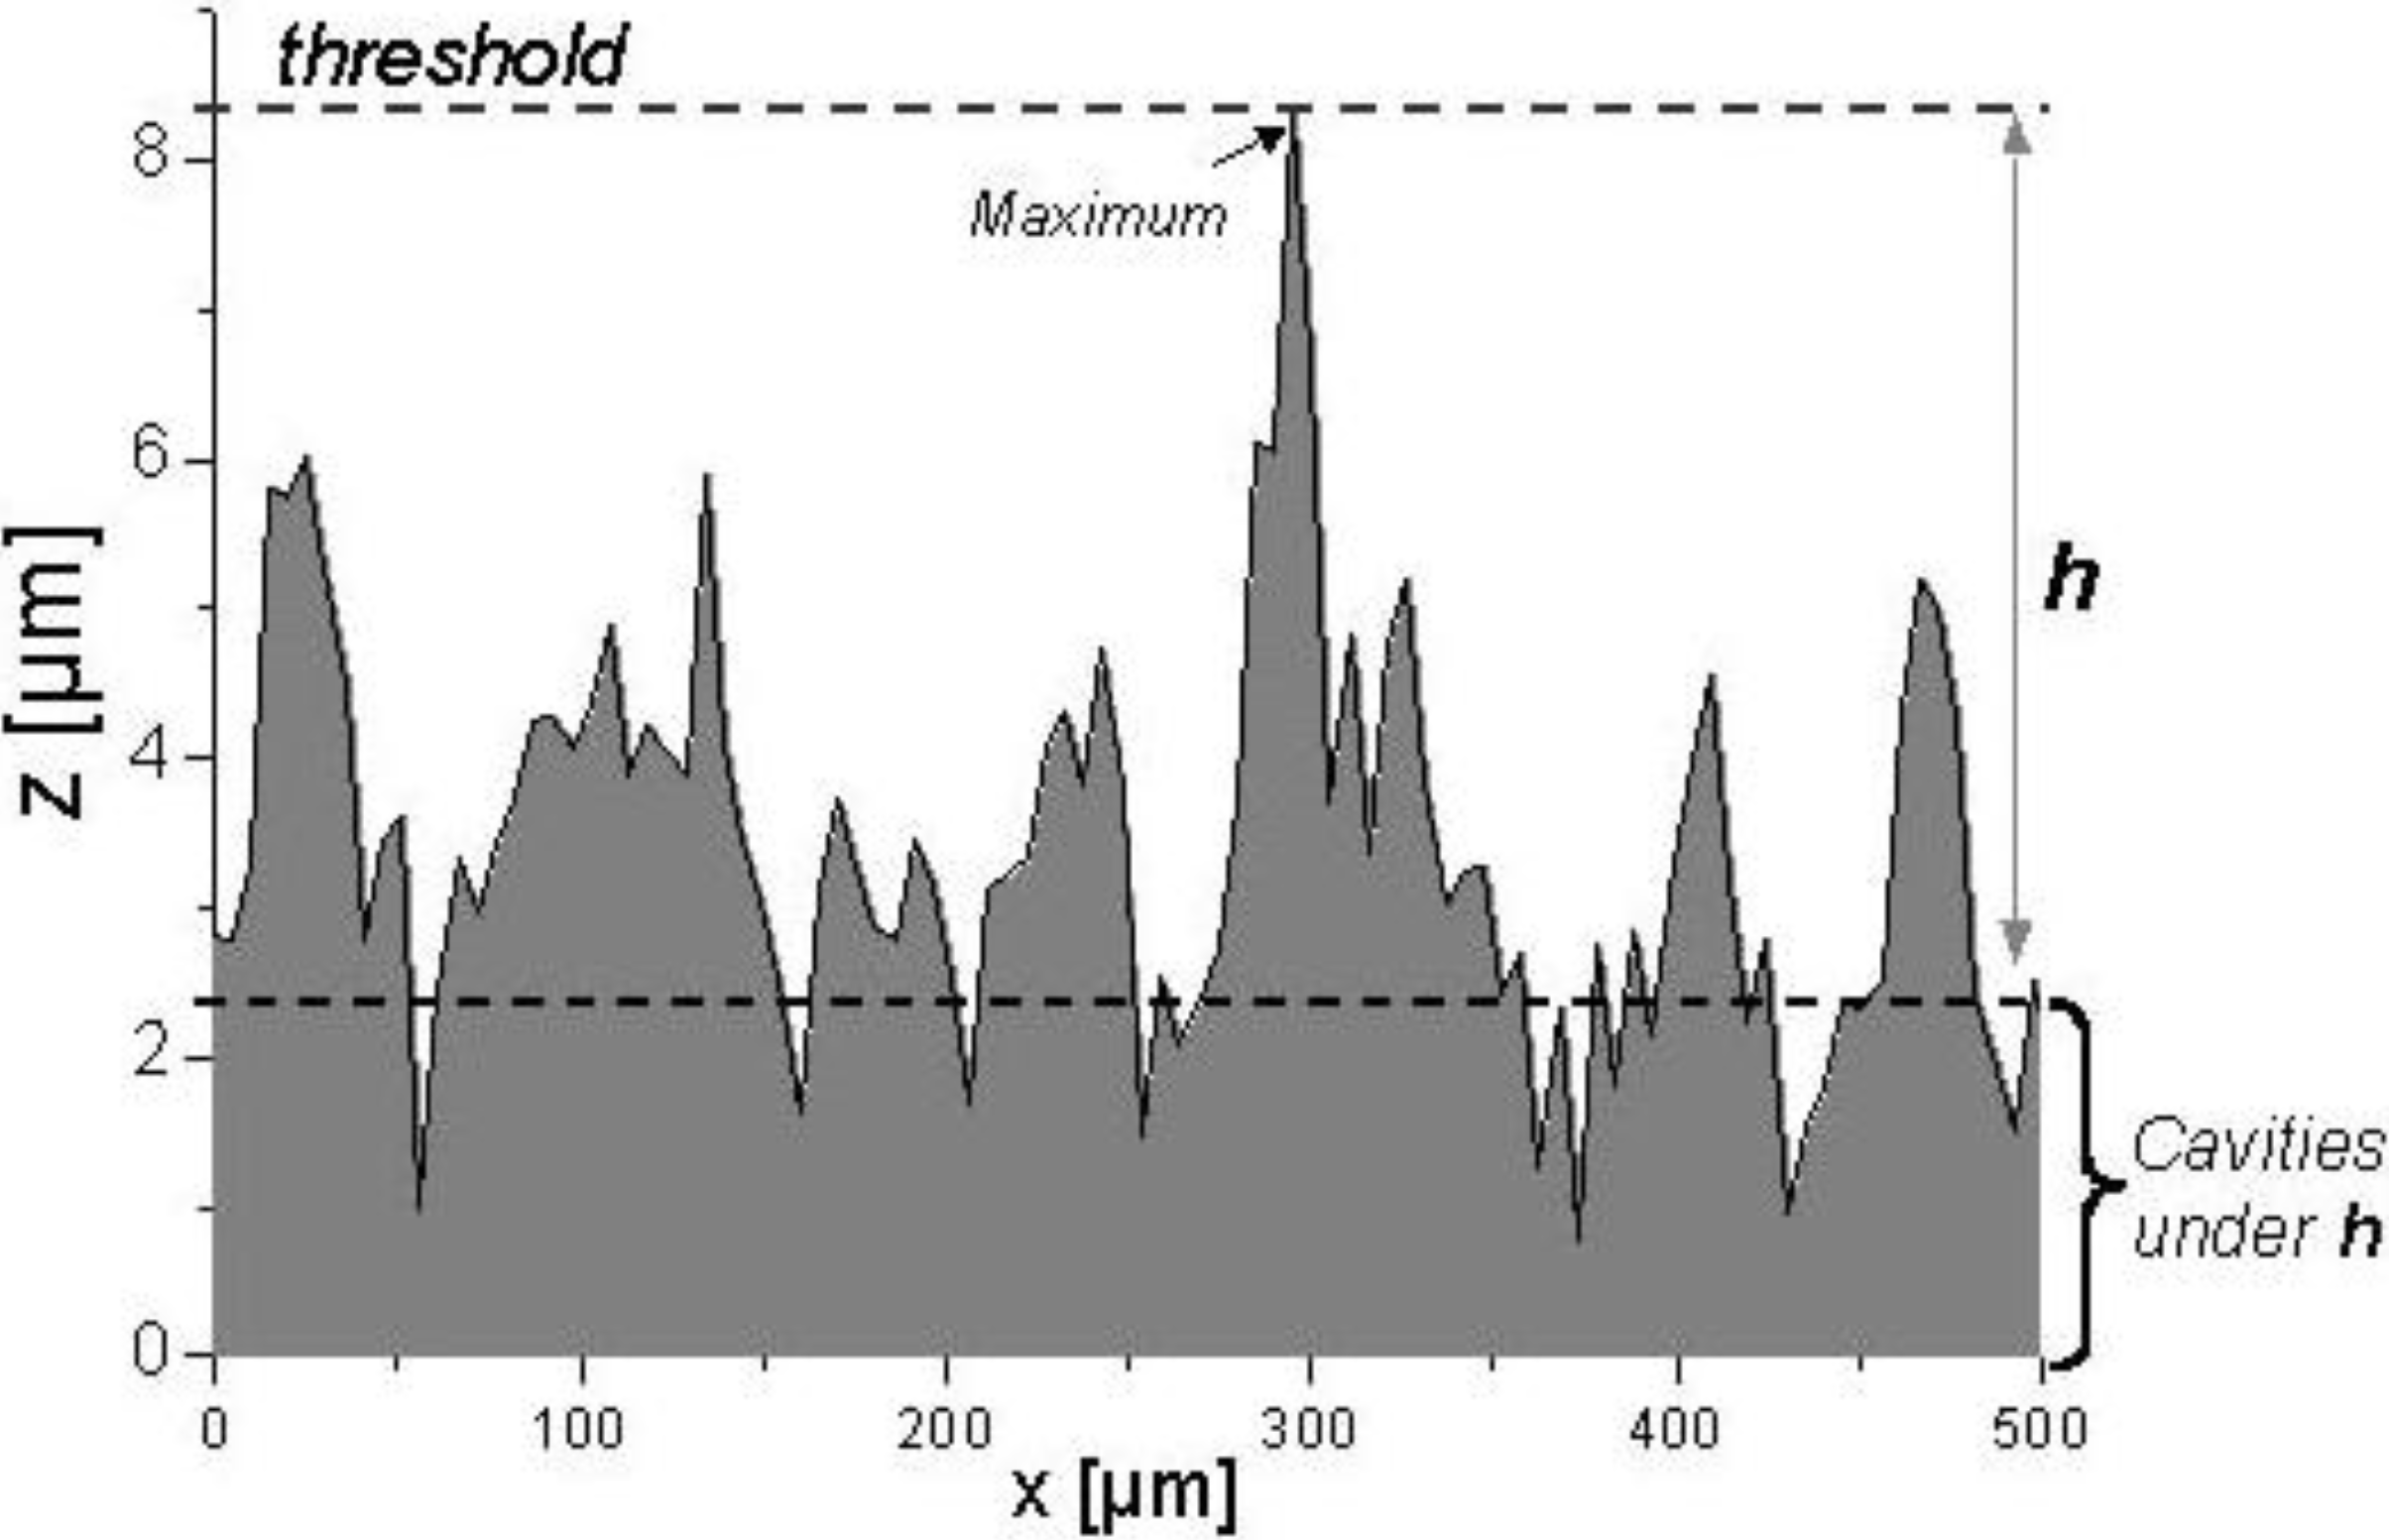
The quantity of cavities and their mean area were calculated by applying ‘filling quantity operations’ [
7], with a threshold value (maximum z-height) of 6 µm, measured under the highest point of the surface after filtration of short waviness (
Figure 3).
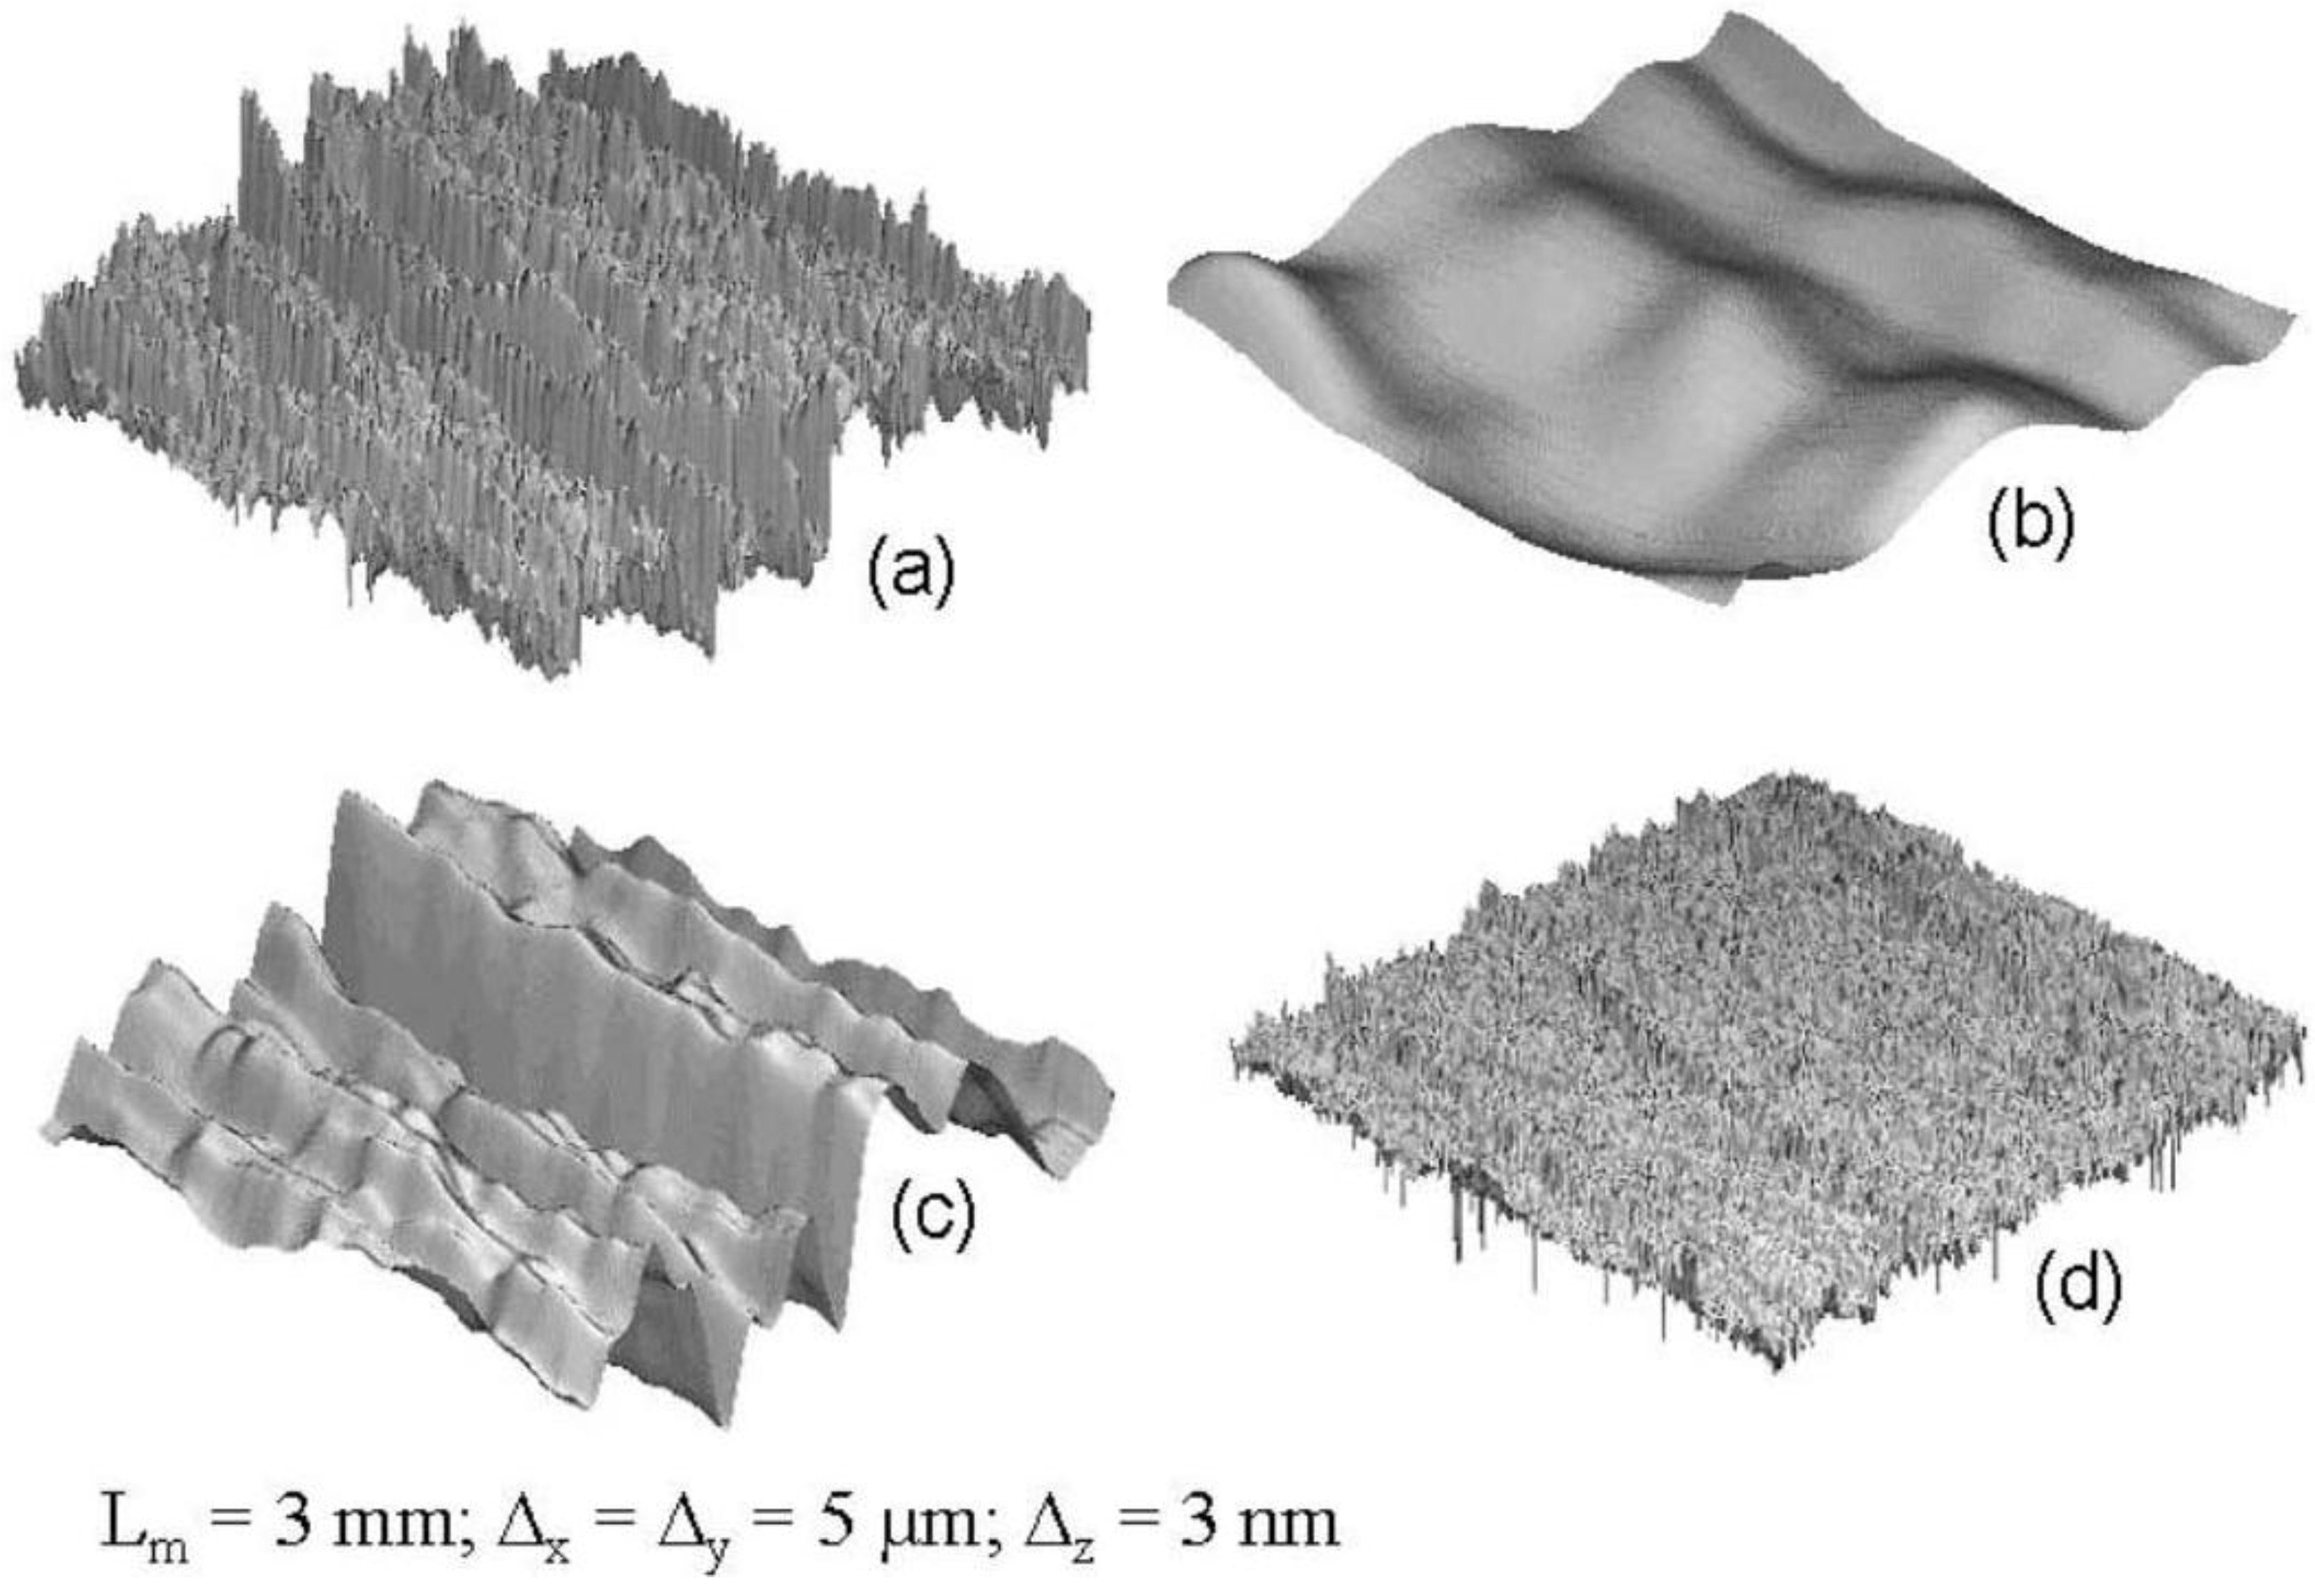
Figure 1.
Total Sheet Molding Compound (SMC) topography (a), isolated short waviness (b), isolated mean roughness (c) and isolated arithmetic mean roughness (d). Lm is the cut-off length. ∆x and ∆y are the lateral resolutions and ∆z is the vertical resolution.
Figure 1.
Total Sheet Molding Compound (SMC) topography (a), isolated short waviness (b), isolated mean roughness (c) and isolated arithmetic mean roughness (d). Lm is the cut-off length. ∆x and ∆y are the lateral resolutions and ∆z is the vertical resolution.
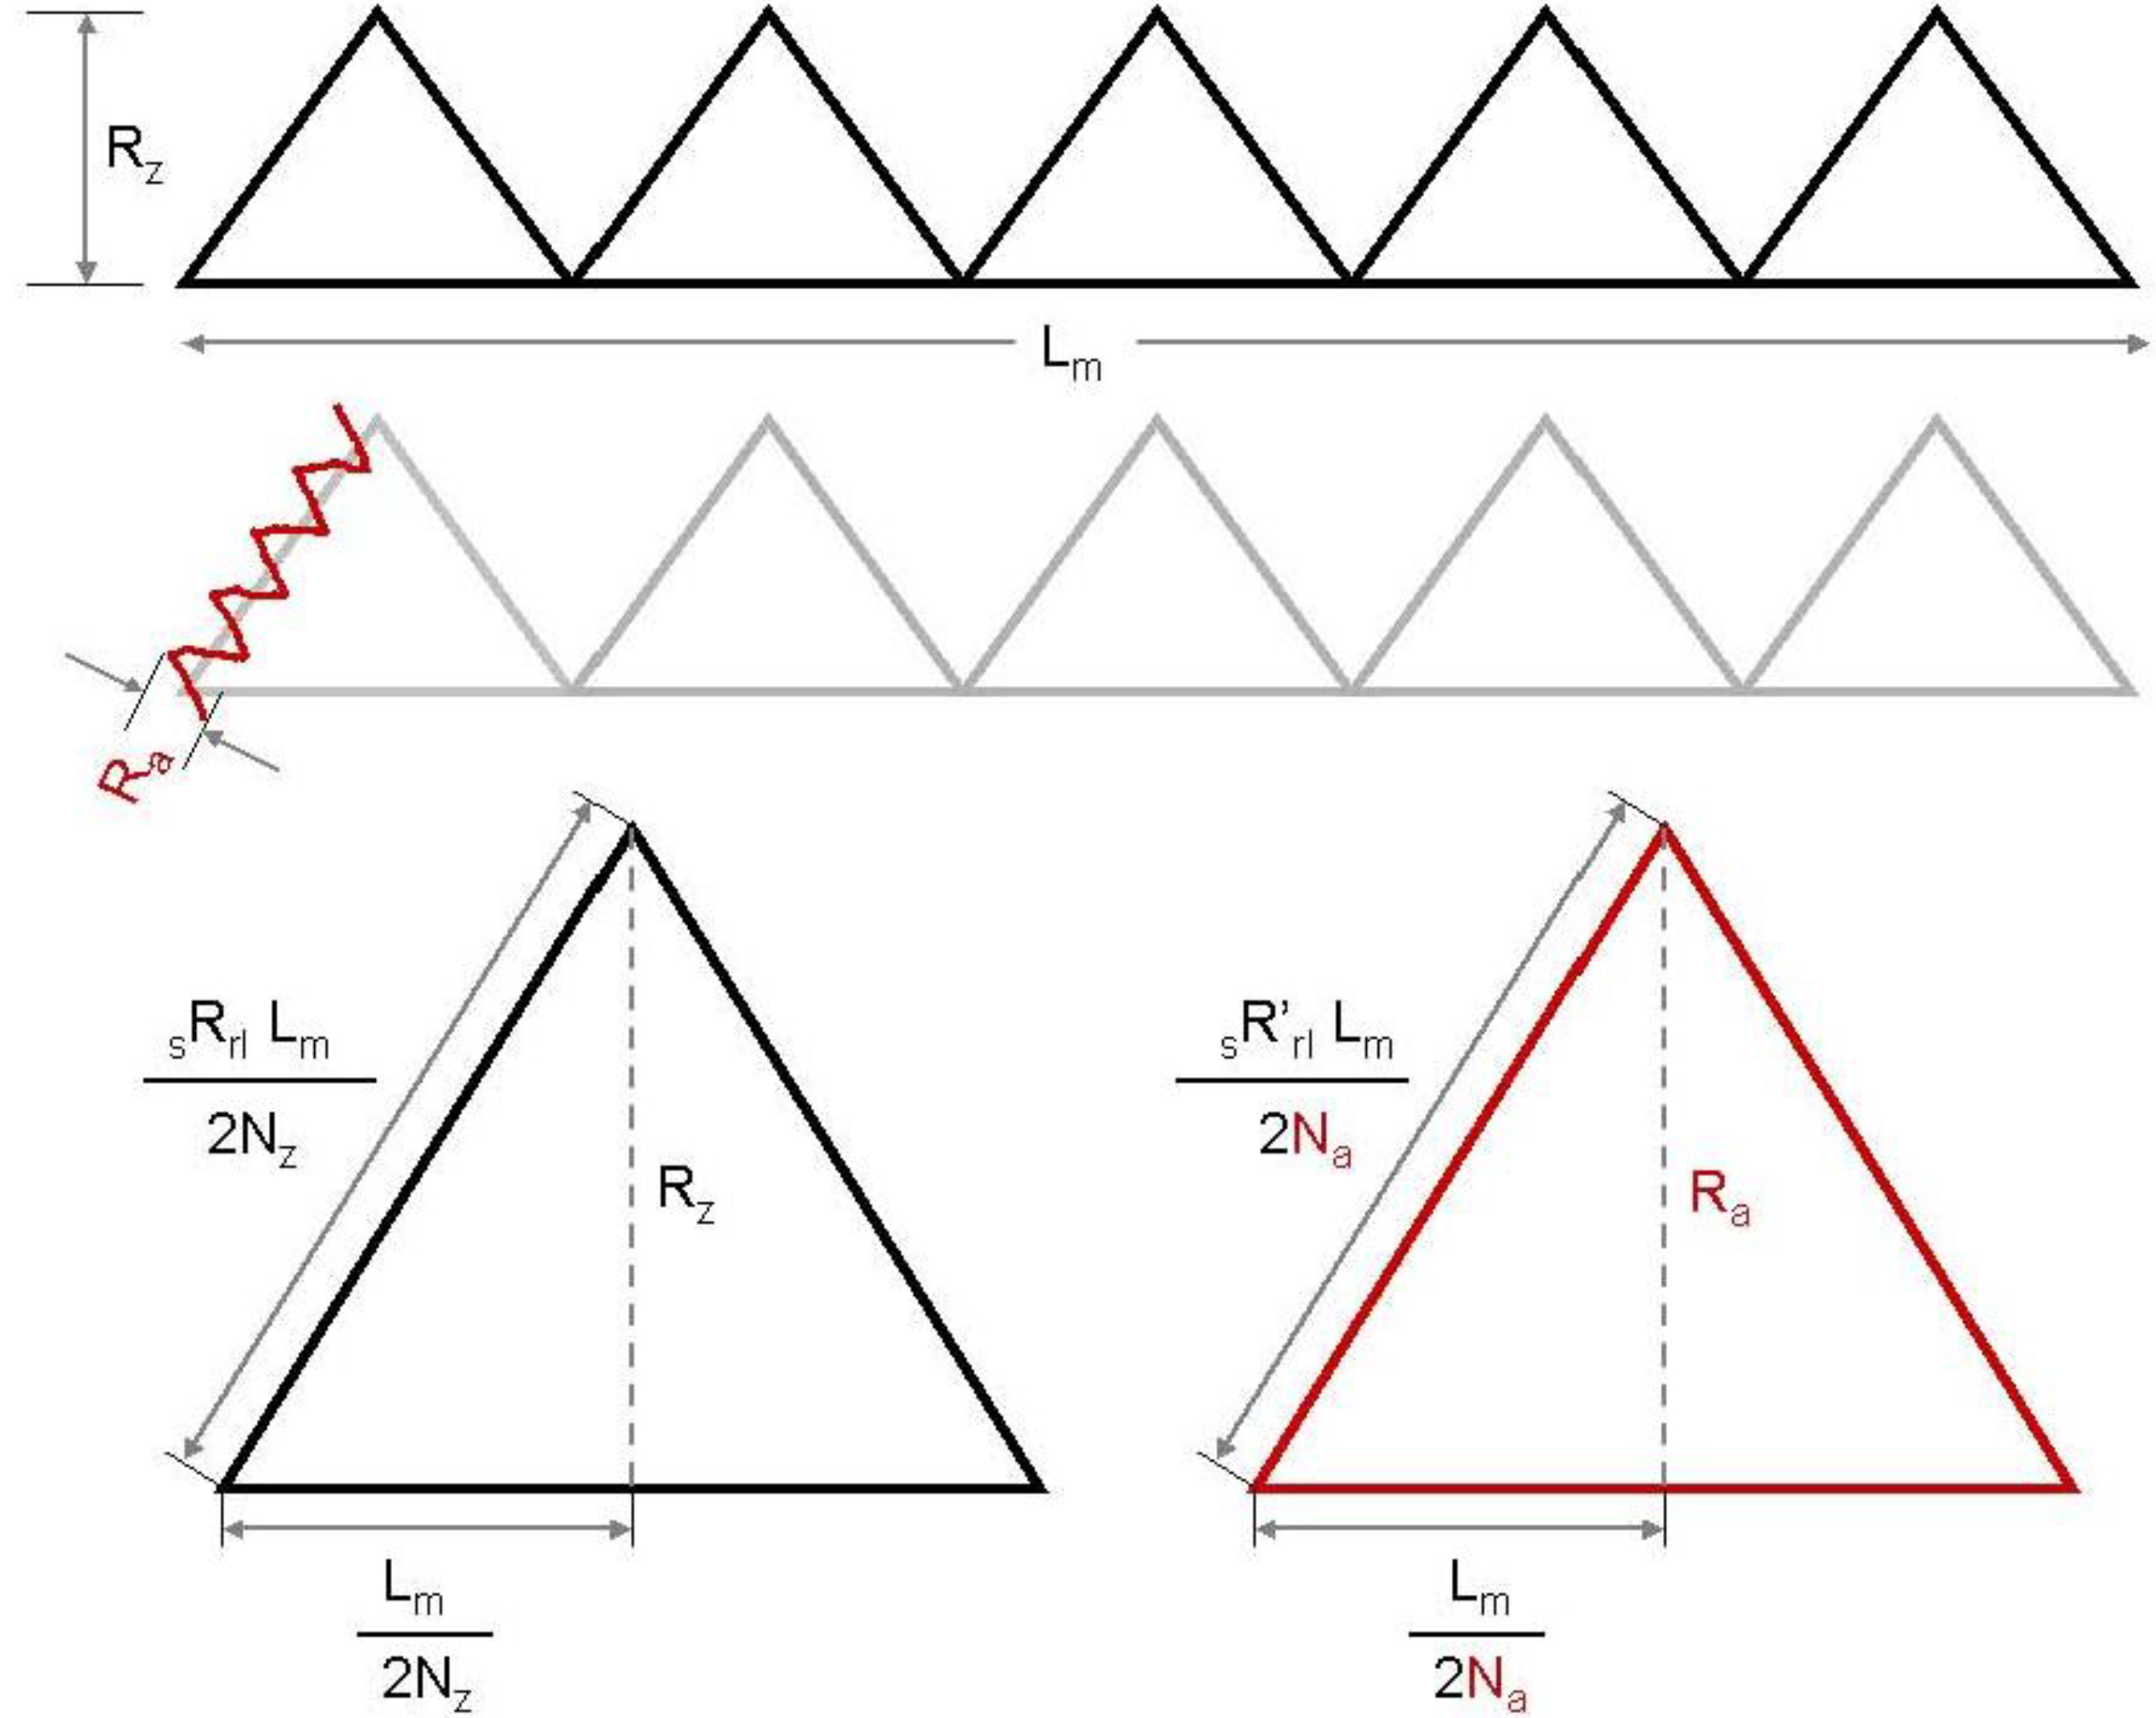
Figure 2.
2D profile using triangular waves to describe the formation of long and short waves and their relation with Rz and Ra.
Figure 2.
2D profile using triangular waves to describe the formation of long and short waves and their relation with Rz and Ra.
Figure 3.
Quantification of cavities by ‘filling quantity operation’ [
7] under 6 µm of highest point.
Figure 3.
Quantification of cavities by ‘filling quantity operation’ [
7] under 6 µm of highest point.
The threshold is an arbitrary value that depends on surface morphology. The purpose is to take a reference plane that can serve as “failure”- limit for all the surfaces to be studied. As it will be shown later, the volumetric characterization of SMC surfaces produced by another better polished metallic mold demands the use of a threshold of only 2 µm.
Applying the model for a surface of SMC-1 (formulation B in [
1]) manufactured by a pressure of 5 MPa, the resulting quantity of cavities and their cross-sectional mean area (
Figure 4) could be predicted schematically by the behavior of R
z, N
z, R
a and N
a as functions of molding time (see
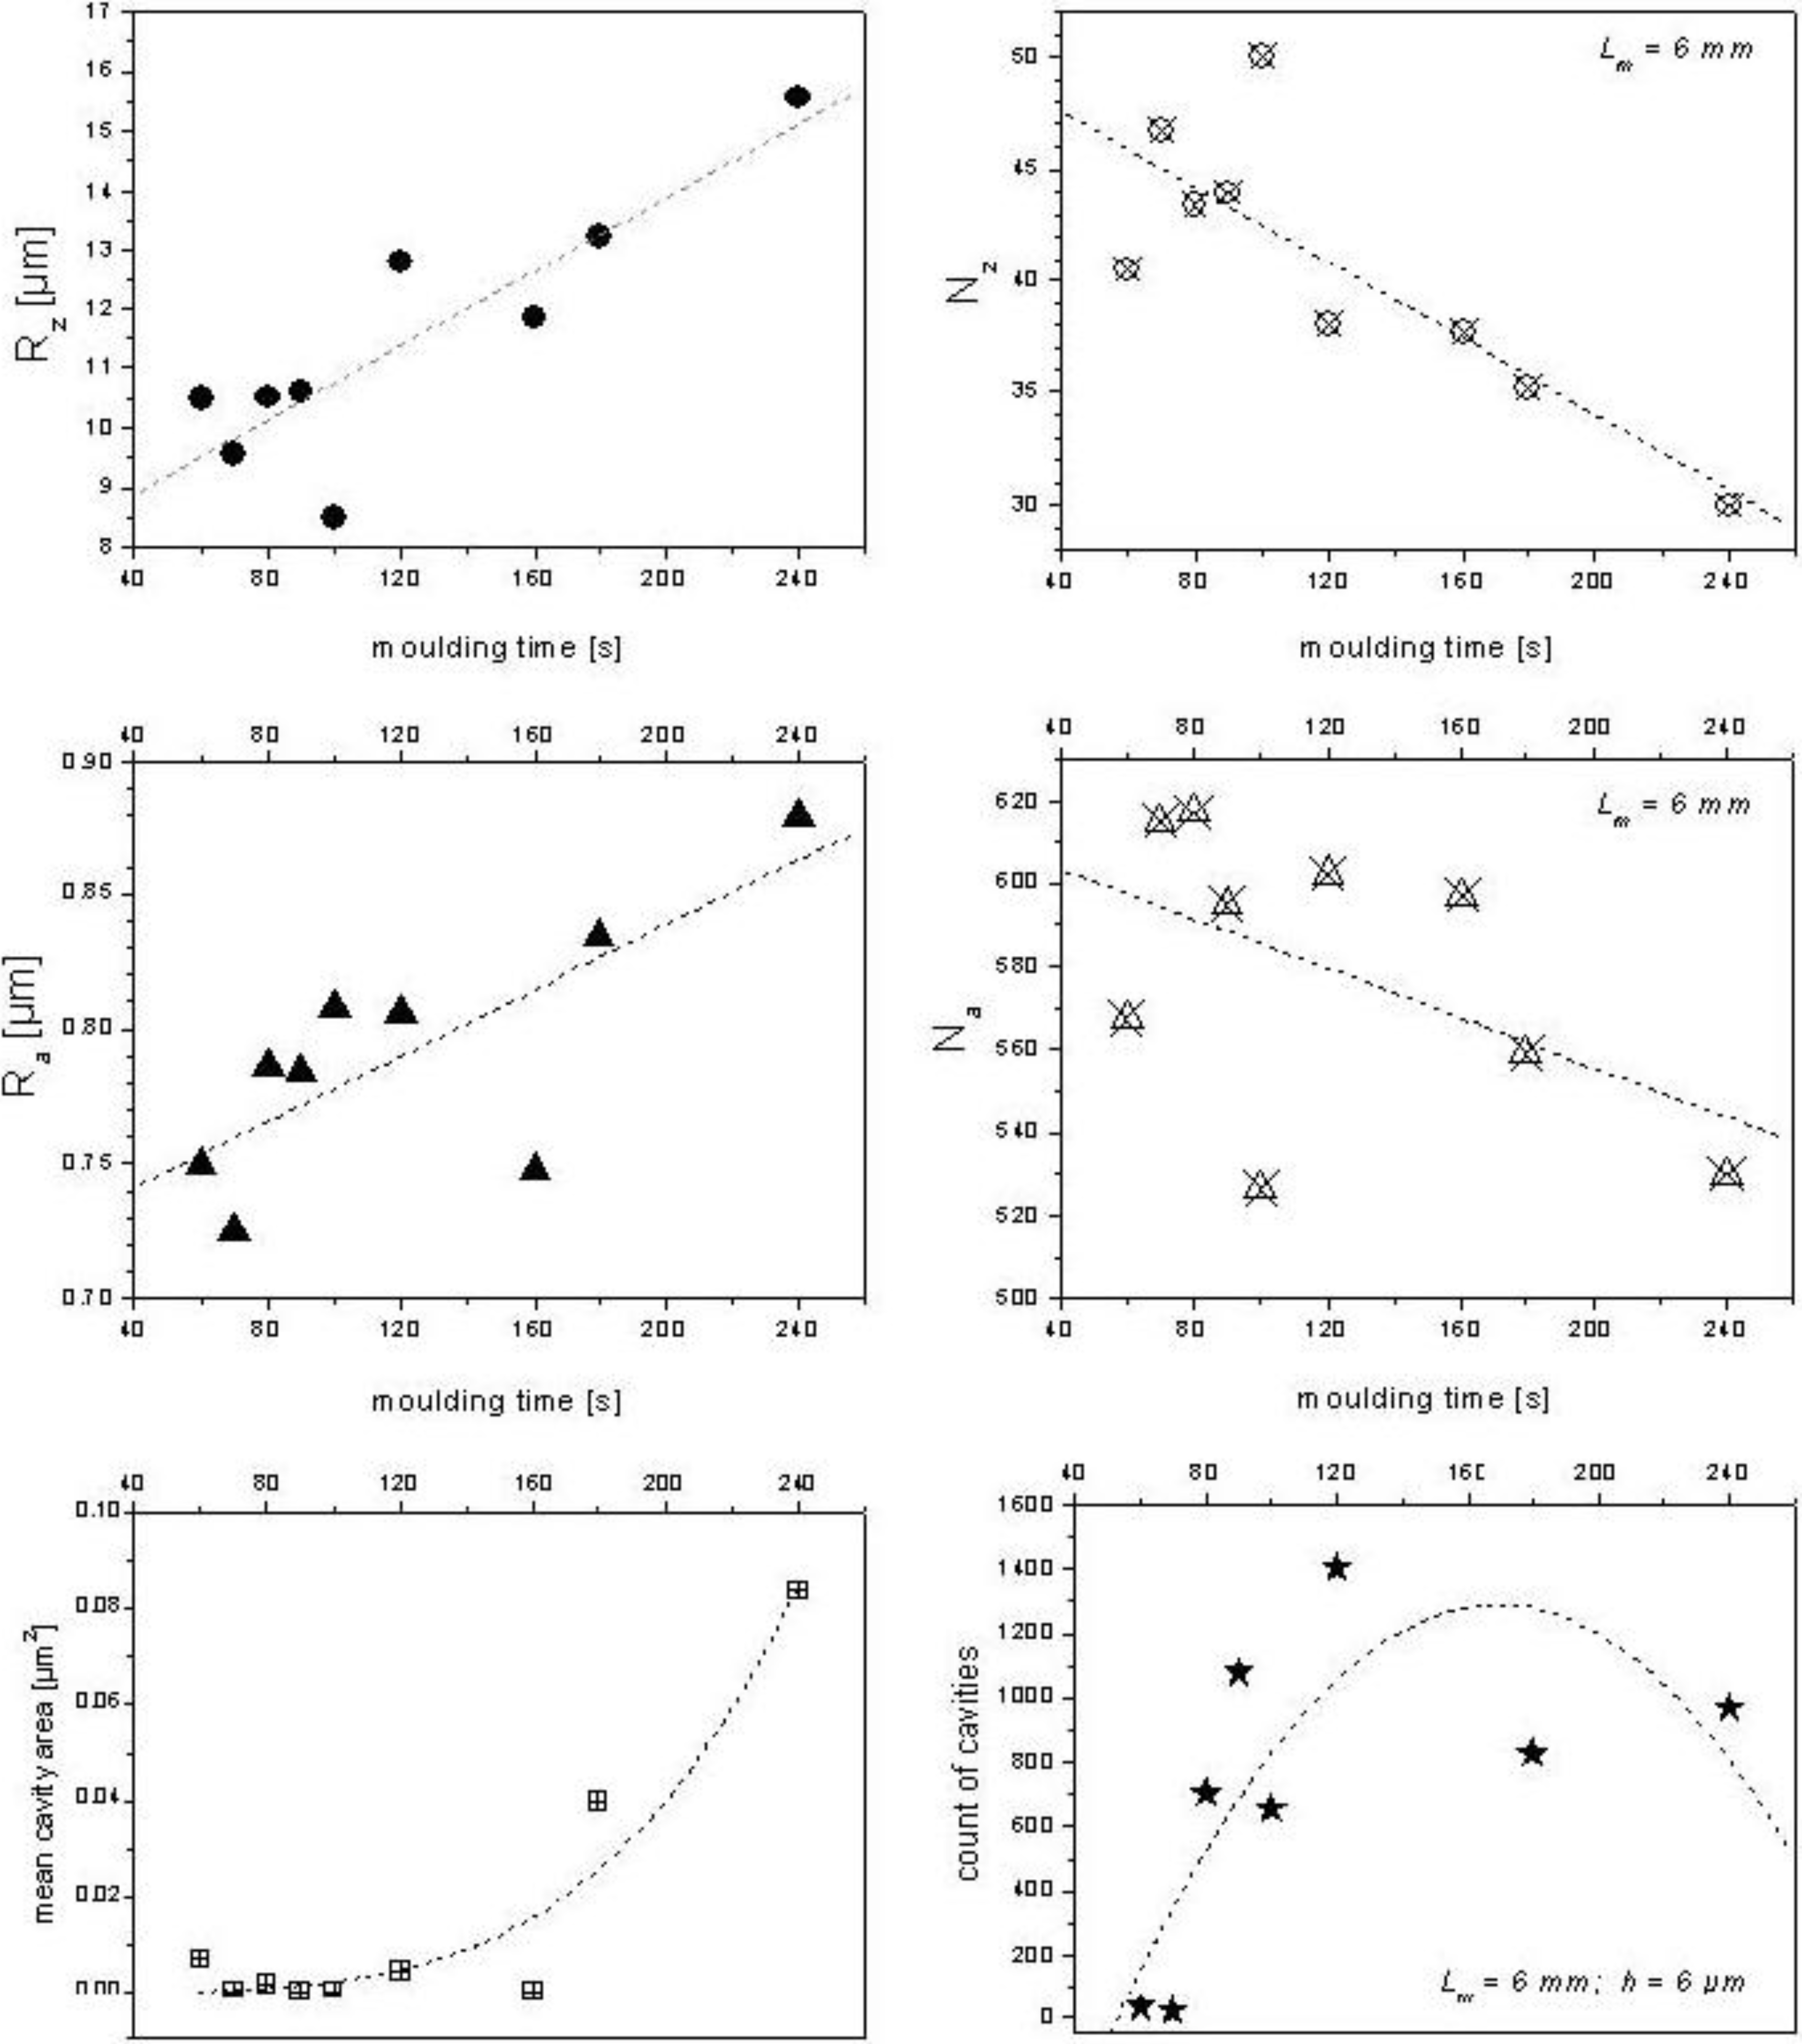
Figure 5). In this case, molding time increases R
z and R
a. At the same time, long and short waves decrease their number. The process results in an increase of cavity cross-sectional area (as a mean value), which is predicted by the conceptual model described above. However, a decrease of cavity count, predicted by the model, occurs only in the last 120 seconds of molding.
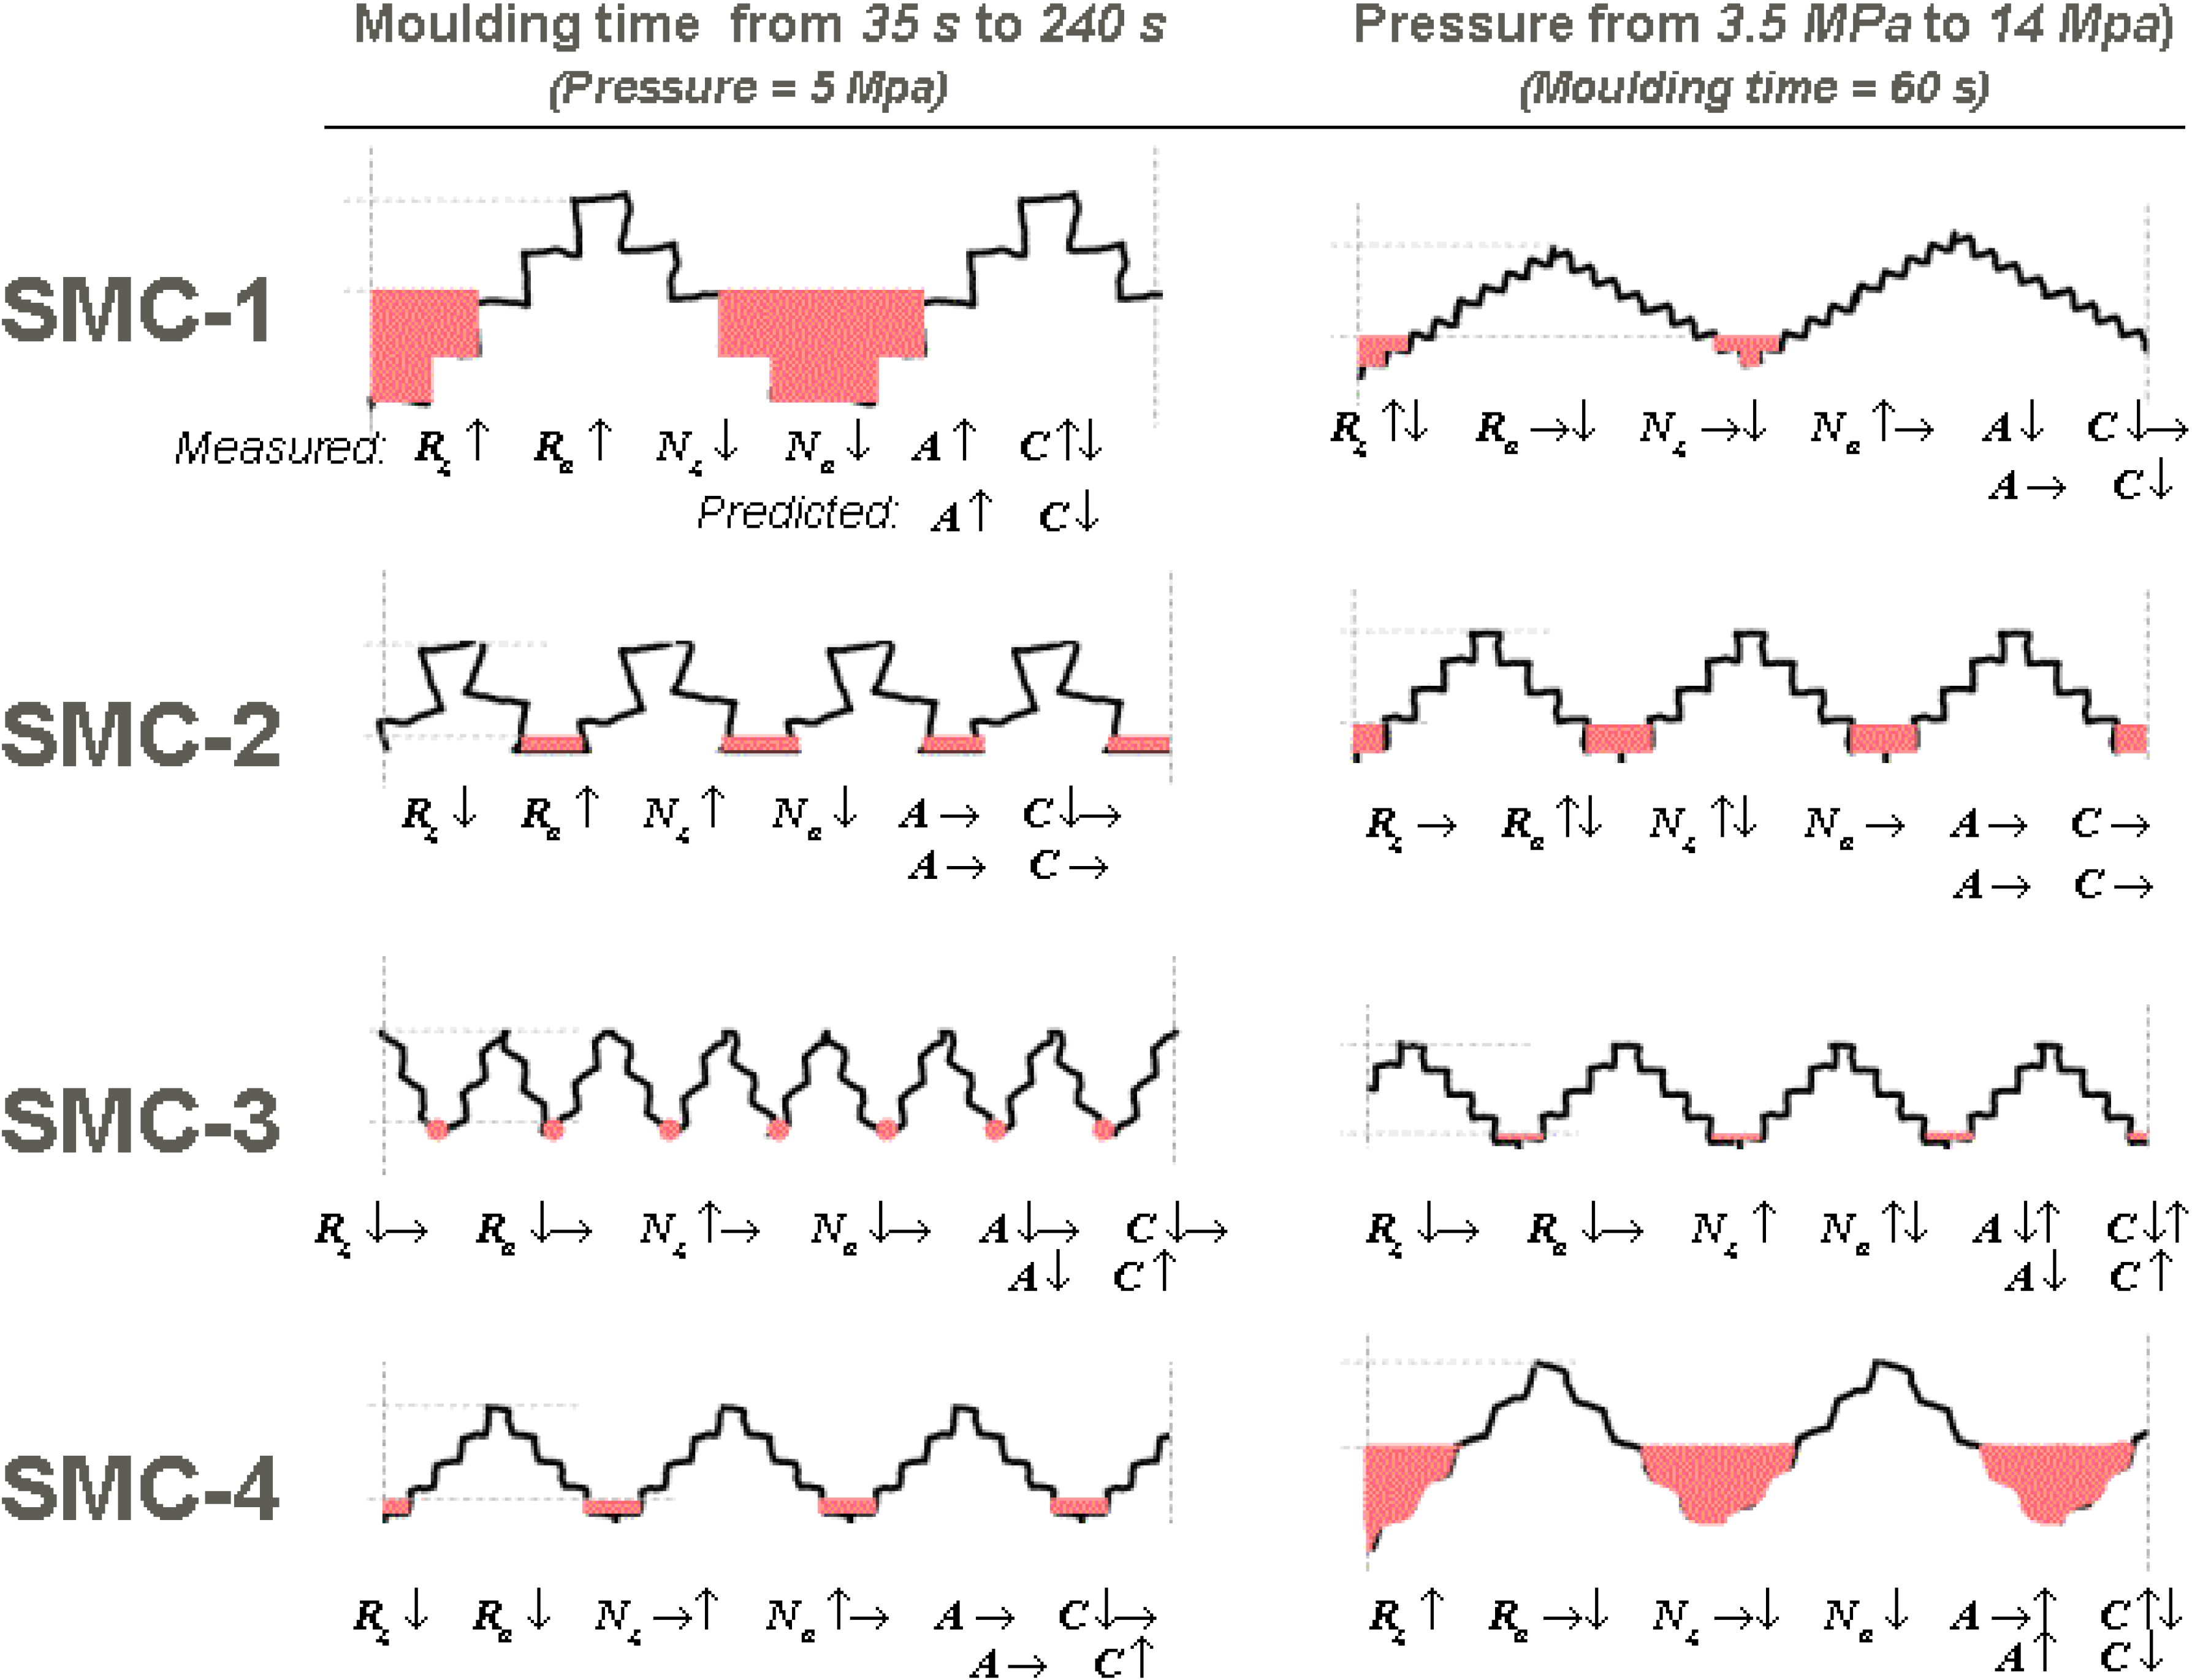
The same analysis, applied to other SMC formulations, having different compositions of filler and additives mentioned in [
1], for different molding time and pressure values, shows that the model can conceptually predict the morphological modification of the profiles (
Figure 6). In the case of SMC-3 at different molding times, the effect of short waviness (which is very important according to [
1]), does not allow the successful application of the model. The best prediction was obtained for SMC-2, for which measured waviness (W
z) is the smallest of those investigated.
Figure 4.
Measured values (Rz, Ra, mean cavity area and count of cavities) and calculated Nz and Na as a function of molding time for a SMC-1 surface.
Figure 4.
Measured values (Rz, Ra, mean cavity area and count of cavities) and calculated Nz and Na as a function of molding time for a SMC-1 surface.
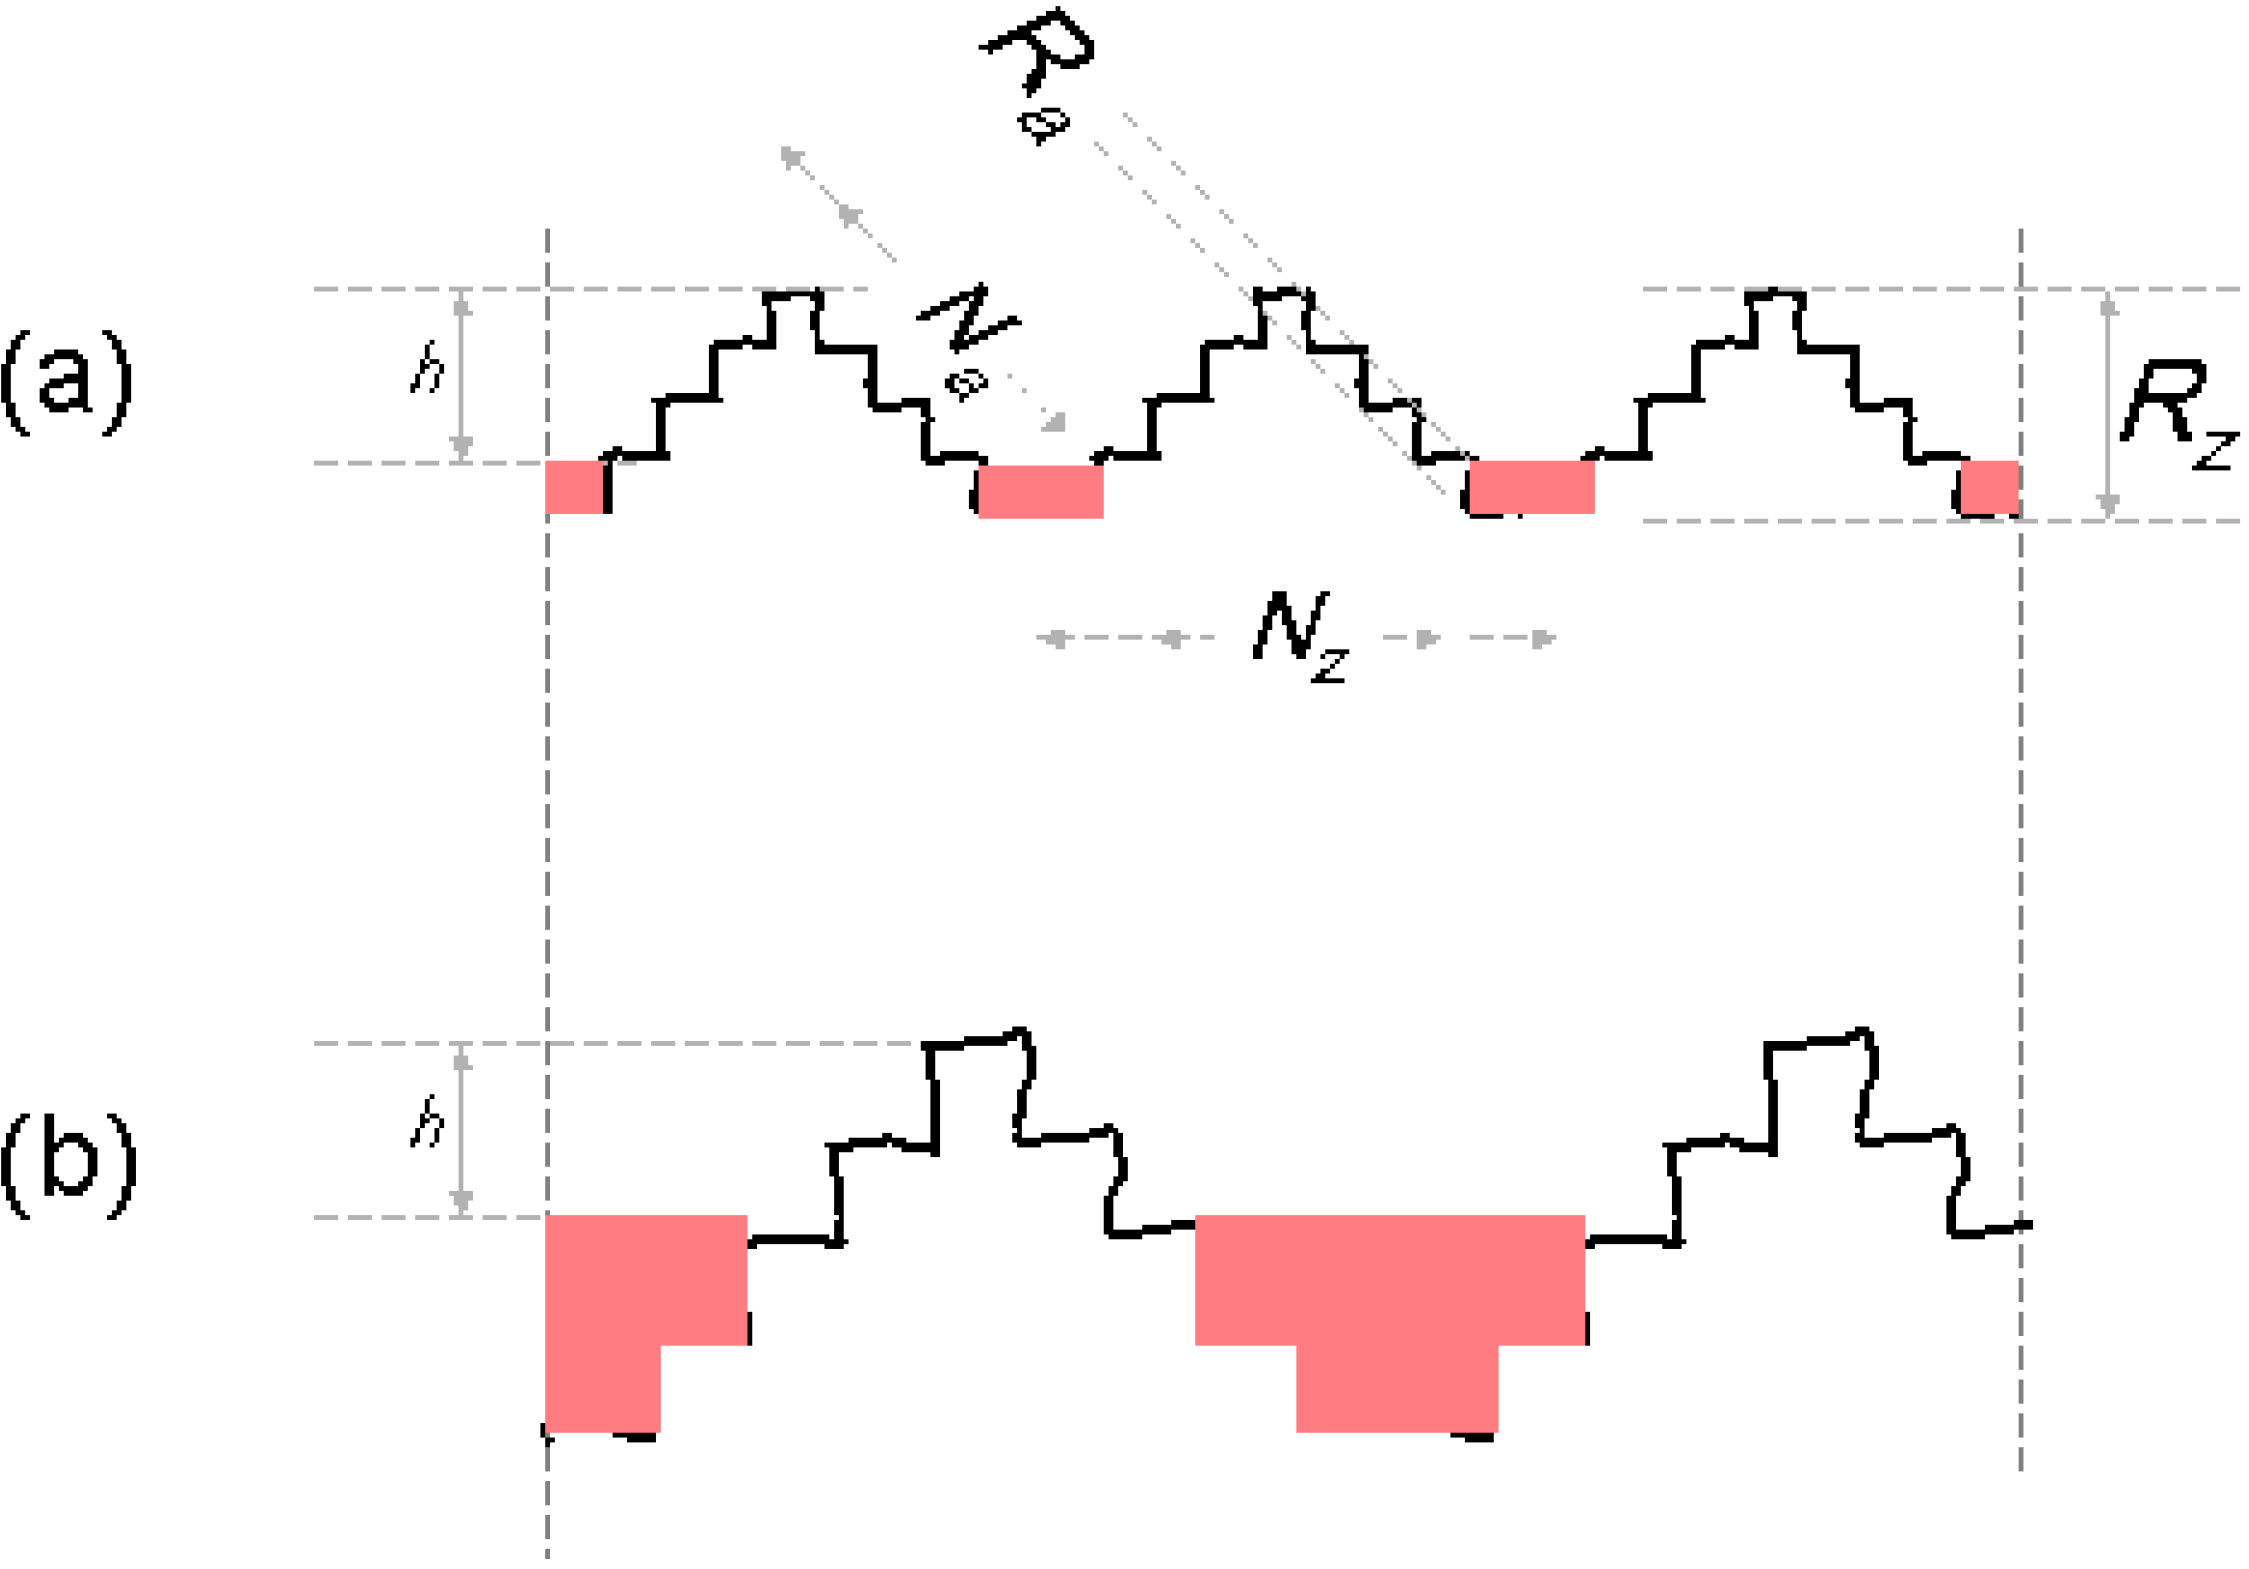
Figure 5.
Modeled SMC-1 profile before molding (a), schematization of predicted profile after 240 s of molding (b). Sizes are not scaled.
Figure 5.
Modeled SMC-1 profile before molding (a), schematization of predicted profile after 240 s of molding (b). Sizes are not scaled.
Figure 6.
A qualitative comparison between measured and predicted parameters. A: mean cavity area, C: count of cavities. ↑ denotes increase, ↓ denotes decrease, → denotes no change.
Figure 6.
A qualitative comparison between measured and predicted parameters. A: mean cavity area, C: count of cavities. ↑ denotes increase, ↓ denotes decrease, → denotes no change.
4.2. Characterization of cavities and prediction of coatability
The number of cavities under defined threshold and their mean area in a defined sample area (
Lm ×
Lm) can be used to compare and quantify the coatability of SMC surfaces. By using both parameters, the frequency and size of structural failures can be quantified.
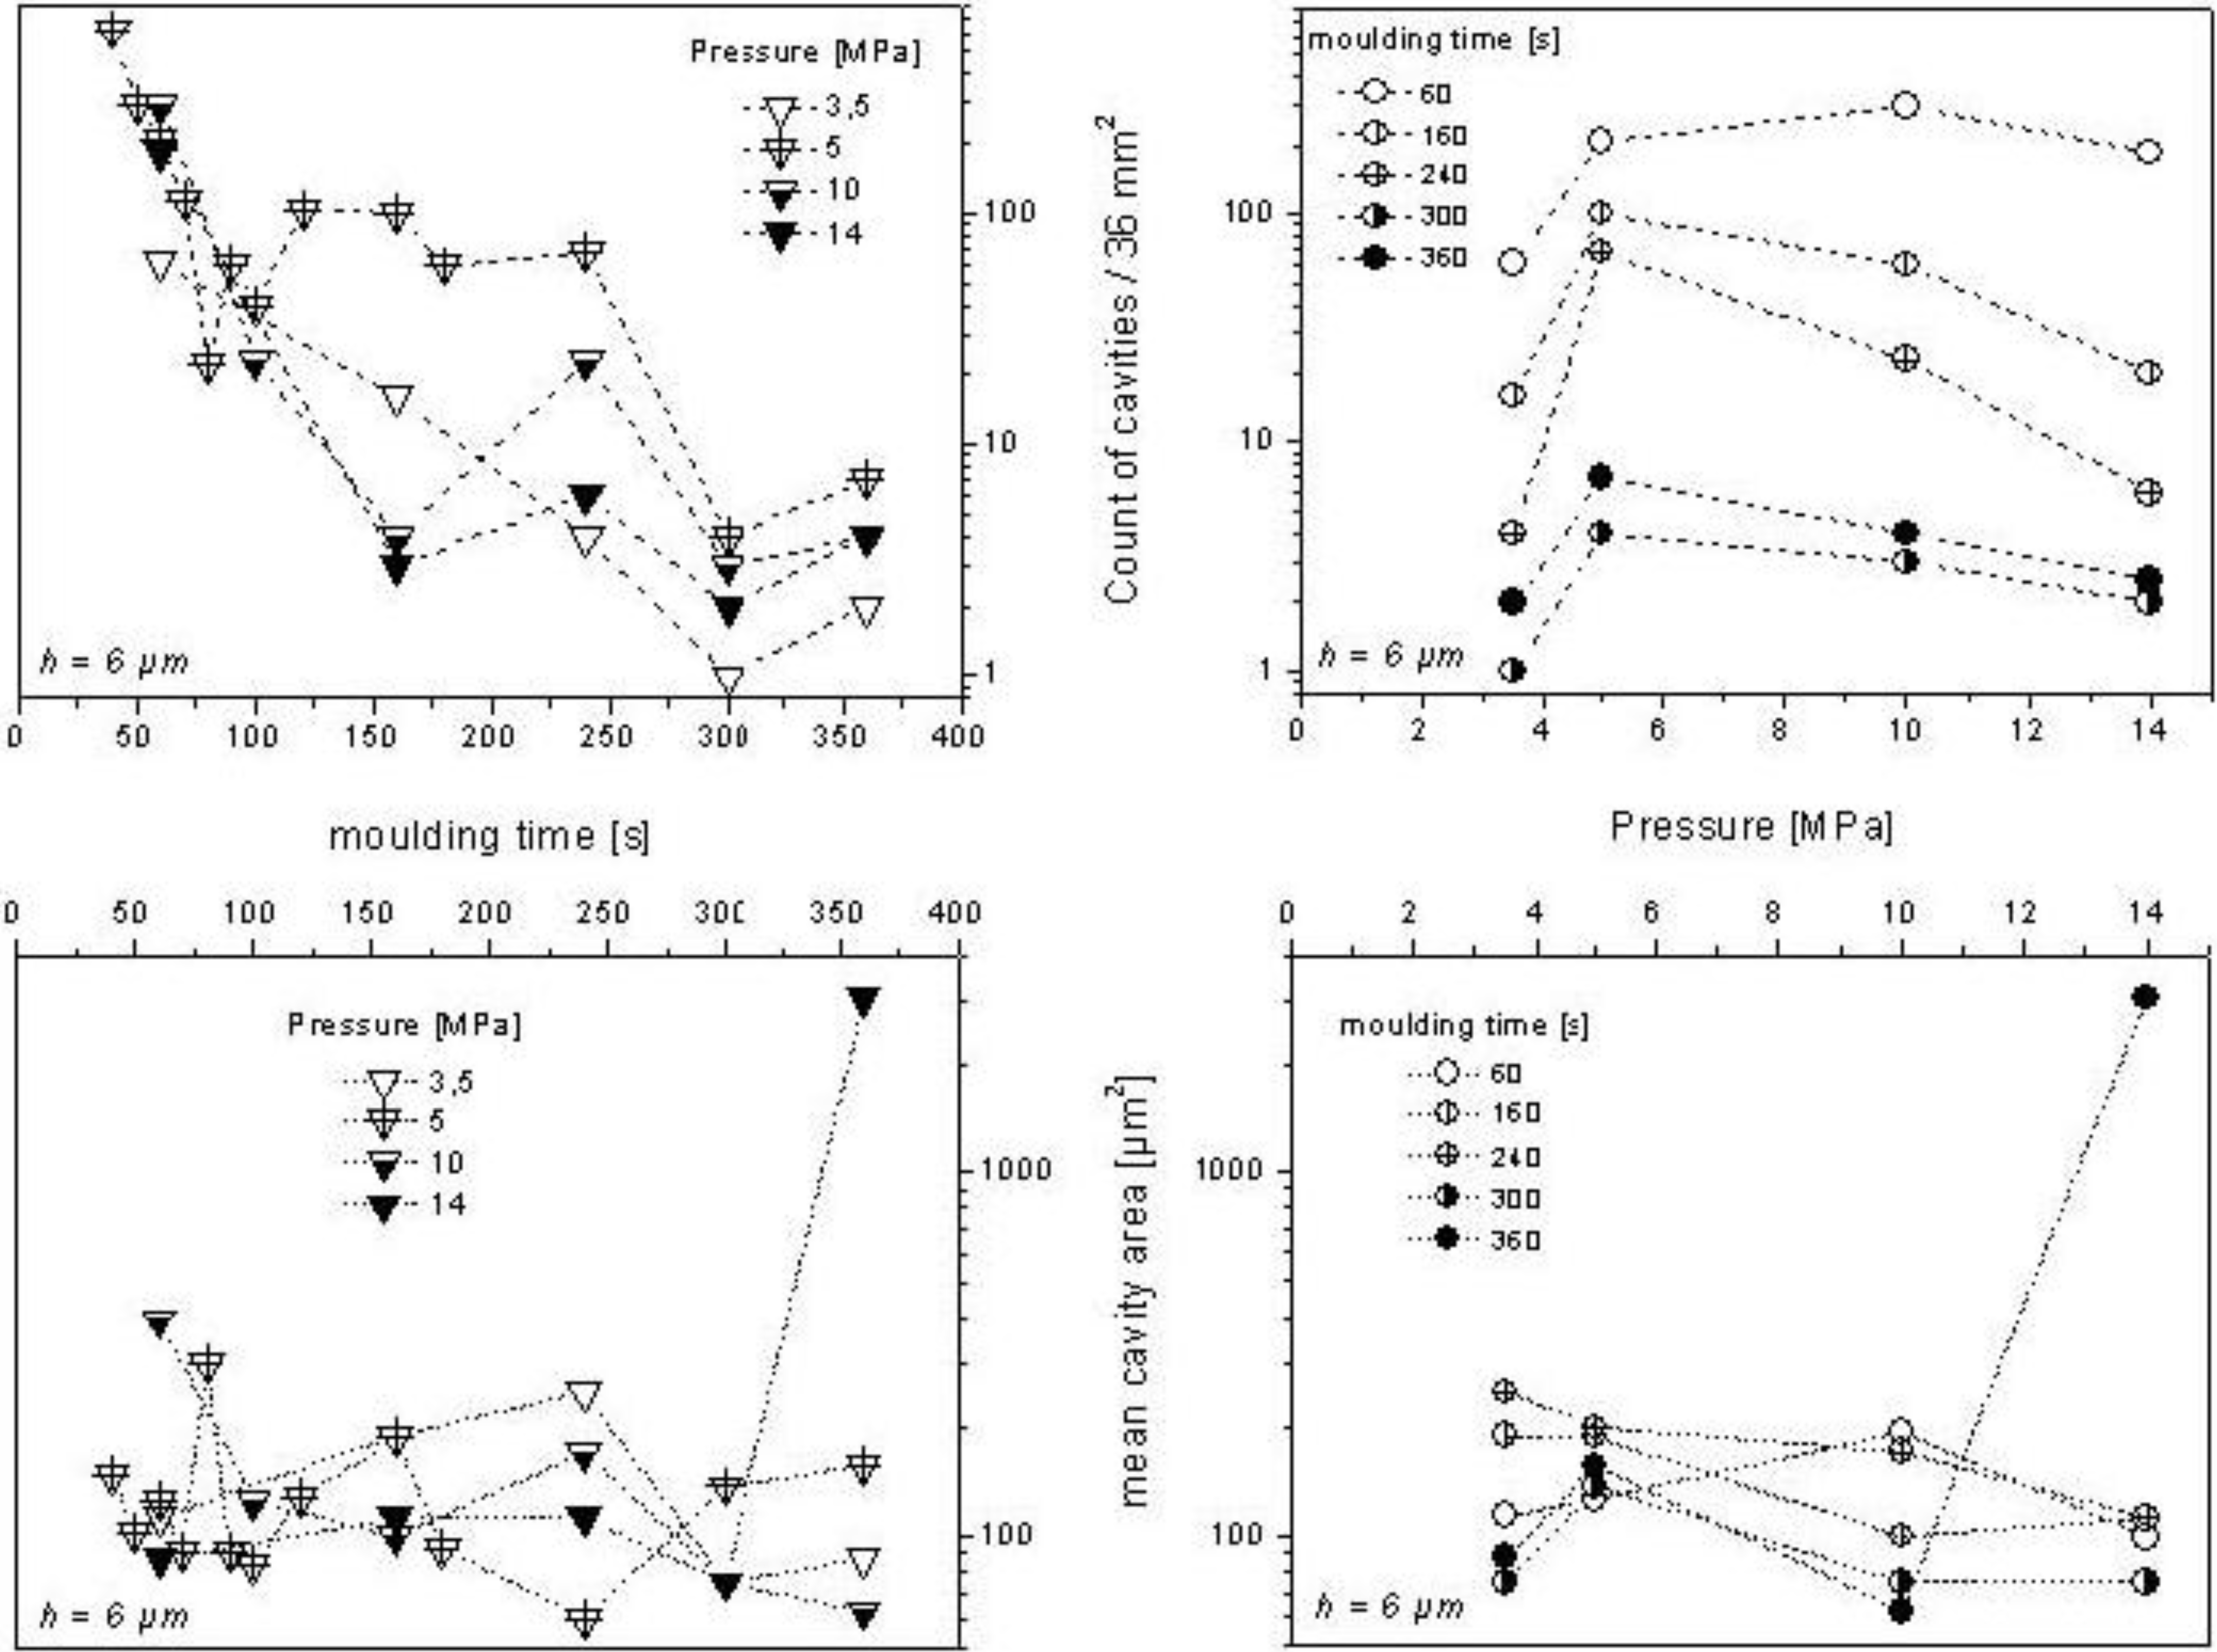
Figure 7 shows the quantification of cavities in order to characterize the coatability of a SMC-2 surface. As explained in
Section 3.1, the statistical reliability of the topographical data was guaranteed by the use of the optimal sampling conditions [
1]. The overlapping behavior observed in
Figure 7 is a consequence of the prepreg placement procedure and adhesion between mold and SMC surface during detaching [
1,
7].
According to this characterization method, at a pressure of 3.5 MPa and a molding time of 300 s the best coatable surface is formed. Only one cavity was found under a threshold of 6 µm, whose area is about 75 µm2. Lower pressure values lad to lower adhesion during the separation of the SMC surface from metallic mold; as a consequence, the resulting topography is more regular.
At the highest pressure (14 MPa), only two cavities were found after 300 s of molding and four cavities after 360 s. However, by this duration of molding, mean area of the cavities increased dramatically from 75 µm2 to 3000 µm2.
Figure 7.
Count of cavities (top) and mean cavity area (bottom) under 6 µm from the highest point by different pressures (right panels) and molding durations (left panels) for SMC-2 (
Figure 6) surfaces. Samples studied (36 mm
2, L
m = 6 mm) correspond to the same position of metallic mold.
Figure 7.
Count of cavities (top) and mean cavity area (bottom) under 6 µm from the highest point by different pressures (right panels) and molding durations (left panels) for SMC-2 (
Figure 6) surfaces. Samples studied (36 mm
2, L
m = 6 mm) correspond to the same position of metallic mold.
4.3. Surface Relative Smooth parameter (SRS) to characterize the topographic modification
By using the count of cavities and their mean area as characterization parameters, only deep points are considered as potential causes of surface failures after coating by formation of undesired bubbles. However, tests demonstrate that grains (peaks), which are normally produced by deeper regions on the metallic mold, could not be successfully coated.
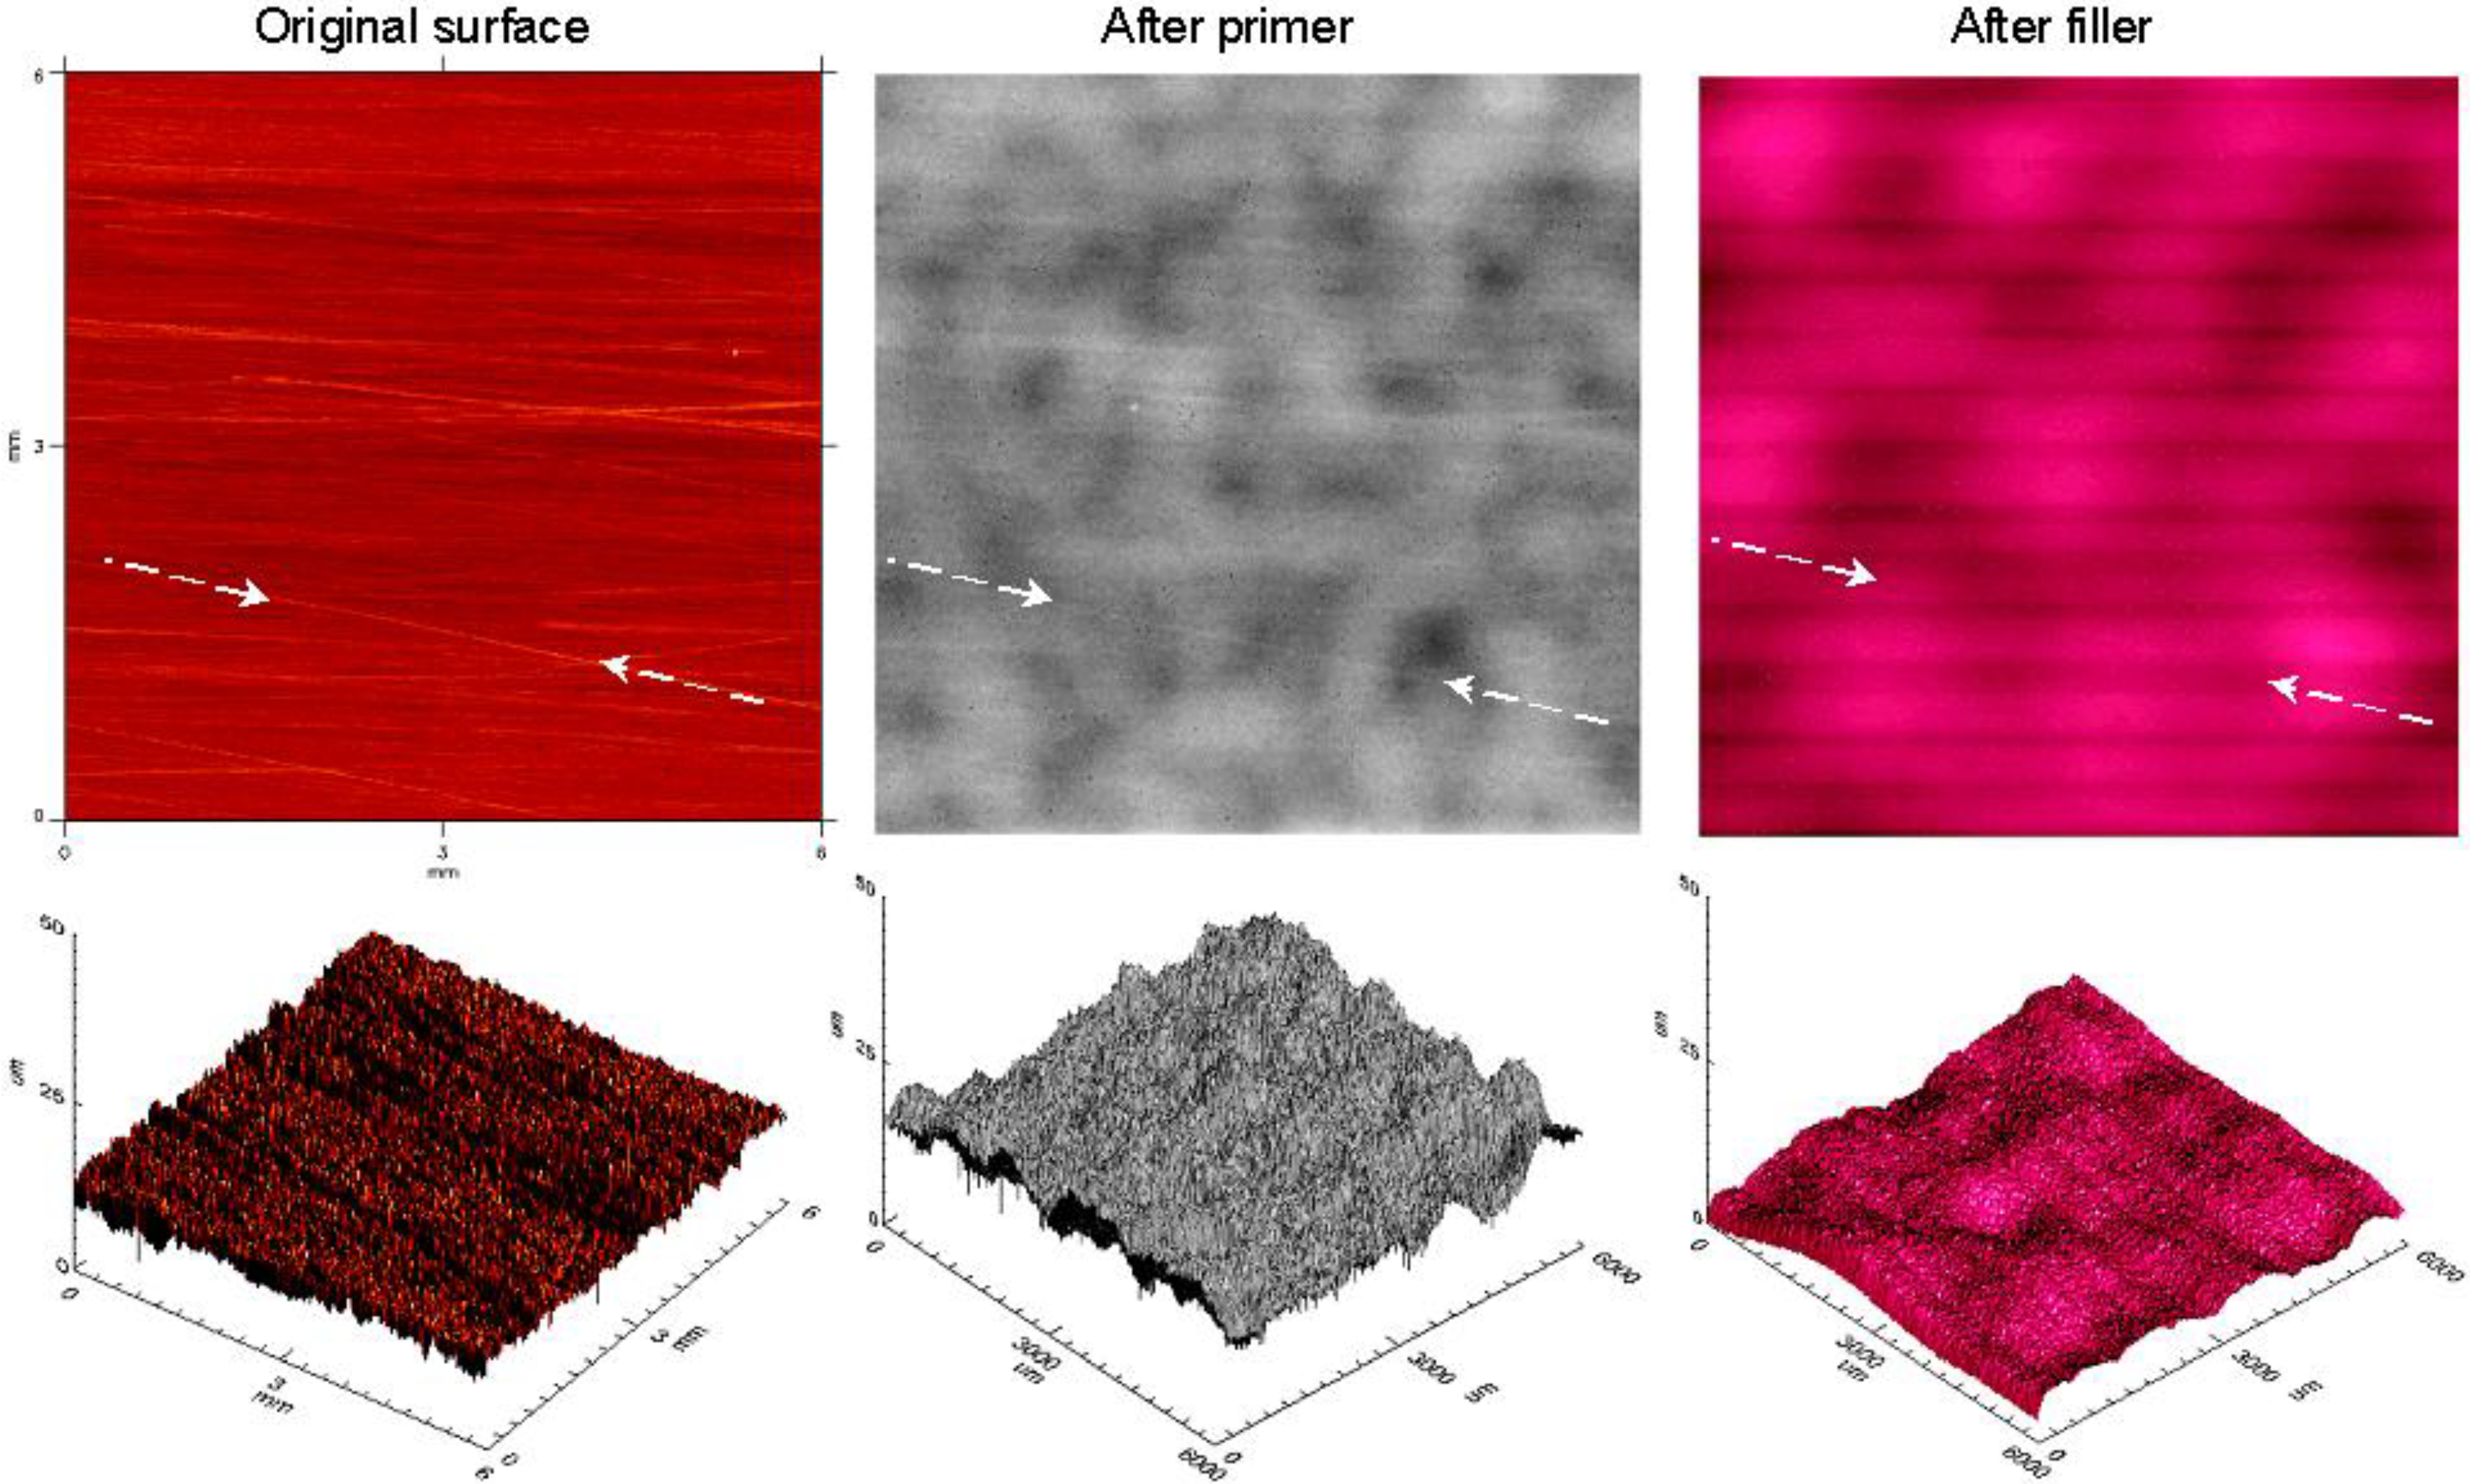
Figure 8 shows that after the first two steps of the coating process, primer (B1402 + B1426 Wörwag) and filler (7245 Anthrazit Hammelrath), some grooves remain at the surface.
Figure 8.
Peaks marked by arrows, produced by mold irregularities, remain after application of primer and, occasionally, after filler.
Figure 8.
Peaks marked by arrows, produced by mold irregularities, remain after application of primer and, occasionally, after filler.
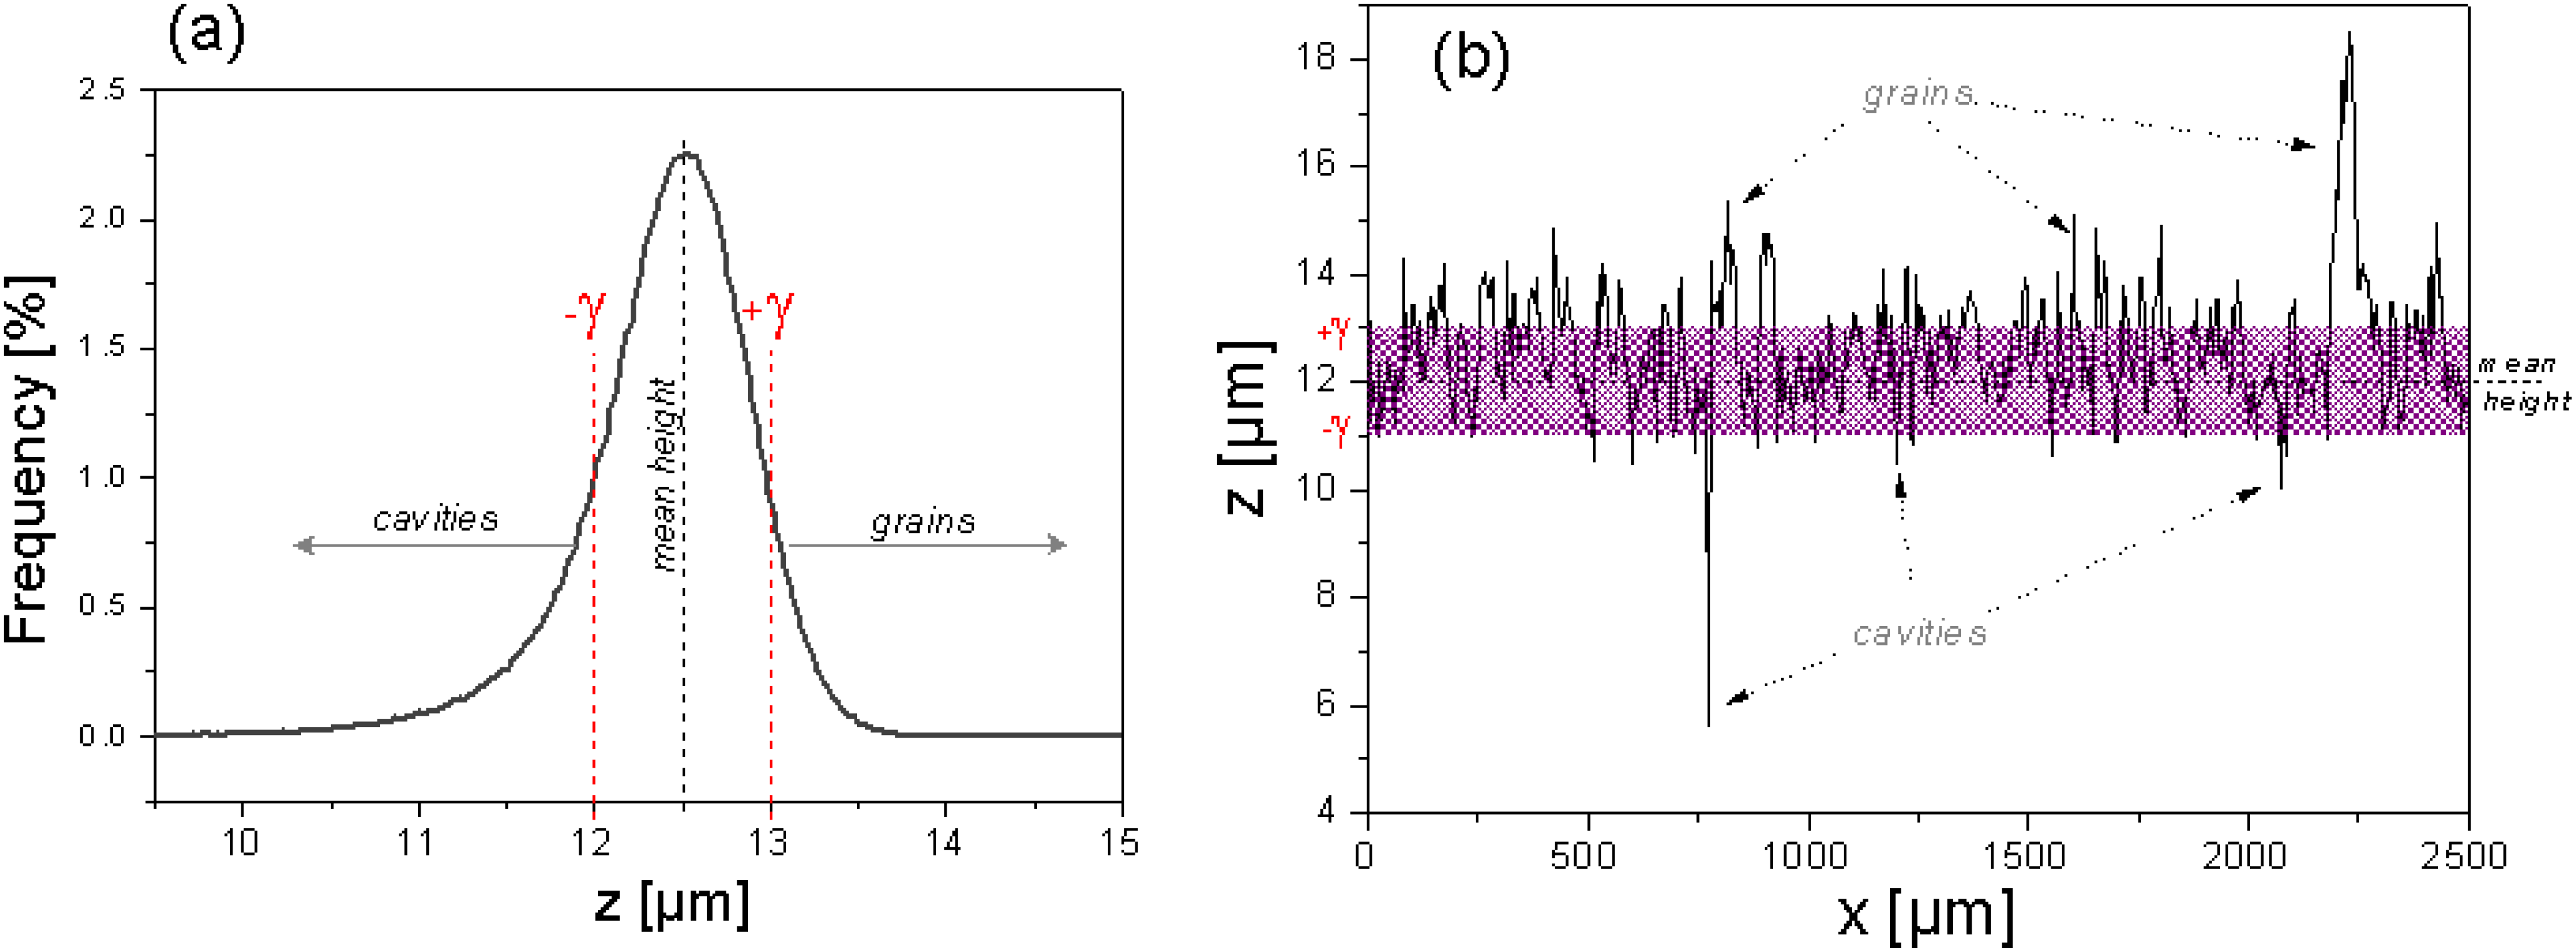
To quantify the cavities as well as the grains of SMC surfaces, a critical parameter is needed. Taking the statistical mean height as a reference height value, it is possible to calculate the quantity and volume of all irregularities above a positive threshold (+γ) and under a negative threshold (-γ), according to
Figure 9. Knowing the total cavities volume (VC) and the total grains volume (VG), it is possible to characterize quantitatively the topographic modification of a surface by any treatment using the Surface Relative Smooth parameter (SRS) defined by the equation:
where i and f denote before and after topographic modification, respectively. For a practical application of this parameter, it is recommended to use percentages. In this case, a SRS value of zero denotes no topographical changes and 100% means a total surface smoothing (elimination of all cavities and grains). Negative values of SRS mean the formation of a more rugose surface after treatment.
Figure 9.
Thresholds +γ and –γ define cavities and grains in a heights histogram (a), or cavities and grains in a surface profile (b).
Figure 9.
Thresholds +γ and –γ define cavities and grains in a heights histogram (a), or cavities and grains in a surface profile (b).
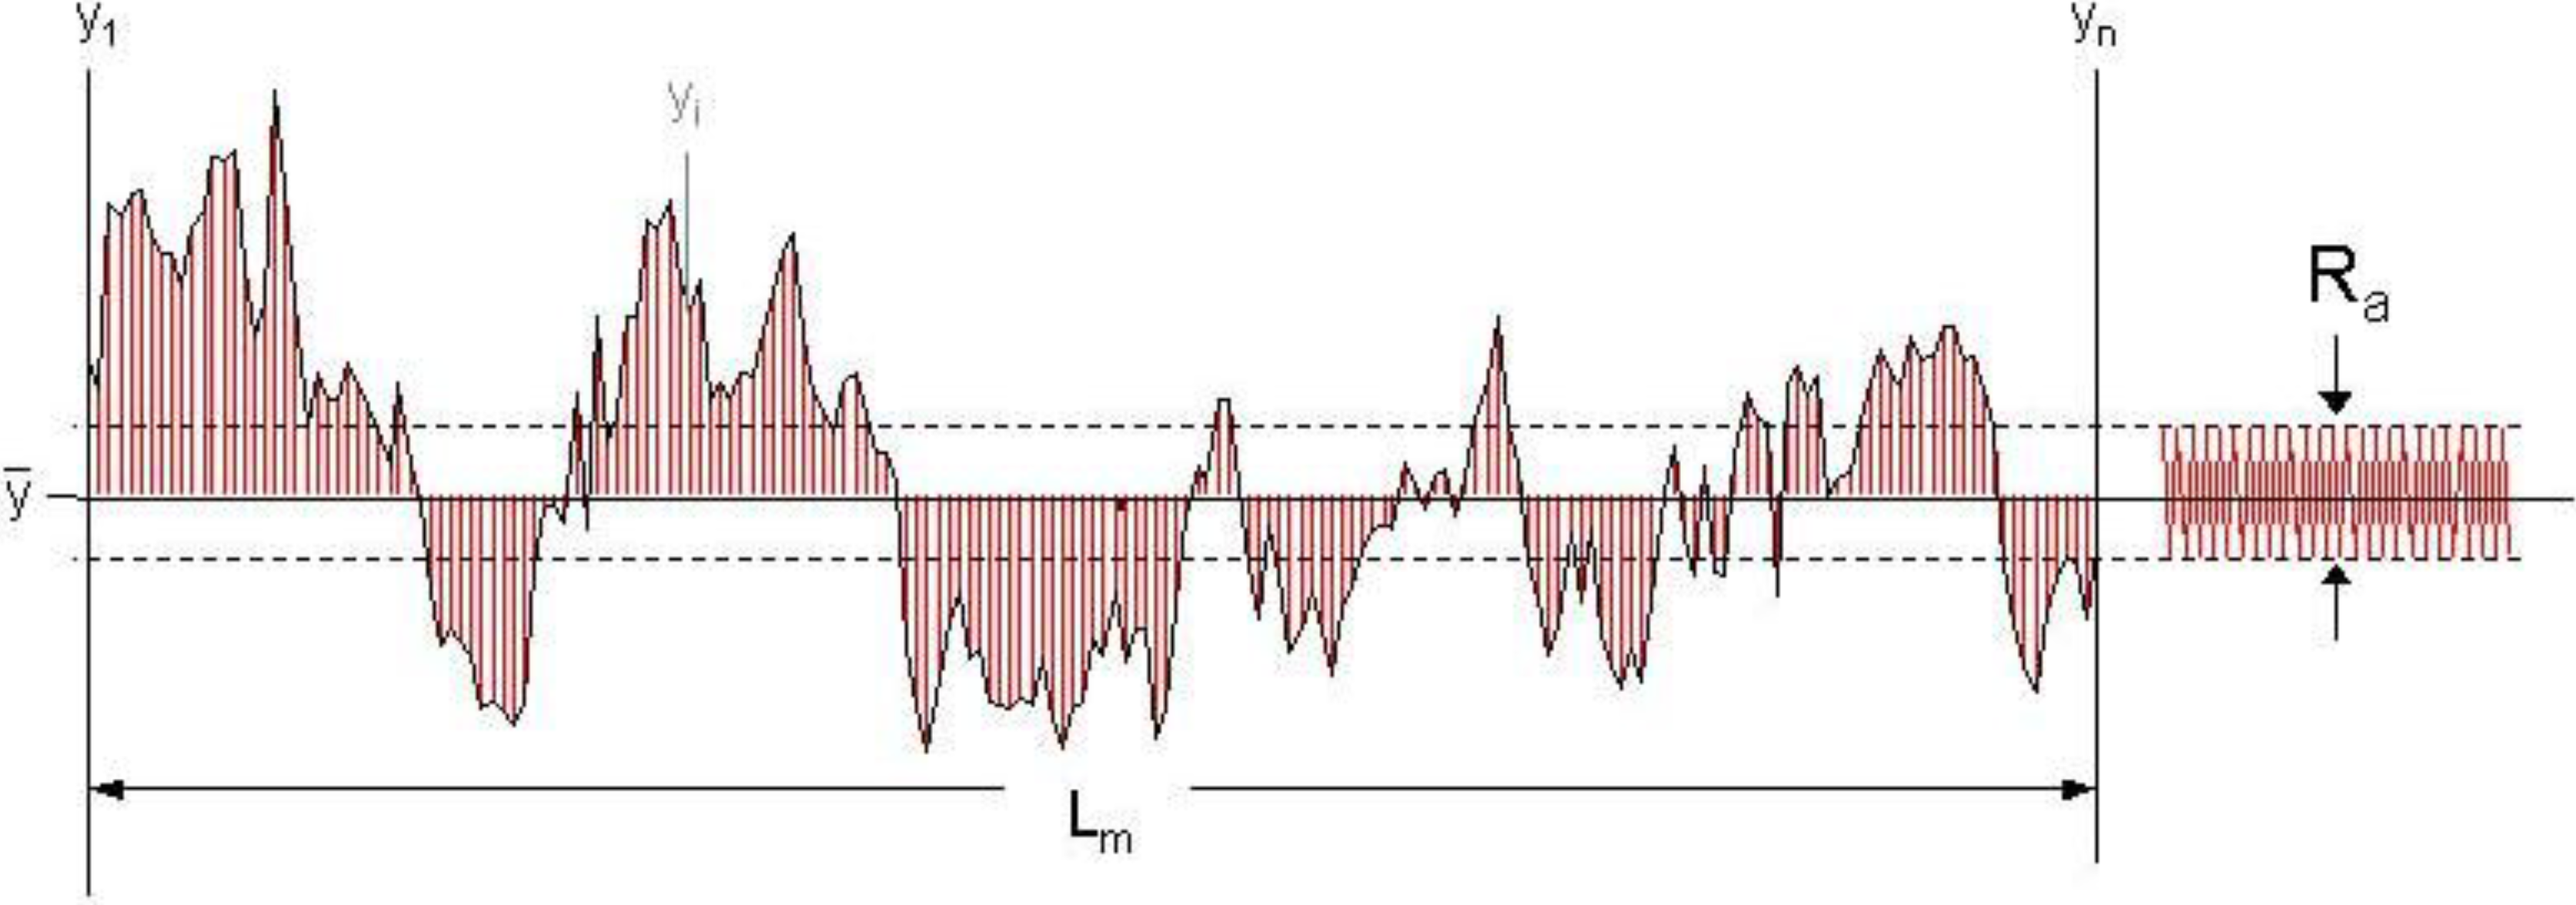
When SRS parameters are used it is highly recommended to compare them in the same sample area. The selection of a value for the threshold γ depends on surface topography; as a first approach ½ R
a can be acceptable. In this case, all cavities and grains are formed by points located above or below the R
a amplitudes, as shown in
Figure 10. The most important condition is that γ must allow topographic differences before and after treatment to be perceived and must be constant during the topographic characterization. Comparison between SRS values only makes sense if the γ value used is the same.
Figure 10.
Arithmetic mean roughness Ra of a profile.
Figure 10.
Arithmetic mean roughness Ra of a profile.
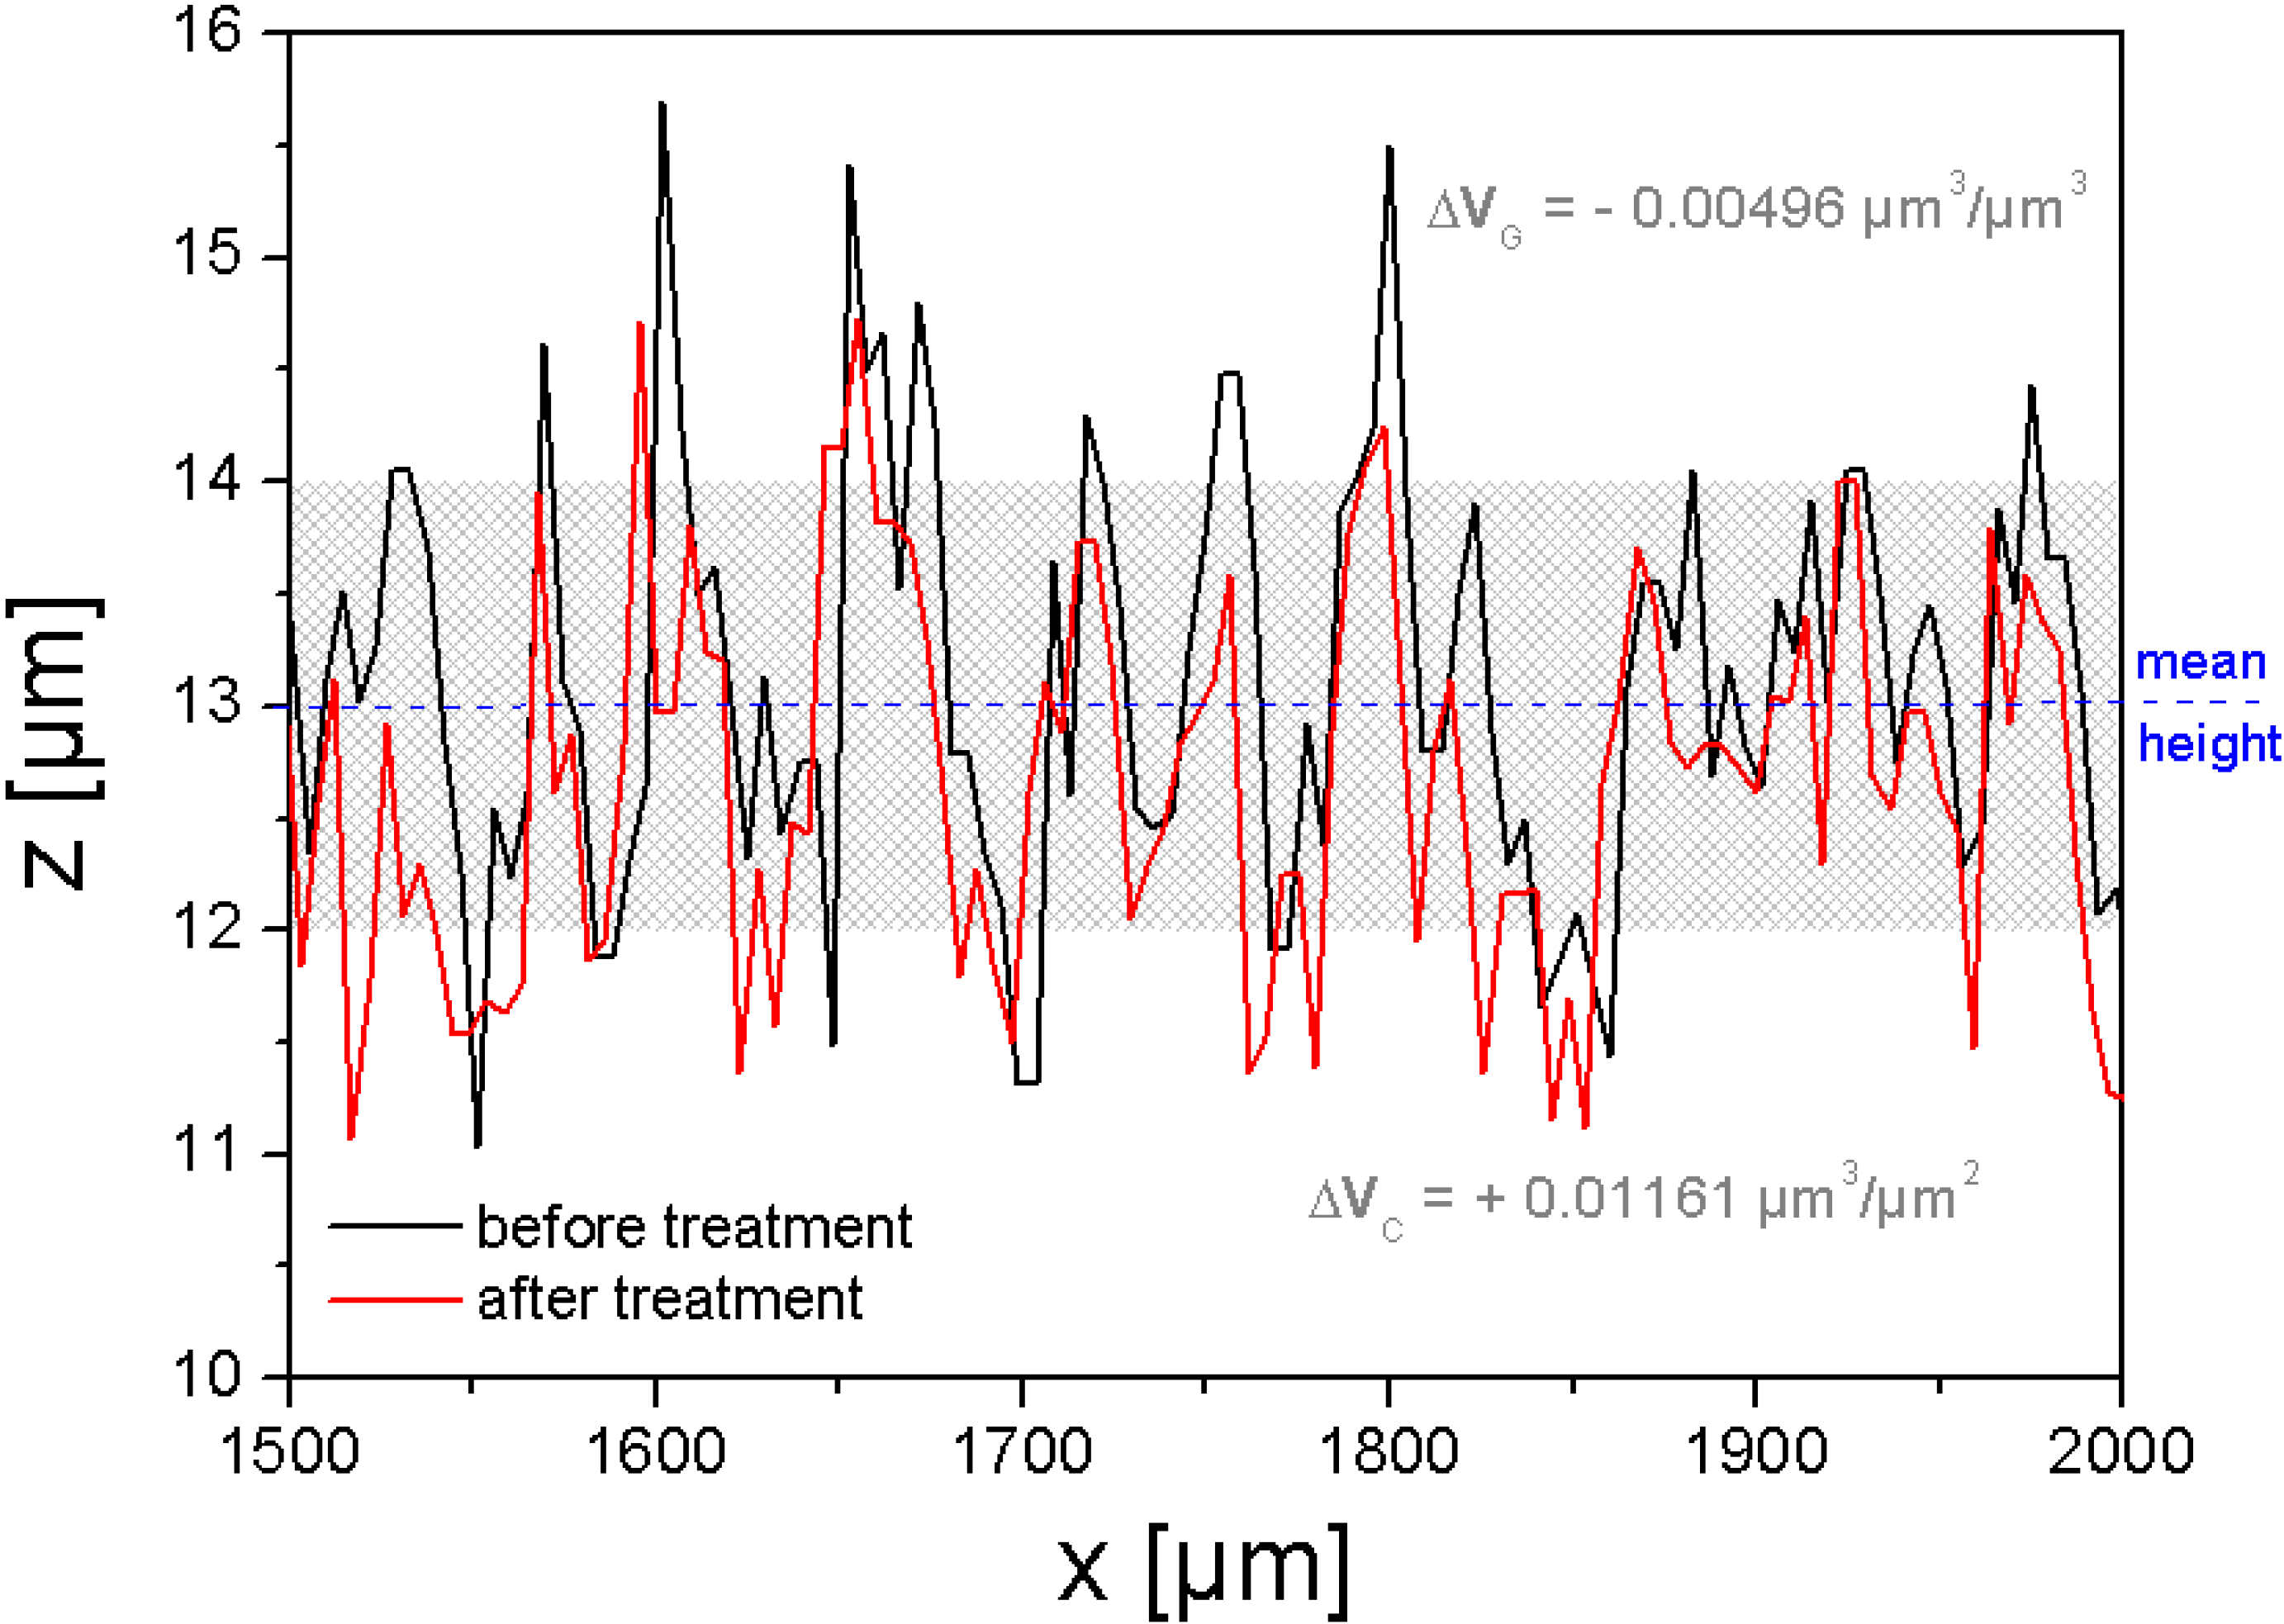
SRS is very sensitive to small changes in topography. For example, after mechanical cleaning (rubbing with cloth) of a SMC surface by a mixture of benzene and ethanol (50%-50% in volume) the topography changes.
Figure 11 shows the profile modification measured over the sample SMC-2, maintaining the measure coordinates.
A complete analysis by SRS should also consider an increase or decrease of counted cavities and grains.
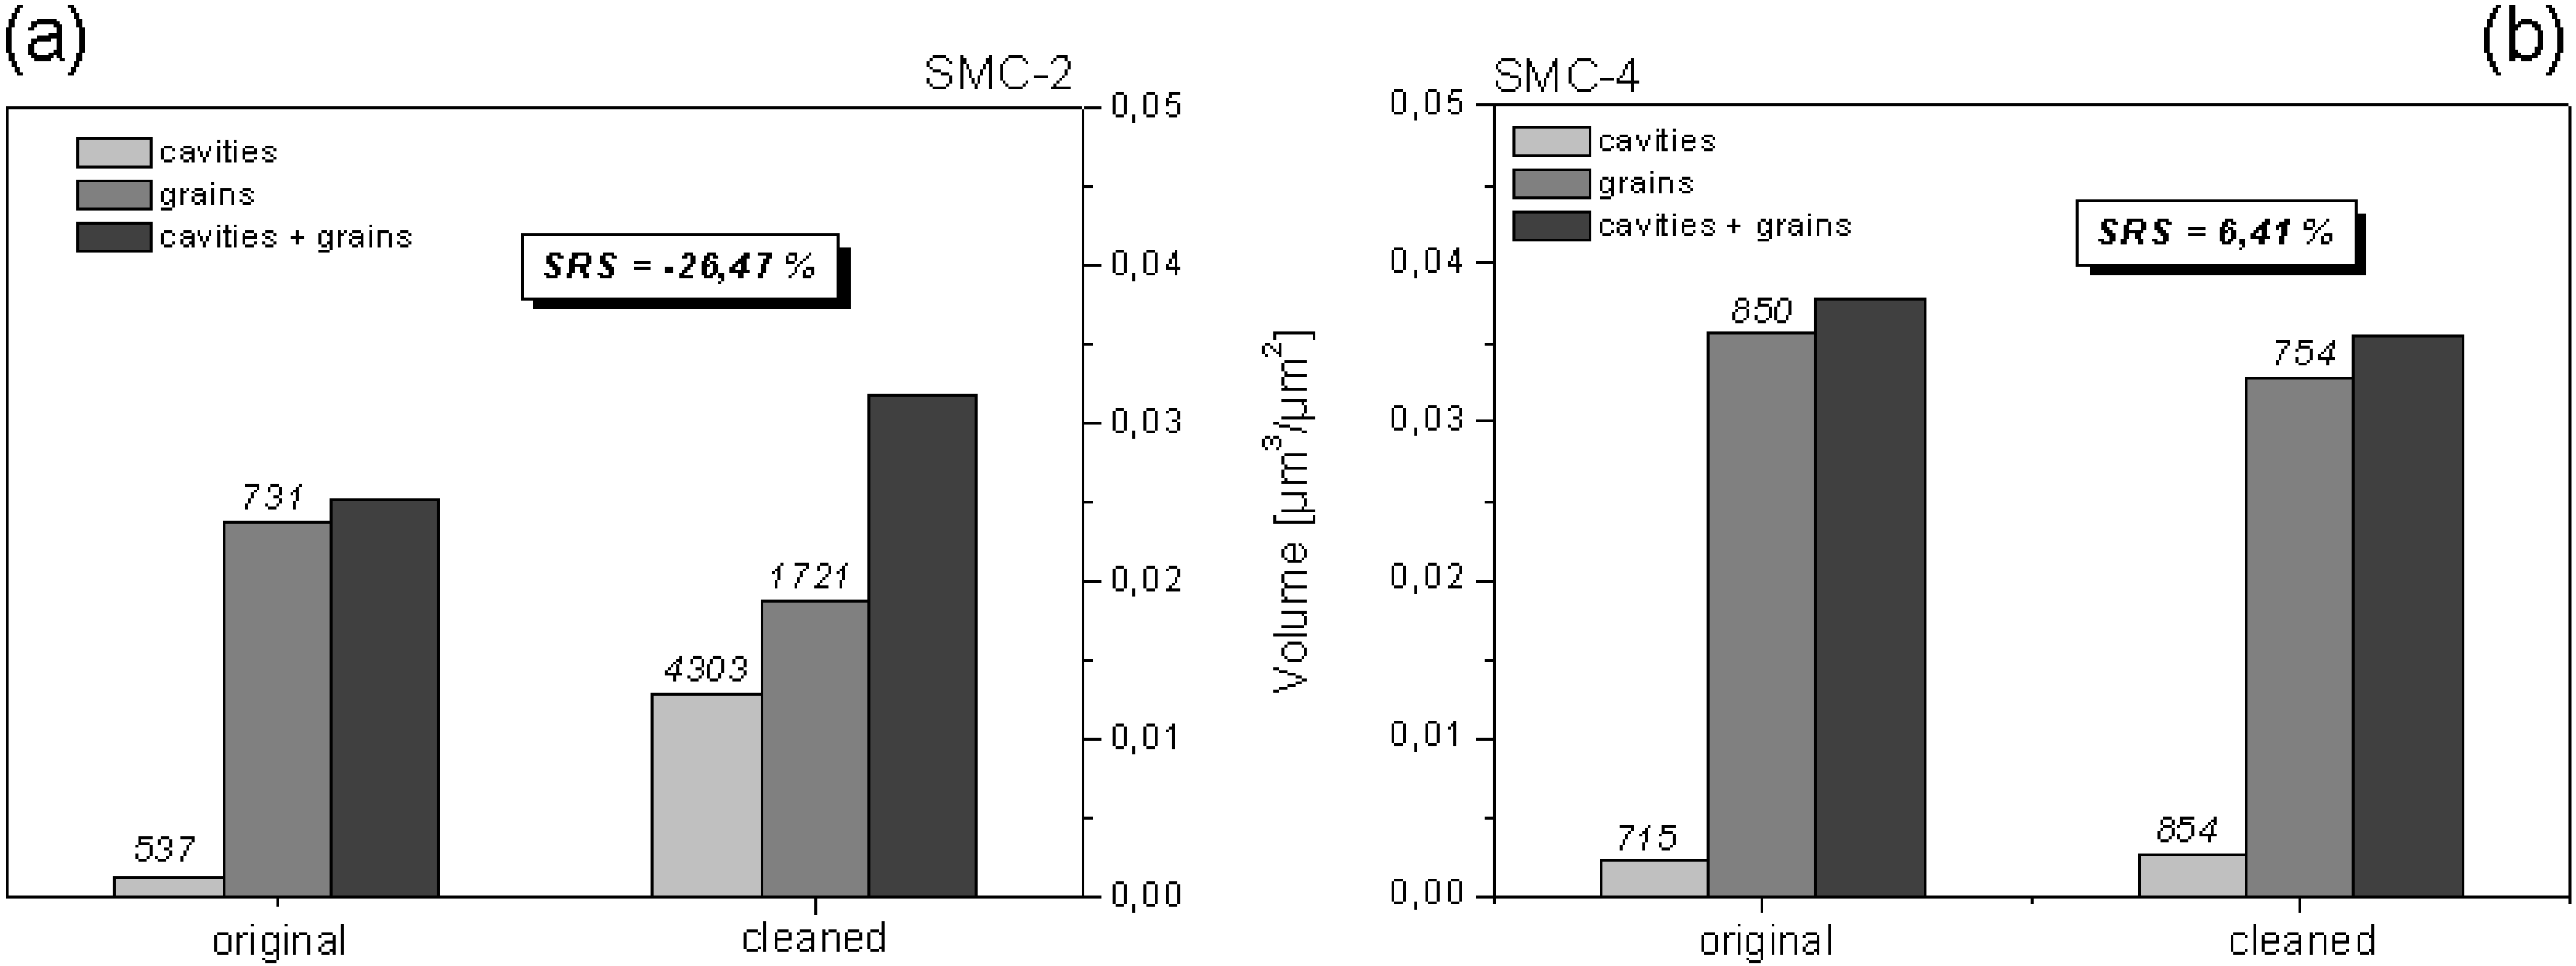
Figure 12 shows the values before and after a surface treatment of a fixed area of 30.6 mm
2.
In the case of SMC-2 (
Figure 12a), results of the volumetric characterization indicate that solvent mixture removes monomer residues from deeper points, resulting in more and larger cavities. For the same reason, solvents increase the number of grains while friction during mechanical cleaning reduces their total volume by wear. The effect of solvents prevail on the effect of mechanical wear resulting in a more rugose surface (SRS = –26.47%). On the contrary, SMC-4 is more resistant to solvents as can be seen in
Figure 12b. During treatment, mechanical wear removes grains in number and volume, leading to a smoother surface (SRS = 6.41%).
Figure 11.
Modification of a SMC surface by cleaning with benzene-ethanol. Both profiles correspond to the same coordinates.
Figure 11.
Modification of a SMC surface by cleaning with benzene-ethanol. Both profiles correspond to the same coordinates.
Figure 12.
Complete characterization and comparison of modification by cleaning with benzene-ethanol between SMC-2 and SCM-4 surfaces. Evaluated area was 30.6 mm2. γ = 1 µm. Values above bars denote cavities and grains counted.
Figure 12.
Complete characterization and comparison of modification by cleaning with benzene-ethanol between SMC-2 and SCM-4 surfaces. Evaluated area was 30.6 mm2. γ = 1 µm. Values above bars denote cavities and grains counted.
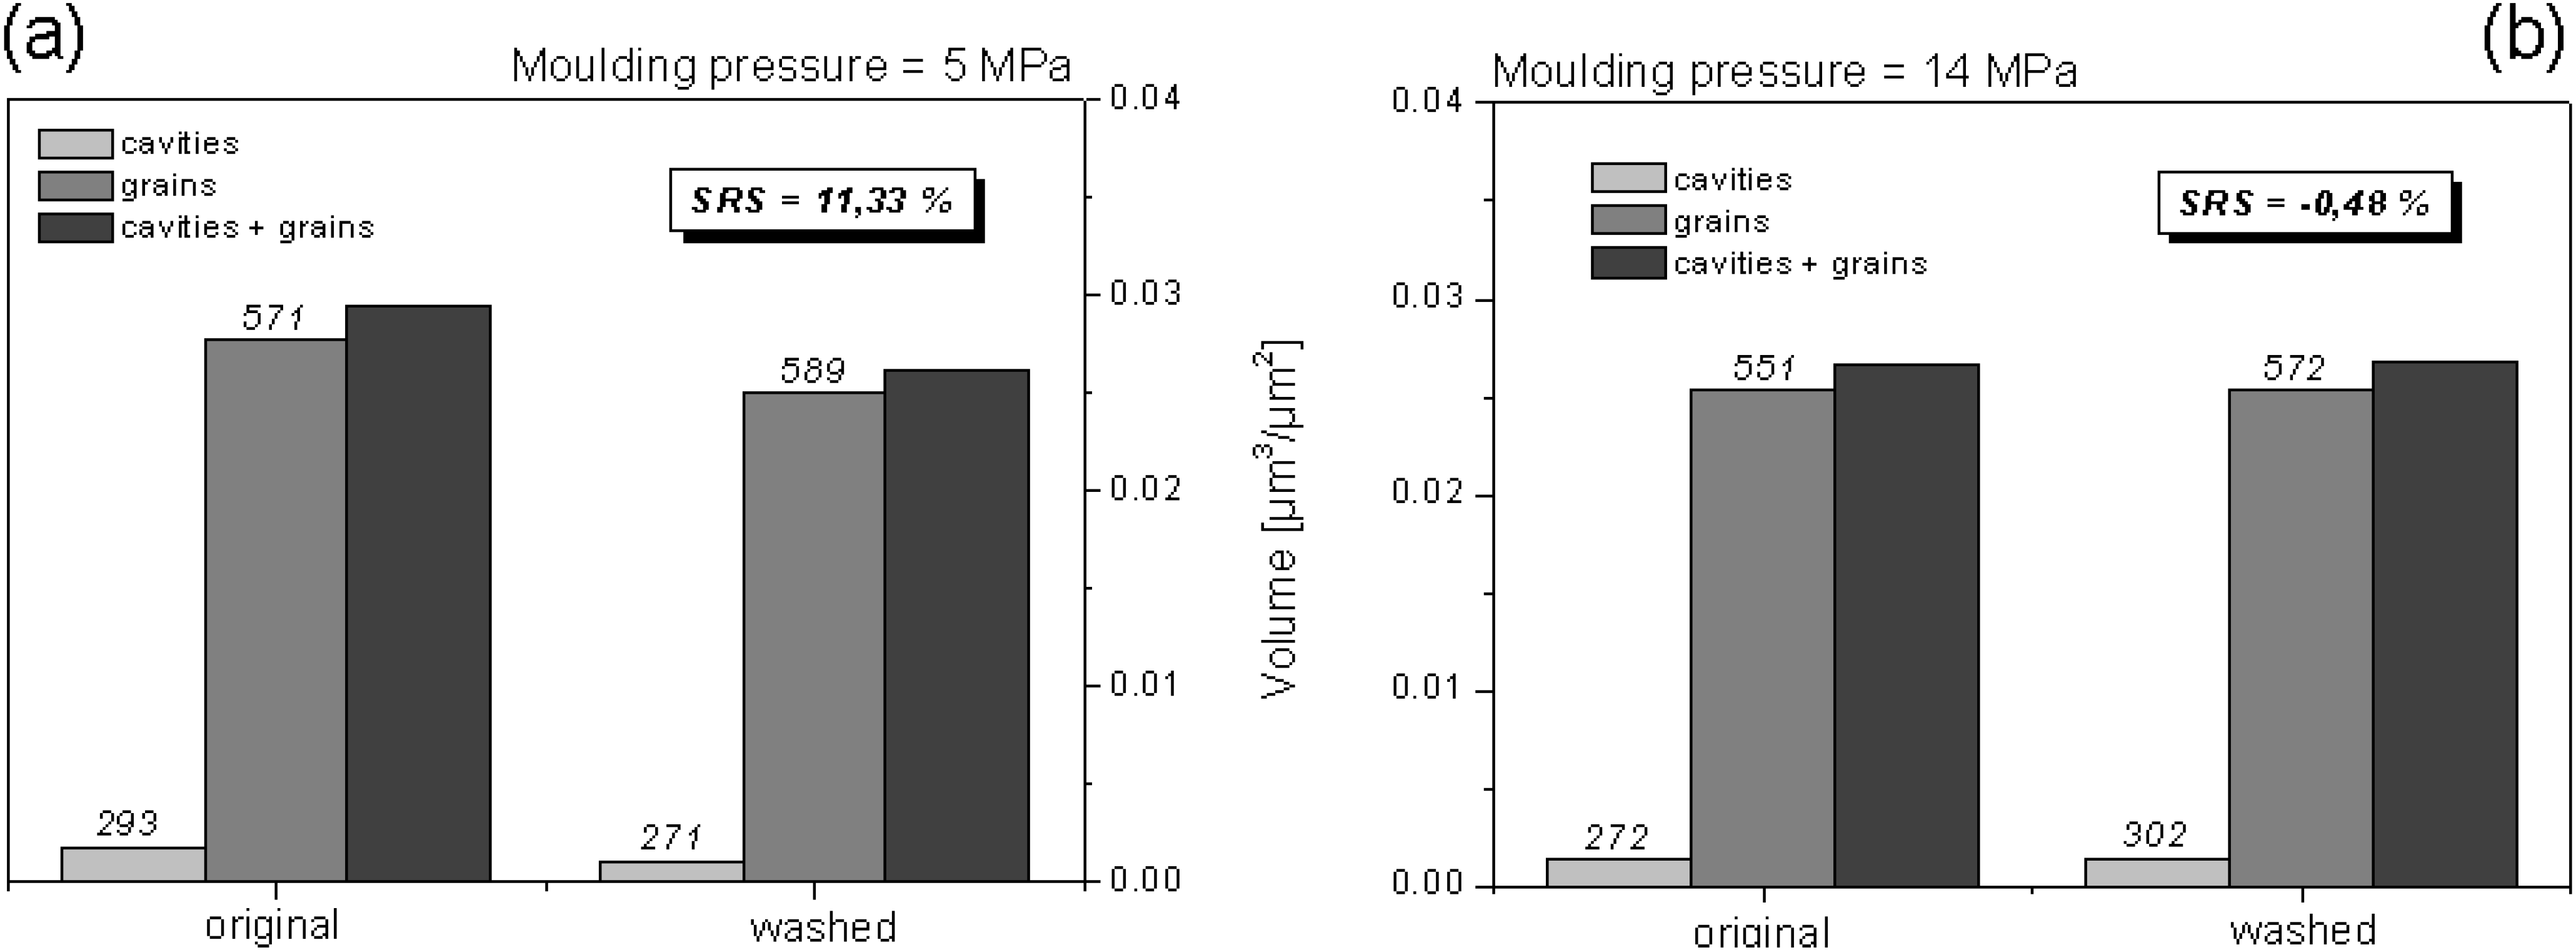
The effect of molding conditions on the quality of a surface could be characterized by SRS.
Figure 13 shows the volumetrical characterization of a SMC-2 sample produced by 5 MPa and 14 MPa of molding pressure after treatment by powerwash (water pressure washing, 50 °C, 3 bar, 2 min, 1% ESKAPHOR N 6502). According to these results, SMC-2 molded under higher pressure (14 MPa) (
Figure 13b) seems to be more resistant to powerwash treatment, because almost no change in SRS value was observed (SRS = −0.48%).
Figure 13.
Complete characterization and comparison of a modification by powerwash. Both surfaces were molded for 160 s, but under two different pressures. Evaluated area was 36 mm2. γ = 1 µm. Values above bars denote cavities and grains counted.
Figure 13.
Complete characterization and comparison of a modification by powerwash. Both surfaces were molded for 160 s, but under two different pressures. Evaluated area was 36 mm2. γ = 1 µm. Values above bars denote cavities and grains counted.
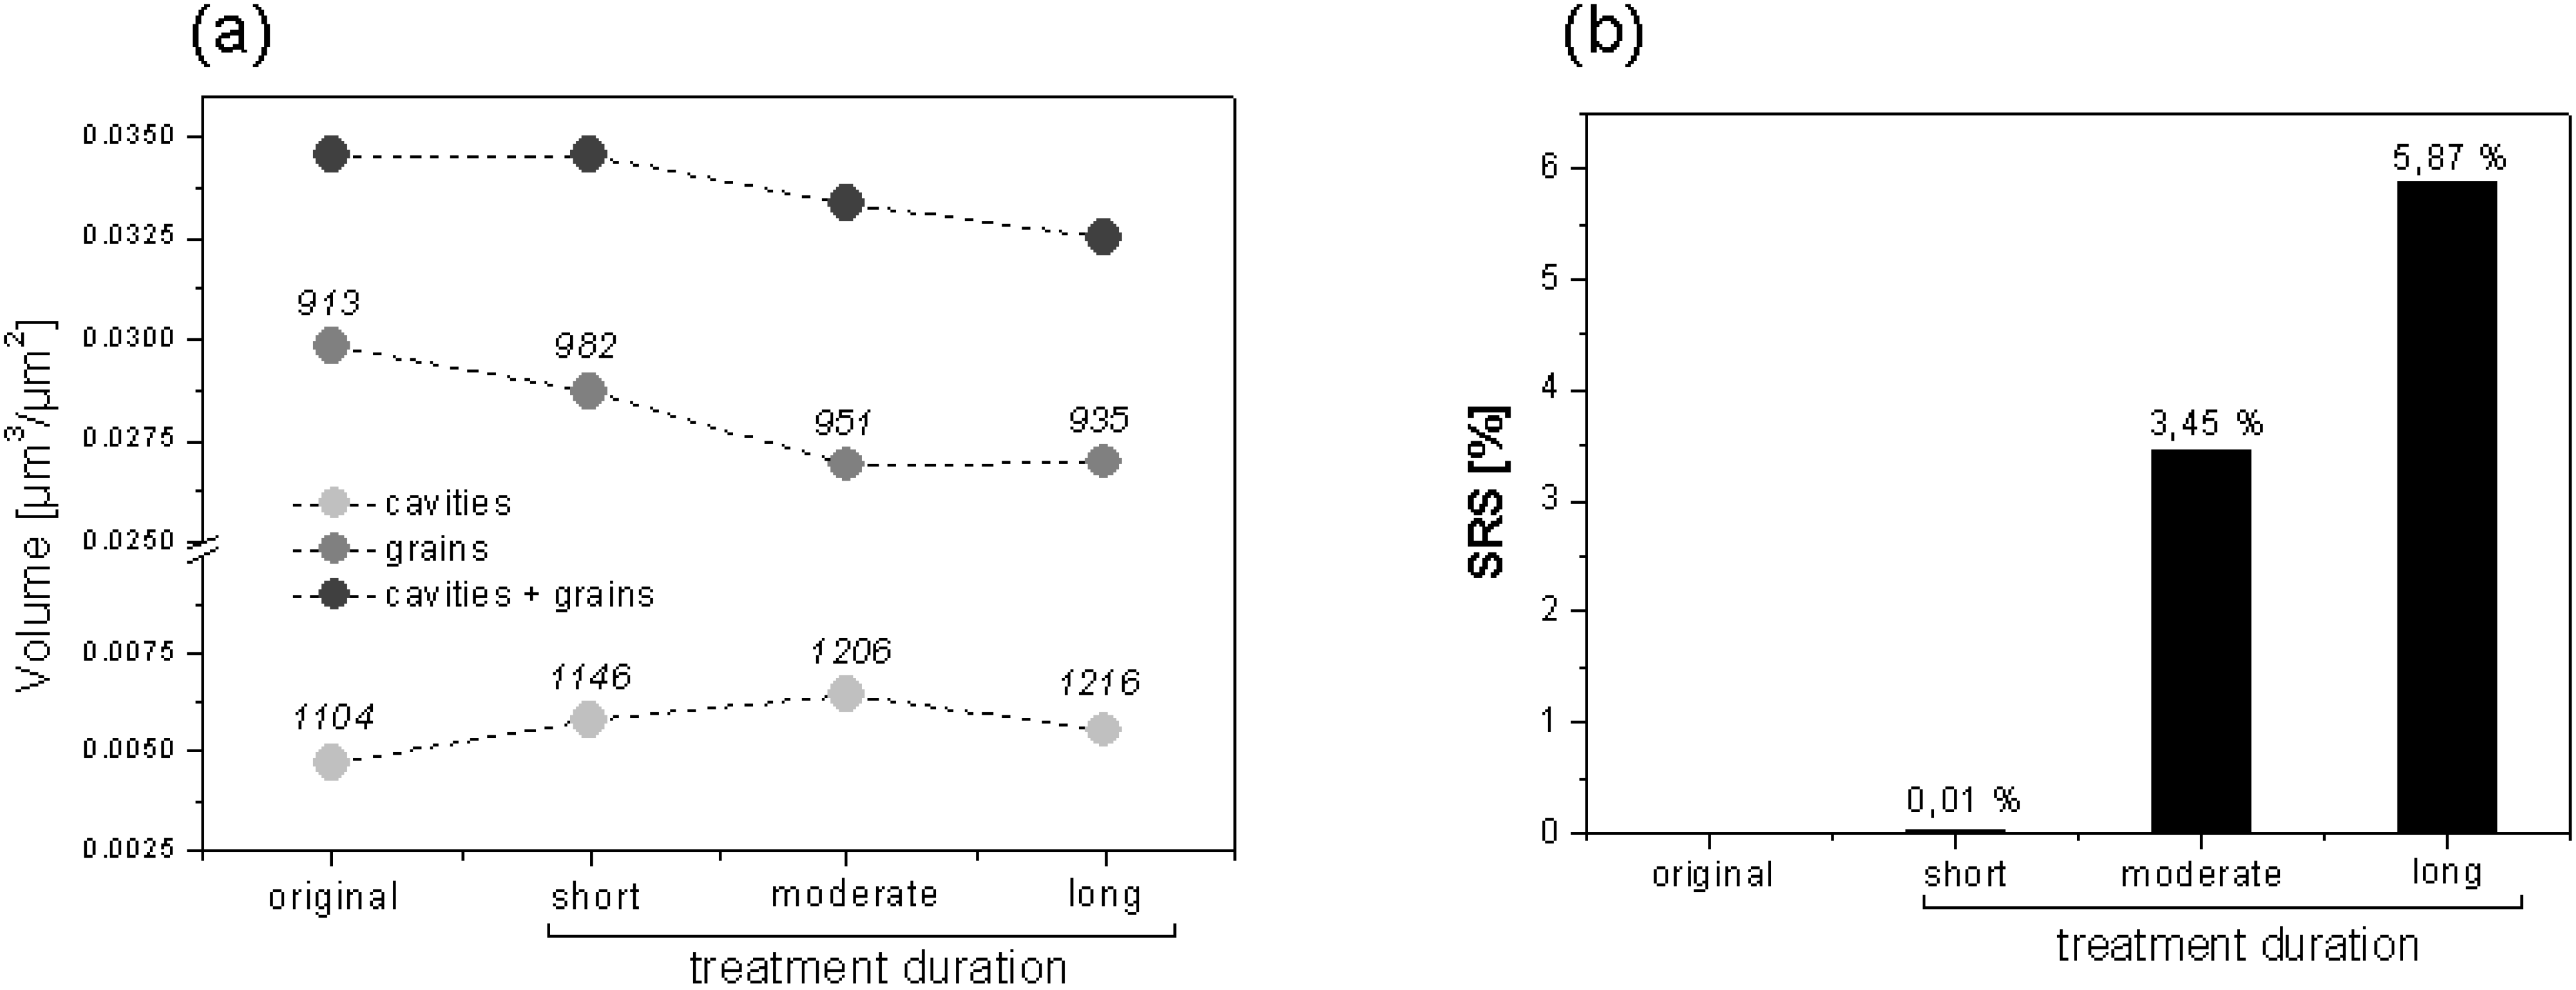
Figure 14.
Sequential smoothing by CO2 pressure applied on a SMC-4 surface molded for 160 s at 5 MPa.
Figure 14.
Sequential smoothing by CO2 pressure applied on a SMC-4 surface molded for 160 s at 5 MPa.
Besides the use of SRS values to compare the behavior of different surfaces under defined type of treatment, the parameter can be used to compare the effectiveness of different treatments on a defined surface.
Figure 14 shows the effect of different treatment intensities (by quantifying treatment duration) of the same CO
2 pressure (2 bar) applied over SMC-4 surfaces previous molded for 160 s under 5 MPa of pressure. The results indicate that the treatment improves smoothing of the surface depending on its duration. CO
2 pressure increases the number of cavities and its volume, but at the same time compresses the grains volume, which controls the smoothing of the surface. Values of cavity and grain volumes after long-term treatment do not follow the same behavior because the mean height position is modified to a lower plane after two sequential treatments. However, the total volume (cavities and grains) describes volumetrical changes occurred.
SRS values should be always accompanied by cavities and grains count information in order to suitably evaluate the topographical changes produced by the modification.
Table 1.
Traditional topographic characterization using Ra compared with SRS method.
Table 1.
Traditional topographic characterization using Ra compared with SRS method.
| Treatment | Process | Surface | Conditions | Rai | Raf | Raf−Rai | SRS |
| μm |
| cleaning | Benzene-Ethanol | SMC-2 | cloth | 0.736 | 0.852 | 0.1160 | −26.47% |
| SMC-4 | 0.737 | 0.735 | −0.0020 | 6.41% |
| washing | Power-wash | SMC-2 | 5 MPa | 0.728 | 0.728 | 0.0000 | 11.33% |
| 14 MPa | 0.725 | 0.730 | 0.0050 | −0.48% |
| cleaning | CO2 pressure | SMC-4 | No treatment | 0.808 | - | - | - |
| | | | short | 0.808 | 0.869 | 0.0610 | 0.01% |
| middle | 0.808 | 0.863 | 0.0550 | 3.45% |
| long | 0.808 | 0.823 | 0.0150 | 5.87% |


