
Fatigue Properties of Methacrylic Adhesive Plexus MA300


Abstract
1. Introduction
2. Materials and Methods
2.1. Materials
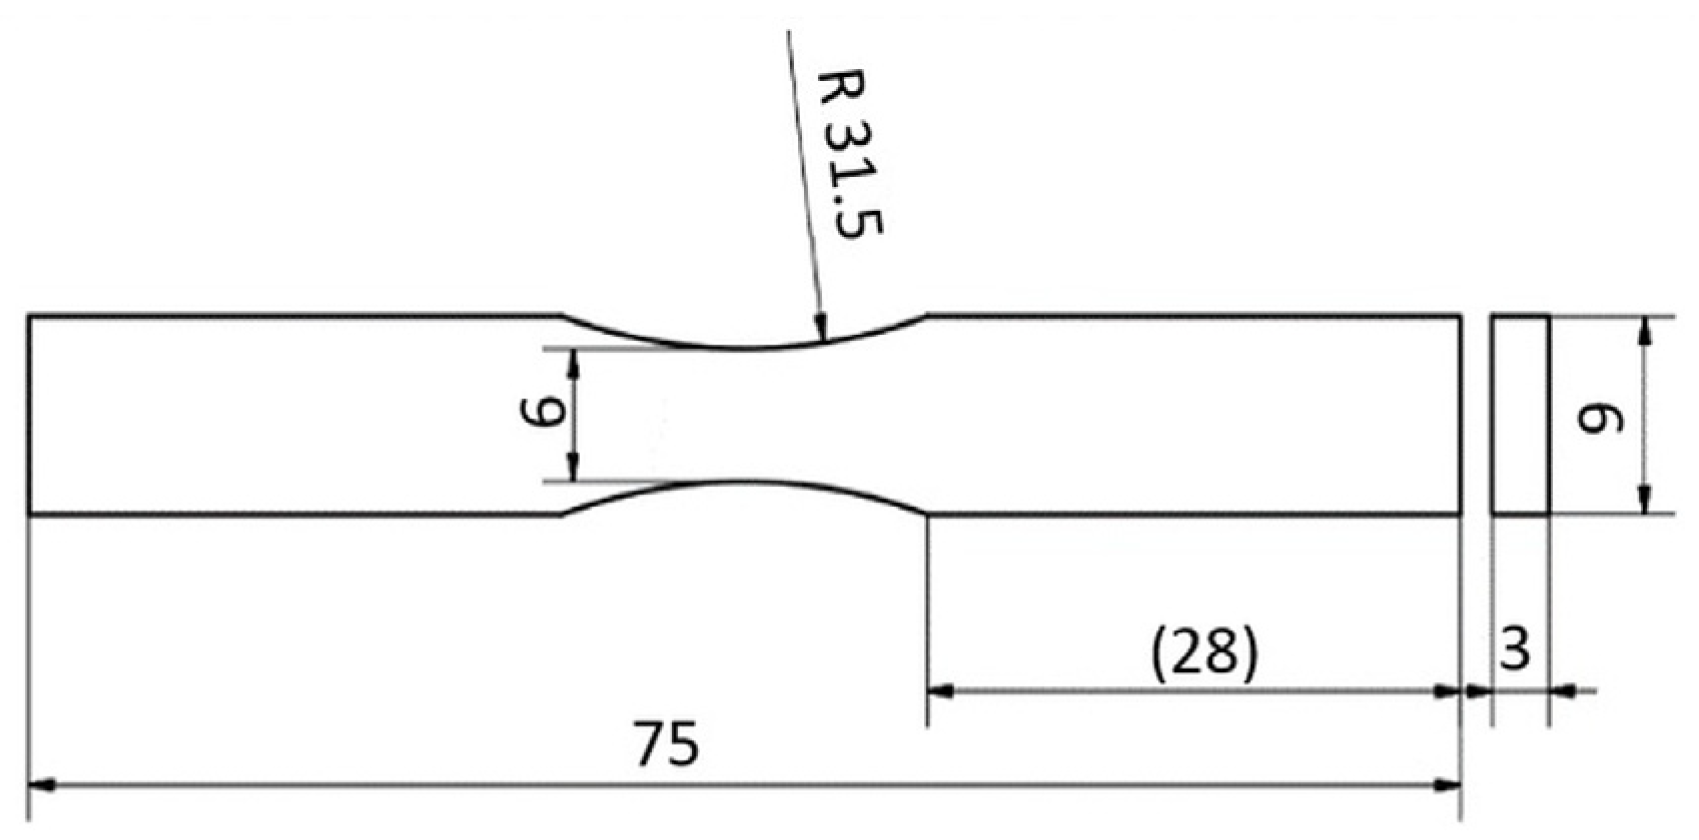
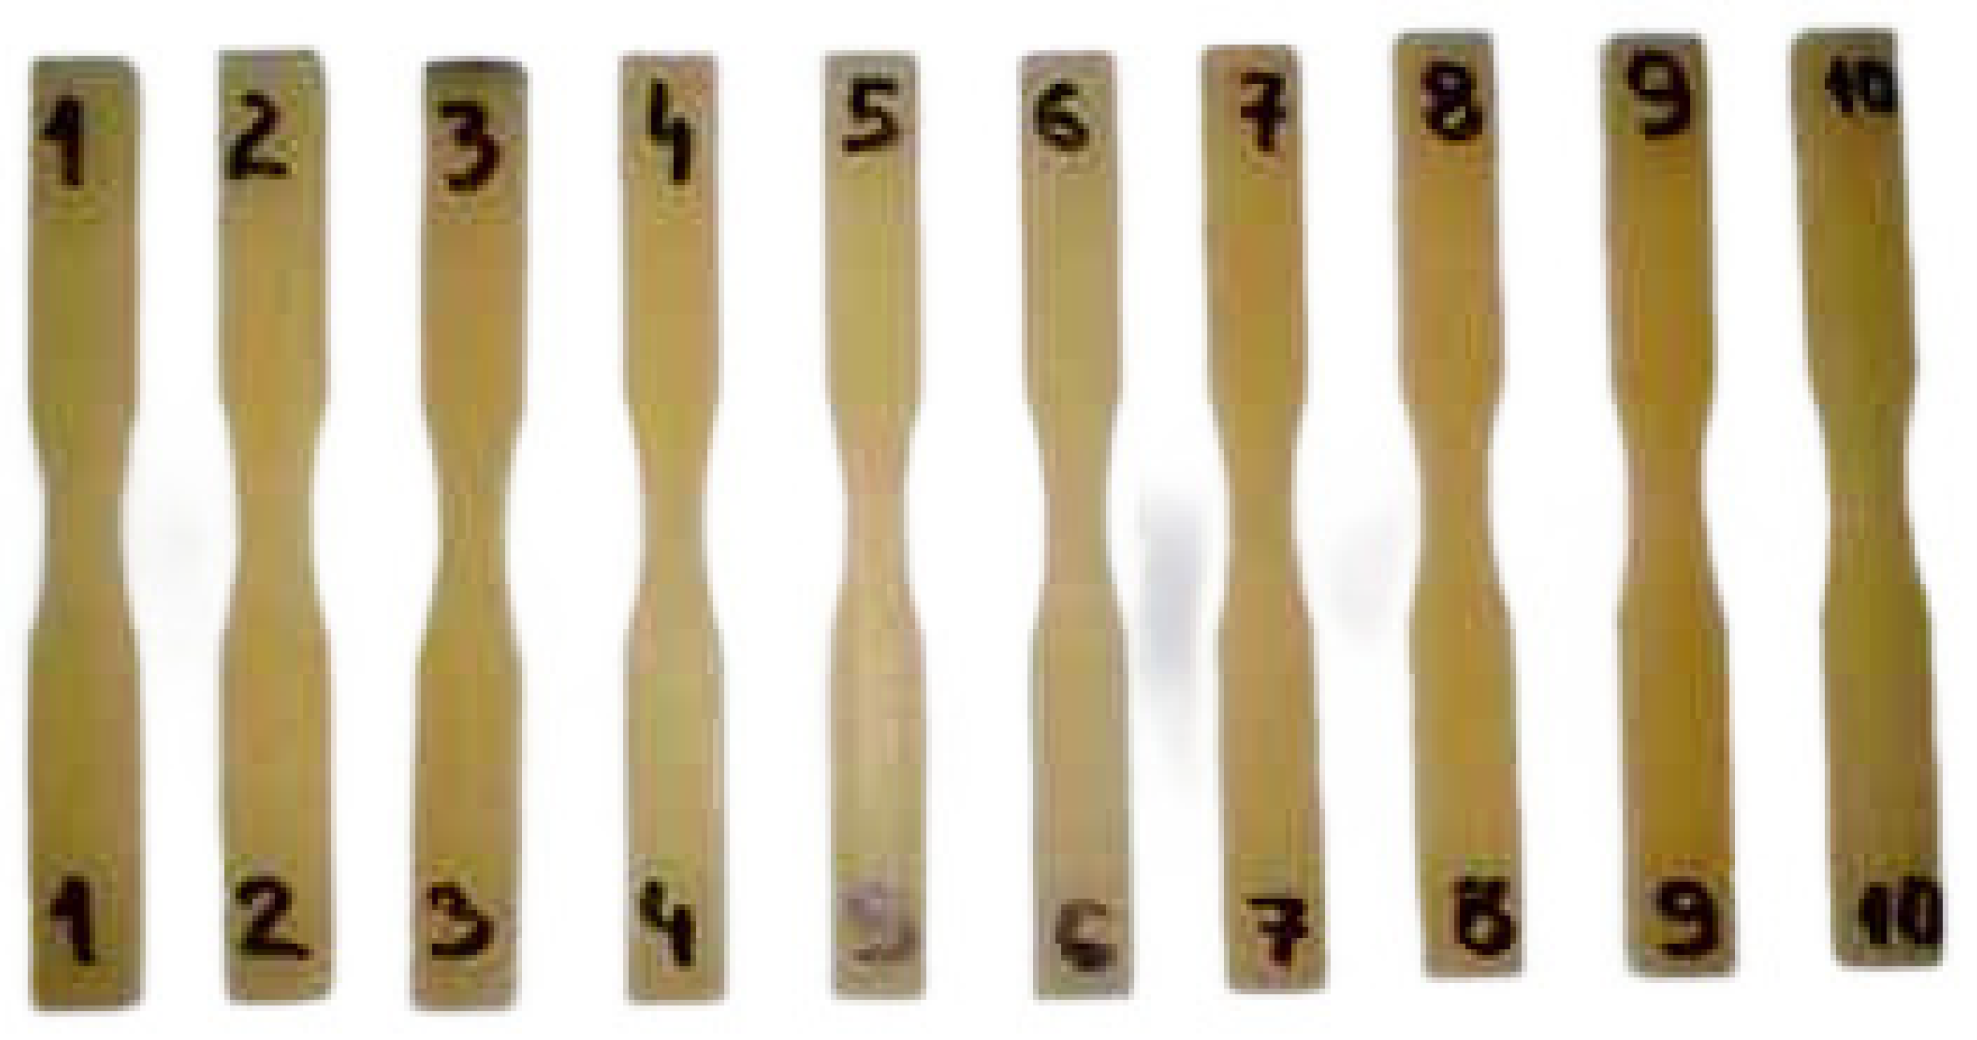
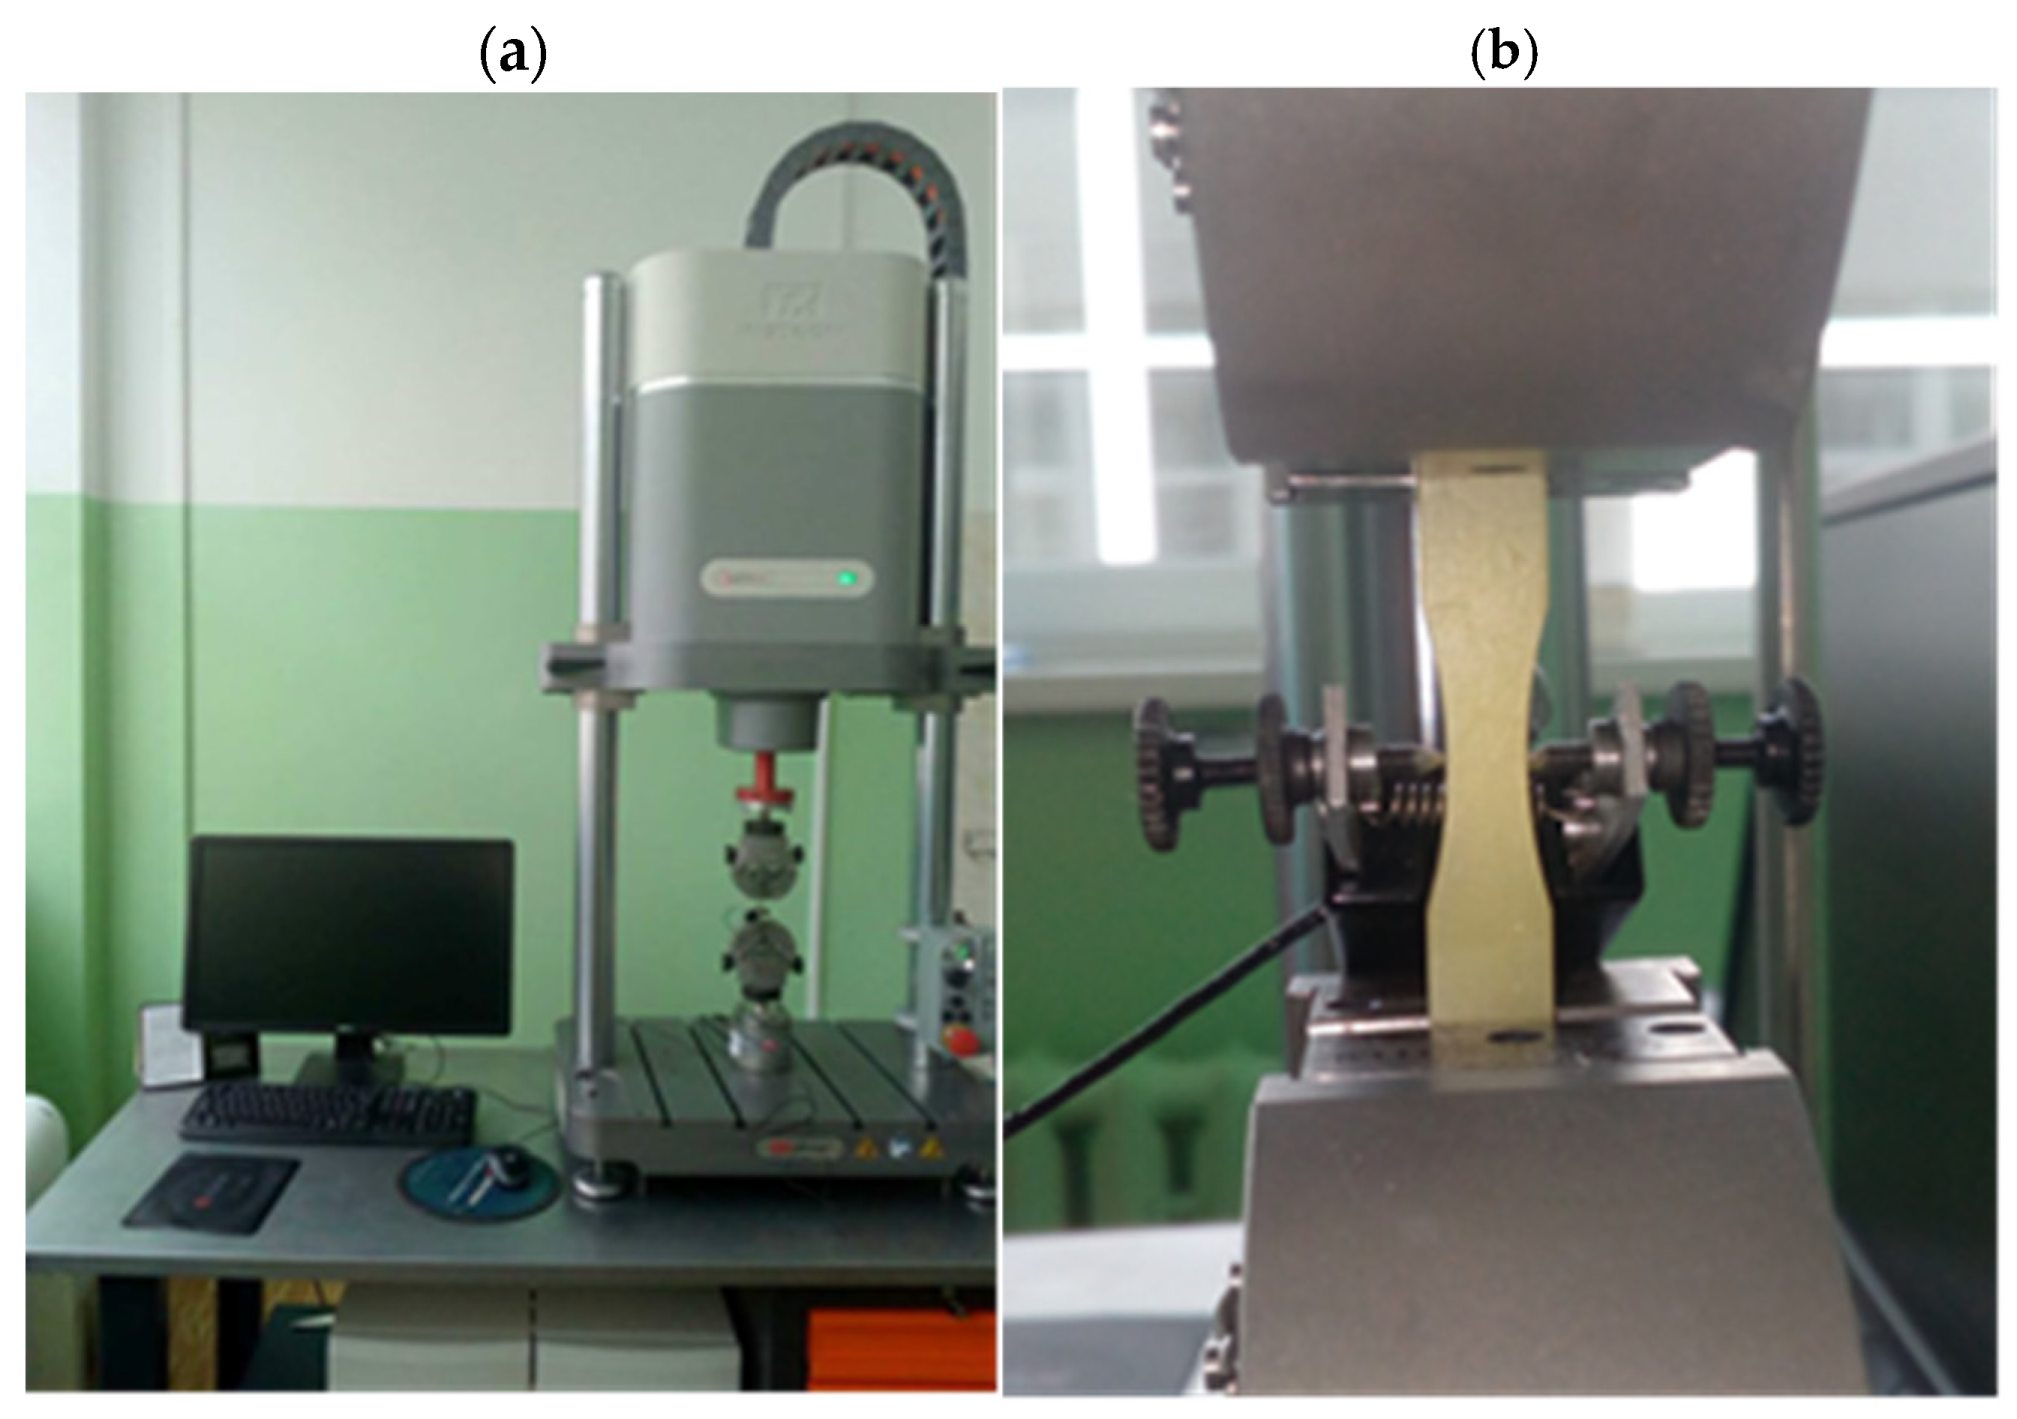
2.2. Methods
- σu—tensile strength;
- X—percentage value.
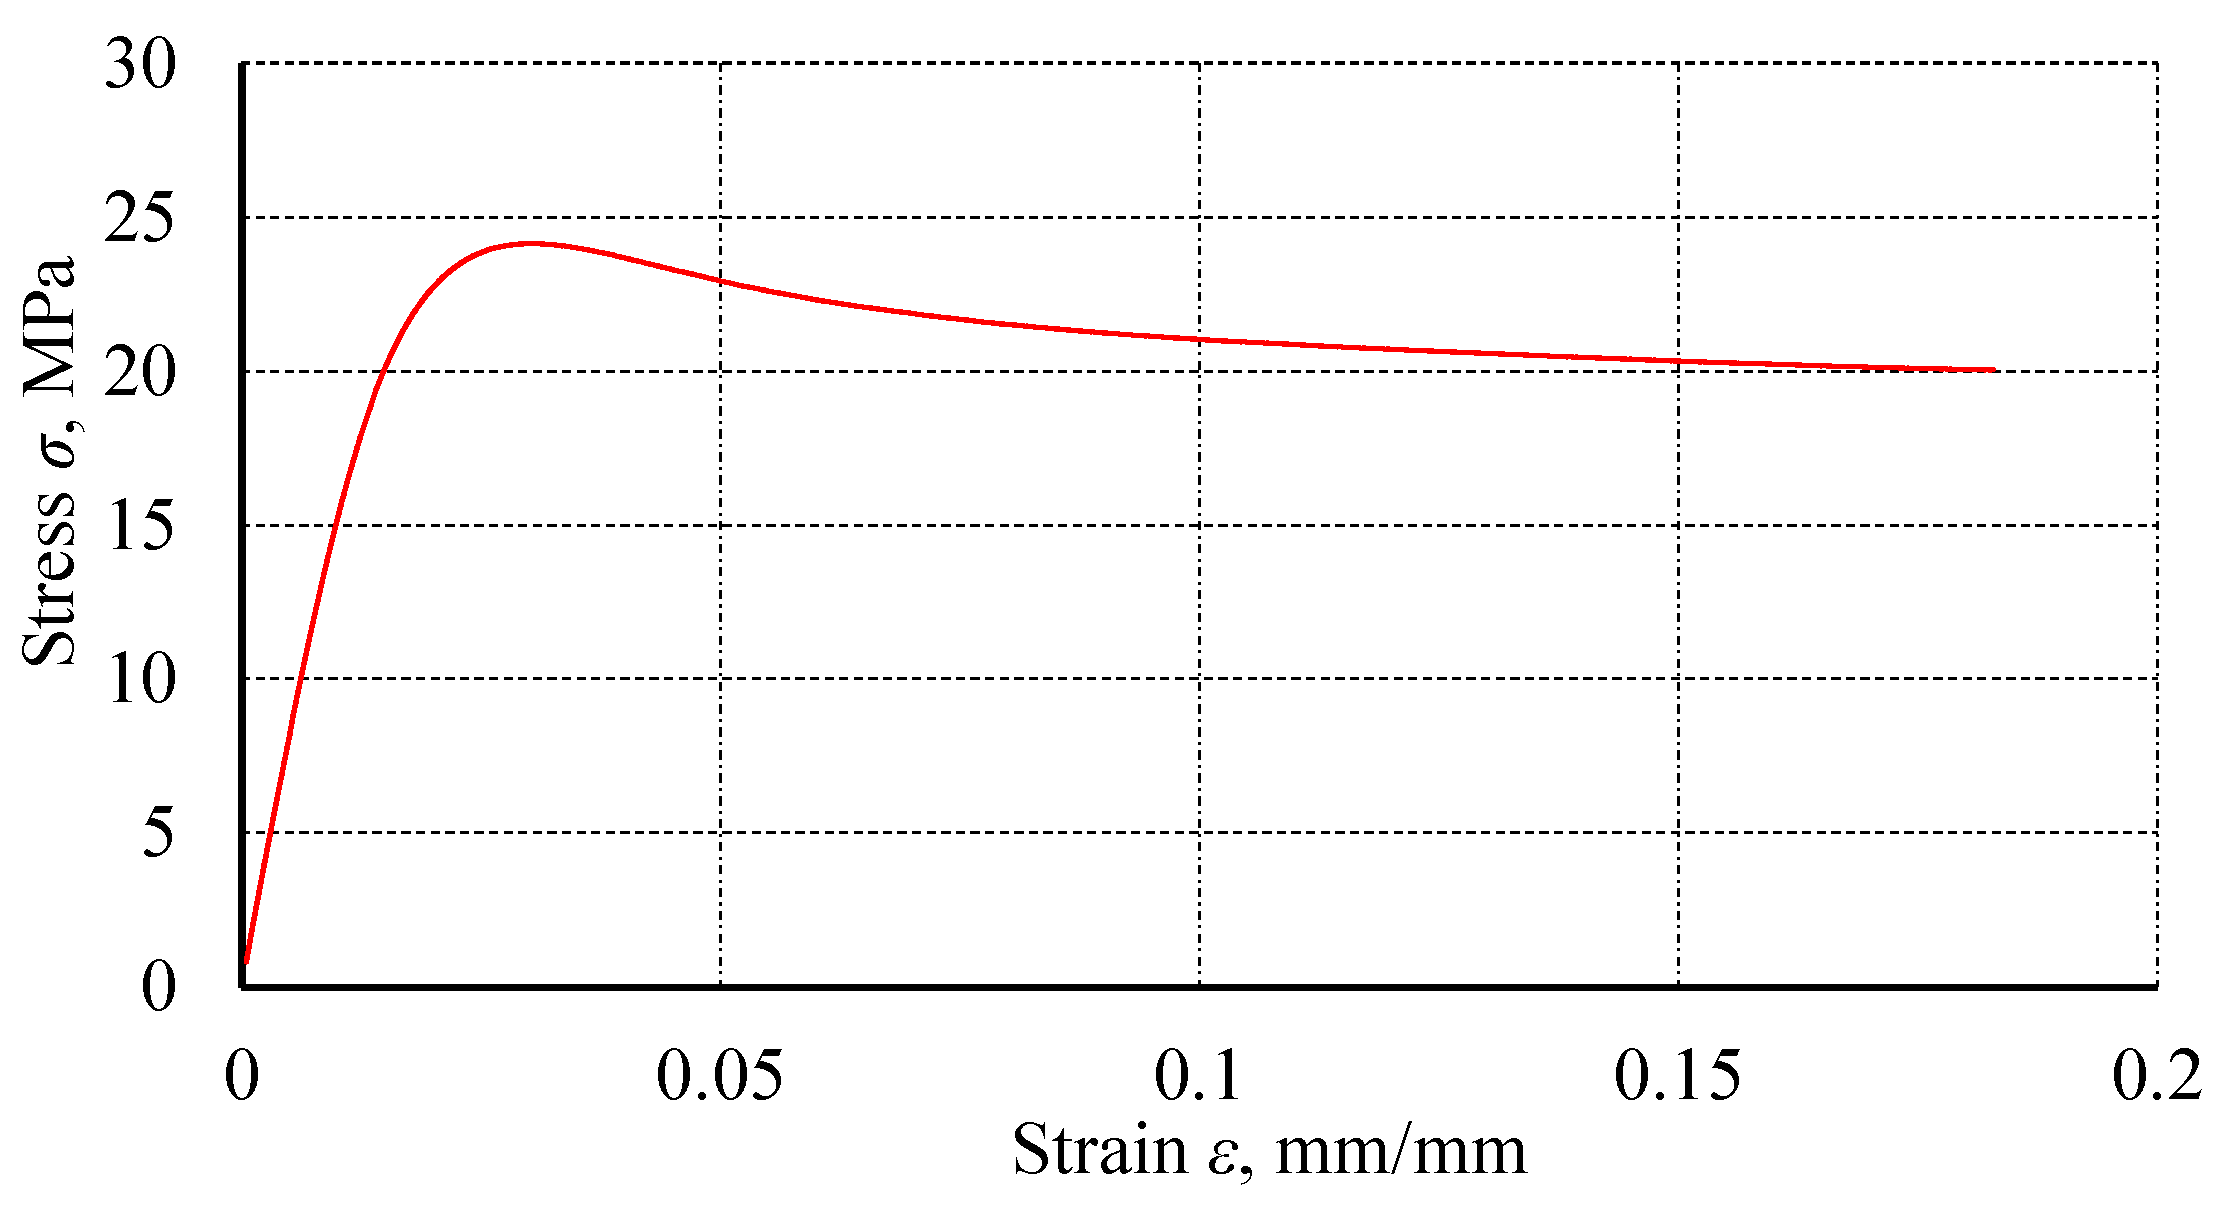
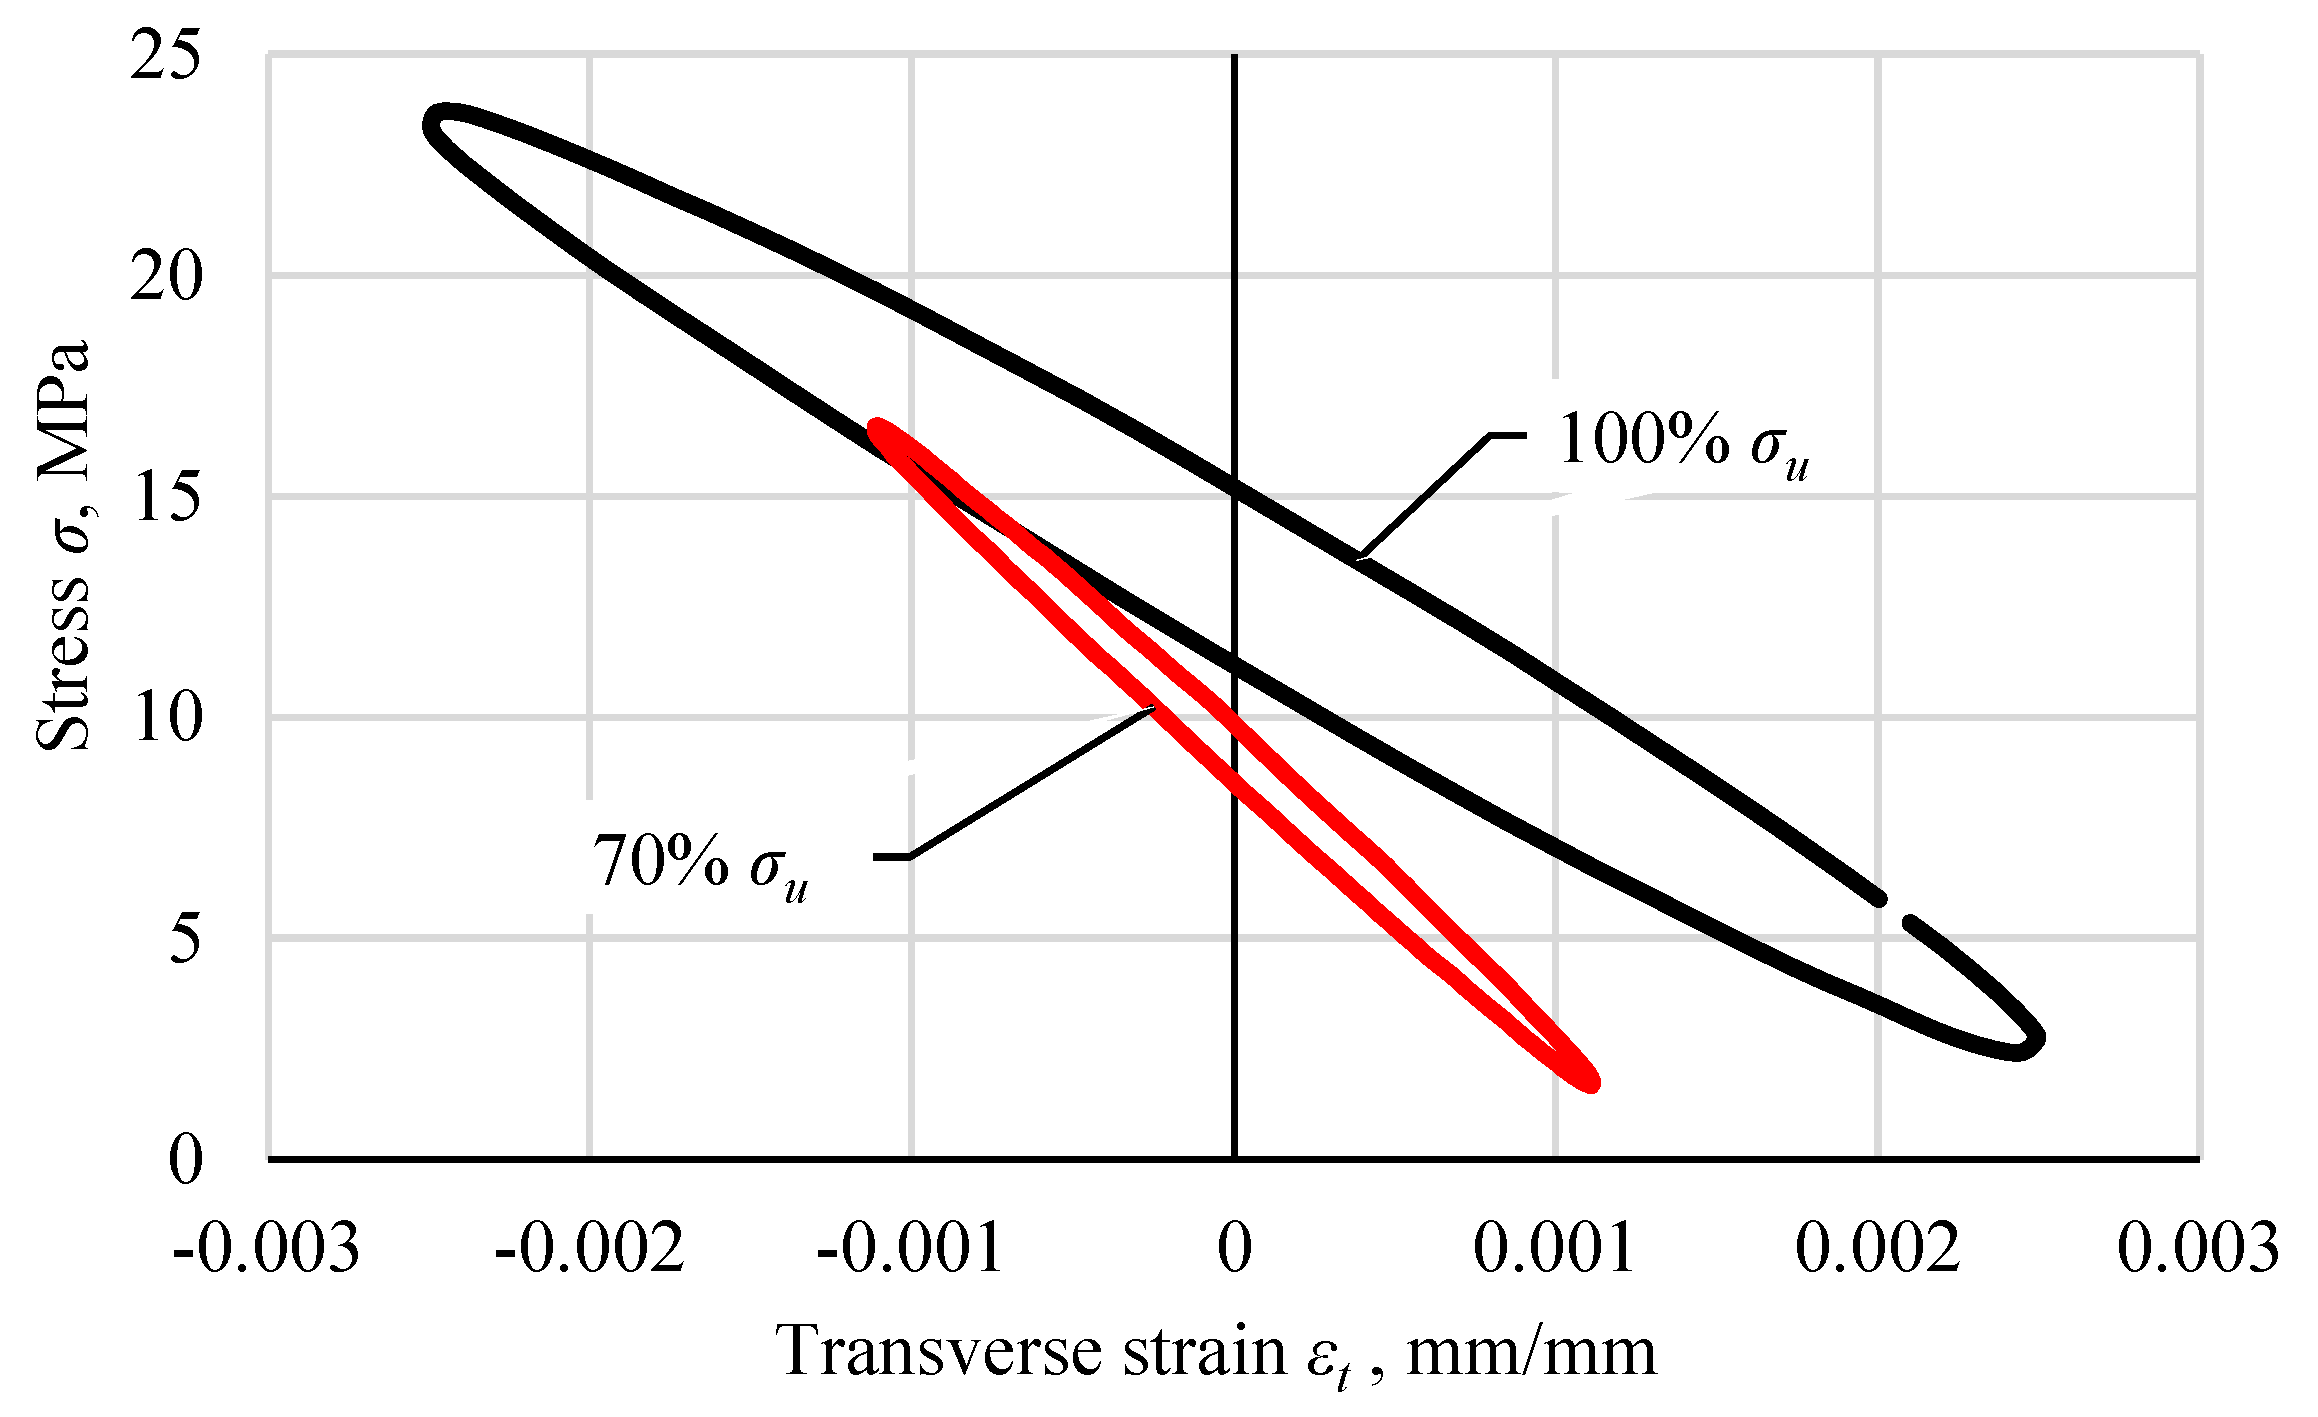
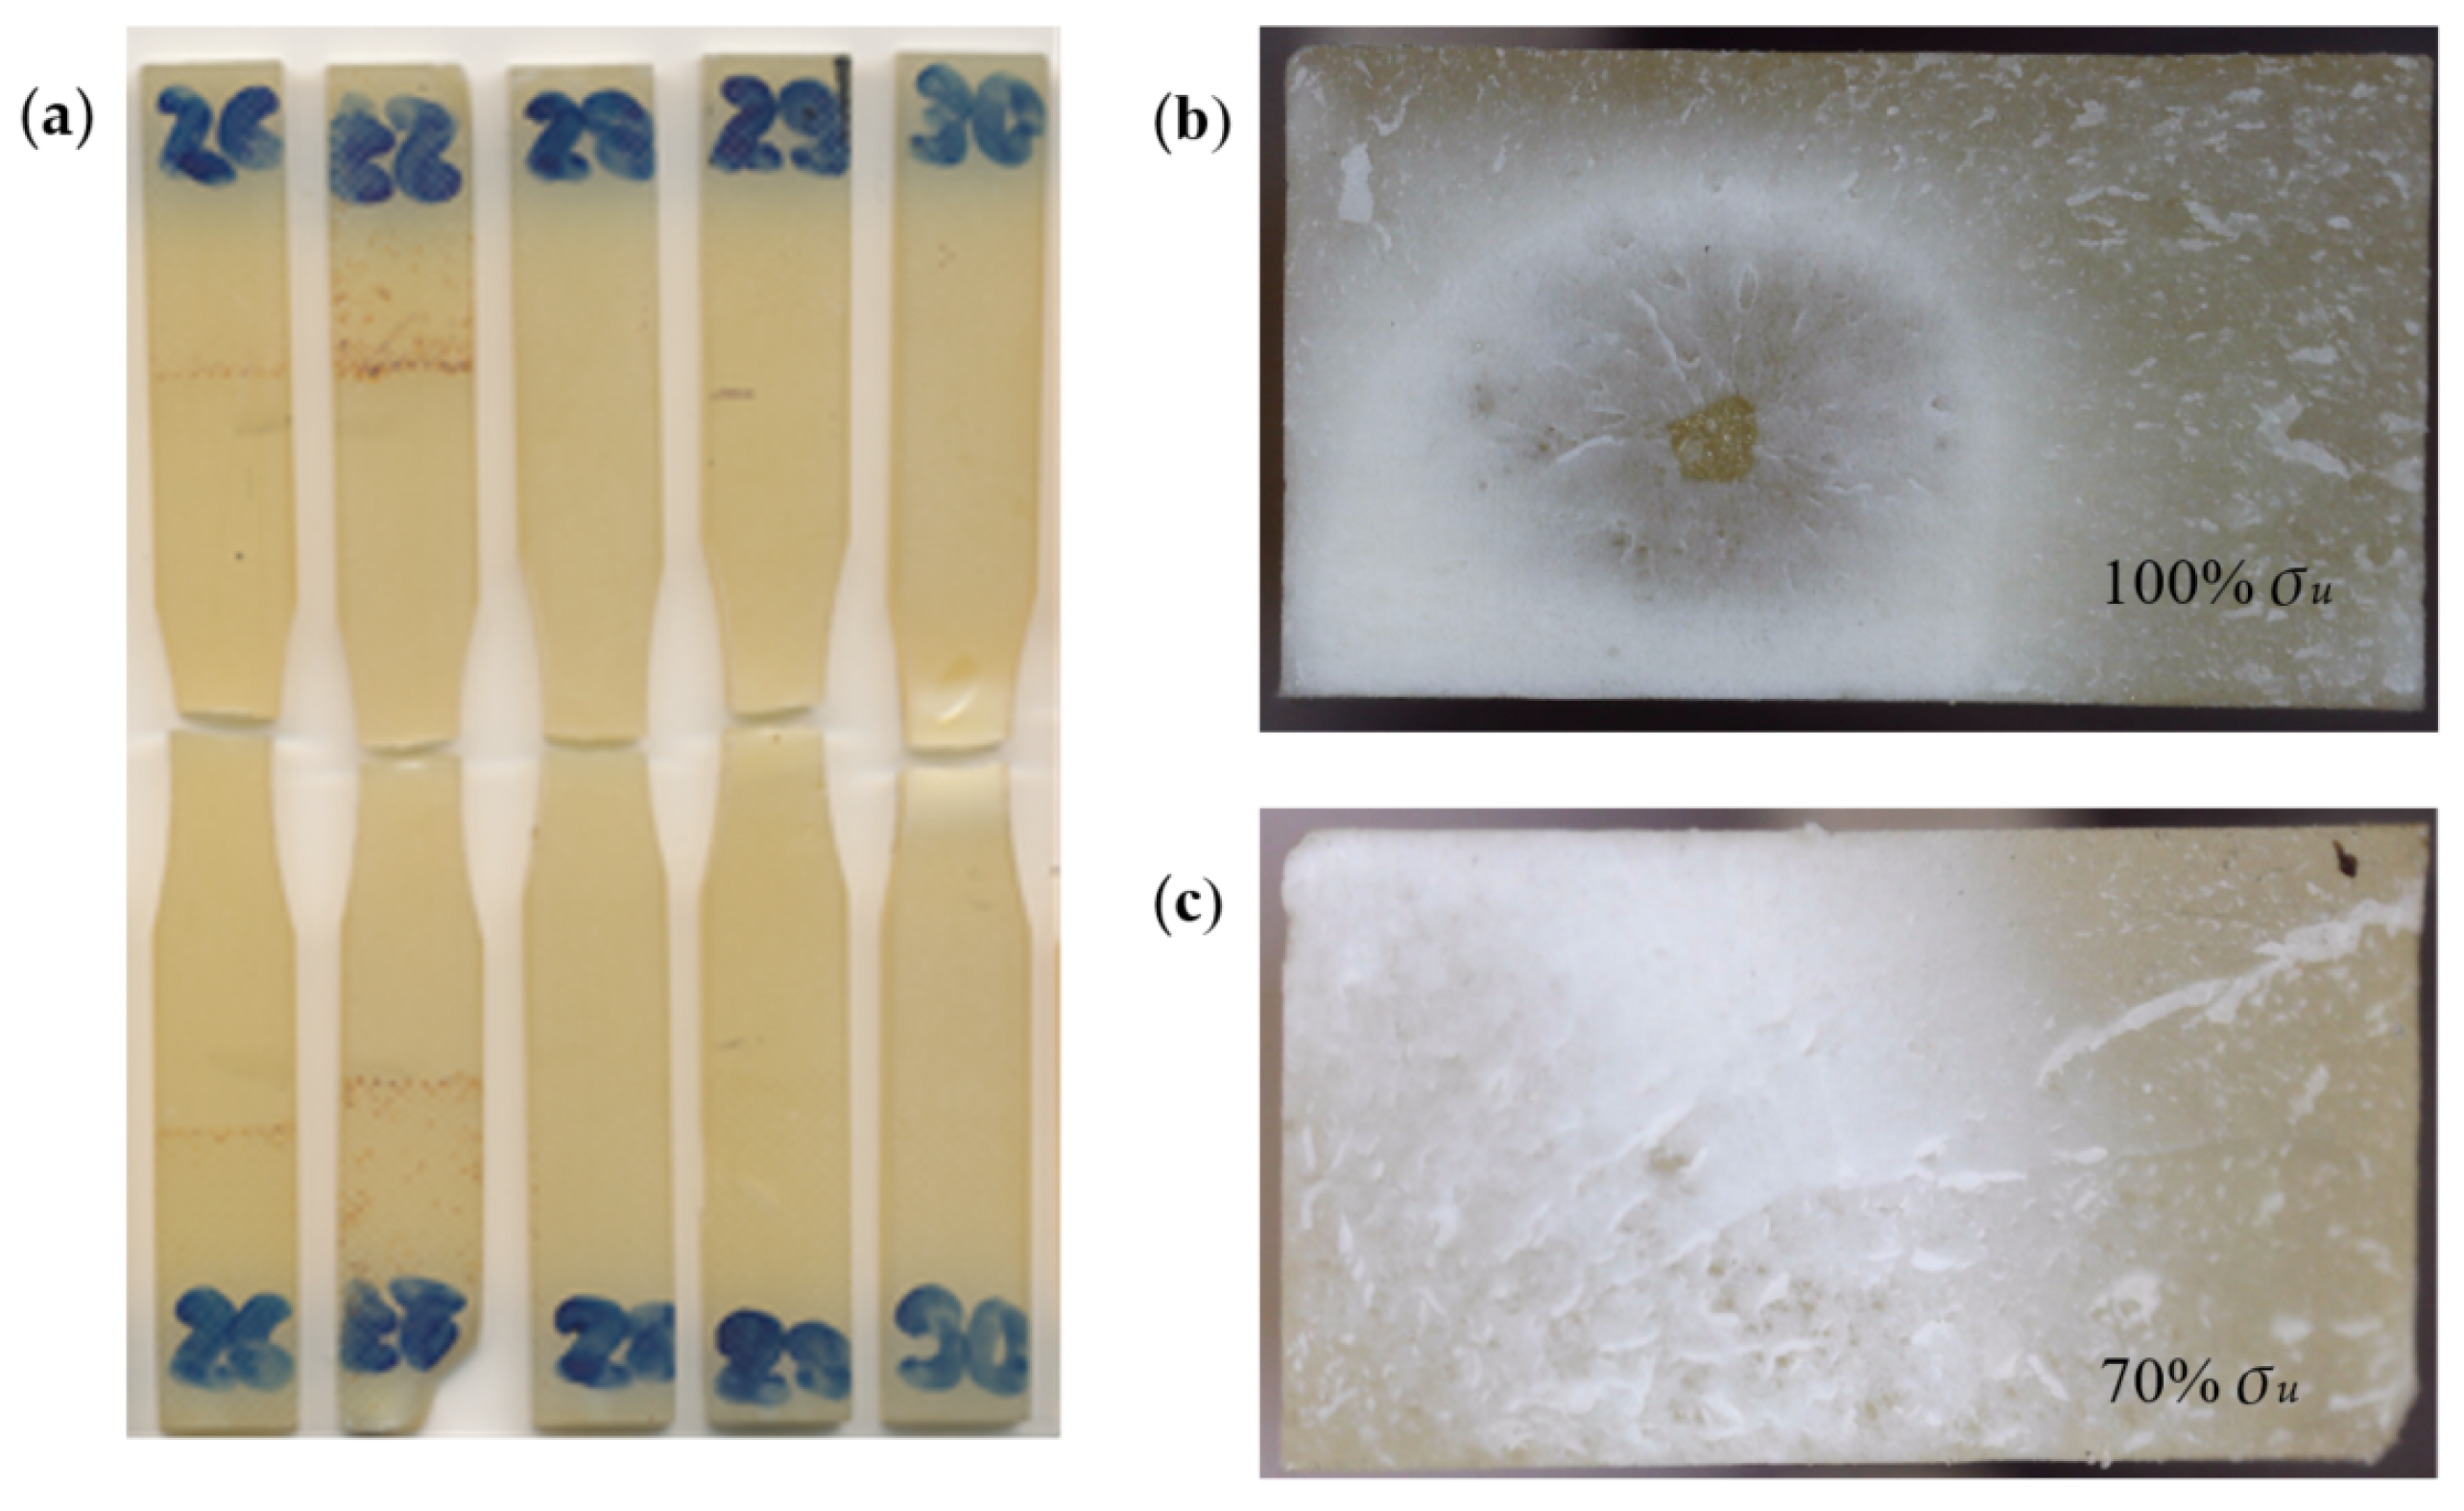
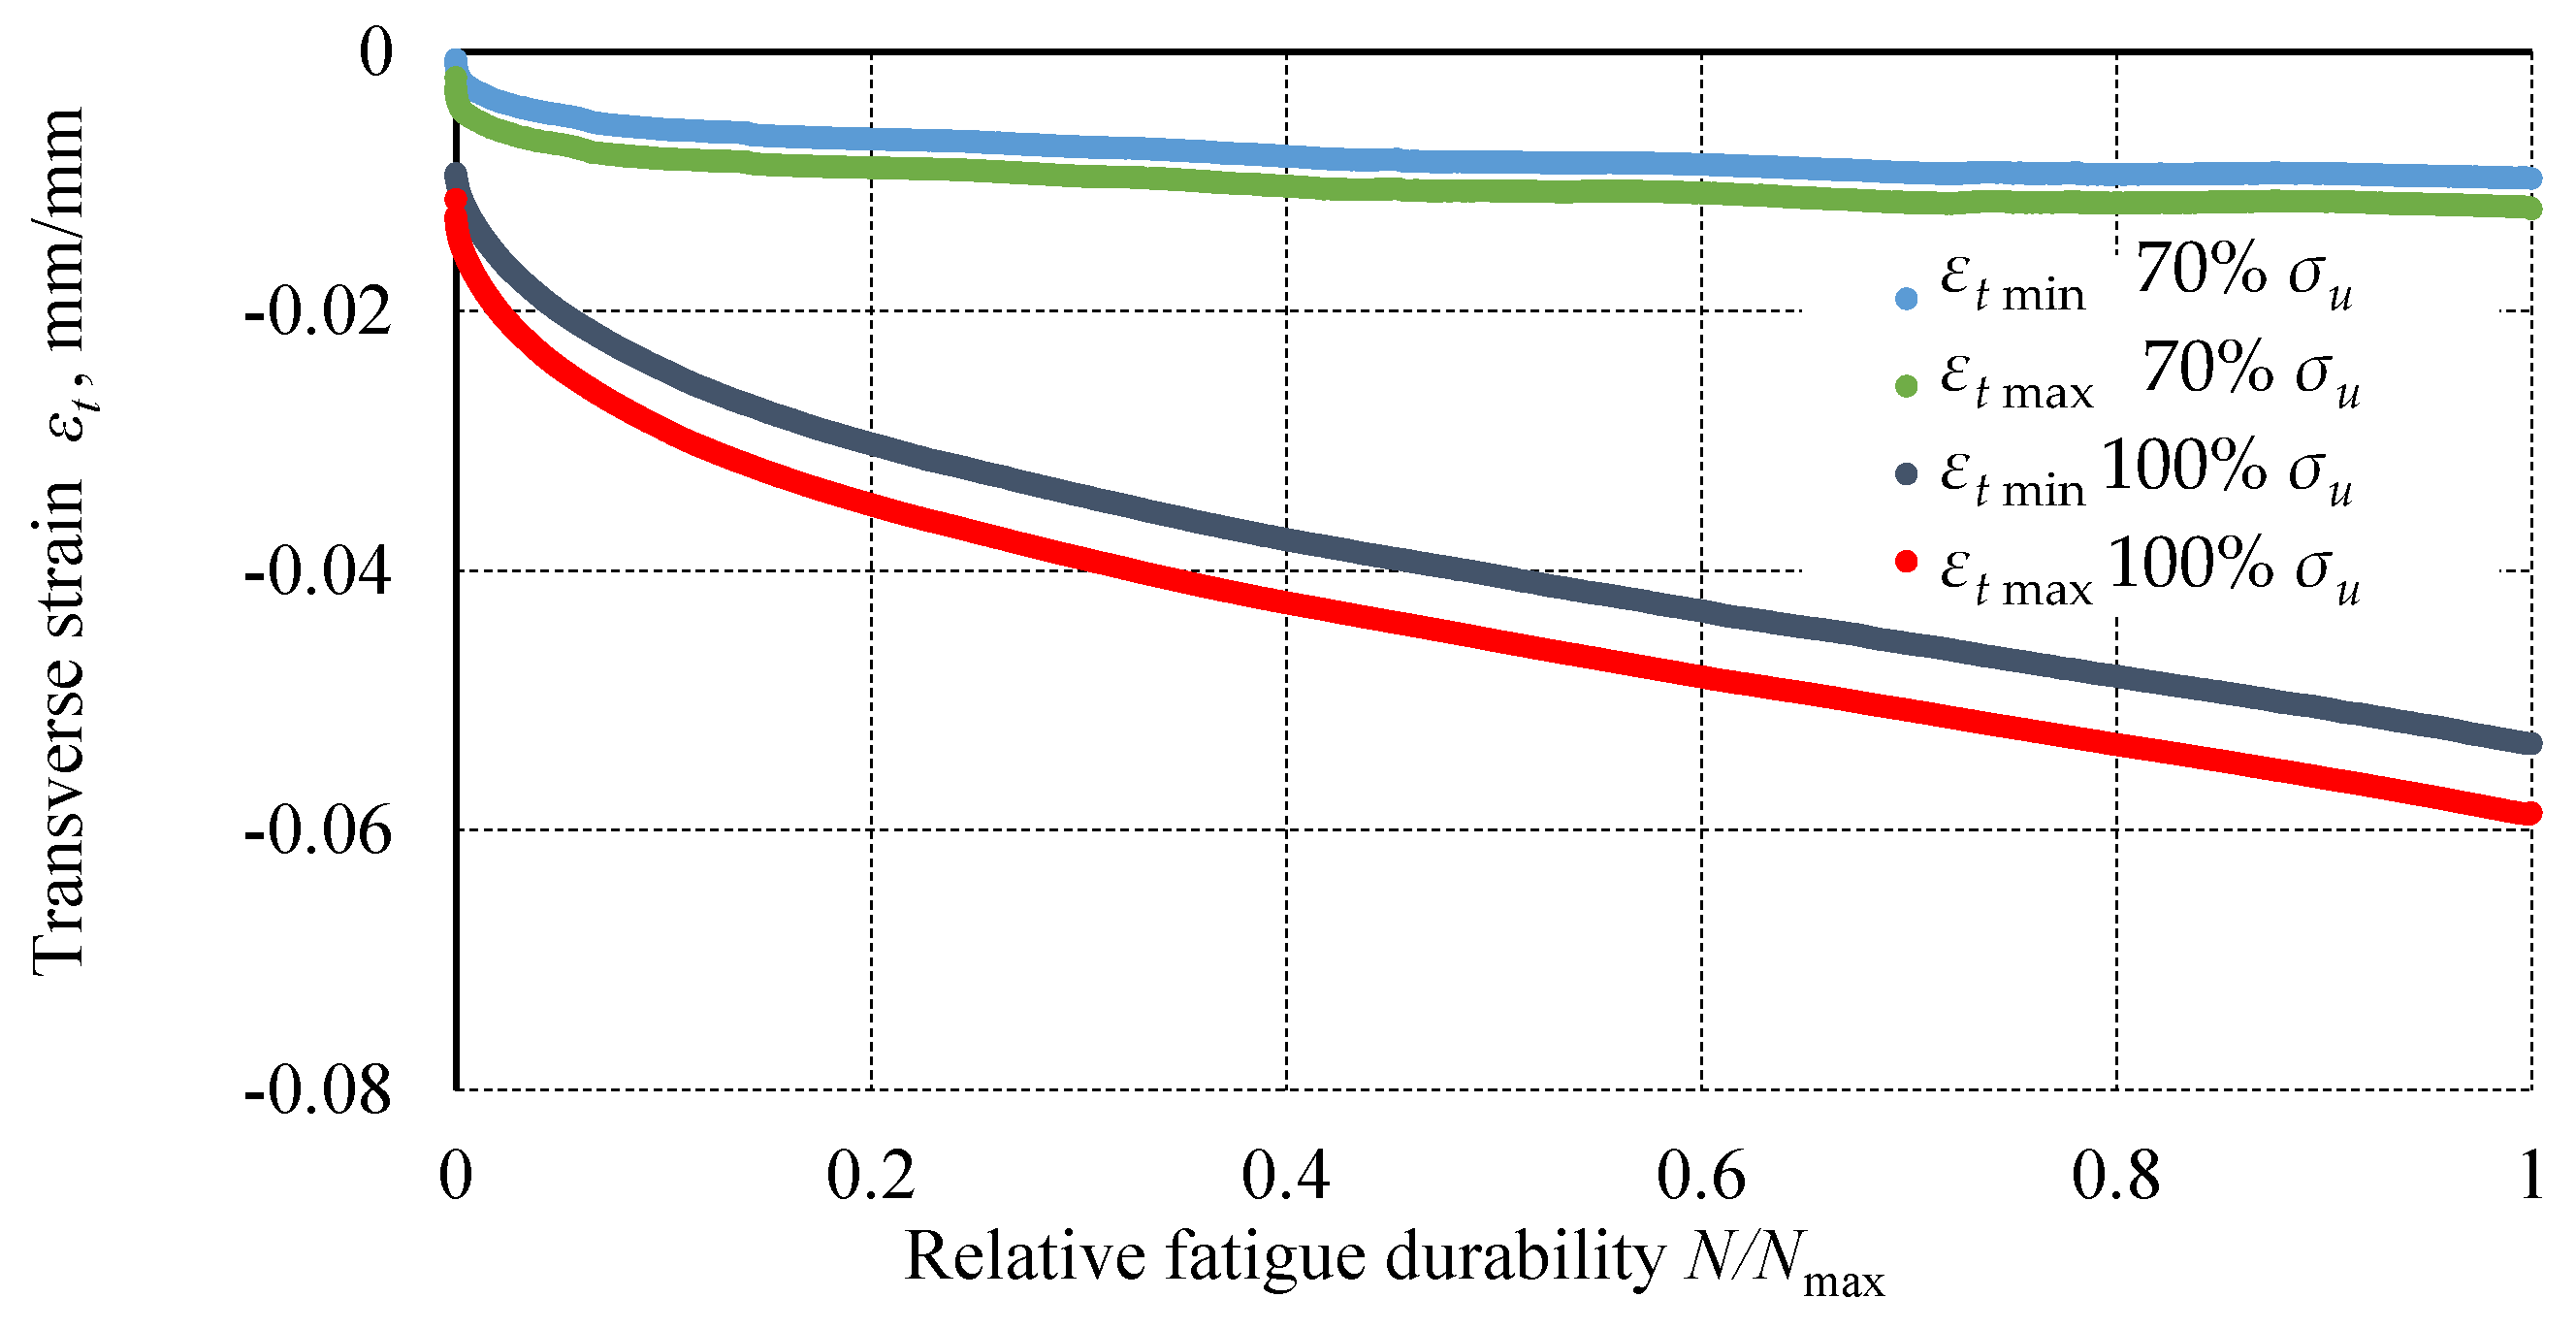
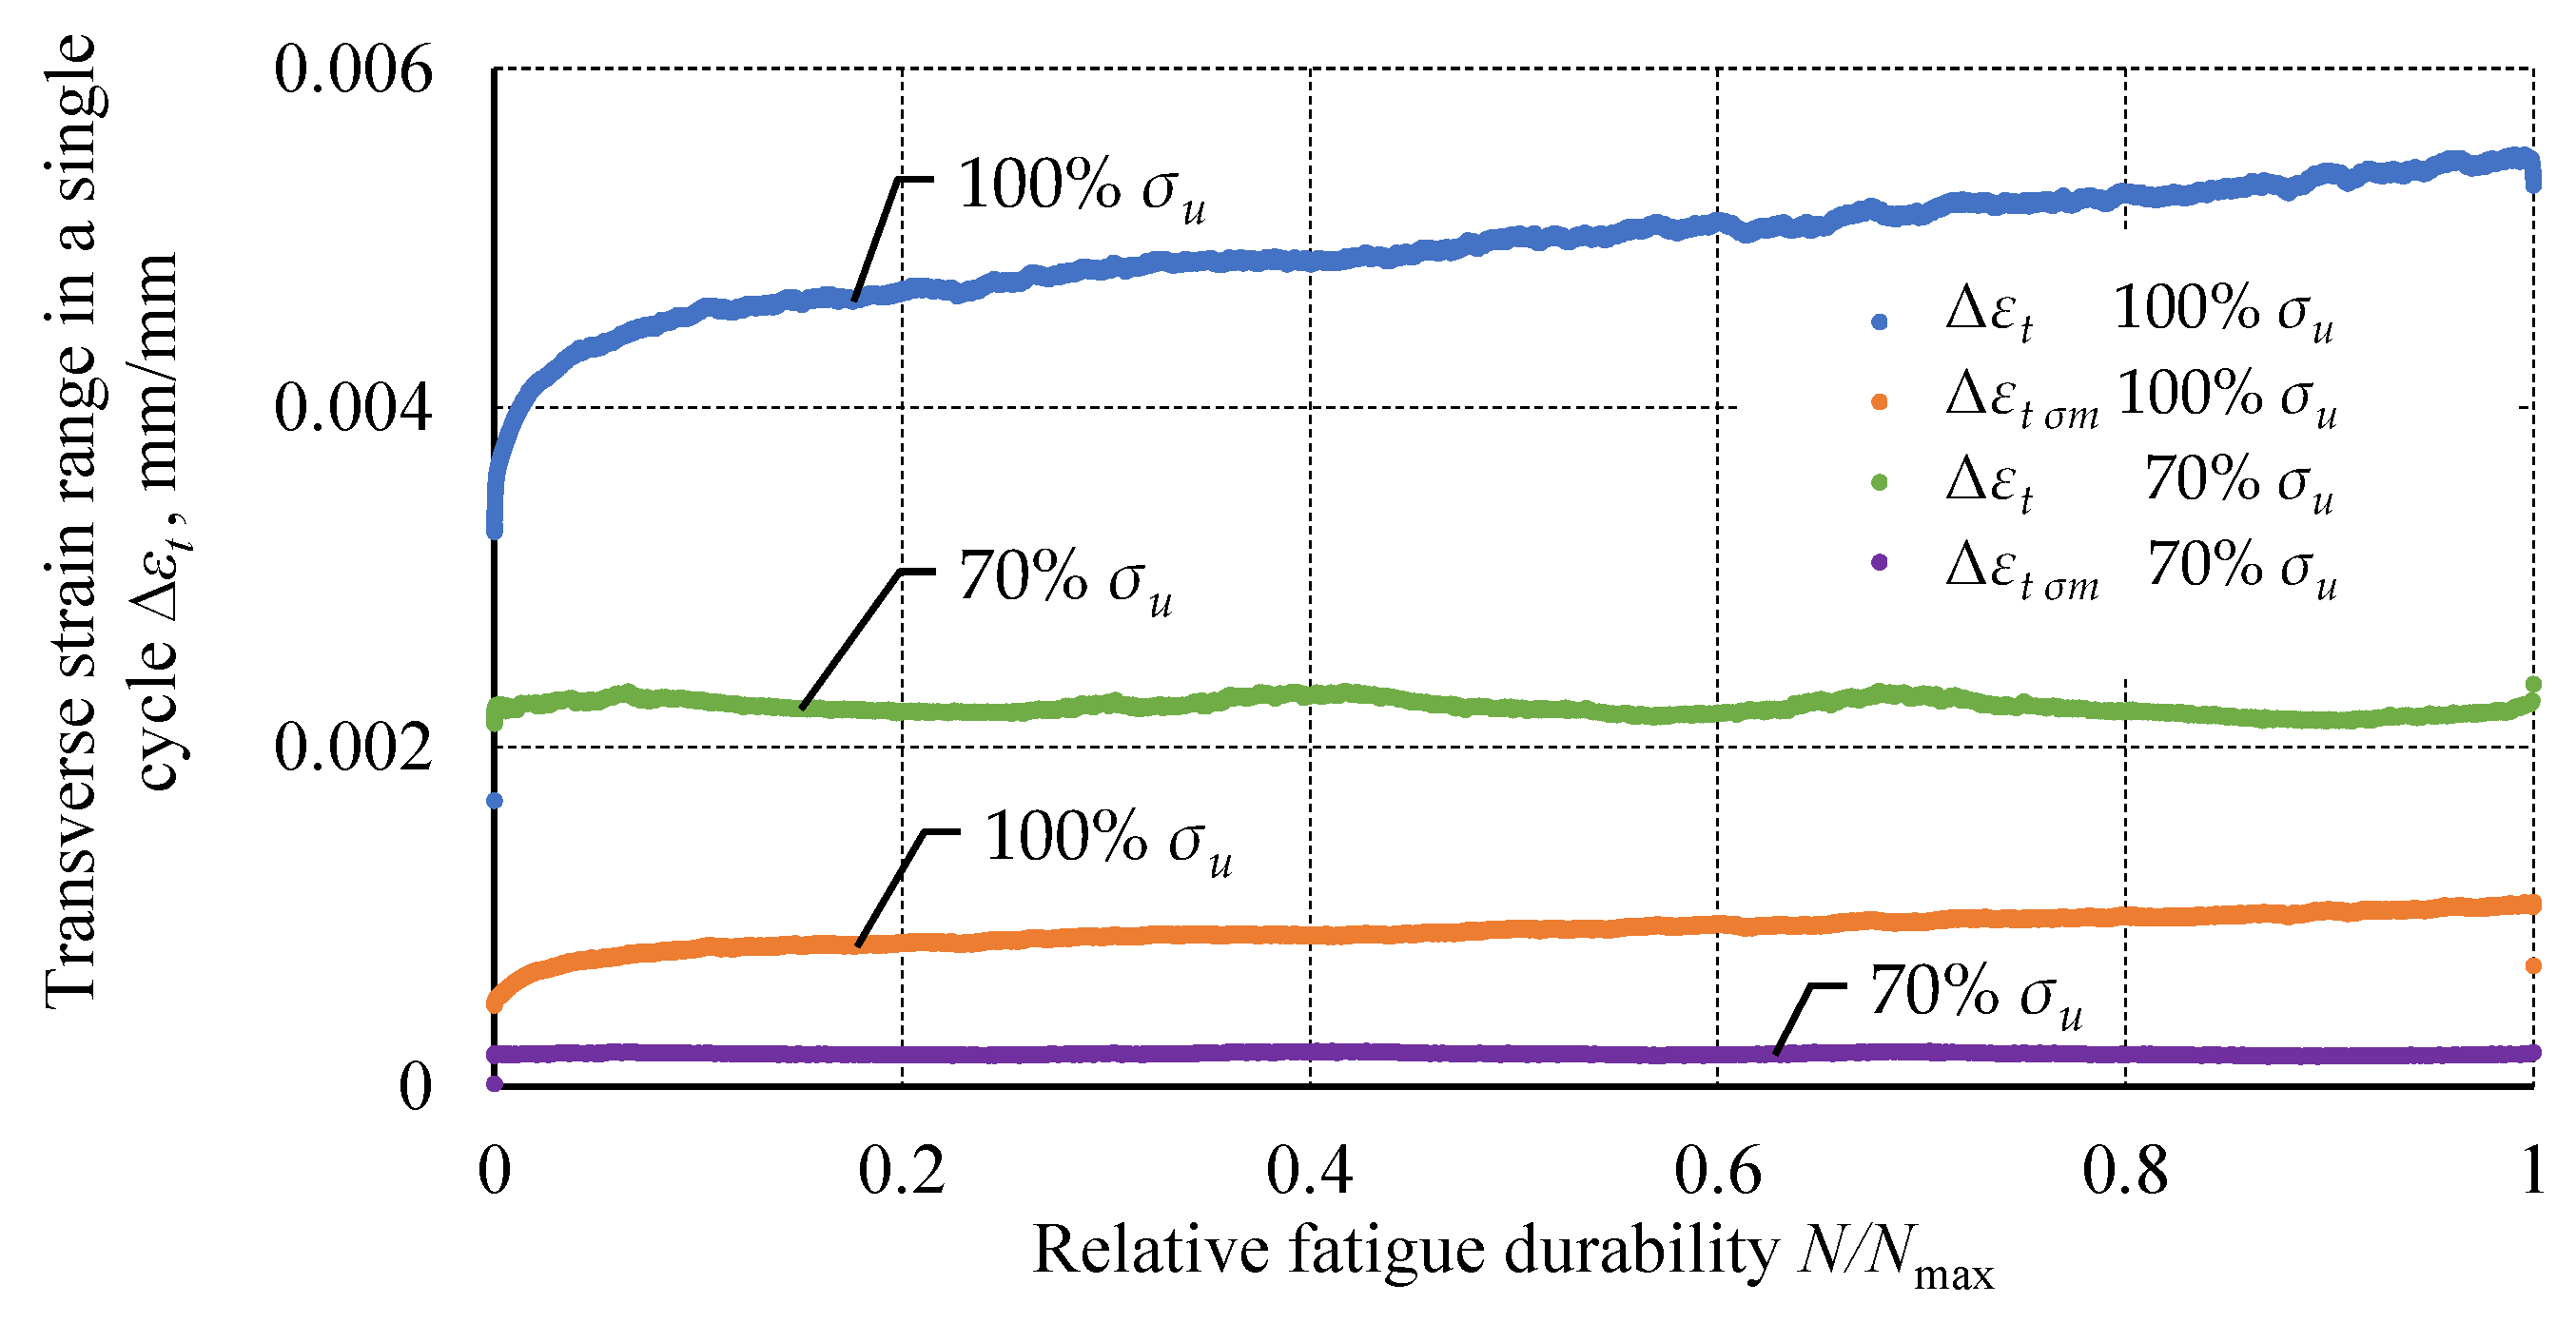
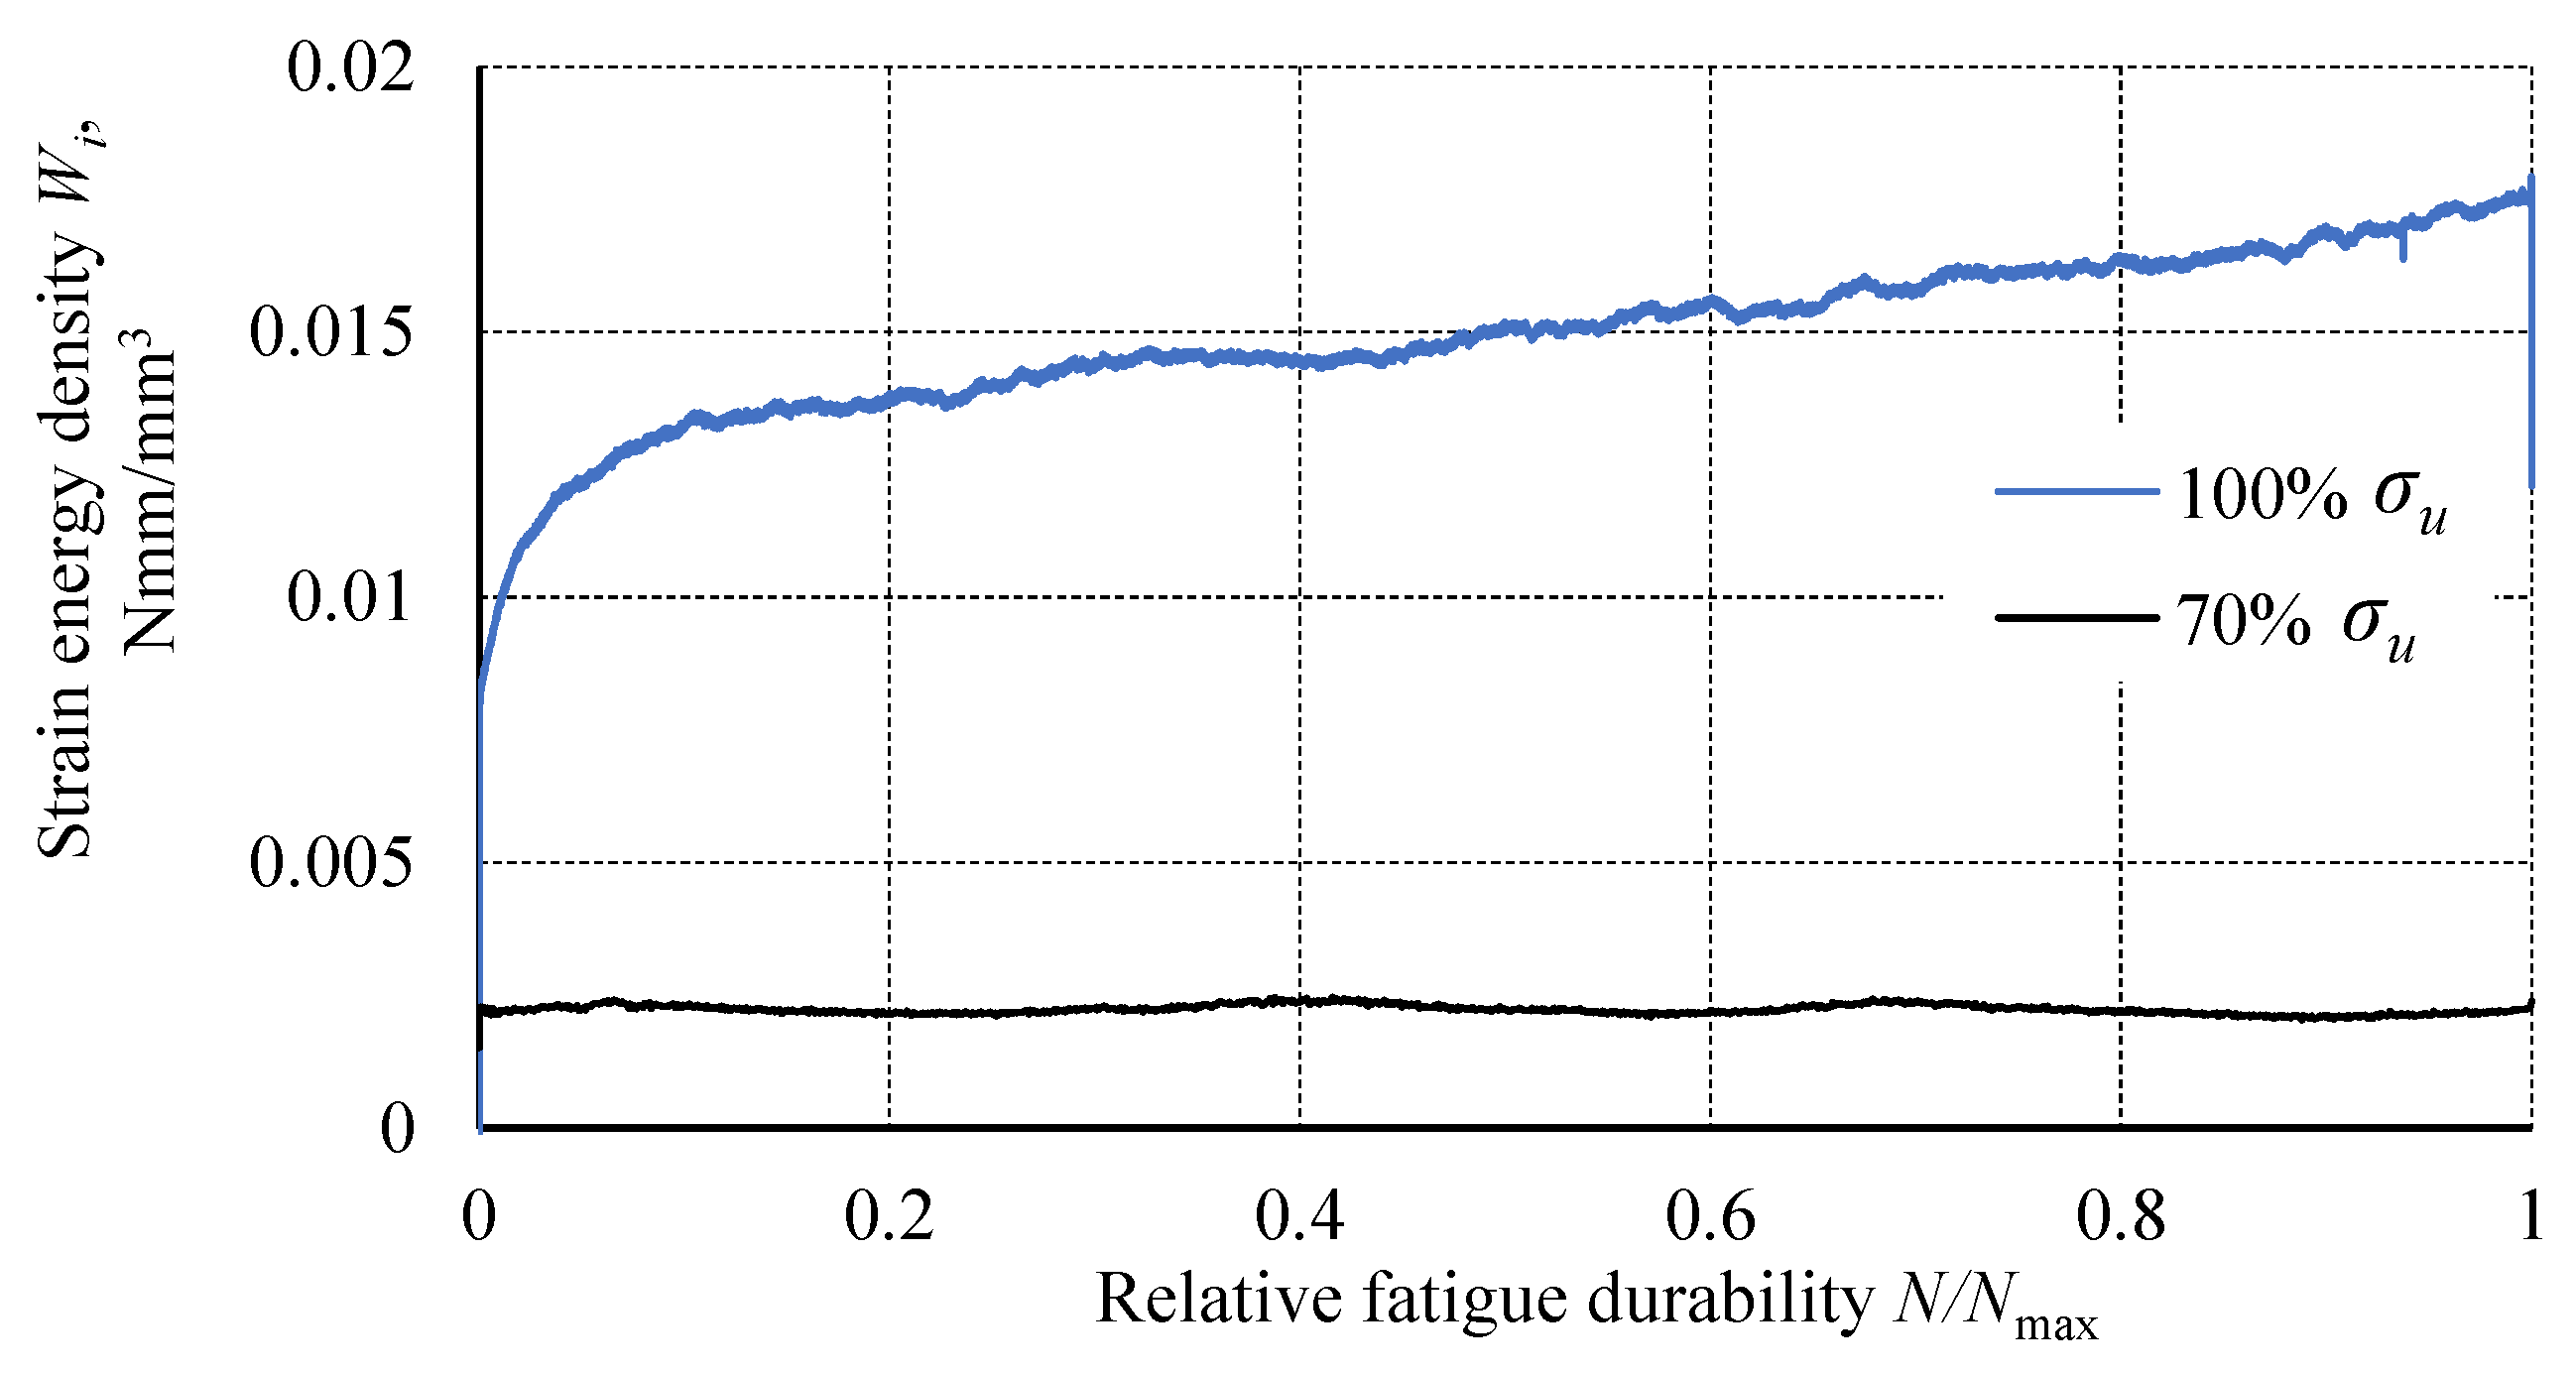
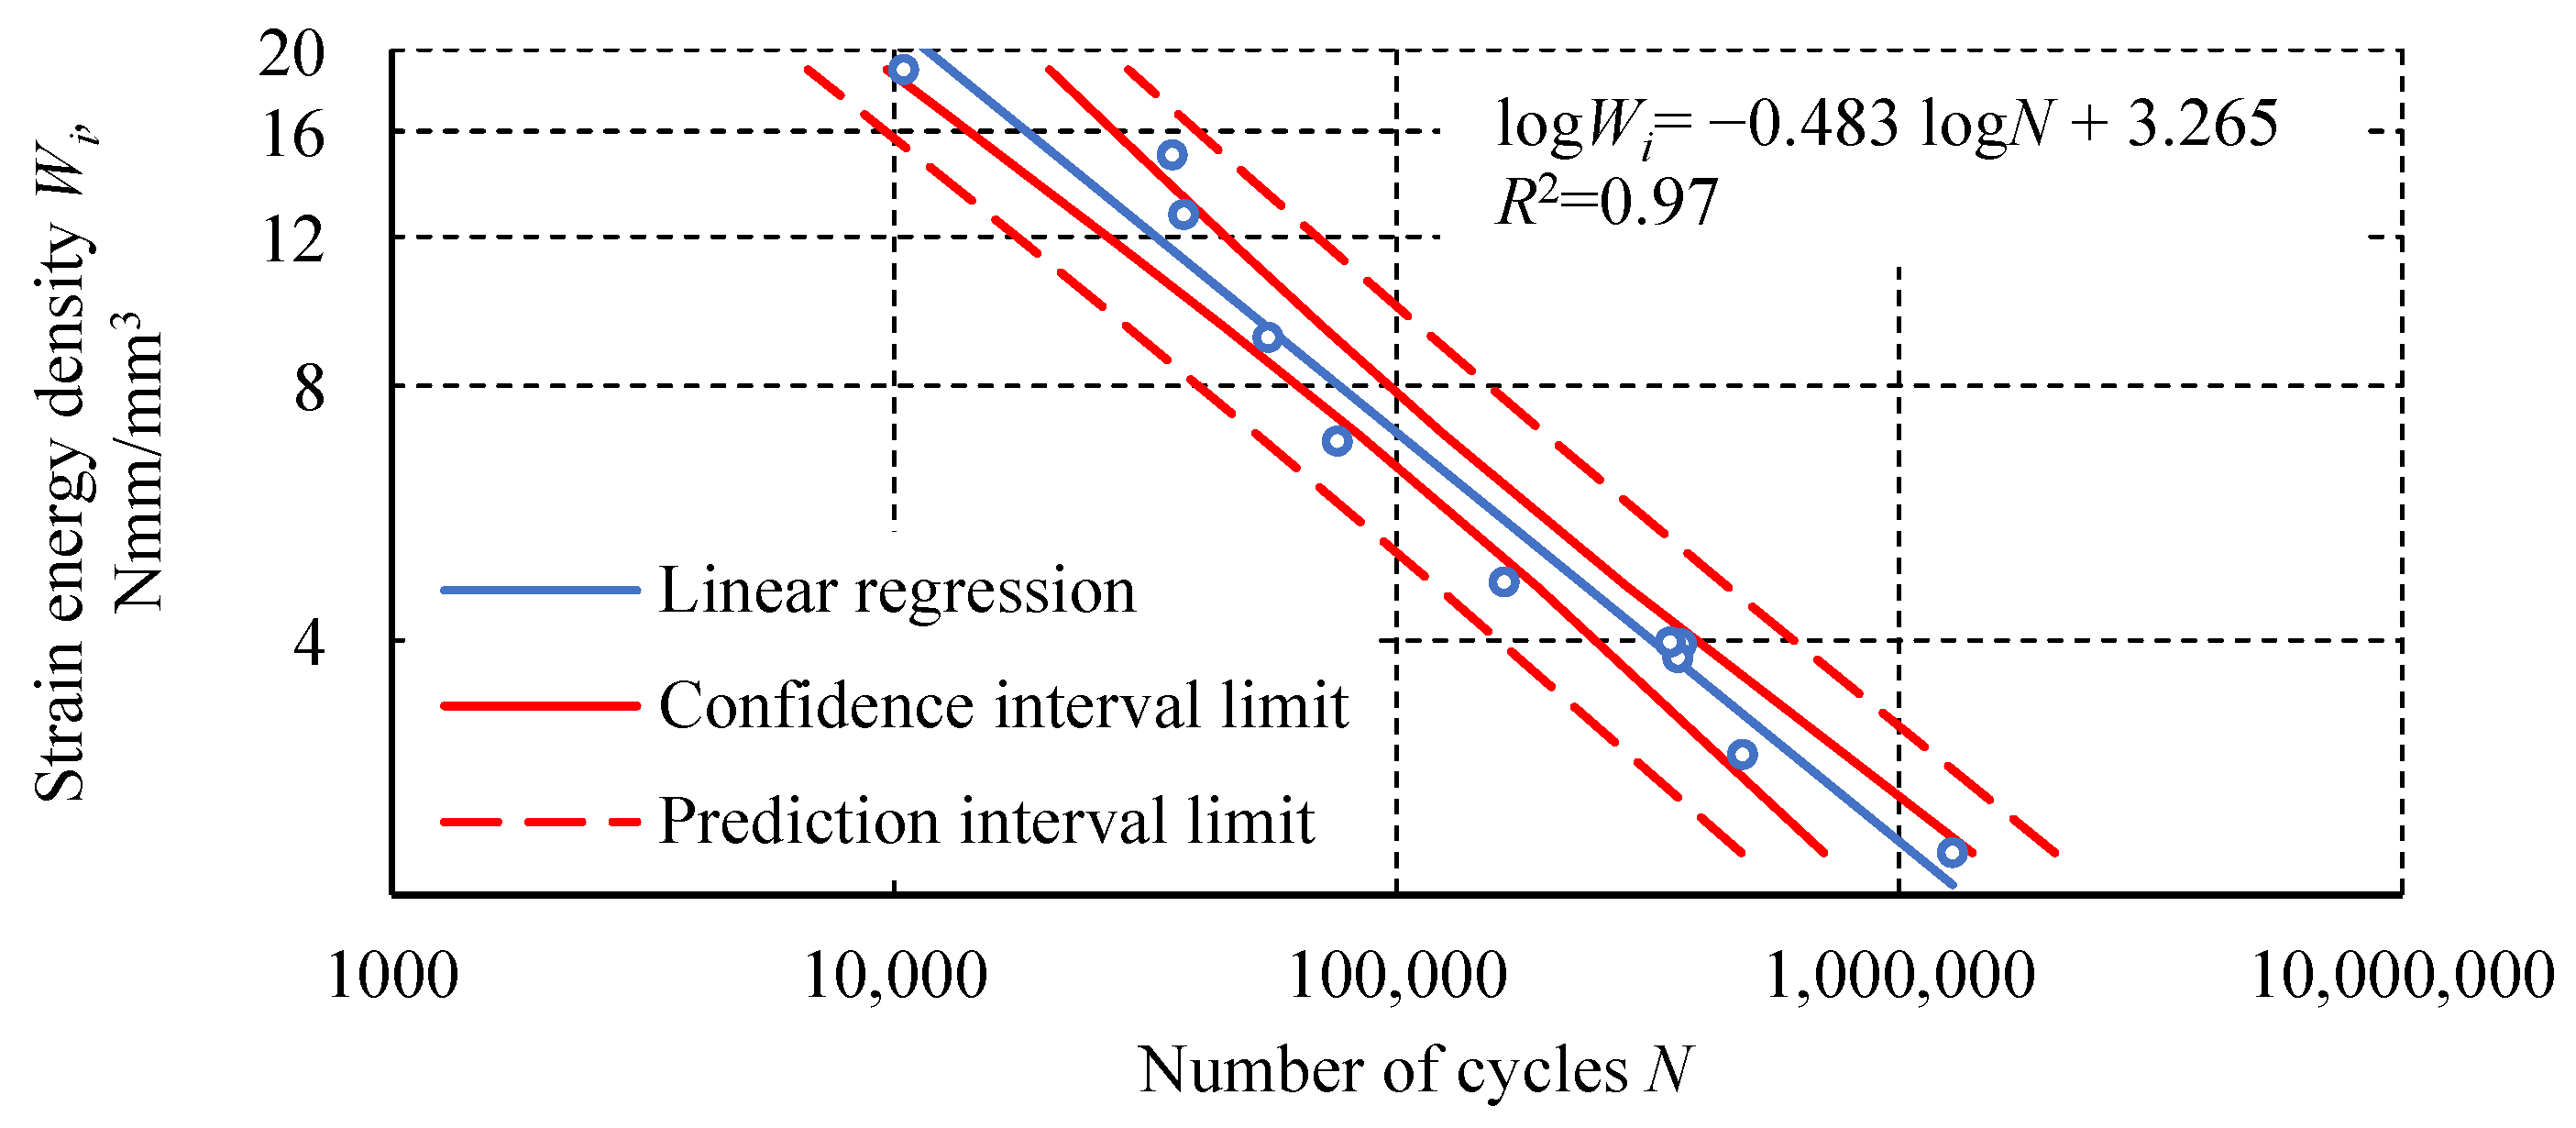
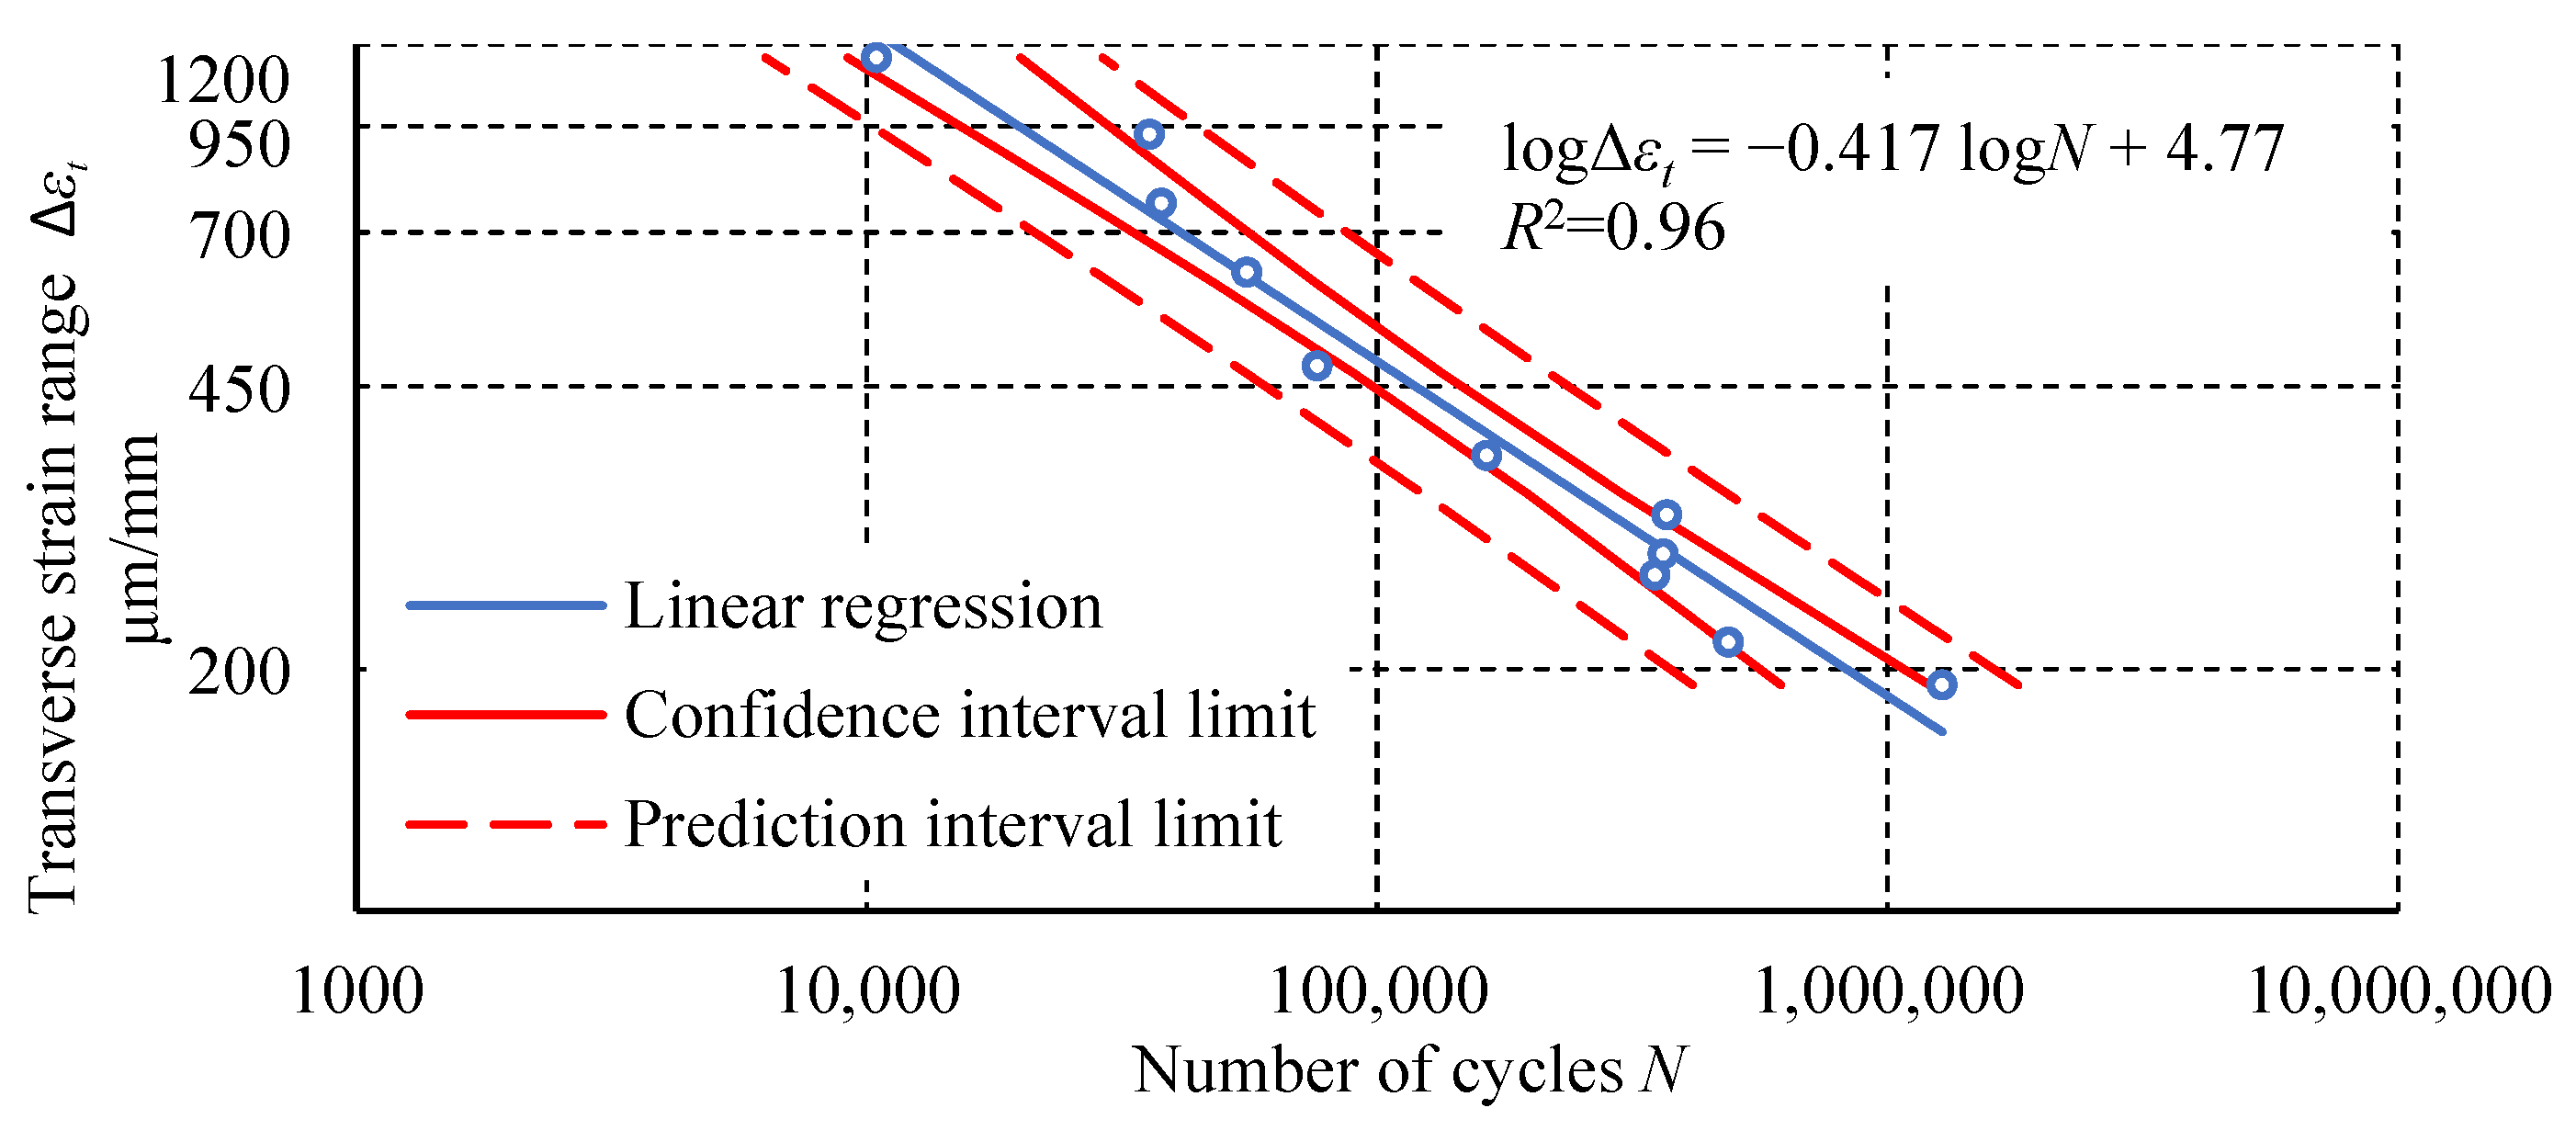
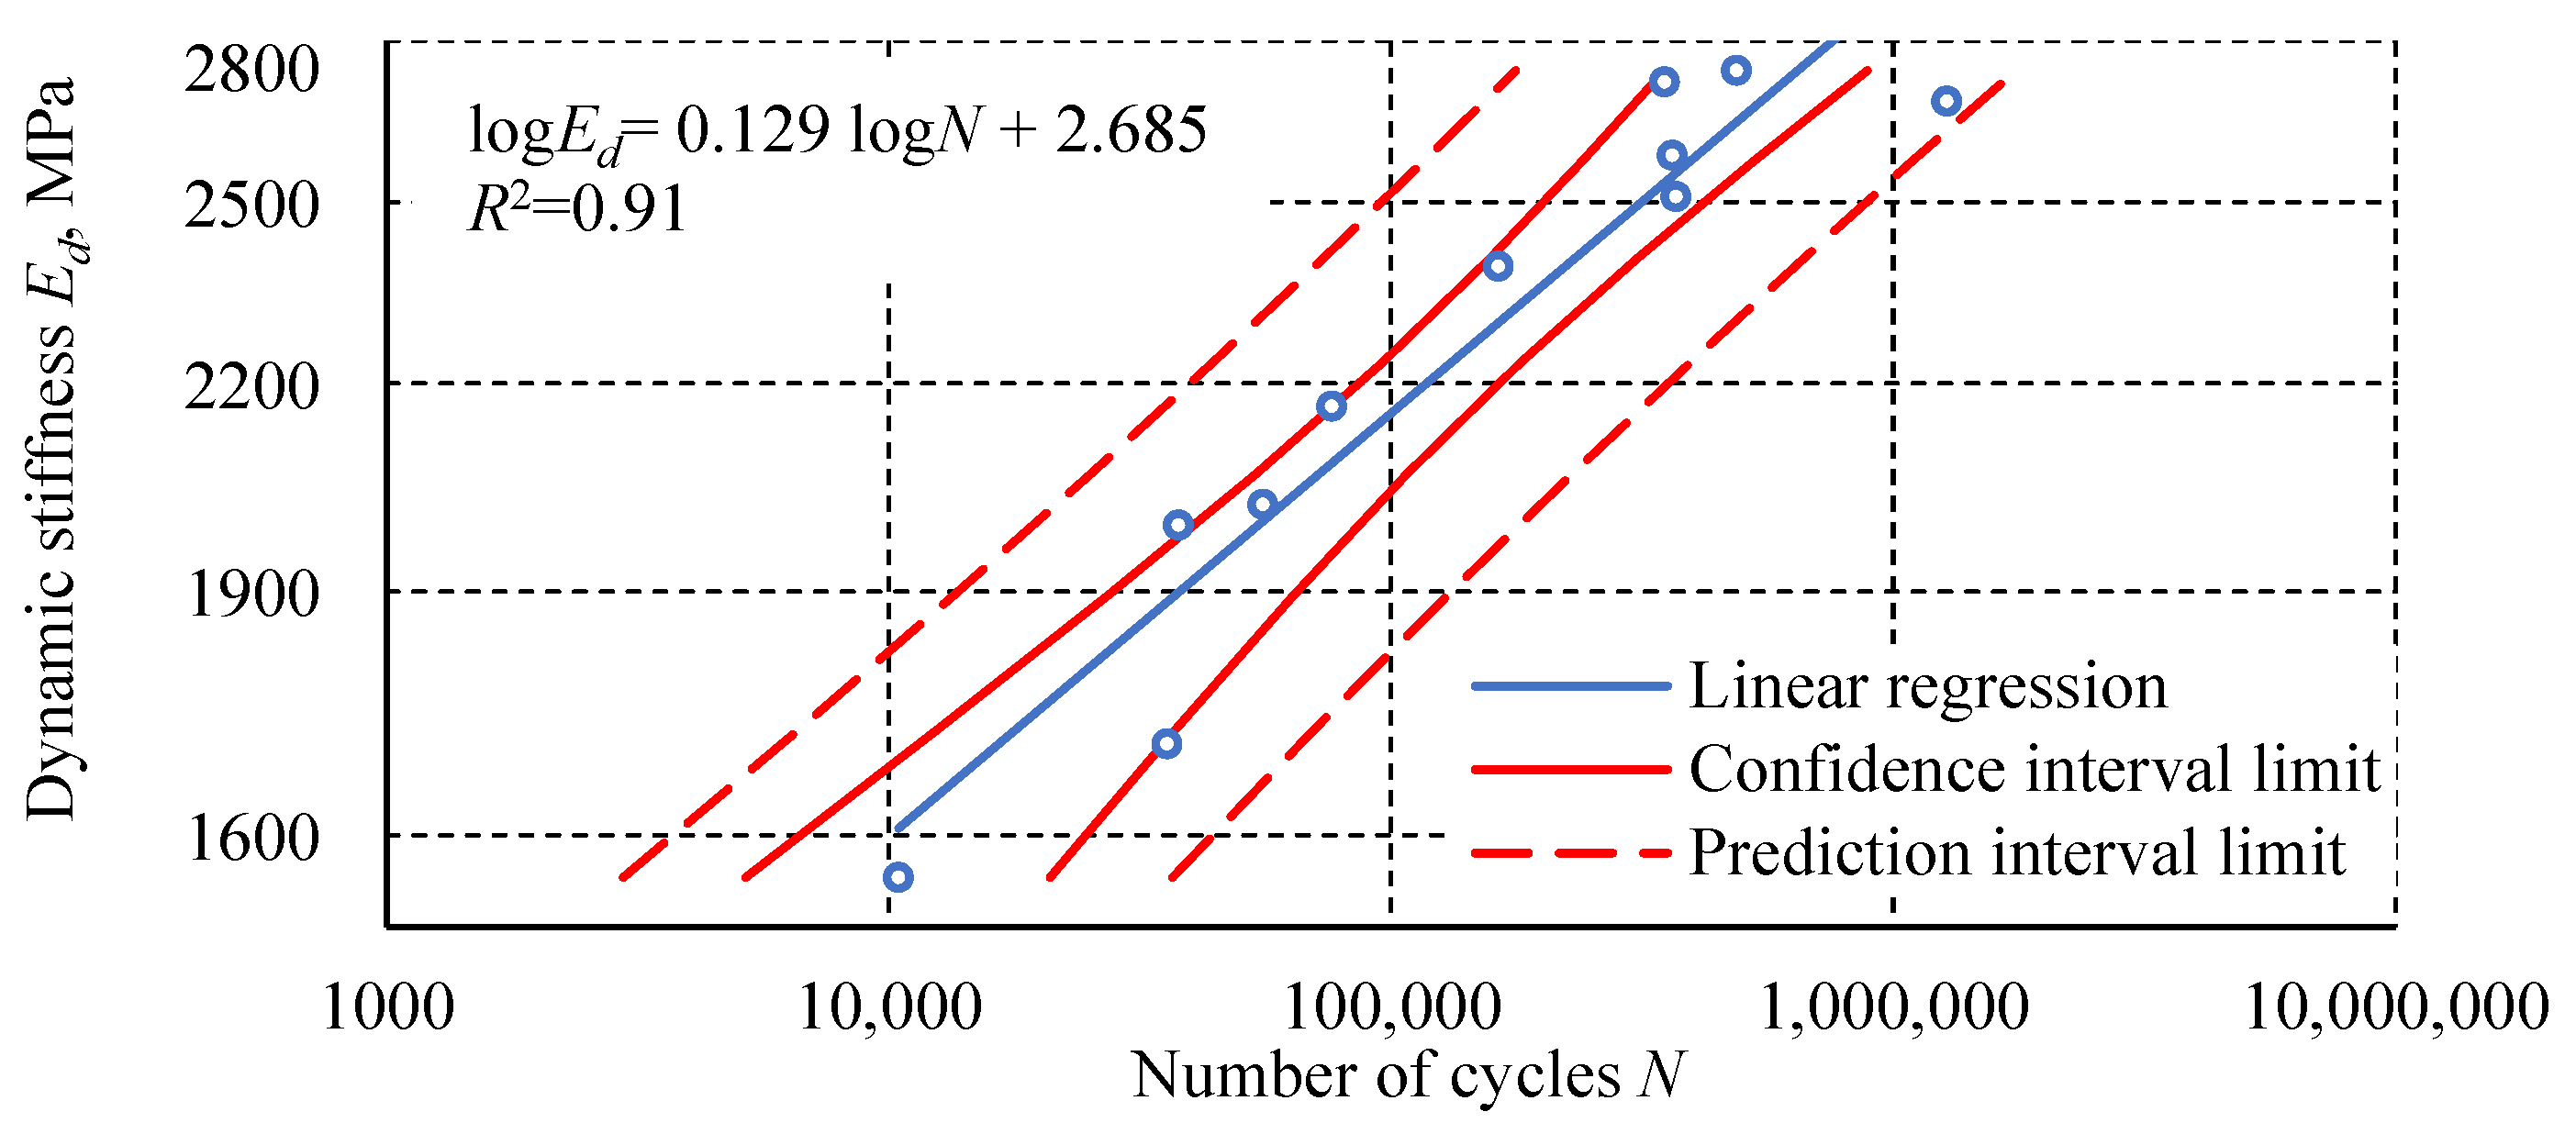
3. Results
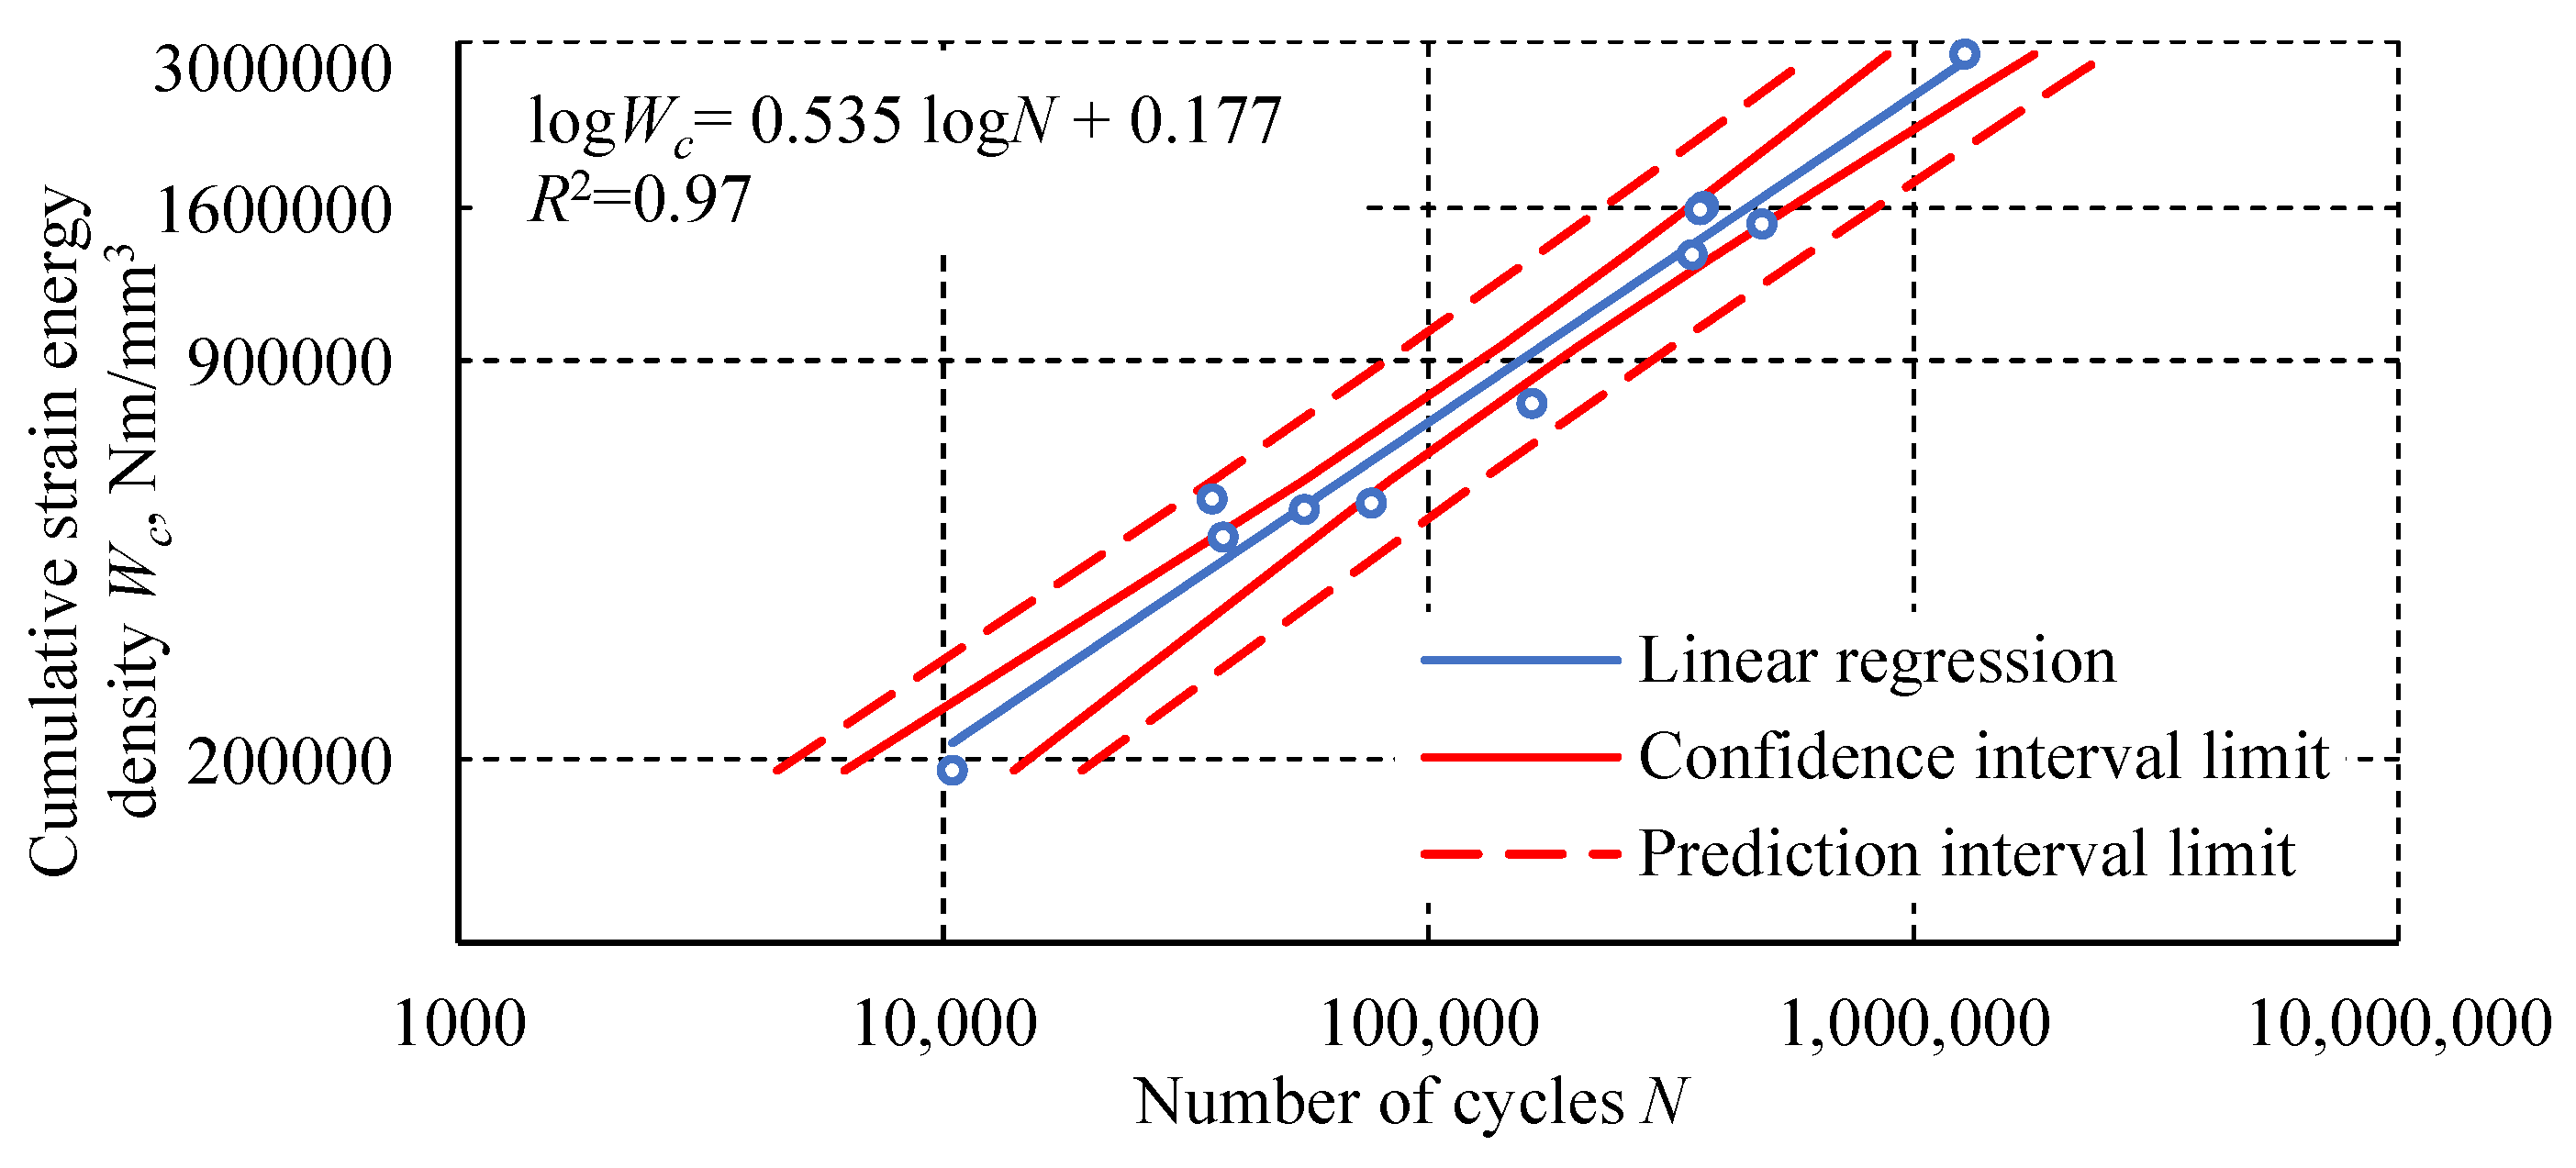
4. Discussion
5. Conclusions
Funding
Institutional Review Board Statement
Informed Consent Statement
Data Availability Statement
Conflicts of Interest
References
- Adams, R.D.; Wake, W.C. Structural Adhesive Joints in Engineering; Elsevier: London, UK, 1984. [Google Scholar]
- da Silvaa, L.F.; da Silvaa, R.A.M.; Chousala, J.A.G.; Pintob, A.M.G. Alternative Methods to Measure the Adhesive Shear Displacement in the Thick Adherend Shear Test. J. Adhes. Sci. Technol. 2008, 22, 15–29. [Google Scholar] [CrossRef]
- Maćkowiak, P.; Ligaj, B. Damage to Adhesive Single Lap Joint Made of Materials with Different Properties under Static Loading Conditions. In Proceedings of the 23rd International Conference, Svratka, Czech Republic, 15–18 May 2017; pp. 598–601. [Google Scholar]
- Wong, E.-H.; Liu, J. Design Analysis of Adhesively Bonded Structures. Polymers 2017, 9, 664. [Google Scholar] [CrossRef] [PubMed]
- Maćkowiak, P.; Ligaj, B.; Płaczek, D.; Kotyk, M. Verification of Selected Failure Criteria for Adhesive Bonded Elements with Different Stiffness through the Use of Methacrylic Adhesive. Materials 2020, 13, 4011. [Google Scholar] [CrossRef] [PubMed]
- da Silva, L.F.M.; das Neves, P.J.C.; Adams, R.D.; Spelt, J.K. Analytical Models of Adhesively Bonded Joints—Part I: Literature Survey. Int. J. Adhes. Adhes. 2009, 29, 319–330. [Google Scholar] [CrossRef]
- Rudawska, A. Mechanical Properties of Selected Epoxy Adhesive and Adhesive Joints of Steel Sheets. Appl. Mech. 2021, 2, 108–126. [Google Scholar] [CrossRef]
- Almutairi, A.D. Comprehensive Investigation of Epoxy Adhesives for Structural Applications in Saudi Arabia: Mechanical Performance, Environmental Impacts, and Analysis on Health. Polymers 2024, 16, 3185. [Google Scholar] [CrossRef]
- Humelnicu, C.; Amortila, V.; Novetschi, M.; Gingarasu, M. Aspects Referring to Fatigue Testing of Epoxy Polymeric Materials. Mech. Test. Diagn. 2020, 10, 21–25. [Google Scholar] [CrossRef]
- Cunha, M.R.O.; Carbas, R.J.C.; Marques, E.A.S.; Akhavan-Safar, A.; Silva, L.F.M.D. Fatigue Behaviour of an Epoxy Adhesive under Mixed-Mode Conditions. Tecnol. Em Metal. Mater. E Min. 2021, 18, e2463. [Google Scholar] [CrossRef]
- Cease, H.; Derwent, P.F.; Diehl, H.T.; Fast, J.; Finley, D. Measurement of Mechanical Properties of Three Epoxy Adhesives at Cryogenic Temperatures for CCD Construction; Fermi National Accelerator Laboratory: Batavia, IL, USA, 2006. [Google Scholar]
- Maćkowiak, P.; Płaczek, D.; Sołtysiak, A. Mechanical Properties of Methacrylic Plexus MA300 Adhesive Material Determined in Tensile Test and Butt Joints of Aluminum Thick Plates. MATEC Web Conf. 2019, 290, 01007. [Google Scholar] [CrossRef]
- Maćkowiak, P.; Płaczek, D.; Kotyk, M. Determination of Design Mechanical Properties of Adhesives in a Tensile and Compression Test. IOP Conf. Ser. Mater. Sci. Eng. 2018, 393, 012027. [Google Scholar] [CrossRef]
- Miner, M.; Cookson, J.; Burke, C. Fatigue Resistance of Structural Adhesives. Available online: https://www.ellsworth.com/resources/insights/white-papers/fatigue-resistance-of-structural-adhesives/ (accessed on 23 March 2025).
- Kałuża, M.; Hulimka, J.; Bula, A. FEM Analysis as a Tool to Study the Behavior of Methacrylate Adhesive in a Full-Scale Steel-Steel Shear Joint. Materials 2022, 15, 330. [Google Scholar] [CrossRef]
- Kałuża, M.; Hulimka, J.; Kubica, J.; Tekieli, M. The Methacrylate Adhesive to Double-Lap Shear Joints Made of High-Strength Steel—Experimental Study. Materials 2019, 12, 120. [Google Scholar] [CrossRef] [PubMed]
- Serra, G.C.G.; Ferreira, J.A.M.; Reis, P.N.B. Static and Fatigue Characterization of Adhesive T-Joints Involving Different Adherends. Processes 2023, 11, 2640. [Google Scholar] [CrossRef]
- Takamura, M.; Isozaki, M.; Takeda, S.; Oya, Y.; Koyanagi, J. Evaluation of True Bonding Strength for Adhesive Bonded Carbon Fiber-Reinforced Plastics. Materials 2024, 17, 394. [Google Scholar] [CrossRef] [PubMed]
- Płaczek, D.; Maćkowiak, P.; Boroński, D. Fatigue Analysis of Welded Joints Using a Thin-Walled Al/Fe Explosive Welded Transition Joints. Materials 2023, 16, 6259. [Google Scholar] [CrossRef]
- Hobbacher, A.F. The New IIW Recommendations for Fatigue Assessment of Welded Joints and Components—A Comprehensive Code Recently Updated. Int. J. Fatigue 2009, 31, 50–58. [Google Scholar] [CrossRef]
- da Silva, L.F.M.; Rodrigues, T.N.S.S.; Figueiredo, M.A.V.; de Moura, M.F.S.F.; Chousal, J.A.G. Effect of Adhesive Type and Thickness on the Lap Shear Strength. J. Adhes. 2006, 82, 1091–1115. [Google Scholar] [CrossRef]
- Da Silva, L.F.; Carbas, R.J.; Critchlow, G.W.; Figueiredo, M.A.; Brown, K. Effect of Material, Geometry, Surface Treatment and Environment on the Shear Strength of Single Lap Joints. Int. J. Adhes. Adhes. 2009, 29, 621–632. [Google Scholar] [CrossRef]
- Reis, P.N.B.; Ferreira, J.A.M.; Antunes, F. Effect of Adherend’s Rigidity on the Shear Strength of Single Lap Adhesive Joints. Int. J. Adhes. Adhes. 2011, 31, 193–201. [Google Scholar] [CrossRef]
- Zhao, X.; Adams, R.D.; da Silva, L.F.M. A New Method for the Determination of Bending Moments in Single Lap Joints. Int. J. Adhes. Adhes. 2010, 30, 63–71. [Google Scholar] [CrossRef]
- Crocombe, A.; Tatarek, A. A Unified Approach to Adhesive Joint Analysis. Proc. Adhes. Sealants Encapsulants 85 1985. [Google Scholar]
- Hart-Smith, L.J. Adhesive-Bonded Single-Lap Joints; National Aeronautics and Space Administration: Washington, DC, USA, 1973. [Google Scholar]
- Crocombe, A.D.; Adams, R.D. An Elasto-Plastic Investigation of the Peel Test. J. Adhes. 1982, 13, 241–267. [Google Scholar] [CrossRef]
- Lee, S.J.; Lee, D.G. Development of a Failure Model for the Adhesively Bonded Tubular Single Lap Joint. J. Adhes. 1992, 40, 1–14. [Google Scholar] [CrossRef]
- Crocombe, A.D.; Bigwood, D.A.; Richardson, G. Analysing Structural Adhesive Joints for Failure. Int. J. Adhes. Adhes. 1990, 10, 167–178. [Google Scholar] [CrossRef]
- Zhao, X. Stress and Failure Analysis of Adhesively Bonded Joints. Ph.D. Thesis, University of Bristol, Bristol, UK, 1991. [Google Scholar]
- Towse, A.; Potter, K.D.; Wisnom, M.R.; Adams, R.D. A Novel Comb Joint Concept for High Strength Unidirectional Carbon Fibre Bonded Joints. In Proceedings of the 11th International Conference on Composite Materials, Gold Coast, QLD, Australia, 14–18 July 1997; Volume 6, pp. 95–101. [Google Scholar]
- Towse, A.; Clarke, A.B.; Wisnom, M.R.; Adams, R.D.; Potter, K.D. The Design and Analysis of High Load Intensity Adhesively Bonded Double Lap Joints. In Proceedings of the Institute of Materials, 4th International Conference, Manchester, UK, 24–26 March 1997; pp. 479–488. [Google Scholar]
- Schmit, F.; Fraisse, P. Fracture Mechanics Analysis of the Strength of Bonded Joints. Mater. Tech. 1992, 80, 55–63. [Google Scholar] [CrossRef]
- Crocombe, A.D. Global Yielding as a Failure Criterion for Bonded Joints. Int. J. Adhes. Adhes. 1989, 9, 145–153. [Google Scholar] [CrossRef]
- Tong, L. Strength of Adhesively Bonded Single-Lap and Lap-Shear Joints. Int. J. Solids Struct. 1998, 35, 2601–2616. [Google Scholar] [CrossRef]
- Chen, Z.; Adams, R.D.; Da Silva, L.F. Prediction of Crack Initiation and Propagation of Adhesive Lap Joints Using an Energy Failure Criterion. Eng. Fract. Mech. 2011, 78, 990–1007. [Google Scholar] [CrossRef]
- Sousa, F.C.; Zamani, P.; Akhavan-Safar, A.; da Silva, L.F.M. A Comprehensive Review of the S-N Fatigue Behaviour of Adhesive Joints. J. Adv. Join. Process. 2024, 9, 100178. [Google Scholar] [CrossRef]
- Maćkowiak, P.; Ligaj, B. Manufacture of Specimens and Mechanical Properties Determination of Structural Adhesives Under Static Loading Condition. Eng. Mech. 2018, 525–528. [Google Scholar]
- Maćkowiak, P.; Ligaj, B.; Płaczek, D.; Jasińska, A. Metody Badania Właściwości Mechanicznych Kleju Metakrylowego Stosowanego w Budowie Pojazdów. Autobusy Tech. Eksploat. Syst. Transp. 2017, 18. [Google Scholar]
- D1002-01; Standard Test Method for Apparent Shear Strength of Single-Lap-Joint Adhesively Bonded Metal Specimens by Tension Loading (Metal-to-Metal). ASTM International: West Conshohocken, USA, 2017.
- ITW Polymers Adhesives Plexus MA300 Data Sheet. Available online: https://www.curbellplastics.com/wp-content/uploads/2022/11/ITW-Polymers-Adhesives-Plexus-MA300-Data-Sheet.pdf (accessed on 20 January 2025).
- Moghim, M.H.; Nahvi Bayani, A.; Eqra, R. Strain-Rate-Dependent Mechanical Properties of Polypropylene Separator for Lithium-Ion Batteries. Polym. Int. 2020, 69, 545–551. [Google Scholar] [CrossRef]
- Fan, J. Strain Rate Dependent Mechanical Properties of a High-Strength Poly(Methyl Methacrylate). J. Appl. Polym. Sci. 2018, 135, 46189. [Google Scholar] [CrossRef]
- Kurotani, Y.; Tanaka, H. Fatigue Fracture Mechanism of Amorphous Materials from a Density-Based Coarse-Grained Model. Commun. Mater. 2022, 3, 67. [Google Scholar] [CrossRef]
- Kishino, M.; Hisano, K.; Kishimoto, Y.; Taguchi, R.; Shishido, A. Bending Fatigue Analysis of Various Polymer Films by Real-Time Monitoring of the Radius of Curvature and Heat Generation. J. Phys. Chem. C 2023, 127, 14510–14517. [Google Scholar] [CrossRef]
- Naga, S.A.R.; El-Sayed, T.A. Fatigue Failure in Polymeric Materials: Insights from Experimental Testing. J. Fail. Anal. Prev. 2024, 24, 922–935. [Google Scholar] [CrossRef]
- Zhou, Y.; Mallick, P.K. Fatigue Performance of Injection-molded Short E-glass Fiber Reinforced Polyamide-6,6. II. Effects of Melt Temperature and Hold Pressure. Polym. Compos. 2011, 32, 268–276. [Google Scholar] [CrossRef]
- Zhou, Y.; Mallick, P.K. Fatigue Performance of an Injection-molded Short E-glass Fiber-reinforced Polyamide 6,6. I. Effects of Orientation, Holes, and Weld Line. Polym. Compos. 2006, 27, 230–237. [Google Scholar] [CrossRef]
- Singh, V.; Misra, A.; Marangos, O.; Park, J.; Ye, Q.; Kieweg, S.L.; Spencer, P. Viscoelastic and Fatigue Properties of Model Methacrylate-Based Dentin Adhesives. J. Biomed. Mater. Res. B Appl. Biomater. 2010, 95B, 283–290. [Google Scholar] [CrossRef]


| Adhesive Properties | Tensile Strength | Young’s Modulus E | Strain to Failure | Lap Shear (ASTM D1002) [40] |
|---|---|---|---|---|
| MPa | MPa | % | MPa | |
| Data from adhesive manufacturer [41] | 20 to 24 | 931 to 1137 | 15 to 25 | 15 to 25 |
| Experimental data [13] | 23.7 | 1610.5 | 19,4 | 21.1 |
| Load Levels | Stress Values in the Cycle | |||
|---|---|---|---|---|
| σmax | σmin | σa | σm | |
| 110% σu | 26.1 | 2.61 | 11.7 | 14.4 |
| 100% σu | 23.7 | 2.37 | 10.7 | 13.0 |
| 90% σu | 21.3 | 2.13 | 9.59 | 11.7 |
| 80% σu | 19.0 | 1.90 | 8.55 | 10.5 |
| 70% σu | 16.6 | 1.66 | 7.47 | 9.13 |
| 60% σu | 14.2 | 1.42 | 6.39 | 7.81 |
| Lp. | Maximum Stress in the Cycle σmax | Stress Amplitude σa | Number of Cycles to Failure N | Lp. | Maximum Stress in the Cycle σmax | Stress Amplitude σa | Number of Cycles to Failure N |
|---|---|---|---|---|---|---|---|
| - | MPa | MPa | - | - | MPa | MPa | - |
| 1 | 26.1 | 11.7 | 12,010 | 19 | 21.3 | 9.6 | 106,262 |
| 2 | 26.1 | 11.7 | 6911 | 20 | 19.0 | 8.55 | 171,044 |
| 3 | 23.7 | 10.7 | 10,444 | 21 | 19.0 | 8.55 | 46,114 |
| 4 | 23.7 | 10.7 | 37,759 | 22 | 19.0 | 8.55 | 109,408 |
| 5 | 23.7 | 10.7 | 34,016 | 23 | 19.0 | 8.55 | 163,608 |
| 6 | 23.7 | 10.7 | 29,185 | 24 | 19.0 | 8.55 | 54,536 |
| 7 | 23.7 | 10.7 | 1187 | 25 | 19.0 | 8.55 | 369,123 |
| 8 | 23.7 | 10.7 | 37,726 | 26 | 19.0 | 8.55 | 487,583 |
| 9 | 23.7 | 10.7 | 21,585 | 27 | 19.0 | 8.55 | 362,728 |
| 10 | 21.3 | 9.59 | 76,298 | 28 | 19.0 | 8.55 | 163,635 |
| 11 | 21.3 | 9.59 | 11,169 | 29 | 16.6 | 7.47 | 1,248,717 |
| 12 | 21.3 | 9.59 | 319,102 | 30 | 16.6 | 7.47 | 1,277,175 |
| 13 | 21.3 | 9.59 | 350,025 | 31 | 16.6 | 7.47 | 190,599 |
| 14 | 21.3 | 9.59 | 55,540 | 32 | 16.6 | 7.47 | 775,502 |
| 15 | 21.3 | 9.59 | 6670 | 33 | 16.6 | 7.47 | 386,391 |
| 16 | 21.3 | 9.59 | 35,672 | 34 | 16.6 | 7.47 | 1,388,402 |
| 17 | 21.3 | 9.59 | 81,560 | 35 | 14.2 | 6.39 | >5,000,000 * |
| 18 | 21.3 | 9.59 | 156,890 | 36 | 14.2 | 6.39 | >5,000,000 * |
Disclaimer/Publisher’s Note: The statements, opinions and data contained in all publications are solely those of the individual author(s) and contributor(s) and not of MDPI and/or the editor(s). MDPI and/or the editor(s) disclaim responsibility for any injury to people or property resulting from any ideas, methods, instructions or products referred to in the content. |
© 2025 by the author. Licensee MDPI, Basel, Switzerland. This article is an open access article distributed under the terms and conditions of the Creative Commons Attribution (CC BY) license (https://creativecommons.org/licenses/by/4.0/).
Share and Cite
Maćkowiak, P. Fatigue Properties of Methacrylic Adhesive Plexus MA300. Materials 2025, 18, 2127. https://doi.org/10.3390/ma18092127
Maćkowiak P. Fatigue Properties of Methacrylic Adhesive Plexus MA300. Materials. 2025; 18(9):2127. https://doi.org/10.3390/ma18092127
Chicago/Turabian StyleMaćkowiak, Paweł. 2025. "Fatigue Properties of Methacrylic Adhesive Plexus MA300" Materials 18, no. 9: 2127. https://doi.org/10.3390/ma18092127
APA StyleMaćkowiak, P. (2025). Fatigue Properties of Methacrylic Adhesive Plexus MA300. Materials, 18(9), 2127. https://doi.org/10.3390/ma18092127