
Multi-Objective Optimization of Motor Sealing Performance: Numerical and Experimental Approach

Abstract
1. Introduction
2. Models
2.1. Physical Model
2.2. Numerical Model
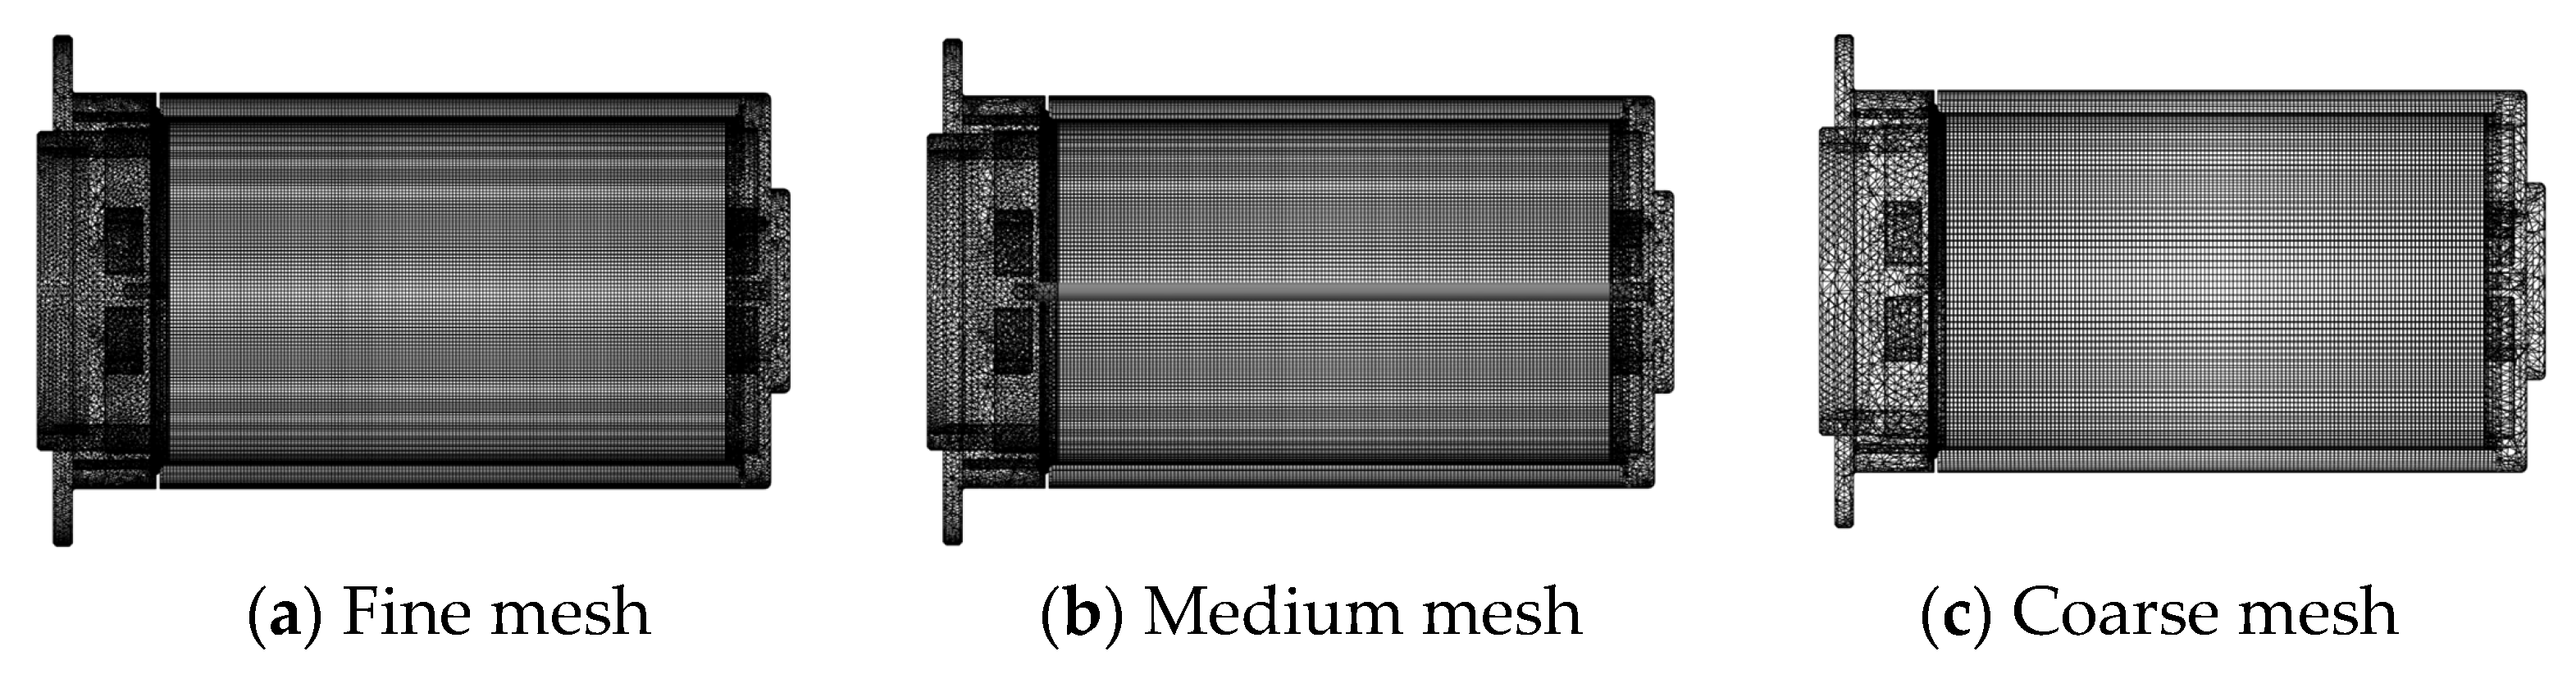
2.3. Grid Independence Test
2.4. Optimization Method
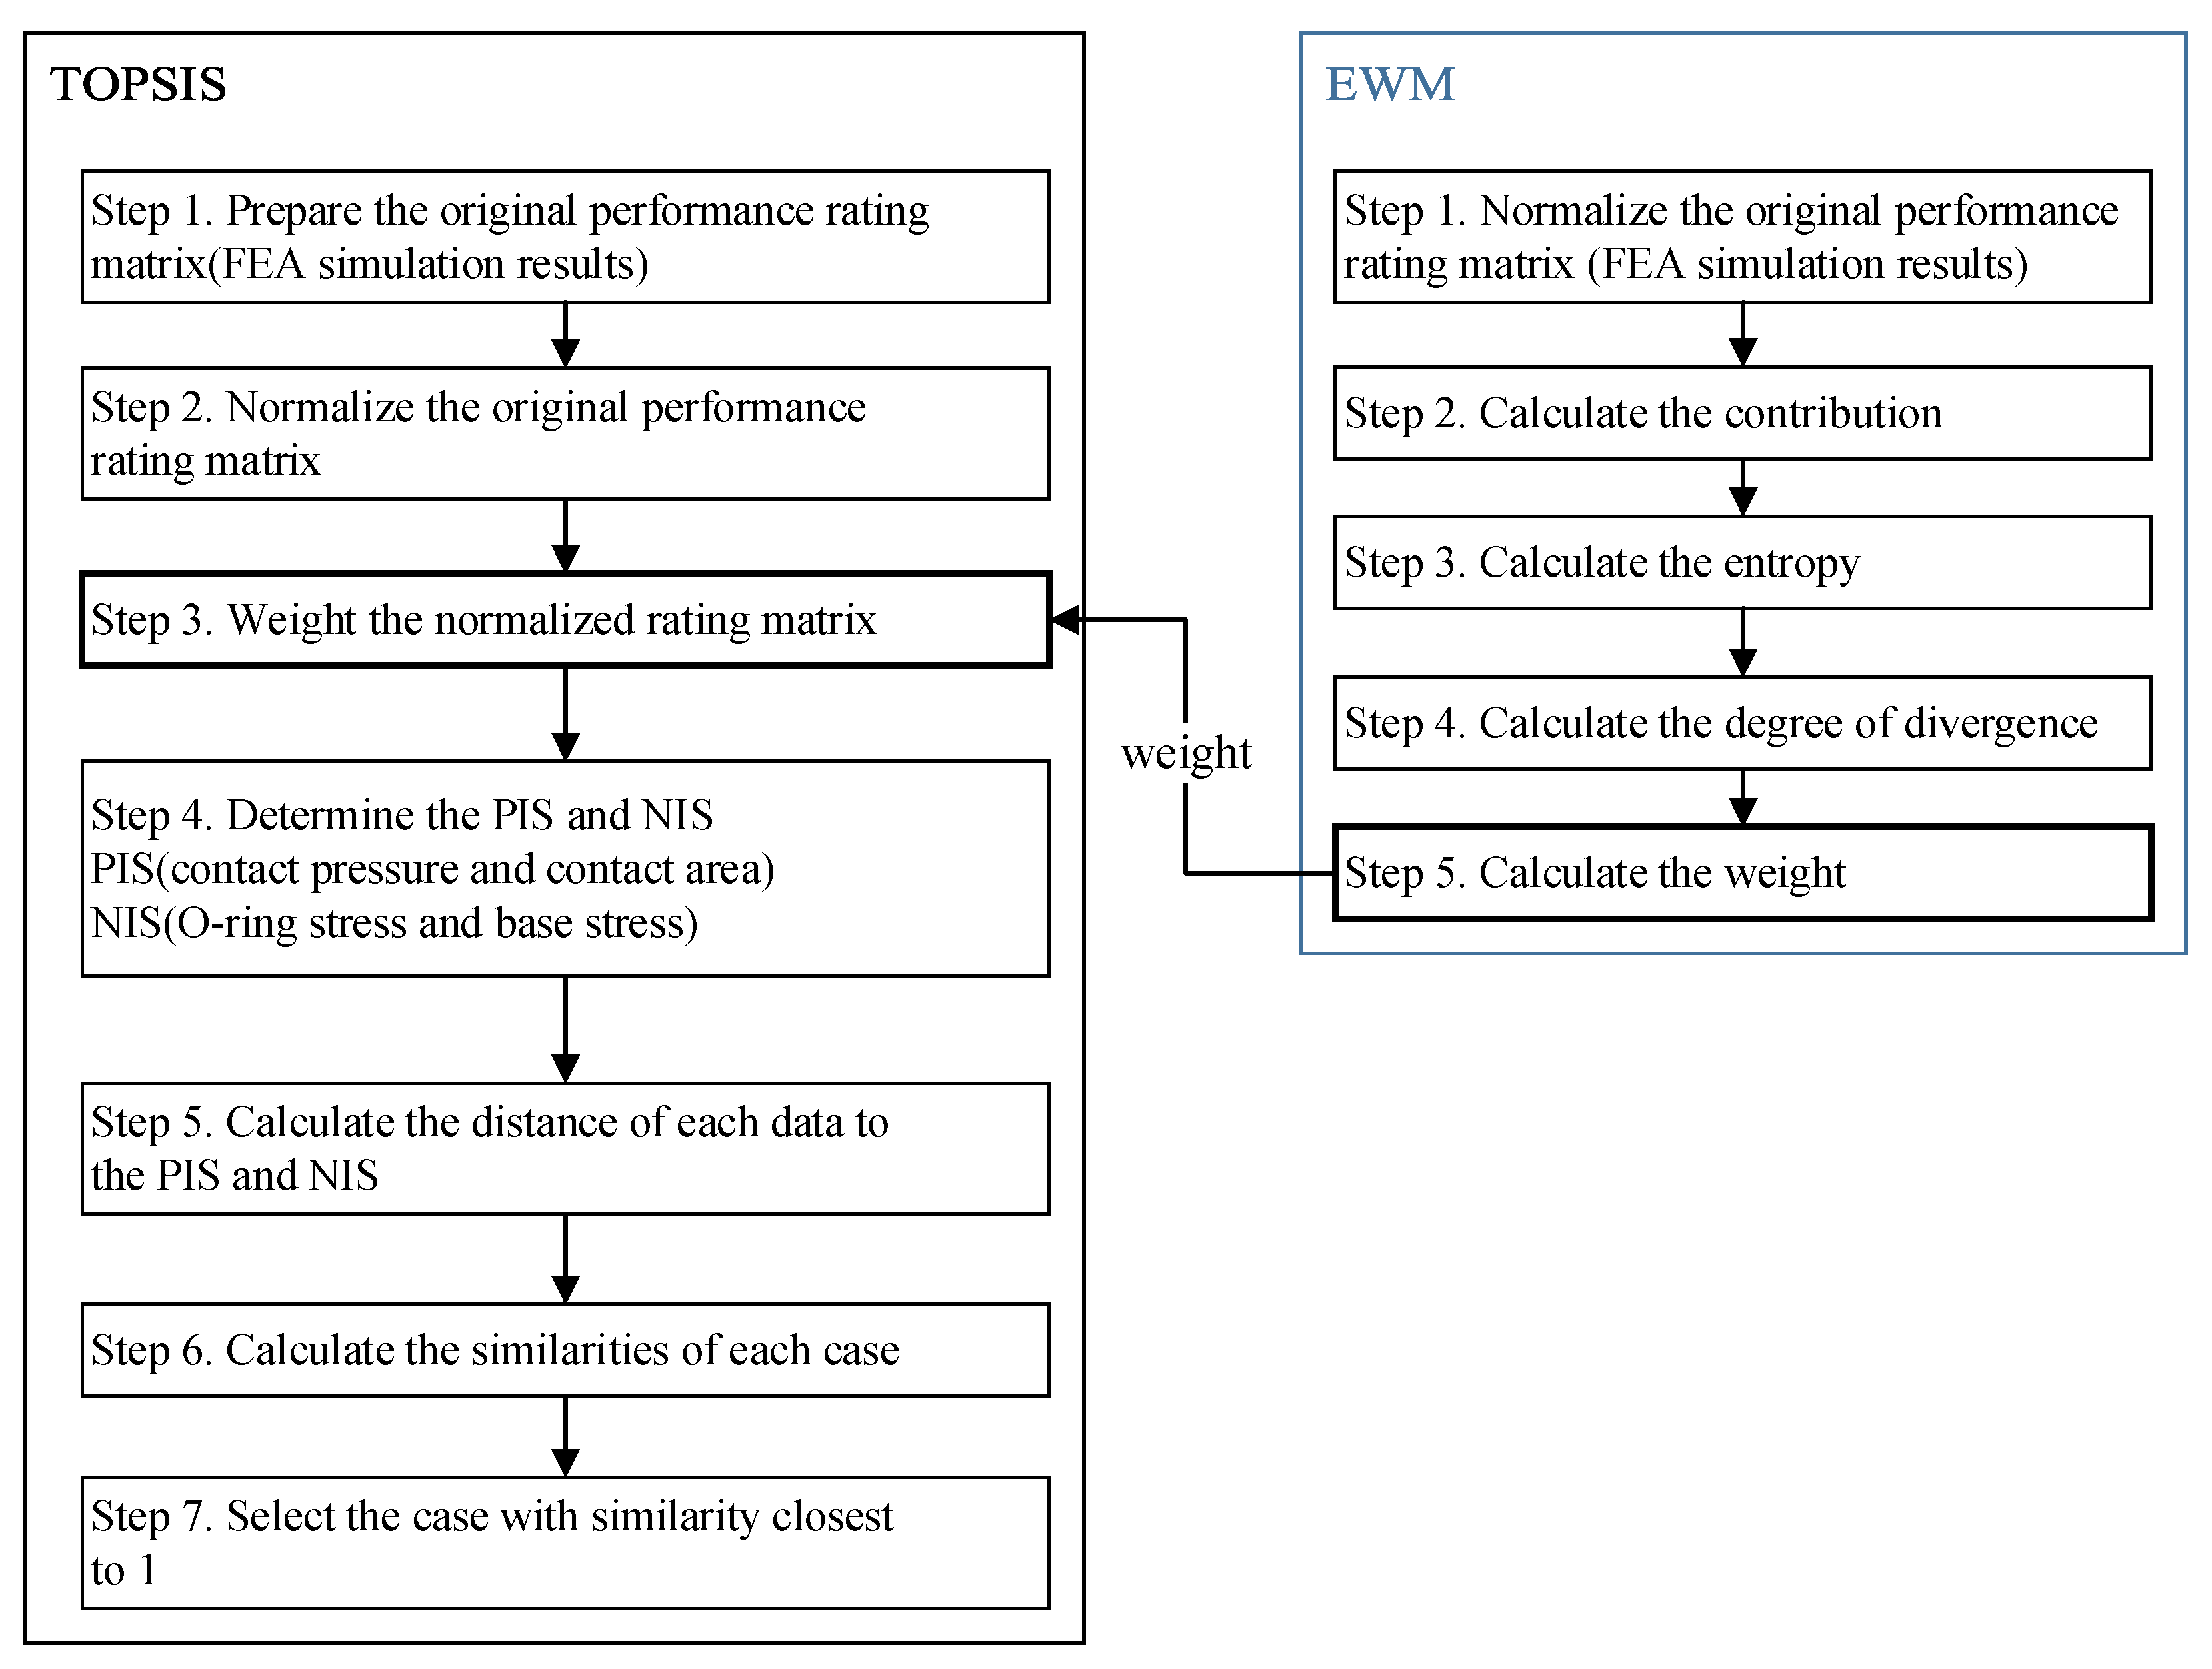
2.4.1. The TOPSIS Method
2.4.2. Entropy Weight Method
3. Sealing Performance Analysis
3.1. FEM Method Analysis
3.1.1. Metal Structure Analysis
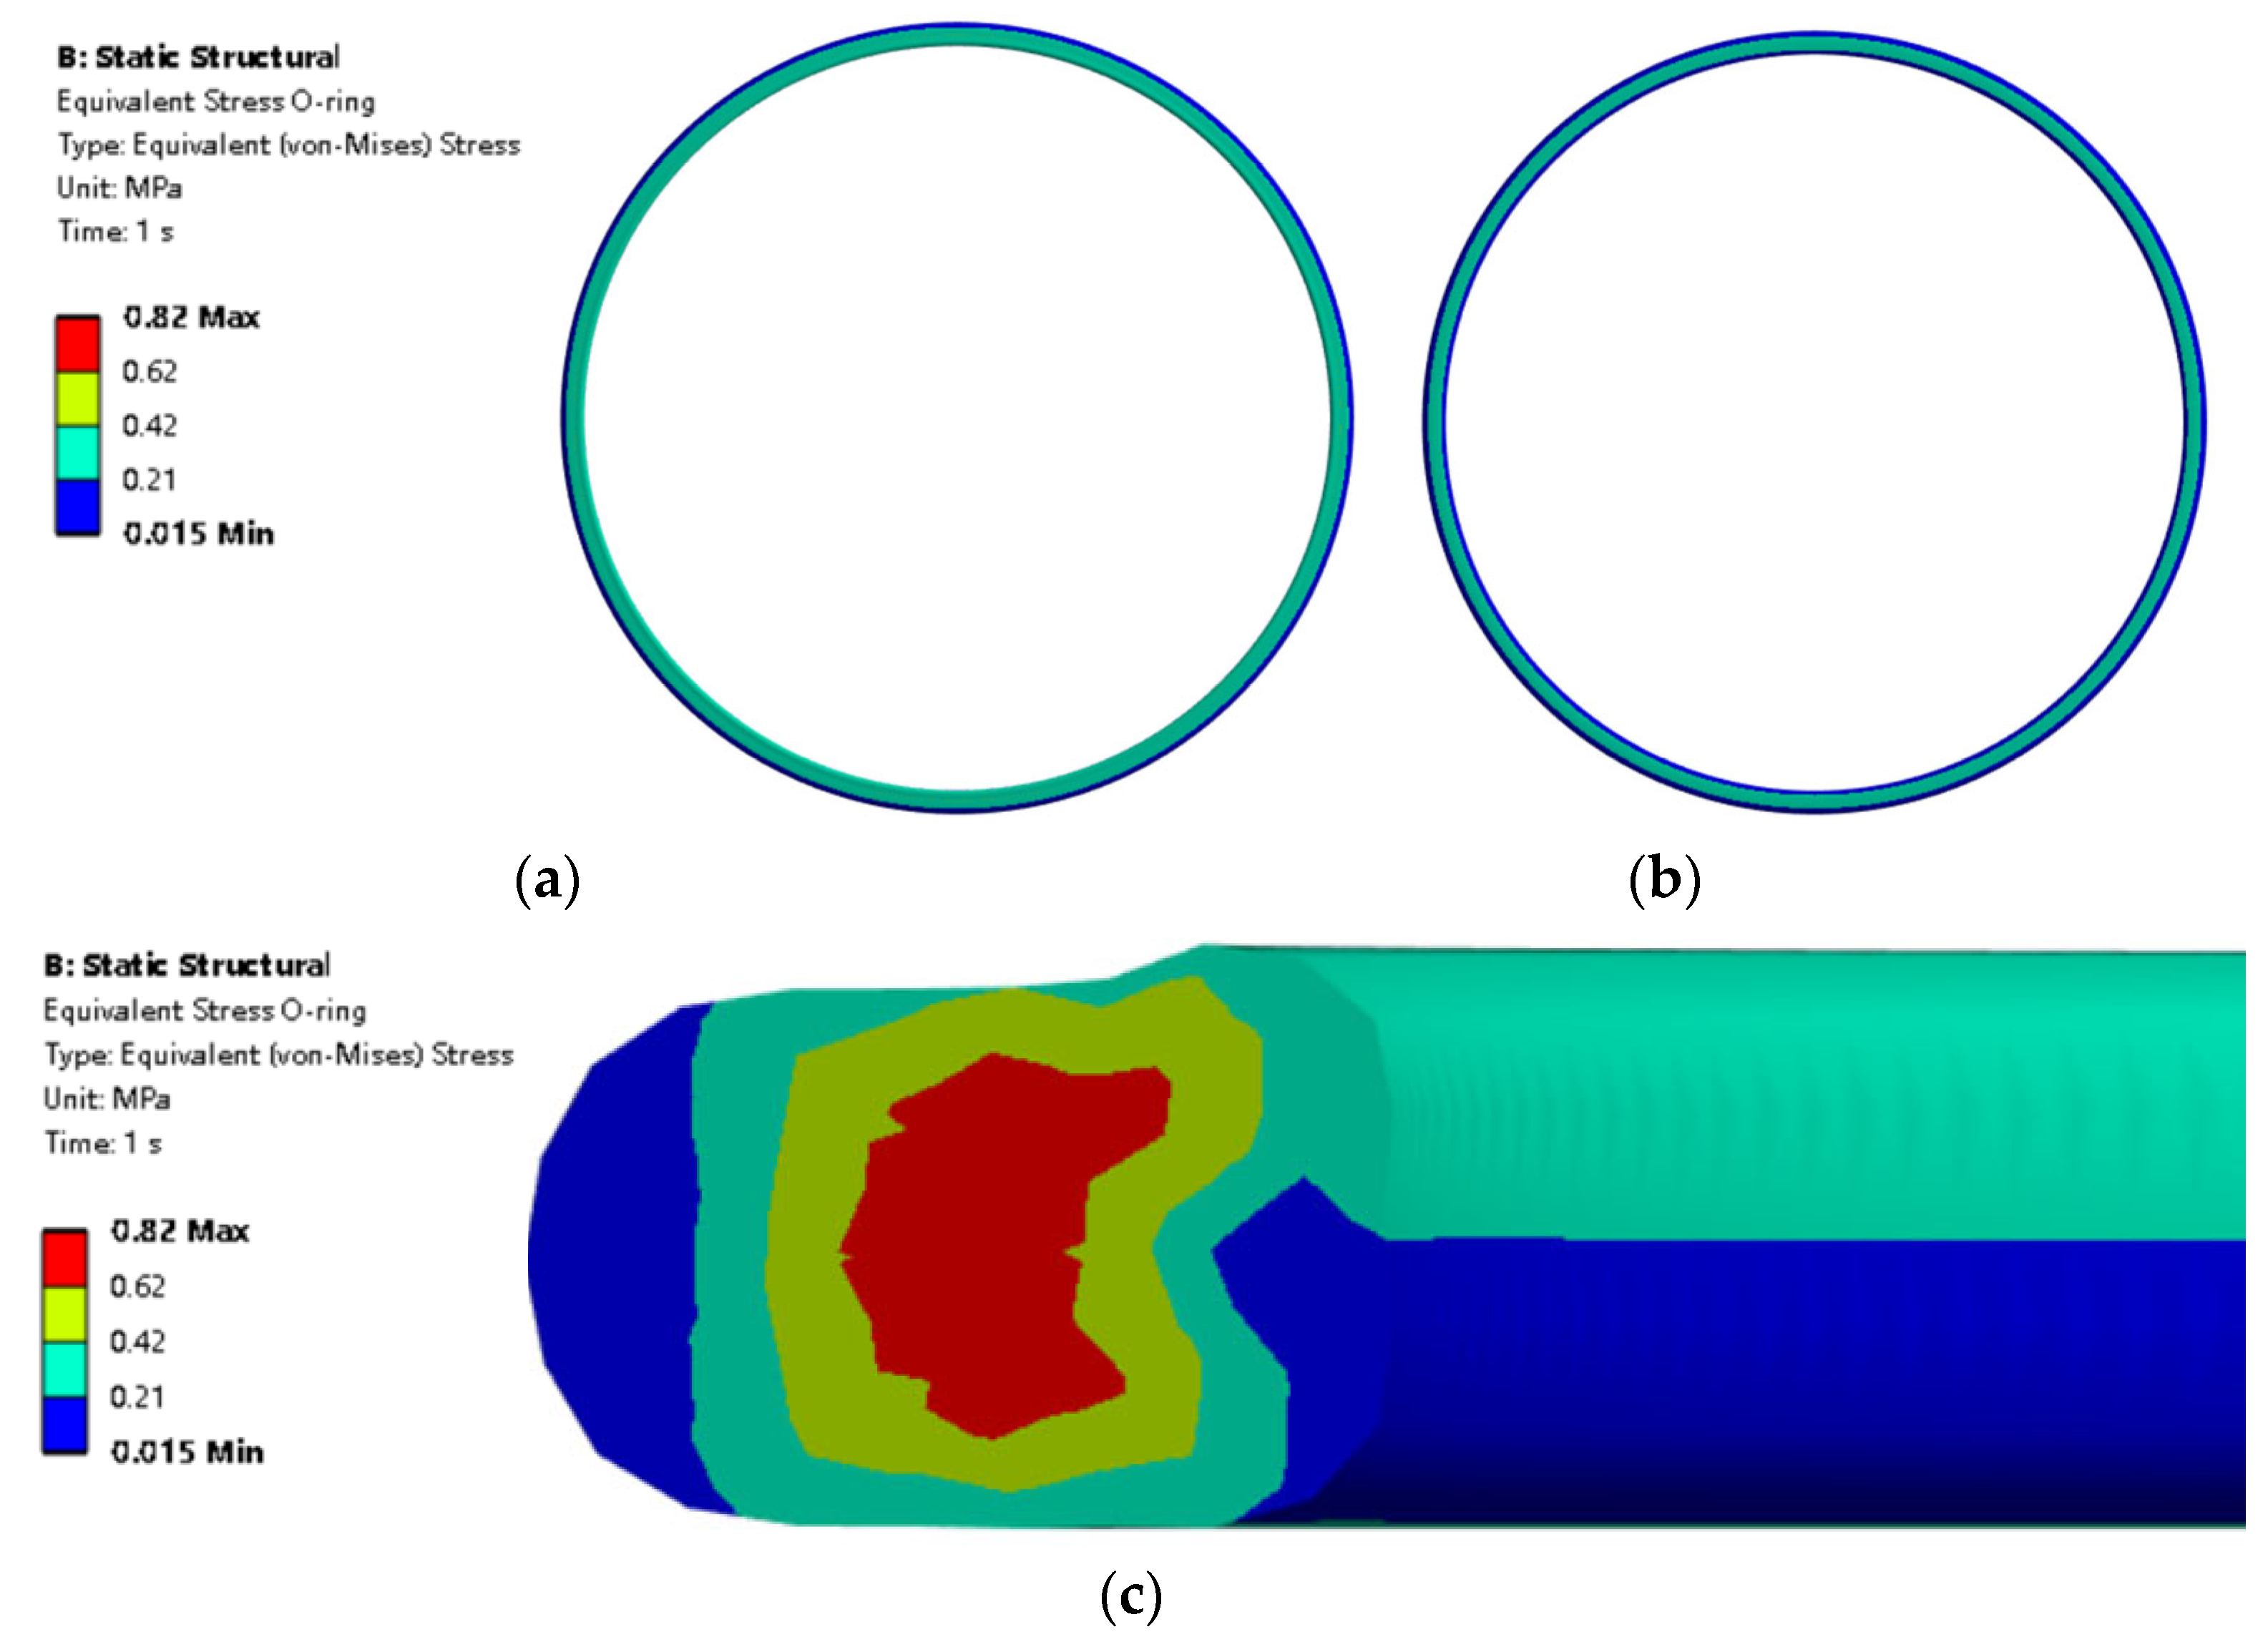
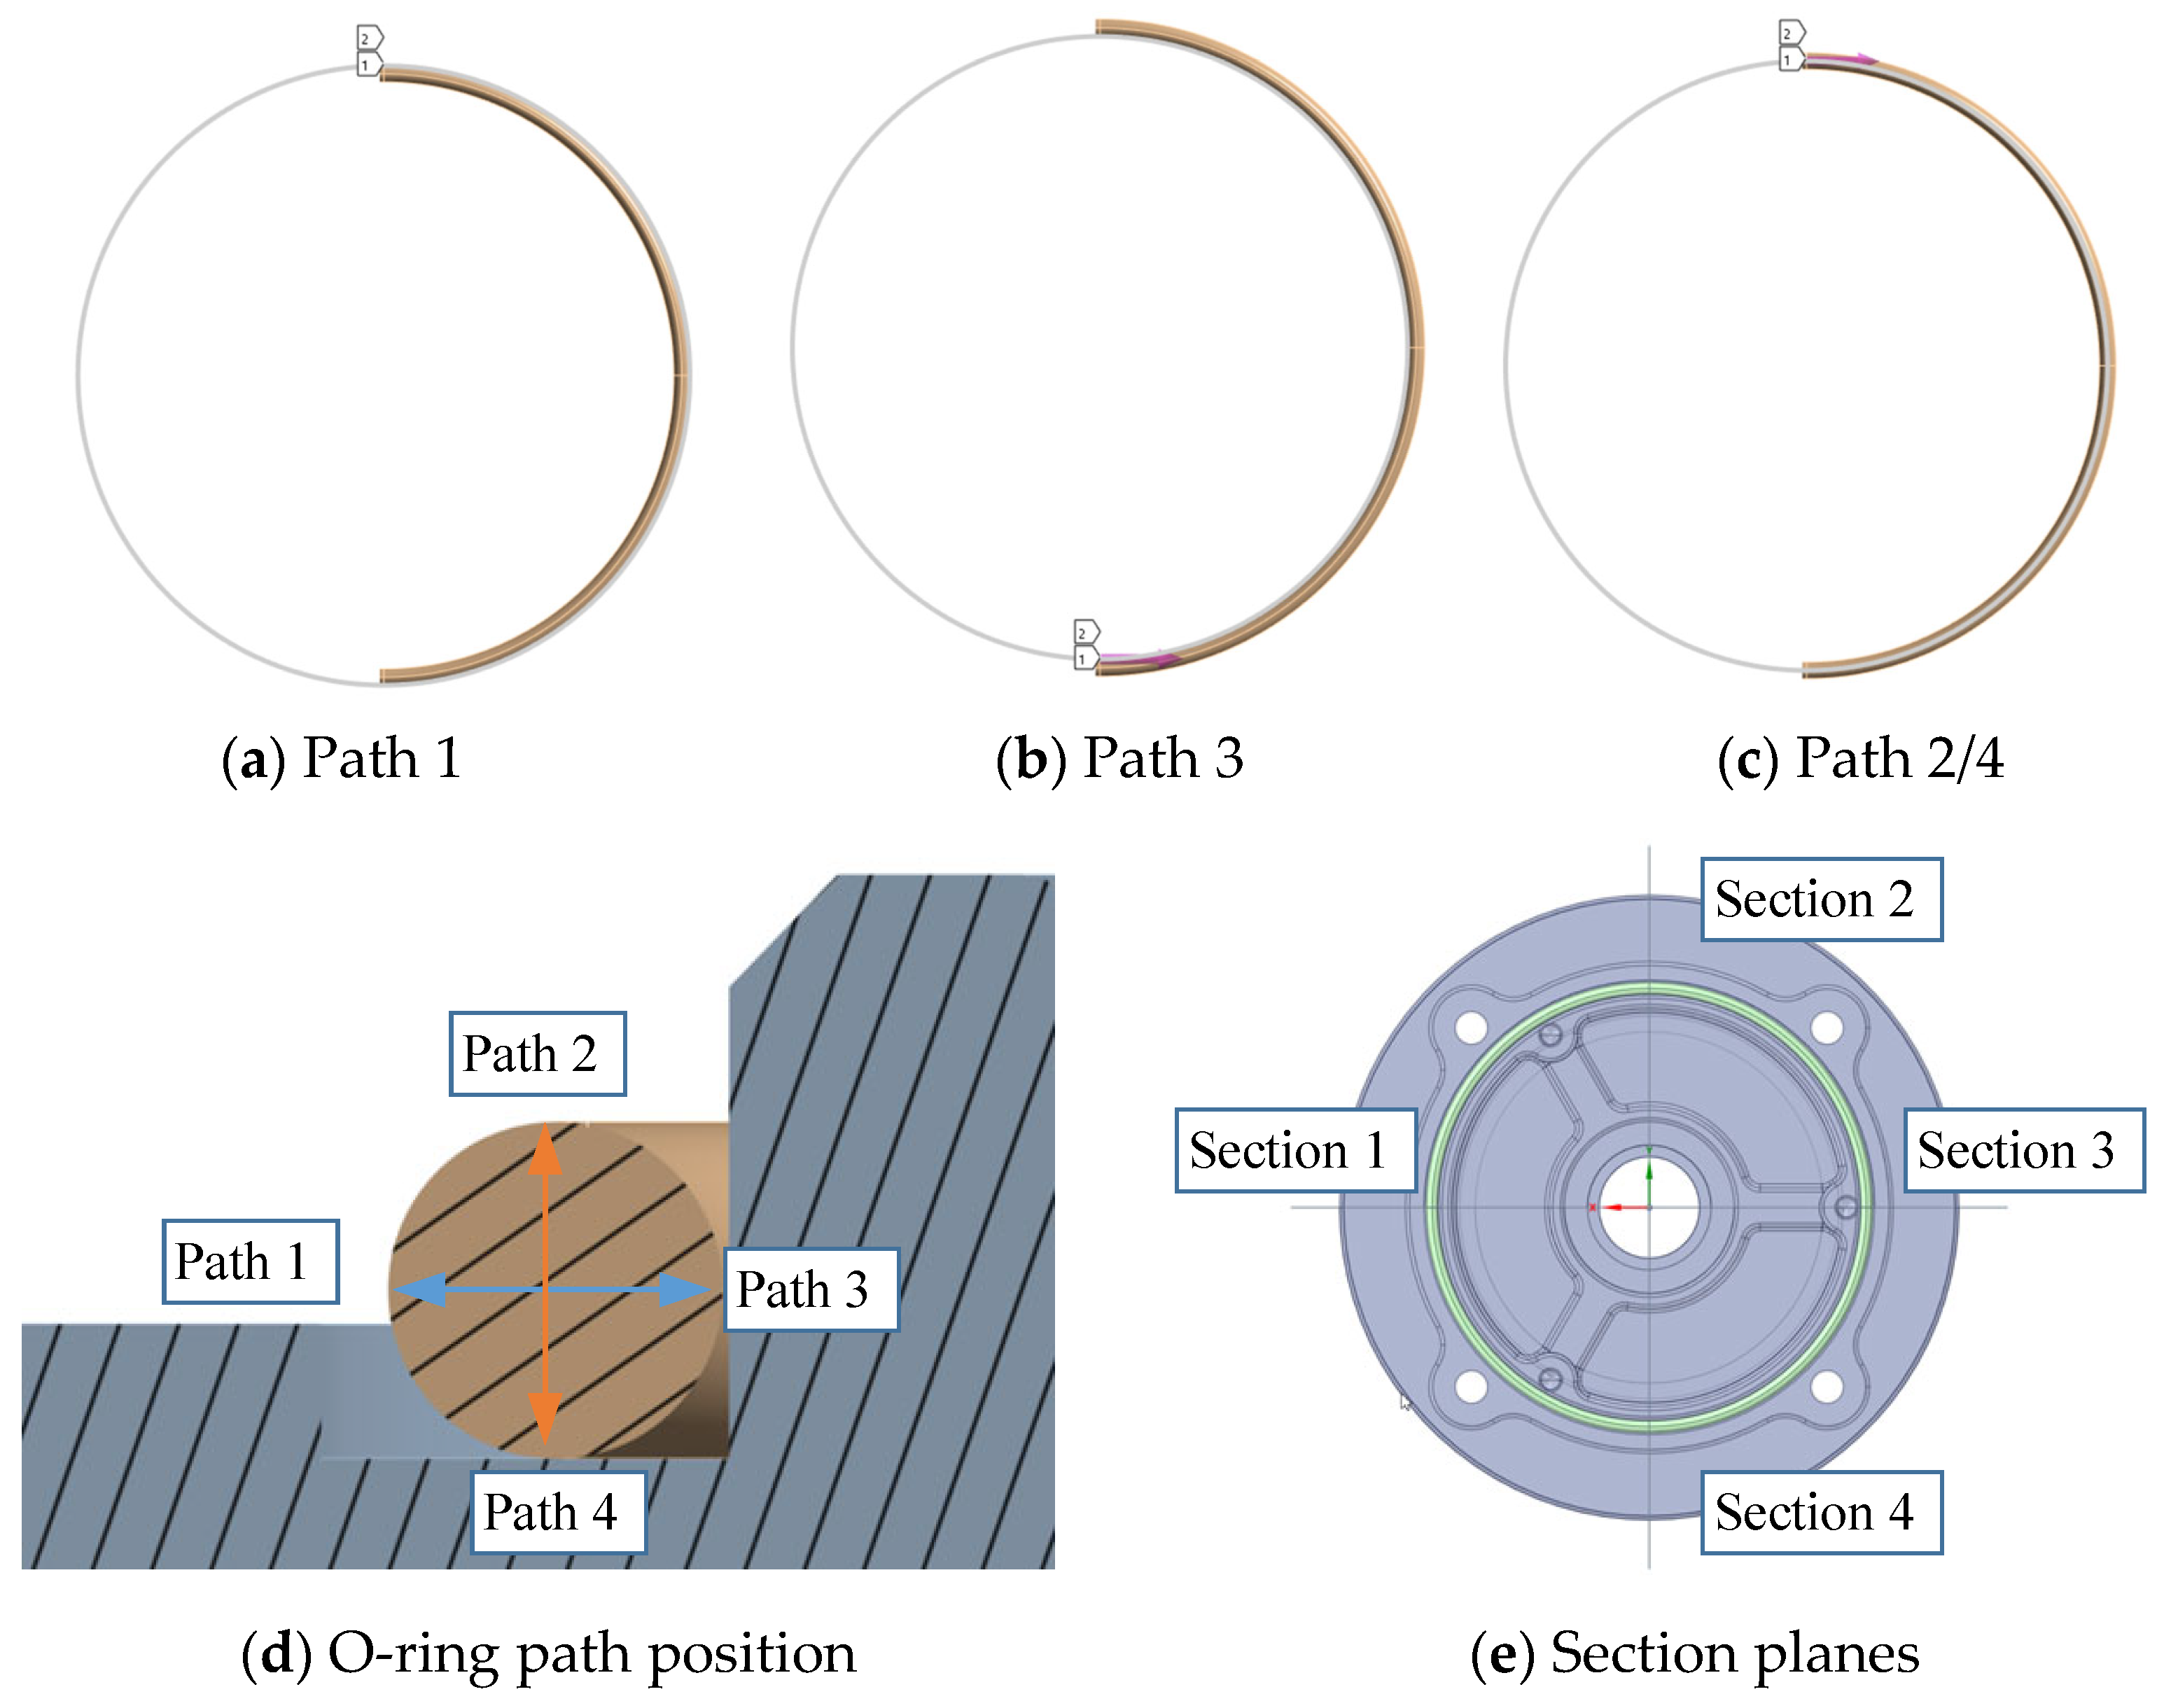
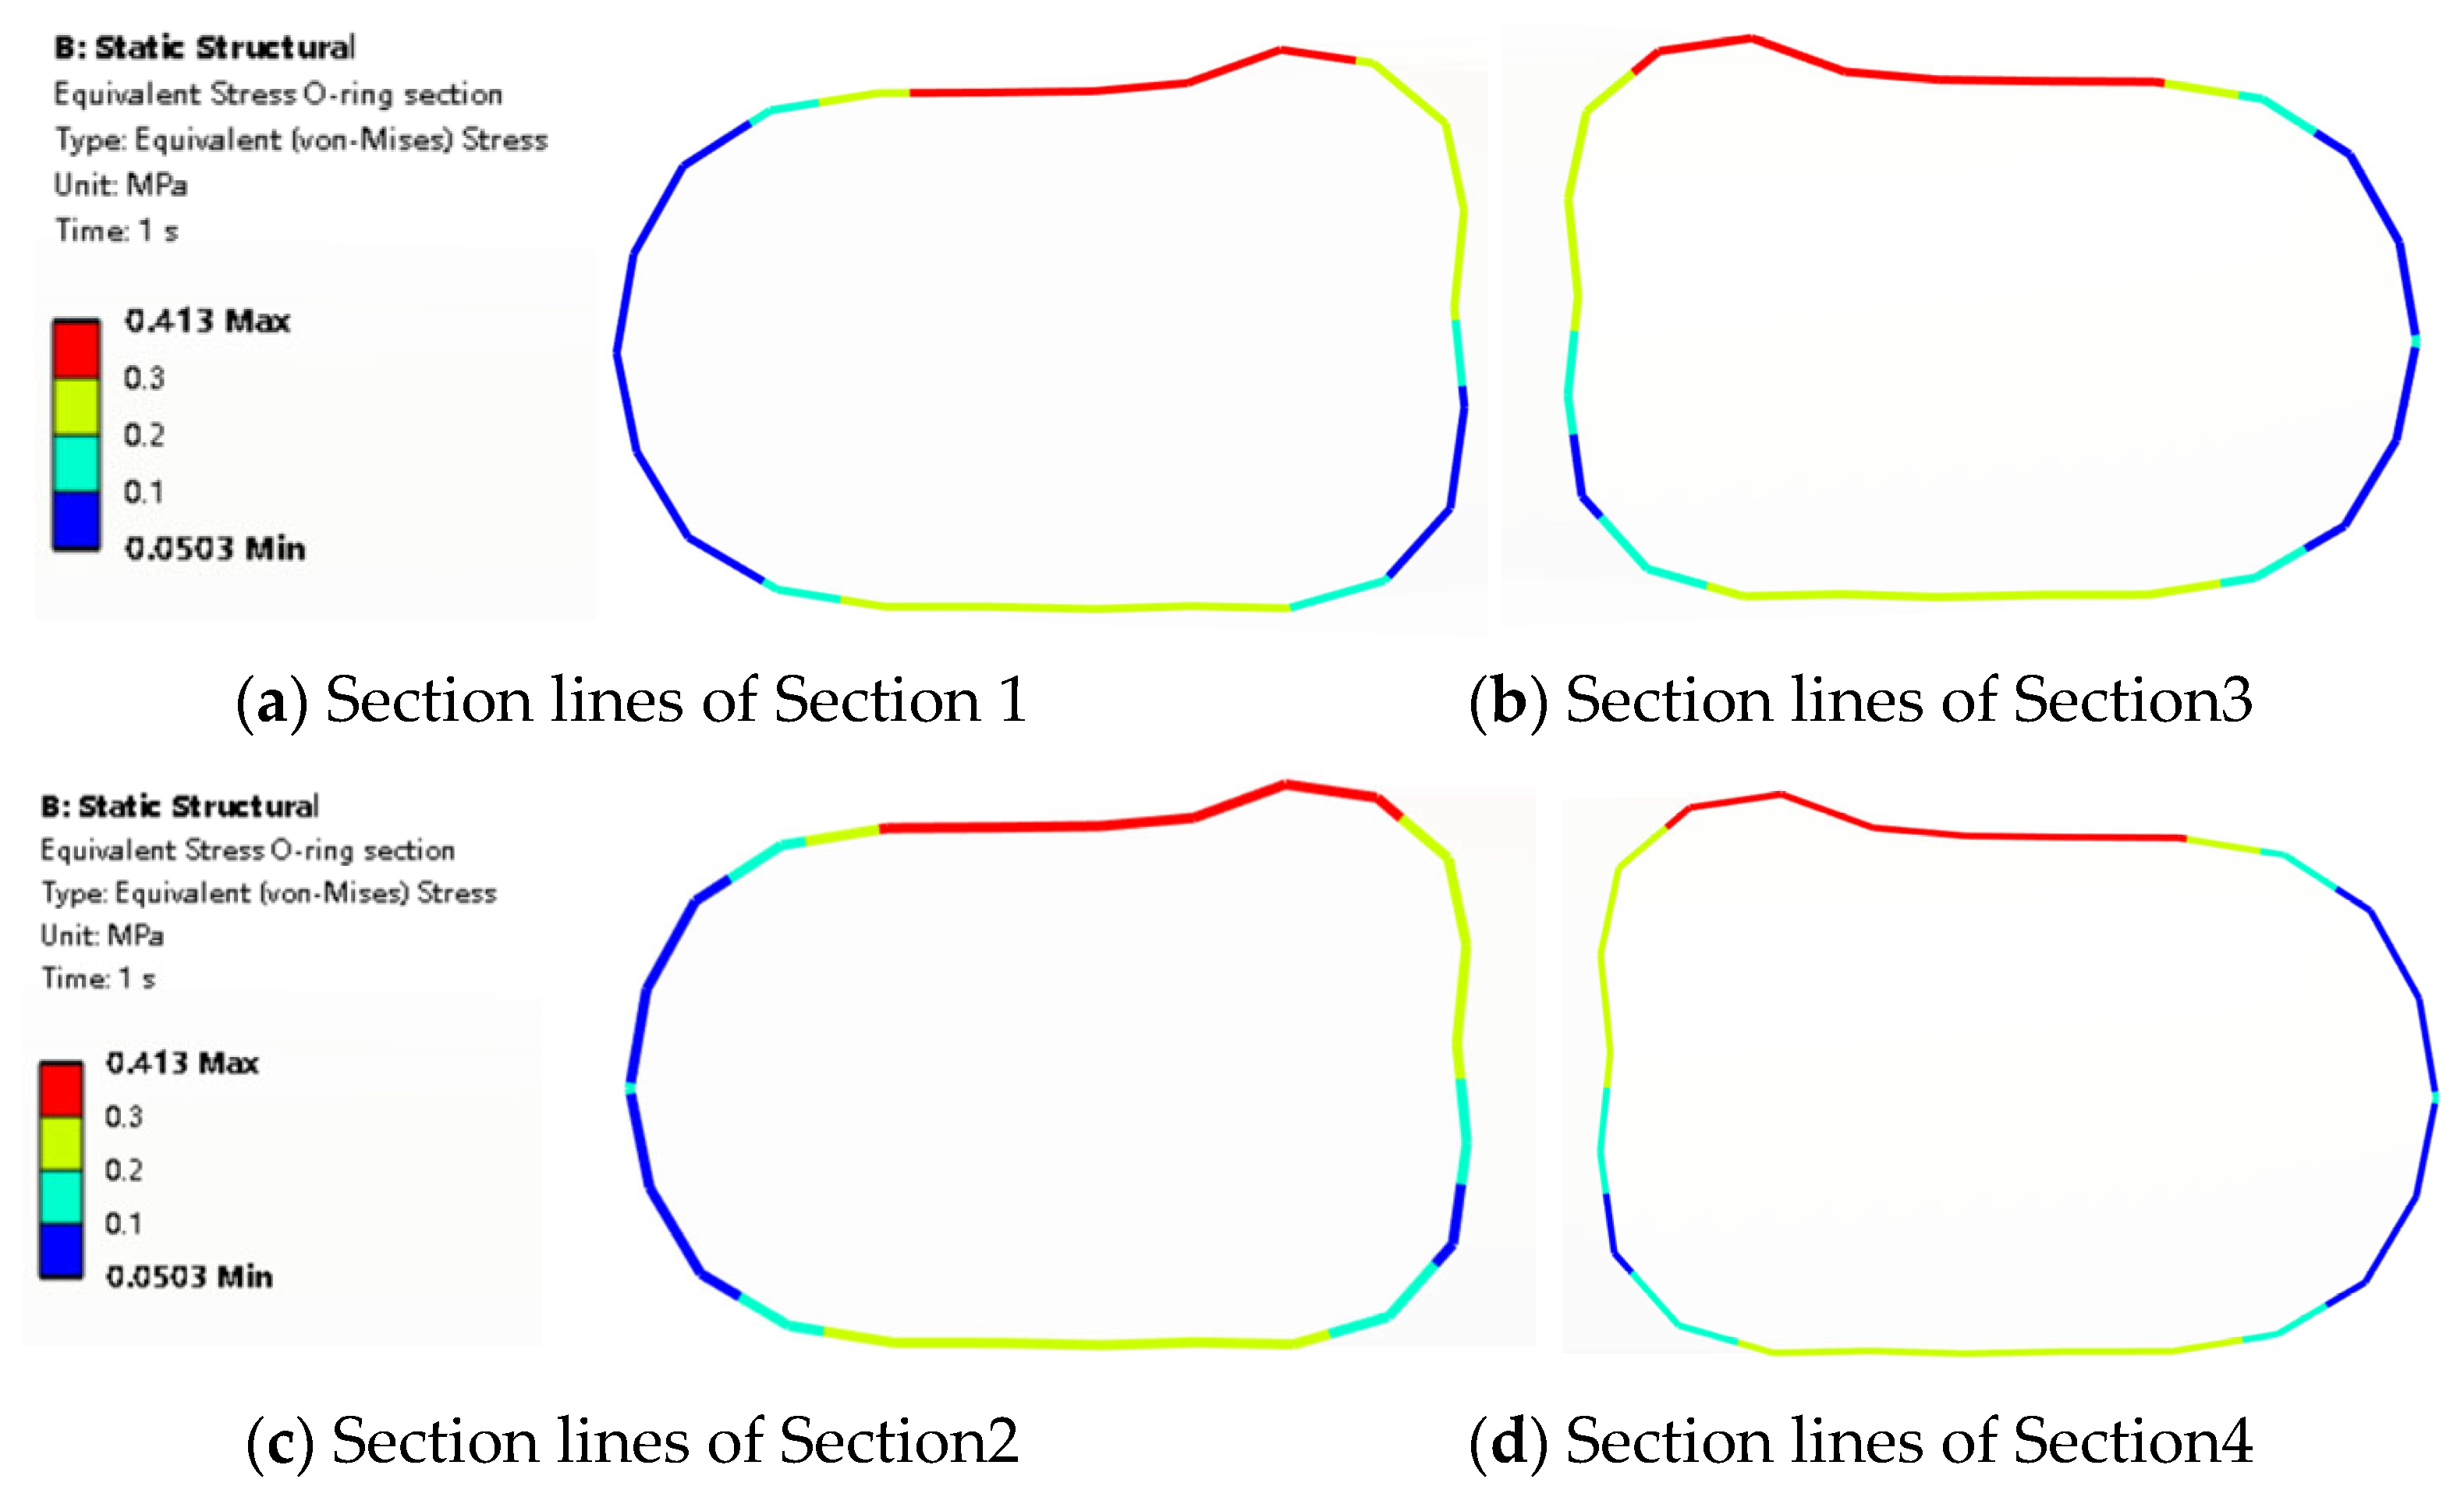
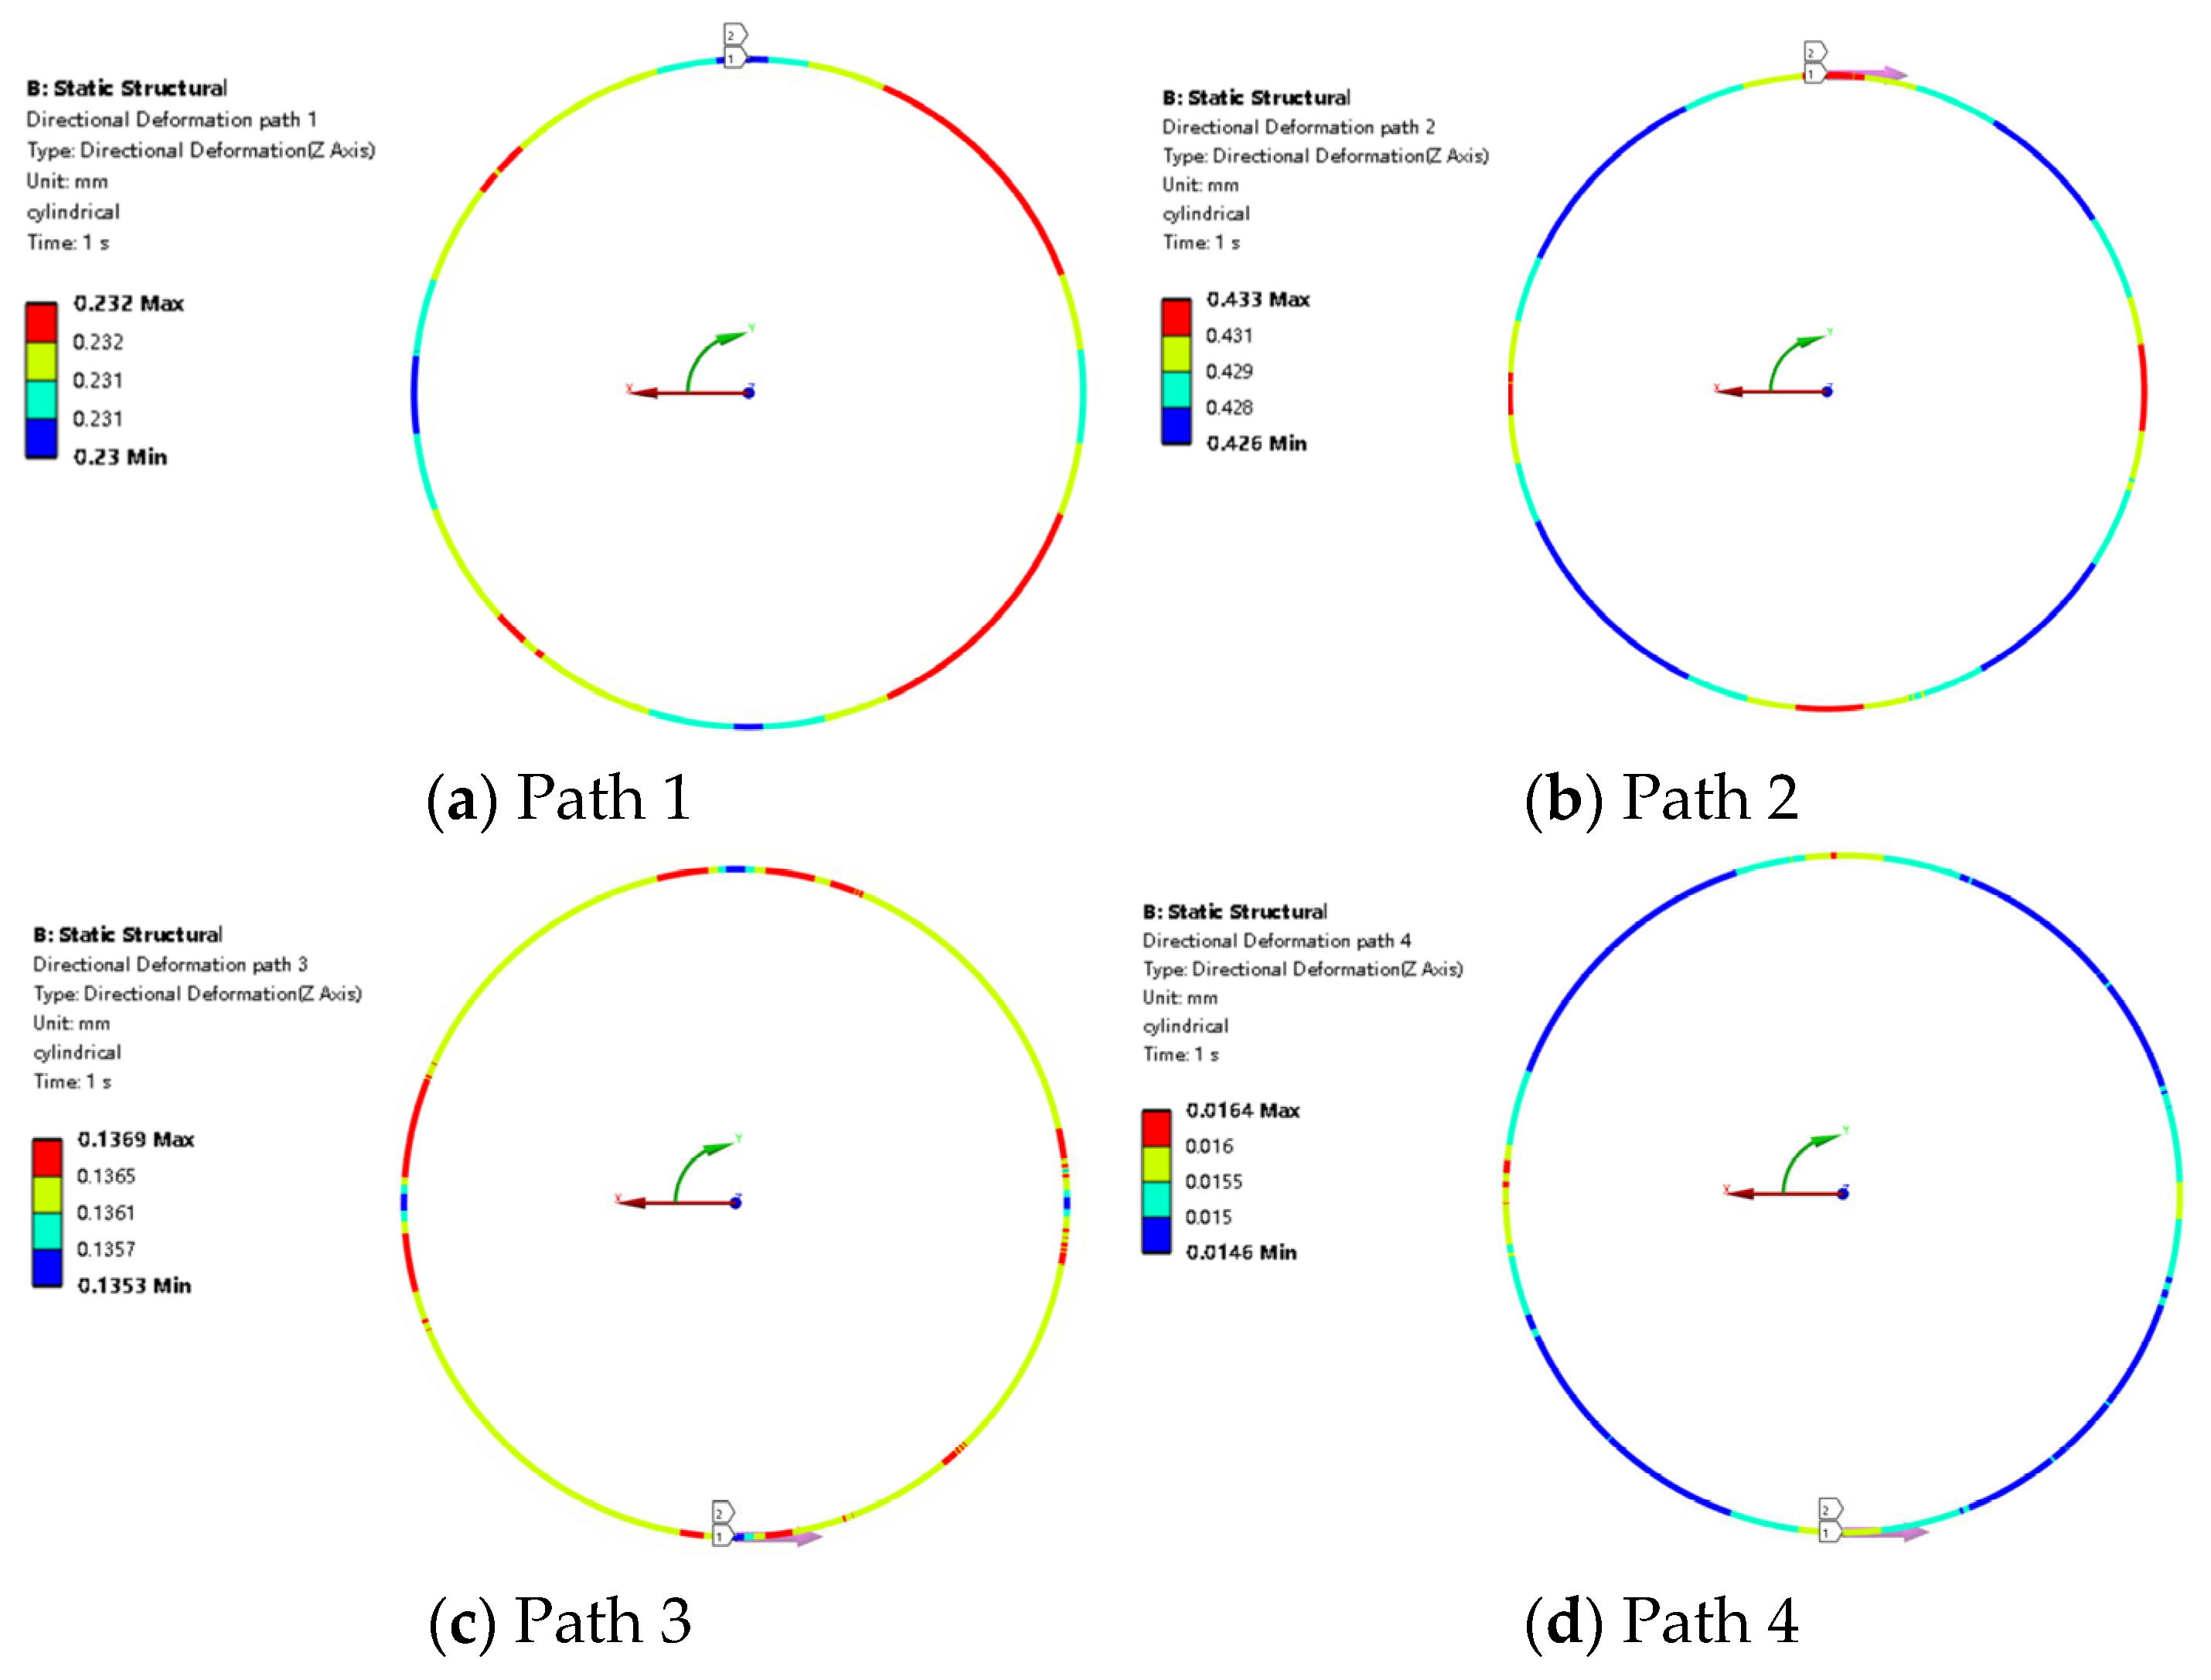
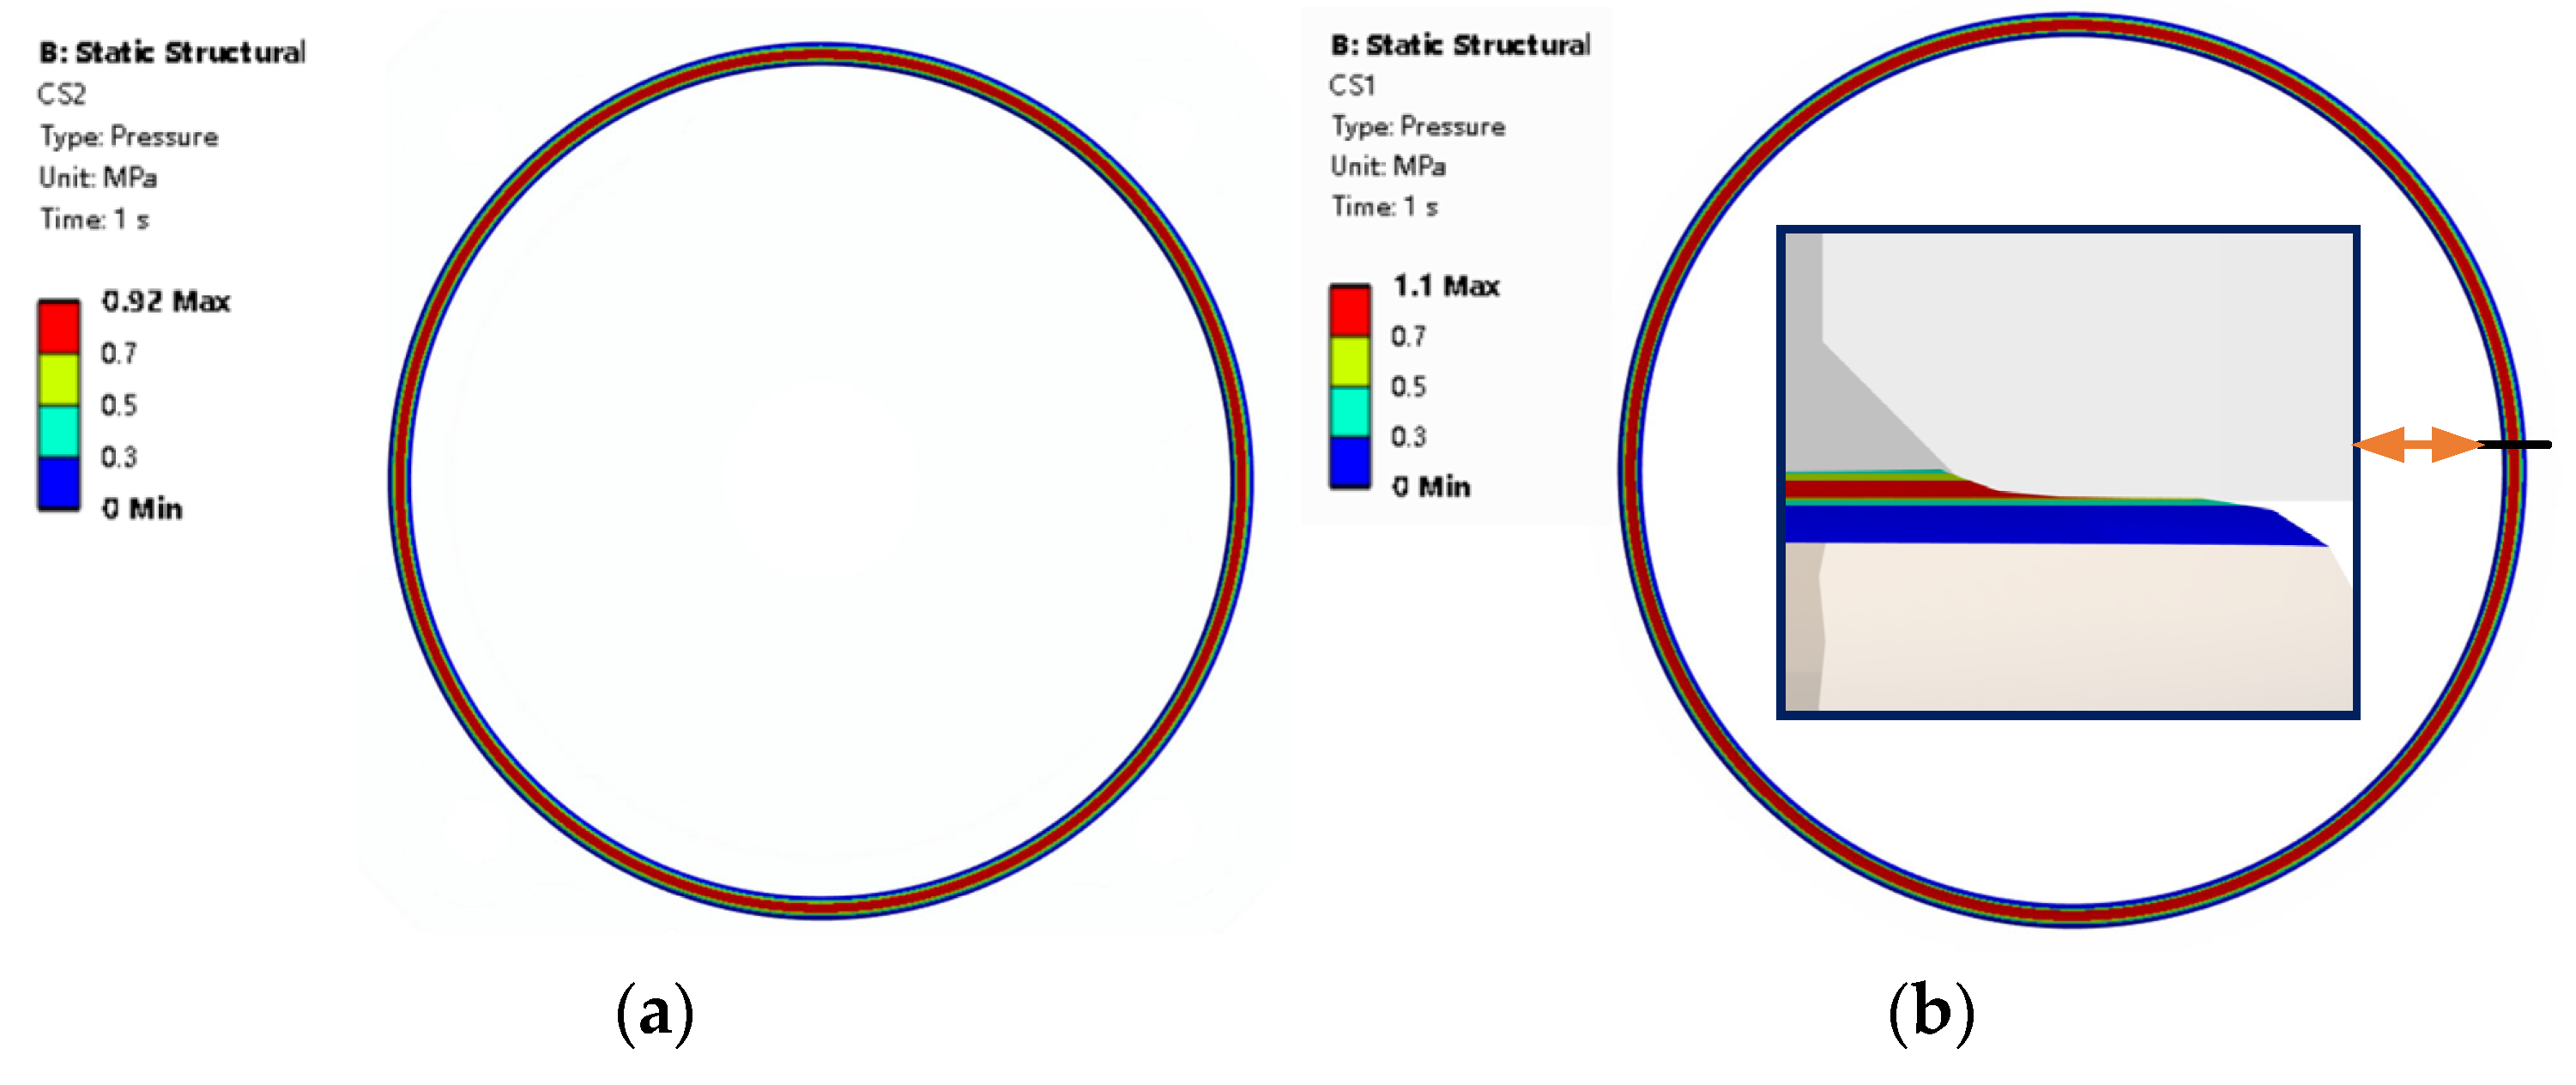
3.1.2. O-Ring Simulation Result
3.2. Experimental Verification
3.2.1. Friction Coefficient Test
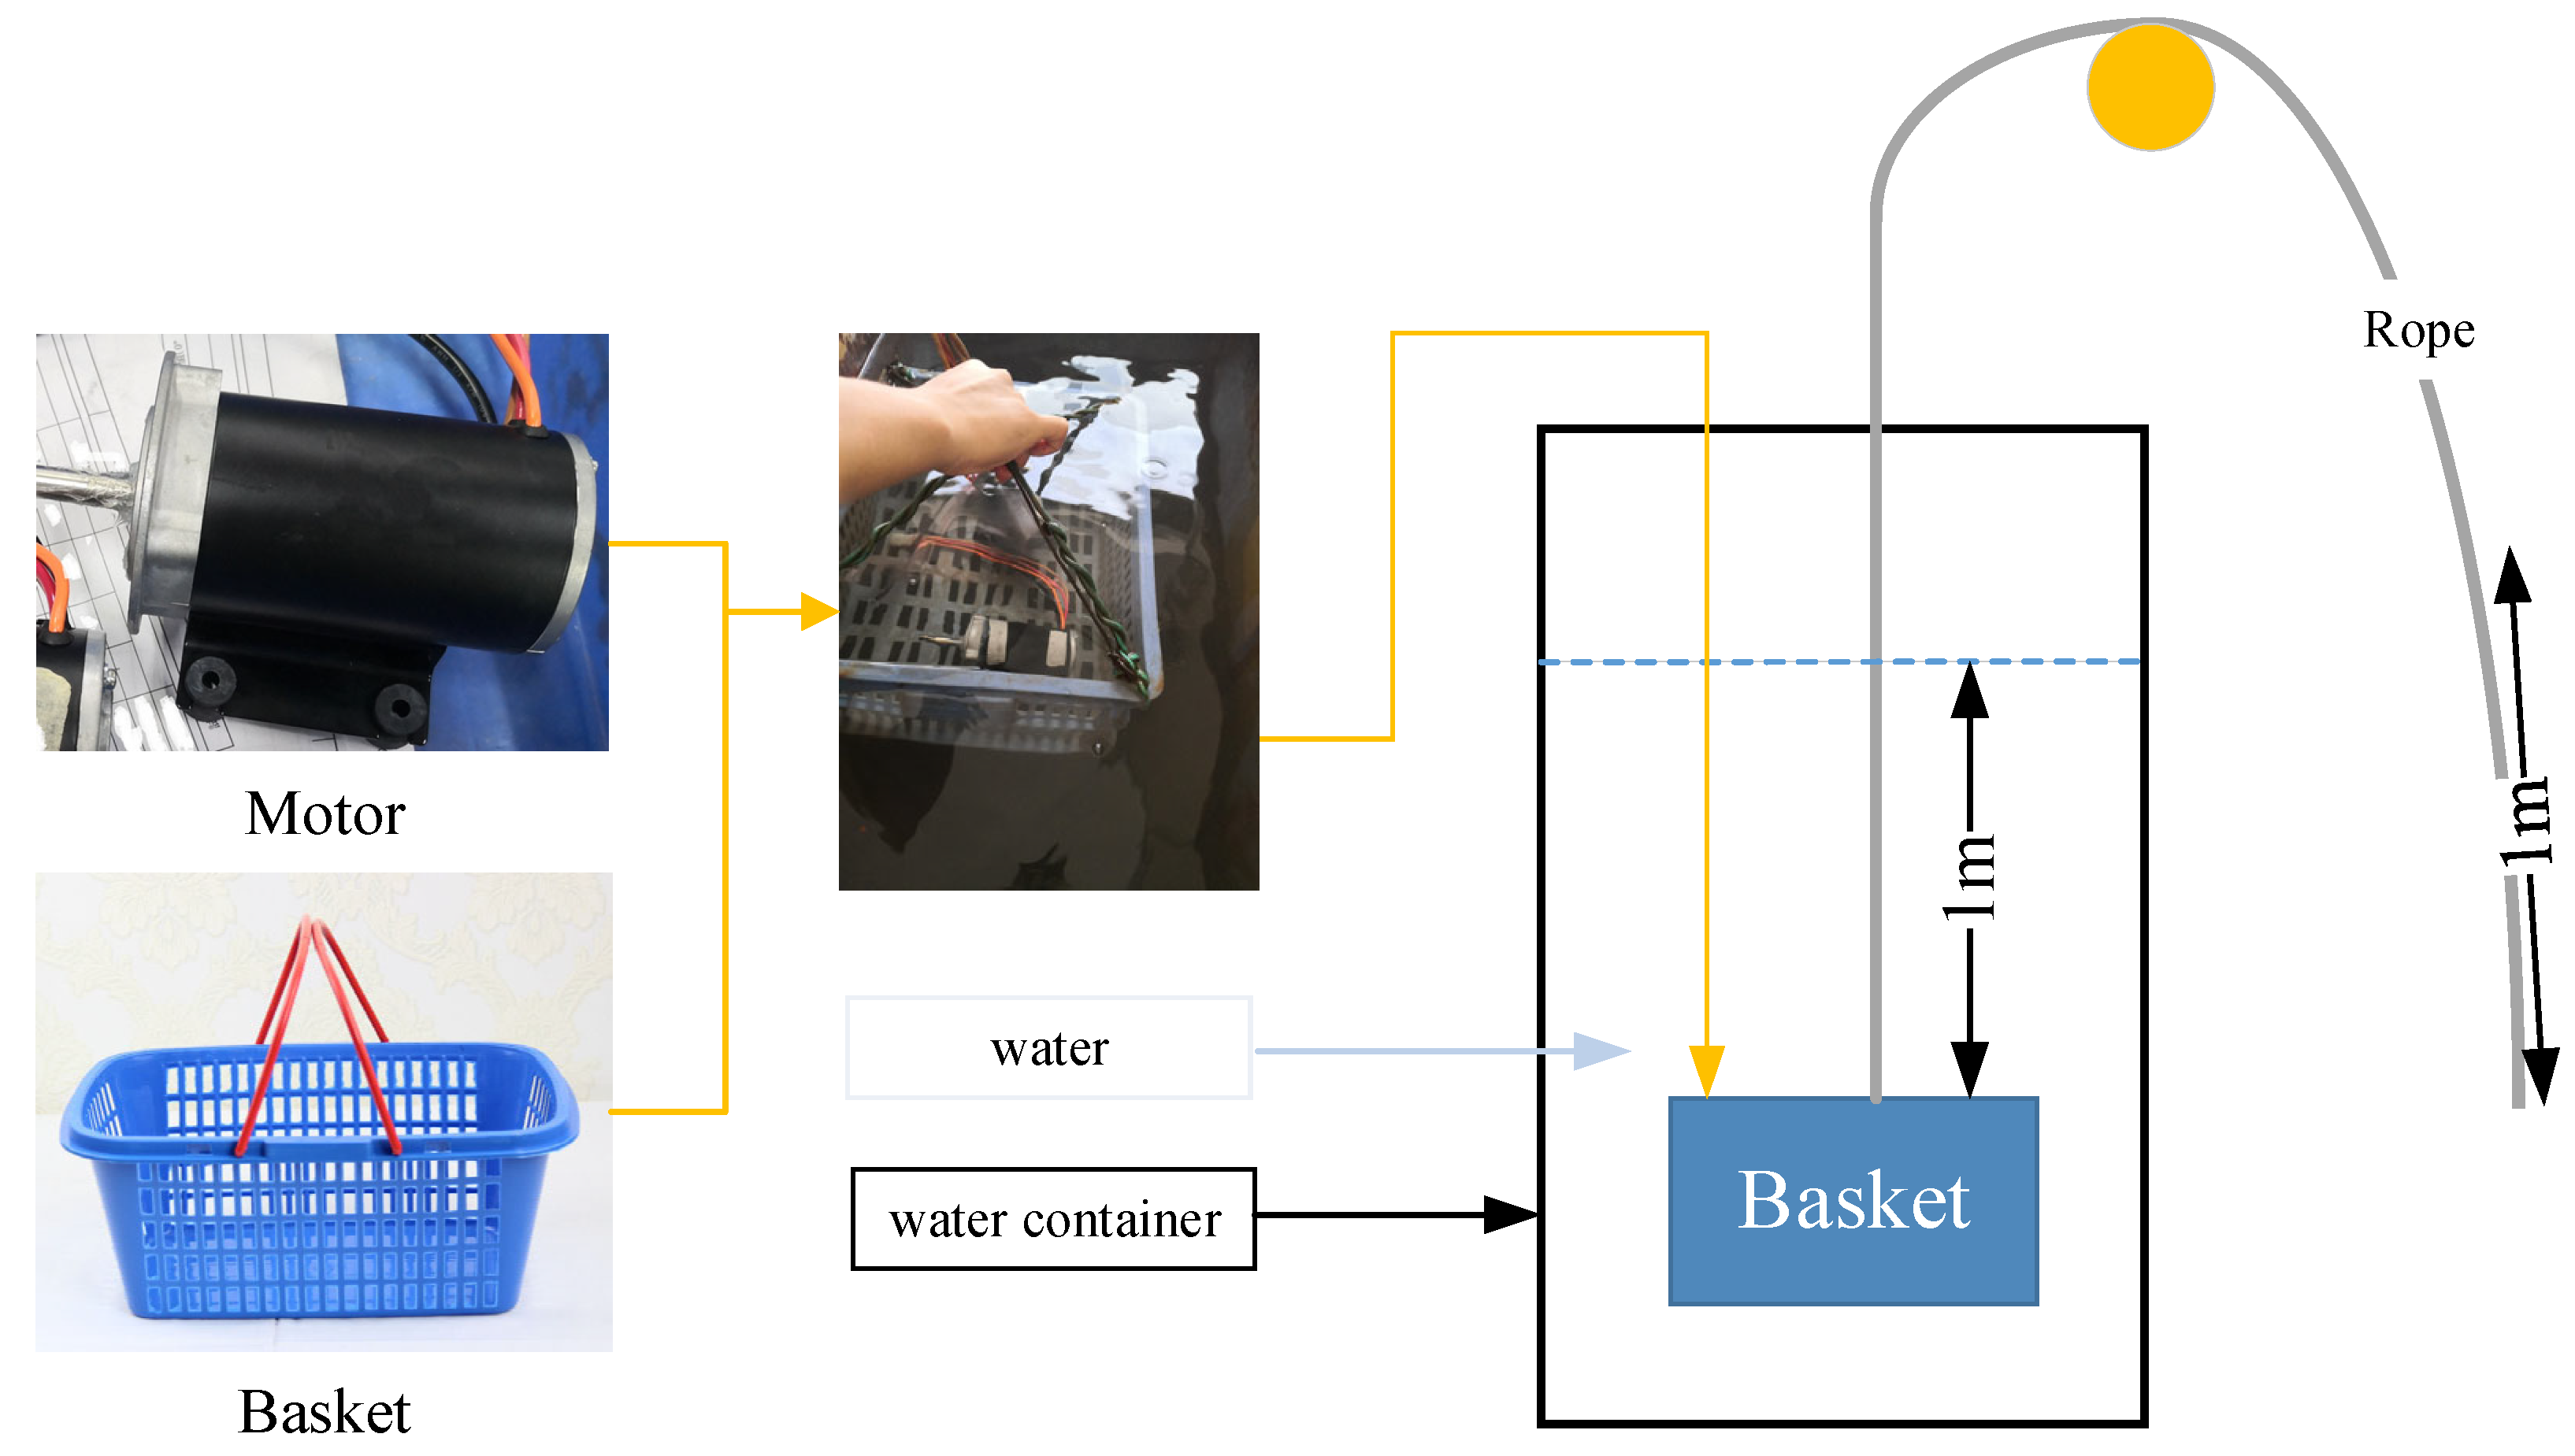
3.2.2. Waterproof Performance Test
4. Results and Discussion
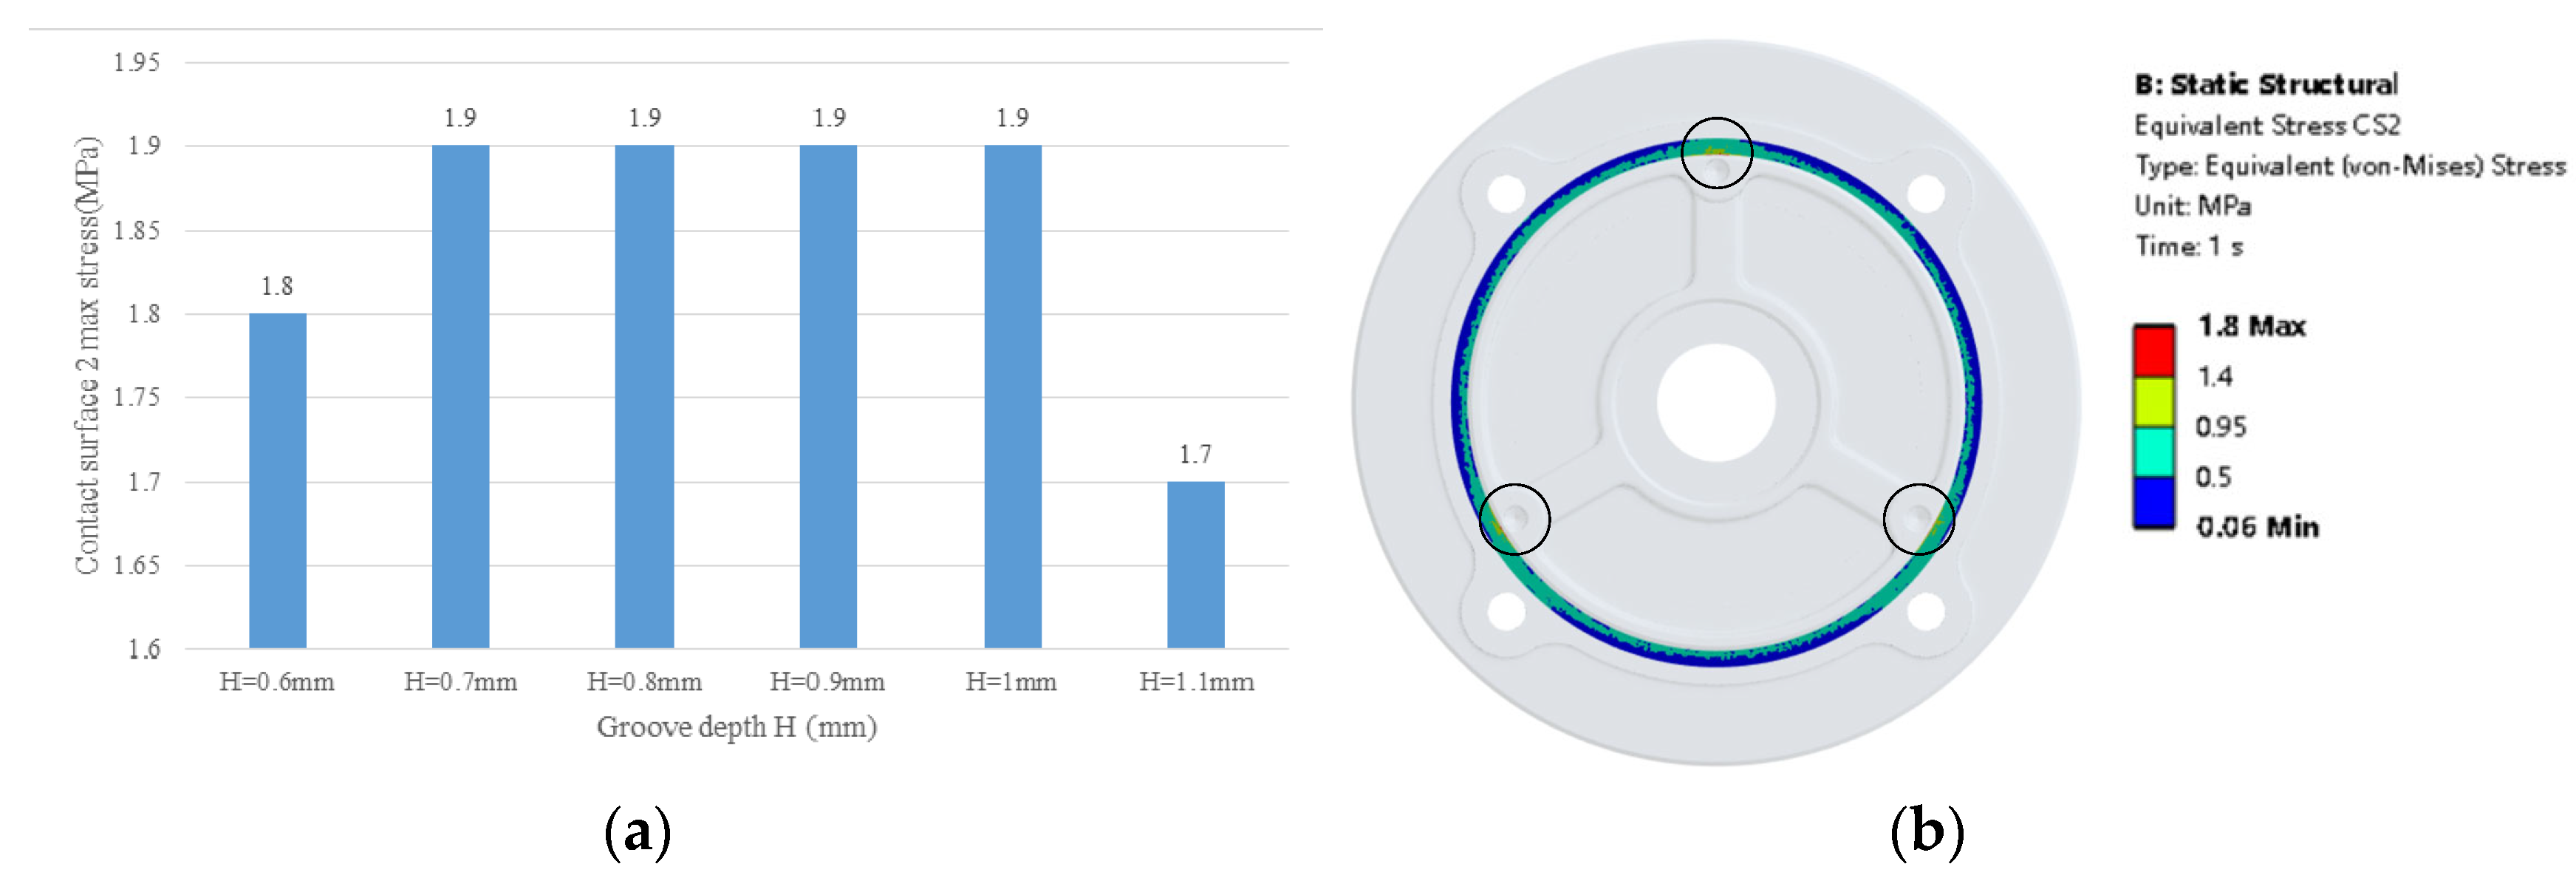
4.1. Influence of Groove Depth Parameters
4.2. Optimal Design by E-TOPSIS Method
4.3. Waterproof Experimental Verification
5. Conclusions
- (1)
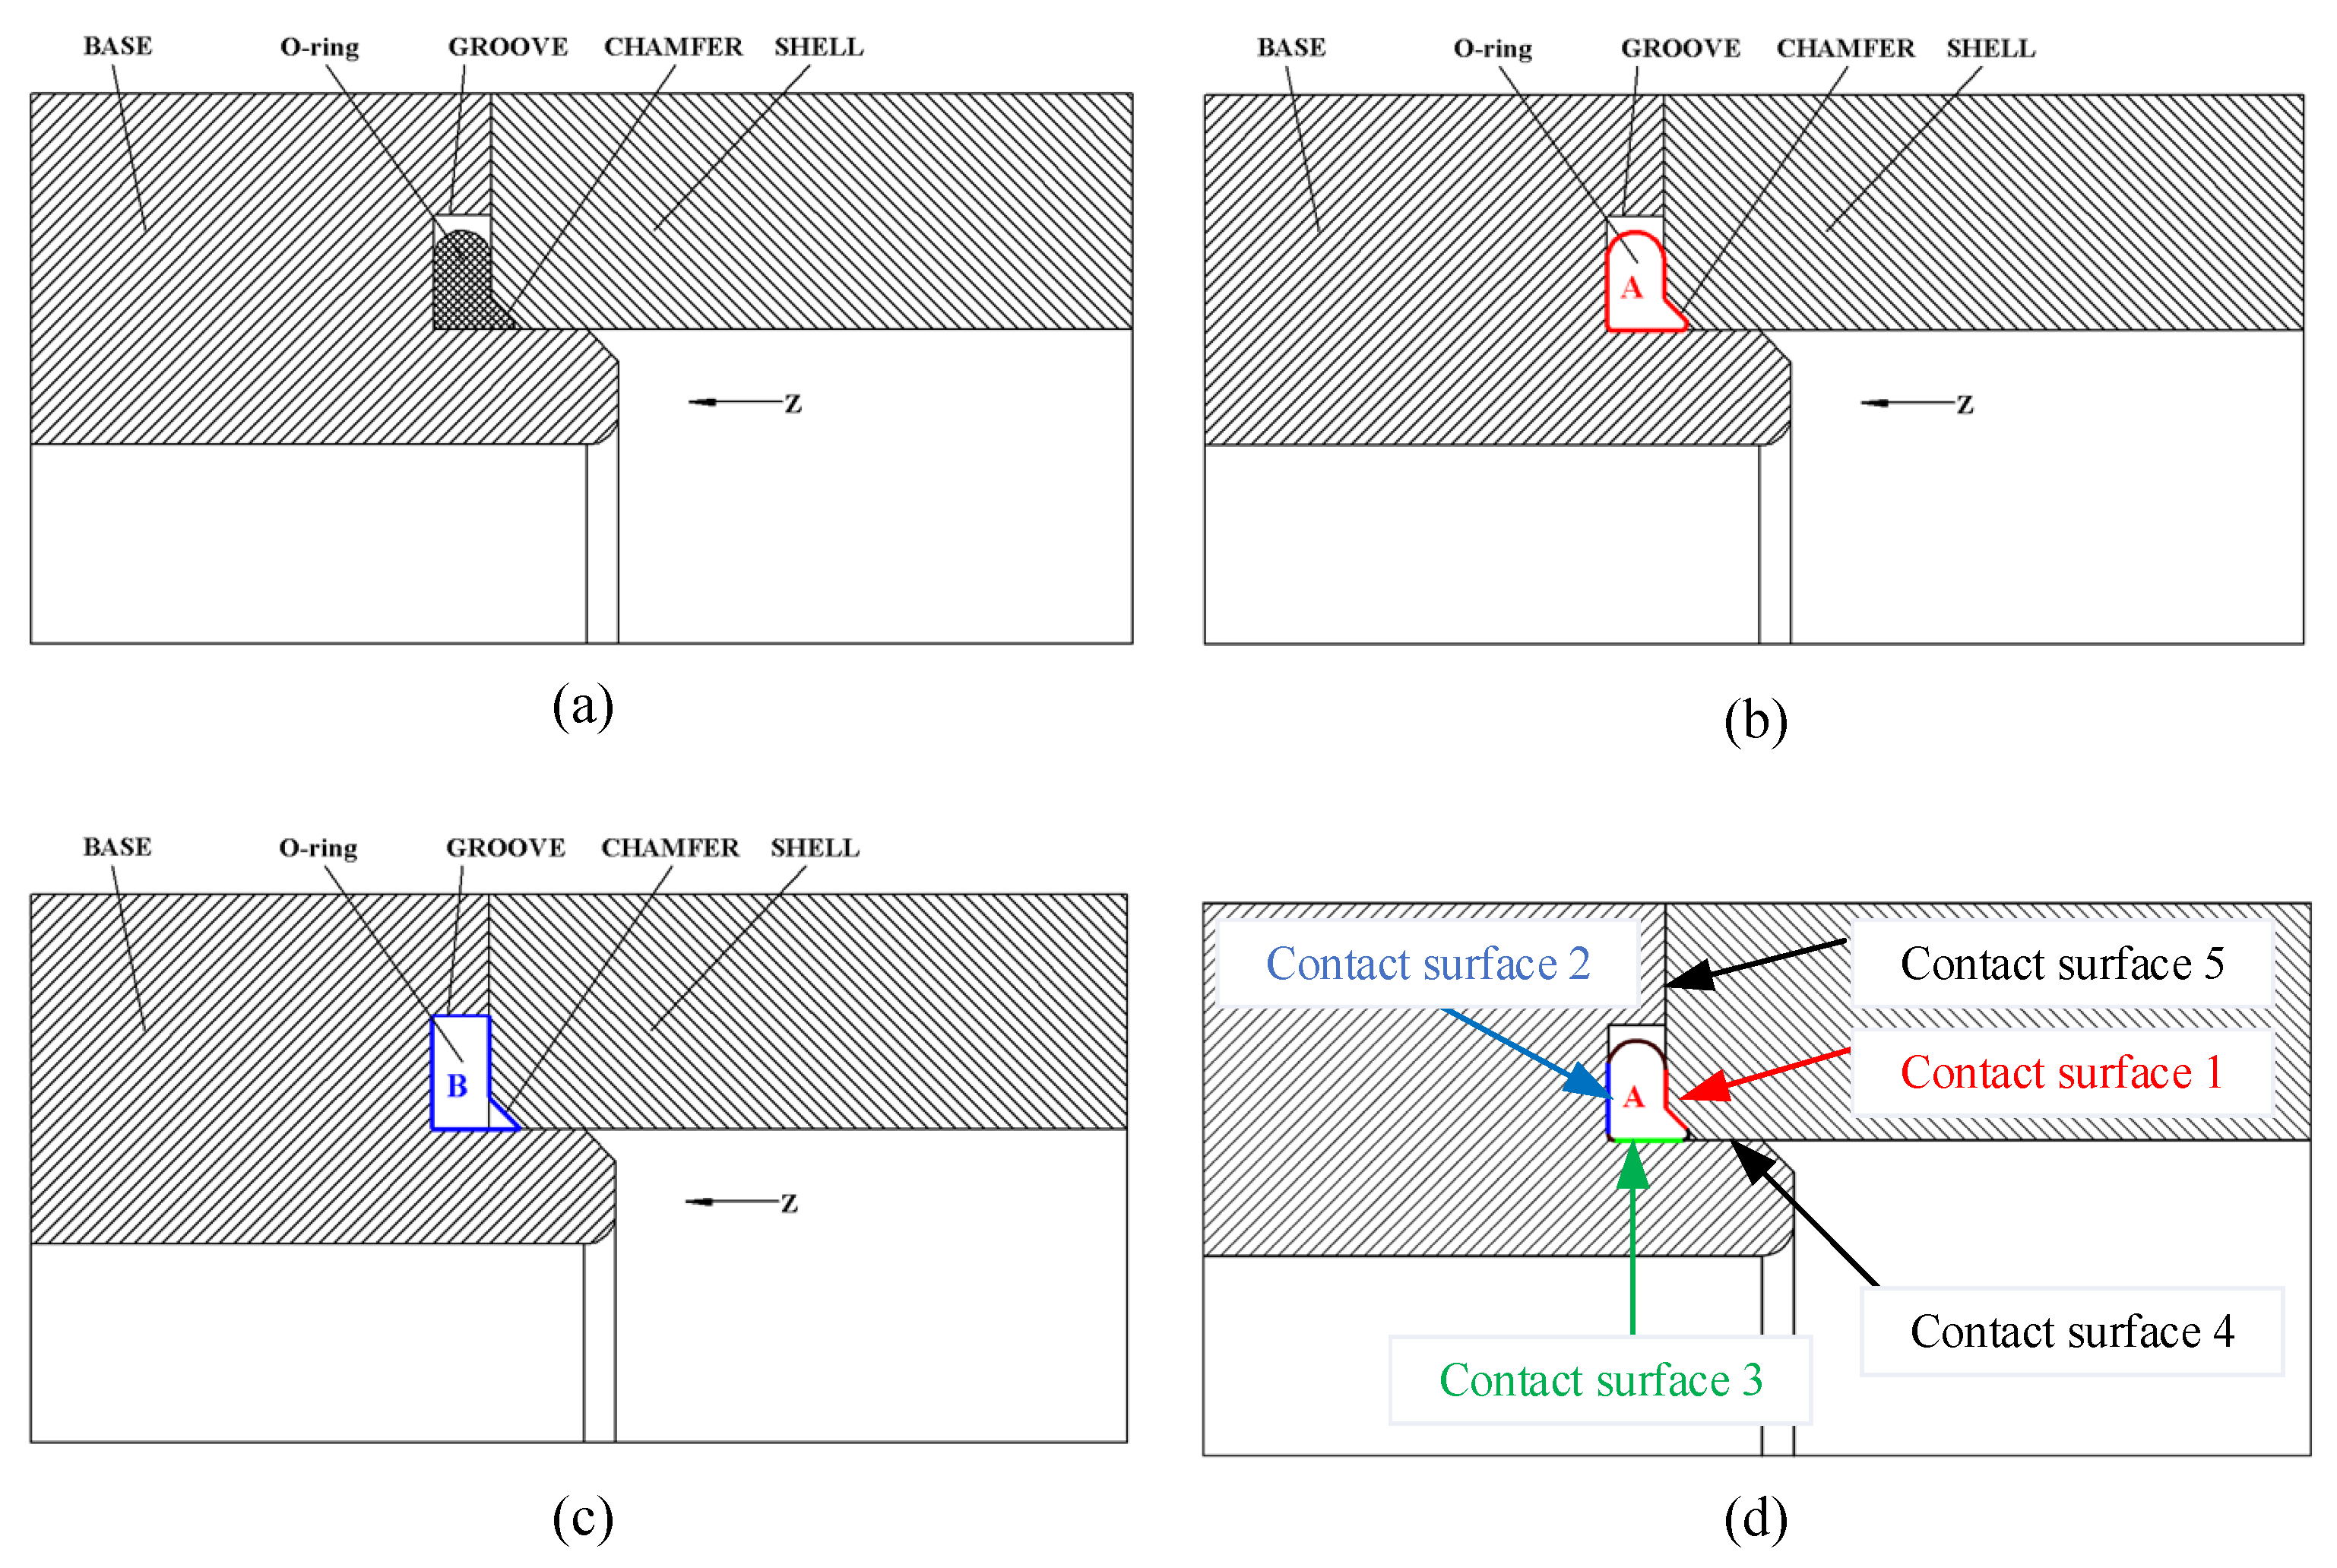
- The deformation distribution and contact pressure distribution of the rubber seal calculated in the 3D model are not exactly the same along the circumferential direction, which is different from the equal distribution mentioned in many papers [21,25,50,51,52]; thus, simplifying the model into a two-dimensional model is not a very accurate simulation in a certain condition, especially to those structures which are not consistent along the circumference direction. It is not recommended to use the two-dimensional simplification method for asymmetric geometric shapes. The O-ring stress of contact surface 1 side is larger than that of contact surface 2 side, which means materials in this area are more likely to be damaged than in other areas.
- (2)
- In this study, the technique for order preference by similarity to the ideal solution (TOPSIS) method is introduced to order the optimal solutions. It is concluded that when the diameter of the O-ring is 1.5 mm, the optimal groove depth is 0.9 mm. The proportional relationship between the diameter D of the O-ring and the optimal groove depth can be extended to H = 0.6 D. This method of analyzing the influence of parameter changes on the O-ring seal performance can reduce test time and improve the economy and timeliness of the O-ring seal design.
- (3)
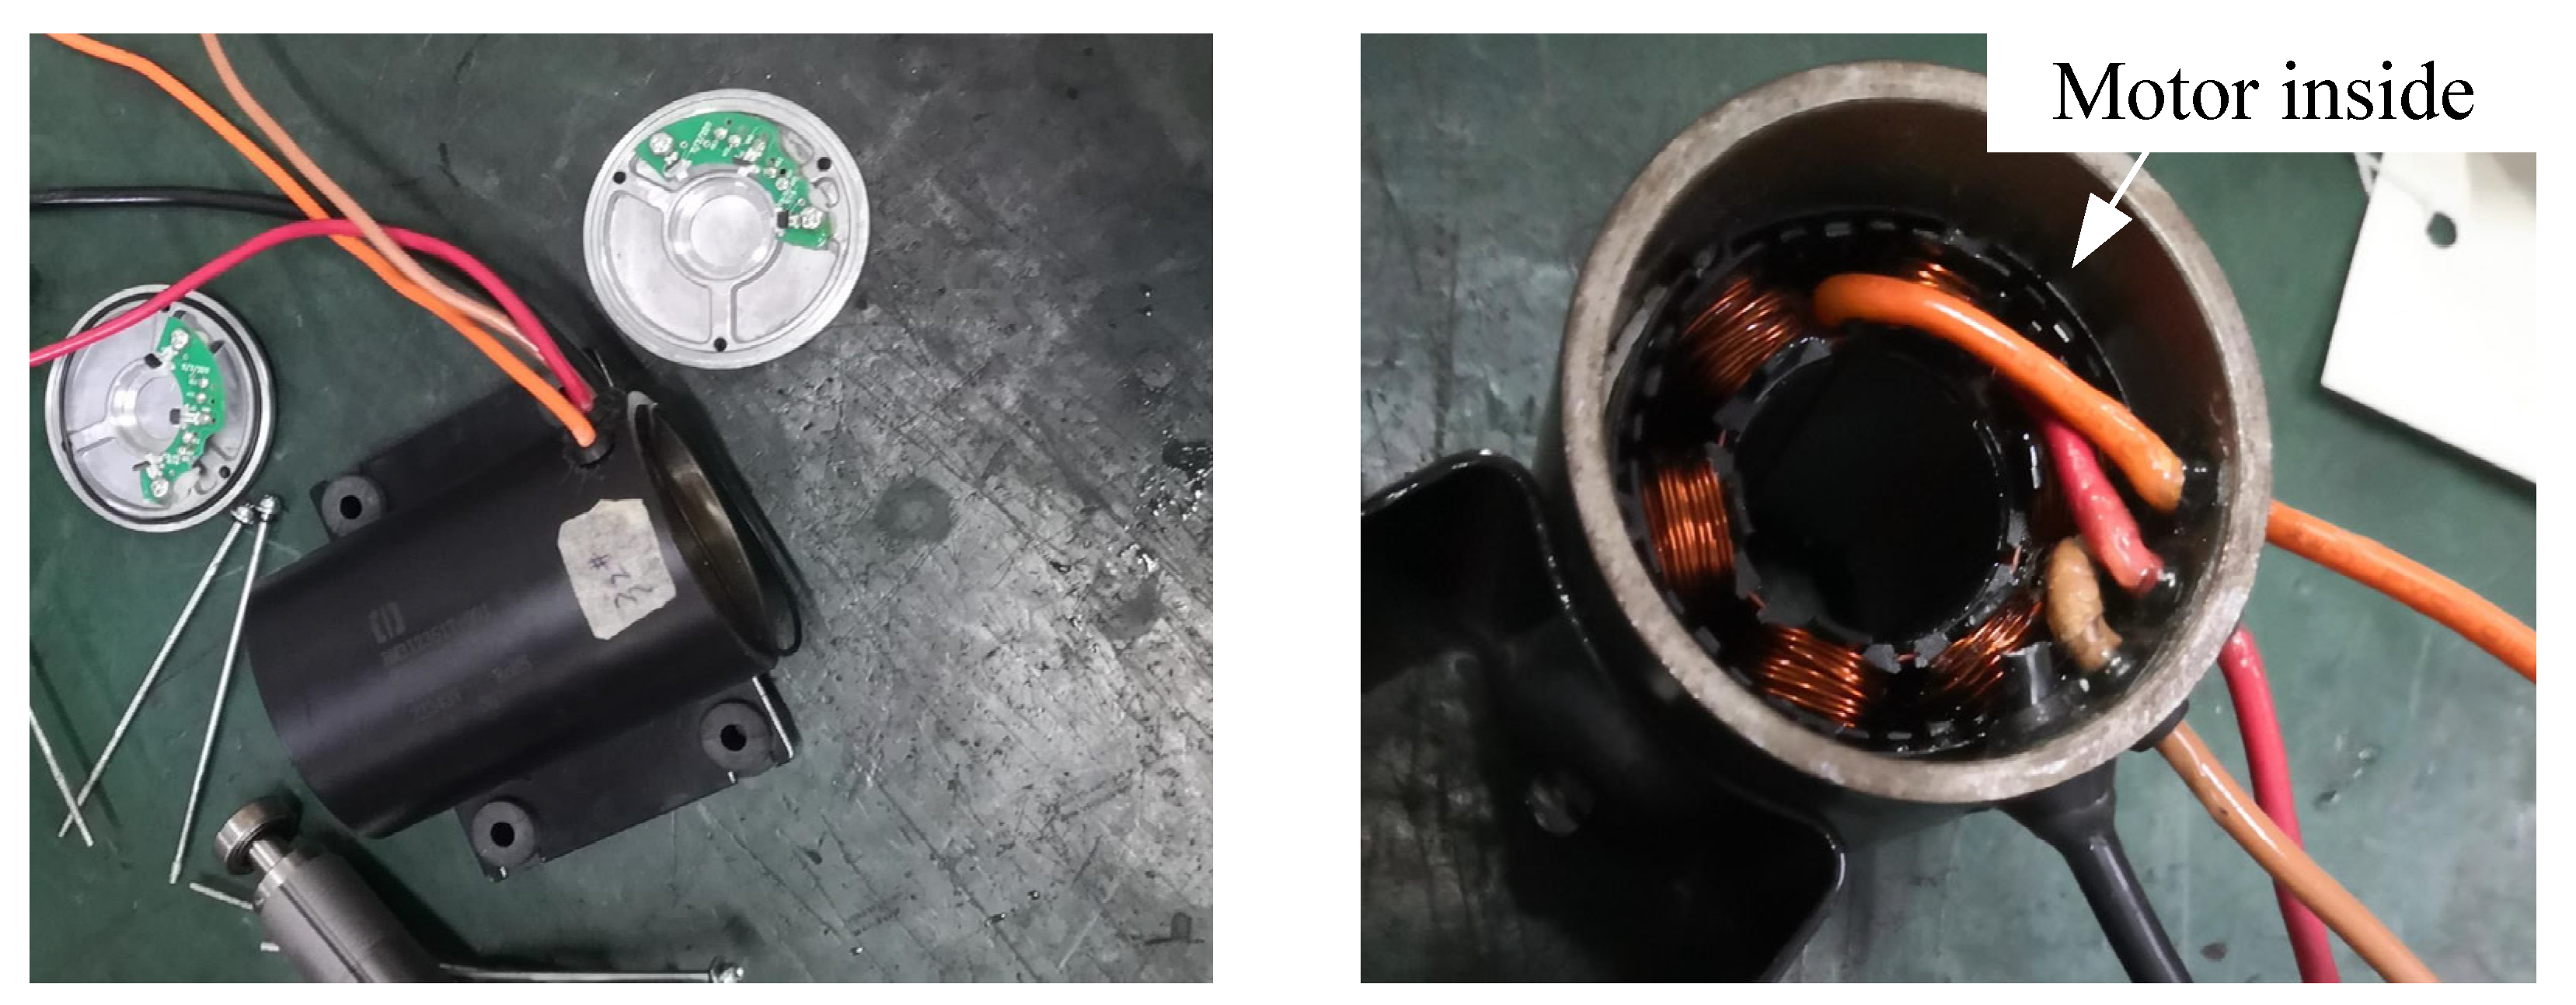
- Through the experimental verification, it is proved that the optimization algorithm selects the optimal design scheme that sealing performance in this study meets the requirements of IPX7. There was no water inside the motor. No water leakage occurred after its disassembly.
- (4)
- From the perspective of application scenarios, the method proposed in this paper is not only suitable for the rubber sealing performance optimization of motors but also applicable to optimization in other fields. Wherever many tasks with similarities can be constructed in optimization, this method can be effectively applied.
- (1)
- The finite element model takes into account the nonlinear characteristics of the material, which results in a computation time of up to nine hours for a single model. In this study, six models were compared, and the long computation time became a limitation. Due to the extended calculation time, the number of models that could be evaluated was restricted. For comparing more design options in the future, accelerating the simulation speed will be a key consideration.
- (2)
- This paper only evaluates the comparison results between different groove depths under the same bolt preload and uses the E-TOPSIS method to optimize these results. It does not compare the combined design schemes of different bolt preloads and different groove depths.
- (3)
- This study applies the E-TOPSIS algorithm for multi-objective optimization. With the development and application of artificial intelligence technology, the combination of artificial intelligence algorithms and multi-objective optimization algorithms, when applied to the design of sealing structures, will be a key research focus in the future and will have broad prospects.
Author Contributions
Funding
Institutional Review Board Statement
Informed Consent Statement
Data Availability Statement
Conflicts of Interest
Nomenclature
| Symbol | Unit | Implication |
| σ | [MPa] | von Mises stress |
| σ1 | [MPa] | principal stresses at x direction |
| σ2 | [MPa] | principal stresses at y direction |
| σ3 | [MPa] | principal stresses at z direction |
| E | [MPa] | Young’s modulus |
| Rp0.2 | [MPa] | Tensile Yield Strength |
| Rm | [MPa] | Tensile Ultimate Strength |
| N | [N] | applied normal force |
| F | [N] | frictional force |
| P | [MPa] | water pressure |
| g | [m/s2] | Earth gravity |
| h | [m] | submersion in water depths |
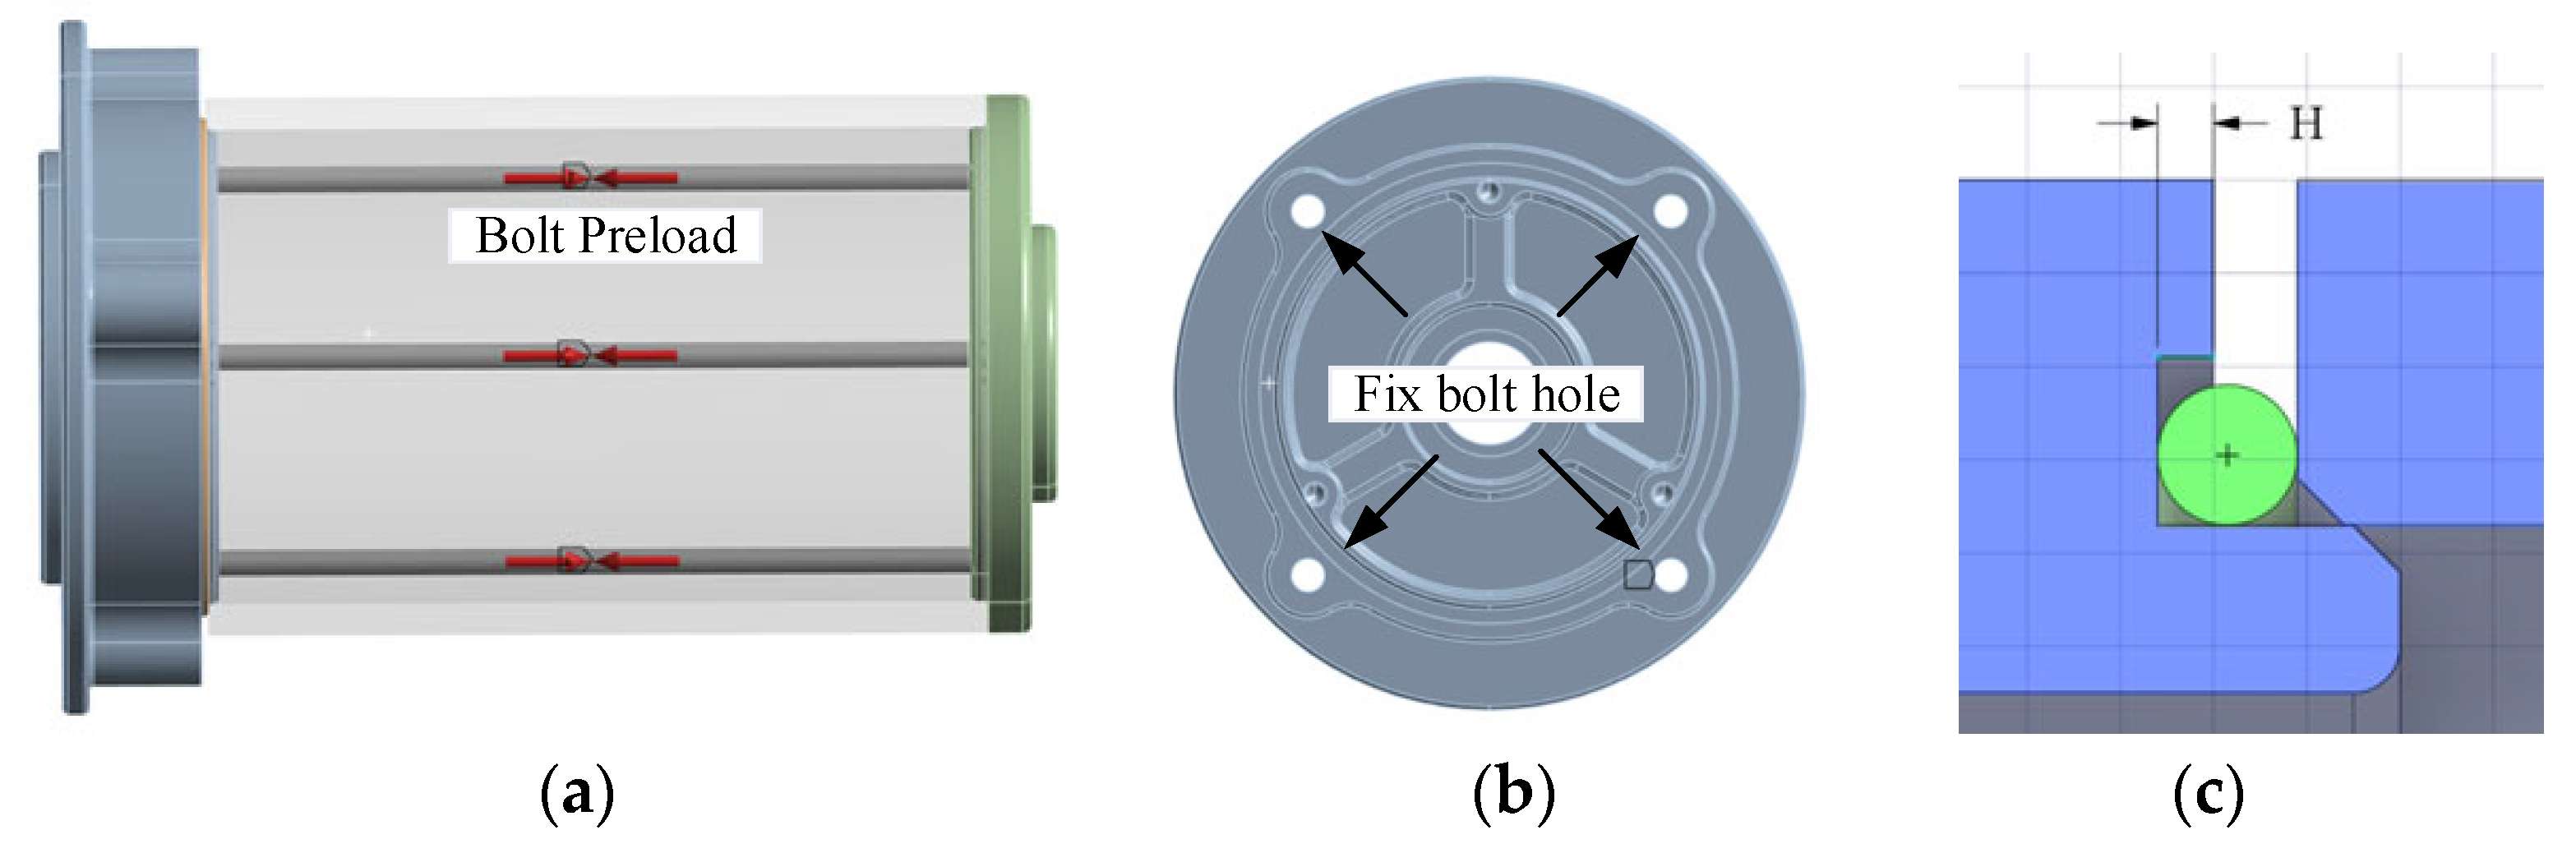
| H | [mm] | groove depth |
| x, y, z | [mm] | Cartesian coordinates |
| ρ | [kg/m3] | water density |
Abbreviations
| Abbreviation | Full Name |
| IP | Ingress Protection |
| NIS | negative ideal solution |
| PIS | positive ideal solution |
| TOPSIS | technique for order preference by similarity to the ideal solution |
| NBR | nitrile butadiene rubber |
| μ | Poisson’s Ratio |
| CS1 | contact surface 1 |
| CS2 | contact surface 2 |
| CS3 | contact surface 3 |
| CS4 | contact surface 4 |
| CS5 | contact surface 5 |
| μk | kinetic frictional coefficient |
| COF | coefficient of friction |
| FEM | Finite Element Method |
| EWM | Entropy Weight Method |
References
- Lee, S.M.; Choi, B.L.; Choi, B.-H. Inverse identification of material properties of rubber O-rings in hydrogen fuel cell electric vehicles. Int. J. Hydrogen Energy 2025, 105, 646–659. [Google Scholar] [CrossRef]
- Tao, Z.; Liao, Y.; Zhang, Q.; Lian, Z. Friction characteristics and failure mechanisms of O-ring seals under lubrication of water-based emulsion. Eng. Fail. Anal. 2025, 169, 109226. [Google Scholar] [CrossRef]
- Liang, B.; Yang, X.; Wang, Z.; Su, X.; Liao, B.; Ren, Y.; Sun, B. Influence of Randomness in Rubber Materials Parameters on the Reliability of Rubber O-Ring Seal. Materials 2019, 12, 1566. [Google Scholar] [CrossRef] [PubMed]
- Tan, D.; Yang, Q.; Yang, W.; Hu, Y.; He, Q.; Yang, X. Impact of friction speeds on the wear mechanisms of X-shaped nitrile rubber seals in oil-rich lubrication condition. Wear 2025, 205933. [Google Scholar] [CrossRef]
- Hossain Bhuiyan, M.M.; Sakib, A.N.; Corral, A.B.; Siddique, Z. Investigating the influence of operating variables on sealing performance of a V-ring seal stack in the oil and gas industry for enhanced environmental and operational performance. Polym. Test. 2024, 131, 108346. [Google Scholar] [CrossRef]
- Wei, J.; Liu, C.; Guo, F.; Tian, J. Effect of angle eccentricity on lip seal performance of helicopter gearbox. Tribol. Int. 2025, 209, 110676. [Google Scholar] [CrossRef]
- Zhang, Y.; Zhang, N.; Cui, B.; Guo, Q. Failure analysis and structural improvement of helicopter landing gear seals based on experiments and three-dimensional numerical simulation. Eng. Fail. Anal. 2024, 163, 108596. [Google Scholar] [CrossRef]
- Li, M.; He, L.; Zheng, D.; Fang, X.; Huang, X.; Xu, G. Characterization of long-term evolution of leakage rates of O-ring seals in nuclear power plant under high-temperature and high-pressure conditions. Nucl. Eng. Des. 2024, 429, 113666. [Google Scholar] [CrossRef]
- Wang, B.; Yang, X.; Hou, B.; Li, Y.; Chen, Y.; Peng, X. Performance analysis and structural optimization of VL-type hydraulic reciprocating seal in a deep-sea hydraulic system. Ocean Eng. 2025, 328, 121048. [Google Scholar] [CrossRef]
- Wu, J.; Li, L.; Wang, P. Effect of stress relaxation on the sealing performance of O-rings in deep-sea hydraulic systems: A numerical investigation. Eng. Sci. Technol. Int. J. 2024, 51, 101654. [Google Scholar] [CrossRef]
- Liao, B.; Sun, B.; Yan, M.; Ren, Y.; Zhang, W.; Zhou, K. Time-Variant Reliability Analysis for Rubber O-Ring Seal Considering Both Material Degradation and Random Load. Materials 2017, 10, 1211. [Google Scholar] [CrossRef] [PubMed]
- George, A.F.; Strozzi, A.; Rich, J. Stress fields in a compressed unconstrained elastomeric O-ring seal and a comparison of computer predictions and experimental results. Tribol. Int. 1987, 20, 237–247. [Google Scholar] [CrossRef]
- Shukla, A.; Nigam, H. A numerical-experimental analysis of the contact stress problem. J. Strain Anal. Eng. Des. 1985, 20, 241–245. [Google Scholar] [CrossRef]
- Dragoni, E.; Strozzi, A. Theoretical analysis of an unpressurized elastomeric O-ring seal inserted into a rectangular groove. Wear 1989, 130, 41–51. [Google Scholar] [CrossRef]
- Fried, I.; Johnson, A.R. Nonlinear computation of axisymmetric solid rubber deformation. Appl. Mech. Eng. 1988, 67, 241–253. [Google Scholar] [CrossRef]
- Yokoyama, K.; Okazaki, M.; Komito, T. Effect of contact pressure and thermal degradation on the sealability of O-ring. JSAE Rev. 1998, 19, 123–128. [Google Scholar] [CrossRef]
- Karaszkiewicz, A. Geometry and contact pressure of an O-ring mounted in a seal groove. Ind. Eng. Chem. Res. 1990, 29, 2134–2137. [Google Scholar] [CrossRef]
- Zhou, Z.; Zhang, K.; Li, J.; Xu, T. Finite element analysis of stress and contact pressure on the rubber sealing O-ring. Lubr. Eng. 2006, 31, 86–89. [Google Scholar]
- Morrell, P.R.; Patel, M.; Skinner, A.R. Accelerated thermal ageing studies on nitrile rubber O-rings. Polym. Test. 2003, 22, 651–656. [Google Scholar] [CrossRef]
- Kim, H.K.; Park, S.H.; Lee, H.G.; Kim, D.R.; Lee, Y.H. Approximation of contact stress for a compressed and laterally one side restrained O-ring. Eng. Fail. Anal. 2007, 14, 1680–1692. [Google Scholar] [CrossRef]
- Chen, Z.; Liu, T.; Li, J. The effect of the O-ring on the end face deformation of mechanical seals based on numerical simulation. Tribol. Int. 2016, 97, 278–287. [Google Scholar] [CrossRef]
- Yamabe, J.; Koga, A.; Nishimura, S. Failure behavior of rubber O-ring under cyclic exposure to high-pressure hydrogen gas. Eng. Fail. Anal. 2013, 35, 193–205. [Google Scholar] [CrossRef]
- Zhang, Z.; Wu, D.; Pang, H.; Liu, Y.; Wei, W.; Li, R. Extrusion-occlusion Dynamic Failure Analysis of O-ring Based on Floating Bush of Water Hydraulic Pump. Eng. Fail. Anal. 2019, 109, 104358. [Google Scholar] [CrossRef]
- Porter, C.; Zaman, B.; Pazur, R.J. A Critical Examination of the Shelf Life of Nitrile Rubber O-Rings used in Aerospace Sealing Applications. Polym. Degrad. Stab. 2022, 206, 110199. [Google Scholar] [CrossRef]
- Yang, M.; Xia, Y.; Ren, Y.; Zhang, B.; Wang, Y. Design of O-ring with skeleton seal of cutter changing robot storage tank gate for large diameter shield machine. Tribol. Int. 2023, 185, 108591. [Google Scholar] [CrossRef]
- Geni, M. ANSYS Workbench 18.0 Finite Element Analysis: Fundamentals and Applications; China Machine Press: Beijing, China, 2018. [Google Scholar]
- Hu, M.; Sun, D.; Sun, G.; Sun, Y.; Ouyang, J. Performance study on anti-weather aging combinations for high-content polymer modified asphalt and comparison by improved multi-scale mathematical TOPSIS method. Constr. Build. Mater. 2023, 407, 133357. [Google Scholar] [CrossRef]
- Dwivedi, P.P.; Sharma, D.K. Evaluation and ranking of battery electric vehicles by Shannon’s entropy and TOPSIS methods. Math. Comput. Simul. 2023, 212, 457–474. [Google Scholar] [CrossRef]
- Wang, Z.; Zhong, Y.; Chai, S.; Niu, S.; Yang, M.; Wu, G. Product design evaluation based on improved CRITIC and Comprehensive Cloud-TOPSIS—Applied to automotive styling design evaluation. Adv. Eng. Inform. 2024, 60, 102361. [Google Scholar] [CrossRef]
- Sabry, I.; Hewidy, A.M.; Naseri, M.; Mourad, A.-H.I. Optimization of process parameters of metal inert gas welding process on aluminum alloy 6063 pipes using Taguchi-TOPSIS approach. J. Alloys Metall. Syst. 2024, 7, 100085. [Google Scholar] [CrossRef]
- Yang, H.; Liu, N.; Li, M.; Gu, M.; Gao, Q. Design and optimization of heat pipe-assisted liquid cooling structure for power battery thermal management based on NSGA-II and entropy Weight-TOPSIS method. Appl. Therm. Eng. 2025, 272, 126416. [Google Scholar] [CrossRef]
- Asgari, M.; Ommi, F.; Saboohi, Z. Aeroelastic modeling and multi-objective optimization of a subsonic compressor rotor blade using a combination of modified NSGA-II, ANN, and TOPSIS. Results Eng. 2025, 26, 104615. [Google Scholar] [CrossRef]
- Ammineni, S.P.; Nagaraju, C.; Raju, D.L. Modal performance degradation of naturally aged NBR. Polym. Test. 2022, 115, 107710. [Google Scholar] [CrossRef]
- Yi, Y.; Hu, T.; Liu, P.; Qu, Q.; Eitelberg, G.; Akkermans, R.A.D. Dynamic lift characteristics of nonslender delta wing in large-amplitude-pitching. Aerosp. Sci. Technol. 2020, 105, 105937. [Google Scholar] [CrossRef]
- Wang, K.; Zhou, Z.; Zhu, X.; Xu, X. Aerodynamic design of multi-propeller/wing integration at low Reynolds numbers. Aerosp. Sci. Technol. 2019, 84, 1–17. [Google Scholar] [CrossRef]
- Zhang, T.; Barakos, G.N.; Filippone, A.; Furqan. High-fidelity aero-acoustic evaluations of a heavy-lift eVTOL in hover. J. Sound Vib. 2024, 584, 118453. [Google Scholar] [CrossRef]
- Kim, Y.T.; Han, S.Y. Cooling channel designs of a prismatic battery pack for electric vehicle using the deep Q-network algorithm. Appl. Therm. Eng. 2023, 219, 119610. [Google Scholar] [CrossRef]
- Zhang, J.; Xie, J. Investigation of Static and Dynamic Seal Performances of a Rubber O-Ring. J. Tribol.-Trans. ASME 2018, 140, 042202. [Google Scholar] [CrossRef]
- Mooney, M. A Theory of Large Elastic Deformation. J. Appl. Phys. 1940, 11, 582–592. [Google Scholar] [CrossRef]
- Rivlin, R.S. Large Elastic Deformation. of Isotropic Materials IV. Further Development of General Theory. Philos. Trans. R. Soc. A 1948, 241, 379–397. [Google Scholar]
- ANSYS Mechanical User’s Guide, Version 2023R2; ANSYS, Inc.: Canonsburg, PA, USA, 2023. Available online: https://ansyshelp.ansys.com/ (accessed on 28 April 2025).
- Li, D.X.; Zhao, H.L.; Zhang, S.M.; Wu, C.R.; Liu, X.L.; Zheng, S.J. Finite Element Analysis on the Influence of Back-Up Ring on the Sealing Effect of Rubber O-Ring. Adv. Mater. Res. 2011, 199, 1595–1599. [Google Scholar] [CrossRef]
- Chen, S.H.; Jiang, G.Z.; Li, G.F.; Xie, L.X.; Qian, W.Q. Nonlinear Analysis of Rotary Sealing Performance of Rubber O-Ring. Appl. Mech. Mater. 2014, 470, 371–375. [Google Scholar] [CrossRef]
- Wenjin, G. Finite Element Analysis of the Sealing Performance of Rubber O-ring. Lubr. Eng. 2012, 37, 60–64. [Google Scholar]
- Hwang, C.L.; Yoon, K. Multiple Attribute Decision Making. Lect. Notes Econ. Math. Syst. 1981, 404, 287–288. [Google Scholar]
- Yu, D.; Pan, T. Tracing knowledge diffusion of TOPSIS: A historical perspective from citation network. Expert Syst. Appl. 2020, 168, 114238. [Google Scholar] [CrossRef]
- Shannon, C.E. A mathematical theory of communication. Bell Syst. Tech. J. 1948, 27, 623–656. [Google Scholar] [CrossRef]
- Zhao, D.; Li, C.; Wang, Q.; Yuan, J. Comprehensive evaluation of national electric power development based on cloud model and entropy method and TOPSIS: A case study in 11 countries. J. Clean. Prod. 2020, 277, 123190. [Google Scholar] [CrossRef]
- Shen, M.; Peng, X.; Xie, L.; Meng, X.; Li, X. Deformation Characteristics and Sealing Performance of Metallic O-rings for a Reactor Pressure Vessel. Nucl. Eng. Technol. 2016, 48, 533–544. [Google Scholar] [CrossRef]
- Wu, J.B.; Li, L. Influence of ambient pressure on sealing performance of O-ring in deep-sea hydraulic system. Ocean Eng. 2022, 245, 110440. [Google Scholar] [CrossRef]
- Zhou, C.; Chen, G.; Xiao, S.-P.; Hua, Z.; Gu, C.-h. Study on fretting behavior of rubber O-ring seal in high-pressure gaseous hydrogen. Int. J. Hydrogen Energy 2019, 44, 22569–22575. [Google Scholar] [CrossRef]
- Shuai, Z.; Sier, D.; Wenhu, Z.; Naizheng, K. Simulation and experiment on sealing mechanism with rigid-flexible combined seal groove in hub bearing. Tribol. Int. 2019, 136, 385–394. [Google Scholar] [CrossRef]


| Material | E (MPa) | μ | Rp0.2 (MPa) | Rm (MPa) |
|---|---|---|---|---|
| ADC12 | 71,000 | 0.33 | 280 | 310 |
| S45C | 200,000 | 0.3 | 899 | 1029 |
| Contact Surface | 1 | 2 | 3 | 4 | 5 |
|---|---|---|---|---|---|
| Friction coefficient | 0.18 | 0.18 | 0.18 | 0 | 0.15 |
| Fine | Medium | Coarse | |
|---|---|---|---|
| Mesh elements | 610,140 | 368,710 | 166,300 |
| O-ring max stress (MPa) | 0.824 | 0.818 | 0.807 |
| Total deformation (mm) | 0.435 | 0.433 | 0.431 |
| CS1 CP (MPa) | 1.109 | 1.104 | 1.101 |
| CS2 CP (MPa) | 1.018 | 0.927 | 0.918 |
| Time to solve | 18 h 48 m 3 s | 8 h 40 m 28 s | 1 h 43 m 55 s |
| Test | N (N) | F (N) | μk |
|---|---|---|---|
| 1 | 22.10 | 4.00 | 0.18 |
| 2 | 22.10 | 3.80 | 0.17 |
| 3 | 22.10 | 3.90 | 0.18 |
| 4 | 22.10 | 3.40 | 0.15 |
| 5 | 22.10 | 4.00 | 0.18 |
| Test | N (N) | F (N) | μk |
|---|---|---|---|
| 1 | 26.65 | 4.20 | 0.16 |
| 2 | 26.65 | 4.00 | 0.15 |
| 3 | 26.65 | 4.00 | 0.15 |
| 4 | 26.65 | 4.20 | 0.16 |
| 5 | 26.65 | 4.00 | 0.15 |
| Test | N (N) | F (N) | μk |
|---|---|---|---|
| 1 | 22.10 | 3.80 | 0.17 |
| 2 | 22.10 | 4.20 | 0.19 |
| 3 | 22.10 | 4.00 | 0.18 |
| 4 | 22.10 | 3.60 | 0.16 |
| 5 | 22.10 | 4.00 | 0.18 |
| Groove Depth (mm) | 0.6 | 0.7 | 0.8 | 0.9 | 1 | 1.1 |
|---|---|---|---|---|---|---|
| Contact pressure CS1 (MPa) | 1.121 | 1.123 | 1.110 | 1.122 | 1.124 | 0.982 |
| Contact pressure CS2 (MPa) | 0.931 | 0.926 | 0.930 | 0.930 | 0.928 | 0.800 |
| Contact pressure CS3 (MPa) | 0.622 | 0.607 | 0.618 | 0.607 | 0.605 | 0.487 |
| Contact area CS1 (mm2) | 183.628 | 183.312 | 183.217 | 183.514 | 184.280 | 179.780 |
| Contact area CS2 (mm2) | 217.368 | 217.377 | 217.341 | 217.474 | 217.900 | 210.630 |
| Contact area CS3 (mm2) | 111.857 | 111.864 | 111.499 | 111.889 | 112.440 | 74.140 |
| Stress O-ring (MPa) | 0.830 | 0.829 | 0.829 | 0.831 | 0.808 | 0.691 |
| Stress Base (MPa) | 3.250 | 3.788 | 3.983 | 2.842 | 3.137 | 2.655 |
| Groove Depth (mm) | 0.6 | 0.7 | 0.8 | 0.9 | 1 | 1.1 |
|---|---|---|---|---|---|---|
| Pi | 0.904 | 0.859 | 0.842 | 0.926 | 0.919 | 0.154 |
| Rank | 3 | 4 | 5 | 1 | 2 | 6 |
Disclaimer/Publisher’s Note: The statements, opinions and data contained in all publications are solely those of the individual author(s) and contributor(s) and not of MDPI and/or the editor(s). MDPI and/or the editor(s) disclaim responsibility for any injury to people or property resulting from any ideas, methods, instructions or products referred to in the content. |
© 2025 by the authors. Licensee MDPI, Basel, Switzerland. This article is an open access article distributed under the terms and conditions of the Creative Commons Attribution (CC BY) license (https://creativecommons.org/licenses/by/4.0/).
Share and Cite
Zhou, W.; Xie, Z. Multi-Objective Optimization of Motor Sealing Performance: Numerical and Experimental Approach. Materials 2025, 18, 2064. https://doi.org/10.3390/ma18092064
Zhou W, Xie Z. Multi-Objective Optimization of Motor Sealing Performance: Numerical and Experimental Approach. Materials. 2025; 18(9):2064. https://doi.org/10.3390/ma18092064
Chicago/Turabian StyleZhou, Weiru, and Zonghong Xie. 2025. "Multi-Objective Optimization of Motor Sealing Performance: Numerical and Experimental Approach" Materials 18, no. 9: 2064. https://doi.org/10.3390/ma18092064
APA StyleZhou, W., & Xie, Z. (2025). Multi-Objective Optimization of Motor Sealing Performance: Numerical and Experimental Approach. Materials, 18(9), 2064. https://doi.org/10.3390/ma18092064