Article

Fabrication and Properties of Zn-Containing Intermetallic Compounds as Sacrificial Anodes of Zn-Based Implants

Hebei Key Laboratory of New Functional Materials, School of Materials Science and Engineering, Hebei University of Technology, Tianjin 300400, China
*
Author to whom correspondence should be addressed.
Materials 2025, 18(9), 2057; https://doi.org/10.3390/ma18092057
Submission received: 28 March 2025 / Revised: 24 April 2025 / Accepted: 28 April 2025 / Published: 30 April 2025
(This article belongs to the Special Issue Physical Metallurgy of Metals and Alloys (3rd Edition))

Abstract

:
In the field of degradable metals, Zn-based implants have gradually gained more attention. However, the relatively slow degradation rate compared with the healing rate of the damaged bone tissue, along with the excessive Zn2+ release during the degradation process, limit the application of Zn-based implants. The use of intermetallic compounds with more negative electrode potentials as sacrificial anodes of Zn-based implants is likely to be a feasible approach to resolve this contradiction. In this work, three intermetallic compounds, MgZn2, CaZn13, and Ca2Mg6Zn3, were prepared. The phase structures, microstructures, and relevant properties, such as thermal stability, in vitro degradation properties, and cytotoxicity of the compounds, were investigated. The XRD patterns indicate that the MgZn2 and CaZn13 specimens contain single-phase MgZn2 and CaZn13, respectively, while the Ca2Mg6Zn3 specimen contains Mg2Ca and Ca2Mg6Zn3 phases. After purifying treatment in 0.9% NaCl solution, high purity Ca2Mg6Zn3 phase was obtained. Thermal stability tests suggest that the MgZn2 and CaZn13 specimens possess good thermal stability below 773 K. However, the Ca2Mg6Zn3 specimen melted at around 739.1 K. Polarization curve tests show that the corrosion potentials of MgZn2, CaZn13, and Ca2Mg6Zn3 in simulated body fluid (SBF) were −1.063 VSCE, −1.289 VSCE, and −1.432 VSCE, which were all more negative than that of the pure Zn specimen (−1.003 VSCE). Clearly, these compounds can act as sacrificial anodes in Zn-based implants. The immersion tests indicate that these compounds were degraded according to the atomic ratio of the elements in each compound. Besides that, the compounds can efficiently induce Ca-P deposition in SBF. Cytotoxicity tests demonstrate that the 10% extracts prepared from these compounds exhibit good cell activity on MC3T3-E1 cells.

1. Introduction

As biodegradable implants temporarily present in the body, Zn and its alloys have become a research hotspot in the field of degradable metals in recent years due to their acceptable biocompatibility and more suitable degradation rate than Mg-based and Fe-based materials [1,2,3,4,5,6,7,8,9,10,11,12,13,14]. However, recent studies have shown that the degradation rate of Zn-based materials is relatively slow in orthopedic applications, which inevitably leads to long-term retention of implants in the body and resulting metabolic complications [15,16]. Since the degradation rate of implants should match the bone regeneration rate as much as possible, the implants must maintain their mechanical integrity in the body for approximately 3–6 months and fully degrade within 1–2 years [15,16,17,18]. To meet the requirements, Refs. [19,20] reported that the degradation rate of implants should be about 0.2 mm/year. Refs. [16,17] reported that the degradation rate should be 0.5 mm/year (plates and screws). Shuai et al. [21] believed that 0.2–0.5 mm/year should be an appropriate degradation rate, which may be due to the fact that the healing periods or the bone regeneration periods are different for the specific bone tissues [16,20,22]. Zhao et al. [23] have summarized the degradation rates of 130 Zn-based specimens (pure Zn and various Zn alloys) after immersion in corrosive solutions for different periods. The results showed that the degradation rates of 120 Zn-based specimens were less than 0.2 mm/year. Among the remaining 10 specimens whose degradation rates were greater than 0.2 mm/year, the maximum rate of these specimens was only about 0.253 mm/year. Not only that, Zhao et al. [23] also reported that 10 porous Zn-based scaffolds among the total 25 scaffold specimens also exhibited a degradation rate of less than 0.2 mm/year during the immersion tests [23]. In addition, it also should be noted that the degradation rate of degradable metals in vivo may be slower than that in vitro due to the essential differences between the in vivo and in vitro environments [24]. For example, Witte et al. [25] reported that the degradation rates of AZ91D and LAE442 alloys in vitro (electrochemical tests) were approximately 103–104 times higher than that those measured in vivo. Ren et al. [26] also reported that the porous Zn-Cu scaffolds exhibited a slower degradation rate in vivo than in vitro. In addition to the relatively slow degradation rates, the second drawback of Zn-based implants is the excessive release of Zn2+ during the degradation process. It is known that Zn is only a trace element in the human body [27], and the tolerance threshold of cells and tissues to Zn2+ is rather low. As a result, the excessive release of Zn2+ can easily cause severe cytotoxicity in vitro and delayed osseointegration in vivo [16,28]. For example, Yang et al. [28] reported that the cell viability of MC3T3-E1 cells after culturing in the extract prepared from a pure Zn specimen for 1–4 days was only about 15.8–51.4%. After implantation of the pure Zn specimen into a Sprague-Dawley rat for 4 weeks, a fibrous connective tissue layer was found around the implant, and only limited sites of direct attachment of new bone to the implant were observed [28]. When Zn-based materials were prepared into porous scaffolds, the porous scaffolds would exhibit faster degradation rates and greater Zn2+ release, which then resulted in lower cell viability [3,29,30]. Based on the above statements, solving the contradiction between the relatively slow degradation rate and the excessive release of Zn2+ during the degradation process naturally becomes an important research direction in the field of degradable Zn-based implant materials.
To resolve the contradiction, introducing sacrificial anodes with electrode potentials more negative than Zn into Zn-based implants should be a viable approach. Yang et al. [28] prepared Zn-xMg composites (x = 1, 2, 5 wt.%) using pure Zn powders and pure Mg powders as raw materials by the spark plasma sintering method. Their experimental results showed that the Mg-rich particles with a core–shell structure (the inner core was MgZn2 phase, and the outer shell was Mg2Zn11 phase) were uniformly distributed in the composites. Electrochemical tests indicated that the composites had more negative corrosion potentials and faster degradation rates than the pure Zn specimen. Furthermore, the Mg-rich phases in the composites indeed degraded preferentially, forming obvious corrosion pits. The results of cytotoxicity tests demonstrated that the Zn2+ concentrations in the extracts of Zn-xMg composites were lower than that in the extract of the pure Zn specimen, and the composites also exhibited better cell viability than the pure Zn specimen. The in vivo implantation experiments conducted in Sprague-Dawley rats also showed that more sites on the Zn-5Mg composite could directly bond to new bone after 4 weeks of implantation, indicating an improvement in bone integration ability compared with the pure Zn specimen.
Based on the experimental results of Yang et al. [28], it can be confirmed that the compounds MgZn2 and Mg2Zn11 can be used as sacrificial anodes in Zn-based implants. However, studies on the degradation properties and degradation mechanisms of MgZn2, Mg2Zn11, and other compounds that can also be used as sacrificial anodes are very limited. Currently, only very few studies have reported the corrosion potentials of MgZn2 and Mg2Zn11 in 3.5% NaCl solution [31,32], as well as the pH variation in the Hank’s solution soaking of a CaZn2 specimen [33]. Apparently, the current information on the degradation properties and degradation mechanisms of the compounds used as sacrificial anodes is not yet sufficient to develop biodegradable Zn-based implants with suitable and controllable degradation rates and good biocompatibility.
In this work, three intermetallic compounds, MgZn2, CaZn13, and Ca2Mg6Zn3, were prepared, and their phase structures and microstructures were characterized. The thermal properties, degradation behaviors, as well as the cytotoxicity of these compounds were also investigated. The experimental results are expected to provide assistance for the preparation of biodegradable Zn-based composites containing these compounds in the next step, and also provide useful help in clarifying the mechanism by which these compounds regulate the degradation behavior and cytotoxicity of Zn-based composites.

2. Materials and Methods

2.1. Preparation of the Intermetallic Compounds

Commercially pure Zn (≥99.995%), pure Mg (≥99.95%), and pure Ca (≥99.0%) ingots were used as raw materials. Three intermetallic compounds having nominal compositions of MgZn2, CaZn13, and Ca2Mg6Zn3 were prepared by a vacuum induction melting furnace under argon protection. Then, the obtained MgZn2, CaZn13, and Ca2Mg6Zn3 ingots were annealed at 500 °C, 470 °C, and 320 °C for 15 h under argon atmosphere, respectively. After that, the oxide layers on the specimens were removed. Due to the report in Ref [34] that when Ca, Mg, and Zn were melted in an atomic ratio of Ca/Mg/Zn = 1/3/1.5 to prepare Ca2Mg6Zn3, the resulting product was likely to contain Mg2Ca phase, and the annealed Ca2Mg6Zn3 ingot still needed to be purified. The annealed Ca2Mg6Zn3 ingot was then immersed in 0.9% NaCl solution until the specimen completely disintegrated into powders. The powders were collected and pressurized into a cylinder with a diameter of 20 mm at 400 MPa for 3 min. After that, the cylinder compact was sintered at 390 °C for 1.5 h under the protection of argon atmosphere. Hereafter, unless otherwise specified, the intermetallic compounds used for phase structure, microstructure, and property characterizations are in an annealed state for the MgZn2 and CaZn13 specimens, while the Ca2Mg6Zn3 specimen is in a sintered state.

2.2. Phase Structure and Microstructure Characterizations of the Intermetallic Compounds

The phase structures of the obtained compounds were identified by an X-ray diffractometer (SmartLab, Rigaku, Tokyo, Japan) with Cu Kα radiation (2°/min). The microstructures of the specimens were characterized by a scanning electron microscope (SEM, S-4800 or SU-3800, Hitachi, Tokyo, Japan). An energy-dispersive X-ray spectrometer (EDS) equipped on the scanning electron microscope was used to determine the chemical compositions of specimens. Before observing the microstructures, the specimens were ground, polished, and then etched with a 4% nitric acid–alcohol solution.

2.3. Microhardness Tests of the Intermetallic Compounds

The microhardness of the intermetallic compounds was measured by a Vickers hardness tester (HVS-30Z, Shanghai Aolong Xingdi Testing Equipment Co., LTD., Shanghai, China). The applied load and the holding time were 196.1 N and 15 s, respectively.

2.4. Thermal Stability Tests of the Intermetallic Compounds

Thermal stability tests of the intermetallic compounds were carried out on a Themys ONE DSC/TG simultaneous analyzer (Setaram Instruments, Lyon, France). The specimens having a weight of 20–30 mg were loaded into alumina crucibles, and then they were heated from room temperature to 773 K at a heating rate of 5 K/min under nitrogen atmosphere to measure the differential scanning calorimetry (DSC) curves and the thermalgravimetric (TG) curves.

2.5. Electrochemical Tests of the Intermetallic Compounds

Polarization curves of the intermetallic compounds were measured by an electrochemical workstation (CHI660-E, Shanghai, China). The intermetallic compound specimens were used as the working electrodes, a saturated calomel electrode (SCE) served as the reference electrode, and a graphite rod acted as the counter electrode. The used corrosive media were 0.9% NaCl solution and simulated body fluid (SBF). The chemical composition of the SBF is listed in Table 1. The pH value of the SBF (37 °C) was adjusted to 7.4 using tris(hydroxymethyl) aminomethane and 1 M HCl solution. During the whole tests, the corrosive media were kept at 37 °C. Before measuring the polarization curves, the working electrodes were immersed in the corrosive media for 90 min to obtain a stable open circuit potential. After that, the polarization curves of the specimens were measured at a scanning rate of 0.5 mV/s. For comparison, the polarization curve of an as-cast pure Zn specimen was also tested.

2.6. Immersion Tests of the Intermetallic Compounds

The immersion tests of the intermetallic compounds were performed in 0.9% NaCl solution and SBF solution, respectively.
To carry out NaCl solution immersion tests, the pH values of the used NaCl solutions were firstly adjusted to 4.0 using a 1 M HCl solution. The intermetallic compound specimens (~1 g) were then immersed in the solutions (150 mL) for 24 h at room temperature. During immersion tests, the immersion solutions were continuously stirred magnetically. At the end of the immersion tests, the metal ion concentrations in the solutions were measured by an inductively coupled plasma-optical emission spectrometer (Agilent 5100, Santa Clara, CA, USA).
SBF immersion tests were performed in 150 mL of SBF solutions at 37 °C for different periods, and the exposed area of the compound specimens was around 1 cm2. During the immersion tests, the pH values of the solutions were measured. After immersion tests, the specimens were taken out from the immersion solutions, and rinsed with deionized water. After drying naturally, the corrosion products deposited on the specimens were characterized by a scanning electron microscope (S-4800, Hitachi) and a Fourier transform infrared spectrometer (FTIR, Vertex 80 V, Bruker, Billerica, MA, USA). Then, the corrosion products were removed with a CrO3 solution (200 g/L), and the corrosive morphologies of the specimens were also observed.

2.7. Cytotoxicity Tests of the Intermetallic Compounds

The cytotoxicity of the intermetallic compounds was evaluated by an indirect contact method, and the cells for tests were MC3T3-E1 cells. The used specimens were 100–150 μm intermetallic compound powders, and the cell culture medium was α-minimum essential medium (saibaikang, iCell-0003, Shanghai, China) containing 10% fetal bovine serum (Procell, 164210-50, Wuhan, China). Detailed experimental steps can be found in Refs. [3,36]. It should be noted that the metal ion concentrations in the 100% extracts prepared by incubating the sterilized specimens in the cell culture medium for 24 h were also measured by an inductively coupled plasma-optical emission spectrometer (Agilent 5110). The cellular activity (i.e., relative growth rate, RGR) of the specimens after incubation in the extracts with different concentrations for different periods was determined by the equation provided in Ref. [3].

3. Results and Discussion

3.1. Phase Structures of the Intermetallic Compounds

Figure 1 depicts the X-ray diffraction patterns of the MgZn2, CaZn13, and Ca2Mg6Zn3 specimens. It can be seen that only single-phase MgZn2 (PDF card number: 04-008-7744) and CaZn13 (PDF card number: 97-018-4414) were identified in the annealed MgZn2 and CaZn13 specimens, respectively, while no other phases were found. The results suggest that both the prepared MgZn2 and CaZn13 specimens, after annealing, exhibit high purity. However, Mg2Ca phase (PDF card number: 03-065-3583) was also detected in the annealed Ca2Mg6Zn3 specimen in addition to Ca2Mg6Zn3 phase (PDF card number: 00-012-0266) (Figure 1c). When the annealed Ca2Mg6Zn3 specimen was disintegrated into powders in NaCl solution and then these powders were compacted and sintered, the obtained specimen only contained Ca2Mg6Zn3 phase (Figure 1d). The reason why Mg2Ca phase could be removed from the Ca2Mg6Zn3 specimen during immersion in NaCl solution should be attributed to the preferential degradation of the Mg2Ca phase. It is known that the standard electrode potentials of Ca = Ca2+ + 2e, Mg = Mg2+ + 2e, and Zn = Zn2+ + 2e are −2.87 VSHE, −2.372 VSHE, and −0.762 VSHE, respectively. Therefore, it can be inferred that the electrode potential of Mg2Ca, which is composed of Mg and Ca elements with more negative electrode potentials, is lower than that of Ca2Mg6Zn3, just as the electrode potentials of MgZn2 and Mg2Zn11 are lower than that of pure Zn reported in Refs. [31,32]. When the annealed Ca2Mg6Zn3 specimen was immersed in NaCl solution, numerous corrosion couples formed between the Mg2Ca phase and the Ca2Mg6Zn3 phase. Clearly, the Mg2Ca phase that had a more negative electrode potential would preferentially degrade as a sacrificial anode. When the Mg2Ca phase completely degraded, the residual phase was just Ca2Mg6Zn3.

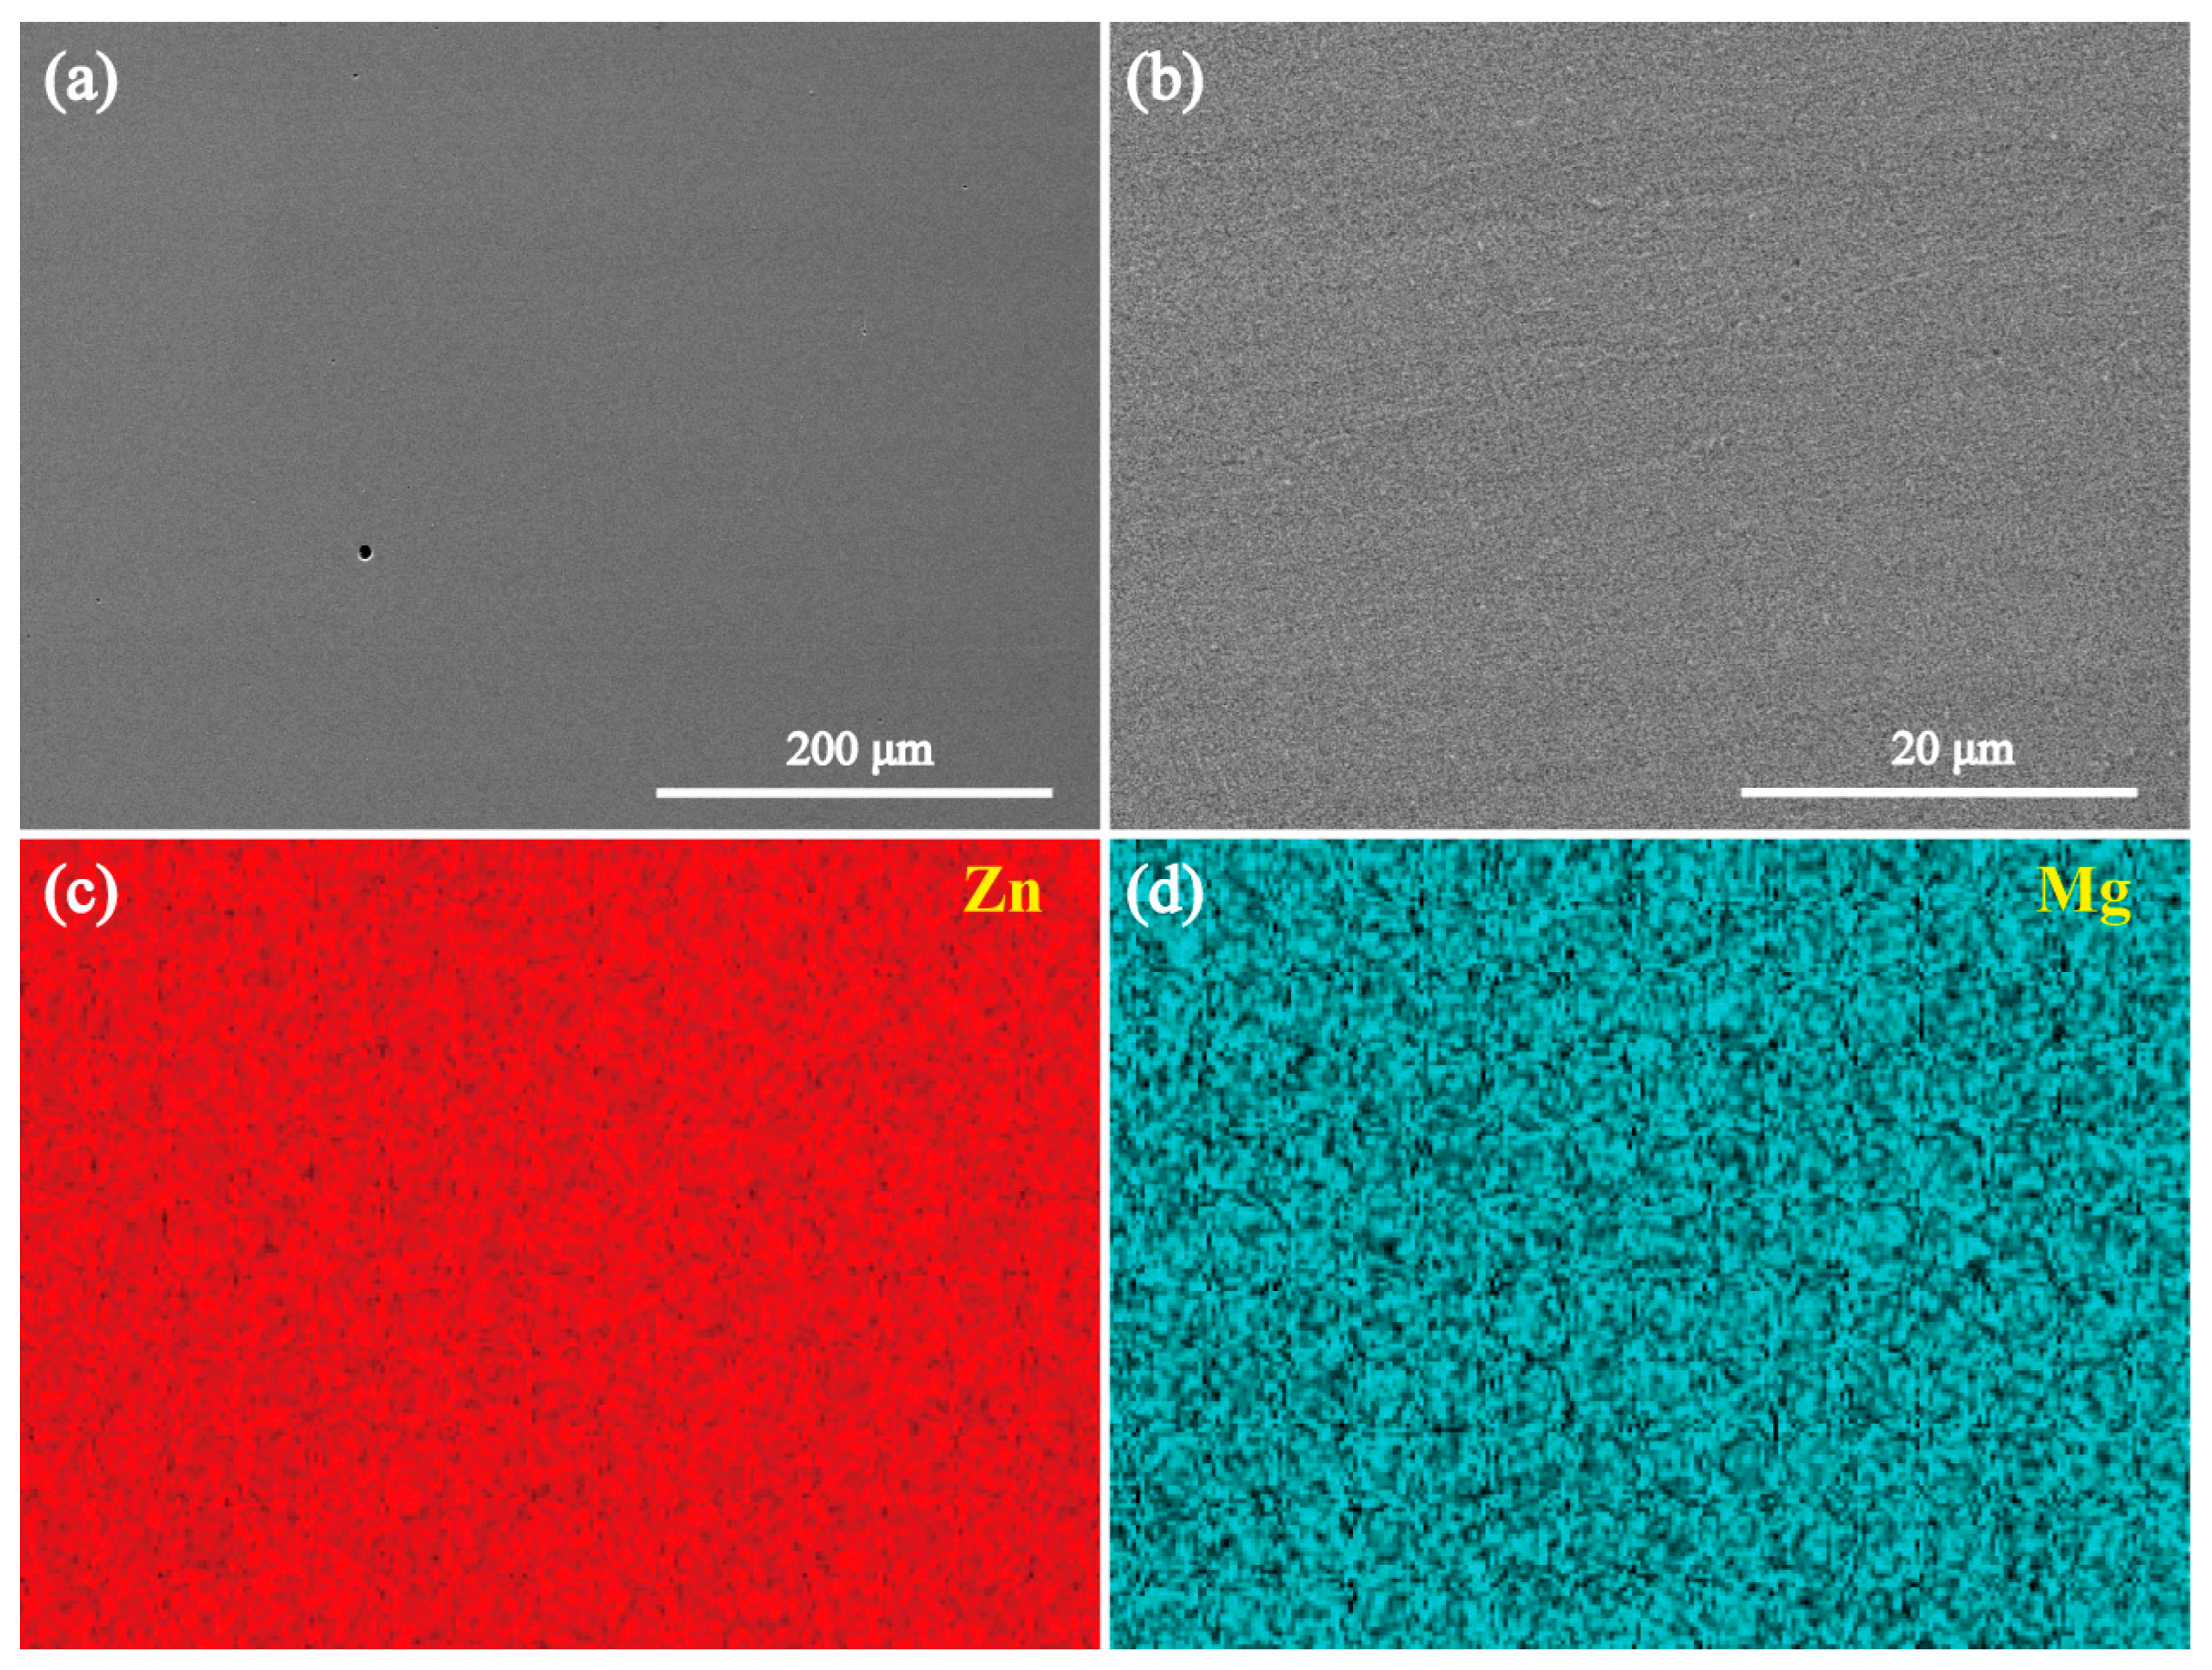
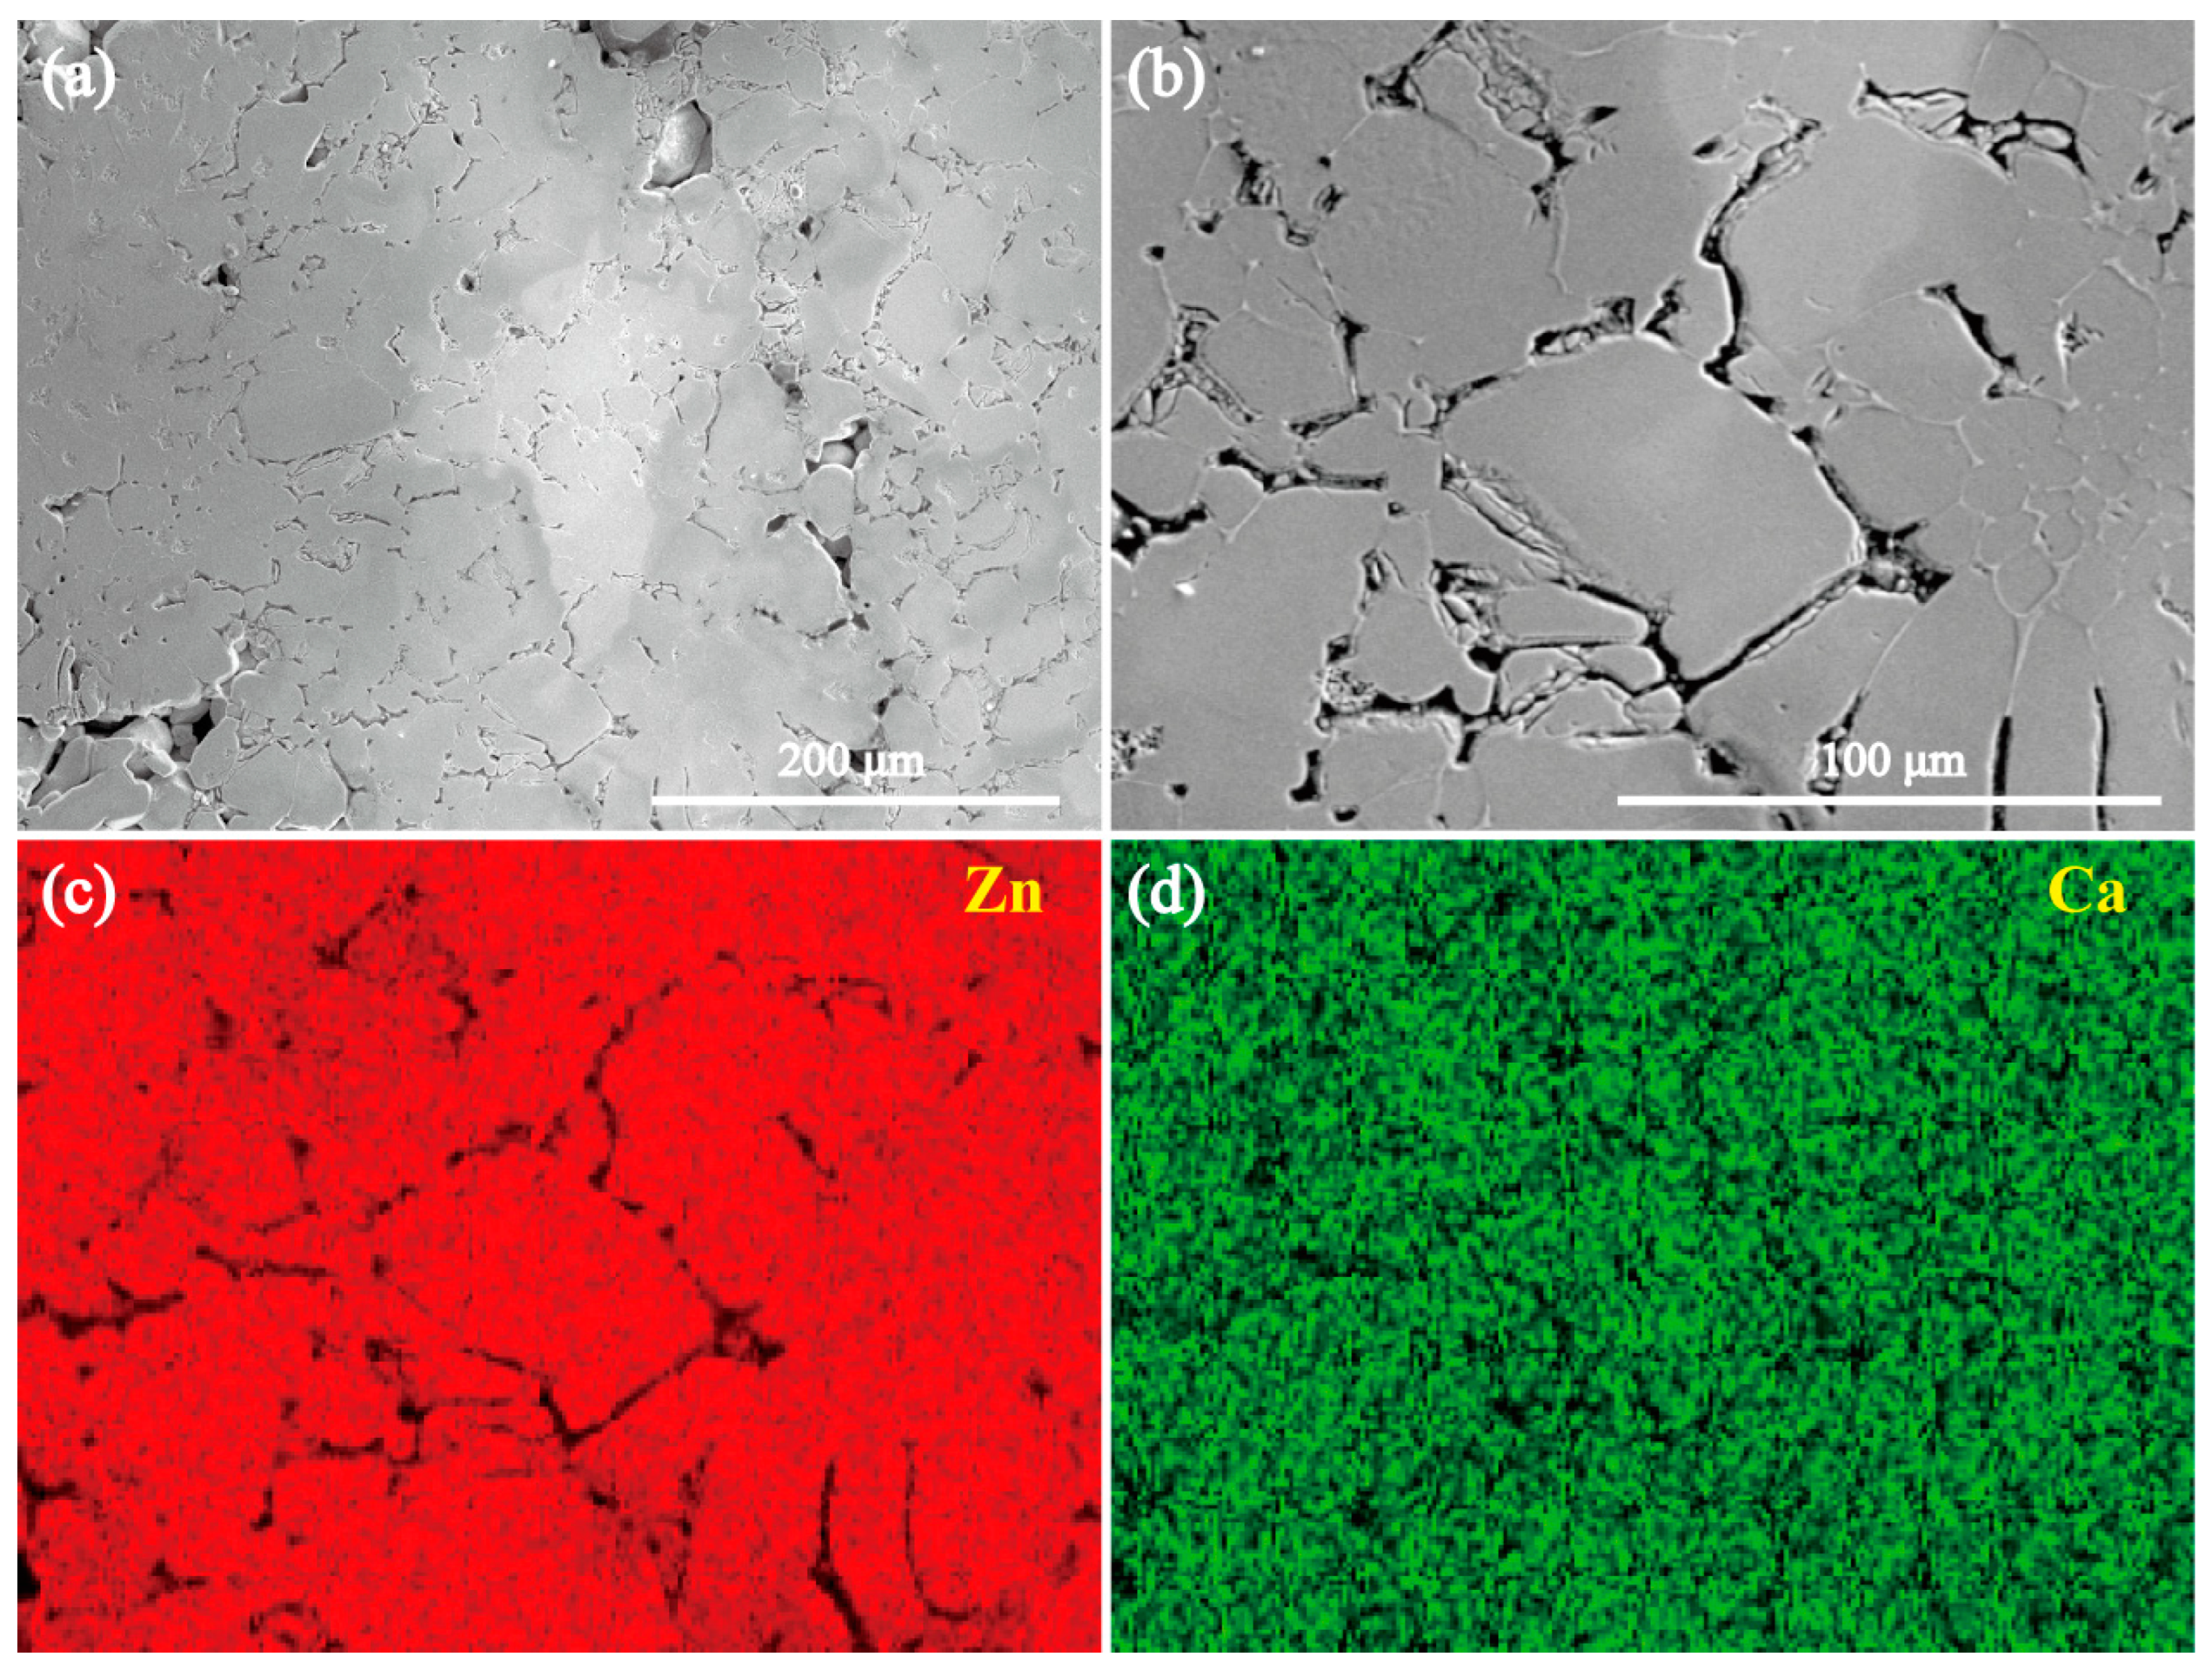
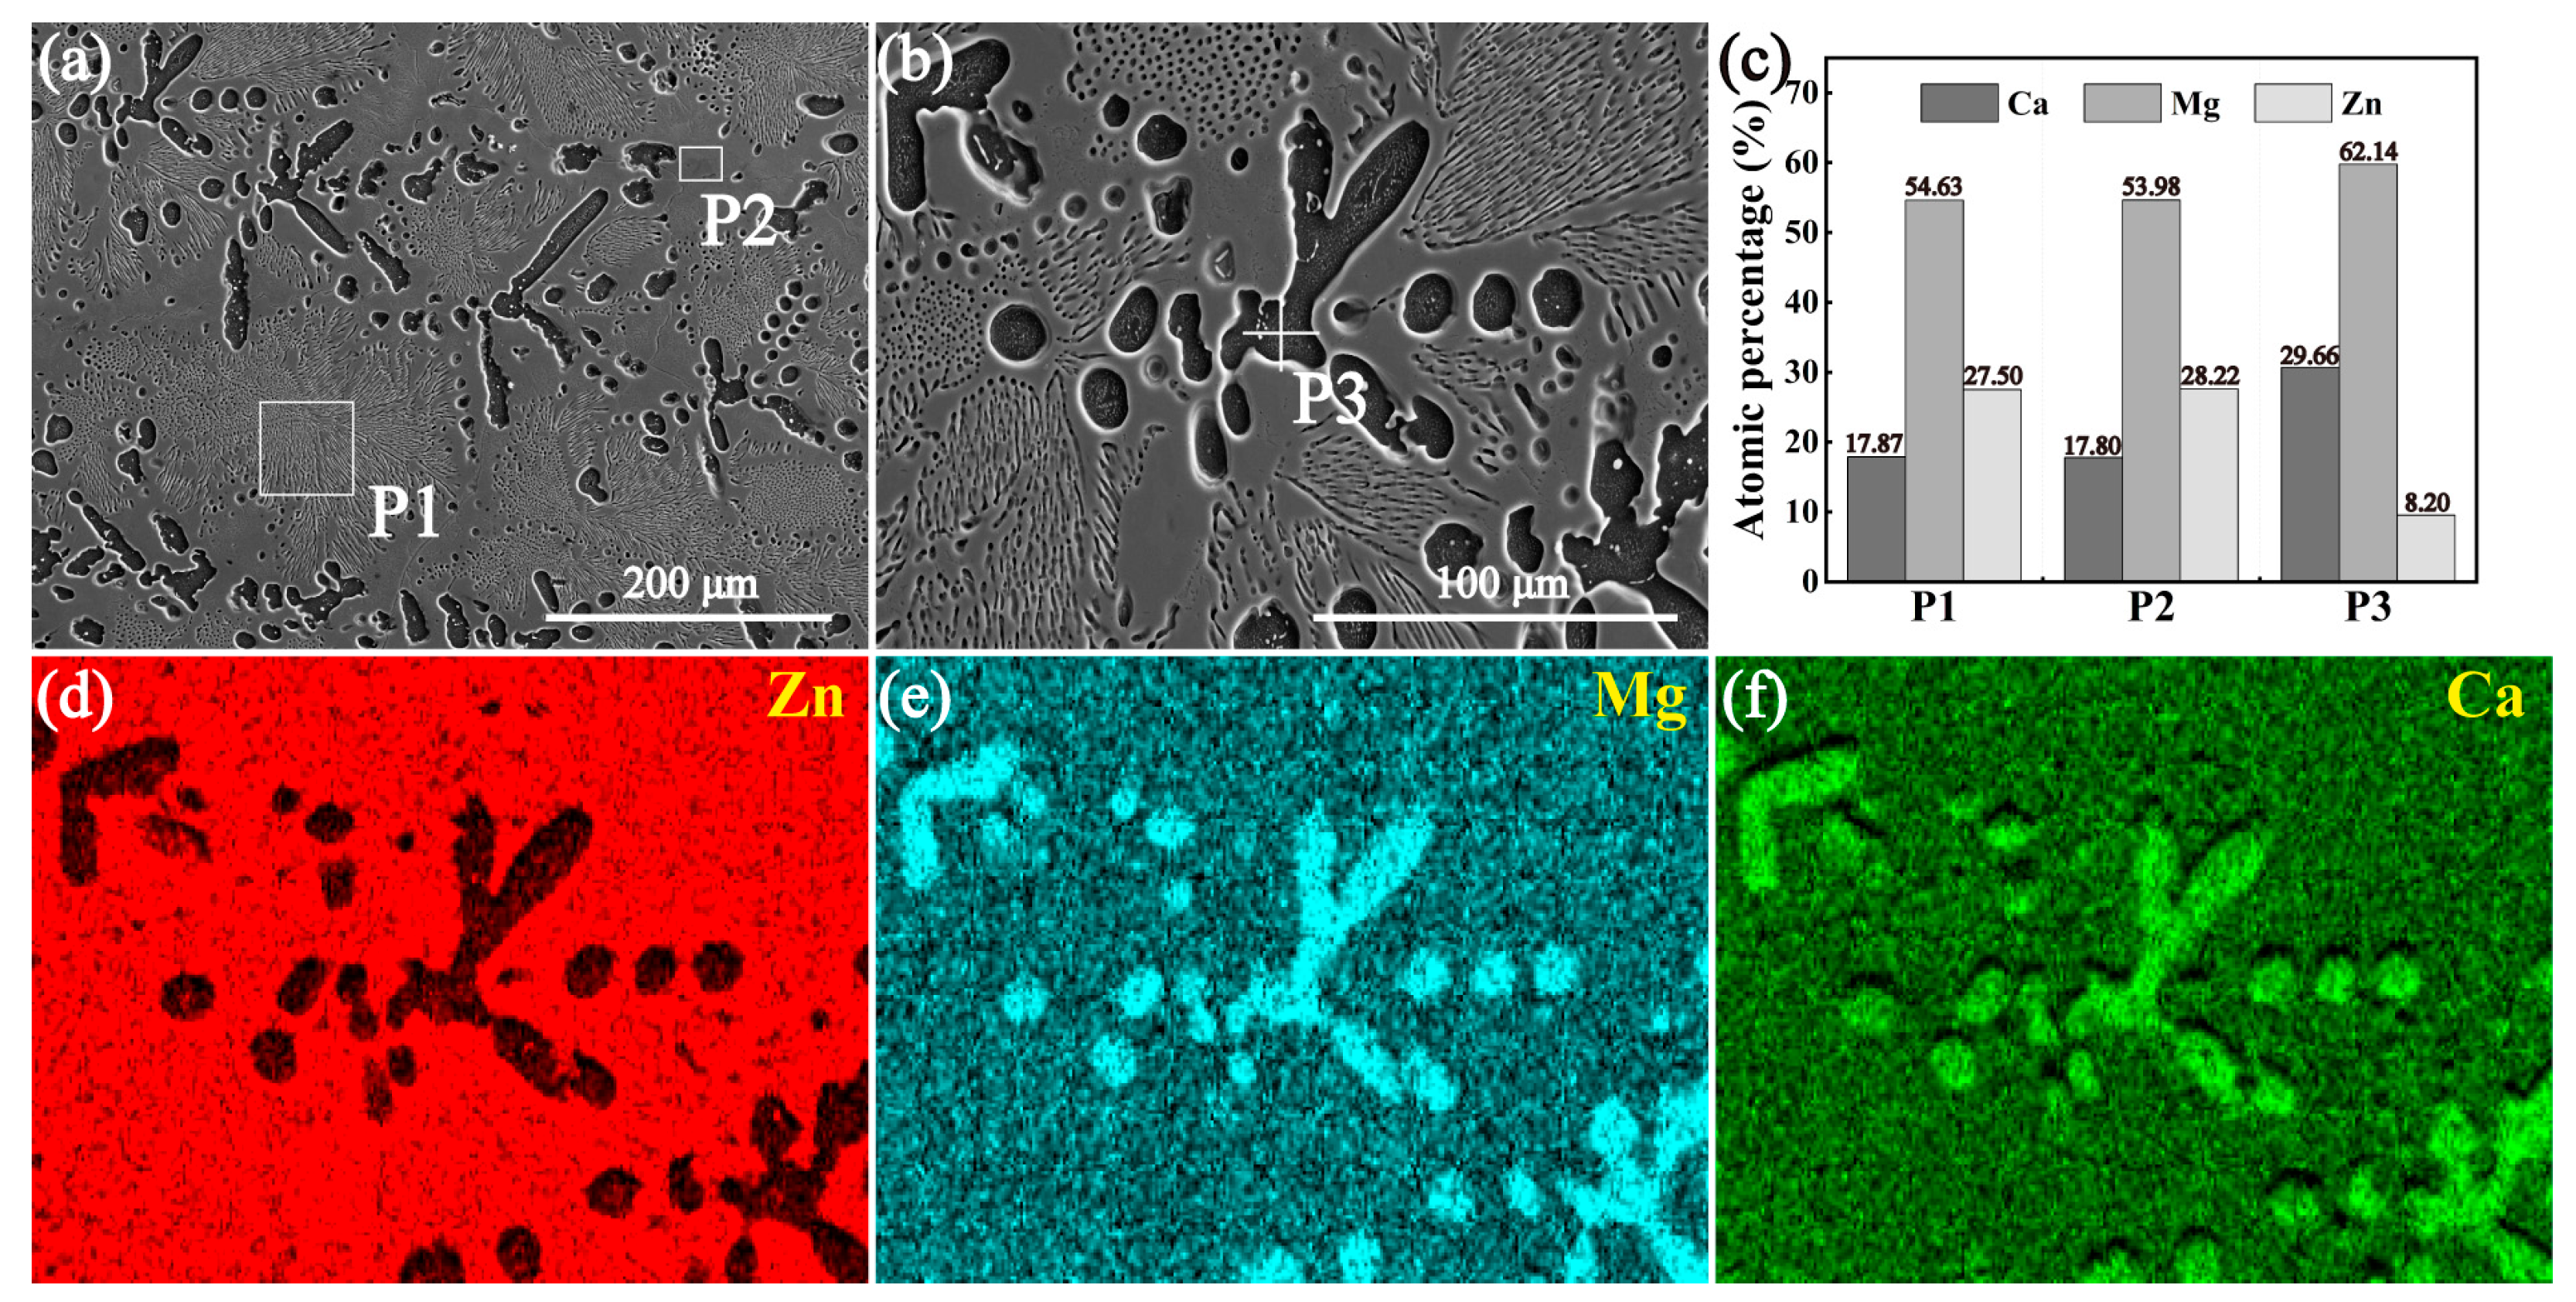
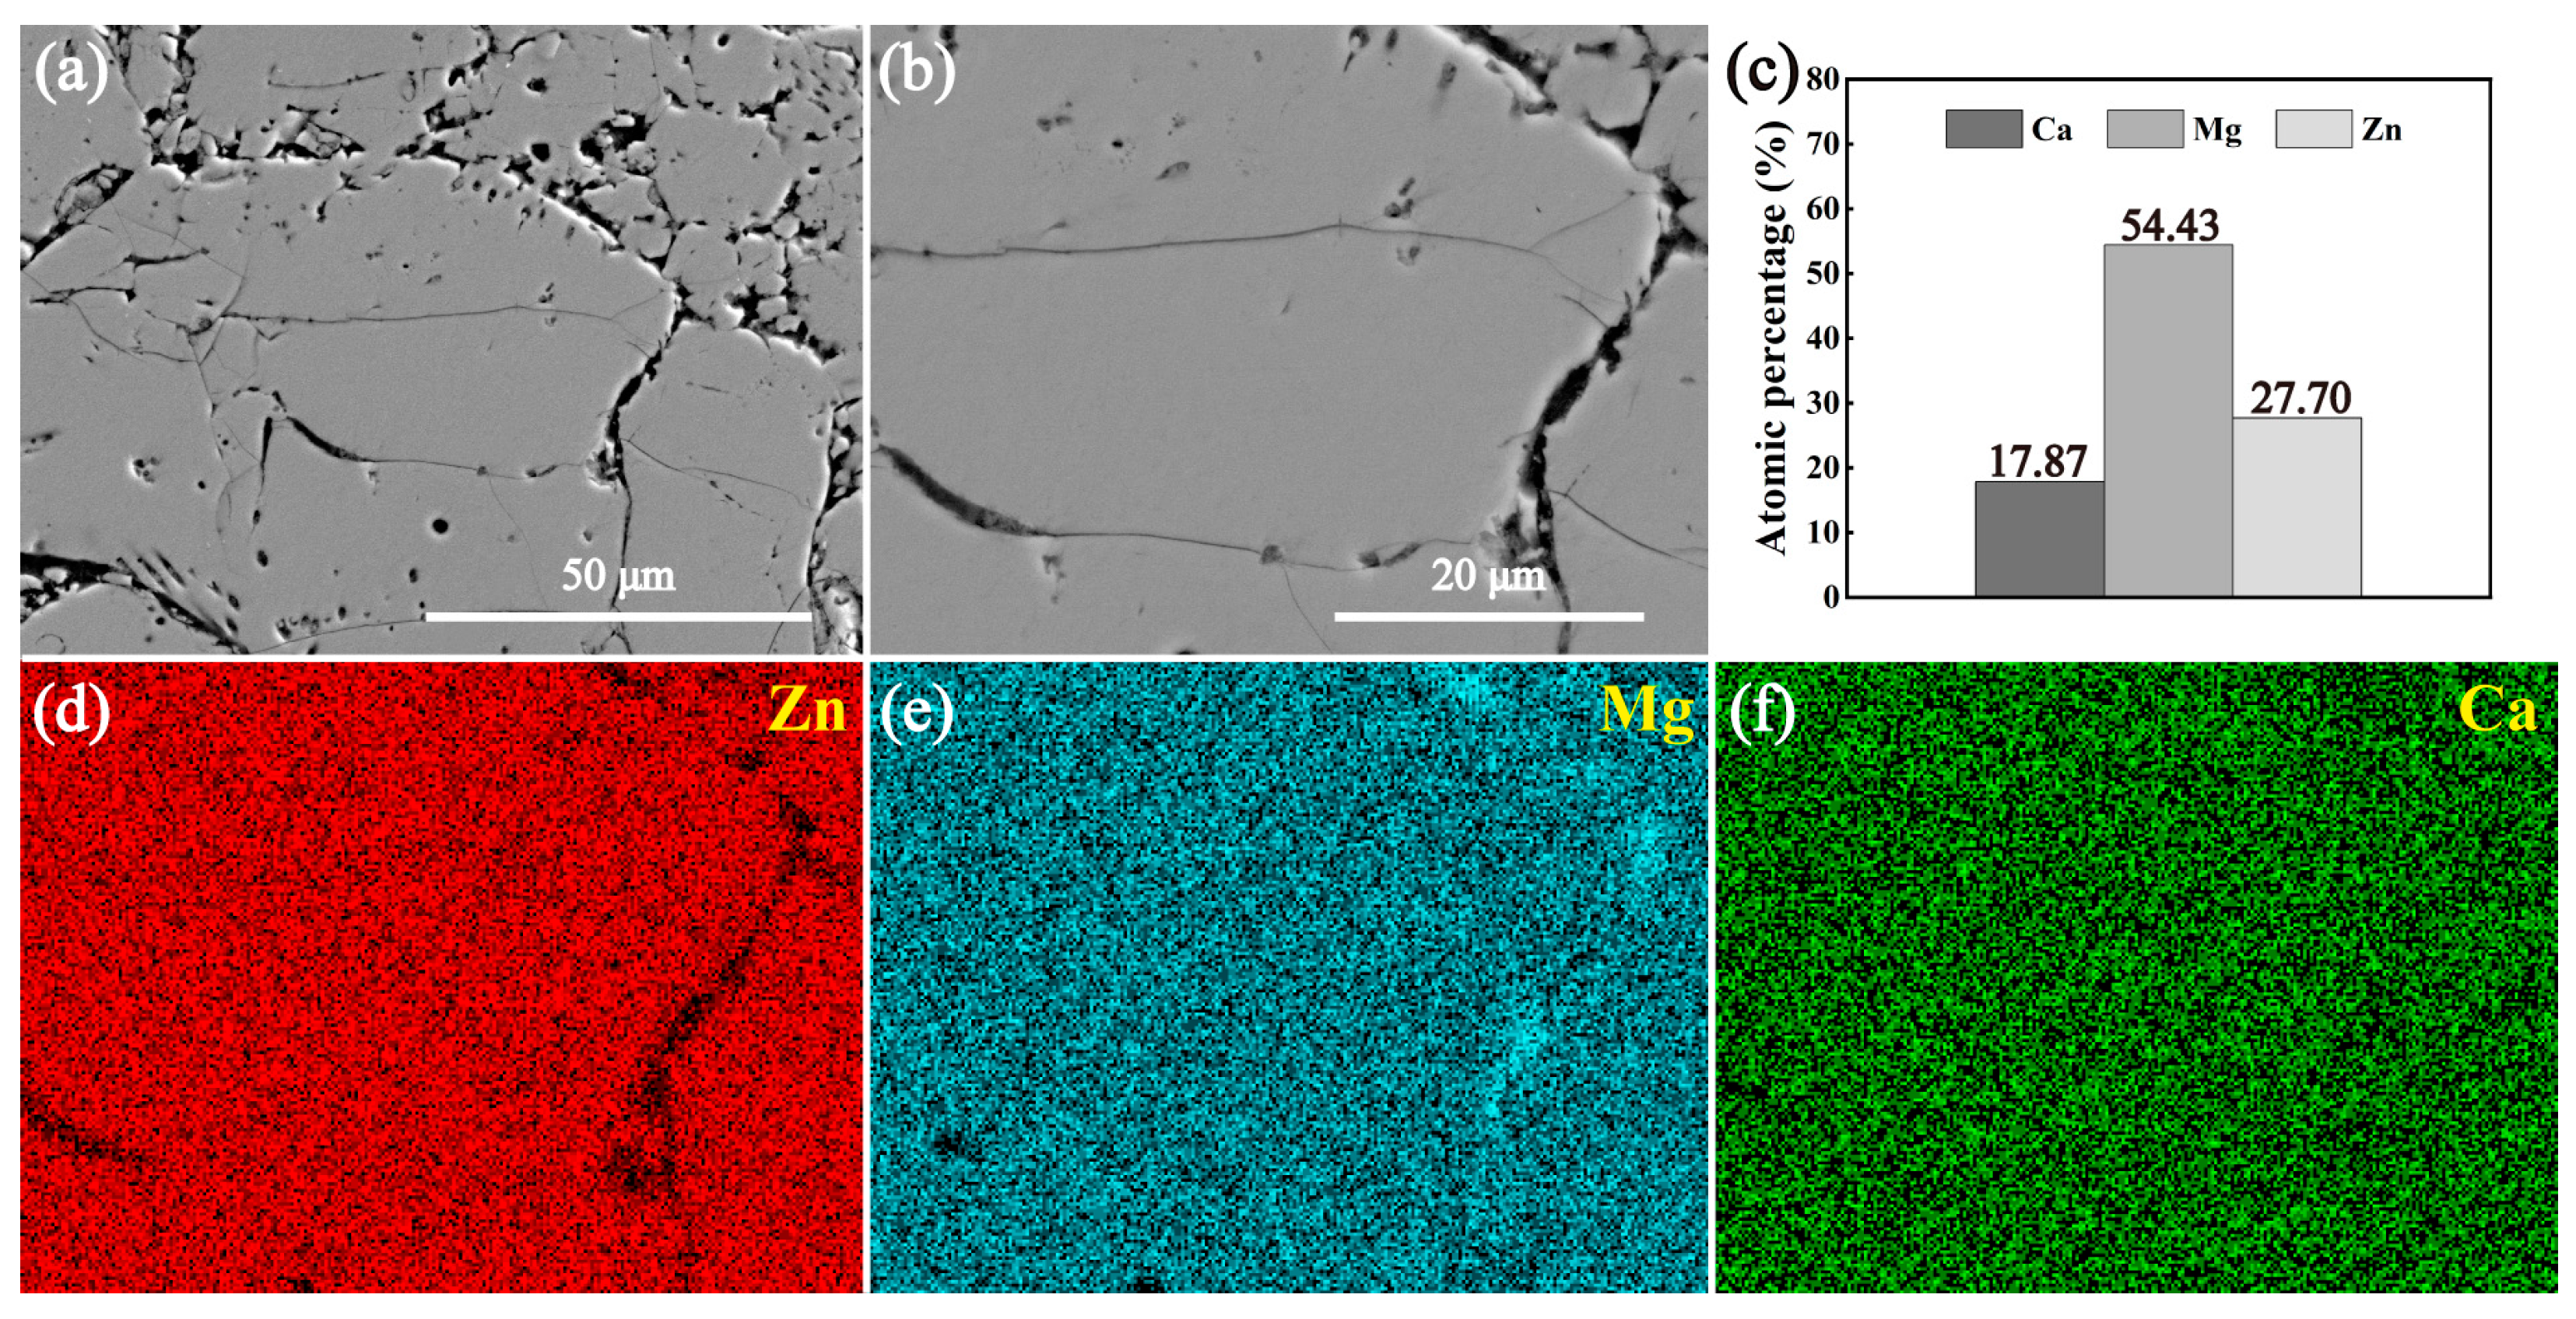
3.2. Microstructures of the Intermetallic Compounds

Figure 2 and Figure 3 present the SEM images and elemental mapping results of the MgZn2 and CaZn13 specimens, respectively. The EDS results of the areas shown in Figure 2b and Figure 3b are presented in Figure 4a and 4b, respectively. As seen in Figure 2, the contrast of the MgZn2 specimen is almost uniform; no grains and grain boundaries were observed. The elemental mapping results show that the Zn and Mg elements on the specimen are uniformly distributed (Figure 2c,d). Not only that, the EDS result (Figure 4a) for the area shown in Figure 2b also suggests that the atomic ratio of Mg/Zn is 1/2.00, indicating that the compound is MgZn2. Clearly, the result is consistent with the XRD result presented in Figure 1a. It should be noted that the microstructure shown in Figure 2 is quite different from that of the MgZn2 specimen reported by Yao et al. [31]. In the microstructure of MgZn2 reported by Yao et al. [31], MgZn2 grains are separated by obvious grain boundaries. For the CaZn13 specimen, the contrast of the specimen surface is also almost uniform except for the grain boundaries. The elemental mapping results imply that the distributions of Zn and Ca elements on the specimen are almost uniform except for the grain boundaries (Figure 3c,d). The EDS result (Figure 4b) for the area shown in Figure 3b suggests that the atomic ratio of Ca/Zn is 1/12.94, suggesting that the compound is CaZn13. Clearly, the result is also consistent with the XRD result presented in Figure 1b.
Figure 5 and Figure 6 show the SEM images and EDS mapping results of the annealed and the sintered Ca2Mg6Zn3 specimens, respectively. For the annealed Ca2Mg6Zn3 specimen, it can be seen that concave dark-colored phase and convex, relatively light-colored phase exist in the specimen (Figure 5a,b). The elemental mapping results suggest the concave dark-colored phase is rich in Mg and Ca, but poor in Zn element (Figure 5d–f). However, the convex, relatively light-colored phase is rich in Zn element, but relatively poor in Mg and Ca elements (Figure 5d–f). The EDS results of the rectangular areas P1 and P2 shown in Figure 5a suggest that the atomic ratios of Ca/Mg/Zn are 1/3.06/1.43 and 1/3.03/1.59, respectively (Figure 5c). Clearly, the two ratios are close to the atomic ratio of Ca, Mg, and Zn elements in Ca2Mg6Zn3. The atomic ratio of Ca/Mg/Zn at point P3 in Figure 5b is 1/2.10/0.28 (Figure 5c). Combined with the XRD pattern shown in Figure 1c, it can be determined that the concave dark-colored phase is Mg2Ca, and the convex, relatively light-colored phase is Ca2Mg6Zn3. In addition, the Mg2Ca phase appears concave after the Ca2Mg6Zn3 specimen is corroded by the metallographic etching solution, indicating that the Mg2Ca phase is more susceptible to corrosion than the Ca2Mg6Zn3 phase. This result is most likely related to the preferential degradation of the Mg2Ca phase as a sacrificial anode. For the sintered Ca2Mg6Zn3 specimen, it can be seen that the concave dark-colored phase existing in Figure 5 is no longer present (Figure 6a,b). The crevices in the specimen should be attributed to the fact that the green compact itself used for sintering was not completely dense and that the powders in the compact did not fully achieve metallurgical bonding during the sintering process. The elemental mapping results shown in Figure 6d–f suggest that the distributions of Zn, Mg, and Ca elements are uniform. The EDS result for the area shown in Figure 6b implies that the atomic ratio of Ca/Mg/Zn is 1:3.05:1.55 (Figure 6c), which indicates that the sintered specimen should be Ca2Mg6Zn3. Clearly, the result is still consistent with the XRD result depicted in Figure 1d.

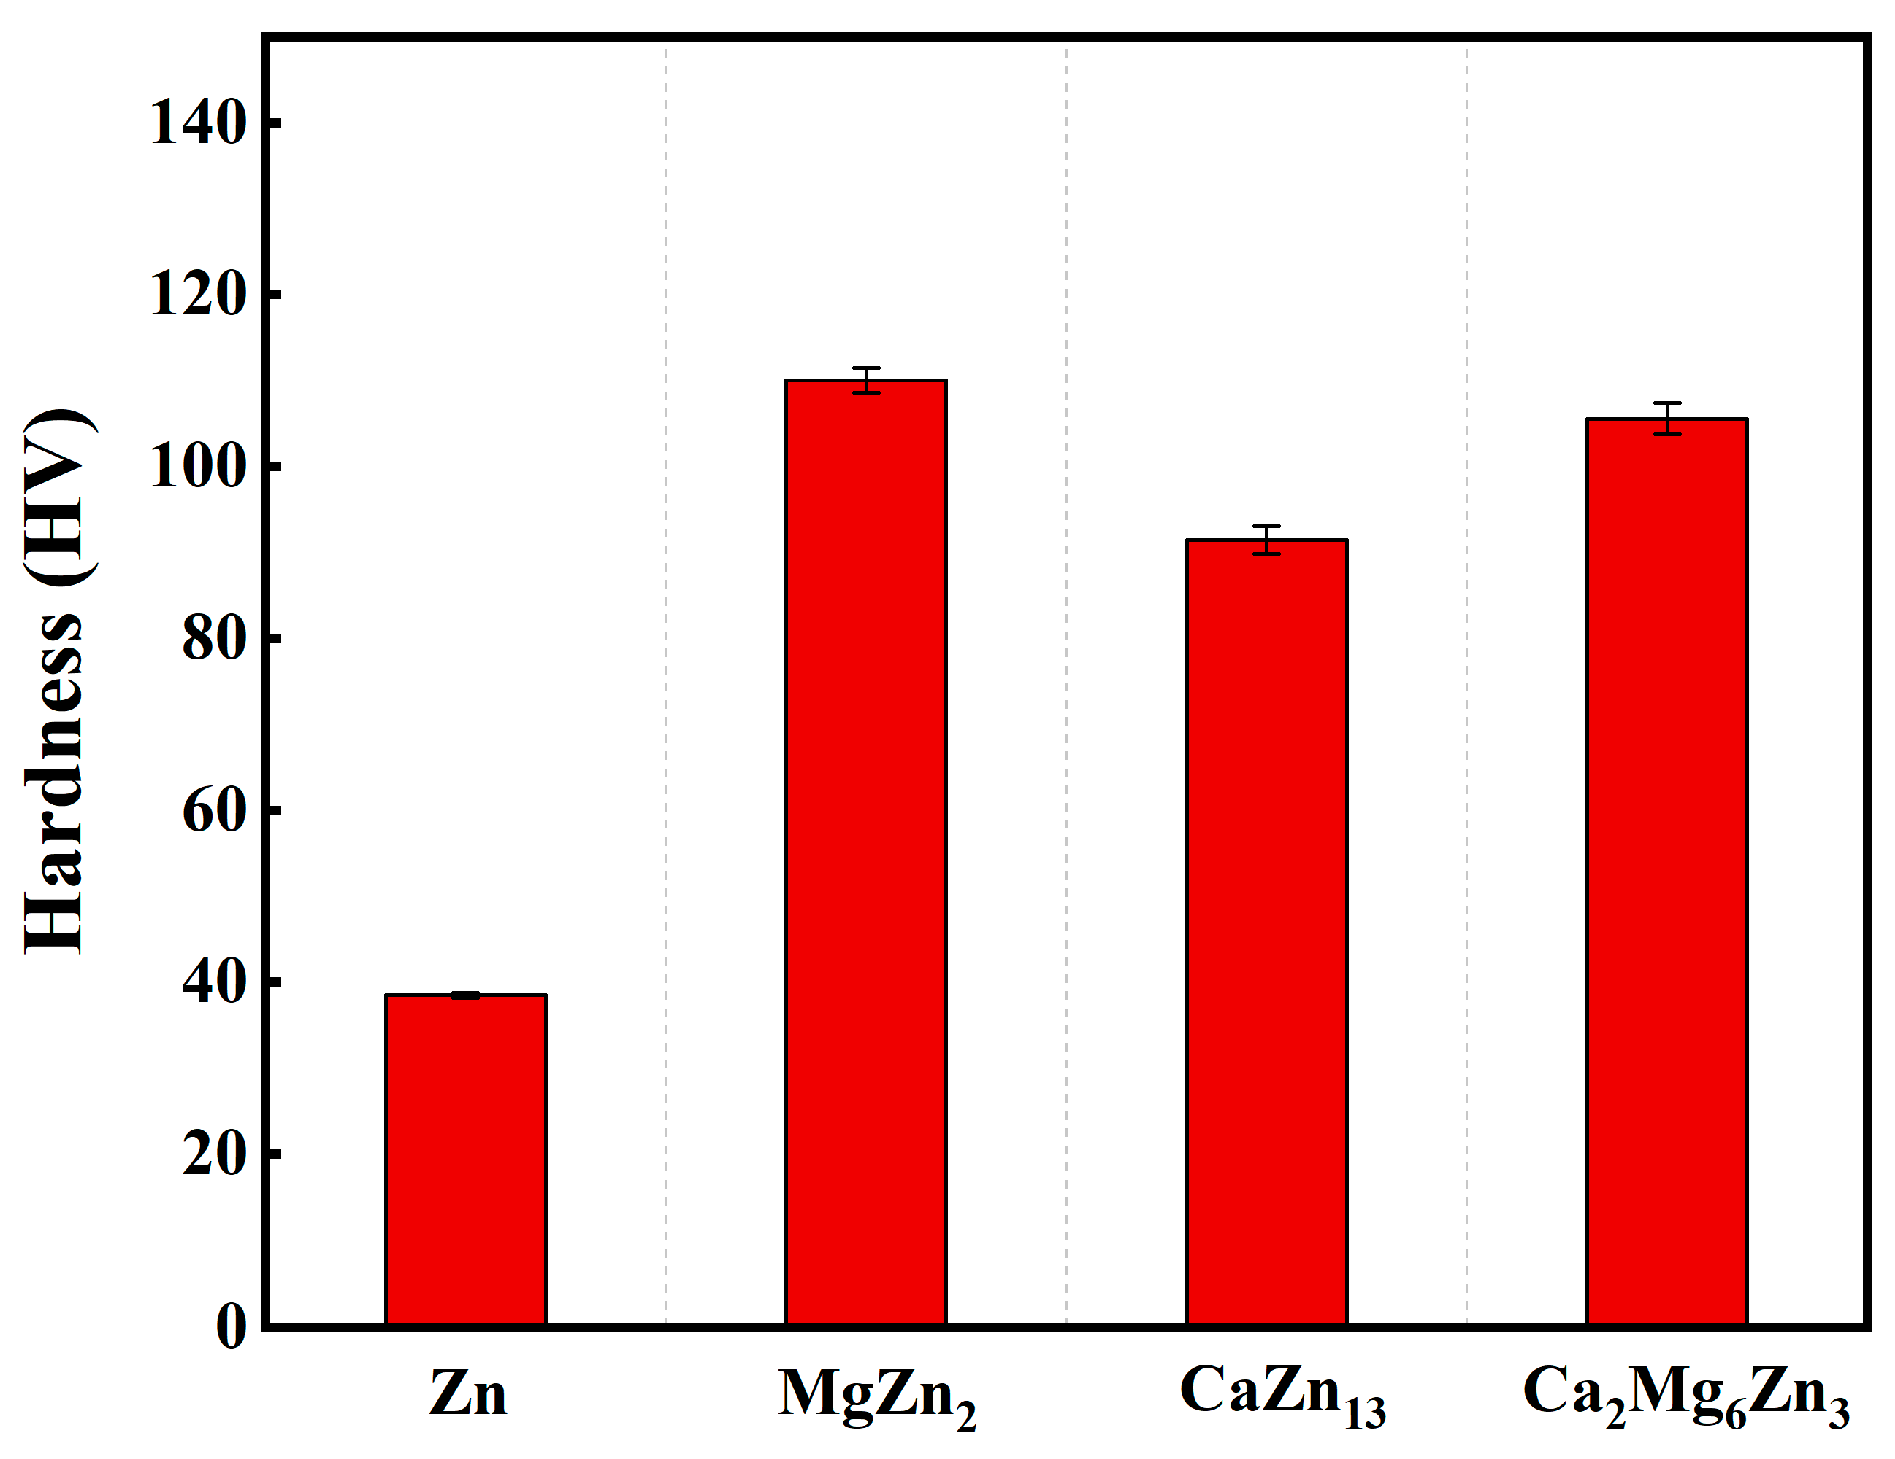
3.3. Microhardness of the Intermetallic Compounds

The microhardness of the MgZn2, CaZn13, and Ca2Mg6Zn3 specimens is plotted in Figure 7. For comparison, the microhardness of an as-cast pure Zn specimen is also provided in Figure 7. The measured hardness values of the MgZn2, CaZn13, and Ca2Mg6Zn3 specimens are 111.0 ± 1.5 HV, 94.2 ± 1.6 HV, and 108.6 ± 1.8 HV, respectively. Clearly, all of these compounds are harder than the as-cast pure Zn (38.5 ± 0.3 HV). The result suggests that the Zn-based composites reinforced by these compounds will have better mechanical properties. Furthermore, these intermetallic compounds in Zn matrix composites can also serve as sacrificial anodes to effectively regulate the degradation rates and cytotoxicity of the composites. In this way, these compounds will be able to achieve simultaneous regulation of the structure and function of the composites.

3.4. DSC/TG Curves of the Intermetallic Compounds

Figure 8 presents the DSC/TG curves of the MgZn2, CaZn13, and Ca2Mg6Zn3 specimens. The DSC curves shown in Figure 8a,b suggest that no endothermic/exothermic peaks appeared throughout the heating of the MgZn2 and CaZn13 specimens from room temperature to 773 K. The TG curves in Figure 8d,e suggest that the weight losses of the MgZn2 and CaZn13 specimens are also very slight during the heating processes. Apparently, both the MgZn2 and CaZn13 phases can exhibit good thermal stability below 773 K. This result can be attributed to the high purity of the specimens and the fact that the thermal analysis temperature did not reach their individual melting points (MgZn2: ~863 K [31], CaZn13: ~942 K [37]). For the Ca2Mg6Zn3 specimen, there is a clear endothermic peak between 719.7 and 750.9 K, and the peak tip corresponds to a temperature of 739.1 K. Based on the morphology of the Ca2Mg6Zn3 specimen in the alumina crucible after thermal analysis test obviously showing the signs of re-solidification after melting and the literature reported by Wasiur-Rahman et al. [34], it can be inferred that the endothermic peak on the DSC curve was caused by the melting of the Ca2Mg6Zn3 specimen. Although the Ca2Mg6Zn3 specimen melted during the thermal analysis test, it is still feasible to use Ca2Mg6Zn3 powders as sacrificial anodes to prepare Zn-based composites reinforced by the compound using a vacuum hot press sintering method. This is because the hot press sintering temperature of Zn-based composites is generally lower than the melting point of Zn (around 692 K). Clearly, the onset melting temperature of Ca2Mg6Zn3 (719.7 K) is still higher than the sintering temperature. In addition, it is noted that the weight loss shown in Figure 8f is also slight.

3.5. Polarization Curves of the Intermetallic Compounds

Figure 9 presents the open circuit potential (OCP) variation curves with the immersion time of the intermetallic compounds and an as-cast pure Zn specimen in SBF and 0.9% NaCl solution. The measured polarization curves of the specimens in both corrosive solutions are provided in Figure 10. The corrosion potentials (Ecorr) and the corrosion current densities (Icorr) derived from the polarization curves by the Tafel extrapolation method are summarized in Table 2. As seen in Figure 9, when the specimens were immersed in SBF or NaCl solutions for 90 min, the OCPs of the specimens were basically stable. The OCP order of the specimens in both solutions is Zn > MgZn2 > CaZn13 > Ca2Mg6Zn3. The polarization curve measurements suggest that the intermetallic compounds and the pure Zn specimen exhibit a corrosion potential order consistent with the OCP order (Figure 10 and Table 2). The results clearly confirm that the three compounds can act as sacrificial anodes in Zn-based composites to protect the cathodic Zn matrix. The reason why the corrosion potential of these compounds is lower than that of the pure Zn specimen can be attributed to the fact that the electrode potentials for the anodic oxidation reactions of Ca and Mg are significantly lower than that of Zn (−2.87 VSHE-Ca and −2.372 VSHE-Mg vs. −0.762 VSHE-Zn). Therefore, the electrode potentials of the compounds formed by the combination of Zn with Mg and/or Ca elements is inevitably lower than that of pure Zn. The inference has been verified by some studies to be reliable. For example, Dong et al. [38] reported that the corrosion potential of MgZn2 in SBF was around −1.221 VSCE, which was more negative than that of pure Zn (−1.218 VSCE). Byun et al. [32] reported that the corrosion potential of MgZn2 in 3.5% NaCl solution was −1.083 VAg/AgCl, which was also lower than that of pure Zn (−1.040 VAg/AgCl). The experimental results reported by Yao et al. [31] also suggest that the corrosion potential of MgZn2 in 3.5% NaCl is lower than that of pure Zn (−0.79 VSHE vs. −0.74 VSHE). Besides that, the results of the electrochemical tests in our work also suggest that the corrosion potential of the compounds is not only related to the electrode potential of non-Zn elements existing in the compounds, but also influenced by the contents of these non-Zn elements. In addition to the corrosion potential, the corrosion current density of the compounds and pure Zn specimen also exhibits the same order in SBF and 0.9% NaCl solution, that is, pure Zn < MgZn2 < CaZn13 < Ca2Mg6Zn3. Similar results were also reported in the literature. For example, Dong et al. [38] reported that the corrosion current density of MgZn2 was also higher than that of pure Zn (47.5 μA/cm2 vs. 39.5 μA/cm2). The reason for the greater current densities of the compounds may be due to the fact that these compounds possess more negative potentials, thus making them exhibit stronger chemical activity in corrosive media. In addition, the oxide films on these compounds may not be as dense as that on the pure Zn specimen (the oxide densification coefficients of the three oxides are αCaO = 0.647, αMgO = 0.779, and αZnO = 1.585, respectively).

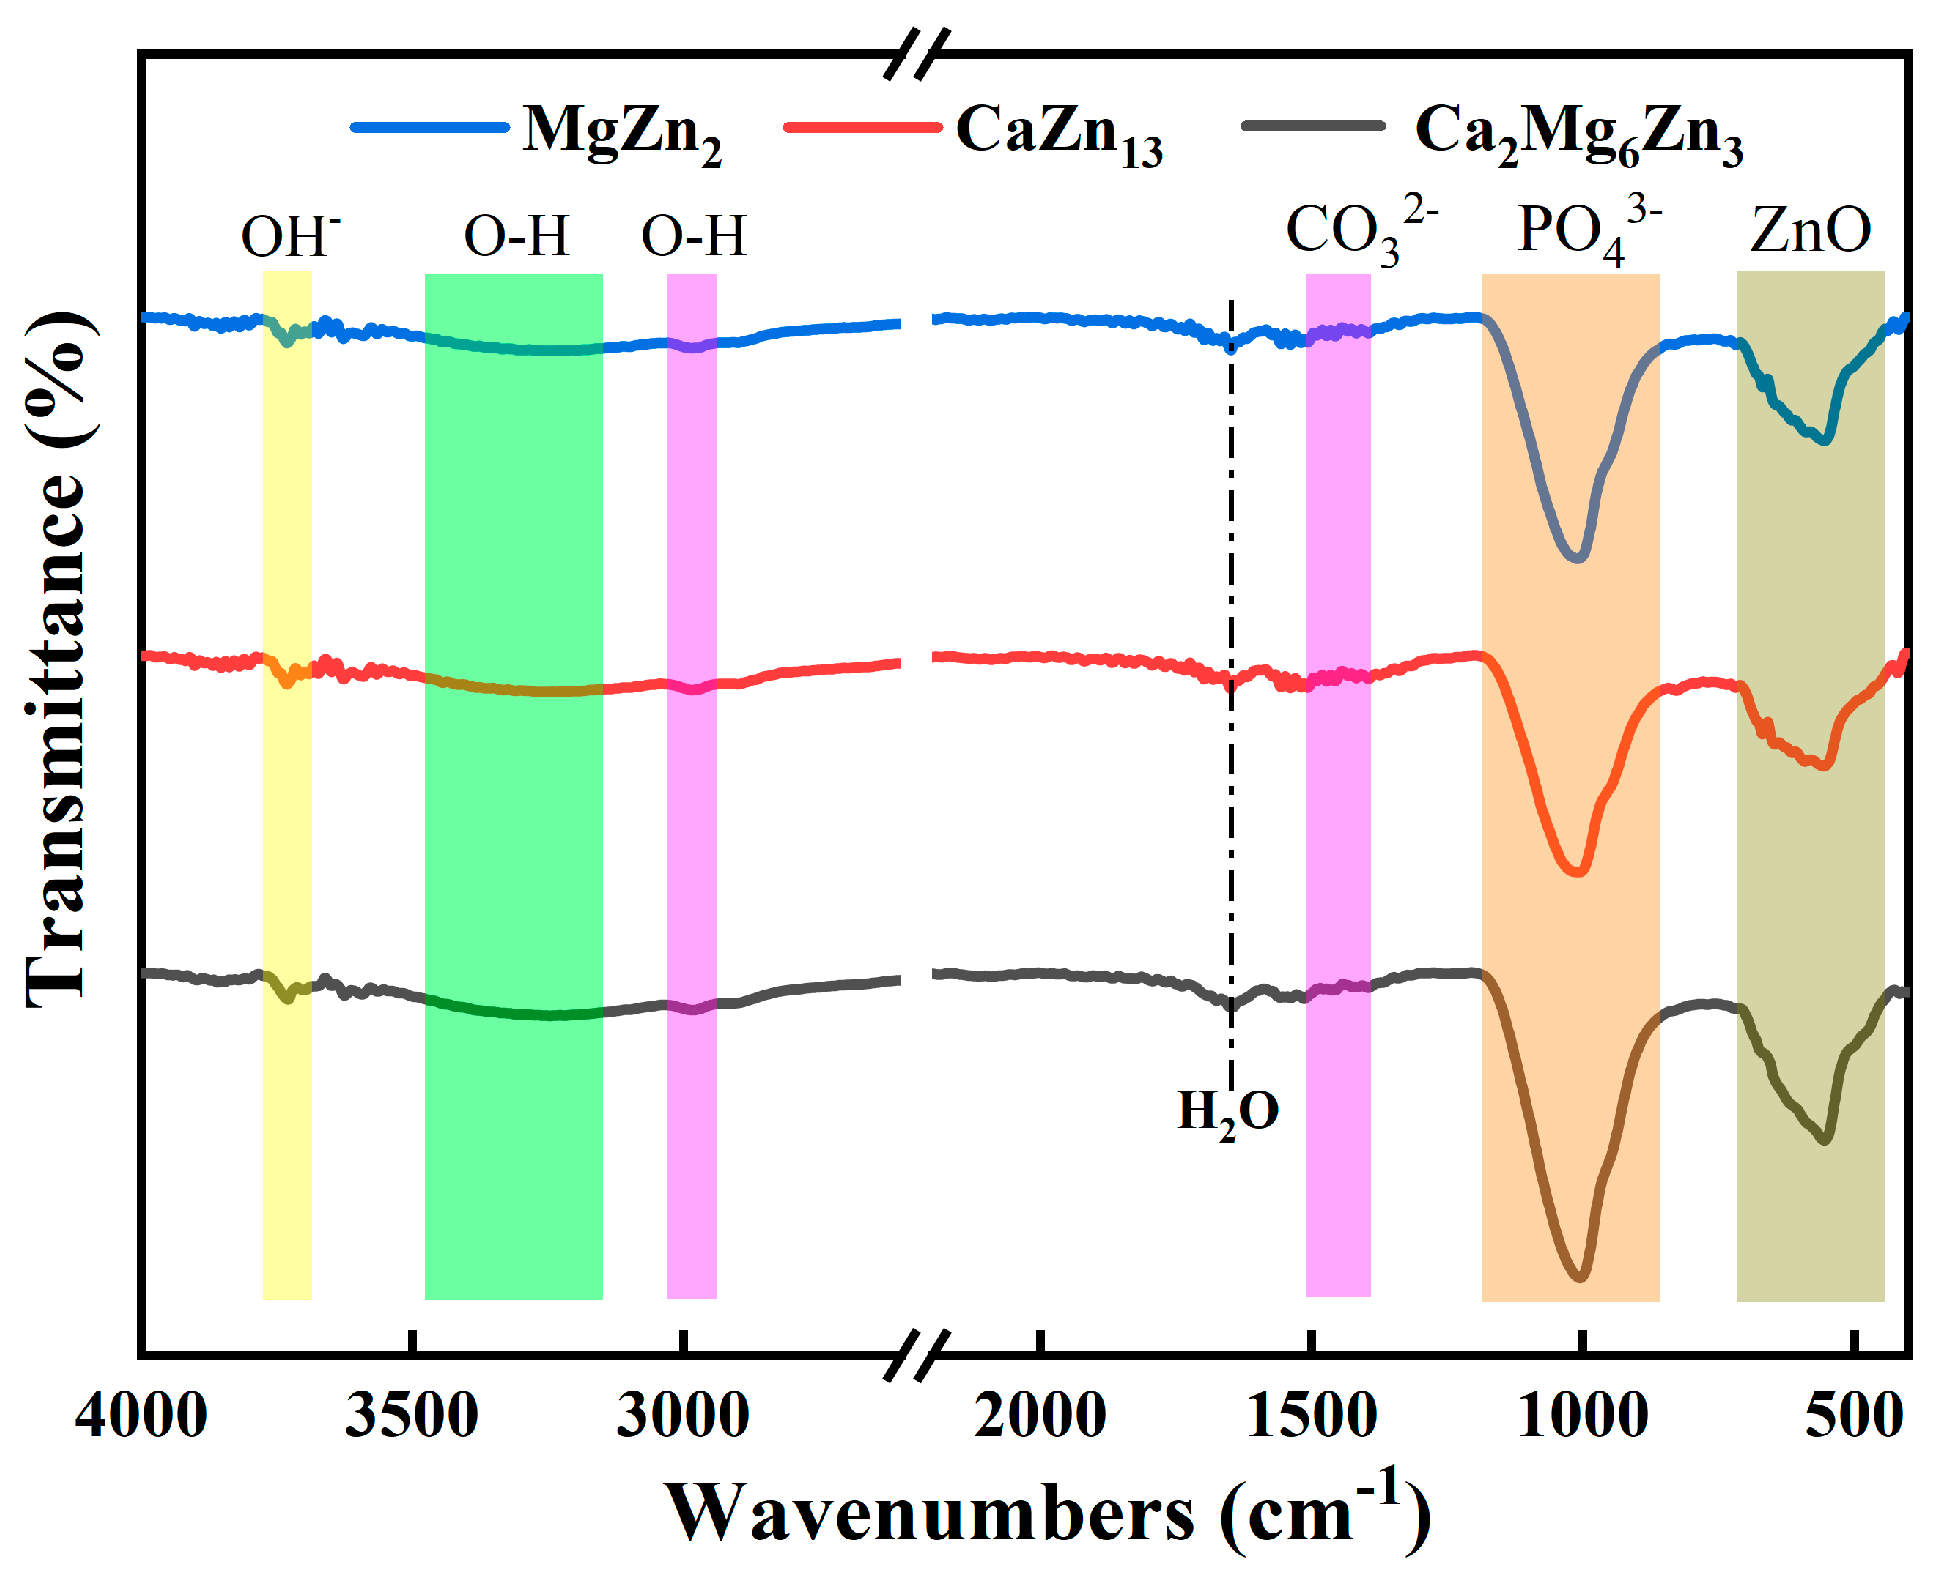
3.6. Degradation Behaviors of the Intermetallic Compounds in Corrosive Solutions

The measured metal ion concentrations in the 0.9% NaCl solutions after soaking the intermetallic compounds for 24 h are listed in Table 3. The calculated concentration ratios of the metal ions dissolved in the NaCl solutions soaking the MgZn2, CaZn13, and Ca2Mg6Zn3 specimens are 1/1.87 (Mg2+/Zn2+), 1/13.29 (Ca2+/Zn2+), and 1/3.07/1.60 (Ca2+/Mg2+/Zn2+), respectively. It can be seen that the concentration ratio of the metal ions dissolved in the NaCl solution approximately corresponds to the atomic ratio of the elements in each compound, that is, these compounds should be degraded according to the atomic ratio of the elements in each compound. Then the anodic degradation reactions of these compounds during immersion tests can be expressed as follows:
MgZn2 = Mg2+ + 2Zn2+ + 6e
CaZn13 = Ca2+ + 13Zn2+ + 28e
Ca2Mg6Zn3 = 2Ca2+ + 6Mg2+ + 3Zn2+ + 22e
Figure 11 depicts the pH variations of the SBF solutions soaking the intermetallic compounds and as-cast pure Zn specimens during immersion tests. For the as-cast pure Zn, MgZn2, and CaZn13 specimens, the pH values of the SBF solutions containing these specimens show very similar variations during the initial 24 h of immersion, all increasing from 7.40 to 7.44 or 7.45 with a small slope. Then, the pH values continued to slowly increase with a much smaller slope until the end of the immersion. At last, the pH values of the SBF solutions containing the as-cast pure Zn, MgZn2, and CaZn13 specimens reached 7.51, 7.52, and 7.55, respectively. In addition, it is also worth noting that the pH value of the SBF containing the CaZn13 specimen is slightly higher than that containing the MgZn2 specimen, and the pH value of the SBF containing the MgZn2 specimen is also slightly higher than that containing the pure Zn specimen in the middle and late stages of the immersion tests (after 72 h of immersion). For the Ca2Mg6Zn3 specimen, the pH variation in the SBF is quite different. After the first 6 h of immersion, the pH value quickly increased from 7.40 to 7.75. Then the pH value of the immersion solution continued to rise slowly with time. At the end of the immersion, the pH of the soaking solution reached 8.5. Obviously, the SBF containing the Ca2Mg6Zn3 specimen exhibited the largest pH growth rate as well as the highest pH value during the entire immersion tests among the four specimens. Since the cathodic reaction associated with the electrochemical corrosion of Zn-based materials is known to release OH ions (Equation (4)) [3,35], the pH value of the immersion solution can reflect to some extent the degradation rate of the specimen. Based on this point, it can be concluded that the Ca2Mg6Zn3 specimen has the fastest degradation rate, followed by the CaZn13 and MgZn2 specimens. The as-cast pure Zn specimen exhibits the slowest degradation rate. Apparently, this result is consistent with the degradation rate ordering obtained from the polarization curves (Table 2).
2H2O+ O2 + 4e = 4OH
Figure 12 shows the SEM images of the intermetallic compounds after immersion in SBF for different periods of time. As shown in Figure 12a,b, after 1 day of the immersion test, some light-colored, nearly spherical corrosion products with varying sizes had deposited on the MaZn2 specimen, either in clusters or as individual particles. Apparently, many areas of the MgZn2 surface remained exposed at this time, and an original scratch on the specimen’s surface could also be seen (indicated by the yellow arrow in Figure 12b). Similar to the MaZn2 specimen, both clustered and individual granular corrosion products were observed on the CaZn13 and Ca2Mg6Zn3 specimens, but the amount of corrosion products increased (Figure 12c–f). Additionally, a tiny crack was found in the dark-colored area of the CaZn13 specimen (indicated by the yellow arrow in Figure 12d). Yuan et al. [36] and Zhang et al. [3] believed that the formation of cracks was caused by the dehydration of the corrosion products during the drying of the specimen after immersion tests. The finer the crack, the thinner the layer of corrosion products is likely to be. For the Ca2Mg6Zn3 specimen, a greater number of cracks were observed on the specimen surface (indicated by the yellow arrows in Figure 12e,f), and some of them had large gaps, indicating that the corrosion product layer had become thicker. After 4 days of immersion, the corrosion products deposited on the surfaces of all specimens further increased, with nearly spherical corrosion products accumulating more densely, particularly on the surface of the Ca2Mg6Zn3 specimen. However, some areas on the surface of the MgZn2 specimen may still be uncovered by corrosion products. For the CaZn13 and Ca2Mg6Zn3 specimens, cracked corrosion product layers were also observed in the relatively flat pits between the clusters of corrosion product particles, indicating that the surfaces of the two specimens were all covered with corrosion products. After 7 days of immersion tests, all specimen surfaces were covered with corrosion products. Due to the limited growth space, some corrosion product particles came into contact with each other and squeezed together during the growth process, forming larger corrosion product particles.
The EDS results of the corrosion products on the specimens after 7 days of immersion are shown in Figure 13. It can be seen that all the corrosion products contain the elements Zn, Ca, P, Mg, O, and C, which is consistent with the EDS results of the corrosion products deposited on Zn-based implants after immersion tests in Hank’s solution or SBF for 28 days, as reported by Yuan et al. [36] and Zhang et al. [3]. The MgZn2 specimen does not contain Ca; therefore, the detected Ca element on this specimen evidently originates from the SBF solution. Similarly, the Mg element present on the CaZn13 surface also comes from the immersion solution. In addition, the Mg content on the MgZn2 specimen is higher than that on the CaZn13 specimen (1.67% vs. 0.20%); the additional Mg is likely derived from the degradation of the MgZn2 itself. Likewise, the extra Ca detected on the CaZn13 specimen is likely a result of the degradation of the CaZn13 itself. Based on this analysis, it can be further inferred that the higher contents of Ca and Mg on the Ca2Mg6Zn3 specimen are partly due to its own degradation. Among the three intermetallic compounds, the Ca2Mg6Zn3 specimen has the fastest degradation rate (Table 2) and the highest pH value during the immersion tests (Figure 11). The fastest degradation rate means that more Mg2+ and Ca2+ could be accumulated on the Ca2Mg6Zn3 specimen after immersion in SBF for the same time. The higher pH value was beneficial for the deposition of calcium phosphates on the specimen [39].
The FTIR spectra of the intermetallic compounds MgZn2, CaZn13, and Ca2Mg6Zn3 specimens after immersion in SBF for 7 days are shown in Figure 14. It can be seen that the corrosion products deposited on the three compounds have similar FTIR spectrums. The characteristic peaks of the functional groups in the FTIR spectra indicate that the corrosion products deposited on the compounds contain ZnO (553 cm−1) [40,41,42], PO43− (1006 cm−1) [40,41,42,43], CO32− (1400–1500 cm−1) [40,41,42,43], absorbed water (3100–3500 cm−1, 2980 cm−1, and 1651 cm−1) [43,44,45], and OH (3735 cm−1) [44,45]. The results are also similar to the FTIR results of the corrosion products deposited on Zn-based implants after immersion tests in Hank’s solution or SBF for 28 days, as reported by Yuan et al. [36] and Zhang et al. [3].
Generally, Zn(OH)2 and ZnO are the most common corrosion products when Zn-based implants degrade in vitro or in vivo [1,3,35,36,46,47,48,49]. The involved anodic reaction for the degradation of Zn is described in Equation (5), while the corresponding cathodic reaction is shown in Equation (4). The Zn2+ produced in Equation (5) reacts with the OH generated in Equation (4) to form Zn(OH)2 (Equation (6)). This Zn(OH)2 can subsequently be converted into the more stable ZnO, as represented in Equation (7), with prolonged immersion or implantation time. Some references have also reported corrosion products caused by the degradation of MgZn2 and Mg2Zn11 in corrosive media. For example, Byun et al. [32] reported that Zn(OH)2 was found on the surfaces of MgZn2 and Mg2Zn11 specimens that had undergone electrochemical tests in 3.5% NaCl solution. Besides that, MgO was also detected on the MgZn2 surface.
For the intermetallic compounds prepared in this work, their anodic degradation reactions can be expressed by Equations (1)–(3), respectively. Since all intermetallic compounds can generate Zn2+ during the degradation process, it is reasonable to infer, based on the experimental results of degradation products of numerous Zn-based implant materials [1,3,35,36,46,47,48,49], the report by Byun et al. [32], and the results shown in Figure 13 and Figure 14, that Zn(OH)2 and ZnO are likely present in the corrosion products deposited on the three intermetallic compounds after the immersion tests. Additionally, the Mg2+ produced by the degradation of the intermetallic compounds may also be converted into MgO or other compounds containing Mg element. It is known that the cations accumulated on the surfaces of the compounds can absorb anions [35], such as PO43− and CO33−, present in the immersion solutions, and the degradation products generally contain various phosphates and carbonates containing Zn or Ca [3,23,35,36,46]. For example, Yuan et al. [36] and Zhang et al. [3] reported that the corrosion products deposited on the PLA/Zn composite and porous Zn-Mg-Y scaffolds after immersion in Hank’s solution or SBF for 28 days contain zinc phosphate and calcium carbonate. Due to the similar EDS and FTIR results of the corrosion products deposited on the intermetallic compounds in this work as in references [3,36], it can be reasonably inferred that the corrosion products deposited on the compounds should also contain zinc phosphate and calcium carbonate in addition to Zn(OH)2 and ZnO. Of course, further experiments are needed to verify the inference.
Zn = Zn2+ + 2e
Zn2+ + 2OH = Zn(OH)2
Zn(OH)2 = ZnO + H2O
The SEM images of the intermetallic compounds after immersion in SBF for 7 days, followed by cleaning of the corrosion products with a chromic acid solution, are shown in Figure 15. During the 7-day immersion test, severe localized corrosion occurred on the surface of the MgZn2 specimen, resulting in an uneven distribution of corrosion pits with different sizes (Figure 15a). Even the areas that appear flat at low magnification (Figure 15a) also contain many small corrosion pits when viewed at high magnification (Figure 15b). For the CaZn13 and Ca2Mg6Zn3 specimens, the original flat surfaces were no longer visible; instead, the surfaces became very rough and uneven, indicating that severe corrosion occurred during the immersion tests. Especially for the Ca2Mg6Zn3 specimen, the remaining exposed surface is riddled with holes, indicating that this specimen experienced the most severe corrosion (Figure 15e,f). Clearly, the degrees of corrosion for the specimens are consistent with the degradation rates of the compounds presented in Table 2.

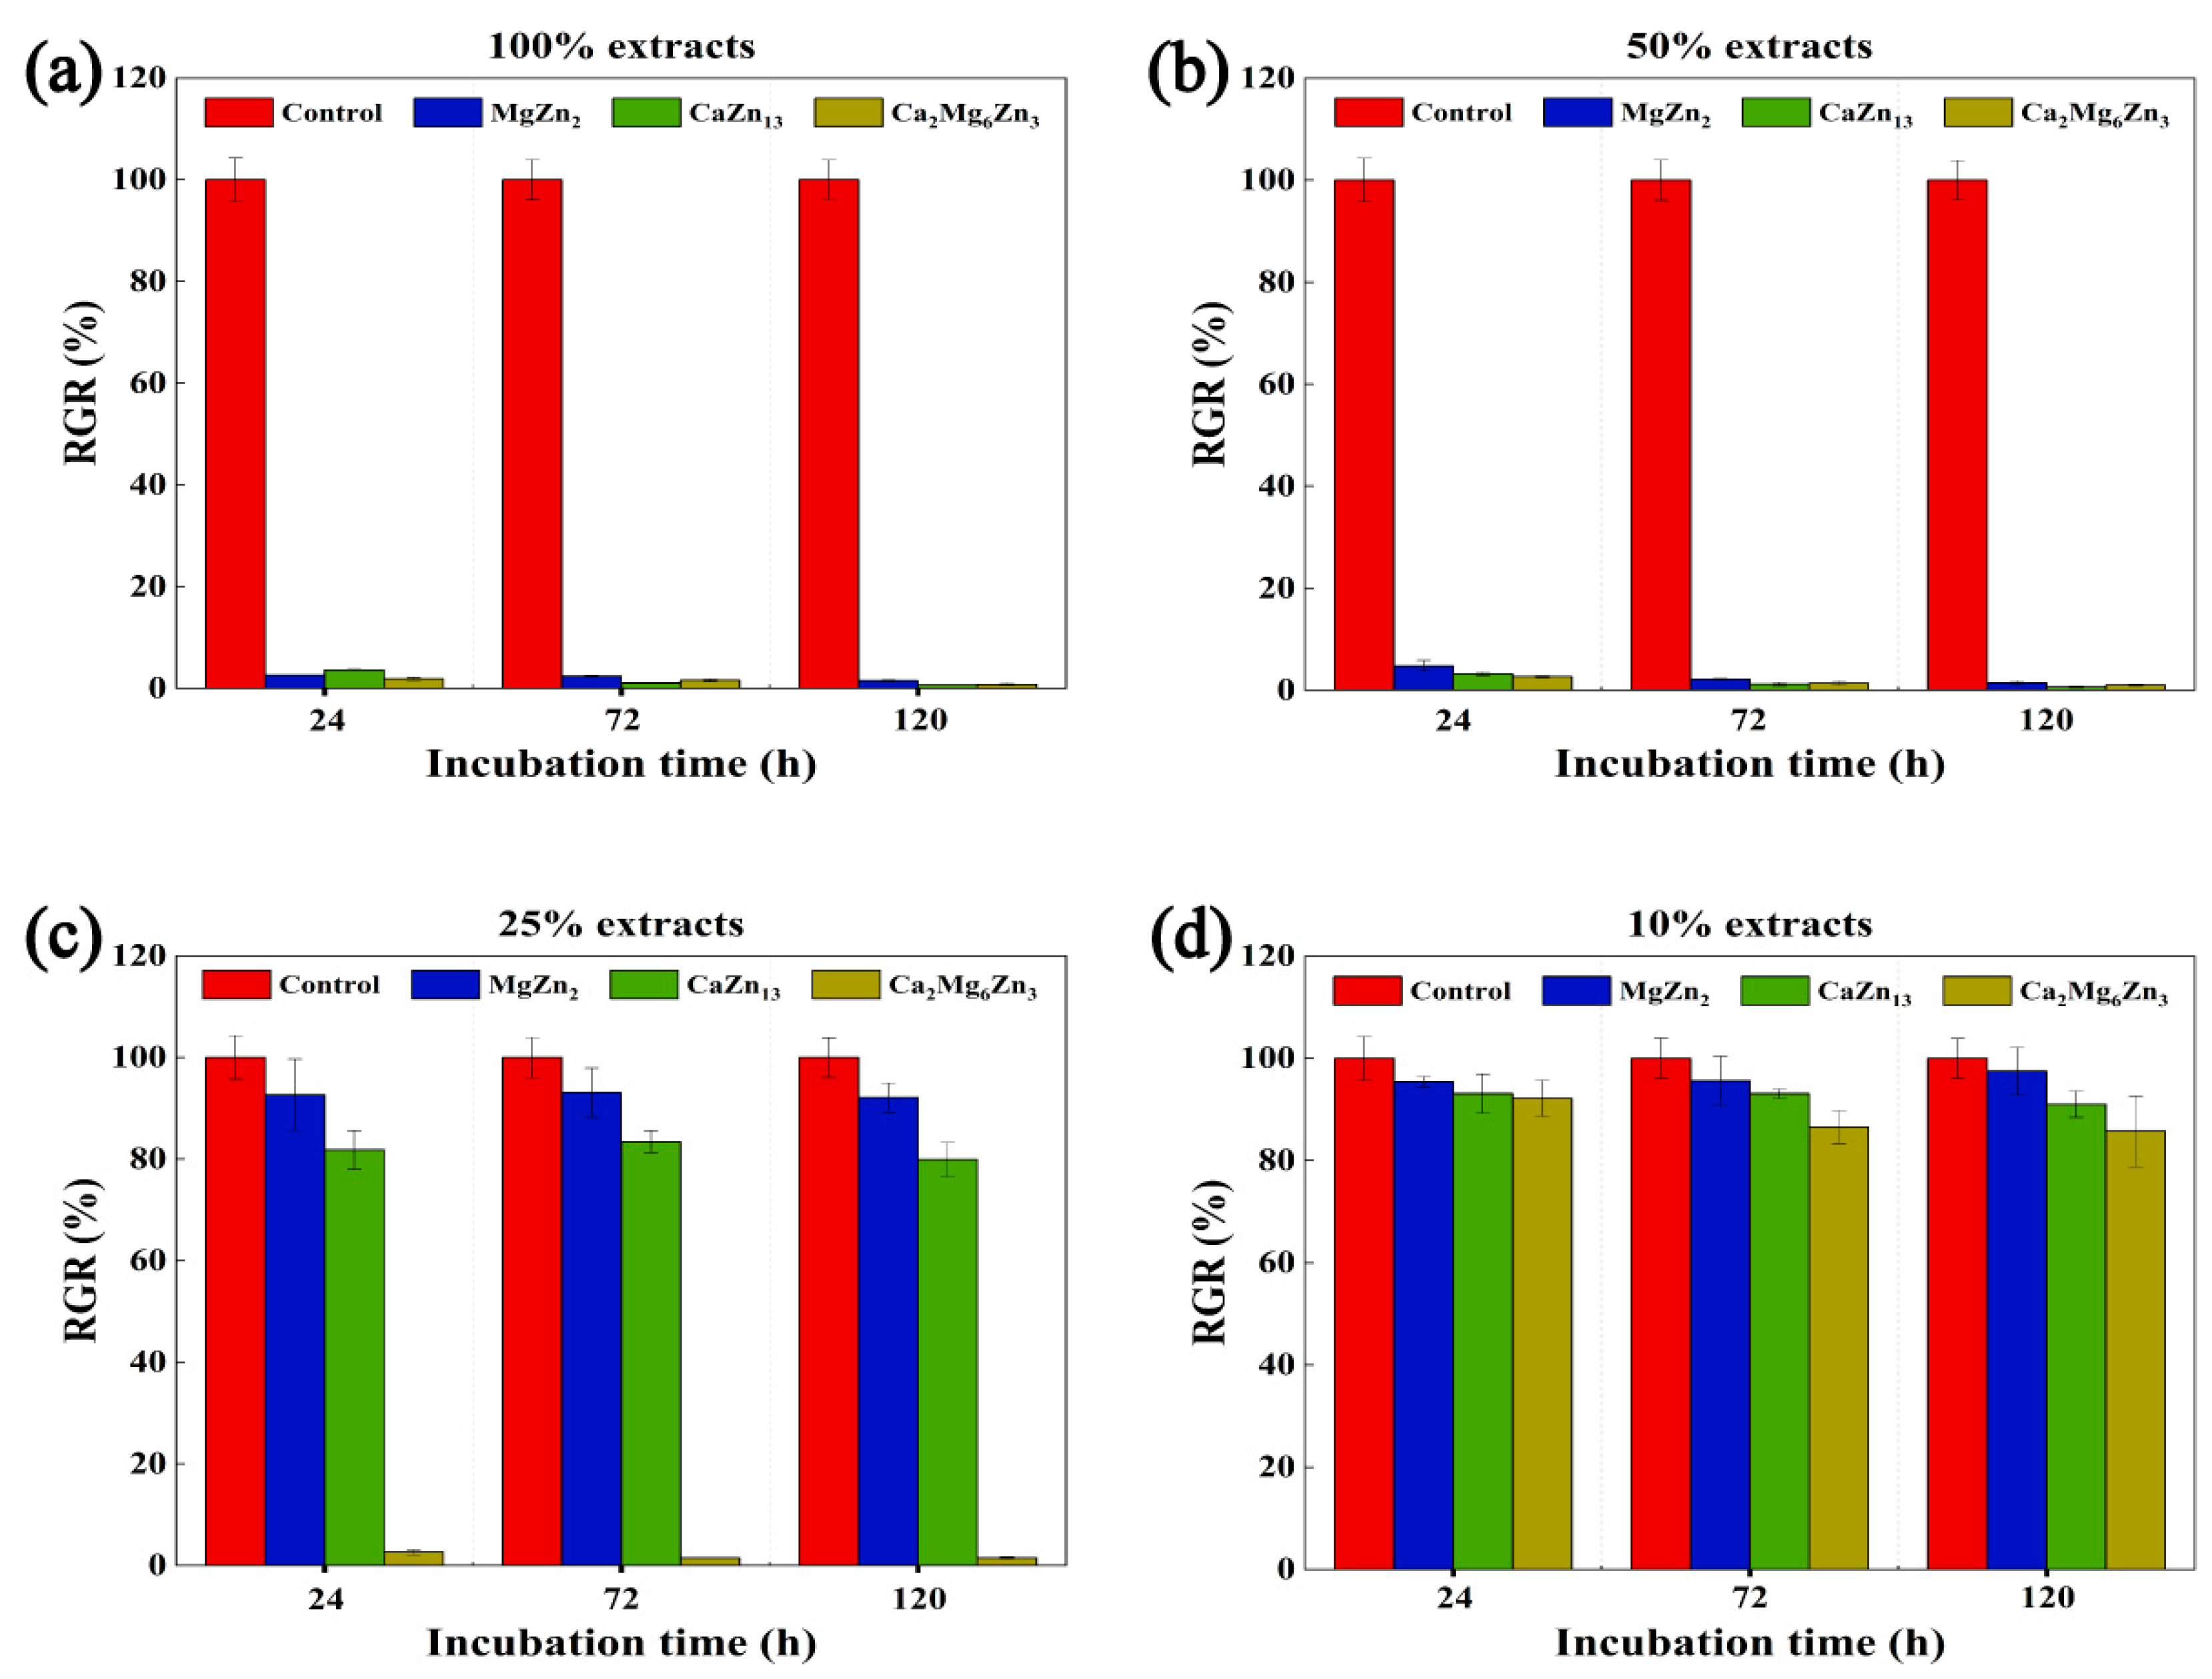
3.7. Cytotoxicity of the Intermetallic Compounds

Figure 16 shows the RGRs of MC3T3-E1 cells cultured in the extracts at concentrations of 100%, 50%, 25%, and 10% for 24 to 120 h. It is evident that both the 100% and 50% extracts of all specimens exhibited severe cytotoxicity on MC3T3-E1 cells regardless of whether the cells were cultured for 24, 72, or 120 h (grade 4 or 5). When the extract concentrations were reduced to 25%, except the extract prepared from the Ca2Mg6Zn3 specimen, the other two extracts showed good cellular activity (grade 0 or 1). Only when the extracts were further diluted to 10%, as the other two extracts demonstrated, did the extract prepared from the Ca2Mg6Zn3 specimen also show good cellular activity on MC3T3-E1 cells.
The measured Zn2+ concentrations in the 100% extracts prepared from the MgZn2, CaZn13, and Ca2Mg6Zn3 specimens are 49.8, 56.6, and 86.7 μg/mL, respectively. These concentrations are all greater than that measured in the 100% extract of a pure Zn specimen (approximately 16.54 μg/mL [50] or 18.98 μg/mL [20]). Clearly, these Zn2+ concentrations are roughly proportional to the degradation rates of the corresponding compounds and the pure Zn specimen, as indicated by the polarization curves (Table 2). The corrosion severity of the compounds after immersion in SBF (Figure 15) further verify the conclusion. It should be noted that although the Zn contents in MgZn2, CaZn13, and Ca2Mg6Zn3 compounds are different, the released Zn2+ ions during the degradation process still mainly depend on the degradation rates of the compounds rather than the Zn contents in the compounds. In addition to Zn2+, Mg2+ (21.8 μg/mL) and Ca2+ (9.4 μg/mL) were also detected in the 100% extracts of the MgZn2 and CaZn13 specimens, respectively. Meanwhile, Ca2+ (39.3 μg/mL) and Mg2+ (96.0 μg/mL) were found in the extract of the Ca2Mg6Zn13 specimen.
It is known that the in vitro cytotoxicity of Zn-based implants primarily depends on the Zn2+ concentration in the extracts. Since Zn is only a trace element in the human body (approximately 3 g) [27], the threshold concentration at which Zn2+ causes severe cytotoxicity on cells and tissues is quite low. According to the findings of Yang et al. [28], Yuan et al. [36], and Zhang et al. [3], the threshold concentration of Zn2+ that caused severe cytotoxicity on MC3T3-E1 cells was around 16.3 μg/mL. Based on this threshold, the 100% extracts prepared from the intermetallic compound specimens inevitably resulted in severe cytotoxicity on MC3T3-E1 cells. Even when the extracts were diluted to 50%, the concentrations of Zn2+ in the extracts of the MgZn2, CaZn13, and Ca2Mg6Zn3 specimens remained at 24.90, 28.30, and 43.35 μg/mL, respectively. Consequently, these extracts continued to exhibit severe cytotoxicity on MC3T3-E1 cells. Upon further dilution to 25%, the Zn2+ concentrations in the extracts of the MgZn2 and CaZn13 specimens decreased to below 16.3 μg/mL (12.45 and 14.15 μg/mL, respectively). As a result, these extracts showed good cellular activity. In contrast, the Zn2+ concentration in the 25% Ca2Mg6Zn3 extract remained higher than 16.3 μg/mL (21.68 μg/mL), which explains why this extract still exhibited severe toxicity on MC3T3-E1 cells. When the extracts were diluted to 10%, the Zn2+ concentrations in all extracts fell well below 16.3 μg/mL, resulting in all of these extracts showing excellent cellular activity.
Although Mg2+ and/or Ca2+ were also present in the extracts of the intermetallic compounds, the experimental results presented in this work indicated that they had little effect on the cytotoxicity of the extracts. This result may be related to the fact that Mg and Ca are major elements in the human body, with relatively high contents in the body (25 g and 1200 g, respectively) [27]. Therefore, higher ion concentrations may be necessary for Mg2+ and Ca2+ to cause severe cytotoxicity on MC3T3-E1 cells. In addition, the positive effect of Mg2+ and/or Ca2+ in the extracts on the cell viability remains unclear, and further experiments are needed in the future.

4. Conclusions

The intermetallic compounds MgZn2, CaZn13, and Ca2Mg6Zn3 were successfully prepared by a vacuum induction melting method. The phase structures, microstructures, and relevant properties of the intermetallic compounds were characterized. The main conclusions are as follows:
  • Both the annealed MgZn2 and CaZn13 specimens have high purity, while the annealed Ca2Mg6Zn3 specimen contains not only Ca2Mg6Zn3 phase but also Mg2Ca phase. After purifying the annealed Ca2Mg6Zn3 specimen (soaking in NaCl solution for some time), high purity Ca2Mg6Zn3 phase was obtained.
  • The MgZn2 and CaZn13 specimens exhibited good thermal stability below 773 K. However, the Ca2Mg6Zn3 specimen melted between 719.7 and 750.9 K.
  • The three intermetallic compounds were degraded according to the atomic ratio of the elements in each compound in corrosive media.
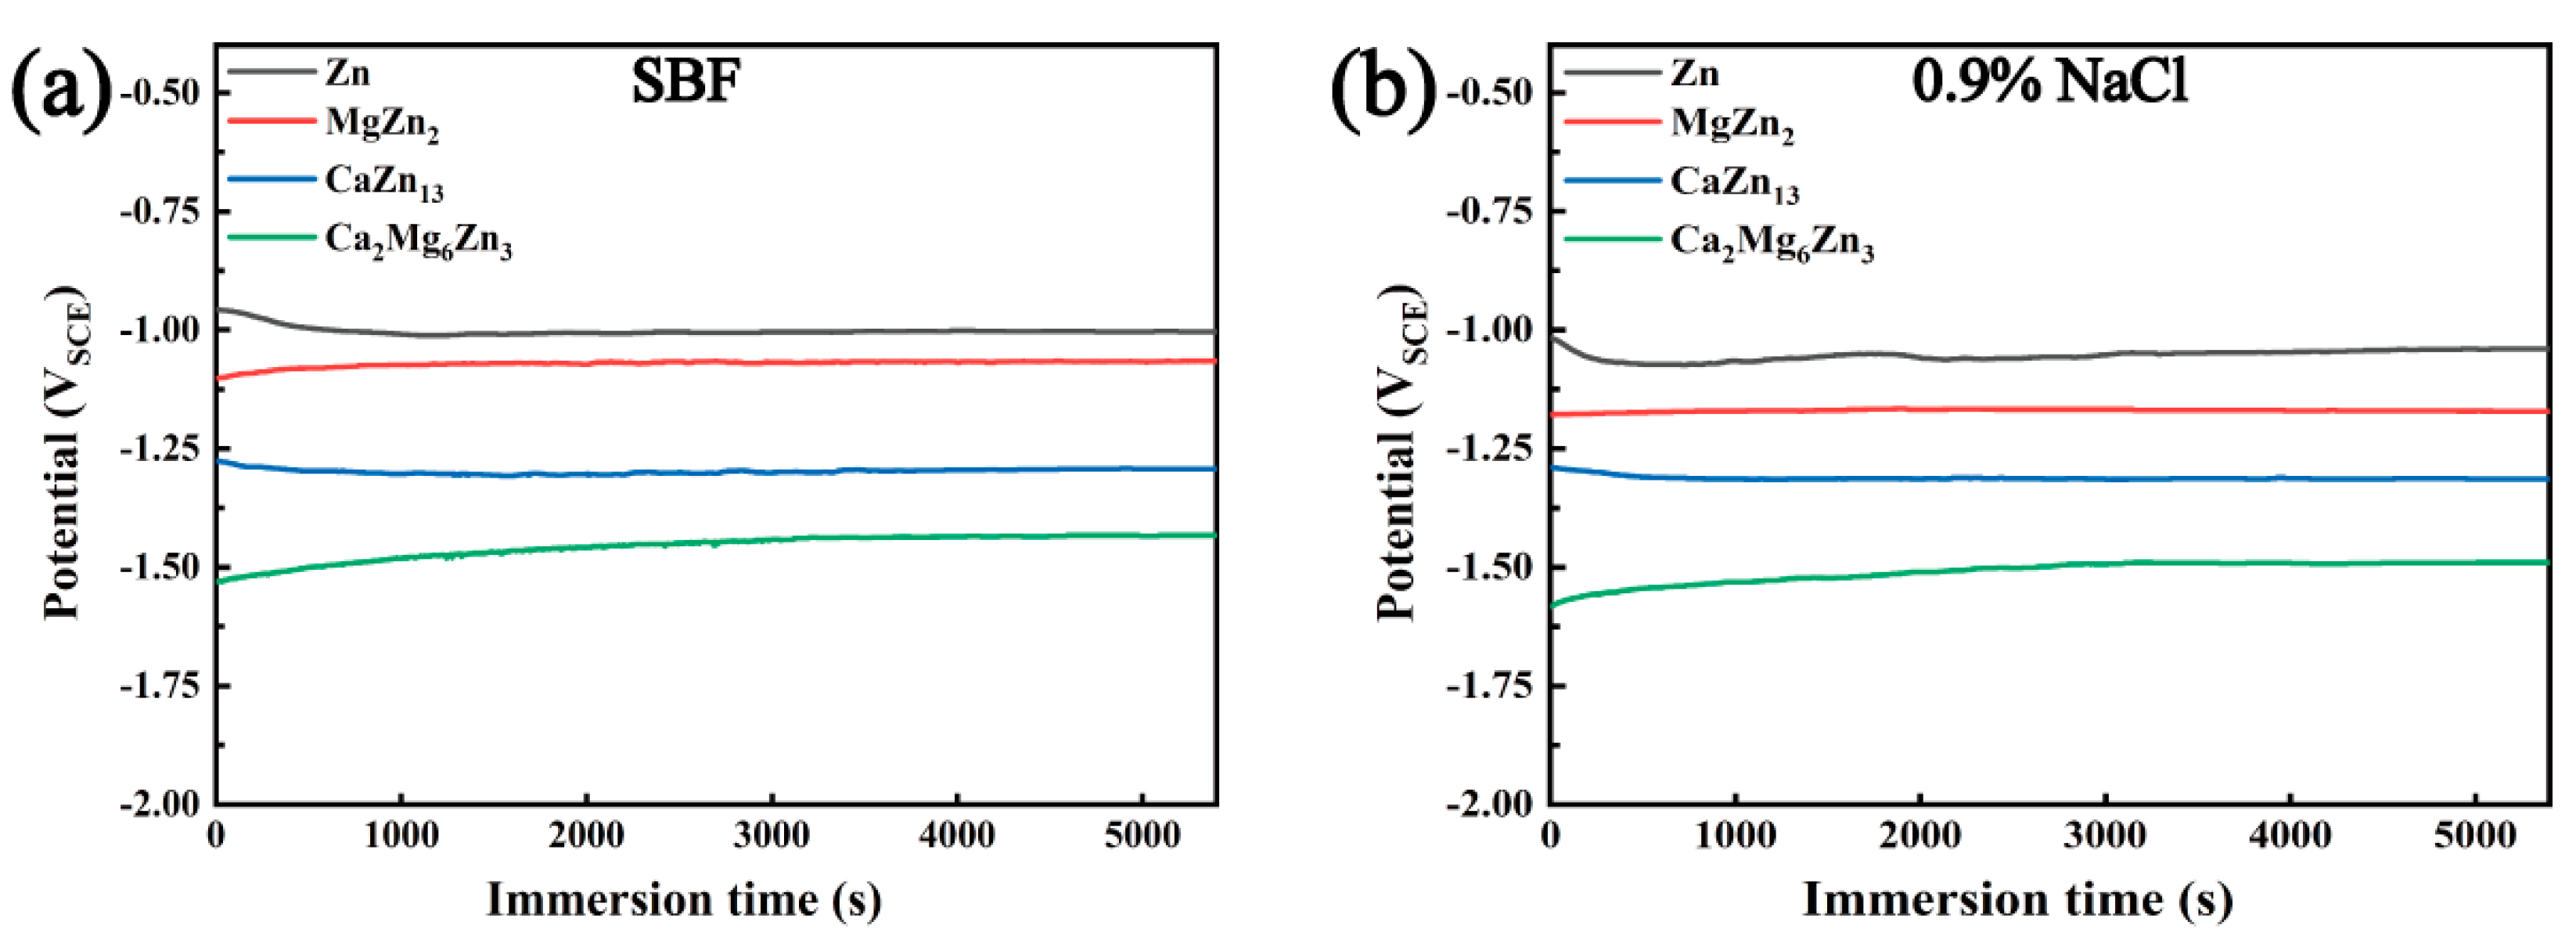
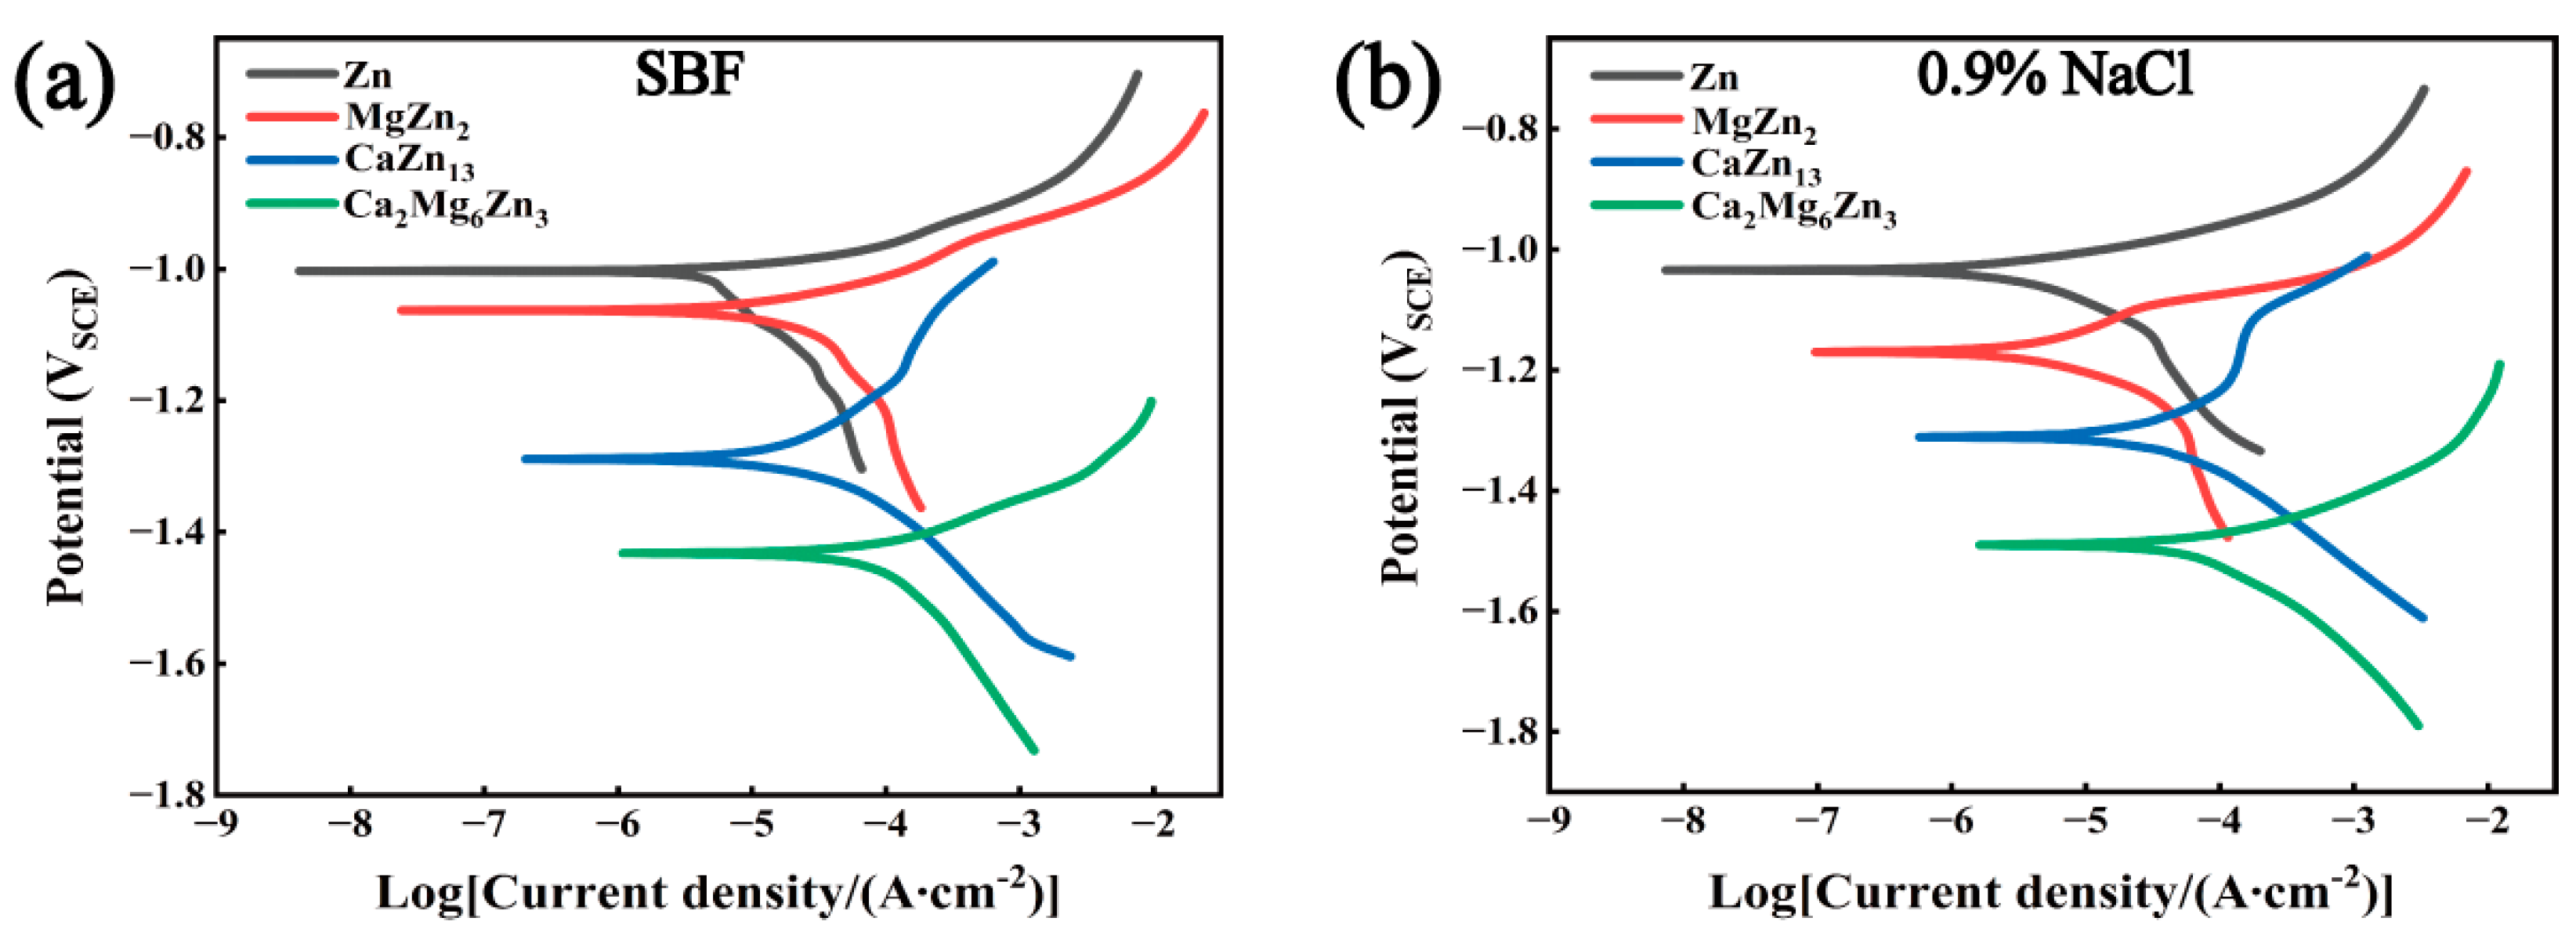
  • The corrosion potentials of the three intermetallic compounds are all lower than that of pure Zn, that is, the three compounds can act as sacrificial anodes in Zn-matrix composites. Among the three compounds, MgZn2 has the highest corrosion potential (−1.063 VSCE in SBF or −1.170 VSCE in 0.9% NaCl solution), and Ca2Mg6Zn3 exhibits the lowest corrosion potential (−1.432 VSCE in SBF or −1.490 VSCE in 0.9% NaCl solution).
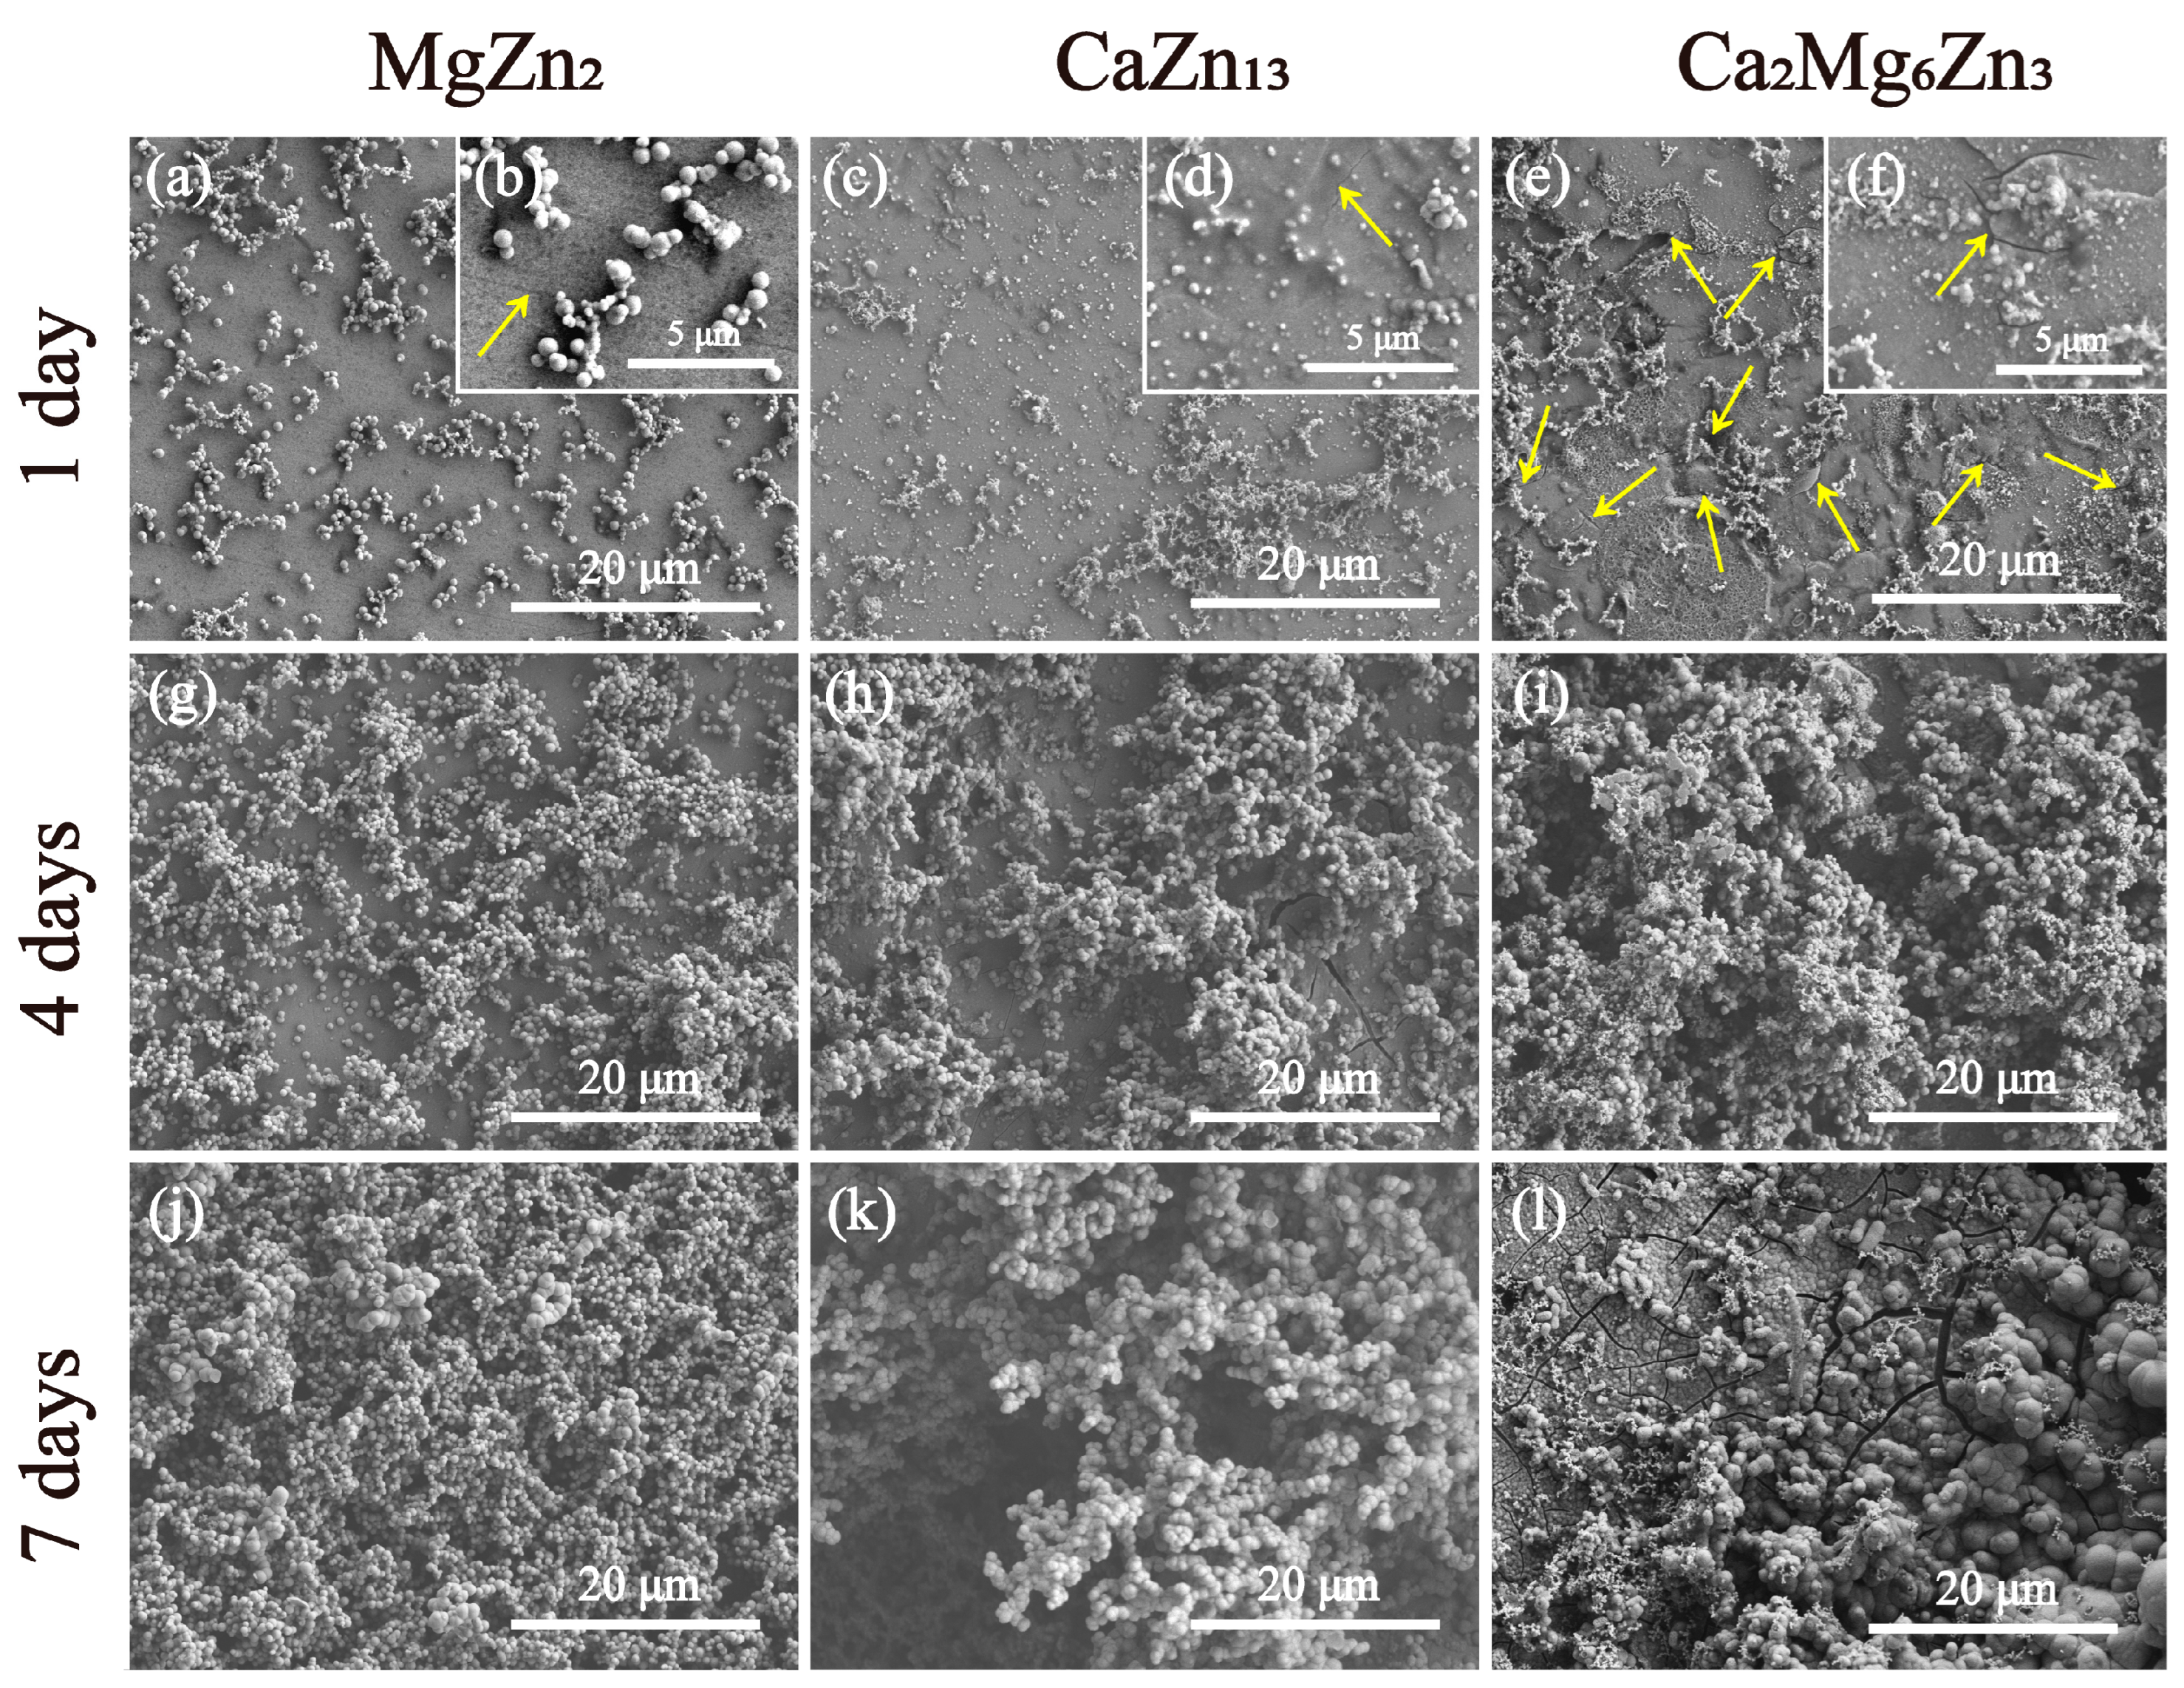
  • The degradation rates of the three intermetallic compounds in corrosive media are all greater than that of pure Zn. Among the three compounds, MgZn2 has the lowest corrosion current density (12.03 µA/cm2 in SBF or 4.37 µA/cm2 in 0.9% NaCl solution), and Ca2Mg6Zn3 exhibits the highest corrosion current density (66.23 µA/cm2 in SBF or 69.49 µA/cm2 in 0.9% NaCl solution). After immersion in SBF for 7 days, localized corrosion occurred on the MgZn2. CaZn13 and Ca2Mg6Zn3 experienced severe corrosion during 7 days of immersion tests.
  • The rapid degradation of the three compounds led to greater Zn2+ dissolution, resulting in severe cytotoxicity. But when the extracts were diluted to 10%, all extracts exhibited good cell activity.

Author Contributions

Conceptualization, K.L., X.W., L.Z. and C.C.; Data curation, K.L., J.L., T.W. and Y.Q.; Formal analysis, J.L., T.W., Y.Q. and L.Z.; Funding acquisition, L.Z. and C.C.; Investigation, K.L.; Methodology, K.L. and X.W.; Writing—original draft, K.L.; Writing—review and editing, K.L. and L.Z. All authors have read and agreed to the published version of the manuscript.

Funding

This work was supported by Hebei Natural Science Foundation (E2024202043, E2022202055). The authors also gratefully acknowledge the financial support of the S&T Program of Hebei (22567635H).

Institutional Review Board Statement

Not applicable.

Informed Consent Statement

Not applicable.

Data Availability Statement

The data presented in this study are available on request from the corresponding author.

Conflicts of Interest

The authors declare no conflicts of interest.

References

  1. Bowen, P.K.; Drelich, J.; Goldman, J. Zinc exhibits ideal physiological corrosion behavior for bioabsorbable stents. Adv. Mater. 2013, 25, 2577–2582. [Google Scholar] [CrossRef] [PubMed]
  2. Fosmire, G.J. Zinc toxicity. Am. J. Clin. Nutr. 1990, 51, 225–227. [Google Scholar] [CrossRef] [PubMed]
  3. Zhang, M.S.; Li, K.L.; Wang, T.B.; Wang, X.; Qi, Y.M.; Zhao, L.C.; Cui, C.X. Preparation and properties of biodegradable porous Zn-Mg-Y alloy scaffolds. J. Mater. Sci. 2024, 59, 8441–8464. [Google Scholar] [CrossRef]
  4. Shi, Z.Z.; Li, X.M.; Yao, S.L.; Tang, Y.Z.; Ji, X.J.; Wang, Q.; Gao, X.X.; Wang, L.N. 300 MPa grade biodegradable high-strength ductile low-alloy (BHSDLA) Zn-Mn-Mg alloys: An in vitro study. J. Mater. Sci. Technol. 2023, 138, 233–244. [Google Scholar] [CrossRef]
  5. Niu, K.N.; Zhang, D.C.; Qi, F.G.; Lin, J.G.; Dai, Y.L. Achieving high strength and antibacterial Zn-4Ag-Mn alloy with homogenous corrosion behavior via high-pressure solid solution. Trans. Nonferrous Met. Soc. China 2024, 34, 2231–2244. [Google Scholar] [CrossRef]
  6. Ji, H.Z.; Shen, G.; Liu, H.H.; Liu, Y.; Qian, J.Y.; Wan, G.J.; Luo, E. Biodegradable Zn-2Cu-0.5Zr alloy promotes the bone repair of senile osteoporotic fractures via the immune-modulation of macrophages. Bioact. Mater. 2024, 38, 422–437. [Google Scholar] [CrossRef]
  7. Liu, A.B.; Qin, Y.; Dai, J.B.; Song, F.; Tian, Y.; Zheng, Y.F.; Wen, P. Fabrication and performance of zinc-based biodegradable metals: From conventional processes to laser powder bed fusion. Bioact. Mater. 2024, 41, 312–335. [Google Scholar] [CrossRef]
  8. Liu, A.B.; Lu, Y.P.; Dai, J.B.; Wen, P.; Xia, D.D.; Zheng, Y.F. Mechanical properties, in vitro biodegradable behavior, biocompatibility and osteogenic ability of additively manufactured Zn-0.8Li-0.1Mg alloy scaffolds. Biomater. Adv. 2023, 153, 213571. [Google Scholar] [CrossRef]
  9. Lu, G.; Chen, C.; Zhang, D.C.; Guo, L.; Lin, J.G.; Dai, Y.L. Optimization of mechanical, corrosion properties and cytotoxicity of biodegradable Zn-Mn alloys by synergy of high-pressure solidification and cold rolling process. J. Alloys Comped. 2024, 1005, 175988. [Google Scholar] [CrossRef]
  10. Guan, Z.P.; Qian, J.Y.; Qin, H.T.; Hou, J.M.; Zhou, Y.K.; Xie, Z.H.; Yu, F.; Chen, Y.Q.; Wan, G.J.; Zeng, H. Osteogenerative and corrosion-decelerating teriparatide-mediated strontium-zinc phosphate hybrid coating on biodegradable zinc-copper alloy for orthopaedic applications. Mater. Today Commun. 2024, 39, 109010. [Google Scholar] [CrossRef]
  11. Qin, Y.; Yang, H.T.; Liu, A.B.; Dai, J.B.; Wen, P.; Zheng, Y.F.; Tian, Y.; Li, S.; Wang, X.G. Processing optimization, mechanical properties, corrosion behavior and cytocompatibility of additively manufactured Zn-0.7Li biodegradable metals. Acta Biomater. 2022, 142, 388–401. [Google Scholar] [CrossRef] [PubMed]
  12. Ji, C.W.; Ma, A.B.; Jiang, J.H.; Song, D.; Liu, H.; Guo, S.S. Research status and future prospects of biodegradable Zn-Mg alloys. J. Alloys Comped. 2024, 993, 174669. [Google Scholar] [CrossRef]
  13. Niu, K.N.; Zhang, D.C.; Qi, F.G.; Lin, J.G.; Dai, Y.L. The effects of Cu and Mn on the microstructure, mechanical, corrosion properties and biocompatibility of Zn-4Ag alloy. J. Mater. Res. Technol. 2022, 21, 4969–4981. [Google Scholar] [CrossRef]
  14. Li, P.; Dai, J.T.; Li, Y.G.; Alexander, D.; Čapek, J.; Geis-Gerstorfer, J.; Wan, G.J.; Han, J.M.; Yu, Z.; Li, A. Zinc based biodegradable metals for bone repair and regeneration: Bioactivity and molecular mechanisms. Mater. Today Bio 2024, 25, 100932. [Google Scholar] [CrossRef]
  15. Li, Y.; Pavanram, P.; Zhou, J.K.; Lietaert, P.; Li, W.; San, H.; Leeflang, M.A.; Mol, J.M.C.; Jahr, H.; Zadpoor, A.A. Additively manufactured biodegradable porous zinc. Acta Biomater. 2020, 101, 609–623. [Google Scholar] [CrossRef]
  16. Yuan, W.; Xia, D.D.; Wu, S.L.; Zheng, Y.F.; Guan, Z.P.; Rau, J.V. A review on current research status of the surface modification of Zn-based biodegradable metals. Bioact. Mater. 2022, 7, 192–216. [Google Scholar] [CrossRef]
  17. Venezuela, J.; Dargusch, M.S. The influence of alloying and fabrication techniques on the mechanical properties, biodegradability and biocompatibility of zinc: A comprehensive review. Acta Biomater. 2019, 87, 1–40. [Google Scholar] [CrossRef] [PubMed]
  18. Huang, H.; Liu, H.; Wang, L.S.; Li, Y.H.; Agbedor, S.O.; Bai, J.; Xue, F.; Jiang, J.H. A high-strength and biodegradable Zn-Mg alloy with refined ternary eutectic structure processed by ECAP. Acta Met. Sin. Engl. 2020, 33, 1191–1200. [Google Scholar] [CrossRef]
  19. Liu, X.W.; Sun, J.K.; Zhou, F.Y.; Yang, Y.H.; Chang, R.C.; Qiu, K.J.; Pu, Z.J.; Li, L.; Zheng, Y. Micro-alloying with Mn in Zn-Mg alloy for future biodegradable metals application. Mater. Des. 2016, 94, 95–104. [Google Scholar] [CrossRef]
  20. Xia, D.D.; Qin, Y.; Guo, H.; Wen, P.; Lin, H.; Voshage, M.; Schleifenbaum, J.H.; Cheng, Y.; Zheng, Y.F. Additively manufactured pure zinc porous scaffolds for critical-sized bone defects of rabbit femur. Bioact. Mater. 2023, 19, 12–23. [Google Scholar] [CrossRef]
  21. Shuai, C.J.; Li, S.; Peng, S.P.; Feng, P.; Lai, Y.X.; Gao, C.D. Biodegradable metallic bone implants. Mater. Chem. Front. 2019, 3, 544–562. [Google Scholar] [CrossRef]
  22. Zheng, Y.F.; Gu, X.N.; Witte, F. Biodegradable metals. Mater. Sci. Eng. R Rep. 2014, 77, 1–34. [Google Scholar] [CrossRef]
  23. Zhao, L.C.; Yuan, P.K.; Zhang, M.S.; Wang, X.; Qi, Y.M.; Wang, T.B.; Cao, B.; Cui, C.X. Preparation and properties of porous Zn-based scaffolds as biodegradable implants: A review. J. Mater. Sci. 2023, 58, 8275–8316. [Google Scholar] [CrossRef]
  24. Chen, Y.J.; Xu, Z.G.; Smith, C.; Sankar, J. Recent advances on the development of magnesium alloys for biodegradable implants. Acta Biomater. 2014, 10, 4561–4573. [Google Scholar] [CrossRef]
  25. Witte, F.; Fischer, J.; Nellesen, J.; Crostack, H.A.; Kaese, V.; Pisch, A.; Beckmann, F.; Windhagen, H. In vitro and in vivo corrosion measurements of magnesium alloys. Biomaterials 2006, 27, 1013–1018. [Google Scholar] [CrossRef] [PubMed]
  26. Ren, H.Z.; Pan, C.; Liu, Y.C.; Liu, D.B.; He, X.H.; Li, X.H.; Sun, X.H. Fabrication, in vitro and in vivo properties of porous Zn-Cu alloy scaffolds for bone tissue engineering. Mater. Chem. Phys. 2022, 289, 126458. [Google Scholar] [CrossRef]
  27. Liu, Y.; Zheng, Y.F.; Chen, X.H.; Yang, J.A.; Pan, H.B.; Chen, D.F.; Wang, L.N.; Zhang, J.L.; Zhu, D.H.; Wu, S.L.; et al. Fundamental theory of biodegradable metals-definition, criteria, and design. Adv. Funct. Mater. 2019, 29, 1805402. [Google Scholar] [CrossRef]
  28. Yang, H.T.; Qu, X.H.; Lin, W.J.; Chen, D.F.; Zhu, D.H.; Dai, K.R.; Zheng, Y.F. Enhanced osseointegration of Zn-Mg composites by tuning the release of Zn ions with sacrificial Mg-rich anode design. ACS Biomater. Sci. Eng. 2018, 5, 453–467. [Google Scholar] [CrossRef] [PubMed]
  29. Tong, X.; Shi, Z.M.; Xu, L.C.; Lin, J.X.; Zhang, D.C.; Wang, K.; Li, Y.C.; Wen, C.E. Degradation behavior, cytotoxicity, hemolysis, and antibacterial properties of electro-deposited Zn-Cu metal foams as potential biodegradable bone implants. Acta Biomater. 2020, 102, 481–492. [Google Scholar] [CrossRef]
  30. Zhao, L.C.; Xie, Y.; Zhang, Z.; Wang, X.; Qi, Y.M.; Wang, T.B.; Wang, R.; Cui, C.X. Fabrication and properties of biodegradable ZnO nano-rods/porous Zn scaffolds. Mater. Charact. 2018, 144, 227–238. [Google Scholar] [CrossRef]
  31. Yao, C.Z.; Wang, Z.C.; Tay, S.L.; Zhu, T.P.; Gao, W. Effects of Mg on microstructure and corrosion properties of Zn-Mg alloy. J. Alloys Comped. 2014, 602, 101–107. [Google Scholar] [CrossRef]
  32. Byun, J.M.; Yu, J.M.; Kim, D.K.; Kim, T.Y.; Jung, W.S.; Kim, Y.D. Corrosion behavior of Mg2Zn11 and MgZn2 single phases. Korean J. Met. Mater. 2013, 51, 413–419. [Google Scholar] [CrossRef]
  33. Hagihara, K.; Shakudo, S.; Fujii, K.; Nakano, T. Degradation behavior of Ca-Mg-Zn intermetallic compounds for use as biodegradable implant materials. Mater. Sci. Eng. C.-Mater. 2014, 44, 285–292. [Google Scholar] [CrossRef] [PubMed]
  34. Wasiur-Rahman, S.; Medraj, M. Critical assessment and thermodynamic modeling of the binary Mg-Zn, Ca-Zn and ternary Mg-Ca-Zn systems. Intermetallics 2009, 17, 847–864. [Google Scholar] [CrossRef]
  35. Zhao, L.C.; Zhang, Z.; Song, Y.T.; Liu, S.J.; Qi, Y.M.; Wang, X.; Wang, Q.Z.; Cui, C.X. Mechanical properties and in vitro biodegradation of newly developed porous Zn scaffolds for biomedical applications. Mater. Des. 2016, 108, 136–144. [Google Scholar] [CrossRef]
  36. Yuan, P.K.; Zhang, M.S.; Wang, X.; Qi, Y.M.; Wang, T.B.; Zhao, L.C.; Cui, C.X. Effects of polylactic acid coating on properties of porous Zn scaffolds as degradable materials. Mater. Charact. 2023, 199, 112852. [Google Scholar] [CrossRef]
  37. Spencer, P.J.; Pelton, A.D.; Kang, Y.B.; Chartrand, P.; Fuerst, C.D. Thermodynamic assessment of the Ca-Zn, Sr-Zn, Y-Zn and Ce-Zn systems. Calphad 2008, 32, 423–431. [Google Scholar] [CrossRef]
  38. Dong, J.H.; Lin, T.; Shao, H.P.; Wang, H.; Dong, Y.X.; Bai, T.S.; Fan, M. Degradation behavior of MgZn2 and Mg2Zn3 intermetallic compounds in simulated body fluid. Mater. Lett. 2023, 347, 134637. [Google Scholar] [CrossRef]
  39. Okido, M.; Kuroda, K.; Ishikawa, M.; Ichino, R.; Takai, O. Hydroxyapatite coating on titanium by means of thermal substrate method in aqueous solutions. Solid State Ion. 2002, 151, 47–52. [Google Scholar] [CrossRef]
  40. Liu, X.; Yang, W.; Shen, D.N.; Cheng, Y.; Chen, D.F.; Zheng, Y.F. Exploring the biodegradation of pure Zn under simulated inflammatory condition. Corros. Sci. 2021, 189, 109606. [Google Scholar] [CrossRef]
  41. Guo, H.; Xia, D.D.; Zheng, Y.F.; Zhu, Y.; Liu, Y.S.; Zhou, Y.S. A pure zinc membrane with degradability and osteogenesis promotion for guided bone regeneration: In vitro and in vivo studies. Acta Biomater. 2020, 106, 396–409. [Google Scholar] [CrossRef] [PubMed]
  42. Shao, X.X.; Wang, X.; Xu, F.F.; Dai, T.Q.; Zhou, J.G.; Liu, J.; Song, K.; Tian, L.; Liu, B.; Liu, Y.P. In vivo biocompatibility and degradability of a Zn-Mg-Fe alloy osteosynthesis system. Bioact. Mater. 2022, 7, 154–166. [Google Scholar] [CrossRef] [PubMed]
  43. Young, J.; Reddy, R.G. Synthesis, mechanical properties, and in vitro corrosion behavior of biodegradable Zn-Li-Cu alloys. J. Alloys Compd. 2020, 844, 156257. [Google Scholar] [CrossRef]
  44. Jamesh, M.; Kumar, S.; Sankara, T.S.N. Electrodeposition of hydroxyapatite coating on magnesium for biomedical applications. J. Coat. Technol. Res. 2012, 9, 495–502. [Google Scholar] [CrossRef]
  45. Seyedraoufi, Z.S.; Mirdamadi, S. Effects of pulse electrodeposition parameters and alkali treatment on the properties of nano hydroxyapatite coating on porous Mg-Zn scaffold for bone tissue engineering application. Mater. Chem. Phys. 2014, 148, 519–527. [Google Scholar] [CrossRef]
  46. Zhao, L.C.; Wang, X.; Wang, T.B.; Xia, Y.H.; Cui, C.X. Mechanical properties and biodegradation of porous Zn-1Al alloy scaffolds. Mater. Lett. 2019, 247, 75–78. [Google Scholar] [CrossRef]
  47. Su, Y.C.; Yang, H.T.; Gao, J.L.; Qin, Y.X.; Zheng, Y.F.; Zhu, D.H. Interfacial zinc phosphate is the key to controlling biocompatibility of metallic zinc implants. Adv. Sci. 2019, 6, 1900112. [Google Scholar] [CrossRef]
  48. Yang, H.T.; Wang, C.; Liu, C.Q.; Chen, H.W.; Wu, Y.F.; Han, J.N.; Jia, Z.C.; Lin, W.J.; Zhang, D.Y.; Li, W.T.; et al. Evolution of the degradation mechanism of pure zinc stent in the one-year study of rabbit abdominal aorta model. Biomaterials 2017, 145, 92–105. [Google Scholar] [CrossRef]
  49. Drelich, A.J.; Zhao, S.; Guillory, R.J.; Drelich, J.W.; Goldman, J. Long-term surveillance of zinc implant in murine artery: Surprisingly steady biocorrosion rate. Acta Biomater. 2017, 58, 539–549. [Google Scholar] [CrossRef]
  50. Zhang, S.; Yuan, P.K.; Wang, X.; Wang, T.B.; Zhao, L.C.; Cui, C.X. Fabrication and properties of Zn-3Mg-1Ti alloy as a potential biodegradable implant material. Materials 2022, 15, 940. [Google Scholar] [CrossRef]
Figure 1. X-ray diffraction patterns of the annealed (a) MgZn2, (b) CaZn13, (c) Ca2Mg6Zn3 specimens, and (d) the sintered Ca2Mg6Zn3 specimen.
Materials 18 02057 g001
Figure 2. (a,b) SEM images of the MgZn2 specimen, and (b) a high magnification image of a local area in (a). (c,d) The elemental mapping results for the area in (b).
Materials 18 02057 g002
Figure 3. (a,b) SEM images of the CaZn13 specimen, and (b) a high magnification image of a local area in (a). (c,d) The elemental mapping results for the area in (b).
Materials 18 02057 g003
Figure 4. (a) The EDS results of the area shown in Figure 2b, (b) the EDS results of the area shown in Figure 3b.
Materials 18 02057 g004
Figure 5. (a,b) SEM images of the annealed Ca2Mg6Zn3 specimen, and (b) a high magnification image of a local area in (a). (c) The EDS results of P1, P2 in (a) and P3 in (b). (df) The elemental mapping results for the area in (b).
Materials 18 02057 g005
Figure 6. (a,b) SEM images of the sintered Ca2Mg6Zn3 specimen, and (b) a high magnification image of a local area in (a). (c) The EDS results for the area shown in (b). (df) The elemental mapping results for the area in (b).
Materials 18 02057 g006
Figure 7. Microhardness results of an as-cast pure Zn specimen and the intermetallic compounds.
Materials 18 02057 g007
Figure 8. DSC (ac) and TG (df) curves of the intermetallic compounds.
Materials 18 02057 g008
Figure 9. OCP–time curves of the intermetallic compounds and an as-cast pure Zn specimen in (a) SBF and (b) 0.9% NaCl solution, respectively.
Materials 18 02057 g009
Figure 10. Polarization curves of the intermetallic compounds and an as-cast pure Zn specimen in (a) SBF and (b) 0.9% NaCl solution, respectively.
Materials 18 02057 g010
Figure 11. The pH variations of the SBF solutions soaking the intermetallic compounds and pure Zn specimens during immersion tests.
Materials 18 02057 g011
Figure 12. SEM images of the MgZn2 (a,b,g,j), CaZn13 (c,d,h,k) and Ca2Mg6Zn3 (e,f,i,l) specimens after immersion in SBF for different periods.
Materials 18 02057 g012
Figure 13. EDS results of the intermetallic compounds after immersion in SBF for 7 days.
Materials 18 02057 g013
Figure 14. FTIR spectra of the intermetallic compounds after immersion in SBF for 7 days.
Materials 18 02057 g014
Figure 15. SEM images of the MgZn2 (a,b), CaZn13 (c,d) and Ca2Mg6Zn3 (e,f) specimens after immersion in SBF for 7 days and subsequent removal of the corrosion products with a chromic acid solution.
Materials 18 02057 g015
Figure 16. The RGRs of MC3T3-E1 cells cultured in the extracts with (a) 100%, (b) 50%, (c) 25%, and (d) 10% concentrations for 24–120 h.
Materials 18 02057 g016
Table 1. Chemical composition of the used SBF [35].
NumberReagentConcentration (g/L)
1NaCl8.035
2NaHCO30.355
3KCl0.225
4K2HPO4∙3H2O0.231
5MgCl2∙6H2O0.311
6CaCl20.292
7Na2SO40.072
Table 2. Electrochemical parameters obtained from the polarization curves shown in Figure 10.
SpecimensSBF0.9% NaCl
Ecorr (VSCE)Icorr (µA/cm2)Ecorr (VSCE)Icorr (µA/cm2)
Pure Zn−1.0035.84−1.0343.53
MgZn2−1.06312.03−1.1704.37
CaZn13−1.28912.93−1.31131.66
Ca2Mg6Zn3−1.43266.23−1.49069.49
Table 3. The metal ion concentrations in 0.9% NaCl solutions after soaking the intermetallic compounds for 24 h.
SpecimensMetal Ion Concentration (mmol/L)Concentration
Ca2+Mg2+Zn2+Ratio
MgZn234.81 ± 1.5265.19 ± 1.50Mg2+/Zn2+ = 1/1.87
CaZn137.00 ± 1.6793.00 ± 1.67Ca2+/Zn2+ = 1/13.29
Ca2Mg6Zn317.63 ± 1.0254.08 ± 1.2428.29 ± 0.26Ca2+/Mg2+/Zn2+ = 1/3.07/1.60
Disclaimer/Publisher’s Note: The statements, opinions and data contained in all publications are solely those of the individual author(s) and contributor(s) and not of MDPI and/or the editor(s). MDPI and/or the editor(s) disclaim responsibility for any injury to people or property resulting from any ideas, methods, instructions or products referred to in the content.

