

Development of Fluorine Fixation Processes for the Horizontal Recycling of Lithium

 , , and
Abstract
:
1. Introduction
2. Materials and Methods
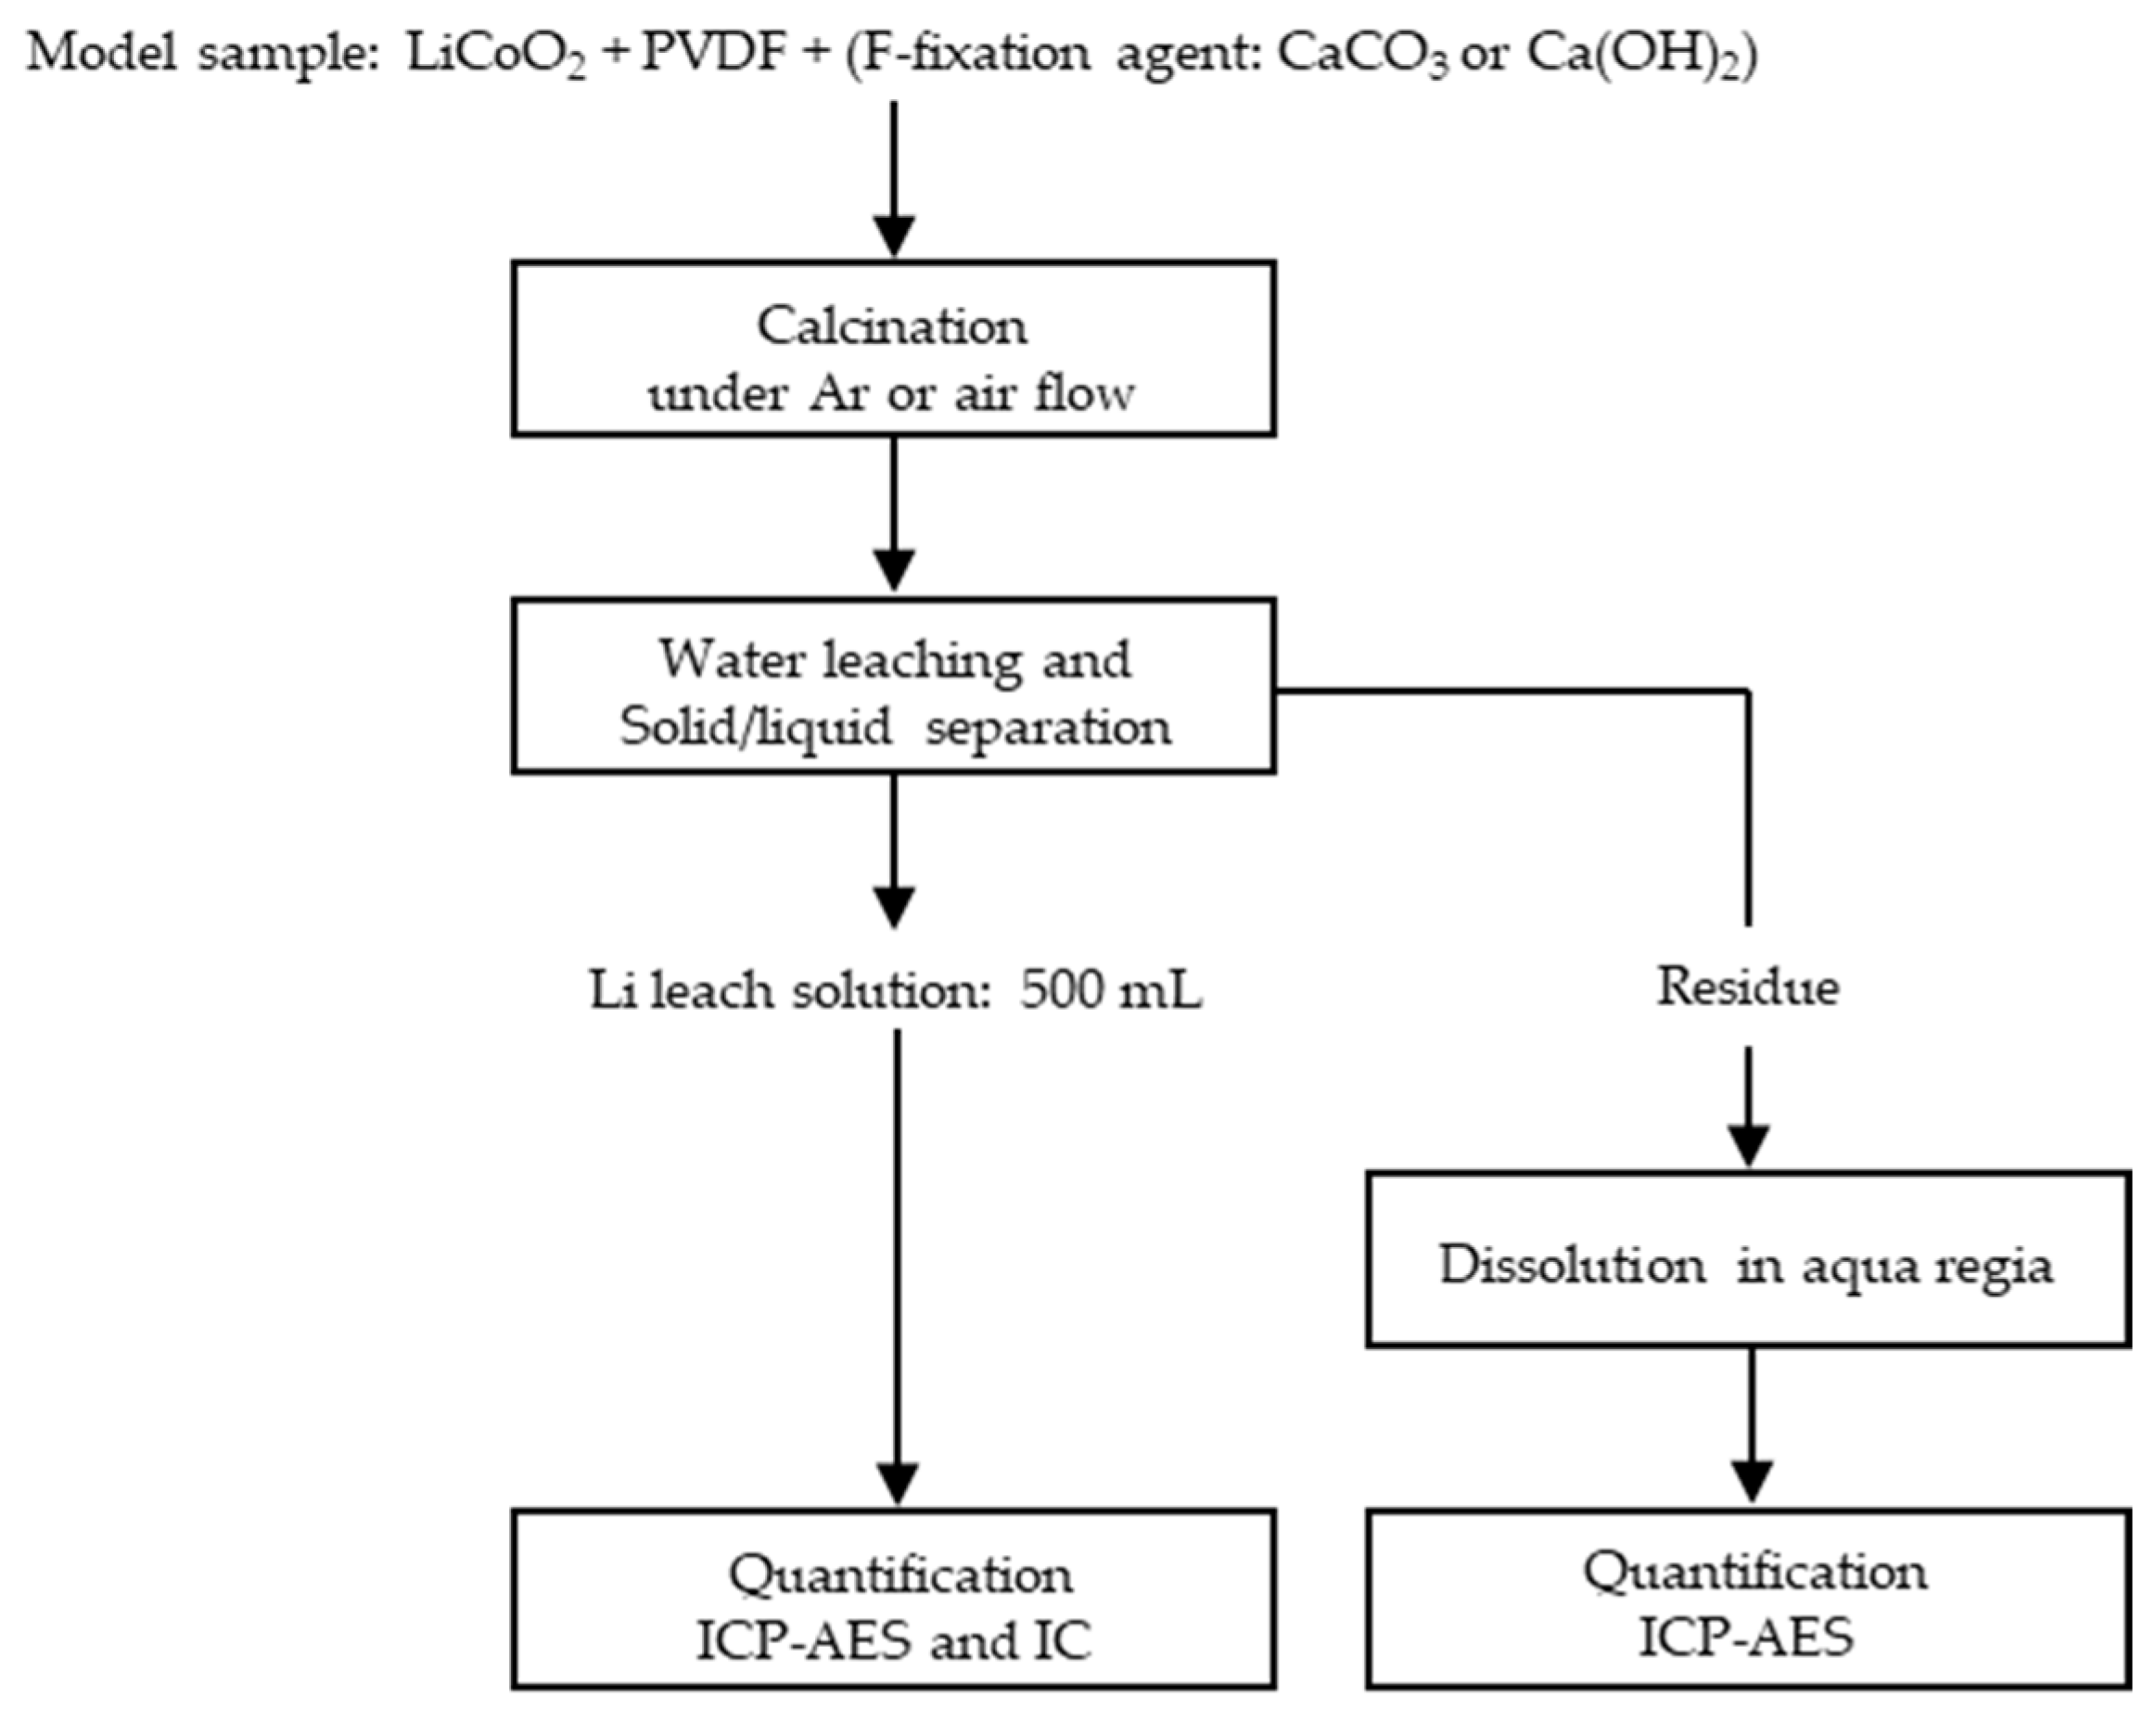
2.1. Lithium Recovery and Fluorine Fixation by Dry Process
2.1.1. Sample Preparation
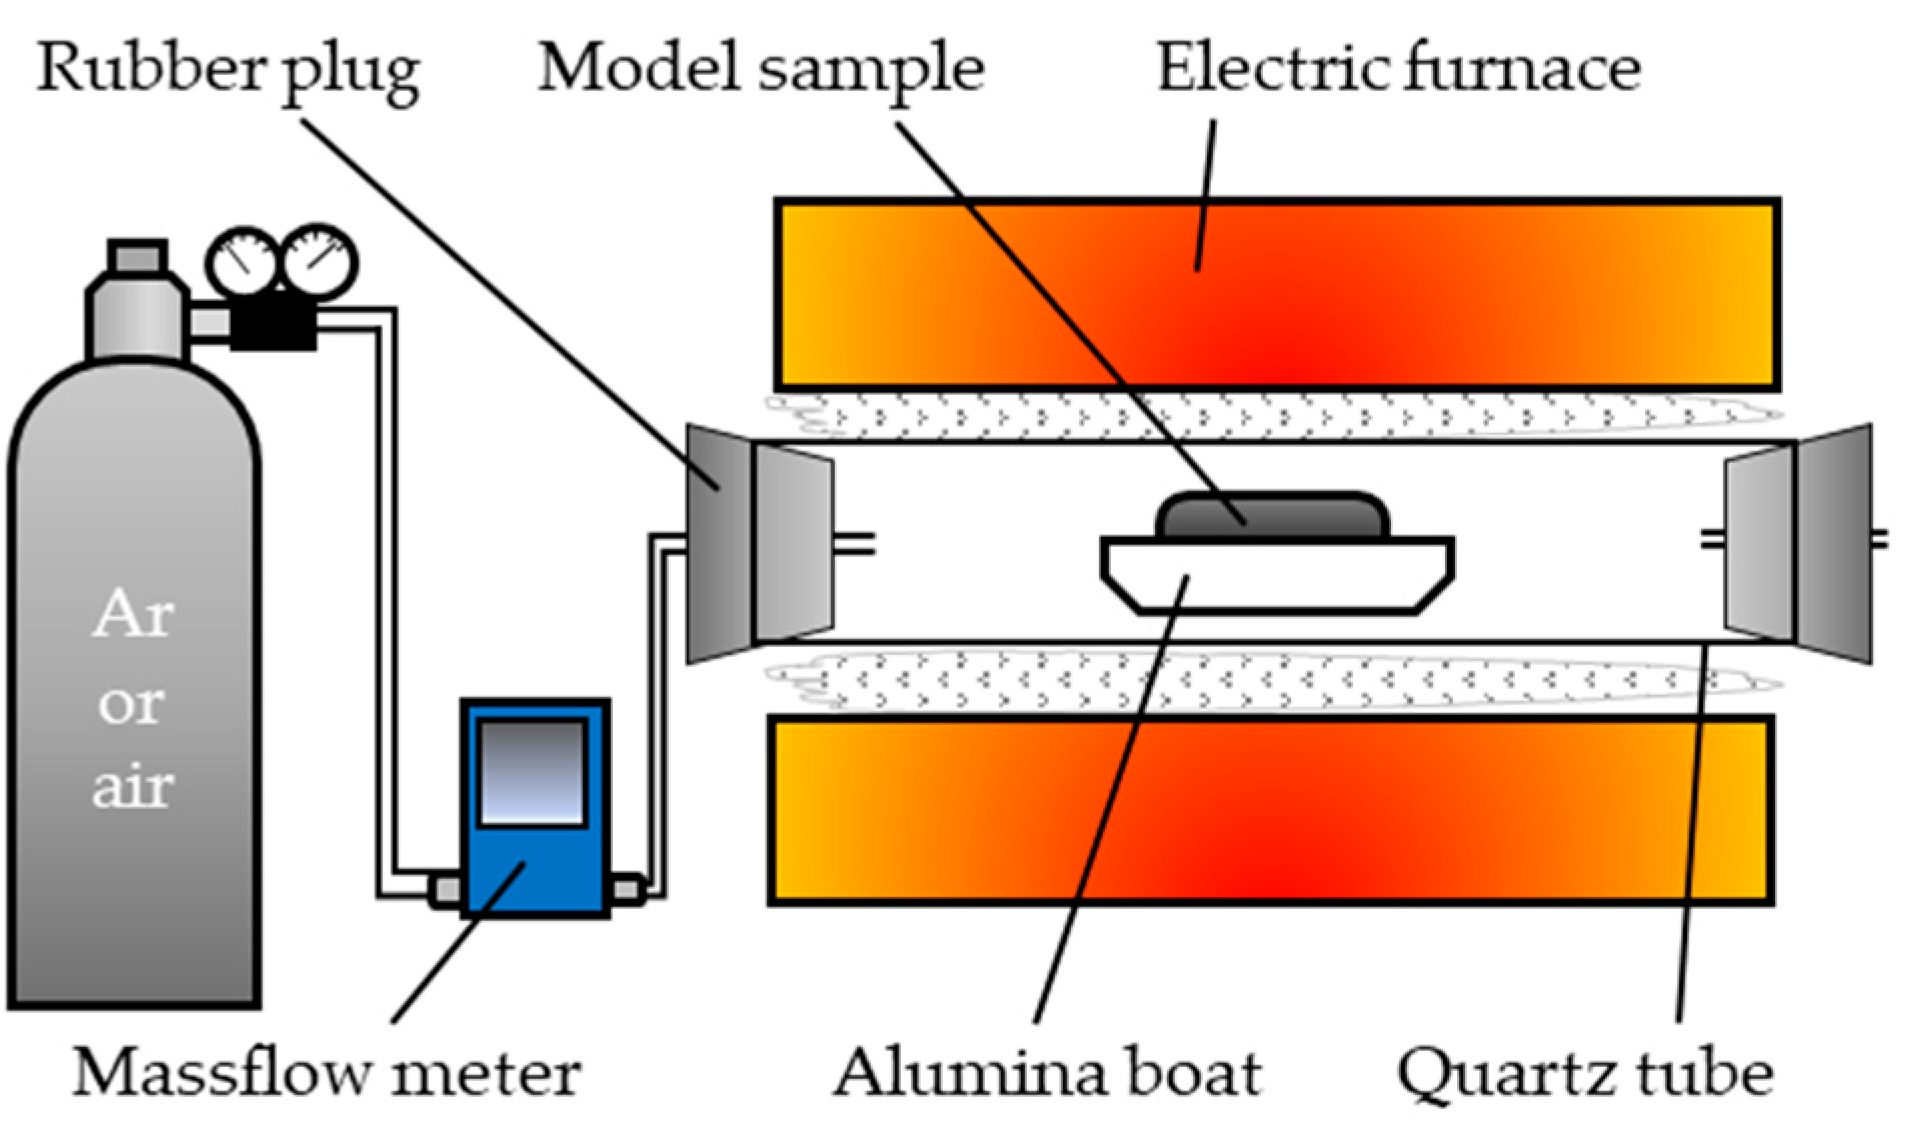
2.1.2. Calcination
2.1.3. Water Leaching
2.1.4. Dissolution of Water Leaching Residue
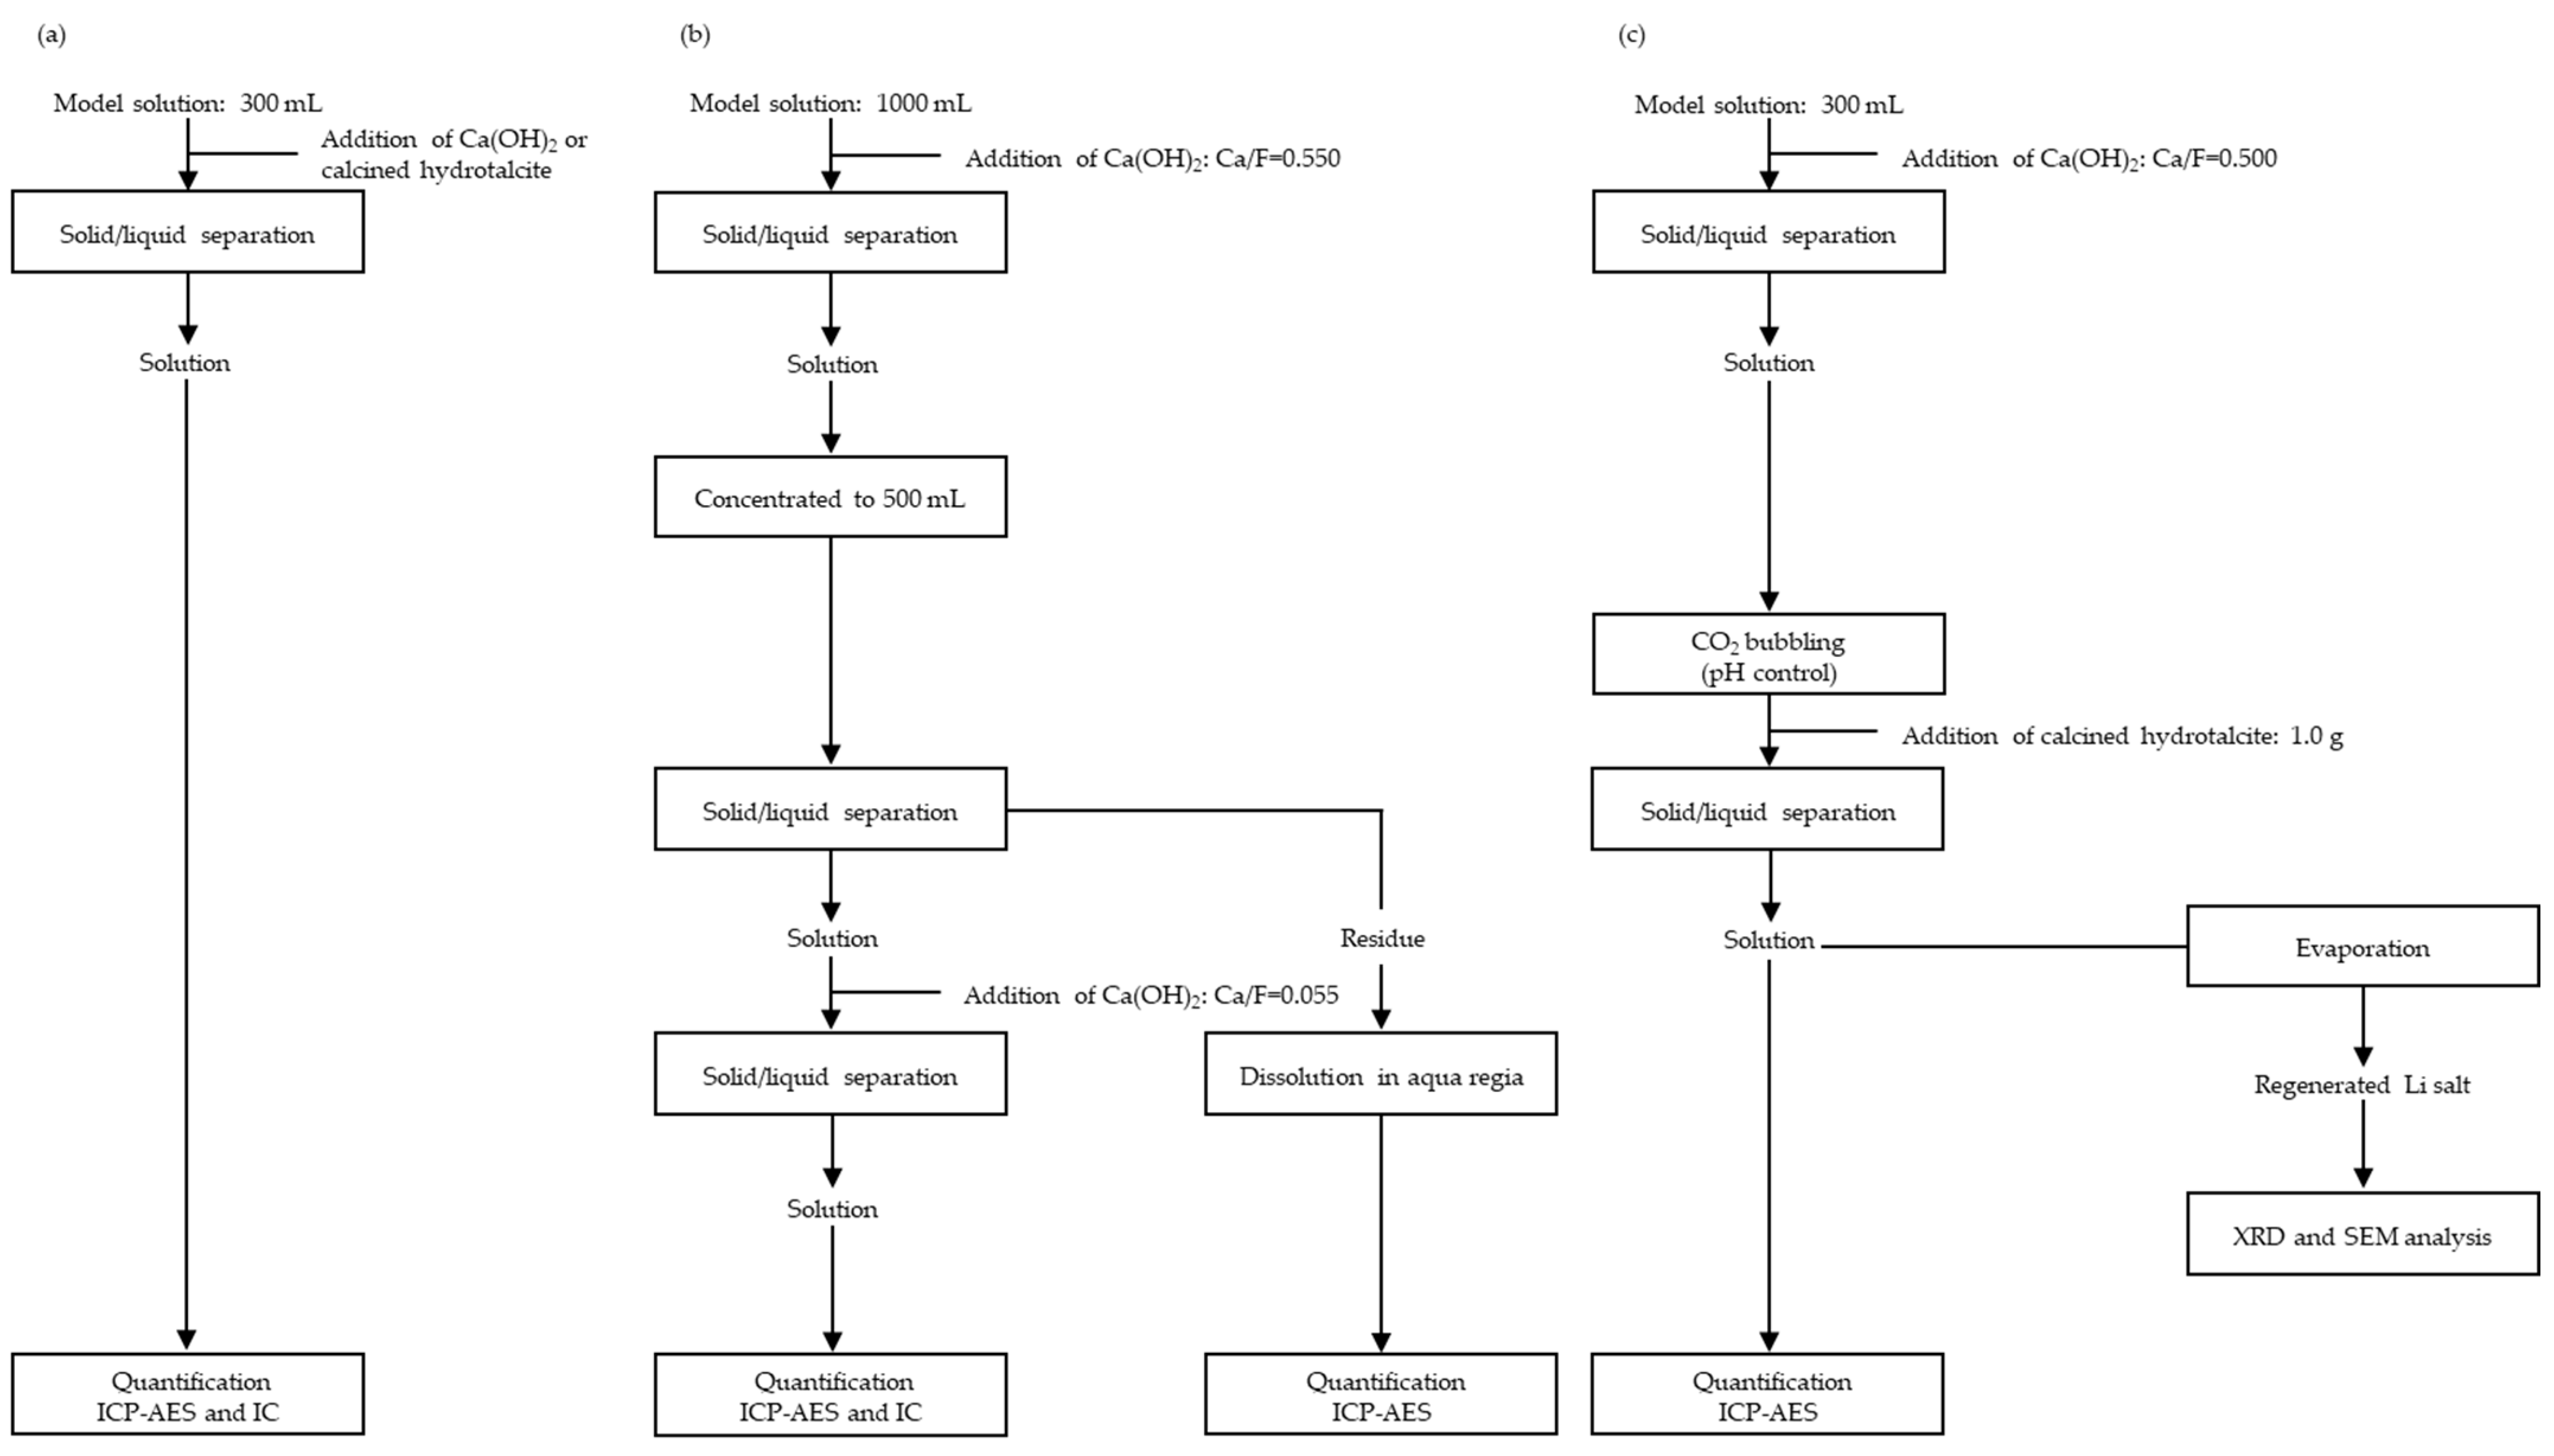
2.2. Fluorine Fixation Via the Wet Process
2.2.1. Single Step
2.2.2. Multiple Steps
2.3. Characterization
2.3.1. Elemental Analysis
2.3.2. XRD Analysis
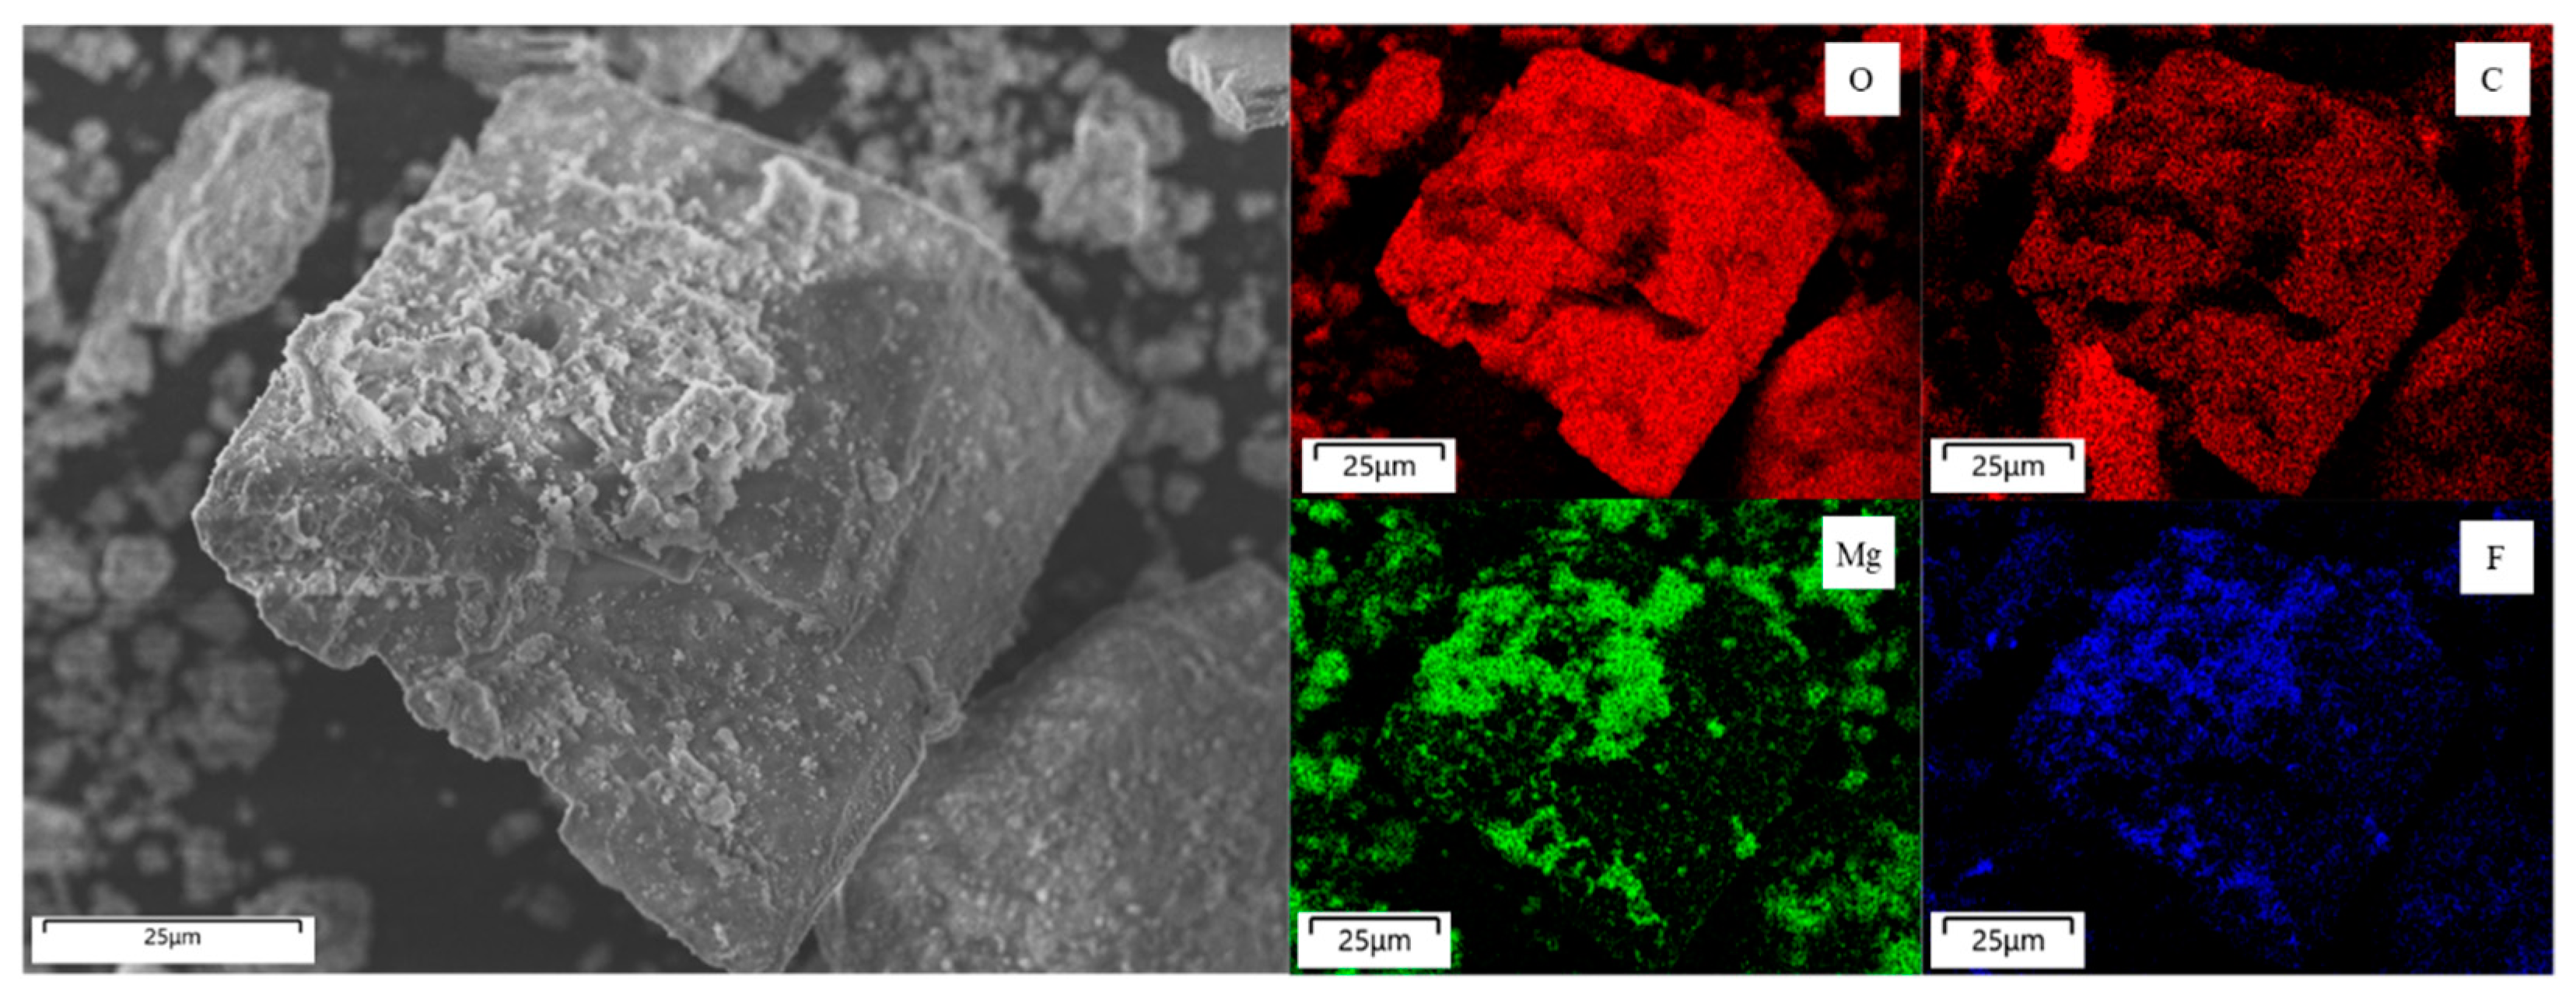
2.3.3. SEM Analysis
2.3.4. Calculation
3. Results
3.1. Li Recovery Via the Dry Process
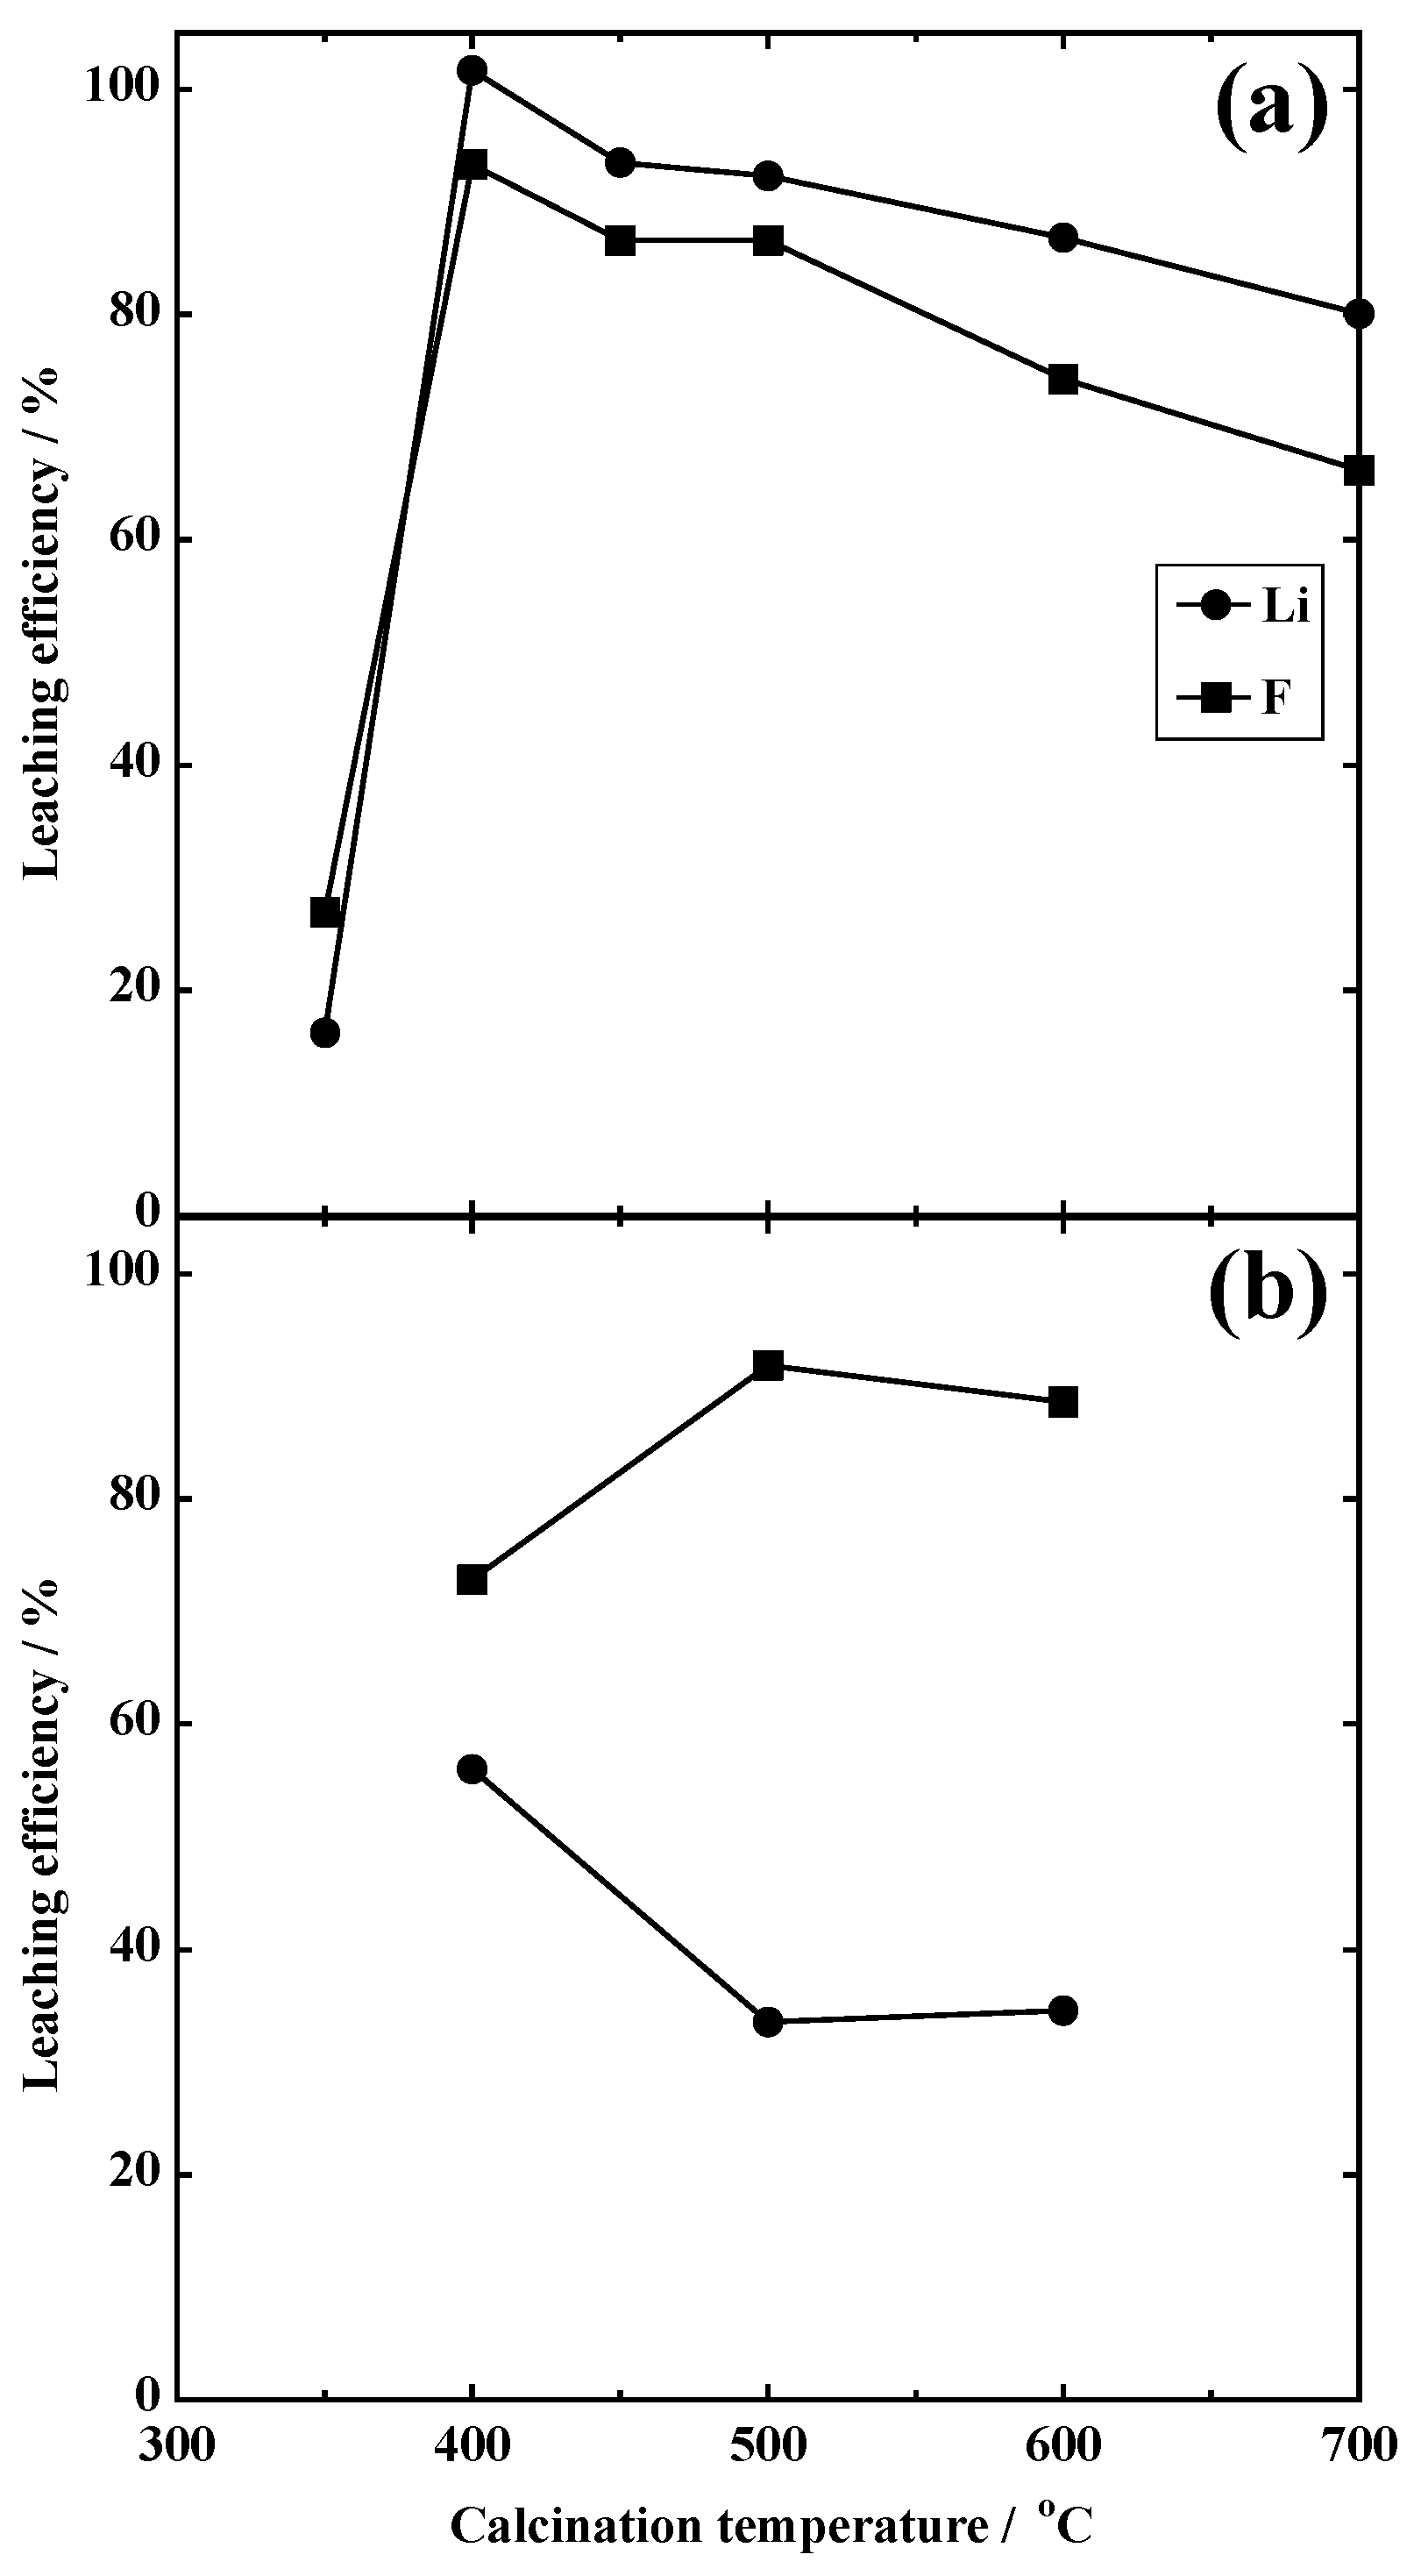
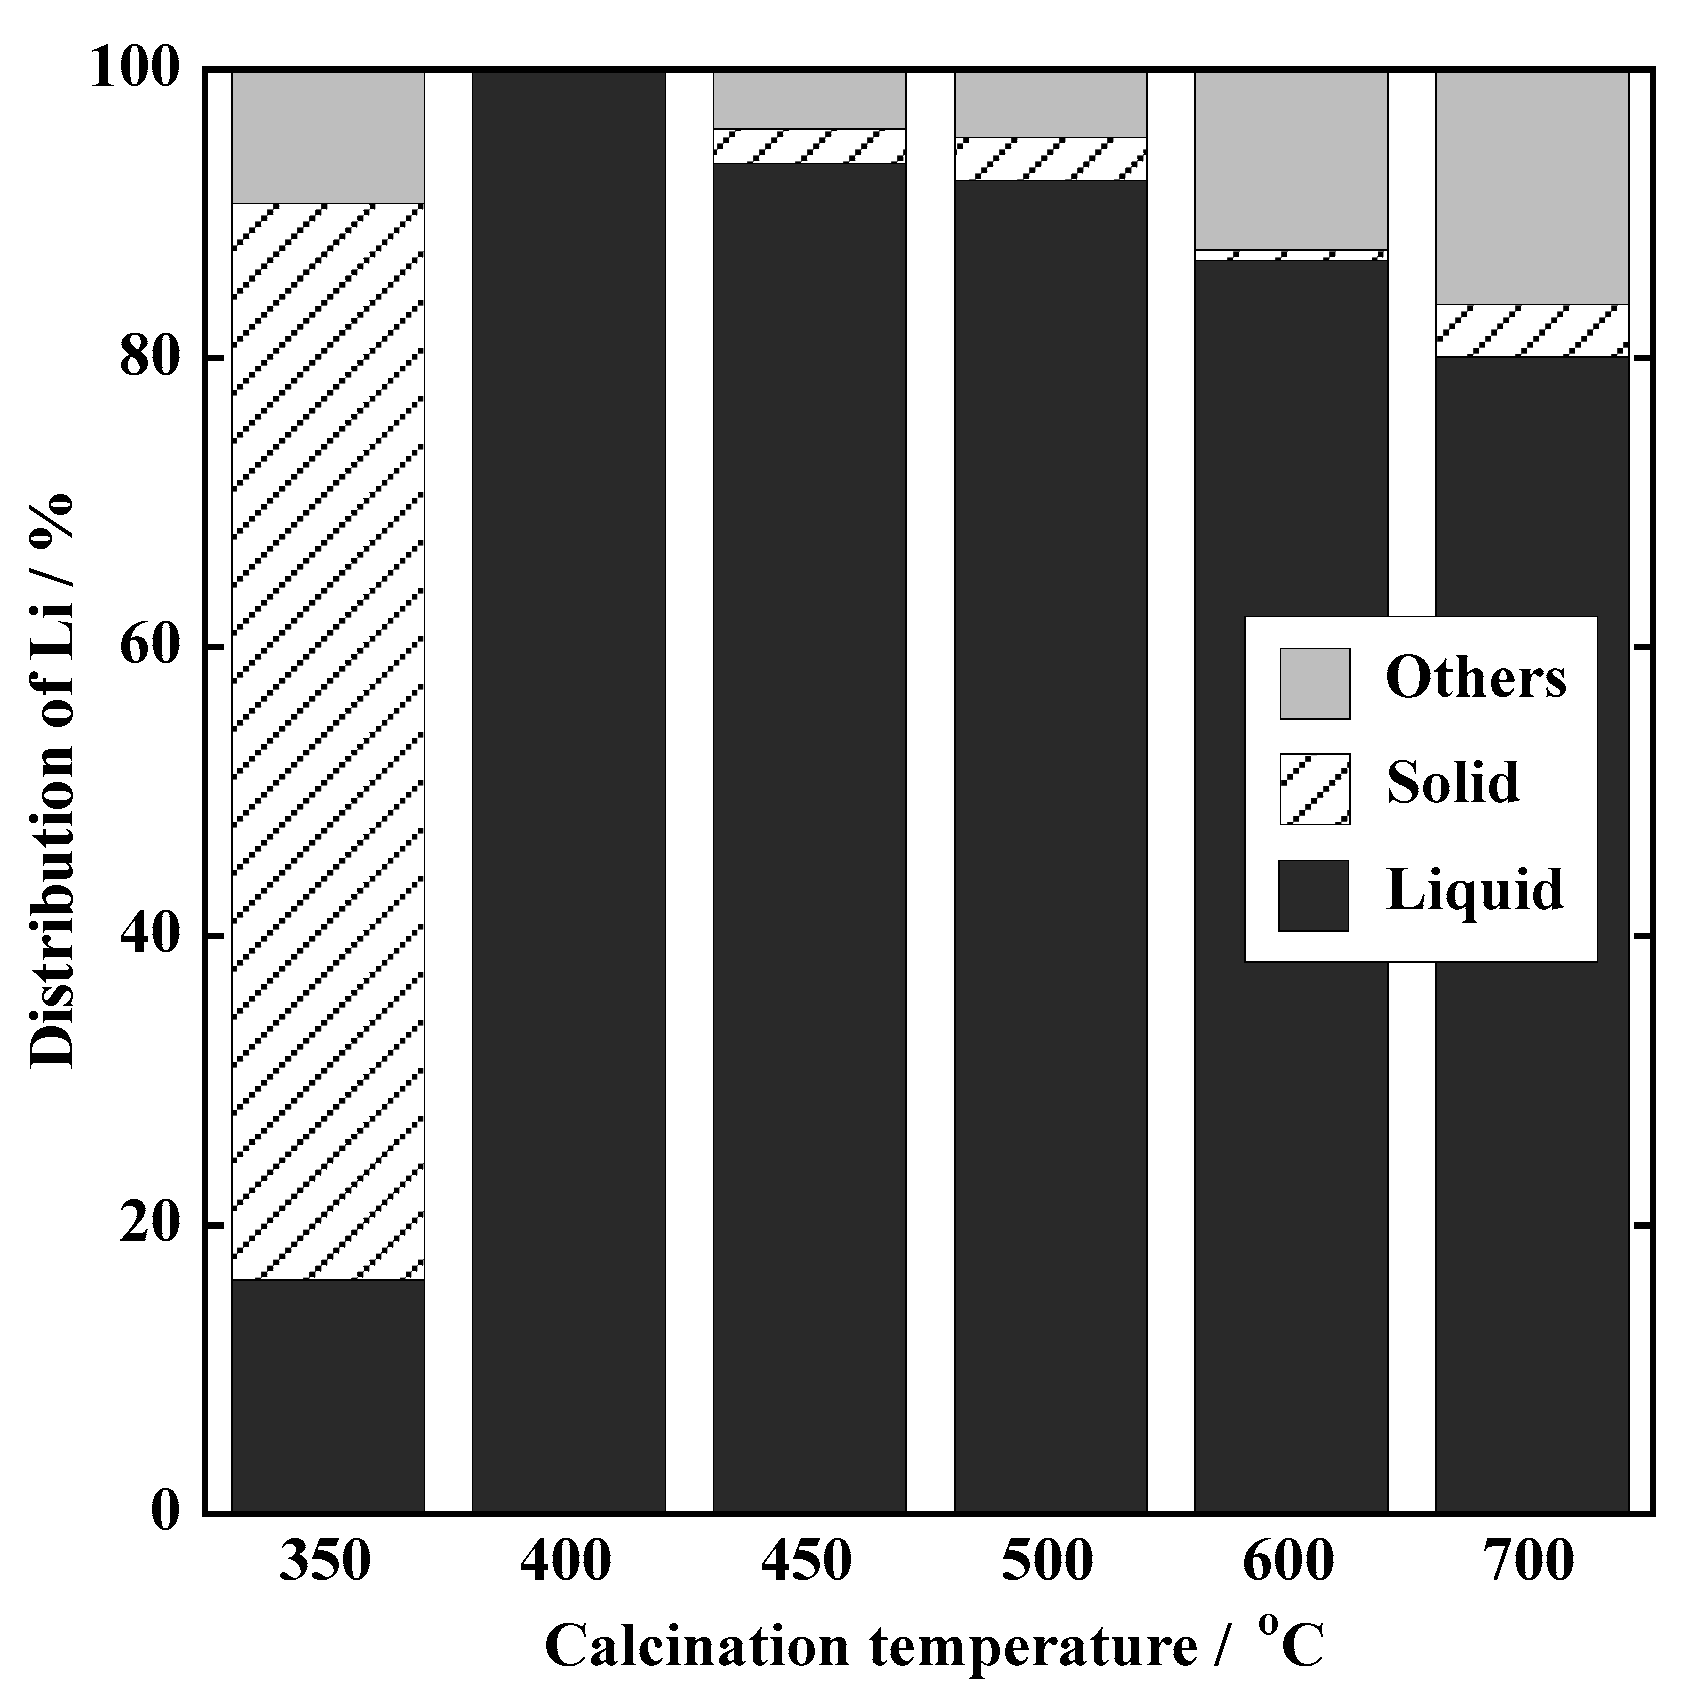
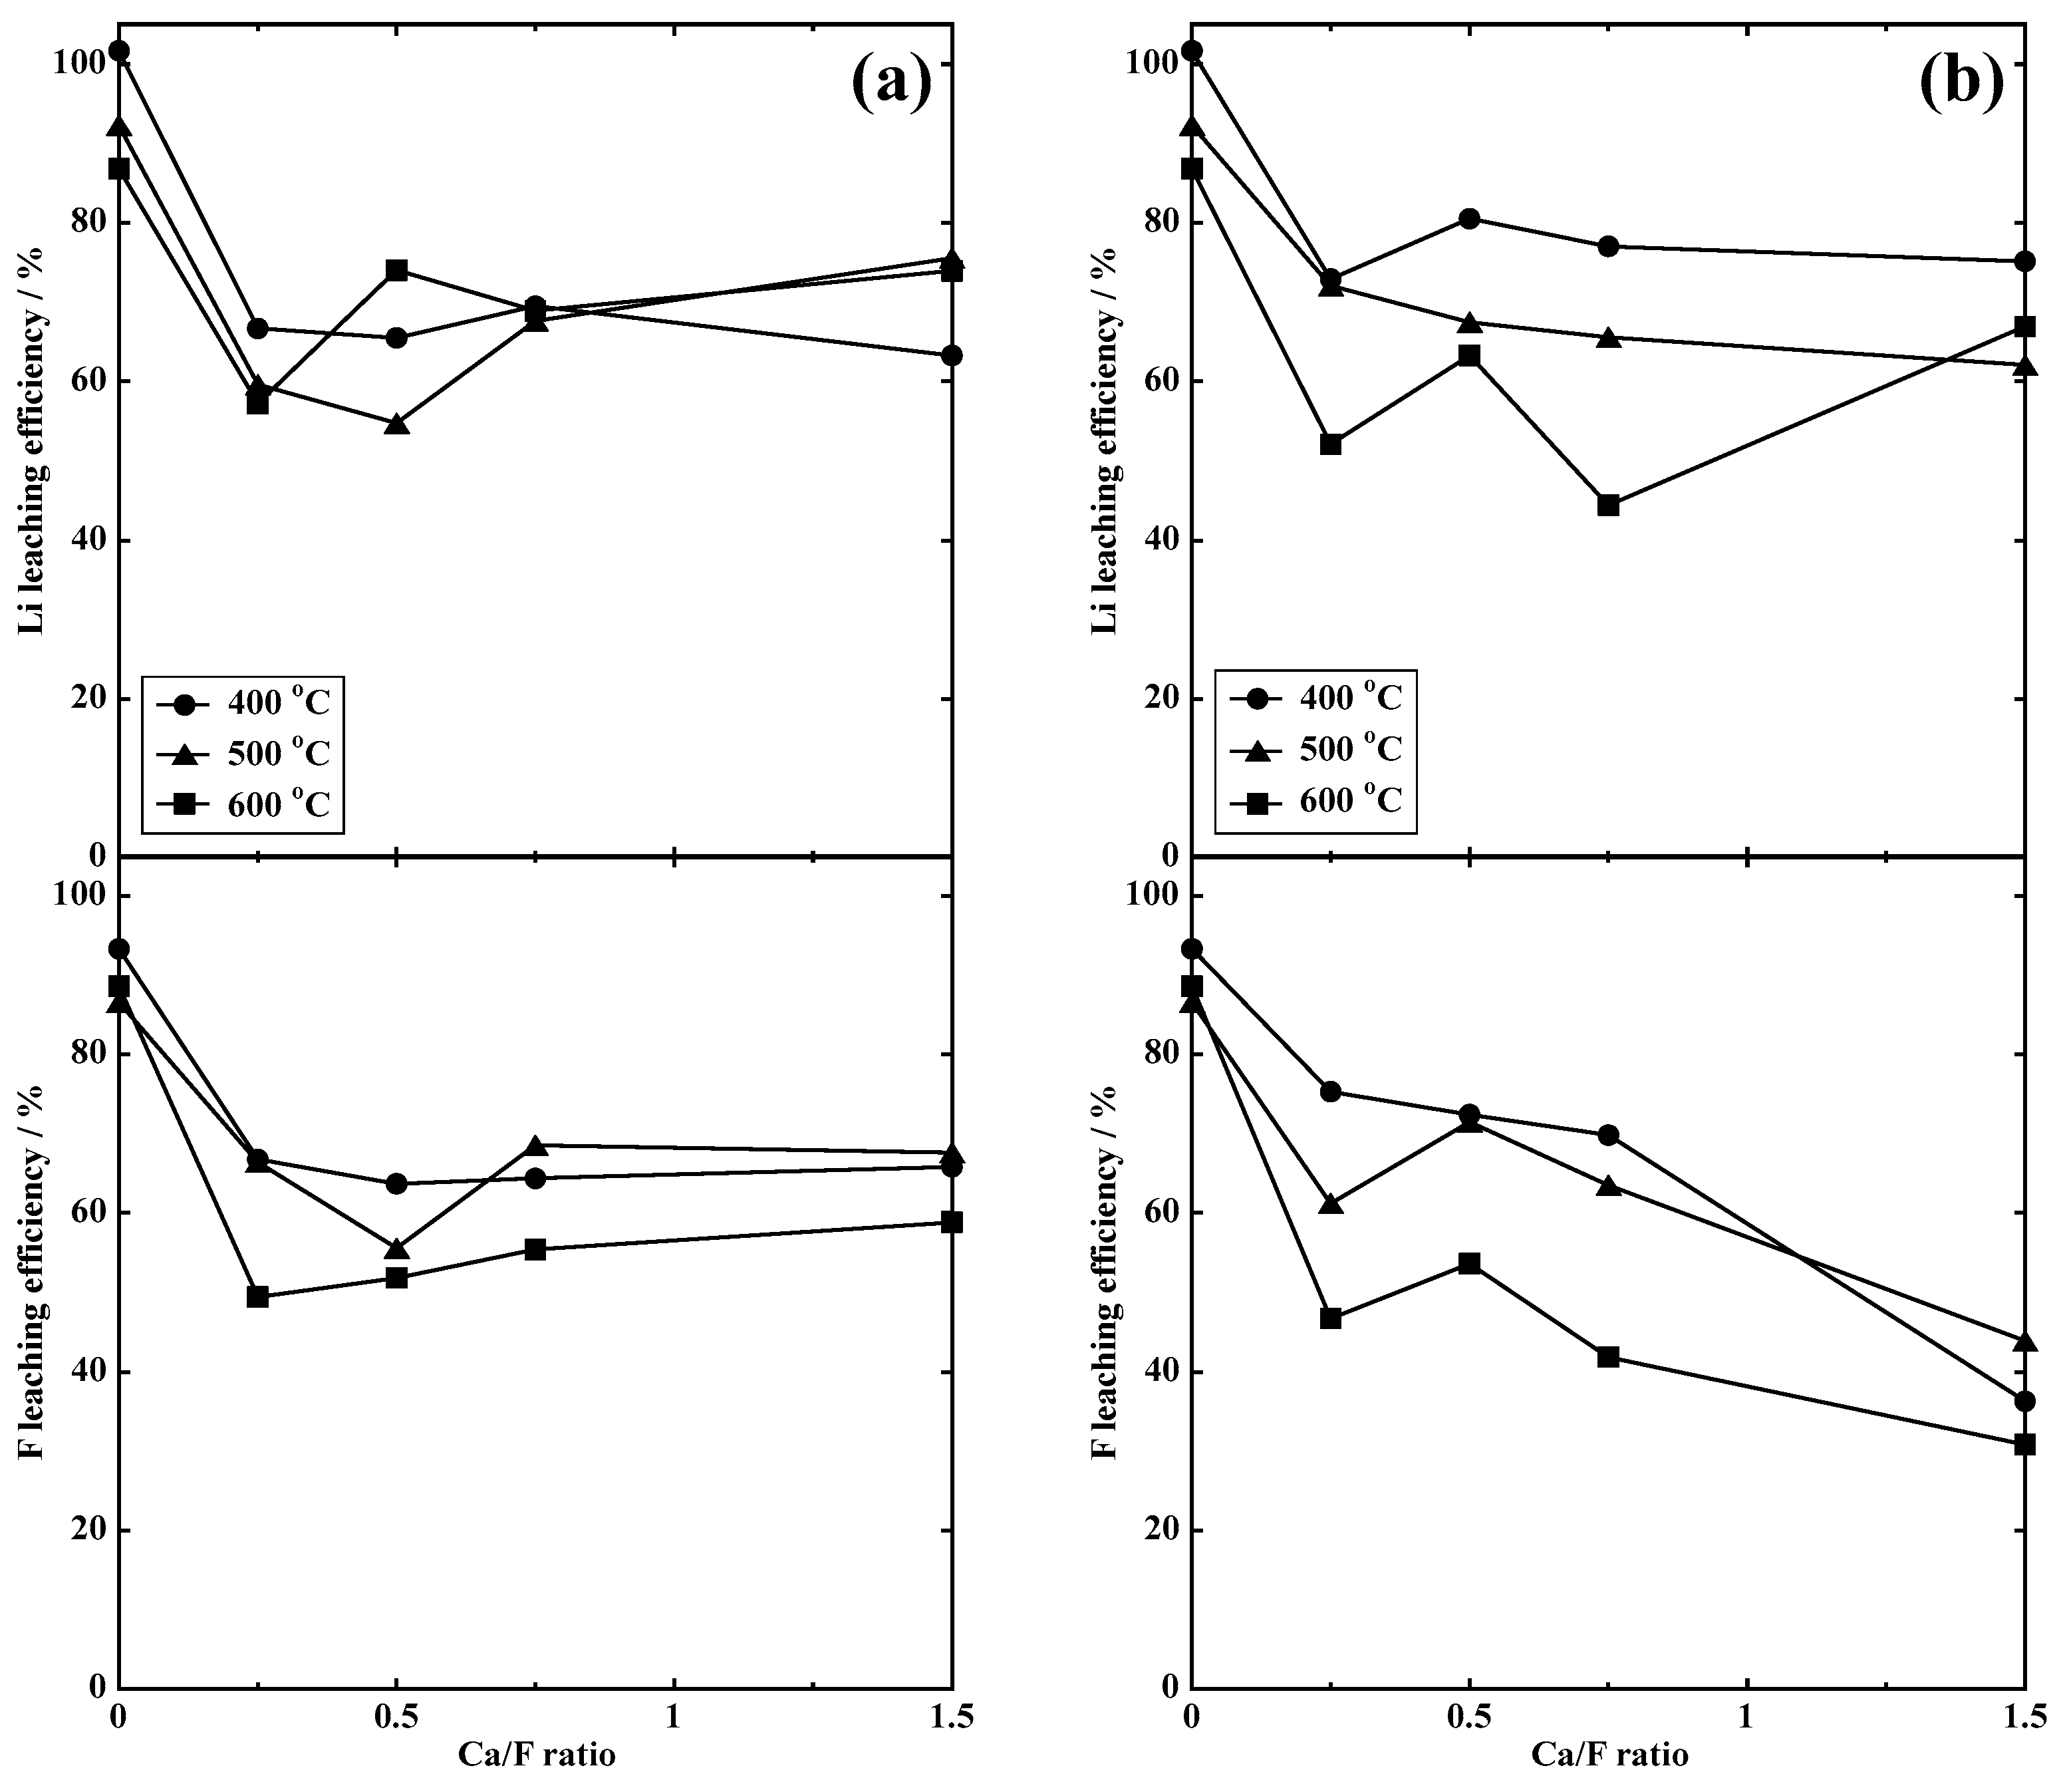
3.1.1. Leaching Behavior of Li
3.1.2. Material Balance of Li
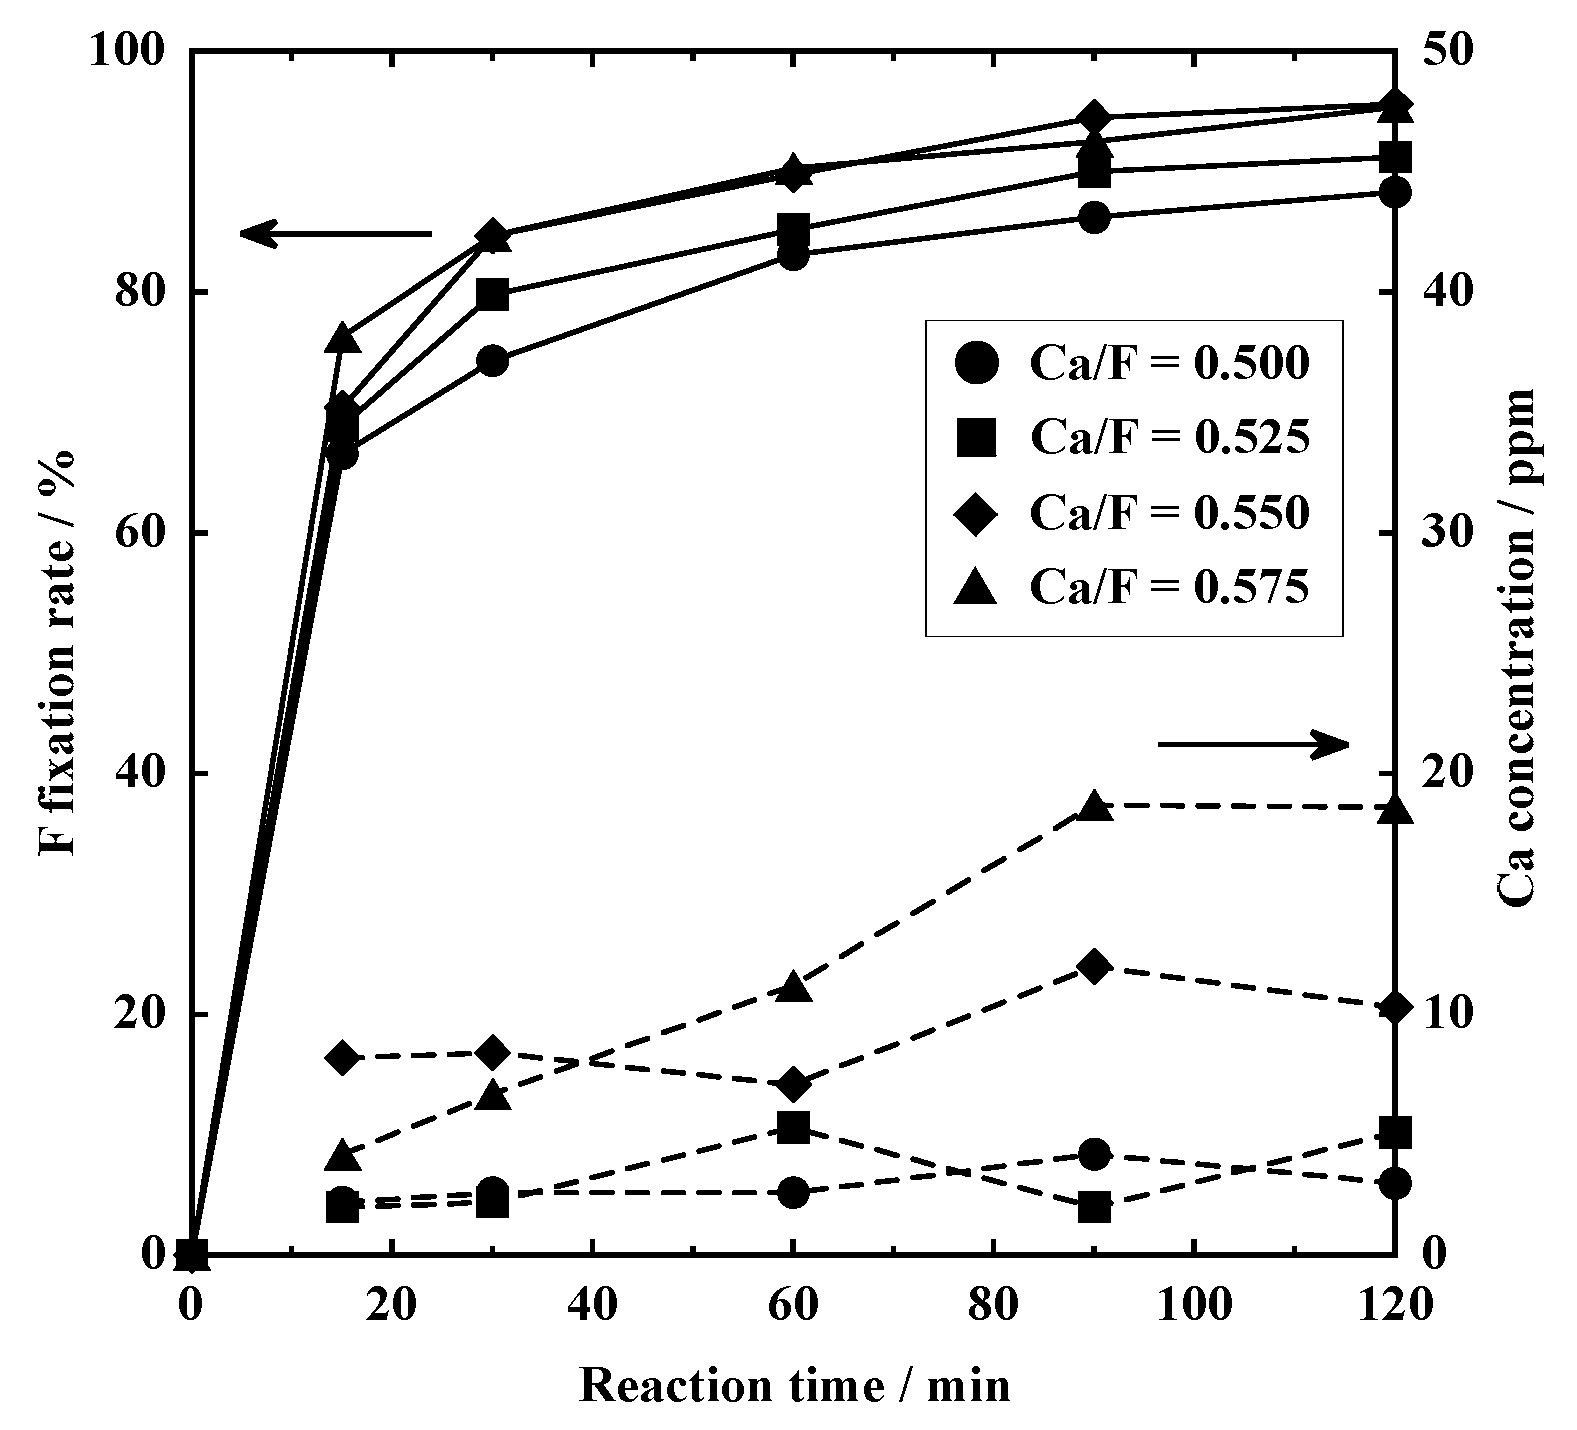
3.2. F Fixation for Li2CO3 Purification
3.2.1. Dry Process
3.2.2. Wet Process
3.2.3. F Fixed by Secondary Processing
3.2.4. Phase Identification of Regenerated Li Salt
4. Conclusions
Author Contributions
Funding
Institutional Review Board Statement
Informed Consent Statement
Data Availability Statement
Acknowledgments
Conflicts of Interest
References
- International Energy Association. The Role of Critical Minerals in Clean Energy Transitions; IEA Publication: Paris, France, 2021; Available online: https://www.iea.org/reports/the-role-of-critical-minerals-in-clean-energy-transitions (accessed on 11 March 2025).
- Council of the European Union; European Parliament. Regulation (EU) 2023/1542 of the European Parliament and of the Council of 12 July 2023 concerning batteries and waste batteries, amending Directive 2008/98/EC and Regulation (EU) 2019/1020 and repealing Directive 2006/66/EC. Off. J. Eur. Union 2023, L191, 1–117. Available online: https://eur-lex.europa.eu/legal-content/EN/TXT/?uri=OJ:L:2023:191:TOC (accessed on 11 March 2025).
- Council of the European Union; European Parliament. Regulation (EU) 2024/1252 of the European Parliament and of the Council of 11 April 2024 establishing a framework for ensuring a secure and sustainable supply of critical raw materials and amending Regulations (EU) no 168/2013, (EU) 2018/858, (EU) 2018/1724 and (EU) 2019/1020. Off. J. Eur. Union 2024, L1252, 1–67. Available online: https://eur-lex.europa.eu/eli/reg/2024/1252/oj (accessed on 11 March 2025).
- Subcommittee on Resource Efficiency; Circular Economy in Industrial Structure Council. Summary of the System Review to Realize a Growth-Oriented Strategy of Resource Efficiency and Circular Economy; Ministry of Economy, Trade and Industry. 2025. Available online: https://www.meti.go.jp/shingikai/sankoshin/sangyo_gijutsu/resource_circulation/pdf/20250213_1.pdf (accessed on 11 March 2025). (In Japanese)
- Ekberg, C.; Petranikova, M. Lithium batteries recycling. In Lithium Process Chemistry; Chagnes, A., Swiatowskaa, J., Eds.; Elsevier: Amsterdam, The Netherlands, 2015; pp. 233–267. [Google Scholar] [CrossRef]
- Li, J.; Wang, G.; Xu, Z. Environmentally friendly oxygen-free roasting/wet magnetic separation technology for in situ recycling cobalt, lithium carbonate and graphite from spent LiCoO2/graphite lithium batteries. J. Hazard. Mater. 2016, 302, 97–104. [Google Scholar] [CrossRef] [PubMed]
- Li, Y.; Lv, W.; Huang, H.; Yan, W.; Li, X.; Ning, P.; Cao, H.; Sun, Z. Recycling of spent lithium-ion batteries in view of green chemistry. Green Chem. 2021, 23, 6139–6171. [Google Scholar] [CrossRef]
- Velázquez-Martínez, O.; Valio, J.; Santasalo-Aarnio, A.; Reuter, M.; Serna-Guerrero, R. A critical review of lithium-ion battery recycling processes from a circular economy perspective. Batteries 2019, 5, 68. [Google Scholar] [CrossRef]
- Al-Asheh, S.; Aidan, A.; Allawi, T.; Hammoud, F.; Al Ali, H.; Al Khamiri, M. Treatment and recycling of spent lithium-based batteries: A review. J. Mater. Cycles Waste Manag. 2024, 26, 76–95. [Google Scholar] [CrossRef]
- Lv, W.; Wang, Z.; Cao, H.; Sun, Y.; Zhang, Y.; Sun, Z. A critical review and analysis on the recycling of spent lithium-ion batteries. ACS Sustain. Chem. Eng. 2018, 6, 1504–1521. [Google Scholar] [CrossRef]
- Kuzuhara, S.; Ota, M.; Tsugita, F.; Kasuya, R. Recovering lithium from the Cathode Active Material in Lithium-Ion Batteries via Thermal Decomposition. Metals 2020, 10, 433. [Google Scholar] [CrossRef]
- Lombardo, G.; Ebin, B.; Foreman, M.R.S.J.; Steenari, B.M.; Petranikova, M. Incineration of EV lithium-ion batteries as a pretreatment for recycling—Determination of the potential formation of hazardous by-products and effects on metal compounds. J. Hazard. Mater. 2020, 393, 122372. [Google Scholar] [CrossRef]
- Makuza, B.; Tian, Q.; Guo, X.; Chattopadhyay, K.; Yu, D. Pyrometallurgical options for recycling spent lithium-ion batteries: A comprehensive review. J. Power Sources 2021, 491, 229622. [Google Scholar] [CrossRef]
- Liu, P.; Xiao, L.; Tang, Y.; Chen, Y.; Ye, L.; Zhu, Y. Study on the reduction roasting of spent LiNixCoyMnzO2 lithium-ion battery cathode materials. J. Therm. Anal. Calorim. 2019, 136, 1323–1332. [Google Scholar] [CrossRef]
- Chabhadiya, K.; Srivastava, R.R.; Pathak, P. Two-step leaching process and kinetics for an eco-friendly recycling of critical metals from spent Li-ion batteries. J. Environ. Chem. Eng. 2021, 9, 105232. [Google Scholar] [CrossRef]
- Sasai, R.; Fujimura, T.; Uesugi, R.; Aketo, T.; Komatsu, K. Eco-friendly recovery process of lithium from reduction roasting residue powder based on hydrothermal extraction. J. Mater. Cycles Waste Manag. 2023, 25, 389–395. [Google Scholar] [CrossRef]
- Kuzuhara, S.; Yamada, Y.; Igarashi, A.; Fujiwara, K.; Terakado, O.; Kasuya, R. Fluorine fixation for spent lithium-ion batteries toward closed-loop lithium recycling. J. Mater. Cycles Waste Manag. 2024, 26, 2696–2705. [Google Scholar] [CrossRef]
- Zhao, M.-M.; Wang, Q.; Krua, L.S.N.; Yi, R.-N.; Zou, R.-J.; Li, X.-Y.; Huang, P. Application progress of new adsorption materials for removing fluorine from waster. Water 2023, 15, 646. [Google Scholar] [CrossRef]
- Wan, D.; Liu, Y.; Xiao, S.; Chen, J.; Zhang, J. Uptake fluoride from water by calcined Mg-Al-CO3 hydrotalcite: Mg/Al ratio effect on its structure, electrical affinity and adsorptive property. Colloids Surf. A Physicochem. Eng. Asp. 2015, 469, 307–314. [Google Scholar] [CrossRef]
- Kameda, T.; Oba, J.; Yoshioka, T. Removal of boron and fluoride in wastewater using Mg-Al layered double hydroxide and Mg-Al oxide. J. Environ. Manag. 2017, 188, 58–63. [Google Scholar] [CrossRef]
- Tanaka, F.; Gungaajav, L.; Terakado, O.; Kuzuhara, S.; Kasuya, R. Dehydrofluorination behavior of poly(vinylidene fluoride) during thermal treatment using calcium carbonate. Thermochim. Acta 2021, 702, 178977. [Google Scholar] [CrossRef]
- Miyata, S. Anion-exchange properties of hydrotalcite-like compounds. Clays Clay Miner. 1983, 31, 305–311. [Google Scholar] [CrossRef]
- Watabe, K.; Seto, Y.; Miura, H. Crystal structure of 3MgO·2CO2 solved by Monte Carlo simulation. J. Comput. Chem. Jpn. 2009, 8, 179–182. [Google Scholar] [CrossRef]
- Sotiles, A.R.; Baika, L.M.; Grassi, M.T.; Wypych, F. Cation Exchange Reactions in Layered Double Hydroxides Intercalated with Sulfate and Alkaline Cations (A(H2O)6)[M2+6Al3(OH)18(SO4)2]·6H2O (M2+ = Mn, Mg, Zn; A+ = Li, Na, K). J. Am. Chem. Soc. 2019, 141, 531–540. [Google Scholar] [CrossRef] [PubMed]


| Calcination Temperature/°C | Li/F Ratio/Atomic Ratio | |
|---|---|---|
| Ar | Air | |
| 350 | 1.8 | - |
| 400 | 3.2 | 2.3 |
| 450 | 3.2 | - |
| 500 | 3.1 | 1.1 |
| 600 | 3.4 | 1.1 |
| 700 | 3.6 | - |
| Total F Fixation Rate/% | Ca Concentration/ppm | |
|---|---|---|
| Primary process | 98.2 | 57.4 |
| After concentration | - | 1.1 |
| Secondary process | 98.6 | 8.9 |
| Additive | Total F Fixation Rate /% | F Concentration /ppm | Initial pH /- | Final pH /- |
|---|---|---|---|---|
| Calcium hydroxide | 89.1 | 109.5 | 7.8 | 12.3 |
| Hydrotalcite | 95.8 | 61.3 | 6.8 | 9.0 |
Disclaimer/Publisher’s Note: The statements, opinions and data contained in all publications are solely those of the individual author(s) and contributor(s) and not of MDPI and/or the editor(s). MDPI and/or the editor(s) disclaim responsibility for any injury to people or property resulting from any ideas, methods, instructions or products referred to in the content. |
© 2025 by the authors. Licensee MDPI, Basel, Switzerland. This article is an open access article distributed under the terms and conditions of the Creative Commons Attribution (CC BY) license (https://creativecommons.org/licenses/by/4.0/).
Share and Cite
Fujiwara, K.; Ito, K.; Kuzuhara, S.; Terakado, O.; Hosoya, N.; Hayashi, H.; Kasuya, R. Development of Fluorine Fixation Processes for the Horizontal Recycling of Lithium. Materials 2025, 18, 2050. https://doi.org/10.3390/ma18092050
Fujiwara K, Ito K, Kuzuhara S, Terakado O, Hosoya N, Hayashi H, Kasuya R. Development of Fluorine Fixation Processes for the Horizontal Recycling of Lithium. Materials. 2025; 18(9):2050. https://doi.org/10.3390/ma18092050
Chicago/Turabian StyleFujiwara, Kazuki, Kaisei Ito, Shunsuke Kuzuhara, Osamu Terakado, Natsuki Hosoya, Hideo Hayashi, and Ryo Kasuya. 2025. "Development of Fluorine Fixation Processes for the Horizontal Recycling of Lithium" Materials 18, no. 9: 2050. https://doi.org/10.3390/ma18092050
APA StyleFujiwara, K., Ito, K., Kuzuhara, S., Terakado, O., Hosoya, N., Hayashi, H., & Kasuya, R. (2025). Development of Fluorine Fixation Processes for the Horizontal Recycling of Lithium. Materials, 18(9), 2050. https://doi.org/10.3390/ma18092050