Article

Understanding the Adsorption Behavior of Different Crystal Surfaces of Manganese Monoxide to Strontium Nitrate Solutions: A Molecular Dynamics Simulation

1
School of Civil Engineering, University of South China, Hengyang 421001, China
2
School of Resources, Environment and Safety Engineering, University of South China, Hengyang 421001, China
3
Shanghai Urban Construction Design Research Institute (Group) Co., Ltd., Shanghai 200125, China
4
College of Chemistry and Chemical Engineering, Central South University, Changsha 410083, China
*
Author to whom correspondence should be addressed.
Materials 2025, 18(8), 1752; https://doi.org/10.3390/ma18081752
Submission received: 18 February 2025 / Revised: 27 March 2025 / Accepted: 1 April 2025 / Published: 11 April 2025

Abstract

:
Manganese monoxide (MnO), a versatile manganese oxide, is highly regarded for its potential to address heavy metal and radioactive contamination effectively. In this study, we investigated the adsorption mechanism of strontium nitrate solution on MnO crystal surfaces using molecular dynamics simulations. We examined the effects of adsorption and diffusion of ions and water molecules on three distinct MnO crystal surfaces. The results revealed significant differences in the adsorption capacities of Sr2+, NO3, and H2O on the MnO crystal surfaces. The radial distribution function (RDF), the non-bond interaction energy (Eint), and mean square displacement (MSD) data indicate that Sr2+ exhibits the strongest interaction with the MnO (111) crystal surface. This results in a shift of Sr2+ from outer-sphere adsorption to inner-sphere adsorption. This strong interaction is primarily due to the increase in the number and prominence of non-bridging oxygen atoms on the MnO crystal surfaces.

Graphical Abstract

1. Introduction

Countries across the globe are actively advancing nuclear energy development due to its high energy density and low carbon emissions. The disposal of nuclear waste remains one of the foremost challenges hindering the progression of nuclear energy development [1]. Compared to various fission by-products, 90Sr is a major contributor to the total radioactivity in high-level liquid nuclear wastes (HLLWs) and is regarded as one of the most hazardous radioactive pollutants due to its high fission yield, long half-life, high-energy β-decay, and biotoxicity [2,3]. The efficient and rapid removal of 90Sr from radioactive wastewater is of critical importance. Sr2+ removal from radioactive wastewater is primarily achieved via precipitation [4], solvent extraction [5], and adsorption [6], with the adsorption method being particularly favored due to its simplicity and high efficiency. The effectiveness of the adsorption method is largely dependent on the selection of the adsorption material. Inorganic materials, as compared to organic materials, exhibit superior chemical and irradiation stability, rendering them more suitable for practical radioactive wastewater treatment.
Metal oxides, including Mn, Fe, and others, within inorganic materials have shown significant advancements in the removal of Sr2+ from radioactive wastewater. This prominence is attributed to their inorganic nature, high removal efficiencies, robust adsorption capacities, and straightforward synthesis and application procedures [7,8,9,10]. Asim et al. synthesized nano-MnO2 with three distinct morphologies—flower-shaped, block-shaped, and tubular—employing a microwave-assisted hydrothermal method, achieving stability in just 10 min [11]. Shen et al. prepared sodium manganese silicate via a one-pot hydrothermal approach, demonstrating an adsorption capacity for Sr2+ up to 249.0 mg/g [12]. Zheng et al. utilized a direct impregnation technique to deposit MnO2 onto HMSS, achieving a peak adsorption capacity of 138.70 mg/g [13]. Bangun et al. synthesized water-soluble coal oxide (CObt) and its composite with magnetic hematite (γ-Fe2O3) through a dual oxidation process. The results demonstrated that the materials were effective in detecting Sr2+ in solution under both acidic and alkaline conditions [14]. Hojae et al. identified the presence of Sr2+ on the hematite surface using X-ray absorption near-edge structure (XANES) and other techniques to investigate the internal ball adsorption behavior. Simultaneously, Sr2+ can be eluted in calcium ion solutions, leading to substitution and the formation of CaCO3 and CaFe2O4 [15]. Olga N. Karasyova et al. investigated the acid–base reactions and surface complexation of Sr2+ at the hematite/water interface through potentiometric titration at varying temperatures. Equilibrium modeling revealed that the inner-sphere complexes consisted of FeOHSr2+ and FeOSrOH [16]. These studies examined the adsorption properties and mechanisms of Mn and Fe oxides on Sr2+, with a particular focus on elucidating the form of inner-sphere complexes formed by Sr2+ on the hematite surface. However, it remains unclear whether Sr2+ on the surface of Mn oxides can form inner-sphere complexes as well. This limitation hinders the development of novel manganese oxides for Sr2+ removal from radioactive wastewater, thereby hindering the safe advancement of nuclear energy.
Molecular simulation serves as an invaluable tool for elucidating interactions between adsorbent materials and adsorbates, providing critical insights into the underlying adsorption mechanisms [17,18,19,20,21,22,23]. Kim et al. disclosed the adsorption behavior of Cs+ on todorokite via molecular dynamics (MD) simulations, noting that Cs+ predominantly adsorbs at the corner sites within todorokite (as an inner-sphere (IS) complex) and at edge-step sites on the external (100)/(001) surfaces (as both IS and outer-sphere (OS) complexes) [24]. Employing experimental and MD simulation techniques, Salari et al. demonstrated that increasing temperature and concentration enhances the adsorption capacity of methylene blue on MnO2 surfaces [25]. Guo et al., utilizing first-principles calculations, determined that a composite of MnO and graphene reduces the adsorption energy of Zn2+ on a microscopic scale [26]. Ilyasov et al. demonstrated via DFT simulations that the interface hydrogenation rate and spatial configuration of MnO (111) impart magnetism to single-layer graphene [27]. These studies have elucidated the interactions between the surfaces of manganese oxides, including todorokite, MnO2, and MnO, with Cs+, Zn2+, and other ions.
MnO, compared to other Mn oxides, adopts a Wurtzite structure within the hexagonal crystal system (space group P63mc). Mn2+ is bonded to four equivalent O2− atoms to form corner-sharing MnO4 tetrahedra. Active sites, such as non-bridging oxygen atoms on the crystal surface of MnO, are well defined and provide strong binding sites for Sr2+, in contrast to the facile hydroxylation of the MnO2 surface [28], which preferentially adsorbs UO2+ and other high-valence ions from radioactive wastewater. Furthermore, the simple hexagonal lattice of MnO enables the construction of small-scale supercells with well-established force field parameters (COMPASS force field), thereby reducing computational costs compared to manganese oxides with more complex tunneling structures, such as todorokite, which require larger models. Consequently, we selected MnO to investigate the adsorption behavior and mechanism of Sr2+ on the surface of manganese oxides.
This study presents, for the first time, an investigation into the adsorption behavior and mechanism of Sr2+ in solutions on different crystal surfaces of MnO using MD simulations. The particle density profiles (PDPs), radial distribution functions (RDFs), the network of hydrogen bonds, the non-bond interaction energies, mean square displacements, and diffusion coefficients of Sr2+, NO3, and H2O were examined. RDF analysis revealed that Sr2+ formed inner-sphere complexes with non-bridging oxygen atoms on the MnO (111) crystal surface, while Sr2+ on other crystal surfaces formed only outer-sphere complexes. Nonbonding interactions indicated that MnO adsorbs Sr2+ in solution primarily through the electrostatic interaction between non-bridging oxygen atoms on the crystal surface and Sr2+. These microstructural and kinetic findings elucidate the adsorption behaviors and mechanisms of Sr2+ on the surfaces of various manganese oxide crystals, offering valuable insights into the development of high-performance manganese oxide materials for strontium removal and ensuring the safe advancement of nuclear energy.

2. Materials and Methods

2.1. Models

The modeling of interfacial adsorption of strontium nitrate solution on various MnO crystal surfaces was carried out in two stages. In the initial stage, data were retrieved from the Materials Project for MnO (mp-999539) from database version v2025.02.12 [29] post1. MnO adopts the hexagonal crystal system (space group P63mc) and a lattice constant of (a = b = 3.42 Å, c = 5.35 Å, α = β = 90.00°, ɣ = 120.00°) [30]. Comprehensive details regarding the crystal structure of MnO can be found in Supplementary Materials Table S1. The XRD patterns of MnO (mp-999539) in this model are presented in Supplementary Materials Figure S1. Based on the convenience of XRD characterization and modeling calculations reported in the relevant literature, the MnO unit cell was divided into the following crystal surfaces: (100) surface (P1), (110) surface (P1), and (111) surface (P1) [30]. To facilitate the study, orthogonalization, and supercell expansion were applied to the different MnO crystal surfaces, resulting in surfaces with similar volume and area.
In the second stage, a strontium nitrate solution model with a concentration of 0.6 mol/L was constructed, based on previous studies, containing 28 Sr2+ and 56 NO3 at a density of approximately 1 g/cm3 [31]. To maintain symmetry and study convenience, two identical MnO crystal surfaces were positioned above and below the strontium nitrate solution. The interfacial adsorption model of strontium nitrate solution on different MnO crystal surfaces was finalized. The schematic of the interfacial adsorption model and the system information table are presented in Figure 1 and Table 1, respectively.

2.2. Force Field and Molecular Dynamics Simulation Details

The COMPASS (Condensed-phase Optimized Molecular Potentials for Atomistic Simulation Studies) force field offers an ideally suited potential energy function and is extensively employed in related MD simulations [32,33,34]. Consequently, this study utilized the COMPASS III force field, implementing atom-based and Ewald methods to simulate short-range van der Waals forces (with a cutoff of 12.5 Å) and long-range electrostatic forces, respectively.
The MD simulations were conducted utilizing the FORCITE module of the commercial software Materials Studio 2023. The Velocity Verlet algorithm was employed to monitor the thermodynamic properties of the system, including temperature, pressure, and total energy. The entire process was executed within the framework of the Hoover canonical ensemble (NVT) [35]. A time step of 1 fs was established, and the temperature was consistently maintained at 300 K. Temperature regulation was achieved using a Nosé thermostat, with periodic boundary conditions applied in three dimensions. Initially, the MnO crystal surfaces in the interfacial model were fixed. Subsequently, the strontium nitrate solution was allowed to diffuse freely, enabling the system to achieve equilibrium at 6000 ps within the NVT ensemble. Data analysis was carried out on the final 2000 ps of atomic trajectories to ensure robust results. Ultimately, measurements such as the density profiles, radial distribution function (RDF), network of hydrogen bonds, non-bond interaction energies, mean square displacements, and diffusion coefficients for Sr2+, NO3, and H2O were obtained. The results of this study provide insights into the adsorption and diffusion properties and mechanisms of Sr2+, NO3, and H2O in solutions on various MnO crystal surfaces.

2.3. Data Analysis

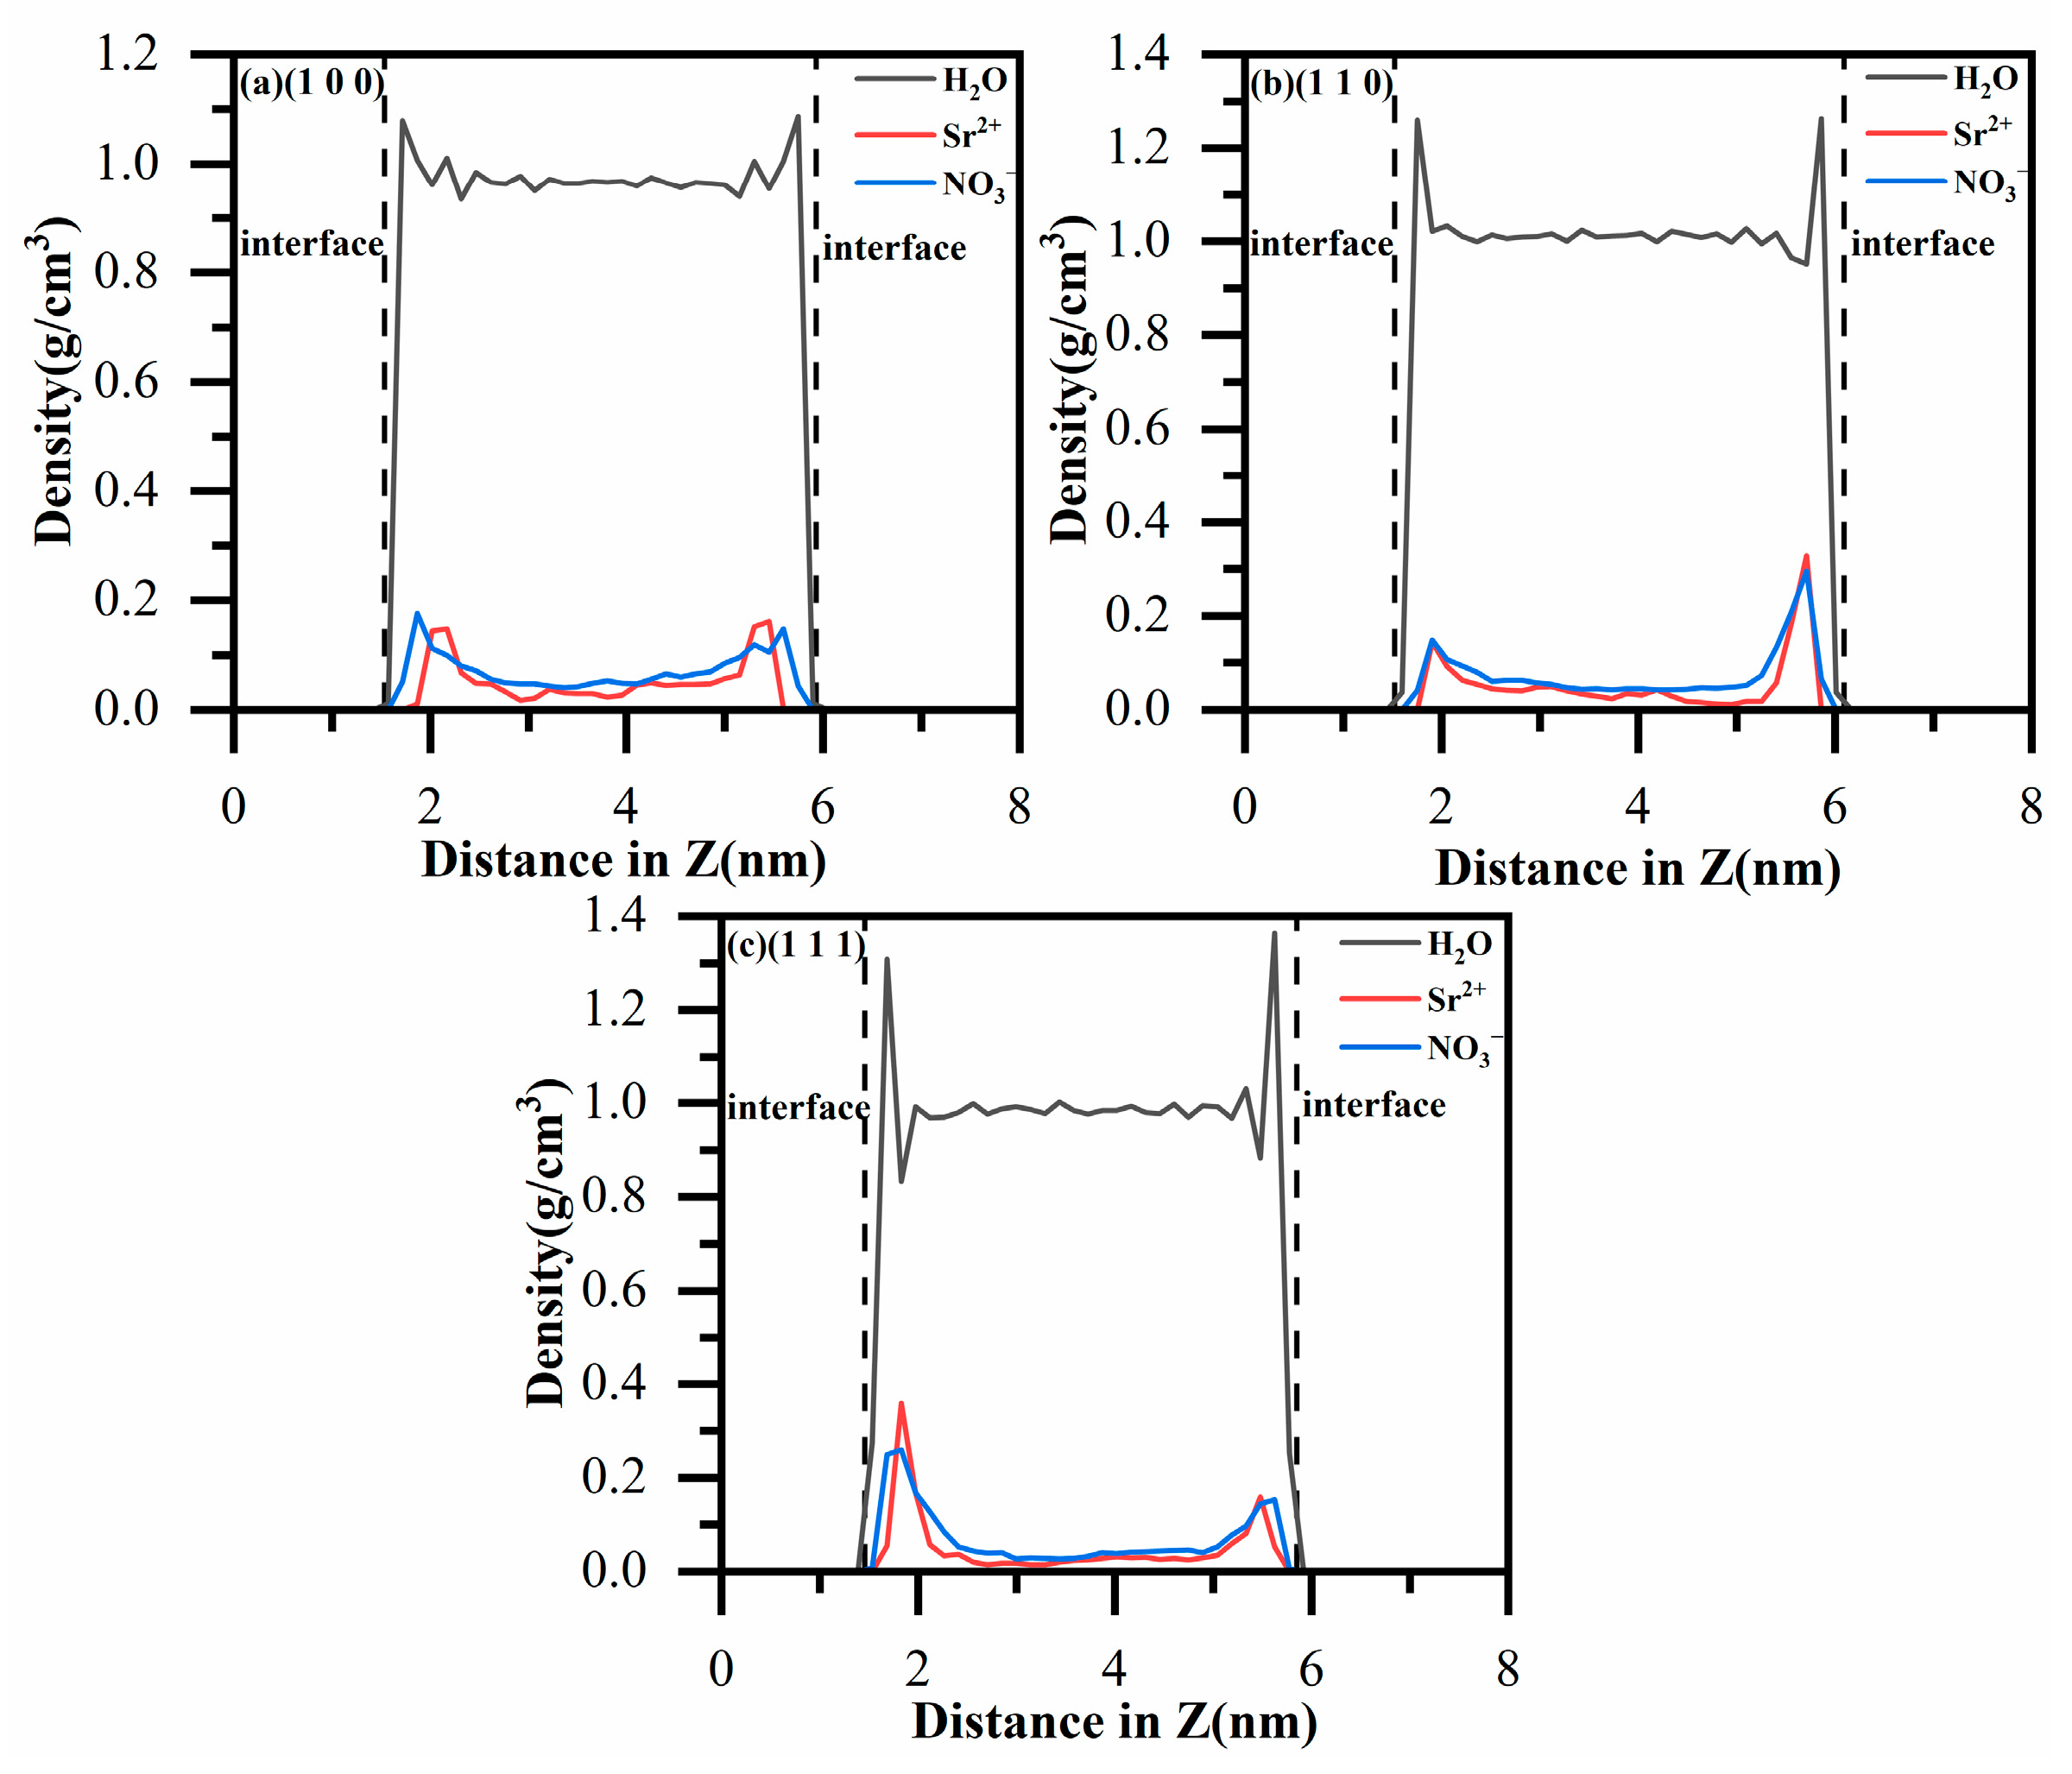
2.3.1. Particle Density Profile (PDP)

The particle density profile (PDP) along the Z-axis of the simulated system was calculated to characterize the spatial distribution of ions and water molecules within different regions along the Z-axis [36]. Subsequent analyses focused on the adsorption and diffusion dynamics of particles near the MnO surface and within the solution. The formula used for the calculation is as follows.
ρ ( z ) = < N ( z Δ z 2 , z + Δ z 2 ) > ( Δ z × S )
Here, S refers to the surface area of the various MnO crystal surfaces, <N(z − Δz/2, z + Δz/2)> represents the number of particles between z − Δz/2 and z + Δz/2, and Δz is each bin width.

2.3.2. Radial Distribution Function (RDF)

The RDF is employed to elucidate the local structure of ions in solution and at the interface [37,38]. The formula used for the calculation is as follows.
R D F A B ( r ) = 1 4 π ρ B r 2 d N A B d r
RDFA-B (r) describes the density of particle B at a specific distance from particle A, denoted as g(r). Here, ρB indicates the density of particle B, while dNA−B represents the mean count of B particles within the interval r to r + d.

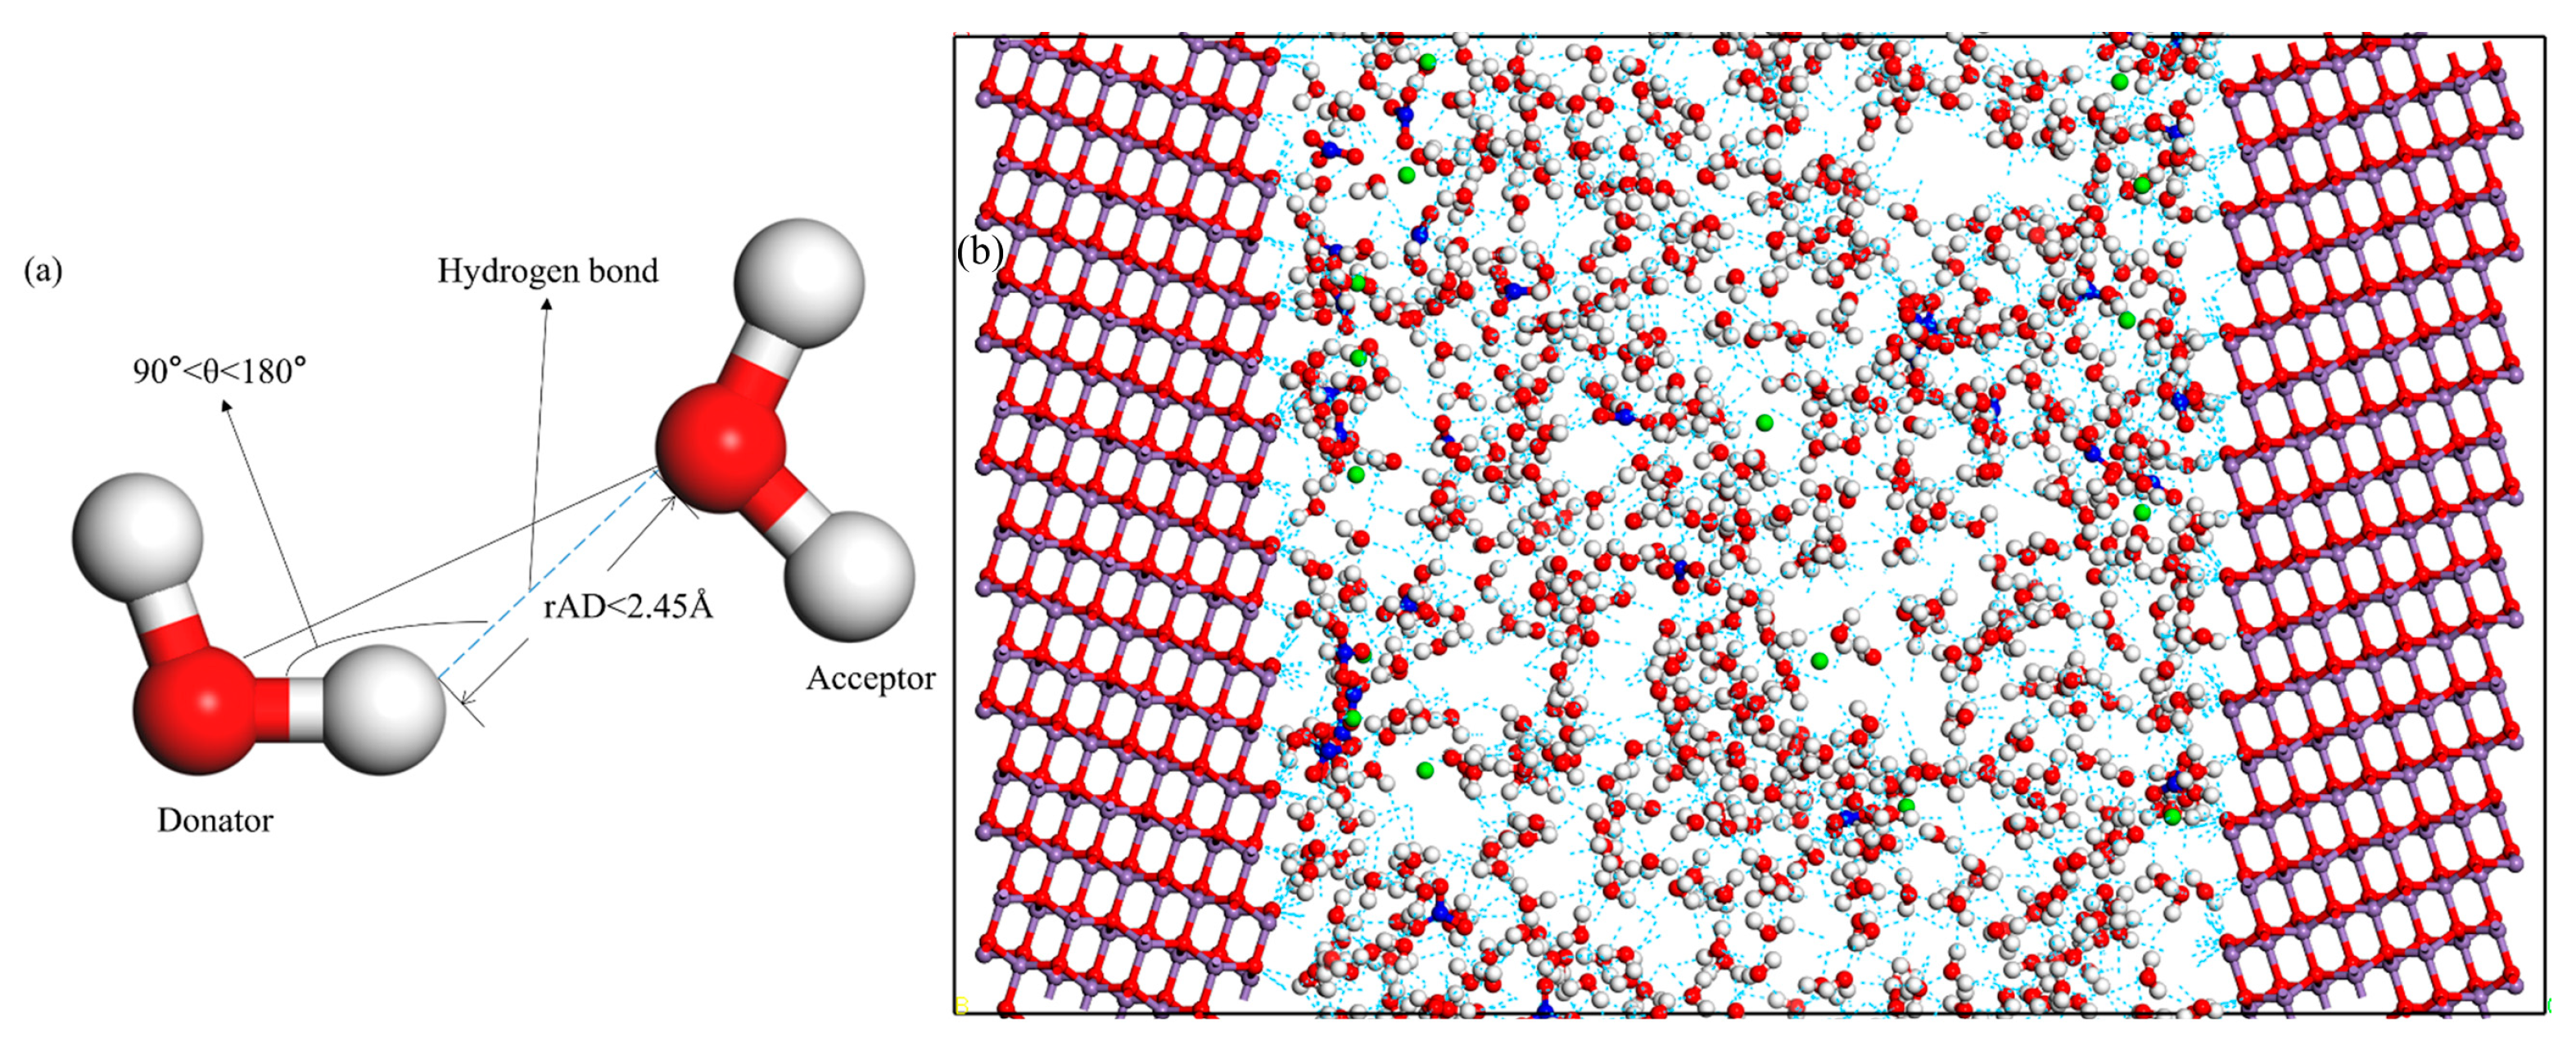
2.3.3. The Network of Hydrogen Bonds

This is instrumental in delineating the local structure of water molecules and elucidating interfacial interactions. To analyze the interactions between the surface and adjacent water molecules, quantifying the number of hydrogen bonds at adsorption equilibrium is essential. As depicted in Figure 2a, the formation of hydrogen bonds requires two criteria: firstly, the distance (rAD) between adjacent hydrogen and oxygen atoms must be less than 2.45 Å; secondly, the angle formed by the Hd-Od vector and the Hd-Oa vector (where Hd is donor hydrogen, Od is donor oxygen, and Oa is acceptor oxygen) must range from 90° to 180° [39].

2.3.4. The Non-Bond Interaction Energy (Eint)

To achieve a comprehensive understanding of the thermodynamics governing the interactions between the MnO crystal surface and the strontium nitrate solution, Eint was computed using the equation below [36,40].
E i n t = E v d w + E e l e c
Evdw and Eelec quantify the van der Waals and electrostatic components of the non-bond interaction energy, respectively.

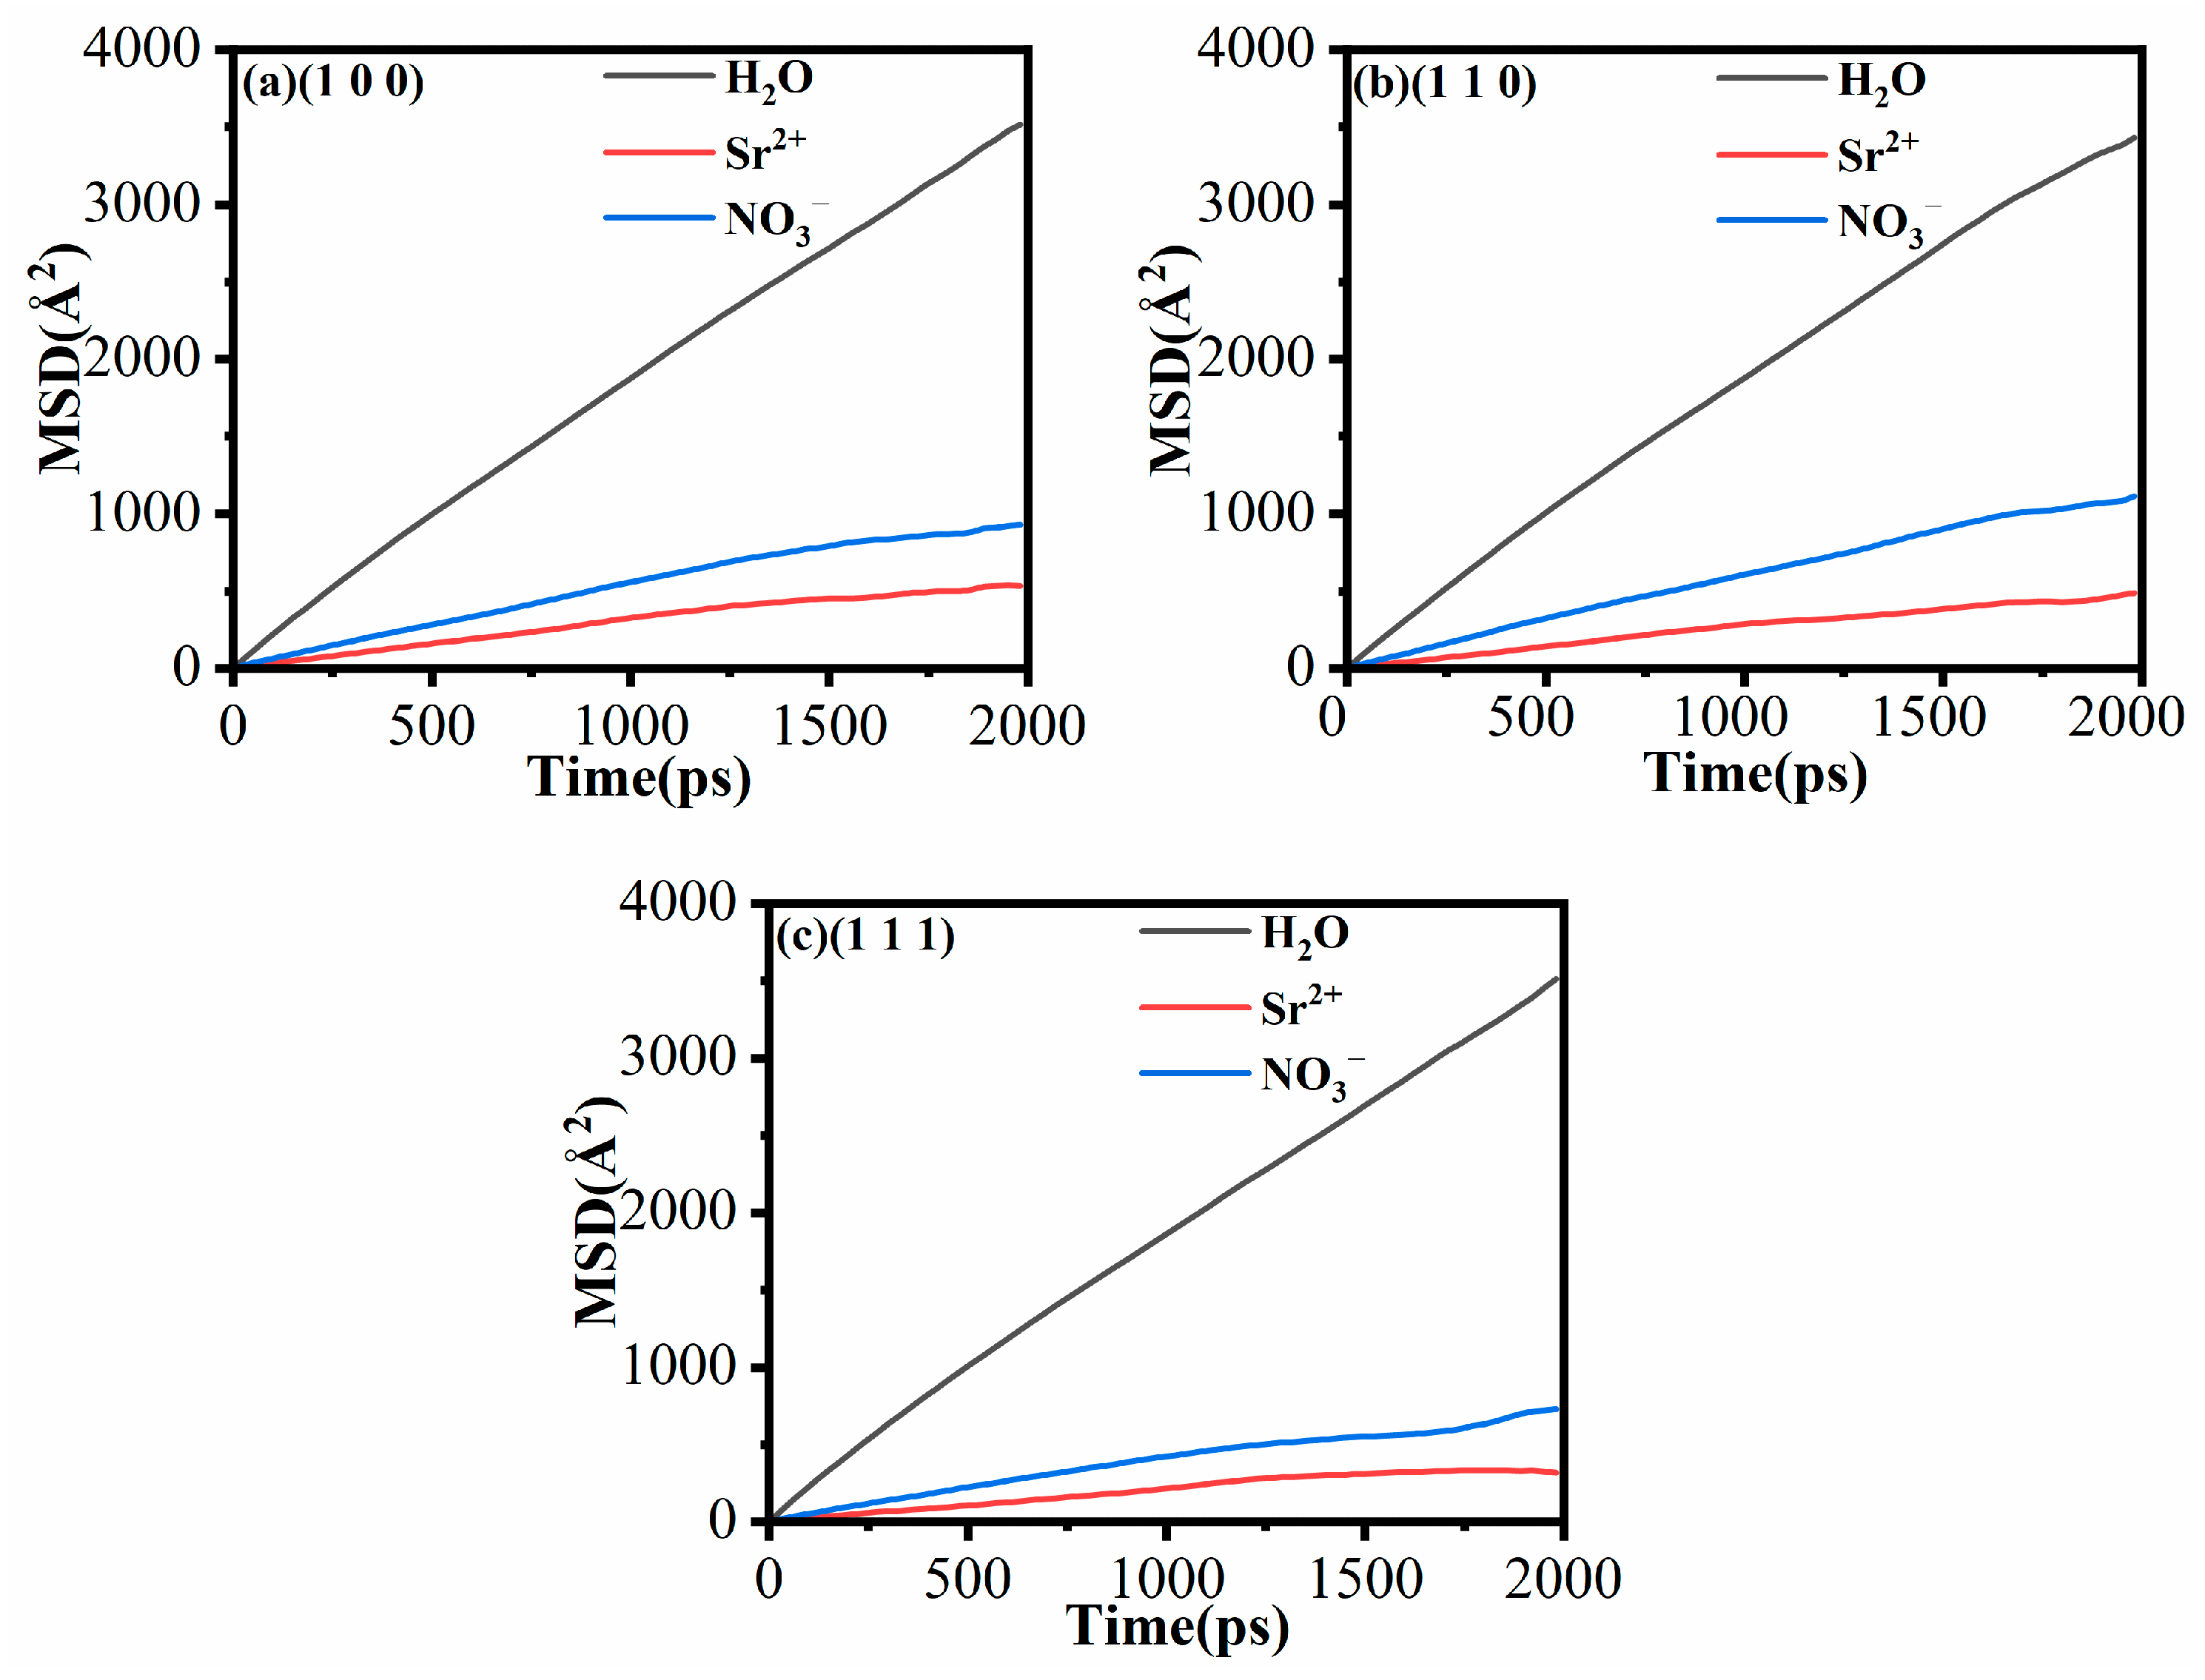
2.3.5. Mean Square Displacement (MSD) and Diffusion Coefficient (D)

The MSD represents the average of squared particle displacements and serves to assess the dynamic behaviors of water molecules and ions, playing a crucial role in the kinetic analysis [41]. The formula used for the calculation is as follows.
M S D ( t ) = 1 n i = 1 n r i t r i ( 0 ) 2
Here, ri(t) and ri(0) denote the position and initial position, respectively, of atom i at time t, with n representing the dimensionality of the computed mean square displacement, specifically n = 3.
Furthermore, the D is determined using Einstein’s diffusion equation [42]. The formula used for the calculation is as follows.
D = 1 6 n lim t d d t i = 1 n r i t r i ( 0 ) 2
Here, t represents the MD simulation time, and the remaining variables adhere to the definitions specified in Equation (4).

3. Results and Discussion

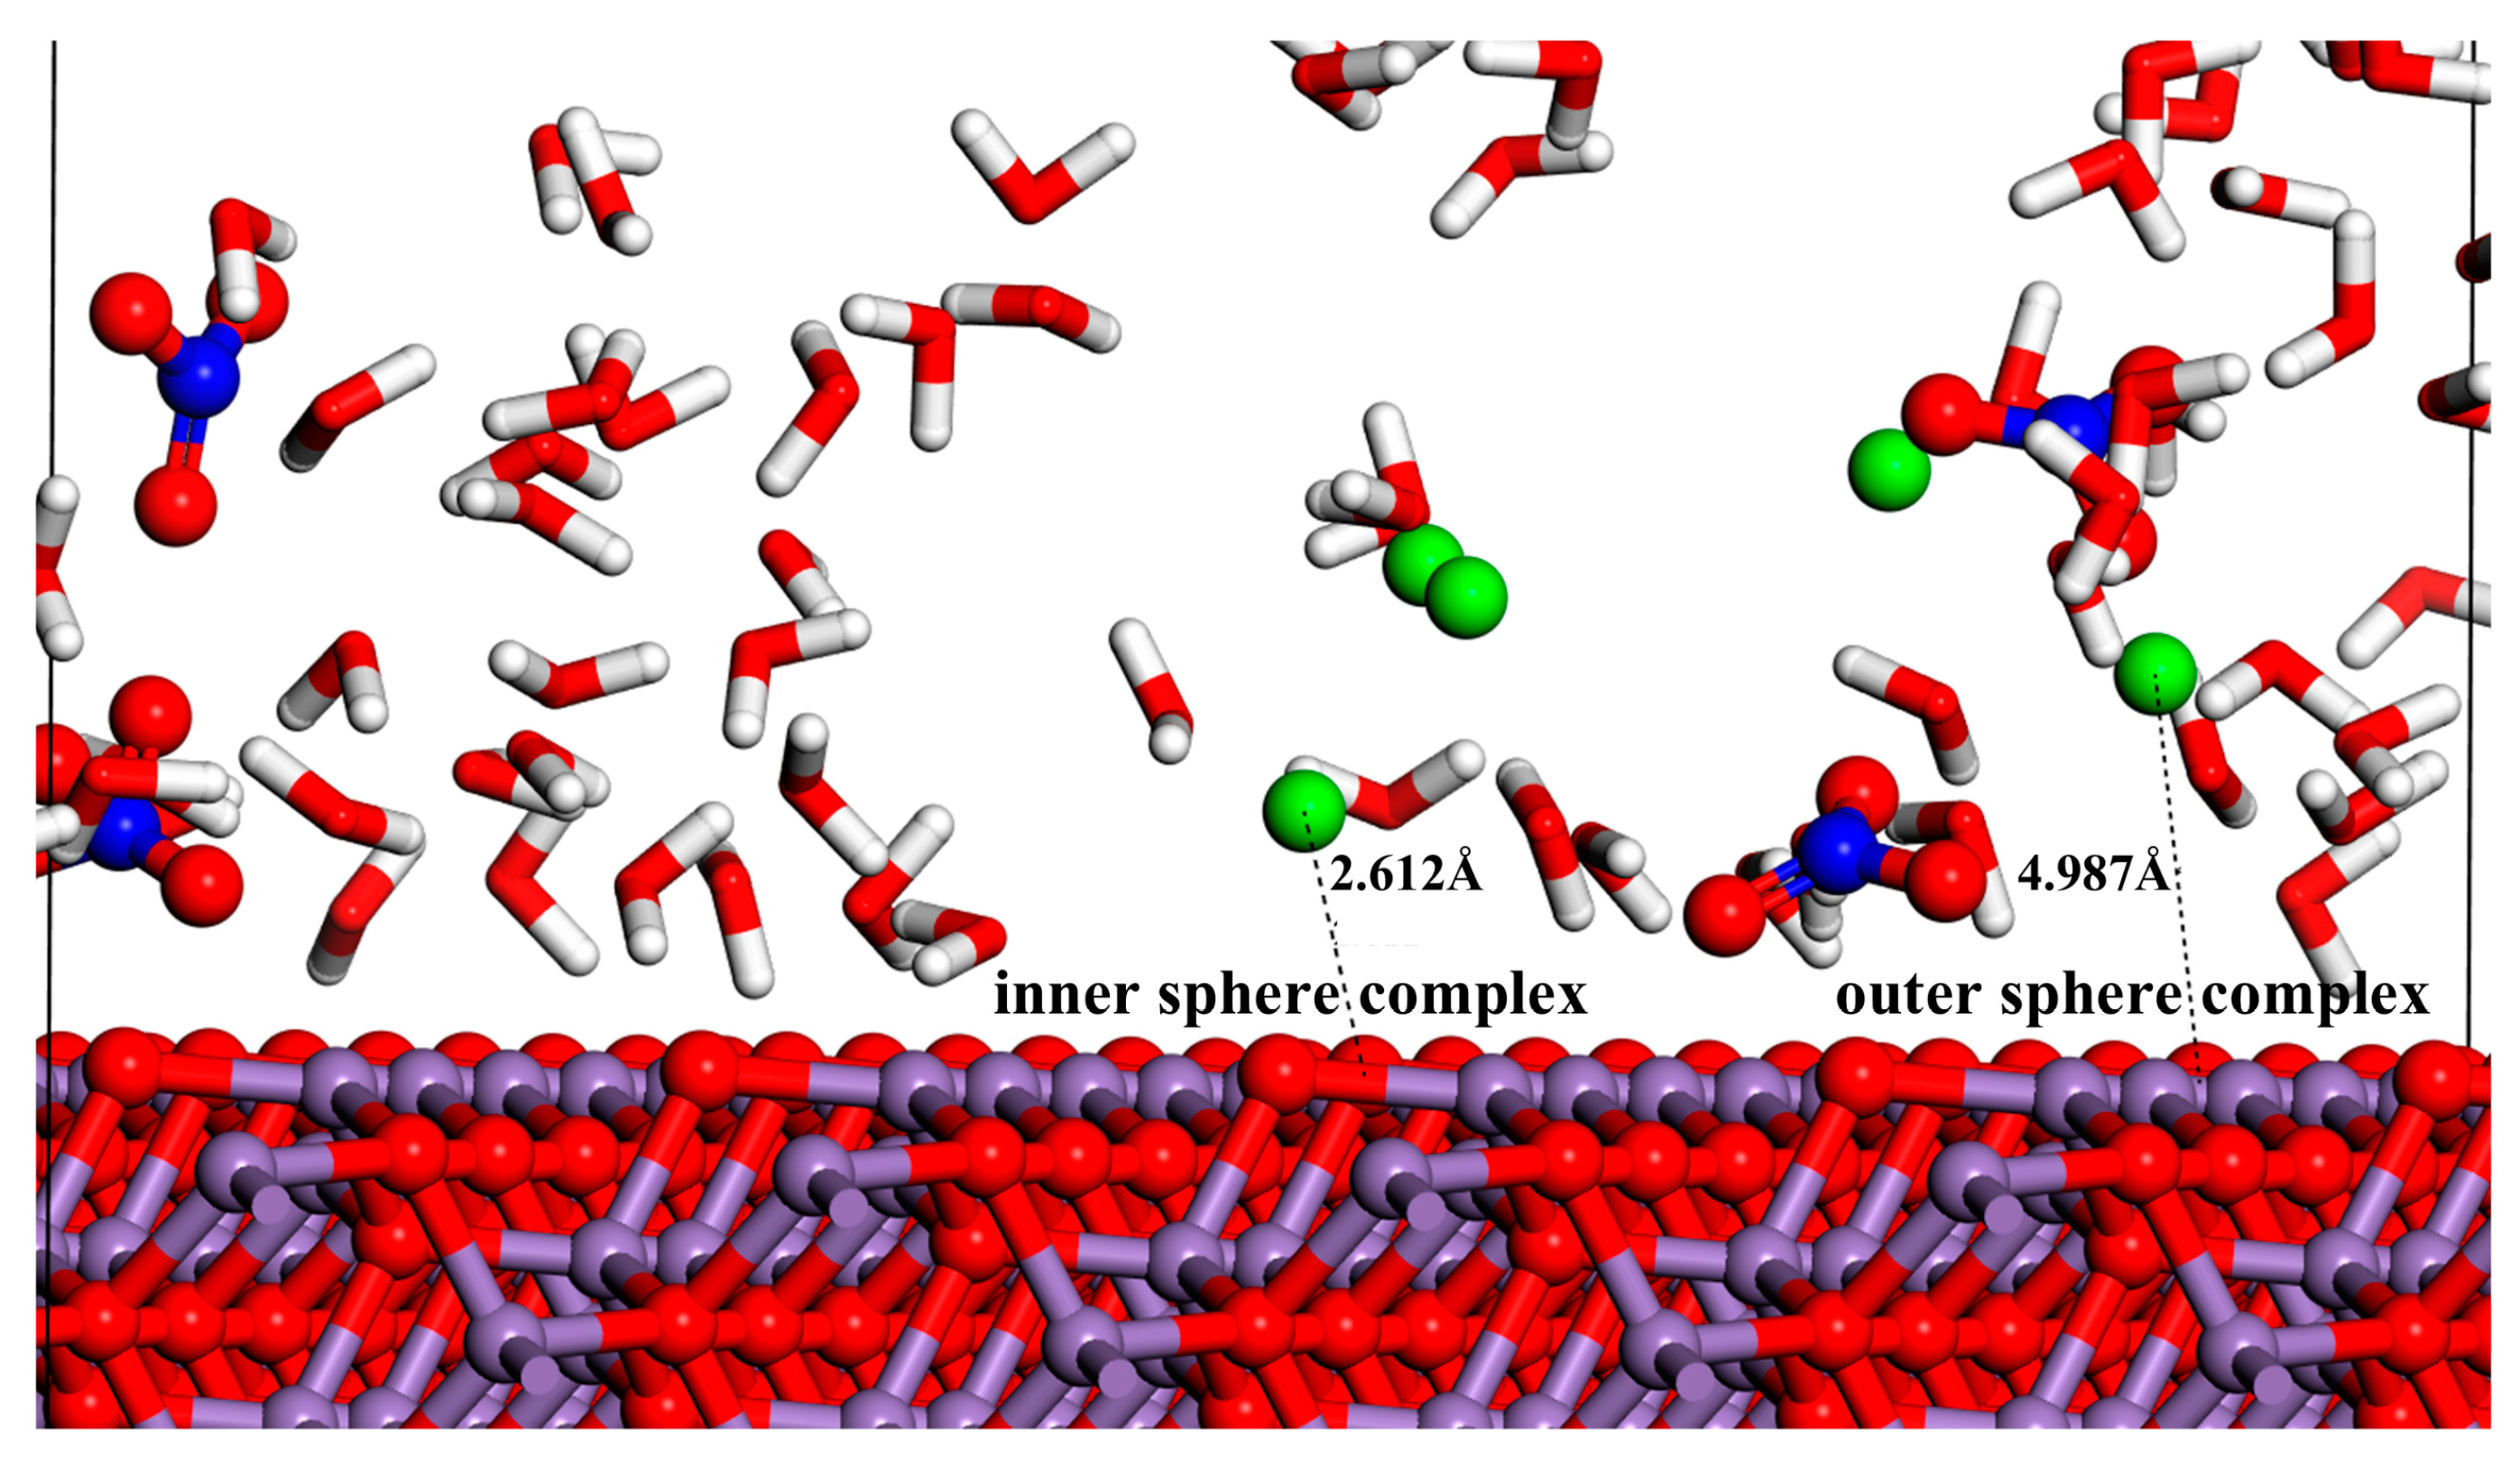
3.1. Density Profiles of Ions and Water Molecules

Figure 3 clearly depicts the unique adsorption characteristics of H2O, Sr2+, and NO3 on the MnO crystal surfaces. For instance, on the (100) MnO crystal surface, the high-density peaks of strontium ions occur at 21.6 Å and 54.5 Å, those of nitrate ions at 18.7 Å and 56.0 Å, and those of water molecules at 17.2 Å and 57.5 Å. Further analysis of the density distributions revealed that the high-density peaks of Sr2+ occurred near those of NO3. However, the NO3 layer is located closer to the MnO crystal surface compared to the Sr2+ layer. Simultaneously, the H2O layer is positioned even closer to the MnO crystal surface than the NO3 layer. This finding suggests that both Sr2+ and NO3 mainly adhere to the MnO surface via outer-sphere (OS) adsorption, with Sr2+ adsorption notably influenced by NO3 interaction. Additionally, Figure 3 demonstrates that the highest density peak for water molecules exceeds 1 g/cm3. These results suggest that the density of H2O near the MnO crystal surface exceeds that of H2O in the solution. The high-density water molecule layer impedes the diffusion of both ions and water molecules. Consequently, this results in enhanced adsorption of Sr2+ and NO3 on the MnO crystal surfaces [43].
Moreover, as depicted in Figure 3, the adsorption of water molecules and ions is markedly influenced by the distinct crystal surfaces of MnO. Upon altering the crystal surface, the density of H2O, Sr2+, and NO3 on the MnO surface generally shows an upward trend. The (100) crystal surface exhibited the highest adsorption capacity for NO3, followed by Sr2+ and H2O, whereas the (110) and (111) crystal surfaces demonstrated the greatest adsorption for Sr2+, followed by NO3 and H2O. Modifications to the MnO crystal surface result in an increase in the number of non-bridging oxygen atoms and the prominence of their spatial positions. Consequently, these changes increase the number of adsorption sites on the MnO crystal surfaces and enhance electronegativity, thereby improving the adsorption of water molecules and ions [44]. Figure 4 further exemplifies this phenomenon.

3.2. Radial Distribution Function (RDF)

As depicted in Figure 5a, the Sr and Ow interaction curve displays two distinct peaks located at approximately 2.6 Å and 4.9 Å, respectively. These peaks correspond to the first and second hydration shells surrounding the central Sr2+. Similarly, Figure 5b illustrates that the N-Ow interaction peaks at 3.4 Å and 5.8 Å are Sr2+ indicative of the hydration structure of NO3. The first hydration shells of Sr-Ow and N-Ow basically align with previous scholarly reports, as shown in Figure 5a,b (Sr-Ow: 2.6–2.7 Å; N-Ow: 3.5 Å) [31,45,46]. It is notable that the distance between the two peaks of Sr-Ow is less than that between the two peaks of N-Ow. The findings demonstrate that the clusters of Sr2+ and H2O are denser than those of NO3 and H2O. Furthermore, as evidenced in Figure 5a,b, the alteration of the MnO crystal surfaces does not markedly affect the radial distribution function (RDF) of Sr-Ow and N-Ow. This suggests that the modification of the MnO crystal surfaces exerts minimal influence on the hydration dynamics of Sr2+ and NO3 within the solution. As shown in Figure 5c, the Sr-N RDF curves on different MnO crystal surfaces exhibit subtle changes, with two prominent peaks: a strong peak at 3.5 Å and weaker peaks at 5.3 Å, 5.2 Å, and 5.1 Å, respectively. The results confirm that changes in the MnO crystal surfaces do not affect the coordination mechanism of Sr2+ and NO3 on these surfaces. In an aqueous solution, Sr2+ typically adopts an octahedral configuration with eight water molecules (Sr2+ (H2O)8) [47], while NO3 can form clusters by partially substituting water molecules, such as Sr2+-(H2O)n-(NO3)8−n [48,49]. The prominent peaks indicate stable bond lengths between Sr2+ and NO3, governed by direct electrostatic forces, while the less pronounced peaks correspond to the Sr-Ow-N bond lengths, which arise from indirect ionic interactions [41]. The prominent peaks of Sr-N bonds on the (111) MnO crystal surface are considerably higher than those on other crystal surfaces. Additionally, the less prominent peak of the Sr-Ow-N bond on the (111) MnO crystal surface is shifted closer to the left side of the transverse axis compared to the peaks on other MnO crystal surfaces. These results suggest that the direct electrostatic and indirect ionic interactions between Sr2+ and NO3 are most pronounced, with the bonding being the tightest and most stable on the (111) MnO crystal surface.
Figure 5a–c demonstrate that the RDFs of Sr-Os, N-Os, and Ow-Os feature pronounced peaks across various crystal surfaces. The MnO crystal surface displays significant adsorption capacities for Sr2+, NO3, and H2O. Transitioning from the (100) to the (110) and (111) crystal surface, the Sr-Os curve shows an upward trajectory, whereas the N-Os and Ow-Os curves first decline before demonstrating an upward trend. These results suggest that the adsorption of hydrated Sr2+ on the MnO crystal surface increases with the number of non-bridging oxygen atoms and their more pronounced localization on the surface. Specifically, as shown in Figure 5d, the strong peak positions of Sr-Os on the (100) crystal surface occur at 4.9 Å and 6.8 Å, with their corresponding g(r) values both smaller than that of Ow-Os. For the (110) crystal surface, as shown in Figure 5e, the strong peak positions of Sr-O and Sr-Os are at 5.0 Å and 6.9 Å, with their corresponding g(r) values both larger than those of Ow-Os. On the (111) crystal surface, as shown in Figure 5f, the strong peak positions of Sr-O and Sr-Os occur at 2.5 Å and 5.0 Å, with their corresponding g(r) values both larger than those of the Ow-Os counterpart. The position of the Sr-Ow hydration shell is typically 2.6 Å [50]. Therefore, Sr2+ exhibits only outer-sphere adsorption behavior on the MnO (100) and (110) crystal surfaces, while both inner-sphere and outer-sphere adsorption behaviors are present on the (111) crystal surface, as illustrated in Figure 5d–f. This conclusion is further corroborated by the data presented in Figure 6. The Sr2+ ions form Sr-Os bonds with non-bridging oxygen atoms on the (111) crystal surface of MnO, as indicated by the coordination numbers in Figure S2 of the Supplementary Materials. Conversely, the adsorption capacity for hydrated NO3 initially diminishes and then subsequently increases. Additionally, the RDF curve shown in Figure 5d reveals that the peak for N-Os on the (100) crystal surface surpasses that for Sr-Os. Unlike the (110) and (111) crystal surfaces, the (100) crystal surface demonstrates a higher adsorption capacity for hydrated NO3 compared to hydrated Sr2+. Even though the (100) crystal surface has fewer non-bridging oxygen atoms compared to other crystal surfaces, these atoms are more isolated and sparsely distributed. Consequently, as shown in Figure 5d,e, this leads to the N-Os peak on the (100) crystal surface being higher than on the (110) crystal surface. Further analysis revealed that changes in the crystal surface significantly influenced the adsorption of Sr2+ on the MnO crystal surface, followed by NO3 and H2O.
In summary, the adsorption mechanisms of Sr2+ and NO3 on MnO crystal surfaces were elucidated. On the one hand, with changes in the MnO crystal surfaces, the number of non-bridging oxygen atoms increases, and their spatial positions become more pronounced, resulting in more adsorption sites and enhanced electronegativity. Consequently, this results in the accumulation and partial desolvation of hydrated Sr2+ ions on the (111) MnO crystal surface, which subsequently attracts NO3 and its hydrated form through electrostatic forces, forming clusters and complexes. Ultimately, this process culminates in the adsorption of NO3 on the MnO crystal surfaces. Conversely, while the electronegativity of the MnO crystal surfaces enhances the repulsive forces between NO3 and these surfaces, it simultaneously increases the adsorption capacity of Sr2+-(H2O)n-(NO3)8−n complexes. The total adsorption of NO3 onto MnO crystal surfaces surpasses the repulsive forces. Therefore, NO3 continues to adsorb near the MnO crystal surfaces. Supporting evidence from other studies supports this conclusion. For example, Wang et al. showed that enhancing the electronegativity of the geopolymer surface improves the ion adsorption capacity [21,51]. Similarly, Xu et al. observed that an increase in the number of exposed adsorption active sites on α-Fe2O3 nanocrystals significantly improved the ion adsorption capacity [52].

3.3. The Network of Hydrogen Bonds

Figure 2a depicts the conditions necessary for hydrogen bond formation. Figure 2b illustrates two distinct categories of hydrogen bonds: those present in solutions, primarily Ow-Ow and N-Ow, and those at the interface, predominantly Ow-Os and N-Os. As demonstrated in Table 2, at the outset of the simulation, the interface initially contained no hydrogen bonds. This indicates that before the onset of adsorption, the interface is devoid of hydrogen bonds. As the MD simulation progresses, ions and water molecules accumulate at the interface, forming a dense solution layer. Upon reaching the adsorption equilibrium at 6000 ps, the number of hydrogen bonds at various interfaces stabilizes at 322, 204, and 241, respectively. This results in an increased number of hydrogen bonds at the interface. Once a stable adsorption state is achieved on the MnO surface, the number of hydrogen bonds at the interface remains relatively constant. Additionally, as illustrated in Table 1 and Figure 4, the number and spatial positioning of non-bridging oxygen atoms on various MnO crystal surfaces influence the number of hydrogen bonds at the interface [44]. Despite fewer non-bridging oxygen atoms on the (100) crystal surface compared to other crystal surfaces, these atoms are more isolated and sparsely distributed on their surface. Relative to other crystal surfaces, the water molecules at the interface of the (100) surface are arranged more orderly, leading to a higher formation of hydrogen bonds [53]. The (111) and (110) crystal surfaces possess an identical number of non-bridging oxygen atoms on their surfaces. However, the non-bridging oxygen atoms on the (111) crystal surface are more pronounced. Consequently, this leads to a greater number of hydrogen bonds at the interface of the (111) crystal surface compared to the (110) surface. Thus, this clarifies the differences in the distribution and number of hydrogen bonds on the MnO crystal surfaces. This can be attributed to variations in the number and spatial arrangement of non-bridging oxygen atoms on the crystal surfaces.

3.4. The Non-Bond Interaction Energy

Table 3 shows that the non-bond interaction energy, including its components—electrostatic and van der Waals energies—are uniformly negative. The adsorption process constitutes a spontaneous exothermic reaction. Additionally, the van der Waals energy is about an order of magnitude lower than the electrostatic energy. Electrostatic attraction serves as the primary driving force in this adsorption process. Given the similarity in the areas of the three crystal surfaces and the significant differences in their adsorption energies, direct comparisons of the non-bond interaction energy data across different surfaces are feasible [54]. For the (100) crystal surface, the absolute non-bond interaction energy value is the highest. This can be attributed to the highest adsorption capacity for water molecules at the interface. This aligns with the data in Figure 4 and Figure 5d, showing that the Ow-Os on the (100) crystal surfaces have the most pronounced radial distribution function (RDF) peaks and the highest number of hydrogen bonds. Considering that the (100) crystal surface has fewer non-bridging oxygen atoms than other surfaces, it follows that its adsorption capacity for Sr2+ is limited. The absolute non-bond interaction energy values for the (111) and (110) crystal surfaces rank second and third, respectively. Notably, the number of non-bridging oxygen atoms on their surfaces is identical and exceeds that on the (100) crystal surfaces, as seen in Table 1. Consequently, their adsorption effectiveness for Sr2+ surpasses that of the (100) crystal surfaces. This corresponds with the findings in Figure 5d–f, which reveal that the RDF curve peaks for Sr-Os on the (111) and (110) crystal surfaces are higher than those on the (100) surface. Concurrently, the spatial positioning of the non-bridging oxygen atoms on the (111) crystal surface is more pronounced compared to that on the (110) crystal surface. Consequently, this leads to more effective adsorption of Sr2+, NO3, and H2O on the (111) crystal surface compared to the (110) surface. This is corroborated by the findings in Figure 5e,f, which show that the RDF curve peaks for Sr-Os, N-Os, and Ow-Os on the (111) crystal surface exceed those on the (110) surface. Additionally, the non-bond interaction energy and network of hydrogen bonds can be used to infer the enthalpy change of MnO adsorption from a strontium nitrate solution at varying temperatures. The enthalpy associated with the interaction between the MnO crystal surface and the strontium nitrate solution decreases as the temperature increases. For further details, refer to the Supplementary Materials.

3.5. Mean Square Displacement (MSD) and Diffusion Coefficient (D)

Figure 7 illustrates the kinetics of Sr2+, NO3, and H2O on different MnO crystal surfaces. As shown in Figure 7a, H2O exhibits the highest diffusion rate on the (100) MnO crystal surface, followed by NO3 and, lastly, Sr2+. This is primarily due to the high adsorption capacity of the MnO crystal surface for Sr2+, which effectively limits the diffusion of Sr2+. As shown in Figure 7b, the diffusion of Sr2+ and H2O decreases further as the transition occurs from the (100) to the (110) crystal surface, while the diffusion of NO3 slightly increases. On the (111) crystal surface, the mobility of both Sr2+ and NO3 decreased significantly. As shown in Figure 7b,c, the mean square displacements (MSDs) of ions and water molecules on the (110) and (111) MnO crystal surfaces indicate that the mobility of H2O significantly exceeds that of Sr2+ and NO3. This phenomenon can be attributed to three primary factors. One factor is the relatively weak interactions between water molecules, primarily governed by hydrogen bonds, which facilitate rapid diffusion in solutions. The second factor involves non-bridging oxygen atoms on the MnO crystal surface, whose electronegativity attracts Sr2+, with diffusion subsequently limited by strong electrostatic forces. The final factor is the formation of dense clusters of hydrated Sr2+ and hydrated NO3, coupled with the complexation of hydrated Sr2+, hydrated NO3, and H2O on the MnO crystal surface [41].
As shown in Table 4, the diffusion coefficients of H2O, Sr2+, and NO3 derived from the MD simulations are consistent with previously reported results [31,51]. Table 4 shows that the diffusivity of H2O, NO3, and Sr2+ decreases sequentially on the same MnO crystal surface. Additionally, Table 1 and Figure 4 show that changes in the crystal surface result in an increase in the number of non-bridging oxygen atoms and a more pronounced spatial localization on the MnO crystal surface. This results in a significant decrease in the diffusion coefficients of Sr2+ and NO3, as shown in Table 4. Therefore, it can be inferred that the increase in the number and prominence of non-bridging oxygen atoms on the MnO crystal surface enhances its adsorption capacity for Sr2+ and NO3. This limitation on the diffusion of ions and water molecules aligns with the enhanced adsorption capacity on the MnO crystal surface.

4. Conclusions

In this study, comprehensive molecular dynamics (MD) simulations were employed to investigate the adsorption behavior and underlying mechanisms of strontium nitrate solution on the crystal surfaces of MnO. First, we observed that Sr2+ exhibits distinct adsorption behaviors and mechanisms on the various crystal surfaces of MnO. Sr2+ can form inner-sphere complexes with non-bridging oxygen atoms on the (111) crystal surface of MnO, whereas on the (100) and (110) crystal surfaces, it forms only outer-sphere complexes. Secondly, this phenomenon arises from the variation in the number and spatial arrangement of non-bridging oxygen atoms across the crystal surfaces of MnO. This variation governs the difference in adsorption sites and electronegativity, which, in turn, influences the adsorption of Sr2+, NO3, and H2O. The (111) crystal surface has the highest concentration and most prominent spatial arrangement of non-bridging oxygen atoms, leading to its strongest adsorption of Sr2+. The (100) crystal surface contains the fewest non-bridging oxygen atoms, resulting in the weakest adsorption of Sr2+. The (110) crystal faces exhibit intermediate properties. Furthermore, the dominant forces responsible for the adsorption of Sr2+, NO3, and H2O on the MnO crystal surfaces differ. Sr2+ and NO3, along with their constituent cluster complexes, are adsorbed primarily through electrostatic interactions, while H2O is adsorbed through hydrogen bonds. Finally, the present study offers valuable insights into the development of high-efficiency manganese oxides for strontium removal, thereby contributing to the safe advancement of nuclear energy.

Supplementary Materials

The following supporting information can be downloaded at: https://www.mdpi.com/article/10.3390/ma18081752/s1, Figure S1: The XRD of MnO (mp-999539); Table S1: MnO crystal structures are available in the Materials Project database; Figure S2: The coordination number (CN) of Sr-Os on various crystal surfaces of MnO; effect of temperature change and enthalpy of the adsorption process.

Author Contributions

Conceptualization, Q.X.; methodology, Q.X., X.Y. (Xingyu Yu), K.G., C.C. and X.Y. (Xixiang Yue); software, Y.L.; validation, Y.L.; formal analysis, X.Y. (Xingyu Yu), K.G., C.C., X.Y. (Xixiang Yue) and J.W.; investigation, Q.X. and X.Y. (Xingyu Yu); resources, K.G., J.W. and Y.L.; data curation, Q.X., X.Y. (Xingyu Yu) and Y.L.; writing—original draft preparation, Q.X.; writing—review and editing, Q.X. and X.Y. (Xingyu Yu); visualization, Q.X. and X.Y. (Xingyu Yu); supervision, J.W.; project administration, J.W.; funding acquisition, K.G. and J.W. All authors have read and agreed to the published version of the manuscript.

Funding

This work was supported by the National Natural Science Foundation of China [grant number 42177074] and Shanghai Urban Construction Design Research Institute (Group) Co., Ltd.

Institutional Review Board Statement

Not applicable.

Informed Consent Statement

Not applicable.

Data Availability Statement

The original contributions presented in this study are included in the article. Further inquiries can be directed to the corresponding author.

Acknowledgments

All authors thank reviewers for their constructive criticism and helpful suggestions.

Conflicts of Interest

Author Kui-Xiang Guo was employed by the company Shanghai Urban Construction Design Research Institute (Group) Co., Ltd. The remaining authors declare that the research was conducted in the absence of any commercial or financial relationships that could be construed as a potential conflict of interest.

References

  1. Li, J.; Jin, J.; Zou, Y.; Sun, H.; Zeng, X.; Huang, X.; Feng, M.; Kanatzidis, M.G. Efficient Removal of Cs+ and Sr2+ Ions by Granulous (Me2NH2)4/3(Me3NH)2/3Sn3S7·1.25H2O/Polyacrylonitrile Composite. ACS Appl. Mater. Interfaces 2021, 13, 13434–13442. [Google Scholar]
  2. Kim, Y.; Jin, K.; Park, I.-H.; Lee, S.; Park, J.; Park, J. Selective Sr2+ capture in an In3+-based anionic metal-organic framework. Chem. Eng. J. 2024, 484, 149321. [Google Scholar]
  3. Guo, Y.-L.; Sun, H.-Y.; Zeng, X.; Lv, T.-T.; Yao, Y.-X.; Zhuang, T.-H.; Feng, M.-L.; Huang, X.-Y. Efficient removal of Sr2+ ions by a one-dimensional potassium phosphatoantimonate. Chem. Eng. J. 2023, 460, 141697. [Google Scholar] [CrossRef]
  4. Lehto, J.; Koivula, R.; Leinonen, H.; Tusa, E.; Harjula, R. Removal of Radionuclides from Fukushima Daiichi Waste Effluents. Sep. Purif. Rev. 2019, 48, 122–142. [Google Scholar]
  5. Li, Q.; Wang, X.; Song, L.; He, L.; Yu, Q.; Xiao, X.; Ding, S. Cyclohexyl substituted diglycolamide ligands for highly efficient separation of strontium: Synthesis, extraction and crystallography studies. J. Environ. Chem. Eng. 2023, 11, 110495. [Google Scholar]
  6. Mousavi, S.E.; Kalal, H.S.; Ghorbanian, S.A.; Khamseh, A.A.G.; Khanchi, A.R. A comparison of various XAD-Amberlite resins impregnated with dicyclohexyl-18-crown-6 for strontium removal. J. Prog. Nucl. Energy 2023, 166, 104965. [Google Scholar]
  7. Liu, B.; Zhu, G.H.; Ma, J.L.; Zhang, L.; Wei, G.J. Equilibrium Fractionation of Stable Strontium Isotopes During Adsorption to Mn Oxides. Geochem. Geophys. Geosyst. 2024, 25, e2024GC011460. [Google Scholar]
  8. Timofeeva, Y.; Karabtsov, A.; Burdukovskii, M.; Vzorova, D. Strontium and vanadium sorption by iron-manganese nodules from natural and remediated Dystric Cambisols. J. Soils Sed. 2024, 24, 1220–1236. [Google Scholar]
  9. Saenko, E. Doping birnessite as a method for synthesizing an ion exchanger selective to strontium and repeatedly working in sorption-desorption cycles. J. Solid State Chem. 2024, 329, 124381. [Google Scholar]
  10. Amesh, P.; Venkatesan, K.A.; Suneesh, A.S.; Maheswari, U. Tuning the ion exchange behavior of cesium and strontium on sodium iron titanate. Sep. Purif. Technol. 2021, 267, 118678. [Google Scholar] [CrossRef]
  11. Asim, U.; Husnain, S.M.; Abbas, N.; Shahzad, F.; Khan, A.R.; Ali, T. Morphology controlled facile synthesis of MnO2 adsorbents for rapid strontium removal. J. Ind. Eng. Chem. 2021, 98, 375–382. [Google Scholar]
  12. Shen, Z.; Yan, G.; Chen, G.; Cao, L.; Tang, X.; Sun, Y.; Liu, J.; Yang, S.; Lin, L.; Zeng, X. Preparation and strontium adsorption behaviors of a new sodium manganese silicate material. Sep. Purif. Technol. 2022, 290, 120824. [Google Scholar]
  13. Zheng, J.; Yang, Y.; Dai, Z.; Wang, J.; Xia, Y.; Li, C. Preparation of manganese dioxide/hollow mesoporous silica spheres (MnO2/HMSS) composites for removal of Sr(II) from aqueous solution. Colloids Surf. A-Physicochem. Eng. Asp. 2023, 666, 131298. [Google Scholar]
  14. Nugroho, B.S.; Wijayanto, H.; Wihadi, M.N.K.; Nakashima, S. Detection of strontium species and Sr(OH)2 NPs formation via double oxidation effect on coal oxide: Preparation and characterization of new coal oxide and its mixture. Inorg. Chem. Commun. 2023, 157, 111377. [Google Scholar]
  15. Song, H.; Jeong, S.; Nam, K. Identification of strontium substitution mechanism in hematite via calcium solution. Chemosphere 2023, 340, 139925. [Google Scholar]
  16. Karasyova, O.N.; Ivanova, L.I.; Lakshtanov, L.Z.; Lövgren, L. Strontium sorption on hematite at elevated temperatures. J. Colloid Interface Sci. 1999, 220, 419–428. [Google Scholar]
  17. Cao, J.; Kong, L.Y.; Guo, T.; Shi, P.; Wang, C.; Tu, Y.M.; Sas, G.; Elfgren, L. Molecular dynamics simulations of ion migration and adsorption on the surfaces of AFm hydrates. Appl. Surf. Sci. 2023, 615, 156390. [Google Scholar]
  18. Qin, D.X.; Xue, Z.Y.; Du, M.; Wang, X.; Xue, Y.; Xu, D.G. Molecular dynamics exploration of ion association mechanism of apatite controlled by a nanogrooved hydroxyapatite surface. Appl. Surf. Sci. 2023, 617, 156580. [Google Scholar]
  19. De Rosa, V.L.D.; Rebaza, A.V.G.; Montes, M.L.; Taylor, M.A.; Alonso, R.E. Sorption of Sr on montmorillonite clays: Theoretical and experimental study. Appl. Surf. Sci. 2022, 592, 153146. [Google Scholar]
  20. Hou, D.S.; Zhang, J.L.; Pan, W.; Zhang, Y.; Zhang, Z.H. Nanoscale mechanism of ions immobilized by the geopolymer: A molecular dynamics study. J. Nucl. Mater. 2020, 528, 151841. [Google Scholar]
  21. Wang, R.; Ye, J.Y.; Wang, J.S.; Peng, X.Y. Adsorption and diffusion mechanism of cesium and chloride ions in channel of geopolymer with different Si/Al ratios: Molecular dynamics simulation. J. Radioanal. Nucl. Chem. 2023, 332, 3597–3607. [Google Scholar] [CrossRef]
  22. Chen, Y.; Wei, M.; Liu, M.; Liu, G.; Li, L.; Yang, Q. Mxene nanosheet membranes for hydrogen isotope separation: An investigation via multi-scale molecular simulations. J. Membr. Sci. 2025, 721, 123814. [Google Scholar]
  23. Qian, L.; Zhang, Y.; Song, W.; Zhang, S.; Zhang, N.; Nica, V. Construction of high-performance glycoprotein molecularly imprinted polymers using boronic acid-containing imidazolium ionic liquid monomer and UiO-66@wood sponge composite carrier. Chem. Eng. J. 2025, 506, 160283. [Google Scholar] [CrossRef]
  24. Kim, H.; Kim, J.; Hyun, S.P.; Kwon, K.D. Toward a mechanistic understanding of cesium adsorption to todorokite: A molecular dynamics simulation study. J. Hazard. Mater. 2022, 436, 129250. [Google Scholar] [PubMed]
  25. Salari, H.; Erami, M.; Dokoohaki, M.H.; Zolghadr, A.R. New insights into adsorption equilibrium of organic pollutant on MnO2 nanorods: Experimental and computational studies. J. Mol. Liq. 2022, 345, 117016. [Google Scholar] [CrossRef]
  26. Guo, Y.; Zhao, Z.; Zhang, J.; Liu, Y.; Hu, B.; Zhang, Y.; Ge, Y.; Lu, H. High-performance zinc-ion battery cathode enabled by deficient manganese monoxide/graphene heterostructures. Electrochim. Acta 2022, 411, 140045. [Google Scholar]
  27. Ilyasov, V.V.; Popova, I.G.; Ershov, I.V. Ab initio study of magnetism and interaction of graphene with the polar MnO(111) surface. Appl. Surf. Sci. 2017, 419, 924–932. [Google Scholar]
  28. Minakshi, M.; Singh, P.; Carter, M.; Prince, K. The Zn-MnO2 battery: The influence of aqueous LiOH and KOH electrolytes on the intercalation mechanism. Electrochem. Solid State Lett. 2008, 11, A145–A149. [Google Scholar]
  29. Jain, A.; Shyue Ping, O.; Hautier, G.; Chen, W.; Richards, W.D.; Dacek, S.; Cholia, S.; Gunter, D.; Skinner, D.; Ceder, G.; et al. Commentary: The Materials Project: A materials genome approach to accelerating materials innovation. APL Mater. 2013, 1, 011002. [Google Scholar] [CrossRef]
  30. Nam, K.M.; Kim, Y.-I.; Jo, Y.; Lee, S.M.; Kim, B.G.; Choi, R.; Choi, S.-I.; Song, H.; Park, J.T. New Crystal Structure: Synthesis and Characterization of Hexagonal Wurtzite MnO. J. Am. Chem. Soc. 2012, 134, 8392–8395. [Google Scholar] [CrossRef]
  31. Tu, Y.; Wang, T.; Wen, R.; Cao, J.; Fang, M.; Wang, C.; Sas, G.; Elfgren, L. Molecular dynamics study on the adsorption of radioactive ions by geopolymers. Adv. Cem. Res. 2023, 36, 129–141. [Google Scholar]
  32. Zhang, K.; Li, H.; Li, Z.; Qi, S.; Cui, S.; Chen, W.; Wang, S. Molecular dynamics and density functional theory simulations of cesium and strontium adsorption on illite/smectite. J. Radioanal. Nucl. Chem. 2022, 331, 2983–2992. [Google Scholar] [CrossRef]
  33. Wang, N.; Pei, C.; Zhong, Y.; Zhang, Y.; Liu, X.; Hou, J.; Yuan, Y.; Zhang, R. Molecular Dynamics Simulation of the Compatibility Between Supercritical Carbon Dioxide and Coating Resins Assisted by Co-Solvents. Materials 2024, 17, 6271. [Google Scholar] [CrossRef]
  34. Li, J.; He, L. Modification and Aging Mechanism of Crumb Rubber Modified Asphalt Based on Molecular Dynamics Simulation. Materials 2025, 18, 197. [Google Scholar] [CrossRef]
  35. Wang, S.; Chen, Y.; Wang, L.; Cui, N.; Li, C.; Sun, S. Study on Water Damage of Asphalt-Aggregate Based on Molecular Dynamics. Materials 2025, 18, 209. [Google Scholar] [CrossRef] [PubMed]
  36. Liu, L.; Zhang, C.; Jiang, W.; Li, X.; Dai, Y.; Jia, H. Understanding the sorption behaviors of heavy metal ions in the interlayer and nanopore of montmorillonite: A molecular dynamics study. J. Hazard. Mater. 2021, 416, 125976. [Google Scholar] [PubMed]
  37. Zhang, W.; Li, J.S.; Chen, S.X.; Huang, K.; Luo, L.J.; Tong, K.W.; Guo, J.H.; Li, S.C.; Zhang, R.; Dai, Z.J. Effect of layer charge density and cation concentration on sorption behaviors of heavy metal ions in the interlayer and nanopore of montmorillonite: A molecular dynamics simulation. Colloids Surf. A-Physicochem. Eng. Asp. 2023, 657, 130553. [Google Scholar]
  38. You, M.; Yin, X.; Sun, Y.; Wu, H.; Li, J.; Zhou, X. Hydrated Calcium Silicate Erosion in Sulfate Environments a Molecular Dynamics Simulation Study. Materials 2024, 17, 6005. [Google Scholar] [CrossRef]
  39. Kumar, R.; Schmidt, J.R.; Skinner, J.L. Hydrogen bonding definitions and dynamics in liquid water. J. Chem. Phys. 2007, 126, 204107. [Google Scholar]
  40. Cao, Z.D.; Wu, Y.D.; Niu, M.S.; Li, Y.; Li, T.; Ren, B.Z. Exploring the solvent effect on risperidone (form I) crystal morphology: A combination of molecular dynamics simulation and experimental study. J. Mol. Liq. 2023, 376, 121358. [Google Scholar]
  41. Hou, D.; Xu, X.; Ge, Y.; Wang, P.; Chen, J.; Zhang, J. Molecular structure, dynamics and adsorption behavior of water molecules and ions on 010 surface of γ-FeOOH: A molecular dynamics approach. Constr. Build. Mater. 2019, 224, 785–795. [Google Scholar]
  42. Blickle, V.; Speck, T.; Lutz, C.; Seifert, U.; Bechinger, C. Einstein relation generalized to nonequilibrium. Phys. Rev. Lett. 2007, 98, 210601. [Google Scholar] [PubMed]
  43. Li, D.; Zhao, W.; Hou, D.; Zhao, T. Molecular dynamics study on the chemical bound, physical adsorbed and ultra-confined water molecules in the nano-pore of calcium silicate hydrate. Constr. Build. Mater. 2017, 151, 563–574. [Google Scholar]
  44. Tu, Y.; Yu, Q.; Wen, R.; Shi, P.; Yuan, L.; Ji, Y.; Sas, G.; Elfgren, L. Molecular dynamics simulation of coupled water and ion adsorption in the nano-pores of a realistic calcium-silicate-hydrate gel. Constr. Build. Mater. 2021, 299, 123961. [Google Scholar]
  45. Ghalami, Z.; Ghoulipour, V.; Khanchi, A. Highly efficient capturing and adsorption of cesium and strontium ions from aqueous solution by porous organic cage: A combined experimental and theoretical study. Appl. Surf. Sci. 2019, 471, 726–732. [Google Scholar]
  46. Yadav, S.; Chandra, A. Transport of hydrated nitrate and nitrite ions through graphene nanopores in aqueous medium. J. Comput. Chem. 2020, 41, 1850–1858. [Google Scholar]
  47. Zhu, F.; Zhou, H.; Fang, C.; Fang, Y.; Zhou, Y.; Liu, H. Ab Initio Investigation of the Microspecies and Energy in Hydrated Strontium Ion Clusters. Mol. Phys. 2018, 116, 273–282. [Google Scholar]
  48. Yadav, S.; Chandra, A. Preferential solvation, ion pairing, and dynamics of concentrated aqueous solutions of divalent metal nitrate salts. J. Chem. Phys. 2017, 147, 244503. [Google Scholar]
  49. Zhu, F.; Zhou, H.; Wang, X.; Zhou, Y.; Liu, H.; Fang, C.; Fang, Y. Raman spectroscopy and ab initio quantum chemical calculations of ion association behavior in calcium nitrate solution. J. Raman Spectrosc. 2018, 49, 852–861. [Google Scholar]
  50. Quezada, G.R.; Toledo, P.G. Complexation of Alkali and Alkaline-Earth Metal Cations at Spodumene-Saltwater Interfaces by Molecular Simulation: Impact on Oleate Adsorption. Minerals 2021, 11, 12. [Google Scholar]
  51. Wang, R.; Zhou, X.; Zhang, W.; Ye, J.; Wang, J. Transport mechanism of uranyl nitrate in nanopore of geopolymer with different Si/Al ratios: Molecular dynamics simulation. J. Solid State Chem. 2024, 331, 124542. [Google Scholar]
  52. Xu, W.-H.; Meng, Q.-Q.; Gao, C.; Wang, J.; Li, Q.-X.; Liu, J.-H.; Huang, X.-J. Investigation of the facet-dependent performance of α-Fe2O3 nanocrystals for heavy metal determination by stripping voltammetry. Chem. Commun. 2014, 50, 5011–5013. [Google Scholar]
  53. Yang, H.; Boucly, A.; Gabathuler, J.P.; Bartels-Rausch, T.; Artiglia, L.; Ammann, M. Ordered Hydrogen Bonding Structure of Water Molecules Adsorbed on Silver Iodide Particles under Subsaturated Conditions. J. Phys. Chem. C 2021, 125, 11628–11635. [Google Scholar]
  54. Liu, Y.; Yu, T.; Lai, W.; Ma, Y.; Kang, Y.; Ge, Z. Adsorption behavior of acetone solvent at the HMX crystal faces: A molecular dynamics study. J. Mol. Graph. Model. 2017, 74, 38–43. [Google Scholar]
Figure 1. Interfacial adsorption model of strontium nitrate solution on the (111) MnO crystal surface. The solution contains 8052 atoms. Color code: white (H), red (O), blue (N), purple (Mn), and green (Sr).
Materials 18 01752 g001
Figure 2. (a) Schematic diagram of hydrogen bond. (b) The network of hydrogen bonds on the MnO crystal surface. Color code: white (H), red (O), blue (N), purple (Mn), and green (Sr).
Materials 18 01752 g002
Figure 3. (a) Density profile of H2O, Sr2+, and NO3 on the (100) crystal surface of MnO; (b) density profile of H2O, Sr2+, and NO3 on the (110) crystal surface of MnO; (c) density profile of H2O, Sr2+, and NO3 on the (111) crystal surface of MnO. (The black dashed lines indicate the Z-axis positions corresponding to the various MnO crystal surfaces).
Materials 18 01752 g003
Figure 4. Snapshots of the interfaces within a 5 Å range on the crystal surfaces of (a) MnO (100) at 6000 ps, (b) MnO (110) at 6000 ps, and (c) MnO (111) at 6000 ps. Color coding: white (H), red (O), blue (N), purple (Mn), and green (Sr).
Materials 18 01752 g004
Figure 5. (a) Radial Distribution Function (RDF) of Sr-Ow on MnO crystal surfaces (100), (110), and (111); (b) RDF of N-Ow on MnO crystal surfaces (100), (110), and (111); (c) RDF of Sr-N on MnO crystal surfaces (100), (110), and (111); (d) RDFs of Sr-Os, N-Os, and Ow-Os on the MnO (100) crystal surface; (e) RDFs of Sr-Os, N-Os, and Ow-Os on the MnO (110) crystal surface; and (f) RDFs of Sr-Os, N-Os, and Ow-Os on the MnO (111) crystal surface. In all cases, Sr denotes Sr2+, N represents nitrogen atoms in NO3, Ow refers to oxygen atoms in H2O, and Os refers to non-bridging oxygen atoms on the MnO crystal surface.
Materials 18 01752 g005
Figure 6. Snapshots of Sr2+ inner-sphere (IS) adsorption and outer-sphere (OS) adsorption at the MnO (111) crystal surface at 6000 ps. Color code: white (H), red (O), blue (N), purple (Mn), and green (Sr).
Materials 18 01752 g006
Figure 7. (a) Mean square displacement (MSD) of H2O, Sr2+, and NO3 on the (100) MnO crystal surface; (b) MSD of H2O, Sr2+, and NO3 on the (110) MnO crystal surface; (c) MSD of H2O, Sr2+, and NO3 on the (111) MnO crystal surface.
Materials 18 01752 g007
Table 1. Details of the particulate systems studied in this work *.
Modela/Åb/Åc/Åα/(deg)β/(deg)γ/(deg) N M n O N H 2 O N S r 2 + N N O 3 N S N B O
(100)44.4642.7874.6590.0090.0090.00208026002856208
(110)42.7841.4776.1190.0090.0090.00201626002856224
(111)44.9141.4773.0690.0090.0090.00190426002856224
* Footnote to table: N represents the number of particles. NS-NBO represents the number of non-bridging oxygen atoms on the MnO crystal surface.
Table 2. The number of hydrogen bonds formed by strontium nitrate solution on MnO crystal surfaces.
Interface(100)(110)(111)
The number of hydrogen bonds (0 ps)000
The number of hydrogen bonds (6000 ps)322204241
Table 3. The non-bond interaction energies between strontium nitrate solutions and different MnO crystal surfaces.
MnO(100)(110)(111)
Eint (kcal/mol)−4257.04−2474.91−3181.38
Eelec (kcal/mol)−4112.27−1729.95−2521.50
Evdw (kcal/mol)−144.77−744.96−659.88
Table 4. Diffusion coefficients (Ds) of H2O, Sr2+, and NO3 on different MnO crystal surfaces: (100), (110), and (111).
MnO(100)(110)(111)
H2O (1 × 10⁻⁵ cm2/s)2.772.702.78
Sr2+ (1 × 10⁻⁵ cm2/s)0.340.330.18
NO3 (1 × 10⁻⁵ cm2/s)0.610.880.46
Disclaimer/Publisher’s Note: The statements, opinions and data contained in all publications are solely those of the individual author(s) and contributor(s) and not of MDPI and/or the editor(s). MDPI and/or the editor(s) disclaim responsibility for any injury to people or property resulting from any ideas, methods, instructions or products referred to in the content.

