Article

Effect of CdO on the Structural and Spectroscopic Properties of Germanium–Tellurite Glass

by
Iveth Viridiana García Amaya
1,*,
David Alejandro Rodríguez Carvajal
1,2,
Josefina Alvarado-Rivera
3,
R. Lozada-Morales
4,
Paula Cristina Santos-Munguía
1,
Juan José Palafox Reyes
5,
Pedro Hernández-Abril
6,
Gloria Alicia Limón Reynosa
7 and
Ma. Elena Zayas
2,*
1
Ingeniería en Geociencias, Unidad Hermosillo, Universidad Estatal de Sonora, Hermosillo 83100, SON, Mexico
2
Departamento de Investigación en Física, Universidad de Sonora, Hermosillo 83000, SON, Mexico
3
SECIHTI—CINVESTAV-Querétaro, Libramiento Norponiente 2000, Fracc. Real de Juriquilla, Querétaro 76230, QRO, Mexico
4
Posgrado en Física Aplicada, Facultad de Ciencias Físico Matemáticas, Benemérita Universidad Autónoma de Puebla, Calle 14 Sur y Av. San Claudio, Col. Jardines de San Manuel, Puebla 72570, PUE, Mexico
5
Departamento de Geología, Universidad de Sonora, Hermosillo 83000, SON, Mexico
6
Ingeniería Biomédica, Unidad Hermosillo, Universidad Estatal de Sonora, Hermosillo 83100, SON, Mexico
7
Departamento de Ciencias Químico-Bilógicas y Agropecuarias, Universidad de Sonora, Navojoa 85880, SON, Mexico
*
Authors to whom correspondence should be addressed.
Materials 2025, 18(8), 1739; https://doi.org/10.3390/ma18081739
Submission received: 14 March 2025 / Revised: 6 April 2025 / Accepted: 7 April 2025 / Published: 10 April 2025

Abstract

:
New glasses in the xCdO-(90 − x)TeO2-10GeO2 system were obtained by the conventional melt-quenching process at 900 °C. The glasses were transparent to the naked eye. The diffraction patterns indicate that the samples were mostly amorphous, except for the CdO-rich glasses, in which the formation of nanocrystals of CdO and Cd3TeO6 were identified. Raman spectroscopy analysis of the samples displayed the existence of TeO3, TeO3+1, TeO4, and GeO4, structural units within the glass matrix. The optical band gap of the glass samples was determined by optical absorption spectroscopy using the Tauc method. Depending on the relative content of TeO2, their values varied in the range of 2.32–2.86 eV. The refractive index was obtained from the band gap values. The XPS measurements showed that Ge 3d, O 1s and Te 3d3/2, Te 3d5/2, Cd 3d5/2, and Cd 3d3/2 doublets shifted to higher binding energy values as the amount of TeO2 was increased. The binding energy values of the Te 3d doublet are related to the TeO4 and TeO3 groups.

1. Introduction

Research on glass matrices containing germanate and tellurate has received special attention in the past because it has been found that this type of glass, when hosting rare earth ions, has applications in the mid-infrared. This is because the reduction of the phonon of the host glass is a condition for achieving high-efficiency mid-infrared luminescence. It is here that these glasses present interesting applications in lasers, which are useful in surgery, atmospheric pollution control, military uses, and remote sensing, among other applications [1].
On the other hand, tellurite glasses in the field of optics are of great interest because are materials for applications in optical waveguides, Raman amplifiers, and third-order harmonic generation [2,3,4]. Moreover, they have become relevant materials for several applications, such as IR technologies and laser devices [5,6]. This is because of their properties which include low maximum phonon energy (~750 cm−1), high refractive index (~2), good chemical stability, low melting temperature, T g (~350 °C), and high dielectric constant. Tellurium oxide-based glasses are known to be transparent in both visible and near IR (NIR) electromagnetic spectrum regions and to be non-hygroscopic materials [7,8,9]. The basic structural units of the tellurite glasses are trigonal bipyramidal (TeO4) and trigonal pyramidal (TeO3) units. When a modifier oxide is added into the TeO2 glass, it breaks the Te–O–Te linkages and forms trigonal (TeO3) units [10,11,12,13].
Moreover, GeO2 is known to be a glass former and a semiconductor material of interest [1]. Glasses based on GeO2 have been widely used in the fabrication of optical fibers and NIR devices because of their high refractive index and high transparency in the NIR region [14]. In addition, germanium dioxide-containing glasses are characterized by their high resistance to intense ionizing radiation and ability to absorb X-rays. These glasses have chemical durability and good thermal stability since germanium (Ge4+) and oxygen (O2−) ions have a strong interionic strength between them [13]. A special feature of glasses containing GeO2 and alkali metals is the germanate anomaly, and this is well known when a proportion of alkali metal (10–17.5 wt%) is introduced, and this is related to the structure of the glass. Researchers believe that saturating the interstices with alkaline ions leads to the transformation of the GeO4 groups into GeO6 groups with octahedral structures.
On the other hand, it is known that cadmium oxide (CdO) acts as a network modifier. Unlike conventional alkali or alkaline-earth oxide modifiers, cadmium oxide is thermally stable and notably covalent in character. Thus, it is expected to shorten the solidification time of glasses during the quenching process [5,13]. Depending on the concentration of CdO, the Cd2+ ions are probable to occupy network modifier (CdO6) positions, adding together to network forming locations with CdO4 structural units. Cadmium oxide is a chemical compound that has semiconductor and piezoelectric characteristics. Compared to other semiconductors, CdO has a gap energy of about 4.1 (eV) and higher exciton binding energy (75 meV) [15,16]. Exciton recombination of CdO nanoparticles leads to UV emissions of about 415 nm [17]. Many researchers are interested in this characteristic of the CdO used in LEDs with short wavelengths [18]. Due to the sharp exciton transition of CdO, it can be used in semiconductor lasers and as transparent electrodes of solar cells [19]. On the other, compared with nanoparticles of another toxic semiconductor, CdO nanoparticles are of the lowest toxicity [20]. Therefore, this chemical is an appropriate option for bioapplications due to its good optical characteristics, such as its fluorescence, high-resolution second-harmonic generation, and two photons’ emissions.
Previous studies of the CdO-TeO2-GeO2 system [21,22,23,24] revealed that the high content of CdO causes the formation of inverted glasses. It was also detected [21,22,23] that Cd2+ cations can coordinate in either tetrahedral or octahedral units; thus, it is possible that its role as a modifier can change to that of an intermediate. X-ray diffraction analysis of this ternary system showed that a sample with overall composition 30CdO·20TeO2·50GeO2 contained CdTe and AlGex nanocrystals with sizes of 59.15 nm and 28.52 nm, respectively [22]. Another study showed that glasses in the CdO-TeO2-GeO2 system were optically activated by Eu3+, Dy3+ and Dy3+/Eu3+. This vitreous system might be useful as a host for rare-earth ions, such as phosphors for UV-based white LEDs [24].
Moreover, GeO2 is known to be a glass former and a semiconductor material of interest [5]. Glasses based on GeO2 have been widely used in the fabrication of optical fibers and NIR devices because of their high refractive index and high transparency in the NIR region [14]. For the above, studies indicated that the CdO-TeO2-GeO2 system may offer the opportunity to fabricate new glasses with a variety of potential technological applications. Furthermore, the goal of this investigation was twofold: first, to produce a series of CdO-TeO2-GeO2 glasses with high content of TeO2 (40–80 wt%); and second, to test the effect of the amount of CdO in the formulation (10–50 wt%) on the spectroscopic properties of the glasses thus obtained.

2. Materials and Methods

The raw materials used in the present study consisted of 99.99% purity of CdO, TeO2 and GeO2 provided by Sigma Aldrich (St. Louis, MO, USA). The resulting blends may be represented by the empirical formula: xCdO-(90 − x)TeO2-10GeO2, where x indicates the content of CdO in the blend in weight percent. It is noted that the amount of GeO2 was set to 10% in all the blends. Five blends were prepared as shown in Figure 1, which corresponded to C10T80, C20T70, C30T60, C40T50, and C50T40. In a typical experiment, the raw materials were first mixed in a high-alumina crucible and further melted at 900 °C for 1 h in a Thermolyne furnace model 46100 (Dubuque, IA, USA). The vitrification process was further conducted by rapid cooling in a stainless-steel mold. To improve the mechanical properties, the samples were kept at 300 °C for 2 h in a stainless-steel mold. Subsequently, the oven was turned off and the samples were allowed to cool down inside the oven by natural convection.
Prior to the spectroscopic analysis, each sample was crushed and ground until the particle size was about 30 µm. Next, X-ray diffraction (XRD) analyses of the samples were conducted in a Bruker Advanced D-8 diffractometer (Madison, WI, USA), using the Cu Kα line. Raman spectra were obtained in a LabRam HR Jobin-Yvon-Horiba spectrometer (Piscataway, NJ, USA) using the He-Ne (632.8 nm) laser line. Optical absorption (OA) spectra were measured in a Varian (Agilent, Santa Clara, CA, USA) spectrometer, model CARY 5000. The optical band gap was calculated assuming an indirect band gap by using the Tauc method, since these materials are amorphous [25]. XPS spectra were obtained in a PHI 5100 spectrometer (Perkin-Elmer, Waltham, MA, USA) with a Mg X-ray Kα radiation of 1253.6 keV, with a pass energy of 20 eV for high-resolution spectra of C 1s, O 1s, Ge 3d, Cd 3d, and Te 3d core levels, using as reference the C 1s peak at 284.8 eV.

3. Results and Discussion

3.1. X-Ray Diffraction Analysis

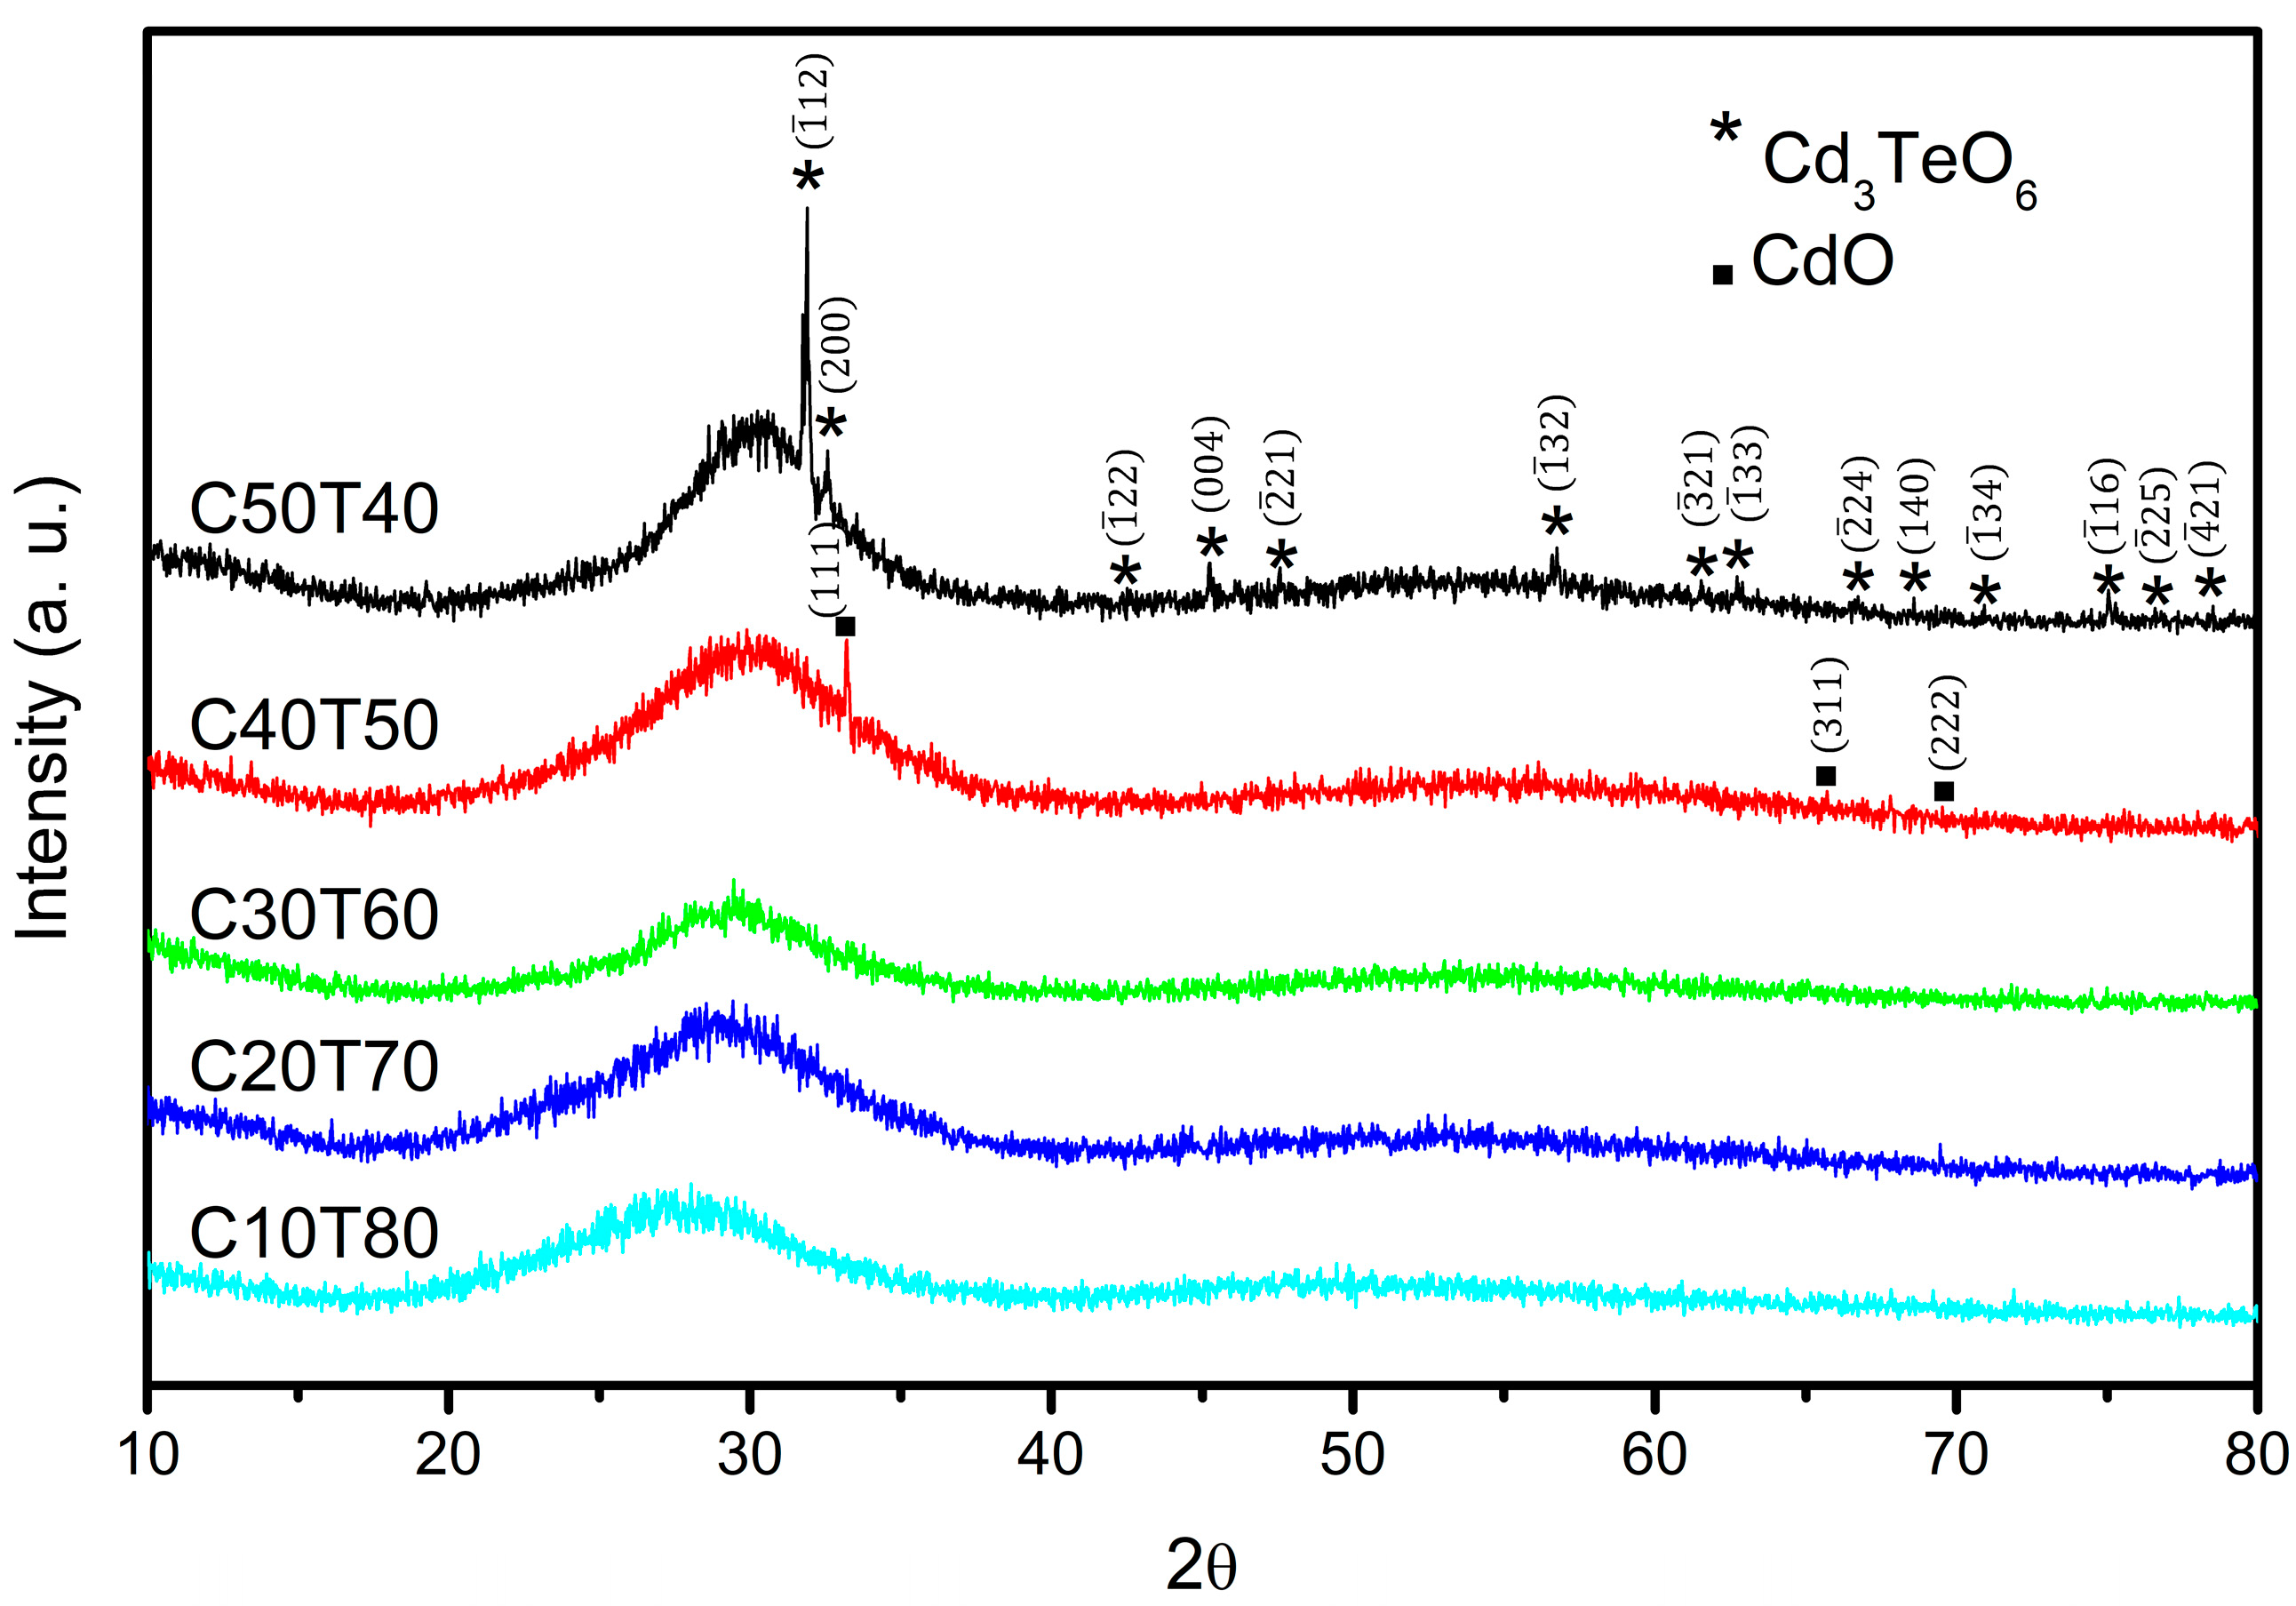
Under visual inspection, the glasses obtained in this work showed a homogeneous appearance. The samples changed from colorless to clear green, green, and brown-orange as the amount of CdO was varied. X-ray diffraction patterns of the samples are shown in Figure 2. All glasses showed a broad diffraction band, in which the maximum as a function of 2θ shifted from 30° to 28° as the amount of TeO2 was increased. The broad band indicates a disordered structure of large range. However, the increase in the concentration of modifier oxides such as CdO in the TeO2 network causes a change in the coordination of tellurium, from TeO4 (tbp) to TeO3 (tp) [26]. This transformation may be associated with an increase in non-bridging oxygens (NBOs) and the development of crystalline phases.
Sample C50T40 exhibited diffraction peaks corresponding to nanocrystals of the Cd3TeO6 phase, with lattice parameters a = 5.4986 Å, b = 5.6386 Å, and c = 8.0191 Å. The diffraction peaks at 2θ values of 31.89°, 32.56°, 42.50°, 45.25°, 47.57°, 56.76°, 61.50°, 62.71°, 66.62°, 68.50°, 70.92°, 75.09°, 76.58°, and 78.48° are associated with the monoclinic structure (JCPDS 76-1007 [27]). Sample C40T50 showed peaks corresponding to nanocrystals of the CdO phase, with a lattice parameter of a = 4.69485 Å. The diffraction peaks at 33.18°, 65.69°, and 69.53° confirm its cubic structure (JCPDS 75-0591 [28]). The crystal sizes calculated by means of the Scherrer’s equation were found to be 84 and 93 nm for Cd3TeO6 and CdO phases, respectively.

3.2. Raman Spectroscopy

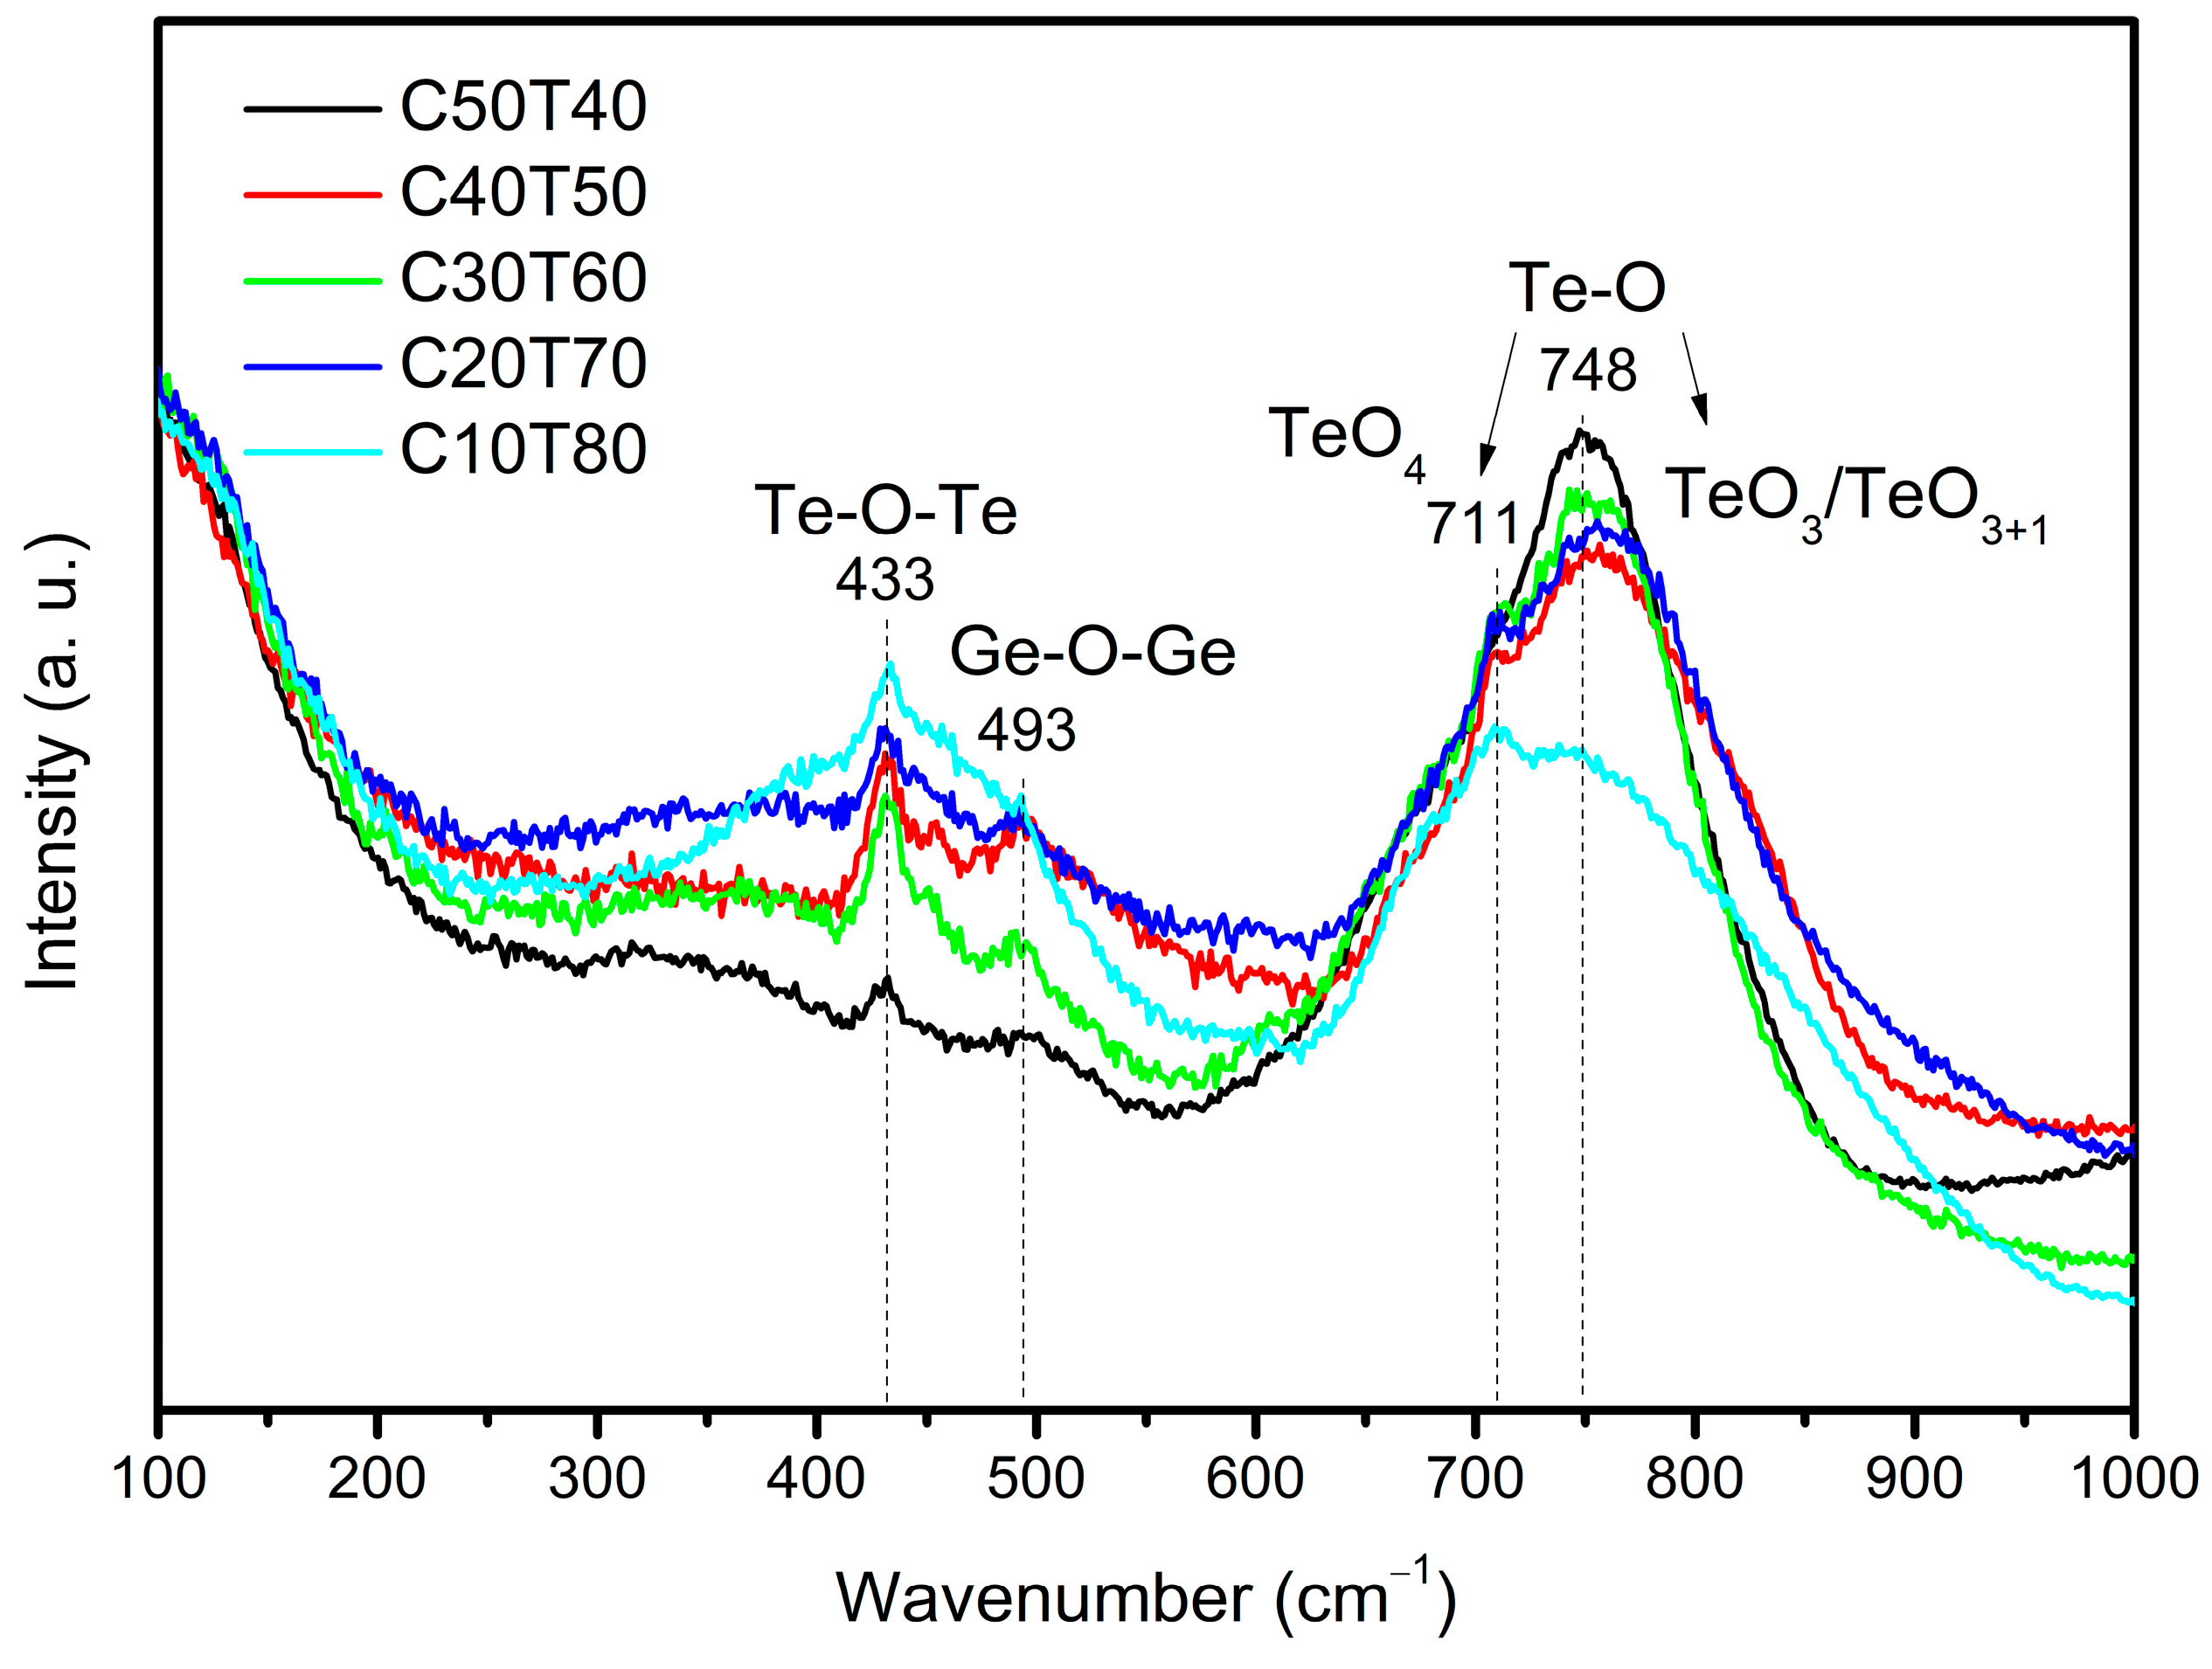
The evolution of the glass structure with the addition of the modifier can be inferred from the Raman analysis results shown in Figure 3. In general, the spectra can be grouped into two regions: the low-frequency region (237–570 cm−1) and the high-frequency region (600–1000 cm−1). In the low-frequency region, two predominant bands centered at 433 and 493 cm−1 marked with dashed line are observed. The band located at 433 cm−1 corresponds to the symmetrical stretching or bending vibrations of Te-O-Te linkages at corner-sharing sites. This mode is due to the networking of the glass structure. Because the intensity of this band gradually decreased as the amount of CdO was increased, this indicates the loss of connectivity upon the addition of the glass modifier. The band at 493 cm−1 can be related to the vibration of Ge(IV)-O-Ge(IV) bridges in three-membered rings formed from tetrahedra [GeO4] [5,29,30]. This band increases in intensity without a linear relationship with the TeO2 content; however, the band disappears for the sample with a higher TeO2 concentration because for this sample, the Te-O-Te bonds predominate, as can be seen in the Figure 3.
In the high-frequency region, the intensity of the main band was found to be of similar magnitude in samples C50T40, C30T60, C40T50, and C20T70. However, it was substantially lower in sample C10T80. The band at 711 cm−1 appears as a small peak over a broad band located at 748 cm−1. At this position, asymmetric stretching vibrations of Te-O- bonds in the TeO4 bipyramidal structural units occur [31]. The band at 748 cm−1 is the most intense band in all samples. This band is attributed to the stretching modes of Te-O- and Te=O bonds, which contain non-bridging oxygen (NBO) from TeO3 tp and TeO3+1 polyhedra [5,32]. This band is typically undetected in pure TeO2. The addition of glass modifiers results in the cleavage of the Te-O-Te linkage of initially completely polymerized structure and transforms TeO4 units into TeO3+1 polyhedra having one NBO atom or TeO3 tp with more NBO atoms [13].
Thus, the observed shift indicates a structure evolution from a rich TeO2 phase to CdxTeyOz compounds that contain TeO3 structures [33,34]. The consumption of the TeO2 phase and the formation of Cd+2-(TeO3)n phases is also observed in their respective XRD patterns.

3.3. Raman Deconvolution

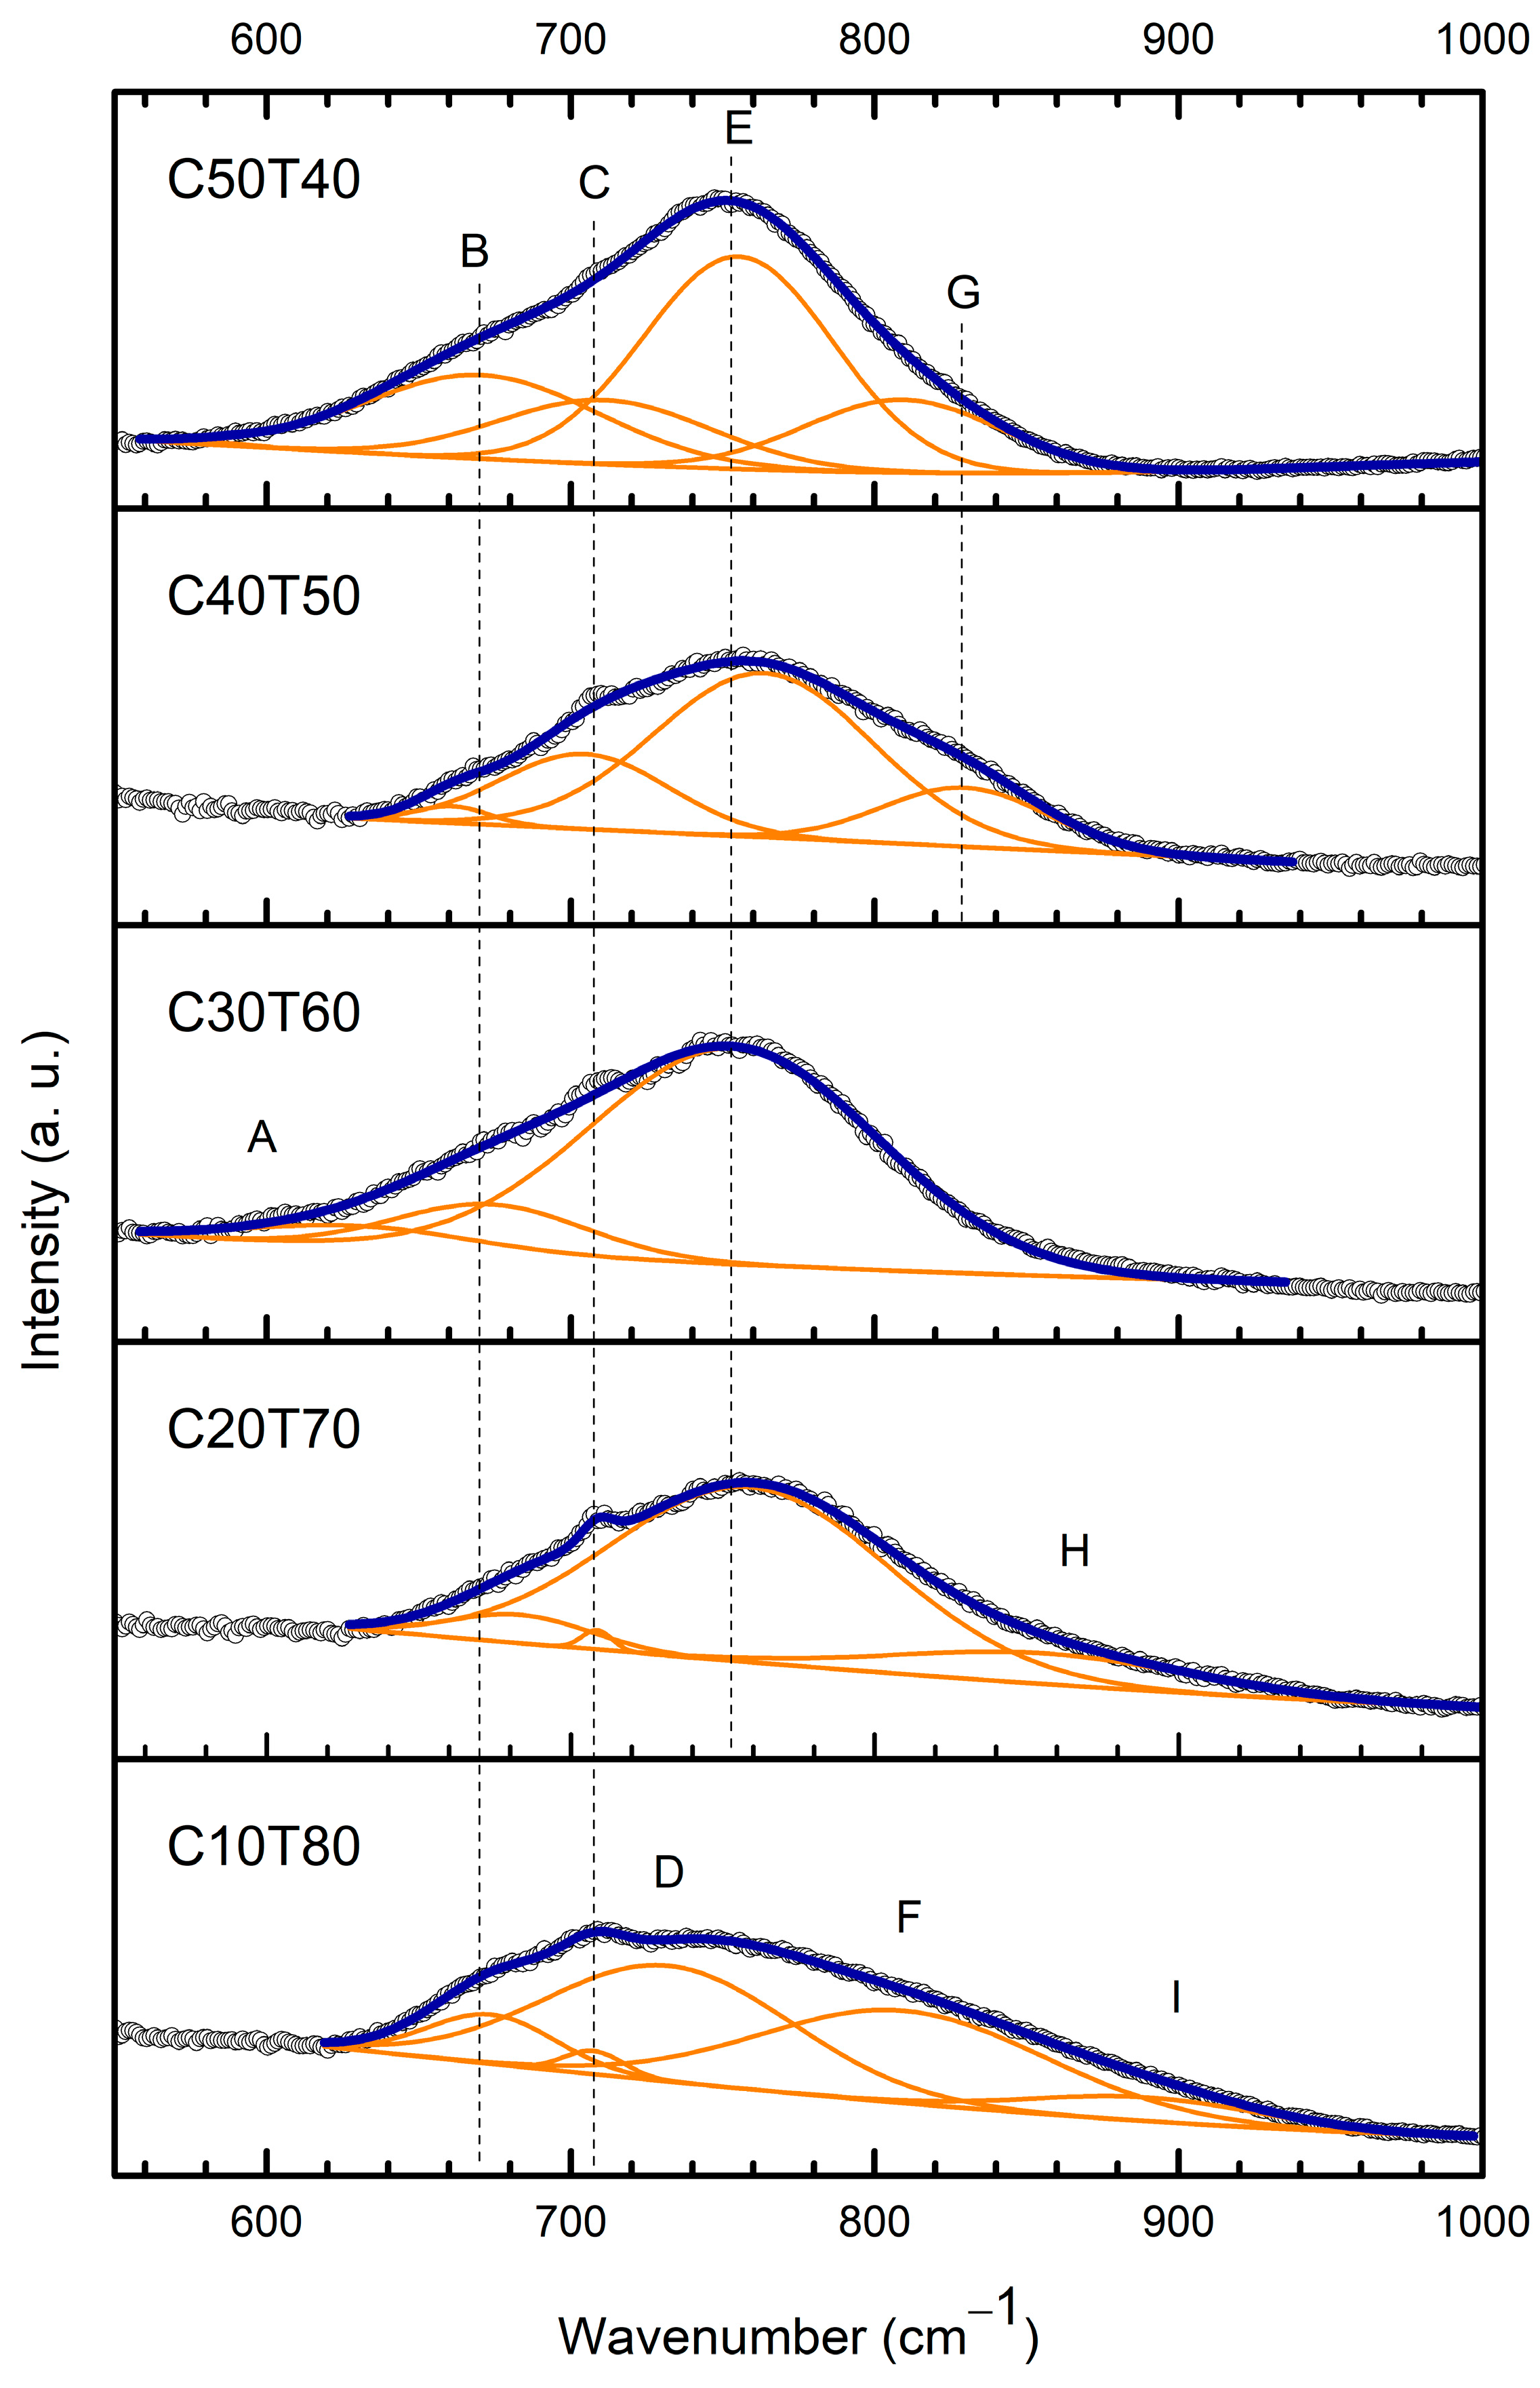
Figure 4 shows the deconvoluted Raman spectra of all samples which were background-corrected and Gaussian functions were used to decompose. It is noted that the main band in the 1000–600 cm−1 range is made up of the contributions of nine individual bands designated by symbols A through I in the plots. The intensity of the individual bands in the samples depended on the amounts of CdO and TeO2 contained in the samples.
The analysis was conducted in the range of 1000–600 cm−1, and the results are listed in Table 1. In general, the intensity of the deconvoluted band increased as the content of TeO2 decreased. The small band A at 621–630 cm−1 corresponds to the O-Te-O in the TeO4 unit and to ring strain associated with the bending modes of Ge-O-Ge bonds [35,36]. Band A was only detected in sample C30T60. Band B is related to the stretching modes of O-Te-O bonds in TeO4 units. It can be associated with antisymmetric vibrations of Te-O bonds in the TeO4, TeO3+1, and TeO3 units [32,37,38,39,40]. It is noted that the calculated intensity of band B at 661–683 cm−1 varied in all samples. Thus, in the sample C40T50, it was substantially low and shifted to a shorter wavelength of 660 cm−1. In contrast, in sample C50T40, the intensity of band B reached its highest value. Furthermore, as the amount of modifier oxide was increased, the intensity of band B also increased.
Band C at 705–709 cm−1 was detected in all samples except C30T60. In the samples where it was predicted to be present, its intensity varied significantly. This was likely attributed to the relative amounts of the modifier oxide. Band C can be related to the deformation modes in germanium atoms in the glassy network and to the stretching vibrations of TeO3+1 [37,41].
Band D at 732 cm−1 was found to be present only in sample C10T80. This band is associated with stretching vibrations between tellurium and non-bridging oxygen (NBO) atoms [37,41].
Band E at 754–764 cm−1 was found to be the most intense of all individual bands detected. It was predicted to occur in all samples except C10T80. This band is associated with asymmetric vibrations from Te-O-Te bridges in γ-TeO2 and stretching vibrations from groups TeO3+1 and [TeO3]−2 with three terminal oxygens [5,42,43,44,45,46]. It is noted that γ-TeO2 is a metastable TeO2 polymorph that arises from the rearrangement of the glass structures and eventually leads to the formation of α-TeO2 [47,48]. In the samples prepared in this work, the γ-TeO2 network constituted by polymerized TeO4 units connected with TeO3 groups was maintained, and no bands related to α-TeO2 were identified [47,48,49]. The former is related to the breaking of the connected glass network, whereas the latter is associated with TeO3 groups. This interaction caused the Te-O- bond stretching vibration studied by Sekiya et al. [40].
Band F at 810 cm−1 was found to be present in sample C10T80 only. This was the sample with the highest content of the former oxide. This band can be associated to γ-TeO2; short Te-O- bonds with NBOs form TeO4 units. It is also related to the LO split of the antisymmetric stretching vibration into the Q2 unit [32,35,36,50].
Band G at 830 cm−1 was found to be present in samples C40T50 and C50T40 which contained the lowest amounts of TeO2. It may be related with the asymmetric stretching of Ge-O-Ge bridges in GeO4 tetrahedra [41]. Band H at 856 cm−1 was only observed in sample C20T70 and can be associated with the stretching vibrations of NBO in Q3 species (GeO4 with three bridging oxygen atoms) [41,51].
Finally, band I at 889 cm−1 was characteristic of the sample with the highest TeO2 content C10T80 and may be attributed to the vibrations of TeO4 tbp and the Te-eqOax-Te bond. Moreover, band I may correspond to the transverse optic (TO) asymmetric stretching vibration of bridging oxygen in Ge-O-Ge linkage in GeO4 units [35].
Overall, it is known that the intensities and locations of the Raman bands detected in each sample depend on both the concentration and types of the structural groups in the sample. It is noted that the individual bands in the deconvolution results vary in intensity and some of them shift towards longer wavelengths. This behavior was possibly caused by the presence of the modifying oxide, the formation of GeO4 units, and the replacement of some TeO3+1 and TeO3 units by GeO4 units [52,53].
Table 1. Assignment of component bands in deconvoluted Raman spectra.
Band LabelLocation (cm−1)Band AssignmentReferences
A621–630Stretching modes of O-Te-O in TeO4 tbp units, and/or ring strain from Ge-O-Ge bending vibrations.[35,36]
B661–683Stretching modes of O-Te-O in TeO4 tbp units, antisymmetric vibrations of Te-O bonds in TeO4, TeO3+1 and TeO3 units.[32,37,38,39,40]
C705–709 Assigned to the deformation modes of Ge atoms in the glassy network.[37,41]
D732Stretching vibration between tellurium and non-bridging oxygen (NBO) atoms.[37,41]
E754–764 Asymmetric vibrations of Te-O-Te symmetric bridges in γ-TeO2, stretching vibrations from groups TeO3+1 and [TeO3]2− with three terminal oxygens.[5,35,42,43,46,54]
The peaks around 713 and 747 are assigned to stretching vibrations of TeO3/TeO3+1 unit.[42]
F810Characteristic band of γ-TeO2, short Te-O- bonds with NBOs form TeO4 units; LO split of the antisymmetric stretching vibrations into Q2 units.[32,35,36,50]
G830Could arise from that in Ge Q3-species.[41]
H856Assigned to the stretching vibrations of NBO in Q3 species (GeO4 with three bridging oxygen atoms).[41,51]
I889Stretching vibrations from Te=O in TeO3 isolated units, TO split of the antisymmetric stretching vibrations of Ge-O-Ge in Q3 units.[35]

3.4. XPS Analysis

Based on XPS wide scans of the samples, the characteristic photoelectron peaks of Cd, Ge, Te, and O were identified in the samples; this is shown in Figure 5. In samples C50T40, C30T60, and C20T70, some Al was also detected. This element was most likely incorporated into the glass because of crucble corrosion (see inset in Figure 5). In general, the introduction of crucible material depends on melting temperature and time [55]. However, all samples were obtained under the same conditions of melting temperature and time. The composition between samples varies, and therefore, there may be more crucible corrosion in some samples than in others because an uncontrolled amount of crucible material, which can be transferred to the melt, significantly depends on the glass composition and temperature–time conditions of its melting [56].
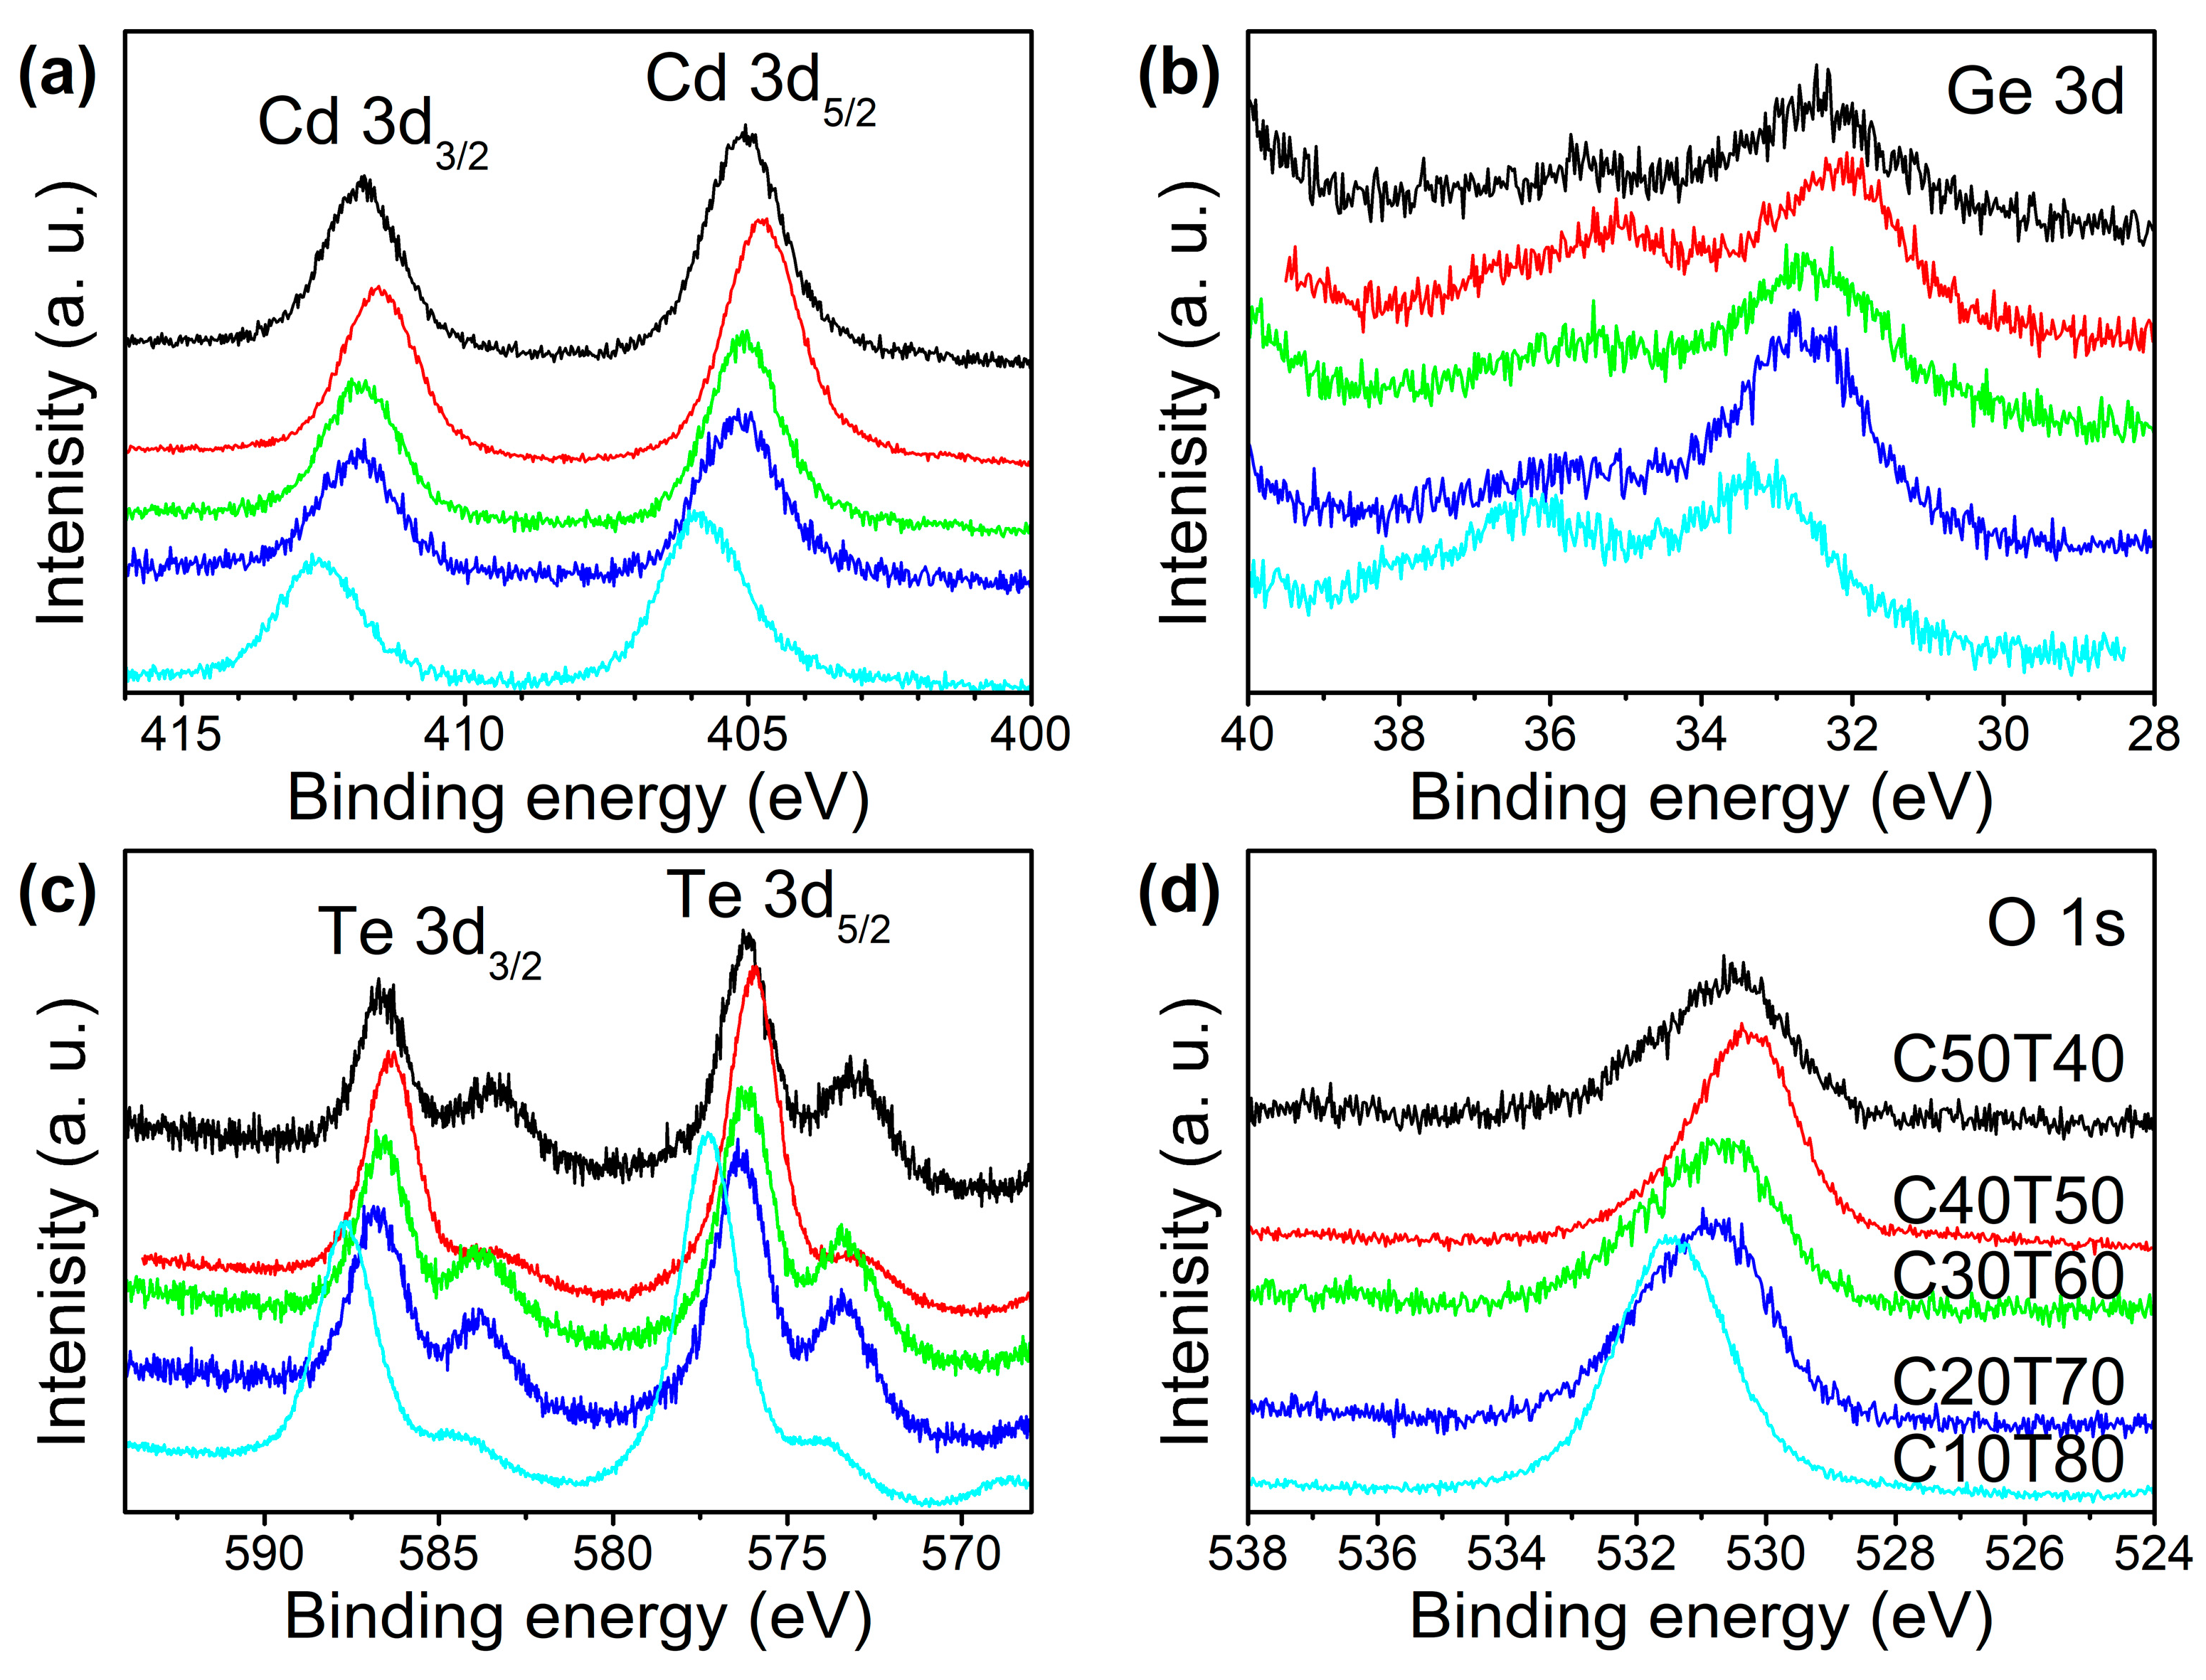
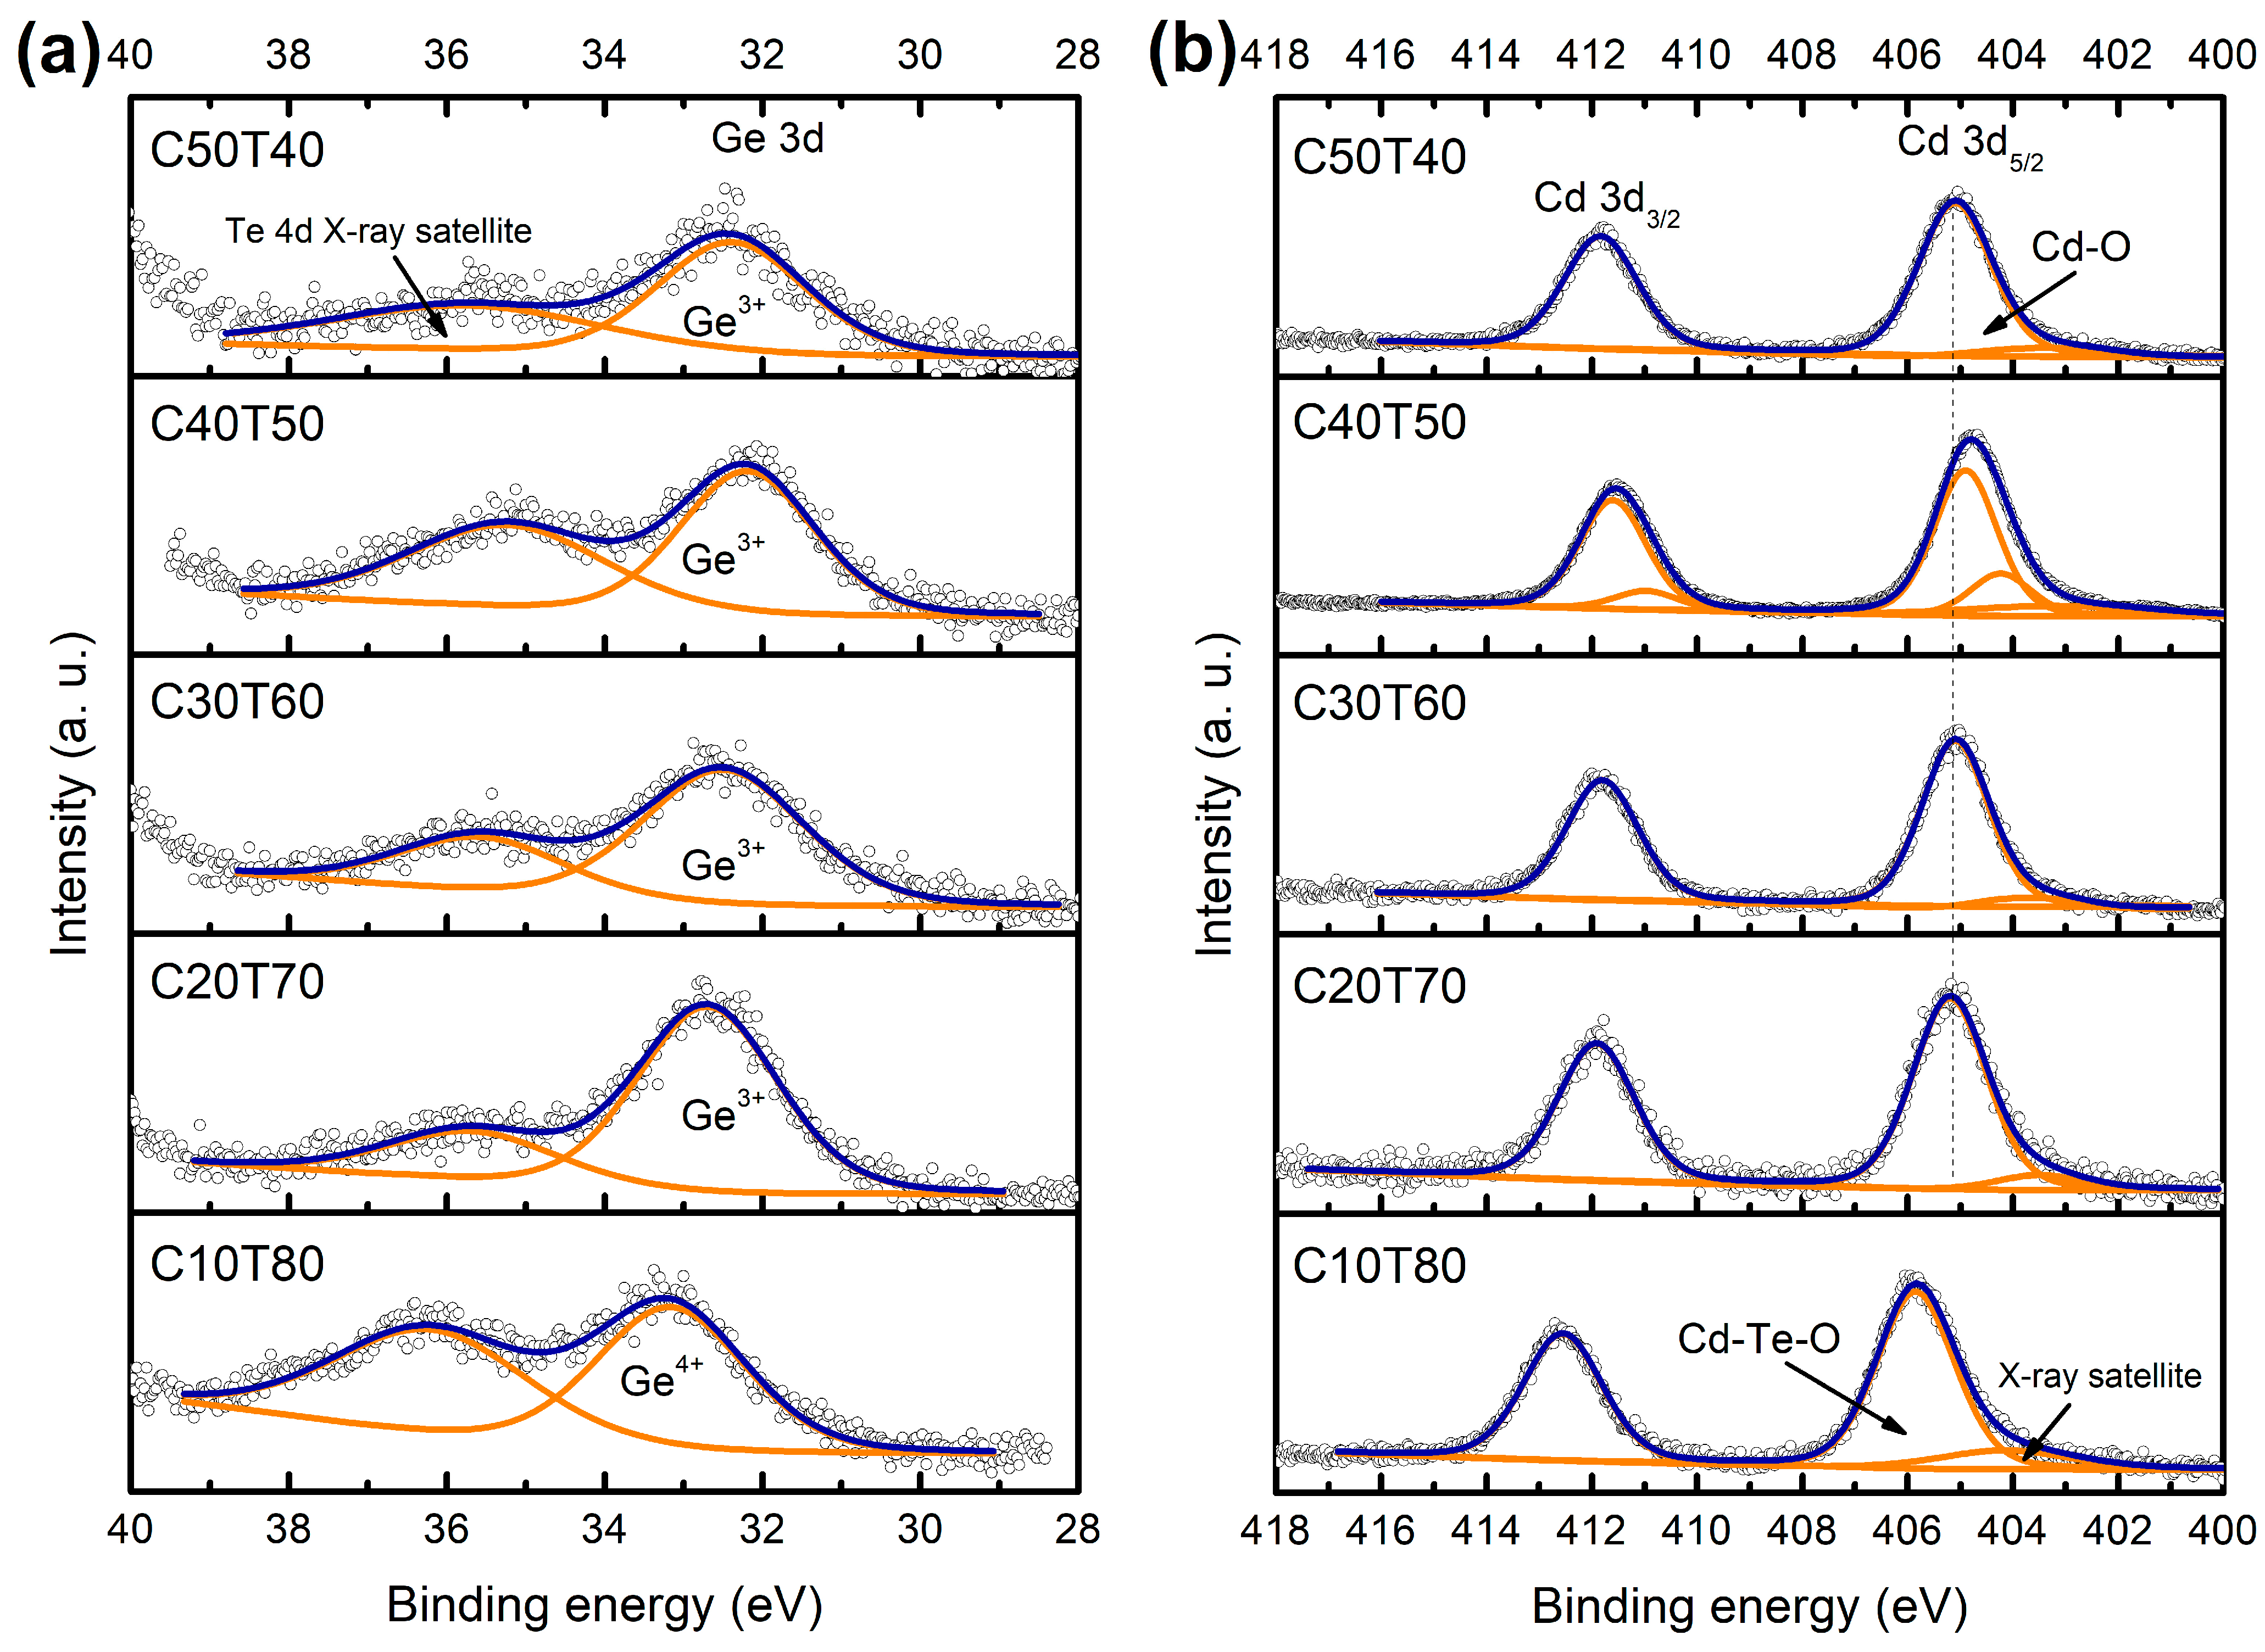
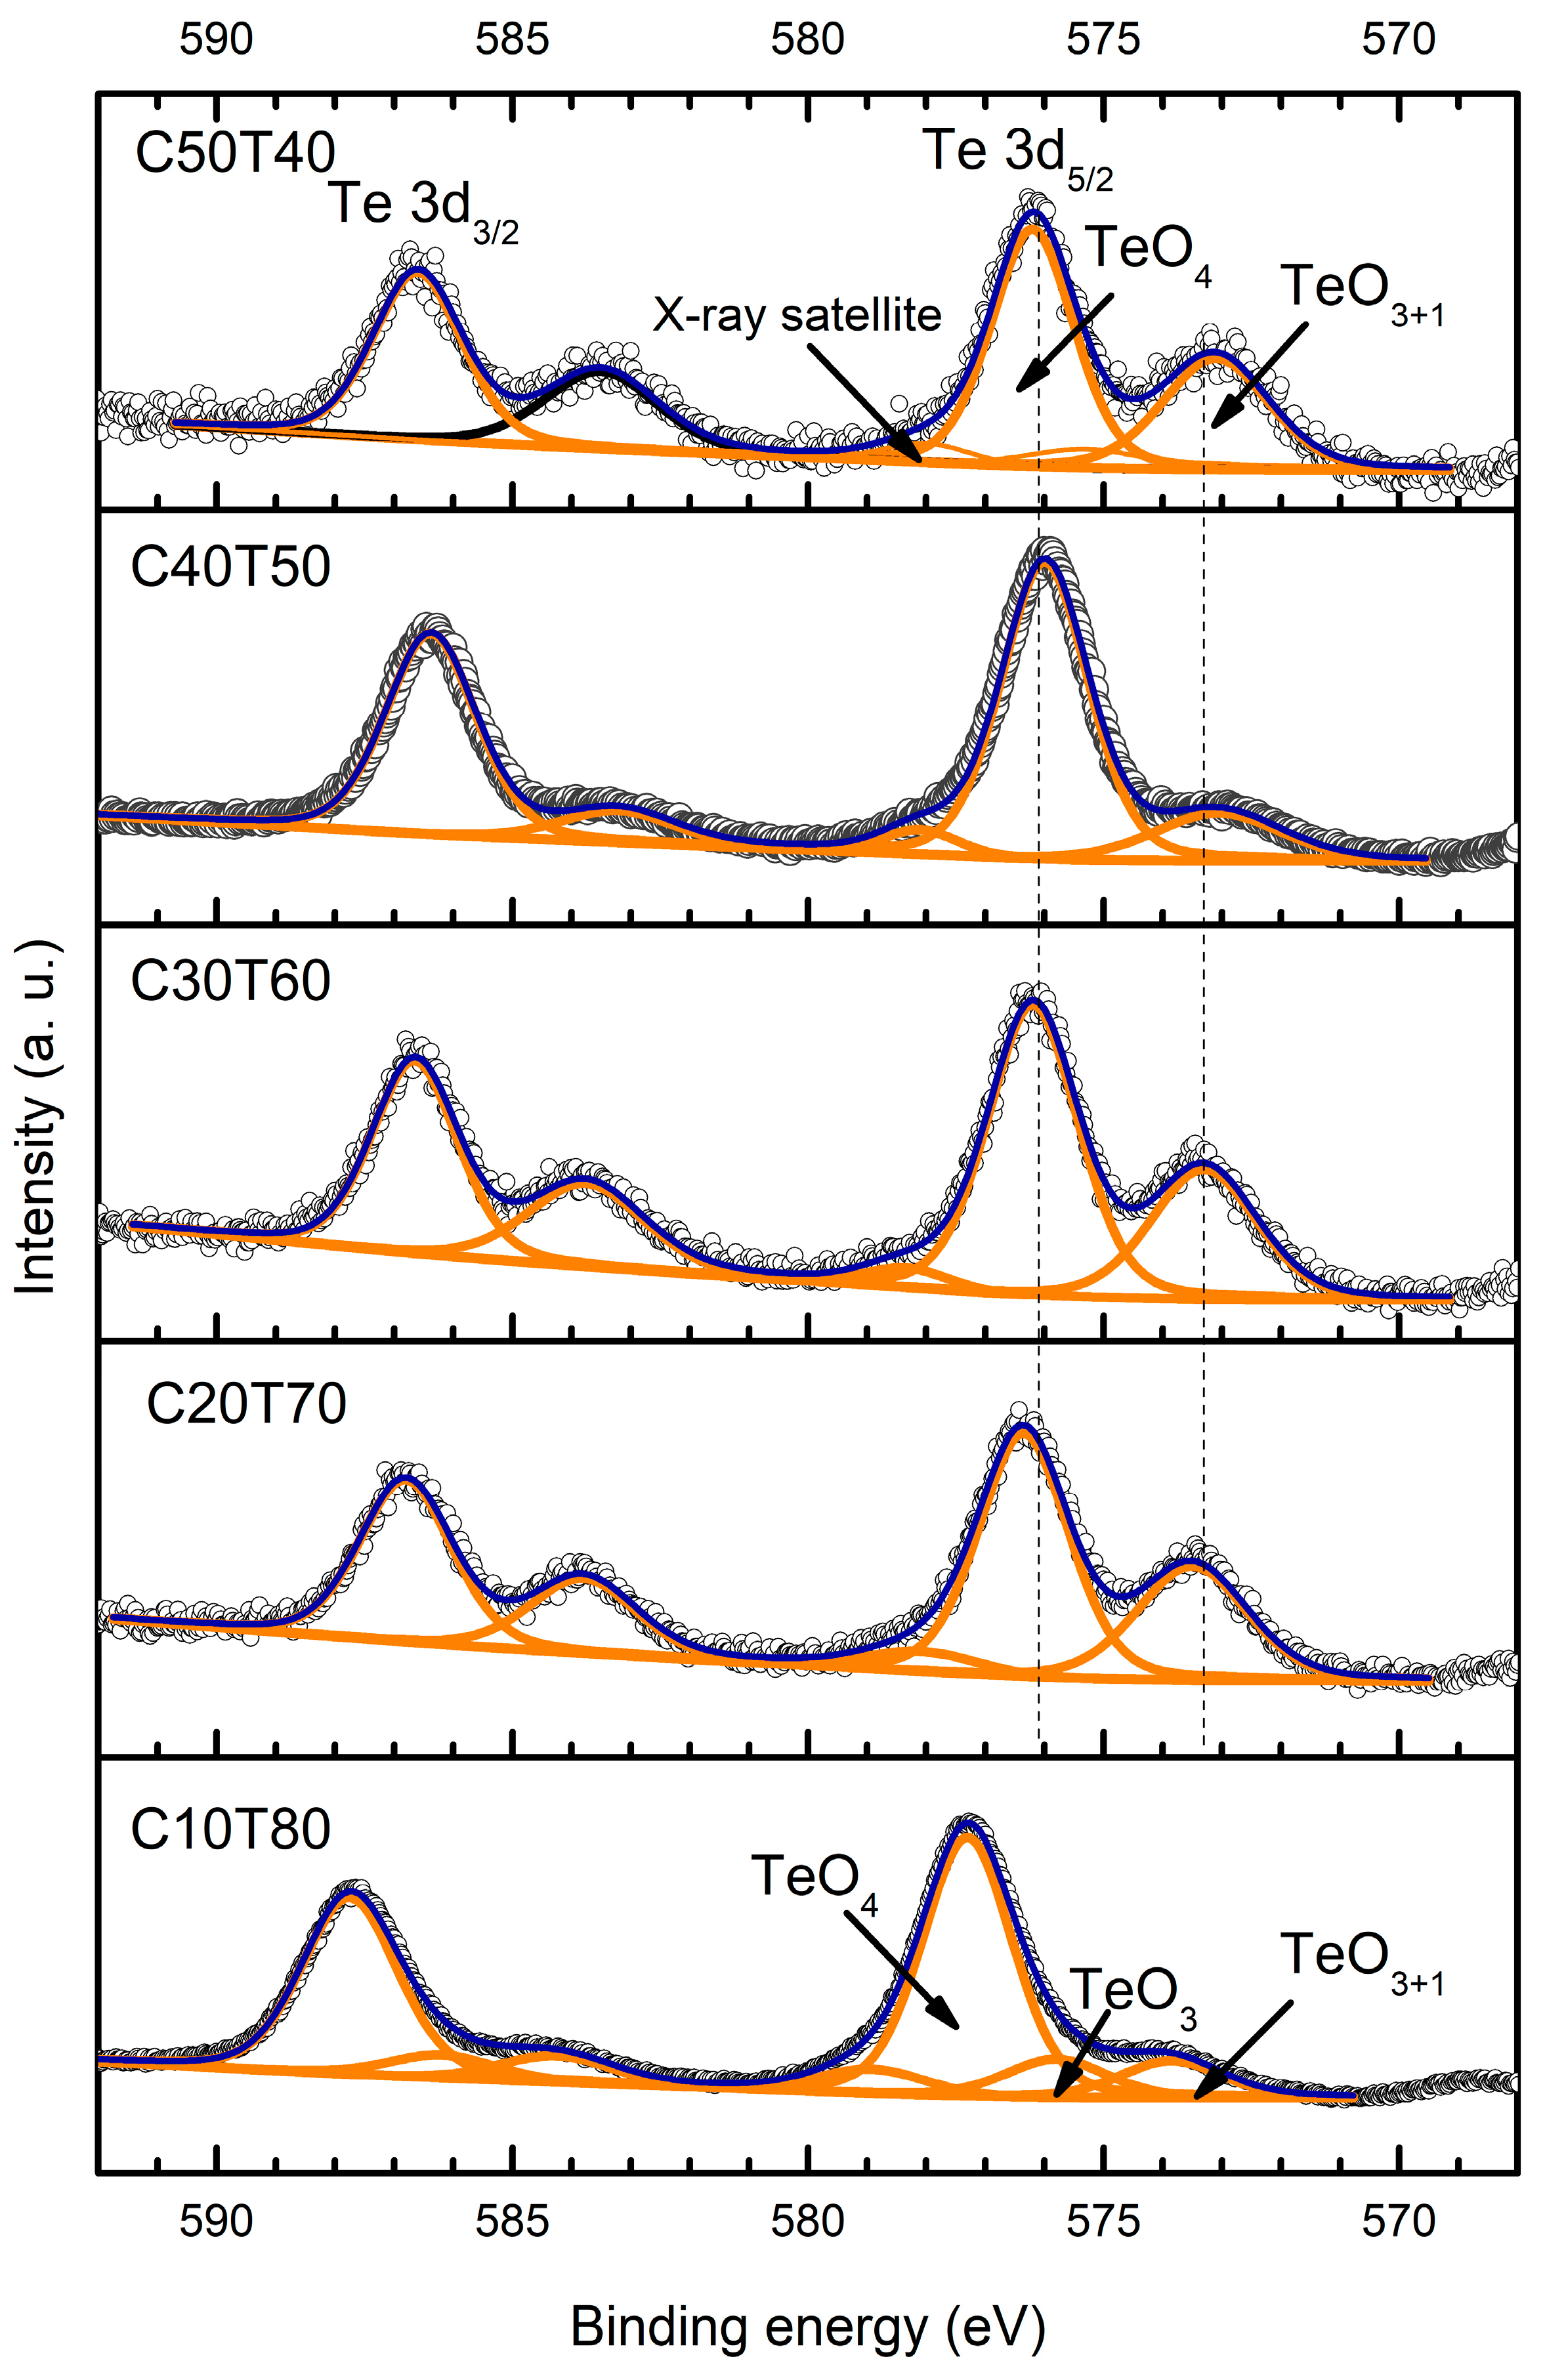
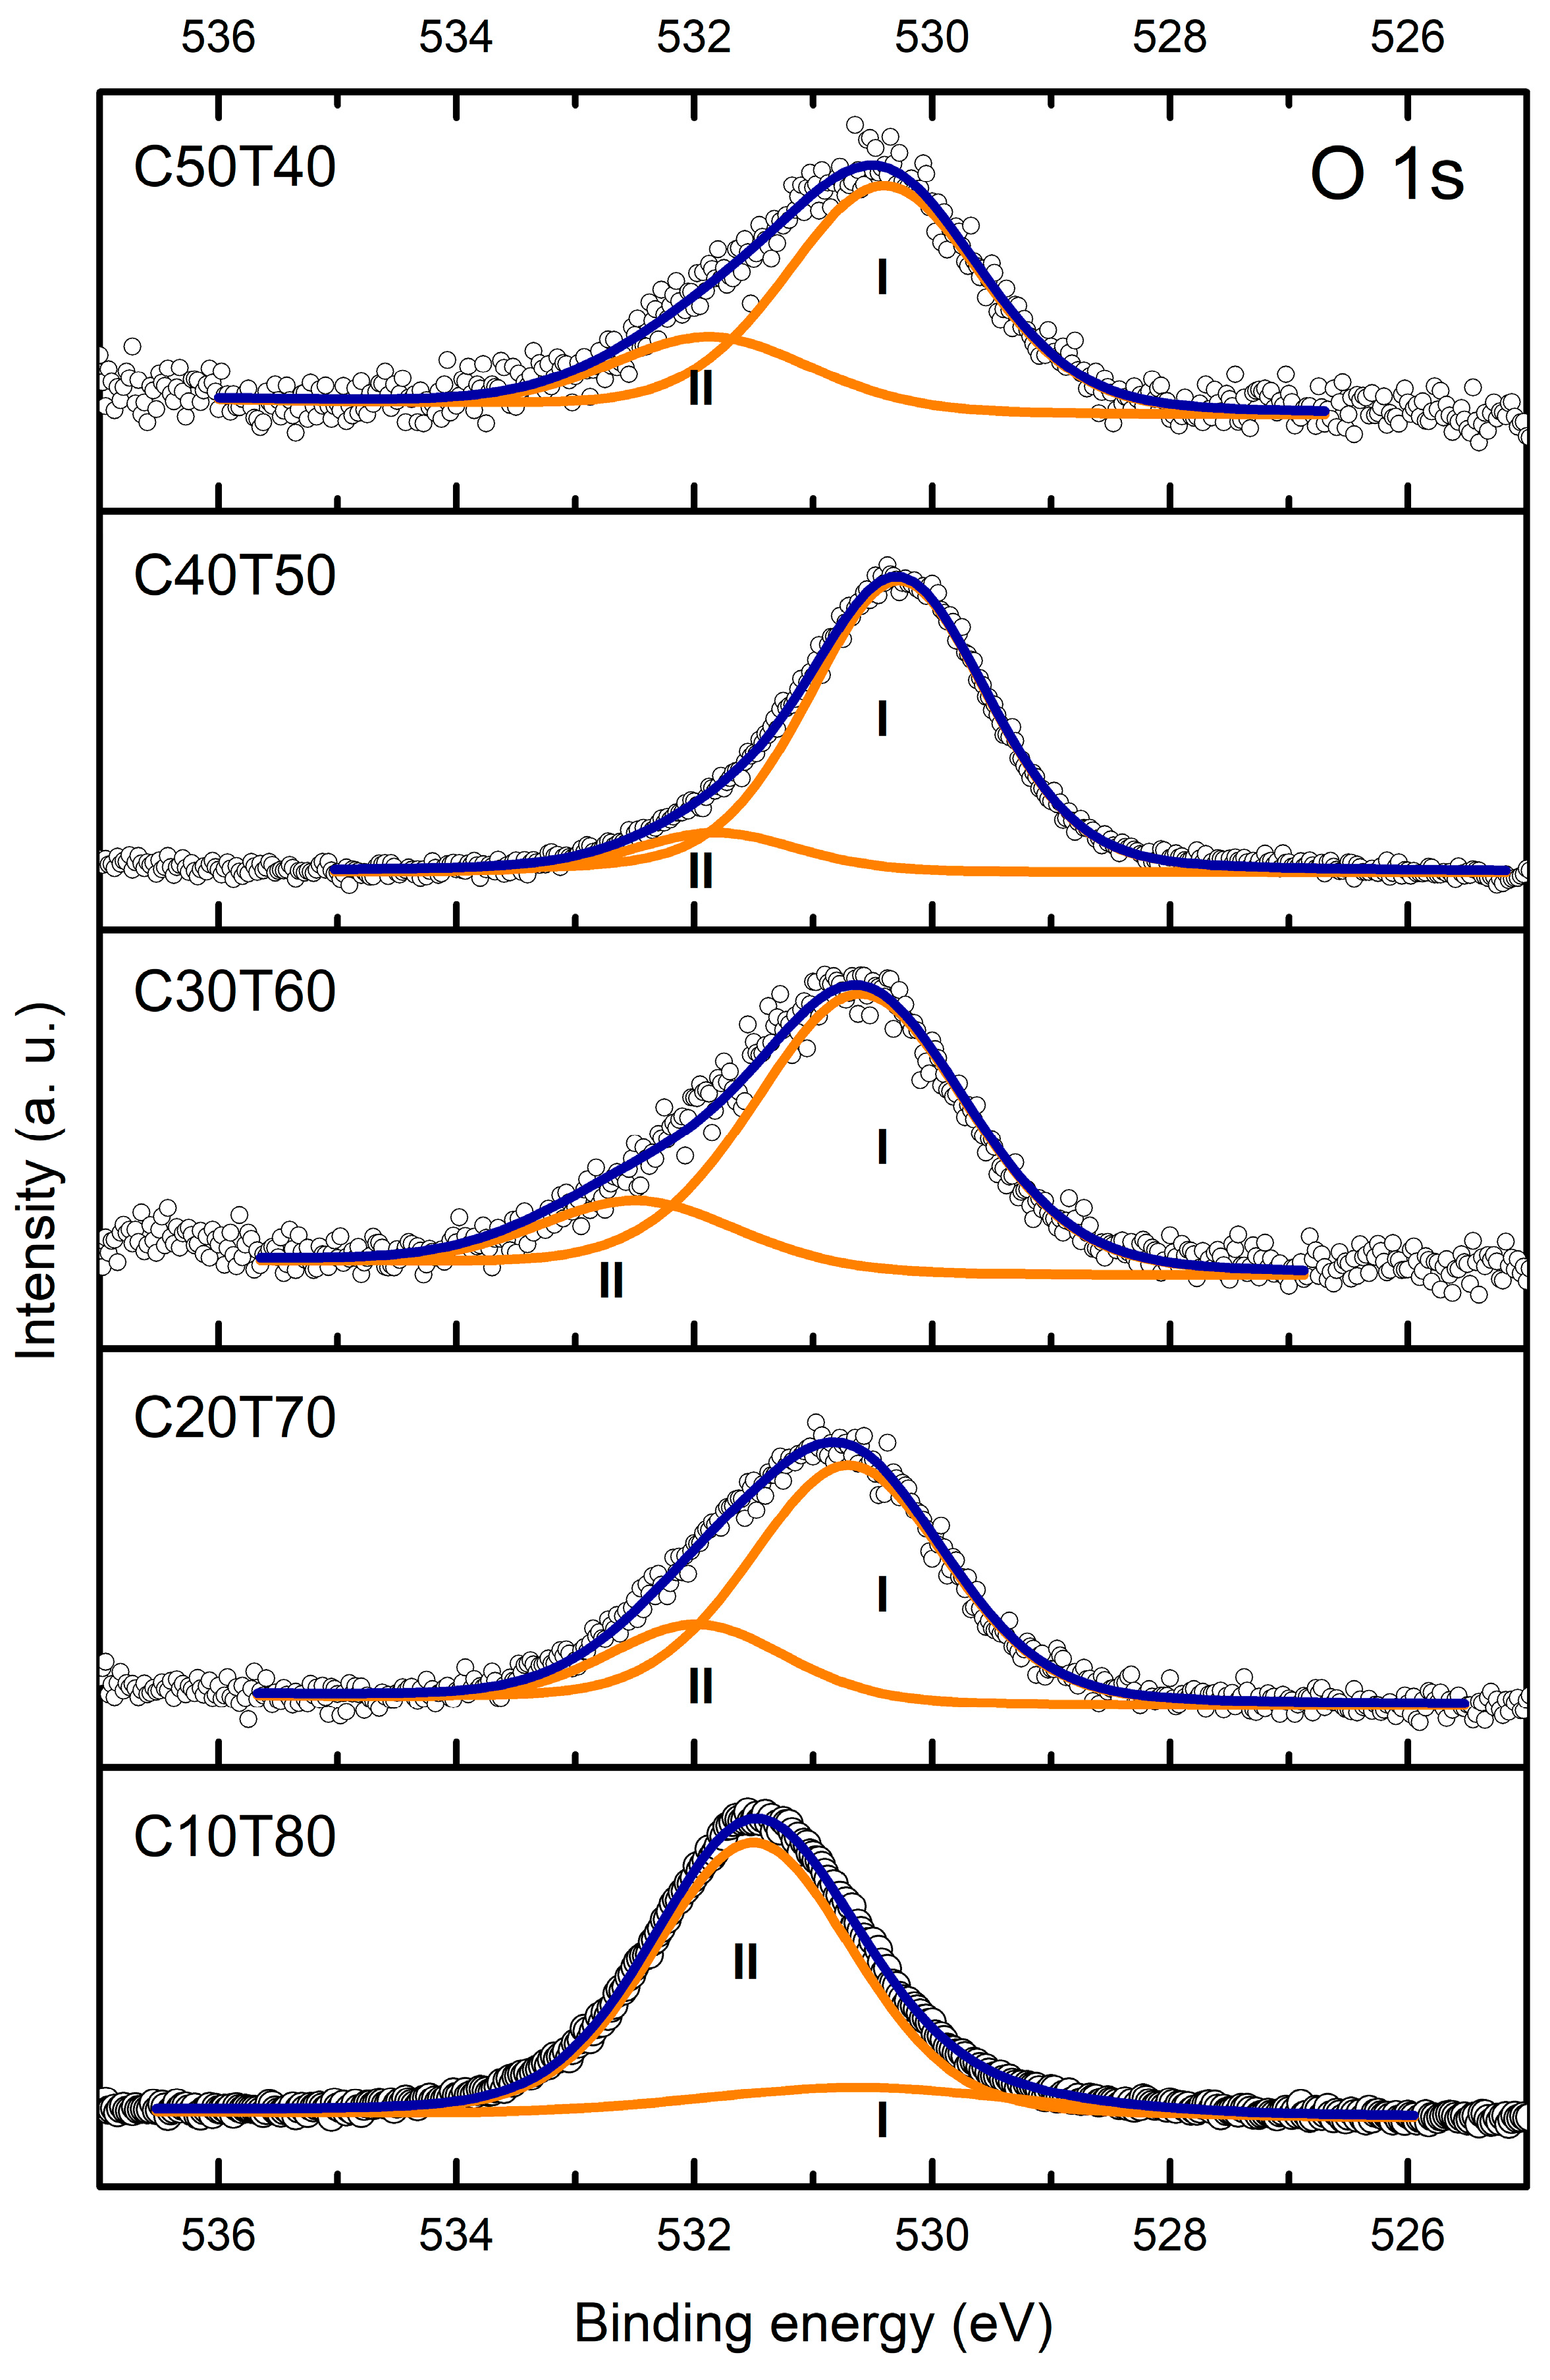
To follow up the structural evolution of the glasses as a function of the initial amounts of GeO2, CdO, and TeO2, high-resolution spectra of Cd 3d5/2, Cd 3d3/2, Ge 3d, Te 3d3/2 Te 3d5/2, and O 1s were conducted in all samples. The results are shown in Figure 6a–d. It is noted that samples C50T40, C30T60, and C20T70 showed similar spectra. Sample C40T50 showed a slight shift towards low binding energy values, and sample C10T80 shifted to higher binding energy values. For a further analysis, deconvolution of all high-resolution spectra (Figure 7 and Figure 8) was carried out using a Gaussian–Lorentzian function and a Tougaard background subtraction. The results are shown in Table 2.
The curve fittings of the Ge 3d photoelectron line of all samples are shown in Figure 7a. A shoulder at energy values around 35.6 eV may be the X-ray satellite of the Te 4d [57,58]. The peaks of the 3d Ge for glasses C50T40–C20T70 were in the range of 32.2 to 32.7 eV. They are related to Ge3+ in Ge2O3 [59]. Regarding sample C10T80, the position of the peak shifted towards a higher binding energy (33.2 eV), and the oxidation state of germanium changed to Ge4+ (GeO2) [59,60,61]. It is noted that the high content of TeO2 changed the coordination of Ge. Thus, four oxygen atoms remove the electronic density from the germanium atom. A possible explanation is that there are GeO4 units with two or more NBOs. The electron density is polarized toward the oxygen atom, decreasing the charge density around the Ge atom, which results in the 3d photoelectronic peak shifting toward higher binding energy values. Considering that the GeO2 content does not vary among the different glasses’ compositions, Ge-O-Te bonds may form in glasses with high TeO2 content.
XPS spectra of Cd 3d are shown in Figure 7b. The binding energies of 405.2, 404.2, 404.9, 405.1, 405.2, and 405.85, eV were obtained for 3d5/2. Similarly, the values of 411.9, 410.9, 411.6, 411.8, and 412.6 eV, were obtained for 3d3/2. The binding energy is attributed to the Cd2+ bonding state [62], shifted to lower binding energy values regarding Cd-O bonds. For C50T40 glass, the Cd 3d5/2 peak is observed at 405.2 eV, which is commonly related to Cd-Te in cadmium telluride [63,64]. According to XRD results, this sample exhibits the formation of tricadmium orthotellurate crystals. Since the 3d doublet could not be resolved in more components, it is possible to infer that there is a combination of Cd-O bonds from the crystal CdO6 octahedra [65] and Cd-O bonds in a TeO2-rich matrix that causes the shift to higher binding energies. Furthermore, the effect of cadmium oxide nanocrystals on the behavior of sample C40T50 is noted. Figure 7b shows that the most intense band of the Cd 3d5/2 peak shifted to the right, and the less intense band of that same peak shifted to the left. The concentration of Cd2+ ions within the glass matrix decreases, acting as a modifier, and interacts with two Te-O- terminal bonds, thereby decreasing the local electron density of Cd, causing the shift to 405.85 eV [62,66]. Another possibility is the formation of Cd-O-Te bonds, which present low local electron densities, leading to higher binding energy values for Cd2+ ion photoelectrons. It is necessary to analyze this system further to understand its glass network structure.
Deconvoluted Te 3d XPS spectra are shown in Figure 8. The Te 3d spectra are associated with different tellurium-based structural units such as TeO4, TeO3, and TeO3+1 [67]. Such associations were made based on electronegativity and binding energy considerations [68]. Thus, the Te 3d5/2 peak at 573–573.85 eV was assigned to Te0, and the 575.8–576.3 eV peak was associated with Te-O links within the TeO2 network [69,70,71]. However, it is noted that the band position in sample C10T80 changed to 577.15 eV, which suggests a change in the coordination of TeO2, possibly from TeO3 to TeO4 [67,72,73].
On the other hand, the characteristic Te 3d5/2 photoelectron peak shifts to higher energy values in the range of 576–577.3 eV as the TeO2 content increases. Based on an extensive bibliographic review, tellurium is present as Te4+ in TeO4 groups for the 576.2 eV, 576 eV, 576.2 eV, 576.3 eV, and 577.3 eV peaks, its Te 3d3/2 counterparts (Table 2) separated by ~10.4 eV [67,72,73,74,75]. The peak at lower binding energies in the 573–573.85 eV range can arise from tellurium in TeO3+1 units [67,73]. Additionally, the FWHM did not change drastically from ~2.1, except for in the C40T50 sample, which had an FWHM of 2.53. The sample presented a CdO crystalline phase, which translates into a TeO2 enrichment of the glass matrix. According to previous reports, the Te 3d5/2 peak related to the TeO3 trigonal pyramids appears around 575 to 576 eV [67,72,73]. Then, for sample C10T80, a peak at 575.8 eV can be assigned to Te4+ in TeO3 groups, and the peak at 577.3 eV is attributed to TeO4 or Te in Ge-O-Te bonds. Those results are in agreement with the Raman spectra analysis. Moreover, the formation of metallic Te cannot be discarded. P. Wang et al. [76] performed an analysis of the effect of melting temperature on color-changing in TeO-GeO-K2O-Nb2O5 glasses using alumina crucibles for the fusion, confirming the presence of metallic Te with differential scanning calorimetry measurements. However, they did not perform XPS spectra deconvolution of the Te 3d doublet peaks, although a shift in position was evidenced. M. Xu et al. [74] reported that for Te0 nanostructures, the Te 3d5/2 and 3d3/2 peaks appear at 573 eV and 583 eV, respectively. For samples C50T40 and C40T50, the Te 3d doublet peaks have binding energies close to those of metallic Te; however, this cannot be confirmed with the present analysis. It is similar to the formation of Cd-Te bonds. According to XPS data on CdTe, the peaks exhibit binding energies of 570–572.5 eV and 581–582 eV [77,78,79], which are lower than those found in the analyzed glasses.
The peaks due to non-bridging oxygen atoms (NBOs) and the bridging oxygen atoms (BOs) (Table 3) were separated by deconvoluting the O 1s spectrum (Figure 9) into different Gaussian peaks. The O 1s (I) denotes the NBOs, and O 1s (II) represents the BOs with lower and higher binding energy values, respectively [65,72,73]. In samples C50T40 and C40T50, the NBOs’ peak position is almost the same, but the area increases significantly for the C40T50 glass. However, the Te 3d spectra showed that the TeO4 units are the most intense for that glass composition. It is necessary to consider that Ge-O, Te=O, Te-O, and Cd-O bonds contribute to the NBOs’ peak, not just TeO3 groups [72]. For samples C30T60, C20T70, and C10T80, the value of the OI peak shifts to ~530.6 eV and decreases its area proportion gradually until it collapses for the glass C10T80. This change arises from the formation of TeO4 units, as discussed in the analysis of the Te 3d XPS spectra. Meanwhile, the OII peak from BOs appears in the 531.8 eV to 532.5 eV range, with the sample of C30T60 glass exhibiting the highest BO peak value, contributing only 11% to the O 1s peak area. This is interesting because despite the high content of TeO2, it is observed that only a few Te-O-Te bonds contribute. From the Raman spectroscopy analysis of the C30T60 glass, we can infer that the NBOs predominantly arose from [TeO3]2− units. This means that the network connectivity may be facilitated by a few TeO4, GeO2, and CdO units, as the last oxide has demonstrated the capability of being a glass former [21] or through Te-O-Cd and Te-O-Ge bonds that do not contribute to the BOs’ peak. Additionally, samples C50T40, C30T60, and C20T70 exhibited and displayed evident Al incorporation (Figure 5), which forms Te-O-Al bonds that also contribute to network connectivity. In addition, XRD characterization evidenced that those three glasses were entirely amorphous. For the C10T80 glass, there was a drastic increase in the BOs’ peak area contribution, with a FWHM of 3.23, which is consistent with the appearance of TeO4 units, as evidenced by the Te 3d spectra of this sample.
Finally, it was previously reported that in TeO2 glasses, the BO and NBO components cannot be resolved due to the initial distorted symmetry of TeO2 structural units [80]. Consequently, the peak BOs at higher energy can be assigned to Te-O-Te and Ge-O-Ge, and the peak NBOs at lower energy values may be associated with Ge-O-Cd, Te-O-Cd, and Cd-O bonds.

3.5. Optical Absorption

The results of the optical absorption analysis of the samples are shown in Figure 10. By means of the Tauc’s relation, a plot of ( h ν α ) n   v s .   ( h ν E g ) can be used to calculate the optical band gap ( E g ) . In this relationship, α is the absorption coefficient, h is the Planck’s constant, ν is the frequency of the electromagnetic radiation, and n = 1 / 2 for amorphous materials [81].
Moreover, Table 4 shows the calculated E g values for all samples obtained in this work. The band gap values indicate that these glasses may have semiconductor applications [82]. It is noted that the larger the content of TeO2, the lower the value of E g . This behavior may be attributed to the effect of the bridging oxygen linkages in the structure. A distinctive feature is noted in sample C50T40, as two optical shoulders are observed in Figure 10. The first shoulder (3.5–4.0 photon eV) is associated with the amorphous matrix, whereas the second shoulder (2.6–3.2 eV) may be related to the effect of embedded nanoparticles of Cd3TeO6 in the glass structure detected in the XRD analysis (Figure 2).
This sample, C50T40, corresponds to a very particular composition where the modifying oxide is present in the same proportion as the forming oxide. If we observe the Raman spectra, we can see the most intense band corresponding to the formation of TeO3 and TeO3+1 units, which lead to the formation of non-bridging oxygens (NBOs). NBOs are formed by the addition of a modifying oxide, which causes a loss of lattice connectivity, giving rise to the formation of the vibrational modes Te-O-Cd and Te-O-Ge because the electrons in NBOs are more easily excited because they are weakly bound compared to bridging oxygens (BOs) [83].
The band gap varies with the presence of non-bridging oxygens. On the other hand, as the amount of CdO (10–40% wt) increases, the value of E g also increases, and it would be expected that at high concentrations of NBOs, the band gap energy would be narrower. In the glasses under study, this does not happen; they exhibited different behavior, perhaps due to the dual role of cadmium, by coordinating with the TeO4 and GeO2 groups.

3.6. Refractive Index

The refractive index ( n ) is one of the key properties to be determined in a glass. This is because the refractive index affects the magnitude of the speed of light through the glass matrix and its direction upon being refracted. The empirical relationship between E g and n is: n 2 = 180 / E g 1 / 2 2 [84]. By using the values of E g computed in the previous section, the values of n shown in Table 4 were obtained. Overall, the refractive index varied in the range of 2.432–2.609, and it increased as the amount of TeO2 increased in the samples. Glasses with similar refractive index have been suggested in applications of waveguide in the sub-THz and millimeters wave region [85]. Typically, an increase in the value of n has been associated with an increase in the polarizability of the matrix, which in turn is caused by the growth of the population of NBOs that possess a greater number of polarizabilities compared to bridging oxygen [84,85,86]. In the present case, in addition to the increase in NBOs, a large number of Cd2+ ions were incorporated into the glassy matrix. Such Cd2+ ions possess large polarizability and a high coordination number. In general, the present glasses show potential for applications in optical devices and fiber optics. The TeO2–GeO2 combination allowed the fabrication of glass samples with high values of the refractive index, high light transmission, and selective absorption compared to those of borosilicate and silicate glasses.

4. Conclusions

Glasses with high TeO2 content (40–80 wt%) were successfully obtained by the traditional melt-quenching process at 900 °C.
The amorphous nature was confirmed by XRD; however, crystallization of the CdO-rich samples occurred and the presence of nanocrystals was observed. Cadmium orthotellurate (Cd3TeO6) nanocrystals were obtained in the C50T40 glass, and in the C40T50 glass, cadmium oxide nanocrystals were detected. So, one of the effects of CdO in these glasses is that high quantities produce a nanocrystalline embedded in the glass phase.
Raman spectroscopy analysis results revealed the transformation of structural units from TeO4 → TeO3 in the glass system with the addition of CdO (modifier oxide). It also showed the presence of M-O-M bonds and higher disorder in the glass network when the TeO2 content was larger than 60 wt%.
The XPS analysis showed that as the content of TeO2 increases, there is a shift towards higher binding energies of the characteristic peaks of Cd 3d5/2, Cd 3d3/2, Ge 3d, Te 3d3/2, Te 3d5/2, and O 1s.
The band gap energy was reduced from 2.87 to 2.32 eV. This behavior was mainly associated with the increase in polyhedron networks induced by M-O-M (M = Cd, Te) chemical bonds, promoting sp transitions located at longer wavelengths.
These glasses can be suitable for optical amplifiers and non-linear optical materials used in the field of science and engineering.

Author Contributions

Conceptualization, I.V.G.A. and M.E.Z.; Data curation, I.V.G.A. and J.J.P.R.; Formal analysis, I.V.G.A., R.L.-M. and M.E.Z.; Funding acquisition, M.E.Z.; Investigation, I.V.G.A., D.A.R.C., J.A.-R. and M.E.Z.; Methodology, D.A.R.C., J.A.-R., R.L.-M., and M.E.Z.; Project administration, I.V.G.A.; Software, J.A.-R.; Supervision, M.E.Z.; Validation, J.A.-R., P.C.S.-M. and G.A.L.R.; Writing—original draft, I.V.G.A., J.A.-R., P.C.S.-M., J.J.P.R., P.H.-A. and M.E.Z.; Writing—review and editing, I.V.G.A., J.A.-R., P.H.-A., G.A.L.R. and M.E.Z. All authors have read and agreed to the published version of the manuscript.

Funding

This research was funded by Universidad Estatal de Sonora under Support for scientific publications.

Institutional Review Board Statement

Not applicable.

Informed Consent Statement

Not applicable.

Data Availability Statement

The original contributions presented in this study are included in the article. Further inquiries can be directed to the corresponding authors.

Acknowledgments

The authors express their gratitude to the X-ray photoelectron spectroscopy laboratory, Physics Research Department, University of Sonora, Mexico. In particular, thanks are due to Roberto Mora Monroy for his assistance in the XPS analysis.

Conflicts of Interest

The authors declare no conflict of interest.

Abbreviations

XPSX-ray photoelectron spectroscopy
IRInfrared
NIRNear Infrared
UVUltraviolet
LEDsLight-Emitting Diodes
XRDX-ray diffraction
OAOptical absorption
NBOsNon-bridging oxygen atoms
FWHMFull Width at Half Maximum
BOsBridging oxygen atoms

References

  1. Wang, Z.; Zhang, B.; Liu, J.; Song, Y.; Zhang, H. Recent Developments in Mid-Infrared Fiber Lasers: Status and Challenges. Opt. Laser Technol. 2020, 132, 106497. [Google Scholar] [CrossRef]
  2. Jlassi, I.; Elhouichet, H.; Hraiech, S.; Ferid, M. Effect of Heat Treatment on the Structural and Optical Properties of Tellurite Glasses Doped Erbium. J. Lumin. 2012, 132, 832–840. [Google Scholar] [CrossRef]
  3. Kamalaker, V.; Upender, G.; Ramesh, C.; Chandra Mouli, V. Raman Spectroscopy, Thermal and Optical Properties of TeO2–ZnO–Nb2O5–Nd2O3 Glasses. Spectrochim. Acta Part A Mol. Biomol. Spectrosc. 2012, 89, 149–154. [Google Scholar] [CrossRef]
  4. Himei, Y.; Miura, Y.; Nanba, T.; Osaka, A. X-Ray Photoelectron Spectroscopy of Alkali Tellurite Glasses. J. Non-Cryst. Solids 1997, 211, 64–71. [Google Scholar] [CrossRef]
  5. Upender, G.; Vardhani, C.P.; Suresh, S.; Awasthi, A.M.; Mouli, V.C. Structure, Physical and Thermal Properties of WO3–GeO2–TeO2 Glasses. Mater. Chem. Phys. 2010, 121, 335–341. [Google Scholar] [CrossRef]
  6. Rachkovskaya, G.E.; Zakharevich, G.B. Germanate Lead-Tellurite Glasses for Optical Light Filters. Glass Ceram. 2012, 68, 385–388. [Google Scholar] [CrossRef]
  7. Fares, H.; Jlassi, I.; Elhouichet, H.; Férid, M. Investigations of Thermal, Structural and Optical Properties of Tellurite Glass with WO3 Adding. J. Non-Cryst. Solids 2014, 396–397, 1–7. [Google Scholar] [CrossRef]
  8. Kaur, A.; Khanna, A.; Pesquera, C.; González, F.; Sathe, V. Preparation and Characterization of Lead and Zinc Tellurite Glasses. J. Non-Cryst. Solids 2010, 356, 864–872. [Google Scholar] [CrossRef]
  9. Ghribi, N.; Dutreilh-Colas, M.; Duclére, J.R.; Gouraud, F.; Chotard, T.; Karray, R.; Kabadou, A.; Thomas, P. Structural, Mechanical and Optical Investigations in the TeO2–Rich Part of the TeO2–GeO2–ZnO Ternary Glass System. Solid. State Sci. 2015, 40, 20–30. [Google Scholar] [CrossRef]
  10. Munemura, H.; Mitome, K.; Misawa, M.; Maruyama, K. Network Structure of M2O–TeO2 (M=Li, Na, Li0.62Na0.38) Glasses. J. Non-Cryst. Solids 2001, 293–295, 700–704. [Google Scholar] [CrossRef]
  11. Akagi, R.; Handa, K.; Ohtori, N.; Hannon, A.C.; Tatsumisago, M. High-Temperature Structure of K2O-TeO2 Glasses. J. Non-Cryst. Solids 1999, 256–257, 111–118. [Google Scholar] [CrossRef]
  12. Pulluru, C.R.; Kalluru, R.R.; Reddy, B.R.; Konovalova, T.A.; Kispert, L.D. Persistent Spectral Hole Burning in Europium-Doped Sodium Tellurite Glass. Appl. Phys. Lett. 2005, 87, 091107. [Google Scholar] [CrossRef]
  13. Sreenivasulu, V.; Upender, G.; Swapna; Vamsi Priya, V.; Chandra Mouli, V.; Prasad, M. Raman, DSC, ESR and Optical Properties of Lithium Cadmium Zinc Tellurite Glasses. Phys. B Condens. Matter 2014, 454, 60–66. [Google Scholar] [CrossRef]
  14. Cai, M.; Zhou, B.; Tian, Y.; Zhou, J.; Xu, S.; Zhang, J. Broadband Mid-Infrared 2.8 Μm Emission in Ho3+/Yb3+-Codoped Germanate Glasses. J. Lumin. 2016, 171, 143–148. [Google Scholar] [CrossRef]
  15. Promphet, N.; Rattanarat, P.; Rangkupan, R.; Chailapakul, O.; Rodthongkum, N. An Electrochemical Sensor Based on Graphene/Polyaniline/Polystyrene Nanoporous Fibers Modified Electrode for Simultaneous Determination of Lead and Cadmium. Sens. Actuators B Chem. 2015, 207, 526–534. [Google Scholar] [CrossRef]
  16. Wang, W.S.; Zhen, L.; Shao, W.Z.; Chen, Z.L. Sodium Chloride Induced Formation of Square-Shaped Cadmium Molybdate Nanoplates. Mater. Lett. 2014, 131, 292–294. [Google Scholar] [CrossRef]
  17. Nisha, K.D.; Navaneethan, M.; Hayakawa, Y.; Ponnusamy, S.; Muthamizhchelvan, C. Influence of Lanthanide Ion on the Morphology and Luminescence Properties of Cadmium Sulphide Nanocrystals. J. Alloys Compd. 2011, 509, 5816–5821. [Google Scholar] [CrossRef]
  18. Gupta, N.; Pal, B. The Synthesis, Structure, Optical and Photocatalytic Properties of Silica-Coated Cadmium Sulfide Nanocomposites of Different Shapes. J. Colloid. Interface Sci. 2012, 368, 250–256. [Google Scholar] [CrossRef]
  19. Vanalakar, S.A.; Mali, S.S.; Pawar, R.C.; Tarwal, N.L.; Moholkar, A.V.; Kim, J.A.; Kwon, Y.B.; Kim, J.H.; Patil, P.S. Synthesis of Cadmium Sulfide Spongy Balls with Nanoconduits for Effective Light Harvesting. Electrochim. Acta 2011, 56, 2762–2768. [Google Scholar] [CrossRef]
  20. Zhiyue, H.; Jingchang, Z.; Xiuying, Y.; Weiliang, C. Synthesis and Application in Solar Cell of Poly(3-Octylthiophene)/Cadmium Sulfide Nanocomposite. Sol. Energy Mater. Sol. Cells 2011, 95, 483–490. [Google Scholar] [CrossRef]
  21. Alvarado Rivera, J.; Pérez Hernández, C.G.; Zayas, M.E.; Álvarez, E. Nanocrystallization of the Cd3Al2Ge3O12 Garnet in Glasses of the CdO-TeO2-GeO2 System. In Advances in Glass Science and Technology; IntechOpen: London, UK, 2018; pp. 39–59. [Google Scholar]
  22. Medrano-Pesqueira, C.L.; Rodríguez-Carvajal, D.A. Structural Properties of Poly-Crystals Embedded in Glassy Matrix of the Ternary System CdO-TeO2-GeO2. J. Non-Cryst. Solids 2017, 475, 15–24. [Google Scholar] [CrossRef]
  23. Pérez Hernández, C.G. Síntesis de Nanoestructuras de Cd3Al2Ge3O12 Por La Técnica de Fusión de Polvos En Materiales Vítreos de La Matriz CdO-TeO2-GeO2 Con Propiedades Luminiscentes. Master’s Thesis, Universidad de Sonora, Hermosillo, Mexico, 2016. [Google Scholar]
  24. Rodríguez-Carvajal, D.A.; Meza-Rocha, A.N.; Caldiño, U.; Lozada-Morales, R.; Álvarez, E.; Zayas, M.E. Reddish-Orange, Neutral and Warm White Emissions in Eu3+, Dy3+ and Dy3+/Eu3+ Doped CdO-GeO2-TeO2 Glasses. Solid State Sci. 2016, 61, 70–76. [Google Scholar] [CrossRef]
  25. Mohammad, E.; Dariush, S. Study of Optical Absorption and Optical Band Gap Determination of Thin Amorphous TeO2–V2O5–MoO3 Blown Films. Indian J. Pure Appl. Phys. 2006, 44, 468–472. [Google Scholar]
  26. Hussin, R.; Leong, N.S.; Alias, N.S. Structural Investigation of Crystalline Host Phosphor Cadmium Tellurite Systems. J. Fundam. Sci. 2009, 5, 17–27. [Google Scholar] [CrossRef]
  27. JCPDS 76-1007; Cadmium Tellurate Cd3TeO6. Inorganic Crystal Structure Database, International Union of Crystallography: Chester, England, 2019.
  28. JCPDS 75-0591; Monteponite, syn CdO. Inorganic Crystal Structure Database, International Union of Crystallography: Chester, England, 2019.
  29. Lesniak, M.; Zeid, J.; Starzyk, B.; Kochanowicz, M.; Kuwik, M.; Zmojda, J.; Miluski, P.; Baranowska, A.; Dorosz, J.; Pisarski, W.; et al. Investigation of the TeO2GeO2 Ratio on the Spectroscopic Properties of Eu3+-Doped Oxide Glasses for Optical Fiber Application. Materials 2022, 15, 117. [Google Scholar] [CrossRef]
  30. Koroleva, O.N.; Korobatova, N.M.; Shtenberg, M.V.; Ivanova, T.N. Structure of Glasses of the Li2O–K2O–GeO2 System: Raman Spectroscopic Data. Geochem. Int. 2019, 57, 331–340. [Google Scholar] [CrossRef]
  31. Jha, A.; Shen, S.; Naftaly, M. Structural Origin of Spectral Broadening of 1.5-Μm Emission in Er3+-Doped Tellurite Glasses. Phys. Rev. B 2000, 62, 6215–6227. [Google Scholar] [CrossRef]
  32. Hegazy, H.H.; Almojadah, S.; Reben, M. Absorption Spectra and Raman Gain Coefficient in Near-IR Region of Er3+ Ions Doped TeO2– Nb2O5–Bi2O3–ZnO Glasses. Opt. Laser Technol. 2015, 74, 138–144. [Google Scholar] [CrossRef]
  33. Senthil Murugan, G.; Ohishi, Y. Raman Spectroscopic Studies of TeO2-BaO-SrO-Nb2O5 Glasses: Structure-Property Correlations. J. Appl. Phys. 2004, 96, 2437–2442. [Google Scholar] [CrossRef]
  34. Murugan, G.S.; Ohishi, Y. Structural and Physical Properties of a Novel TeO2-BaO-SrO-Ta2O5 Glass System for Photonic Device Applications. J. Non-Cryst. Solids 2005, 351, 364–371. [Google Scholar] [CrossRef]
  35. Carrillo-Torres, R.C.; Saavedra-Rodríguez, G.; Alvarado-Rivera, J.; Caldiño, U.; Sánchez-Zeferino, R.; Alvarez-Ramos, M.E. Tunable Emission and Energy Transfer in TeO2-GeO2-ZnO and TeO2-GeO2-MgCl2 Glasses Activated with Eu3+/Dy3+ for Solid State Lighting Applications. J. Lumin. 2019, 212, 116–125. [Google Scholar] [CrossRef]
  36. Alvarado-Rivera, J.; Rodríguez-Carvajal, D.A.; Acosta-Enríquez, M.d.C.; Manzanares-Martínez, M.B.; Álvarez, E.; Lozada-Morales, R.; Díaz, G.C.; de Leon, A.; Zayas, M.E. Effect of CeO2 on the Glass Structure of Sodium Germanate Glasses. J. Am. Ceram. Soc. 2014, 97, 3494–3500. [Google Scholar] [CrossRef]
  37. Yadav, A.K.; Singh, P. A Review of the Structures of Oxide Glasses by Raman Spectroscopy. RSC Adv. 2015, 5, 67583–67609. [Google Scholar] [CrossRef]
  38. Kumar Ramamoorthy, R.; Bhatnagar, A.K. Effect of ZnO and PbO/ZnO on Structural and Thermal Properties of Tellurite Glasses. J. Alloys Compd. 2015, 623, 49–54. [Google Scholar] [CrossRef]
  39. Dewan, N.; Sreenivas, K.; Gupta, V. Properties of Crystalline γ-TeO2 Thin Film. J. Cryst. Growth 2007, 305, 237–241. [Google Scholar] [CrossRef]
  40. Sekiya, T.; Mochida, N.; Ohtsuka, A. Raman Spectra of MO–TeO2 (M = Mg, Sr, Ba and Zn) Glasses. J. Non-Cryst. Solids 1994, 168, 106–114. [Google Scholar] [CrossRef]
  41. Franco, D.F.; Fernandes, R.G.; Felix, J.F.; Mastelaro, V.R.; Eckert, H.; Afonso, C.R.M.; Messaddeq, Y.; Messaddeq, S.H.; Morency, S.; Nalin, M. Fundamental Studies of Magneto-Optical Borogermanate Glasses and Derived Optical Fibers Containing Tb3+. J. Mater. Res. Technol. 2021, 11, 312–327. [Google Scholar] [CrossRef]
  42. Dousti, M.R.; Sahar, M.R.; Amjad, R.J.; Ghoshal, S.K.; Awang, A. Surface Enhanced Raman Scattering and Up-Conversion Emission by Silver Nanoparticles in Erbium-Zinc-Tellurite Glass. J. Lumin. 2013, 143, 368–373. [Google Scholar] [CrossRef]
  43. García-Amaya, I.V.; Zayas, M.E.; Alvarado-Rivera, J.; Cortez-Valadez, M.; Pérez-Tello, M.; Cayetano-Castro, N.; Martínez-Suárez, F.; Mendoza-Córdova, A. Influence of Eu2O3 on Phase Crystallization and Nanocrystals Formation in Tellurite Glasses. J. Non-Cryst. Solids 2018, 499, 49–57. [Google Scholar] [CrossRef]
  44. Reza Dousti, M.; Sahar, M.R.; Ghoshal, S.K.; Amjad, R.J.; Samavati, A.R. Effect of AgCl on Spectroscopic Properties of Erbium Doped Zinc Tellurite Glass. J. Mol. Struct. 2013, 1035, 6–12. [Google Scholar] [CrossRef]
  45. Ghribi, N.; Dutreilh-Colas, M.; Duclère, J.; Hayakawa, T.; Carreaud, J.; Karray, R.; Kabadou, A. Thermal, Optical and Structural Properties of Glasses within the TeO2–TiO2–ZnO System. J. Alloys Compd. 2015, 622, 333–340. [Google Scholar] [CrossRef]
  46. Sahar, M.R.; Sulhadi, K.; Rohani, M.S. The Preparation and Structural Studies in the (80–x)TeO2–20ZnO–(x) Er2O3 Glass System. J. Non-Cryst. Solids 2008, 354, 1179–1181. [Google Scholar] [CrossRef]
  47. Noguera, O.; Smirnov, M.; Mirgorodsky, A.P.; Merle-Méjean, T.; Thomas, P.; Champarnaud-Mesjard, J.C. Ab Initio Study of the Polymer Molecules (TeO2)n as Model Systems for the Local Structure in TeO2 Glass. Phys. Rev. B 2003, 68, 094203. [Google Scholar] [CrossRef]
  48. Noguera, O.; Merle-Méjean, T.; Mirgorodsky, A.P.; Smirnov, M.B.; Thomas, P.; Champarnaud-Mesjard, J.C. Vibrational and Structural Properties of Glass and Crystalline Phases of TeO2. J. Non-Cryst. Solids 2003, 330, 50–60. [Google Scholar] [CrossRef]
  49. Champarnaud-Mesjard, J.C.; Blanchandin, S.; Thomas, P.; Mirgorodsky, A.; Merle-Mejean, T.; Frit, B. Crystal Structure, Raman Spectrum and Lattice Dynamics of a New Metastable Form of Tellurium Dioxide: γ–TeO2. J. Phys. Chem. Solids 2000, 61, 1499–1507. [Google Scholar] [CrossRef]
  50. Plotnichenko, V.G.; Koltashev, V.V.; Sokolov, V.O.; Popova, N.V.; Grishin, I.A.; Churbanov, M.F. Spectroscopic Properties of New BaCl2-BaO-TeO2 Tellurite Glasses for Fibre and Integrated Optics Applications. J. Phys. D Appl. Phys. 2008, 41, 015404. [Google Scholar] [CrossRef]
  51. Zhang, F.; Zhang, H.; Dong, G.; Qiu, J. Embedded Nanogratings in Germanium Dioxide Glass Induced by Femtosecond Laser Direct Writing. J. Opt. Soc. Am. B 2014, 31, 860–864. [Google Scholar] [CrossRef]
  52. Kang, S.; Xiao, X.; Pan, Q.; Chen, D.; Qiu, J.; Dong, G. Spectroscopic Properties in Er3+-Doped Germanotellurite Glasses and Glass Ceramics for Mid-Infrared Laser Materials. Sci. Rep. 2017, 7, 43186. [Google Scholar] [CrossRef]
  53. Parveen, N.; Jali, V.M.; Patil, S.D. Structure and Optical Properties of TeO2-GeO2 Glasses. Int. J. Adv. Sci. Eng. Technol. 2016, 4, 80–85. [Google Scholar]
  54. Tagiara, N.S.; Palles, D.; Simandiras, E.D.; Psycharis, V.; Kyritsis, A.; Kamitsos, E.I. Synthesis, Thermal and Structural Properties of Pure TeO2 Glass and Zinc-Tellurite Glasses. J. Non-Cryst. Solids 2017, 457, 116–125. [Google Scholar] [CrossRef]
  55. Barz, A.; Haase, T.; Meyer, K.; Stachel, D. Corrosion of Crucible Materials and Their Influence on Structure of Phosphate Glasses. Phosphorus Res. Bull. 1996, 6, 331–335. [Google Scholar] [CrossRef] [PubMed]
  56. Dos Santos, I.M.G.; Moreira, R.C.M.; de Souza, A.G.; Paskocimas, C.A.; Leite, E.R.; Varela, J.A.; Longo, E. Corrosión En Crisol Cerámico Por Vidrios de Óxidos de Metales Pesados, Parte I: Estudio Fenomenológico Fecha. InterCeram Int. Ceram. Rev. 2003, 52, 198–205. [Google Scholar]
  57. Langer, D.W.; Vesely, C.J. Electronic Core Levels of Zinc Chalcogenides. Phys. Rev. B 1970, 2, 4885–4892. [Google Scholar] [CrossRef]
  58. Scrocco, M. X-Ray and Electron-Energy-Loss Spectra of Bi, Sb, Te and Bi2Te3, Sb2Te3 Chalcogenides. J. Electron. Spectros Relat. Phenom. 1990, 50, 171–184. [Google Scholar] [CrossRef]
  59. Molle, A.; Spiga, S.; Fanciulli, M. Stability and Interface Quality of GeO2 Films Grown on Ge by Atomic Oxygen Assisted Deposition. J. Chem. Phys. 2008, 129, 011104. [Google Scholar] [CrossRef]
  60. Kumar, S.; Singh, D.; Thangaraj, R. XPS Study of Thermally Evaporated Ge-Sb-Te Amorphous Thin Films. AIP Conf. Proc. 2011, 1393, 141–142. [Google Scholar] [CrossRef]
  61. Wang, P.W.; Qi, Y.; Henderson, D.O. Oxygen Bonding in GeO2 Glass. J. Non-Cryst. Solids 1998, 224, 31–35. [Google Scholar] [CrossRef]
  62. Moholkar, A.V.; Agawane, G.L.; Sim, K.U.; Kwon, Y.B.; Choi, D.S.; Rajpure, K.Y.; Kim, J.H. Temperature Dependent Structural, Luminescent and XPS Studies of CdO:Ga Thin Films Deposited by Spray Pyrolysis. J. Alloys Compd. 2010, 506, 794–799. [Google Scholar] [CrossRef]
  63. Dahivade, P.B.; Pawar, S.N.; Pathan, H.M.; Lokhande, B.J. Temperature-Dependent Hydrothermal Synthesis of CdO Nanoparticles and Its Analysis for Supercapacitor Application. ES Energy Environ. 2024, 24, 1098. [Google Scholar] [CrossRef]
  64. Alam, A.E.; Ojo, A.A.; Jasinski, J.B.; Dharmadasa, I.M. Magnesium Incorporation in N-CdTe to Produce Wide Bandgap p-Type CdTe:Mg Window Layers. ChemEngineering 2018, 2, 59. [Google Scholar] [CrossRef]
  65. Larink, D.; Eckert, H. Mixed Network Former Effects in Tellurite Glass Systems: Structure/Property Correlations in the System (Na2O)1/3[(2TeO2)x(B2O3)1 − x]2/3. J. Non-Cryst. Solids 2015, 426, 150–158. [Google Scholar] [CrossRef]
  66. Zeng, C.; Ramos-Ruiz, A.; Field, J.A.; Sierra-Alvarez, R. Cadmium Telluride (CdTe) and Cadmium Selenide (CdSe) Leaching Behavior and Surface Chemistry in Response to PH and O2. J. Environ. Manag. 2015, 154, 78–85. [Google Scholar] [CrossRef] [PubMed]
  67. Lozano, G.; Marega, E., Jr.; Rivera, V.A. XPS Analysis of Bridging and Non-Bridging Oxygen in Yb3+-Er3+-Tm3+-Doped Zinc-Tellurite Glasses. J. Non-Cryst. Solids 2021, 553, 120520. [Google Scholar] [CrossRef]
  68. Chowdari, B.V.R.; Kumari, R. Structure and Ionic Conduction in the Ag2O·WO3·TeO2 Glass System. J. Mater. Sci. 1998, 33, 3591–3599. [Google Scholar] [CrossRef]
  69. Bartolo-Pérez, P.; Farías, M.H.; Castro-Rodríguez, R.; Peña, J.L. XPS Analysis of Oxidation States of Te in CdTe Oxide Films Grown by Rf Sputtering with an Ar-NH3 Plasma. Superf. Vacío 2001, 12, 8–11. [Google Scholar]
  70. Mekki, A.; Khattak, G.D.; Wenger, L.E. XPS and Magnetic Studies of Vanadium Tellurite Glassses. J. Electron. Spectros Relat. Phenom. 2009, 175, 21–26. [Google Scholar] [CrossRef]
  71. Qing-Hui, L.; Dong-Hong, G.; Fu-Xi, G. Short-Wavelength Recording Properties of TeOx Thin Films. Chin. Phys. Lett. 2004, 21, 320–323. [Google Scholar] [CrossRef]
  72. Clabel, H.J.L.; Valverde, J.V.P.; Lozano, C.G.; Marega, E.; Mastelaro, V.R.; Mendonça, C.R. Nonlinear Optical Properties of La3+-Doped Tellurite-Zinc Glasses: Impact of Chemical Bonding and Physical Properties via Raman and XPS. Ceram. Int. 2024, 51, 844–855. [Google Scholar] [CrossRef]
  73. Sk, R.K.; Ansari, G.F.; Kumar, S.; Sathish, N.; Mudgal, M.; Ashiq, M. Structural, Thermal and X-Ray Photoelectron Spectroscopic Properties of Boro-Tellurite Based Quaternary Glass System. Opt. Mater. 2024, 156, 115989. [Google Scholar] [CrossRef]
  74. Xu, M.; Li, J.; Yang, Q.; Jiang, L.; He, J.; He, D.; Wang, Y.; Yang, Y. Morphology-Controlled Green Synthesis of Tellurium Nanostructures and Applications of Te/MXene Hybrid Structures. Mater. Adv. 2023, 4, 5668–5673. [Google Scholar] [CrossRef]
  75. Kamalaker, V.; Chanakya, N.; Madhuri, J.H.; Jahangeer, N.; Maheshwar Reddy, M.; Ramesh, C.; Muralikrishna, P.; Upender, G. Influence of Nb5+ and La3+ Ions on Physical Properties of the Quaternary TeO2-ZnO-Nb2O5-La2O3 Glass System. Ceram. Int. 2024, 50, 41472–41482. [Google Scholar] [CrossRef]
  76. Wang, P.; Cui, Y.; Zhao, S.; Ye, R.; Cai, M.; Calve, L.; Rocherulle, J.; Huang, F.; Ma, H.; Bai, G.; et al. Effects of Melting Temperature on Color-Changing in Germano-Tellurite Niobate Glass. Opt Laser Technol 2022, 156, 108627. [Google Scholar] [CrossRef]
  77. Dzhagan, V.; Mazur, N.; Kapush, O.; Selyshchev, O.; Karnaukhov, A.; Yeshchenko, O.A.; Danylenko, M.I.; Yukhymchuk, V.; Zahn, D.R.T. Core and Shell Contributions to the Phonon Spectra of CdTe/CdS Quantum Dots. Nanomaterials 2023, 13, 921. [Google Scholar] [CrossRef] [PubMed]
  78. Ukarande, A.; Sonawane, S.M.; Chaure, S.; Chaure, N.B. Wet-Electrochemical Growth of CdTe Layers for Photovoltaic Applications. J. Mater. Sci. Mater. Electron. 2022, 33, 22456–22468. [Google Scholar] [CrossRef]
  79. Tarasov, A.S.; Mikhailov, N.N.; Dvoretsky, S.A.; Menshchikov, R.V.; Uzhakov, I.N.; Kozhukhov, A.S.; Fedosenko, E.V.; Tereshchenko, O.E. Preparation of Atomically Clean and Structurally Ordered Surfaces of Epitaxial CdTe Films for Subsequent Epitaxy. Semiconductors 2021, 55, S62–S66. [Google Scholar] [CrossRef]
  80. Hart, R.T.; Zwanziger, J.W.; Werner-Zwanziger, U.; Yates, J.R. On the Spectral Similarity of Bridging and Nonbridging Oxygen in Tellurites. J. Phys. Chem. A 2005, 109, 7636–7641. [Google Scholar] [CrossRef]
  81. Tauc, J. Optical Properties of Amorphous Semiconductors. In Amorphous and Liquid Semiconductors; Plenum Publishing Company Ltd.: Rhode, Island, 1974; pp. 159–220. ISBN 9781467344791. [Google Scholar]
  82. El-Samanoudy, M.M.; Sabry, A.I.; Shaisha, E.E.; Bahgat, A.A. Optical and Infrared Spectra of Glasses in the TeO2-GeO2-Fe2O3 System. Phys. Chem. Glas. 1991, 32, 115–120. [Google Scholar]
  83. Japari, S.J.; Sayyed, M.I.; Yahya, A.K.; Anis, A.L.; Iskandar, S.M.; Zaid, M.H.M.; Azlan, M.N.; Hisam, R. Effects of Na2O on Optical and Radiation Shielding Properties of XNa2O-(20-x)K2O-30V2O550TeO2Mixed Alkali Glasses. Results Phys. 2021, 22, 103946. [Google Scholar] [CrossRef]
  84. Sadeq, M.S.; Morshidy, H.Y. Effect of Mixed Rare-Earth Ions on the Structural and Optical Properties of Some Borate Glasses. Ceram. Int. 2019, 45, 18327–18332. [Google Scholar] [CrossRef]
  85. Ramachari, D.; Yang, C.S.; Wada, O.; Uchino, T.; Pan, C.L. High-Refractive Index, Low-Loss Oxyfluorosilicate Glasses for Sub-THz and Millimeter Wave Applications. J. Appl. Phys. 2019, 125, 151609. [Google Scholar] [CrossRef]
  86. Lozada-Morales, R.; Hernández-Rodríguez, M.F.; Rubio-Rosas, E.; Espinosa-Cerón, Y.; Meza-Rocha, A.N.; Zayas, M.E.; Licona-Ibarra, R.; Carmona-Téllez, S. Glass Formation Area of the CdO-CuCl2-V2O5 Ternary System: Optical Properties as a Function of CuCl2 Content. J. Non-Cryst. Solids 2021, 566, 120896. [Google Scholar] [CrossRef]
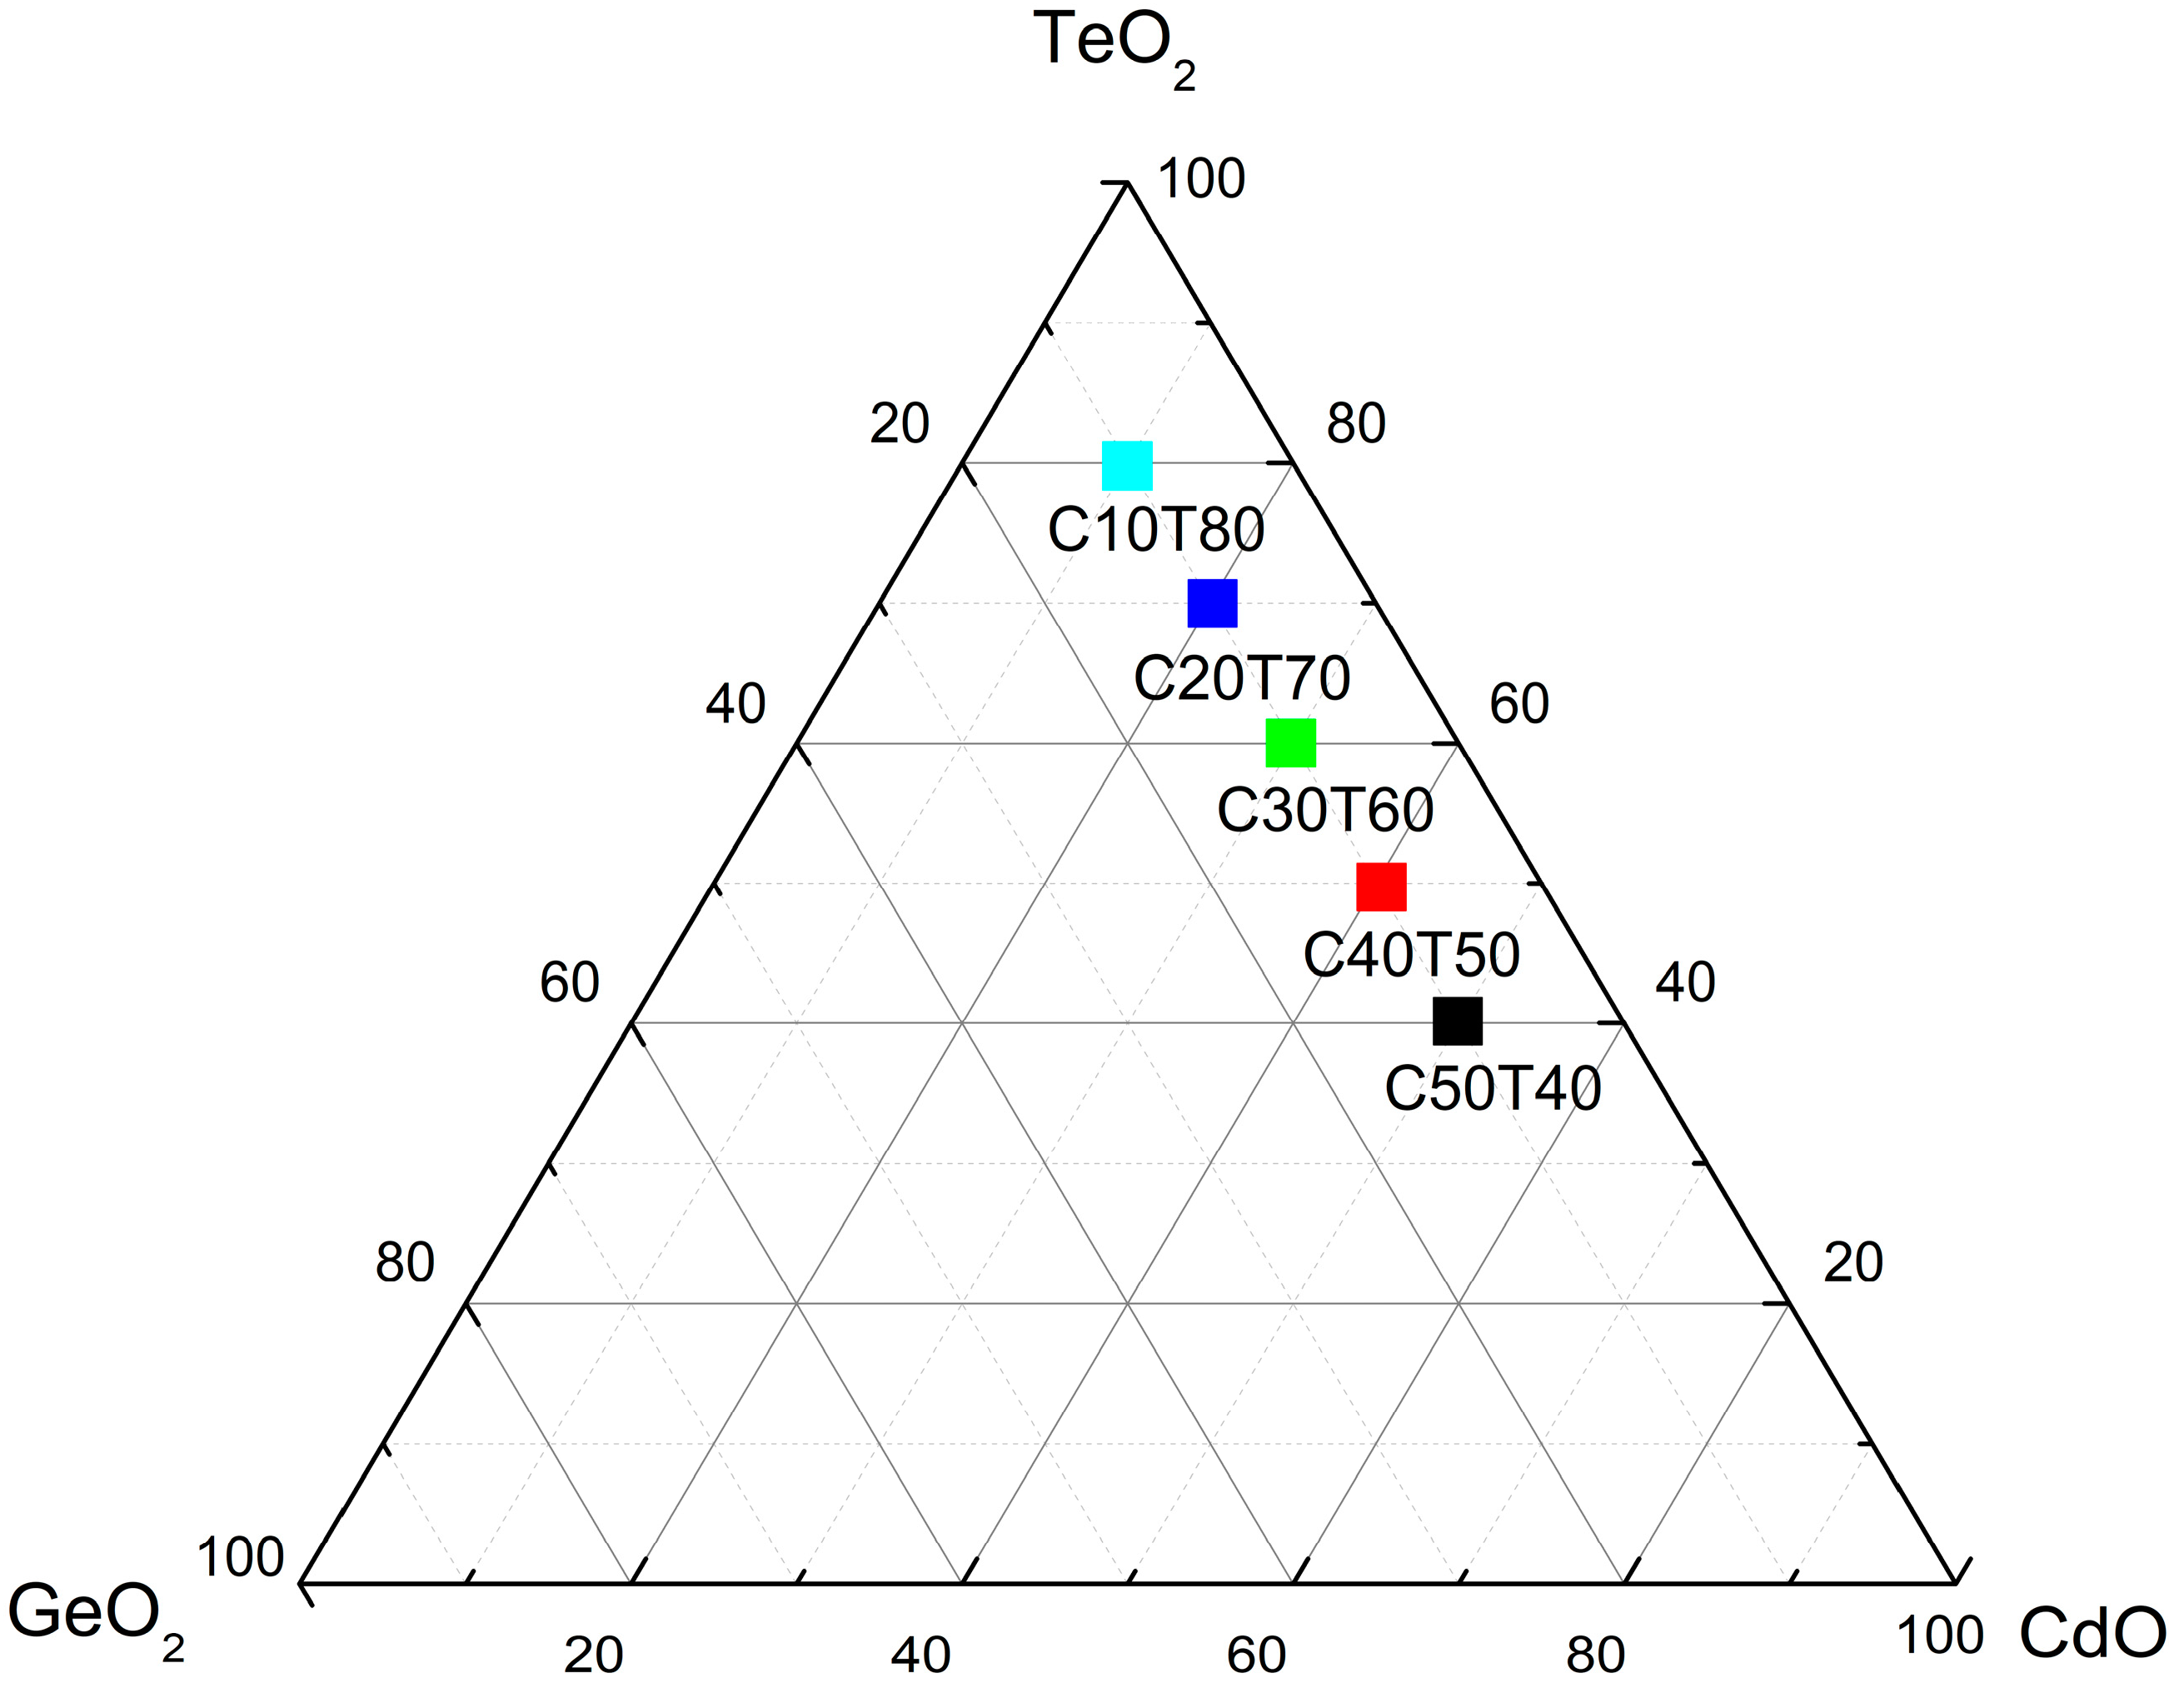
Figure 1. Gibbs triangle showing the compositions of the raw materials used in the present study.
Materials 18 01739 g001
Figure 2. X-ray diffraction patterns of samples.
Materials 18 01739 g002
Figure 3. Raman spectra of samples C50T40-C10T80 showing the low and high frequency regions as discussed in the text.
Materials 18 01739 g003
Figure 4. Deconvolution Raman spectra of C50T40-C10T80 high frequency regions.
Materials 18 01739 g004
Figure 5. XPS scan of fabricated glasses presenting the photoelectron peaks related to the elements that constitute the glasses; the inset shows the region from 150 to 0 eV where the Ge 3d peak appears as well as the Al 2p for some samples.
Materials 18 01739 g005
Figure 6. High-resolution XPS spectra of (a) Cd 3d5/2 and Cd 3d3/2, (b) Ge 3d, and (c) Te 3d5/2 and Te 3d3/2; and (d) O 1s photoelectron peaks of all glass samples.
Materials 18 01739 g006
Figure 7. Curve fitting of (a) Ge 3d and (b) Cd 3d doublet high-resolution spectra.
Materials 18 01739 g007
Figure 8. Curve fitting of Te 3d.
Materials 18 01739 g008
Figure 9. O 1s peaks of all samples.
Materials 18 01739 g009
Figure 10. Plot of ( h ν α ) 1 / 2 versus photon energy ( h ν ) for the samples C50T40-C10T80, as is indicated. The straight line segment represents the best linear fitting of the absorption edge to the energy axis.
Materials 18 01739 g010
Table 2. Results from curve fitting of high-resolution XPS spectra of Ge 3d, Cd 3d5/2, Cd 3d3/2, Te 3d5/2, and Te 3d3/2 peaks.
GlassGe 3dCdTe
3d5/23d3/23d5/23d3/2
eVFWHMeVFWHMeVFWHMeVFWHMeVFWHM
C50T4032.42.24405.21.65411.91.70573.12.13583.5 2.28
576.21.65586.6 1.79
C40T5032.21.97404.21.37410.91.44573.0253583.2 2.26
404.91.42411.61.495761.75586.4 1.80
C30T6032.52.44405.11.51411.81.6573.32.13583.752.31
576.21.81586.6 1.72
C20T7032.72.08405.21.66411.91.71573.52.13583.82.12
576.31.78586.81.85
C10T8033.25405.851.75412.61.71573.852.02584.252.21
575.82.02586.22.10
577.31.80587.751.92
Table 3. Results from O 1s curve fitting of all glasses.
GlassComponentBinding Energy
(eV)
FWHM
(eV)
Area
(%)
C50T40OI
OII
530.4
531.9
1.96
1.97
75.9
24.1
C40T50OI
OII
530.3
531.8
1.78
1.63
89.0
11.0
C30T60OI
OII
530.6
532.5
2.13
2.03
80.7
19.3
C20T70OI
OII
530.7
532.0
1.96
1.78
76.9
23.1
C10T80OI
OII
530.6
531.5
1.99
3.23
15.0
85.0
Table 4. Optical band gap and refractive index values obtained for the glass samples.
Sample E g (eV) n
C50T402.682.489
C40T502.872.432
C30T602.772.461
C20T702.332.605
C10T802.322.609
Disclaimer/Publisher’s Note: The statements, opinions and data contained in all publications are solely those of the individual author(s) and contributor(s) and not of MDPI and/or the editor(s). MDPI and/or the editor(s) disclaim responsibility for any injury to people or property resulting from any ideas, methods, instructions or products referred to in the content.