
Microstructural Analysis of Sand Reinforced by EICP Combined with Glutinous Rice Slurry Based on CT Scanning


Abstract
1. Introduction
2. Materials and Methods
2.1. Materials
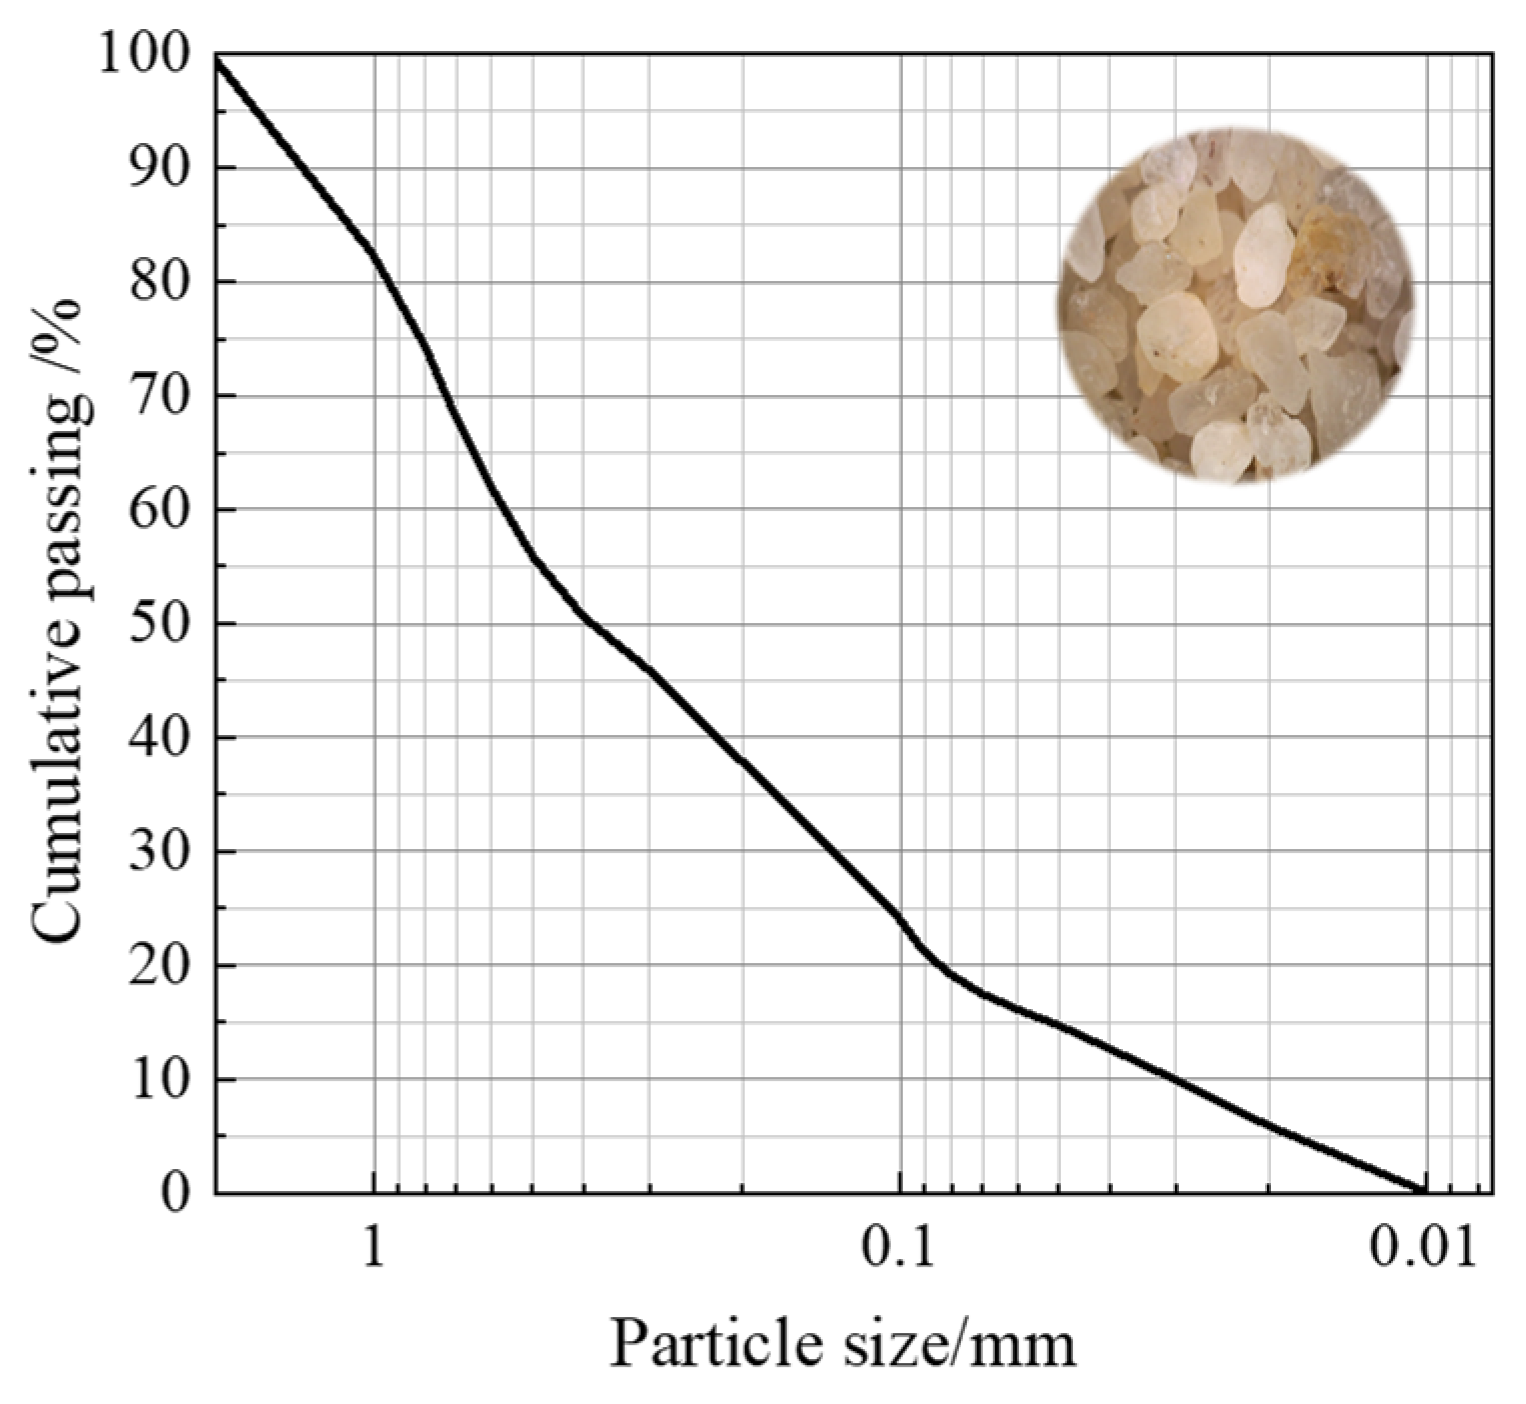
2.1.1. Soil
2.1.2. EICP Solution
2.1.3. Glutinous Rice Slurry
2.2. Specimen Preparation
2.3. Experimental Design
2.4. FTIR Test Processing
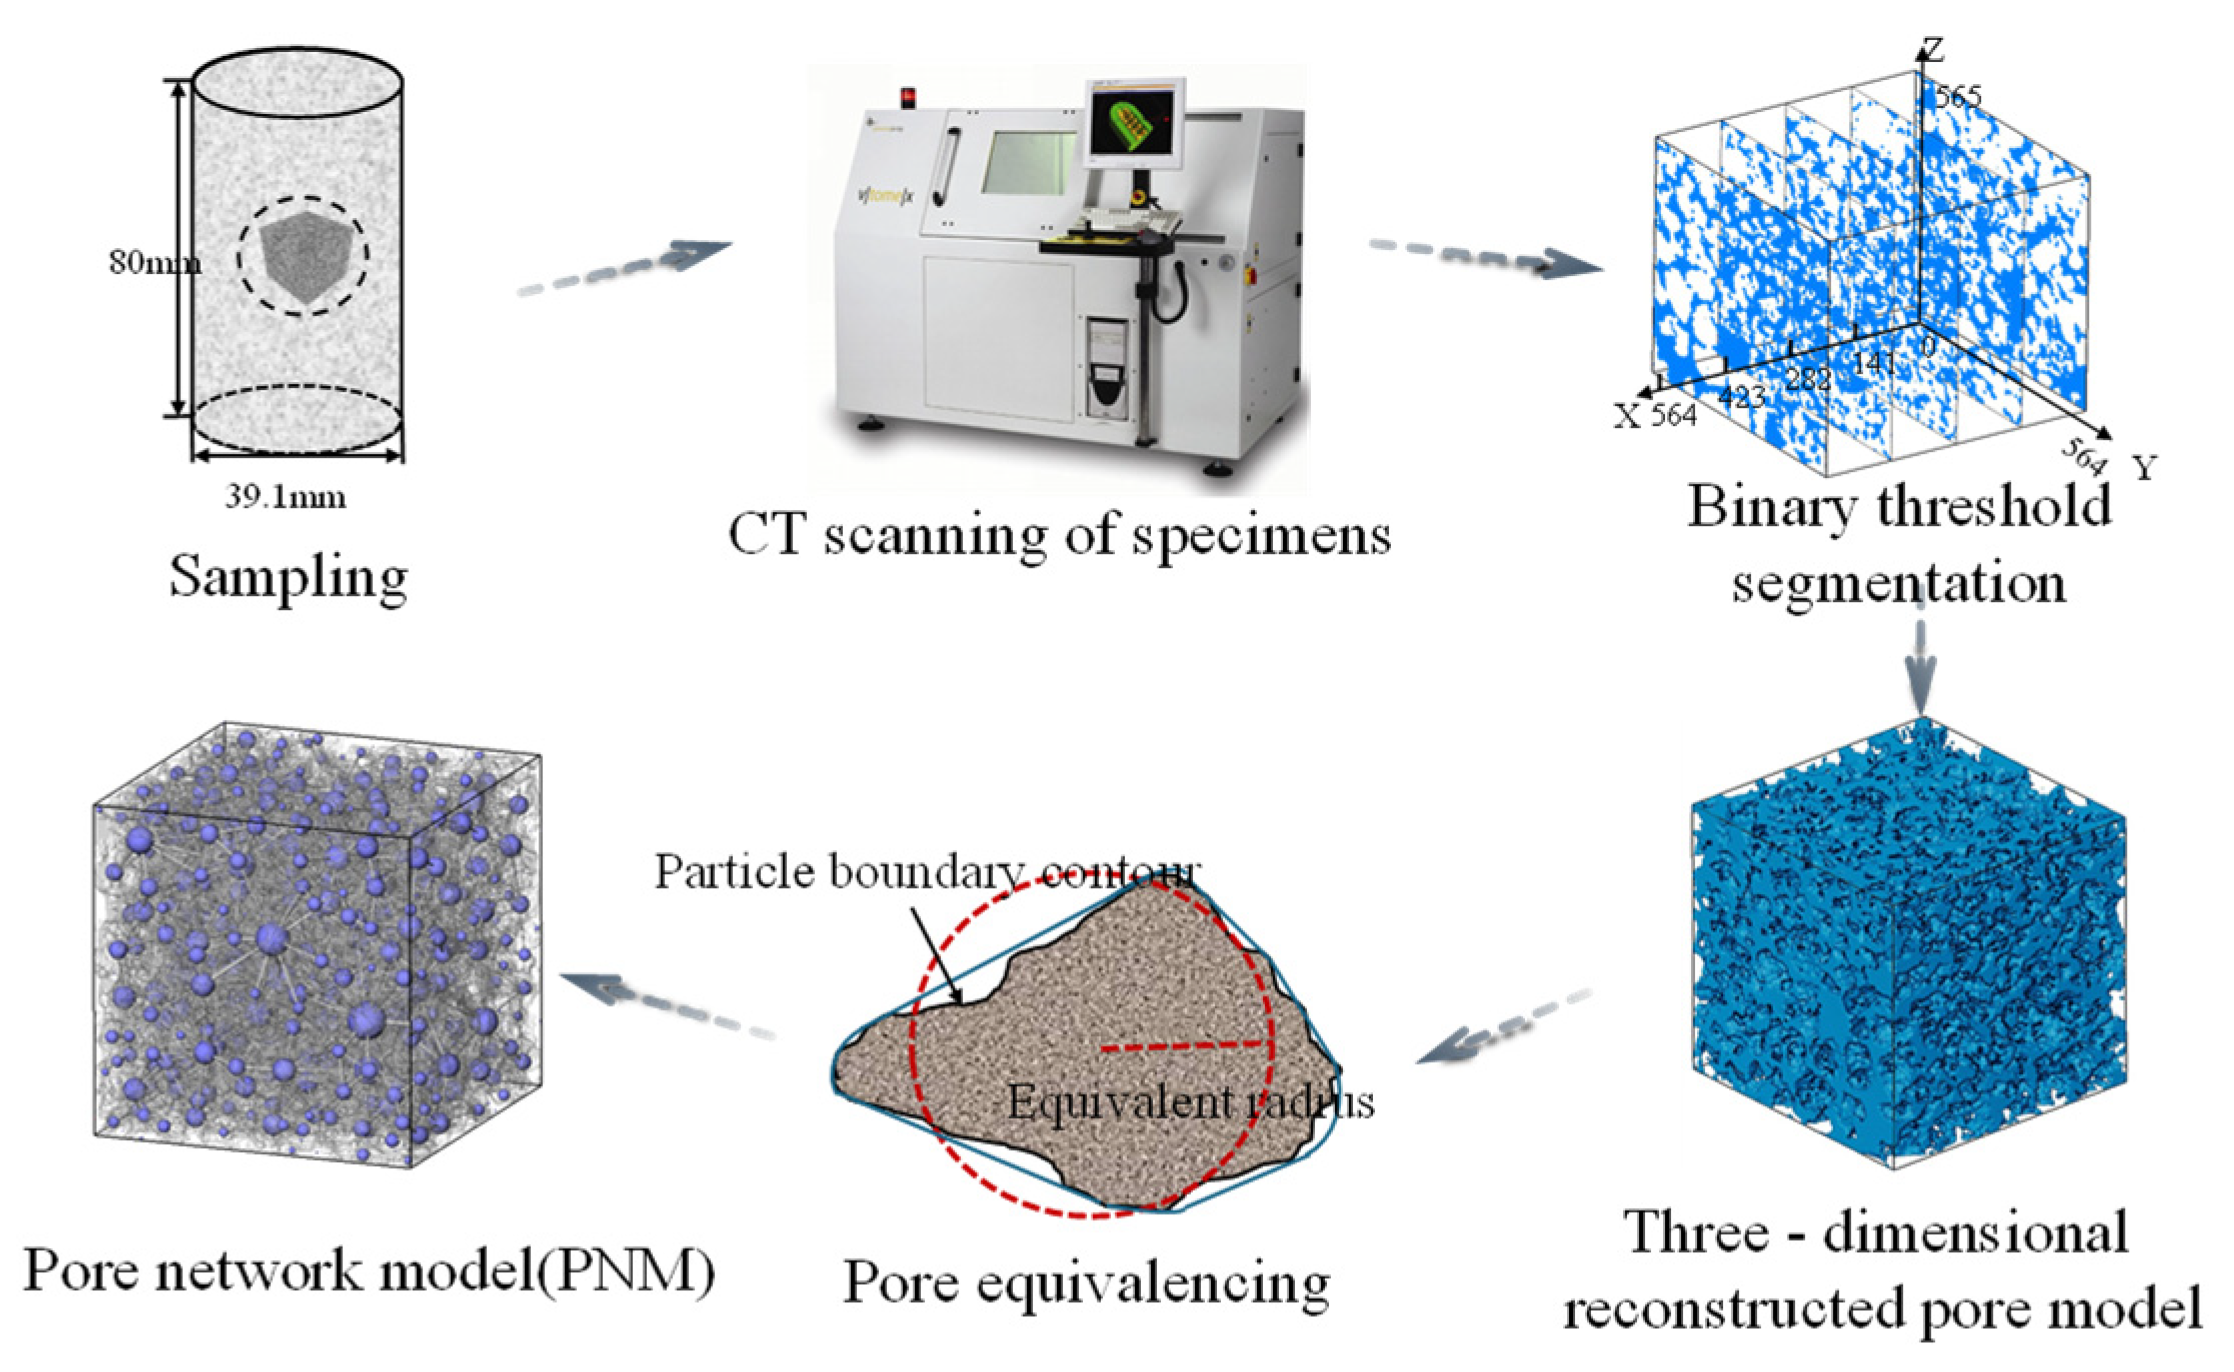
2.5. CT Test Processing and Analysis
- Contrast Enhancement: The image contrast was optimized to amplify the structural distinctions between the solid particles and air-filled pores, thereby improving phase differentiation for subsequent analyses.
- Threshold Segmentation: The Interactive Threshold module was applied to binarize CT slice images, enabling the precise identification of solid particles and pore spaces.
- 3D Reconstruction: The selected voxel regions were projected onto 2D planes, followed by volumetric stacking to reconstruct the 3D pore architecture of the soil matrix.
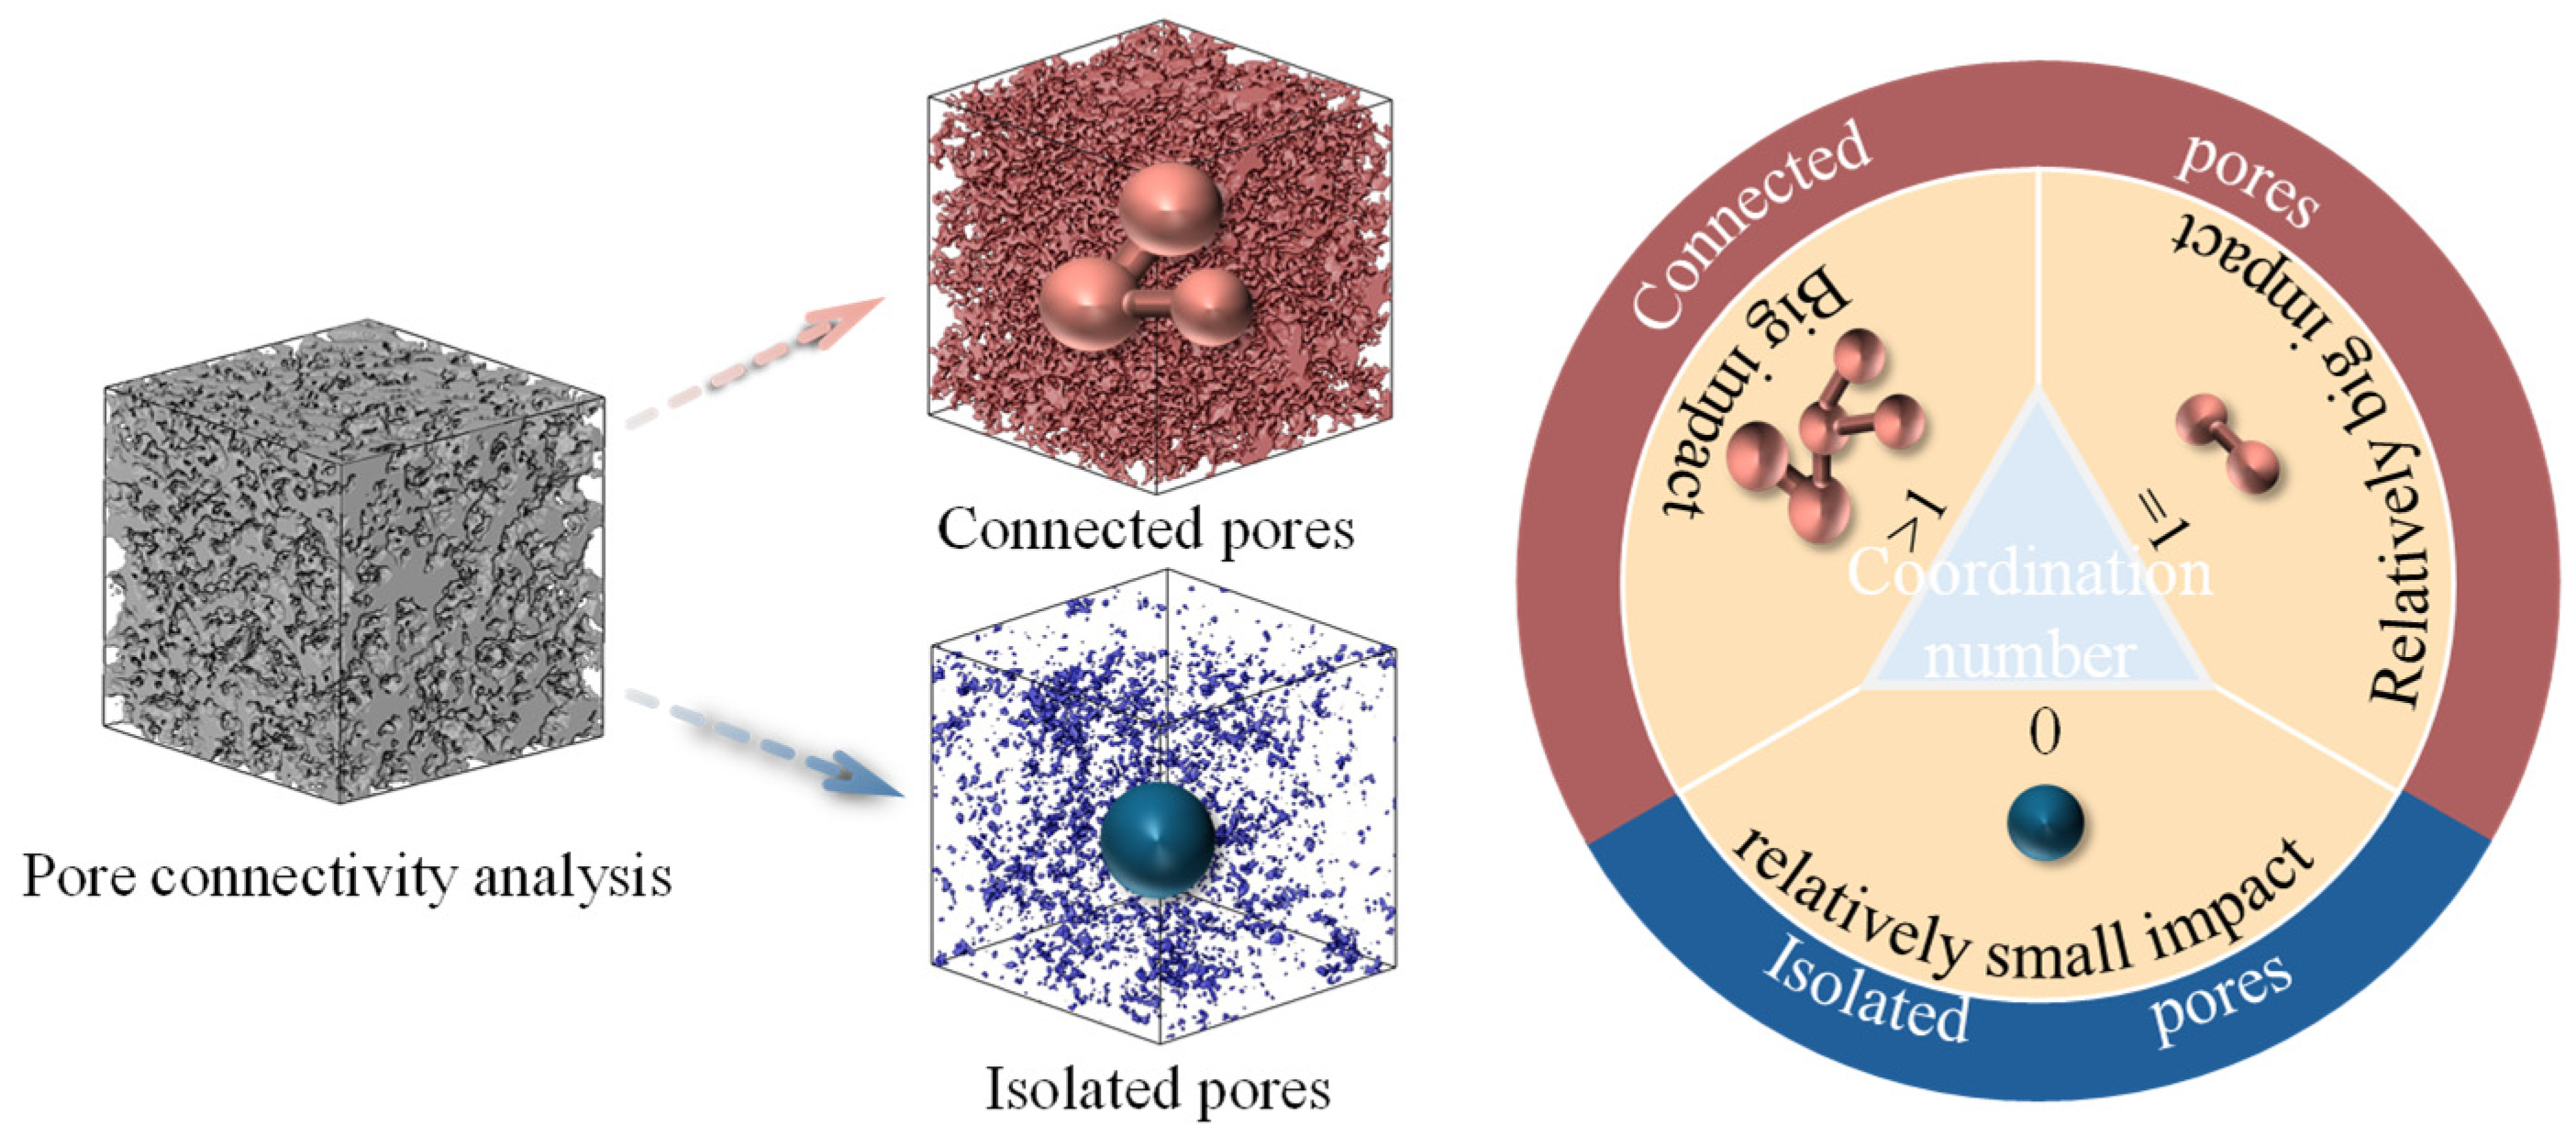
- Coordination number > 1: Connected pores adopt a tree-like structure, which is characteristic of branched, high-connectivity networks.
- Coordination number = 1: The pores exhibit a dumbbell-shaped structure, representing linear connections between two adjacent pores.
- Coordination number = 0: Pores exist as isolated entities, contributing negligibly to permeability or strength.
3. Results and Discussion
3.1. Analysis of Permeability Test Results
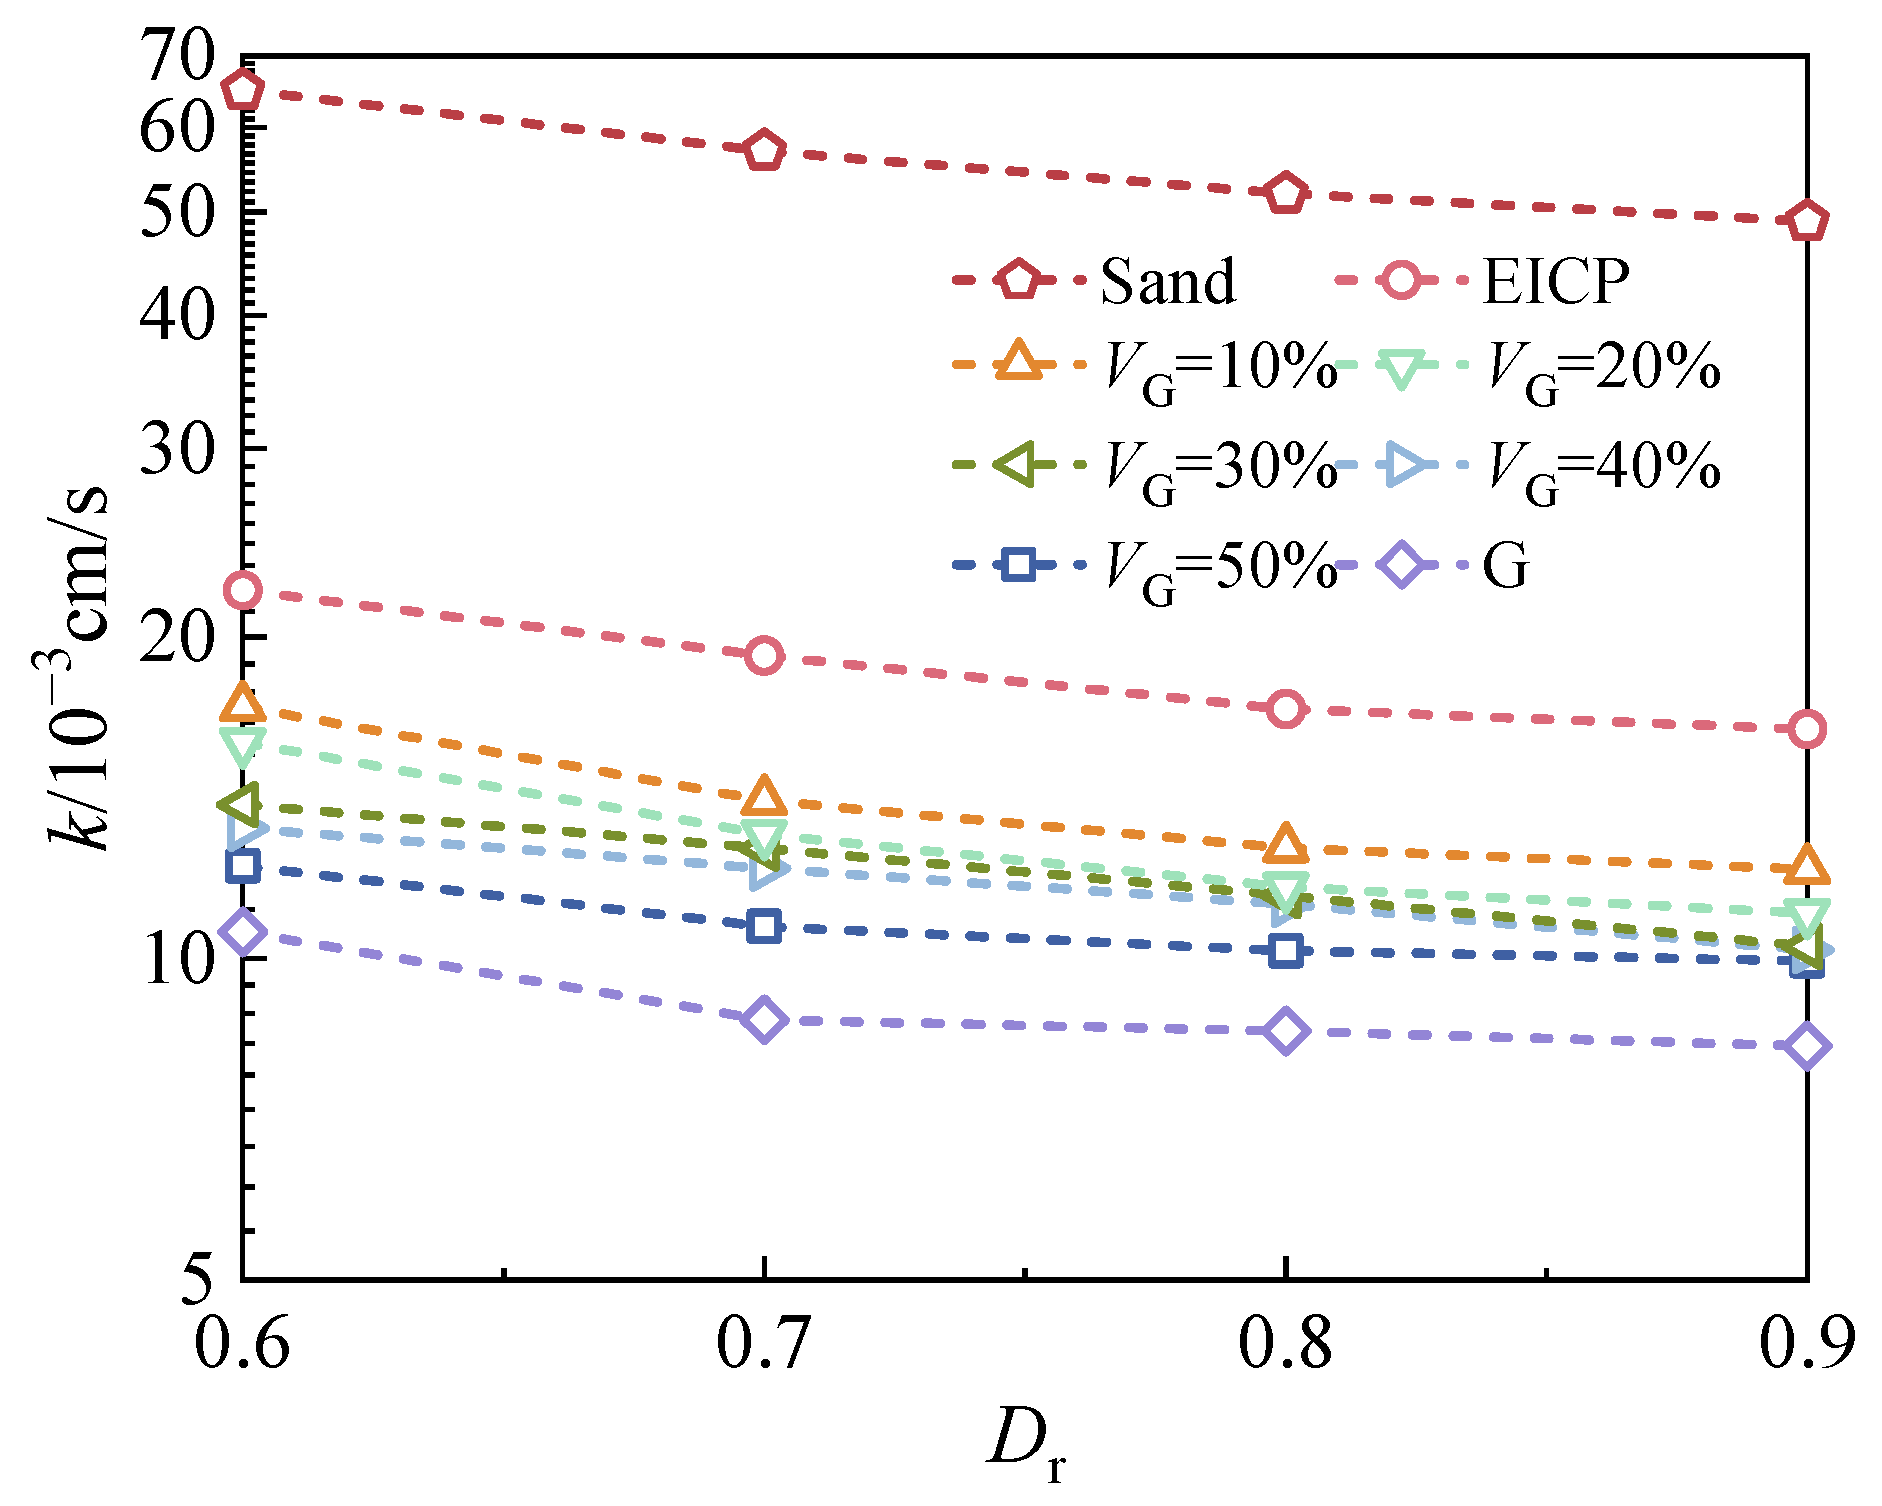
3.1.1. Effects of Dr and VG on Permeability
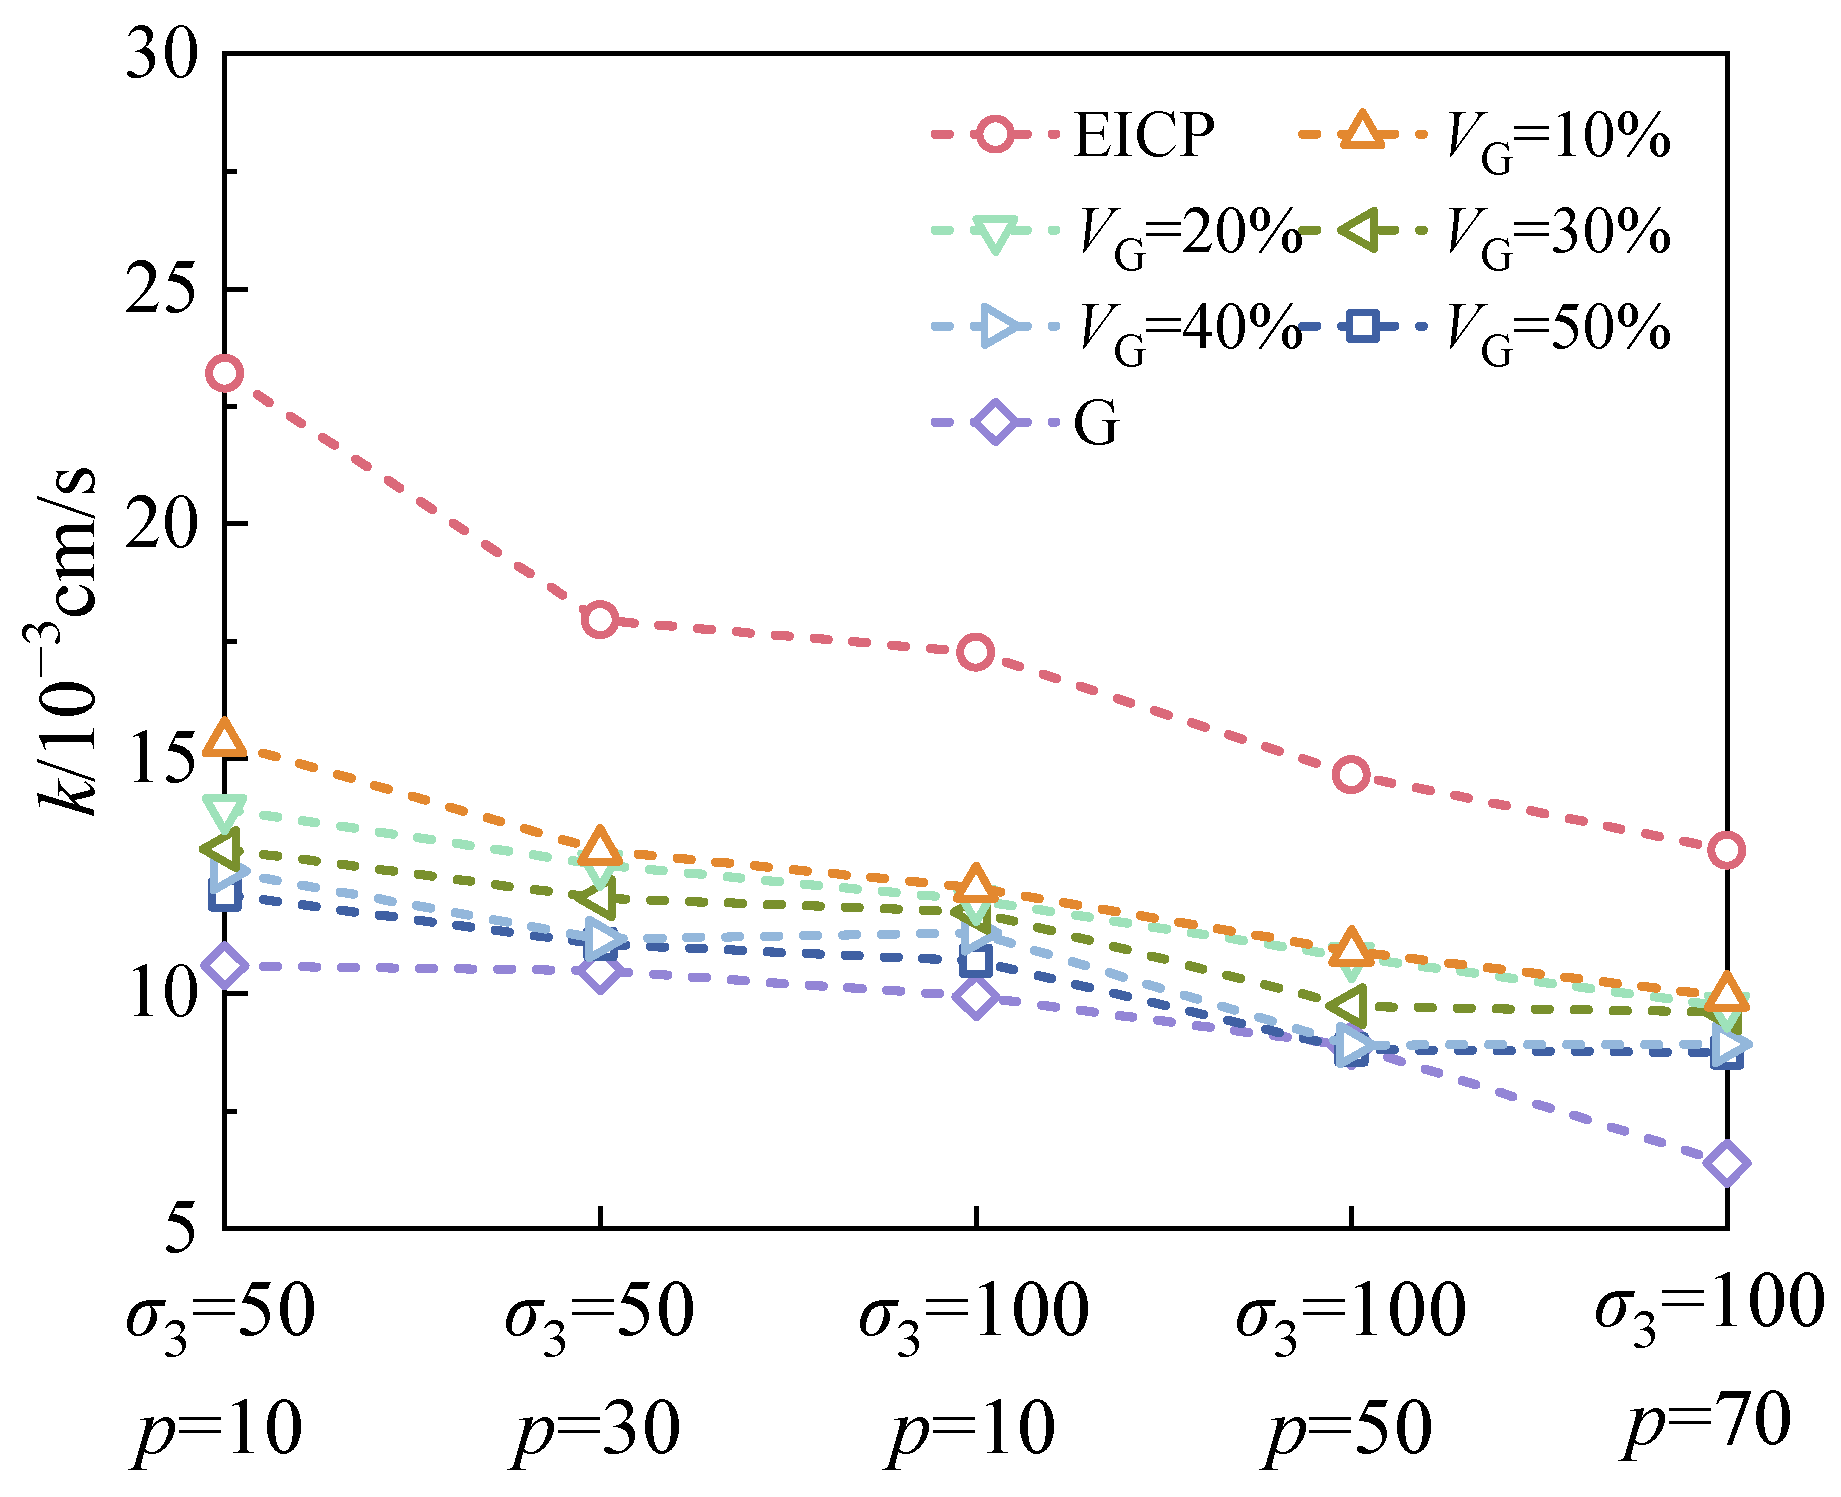
3.1.2. Effects of σ3 and P on Permeability
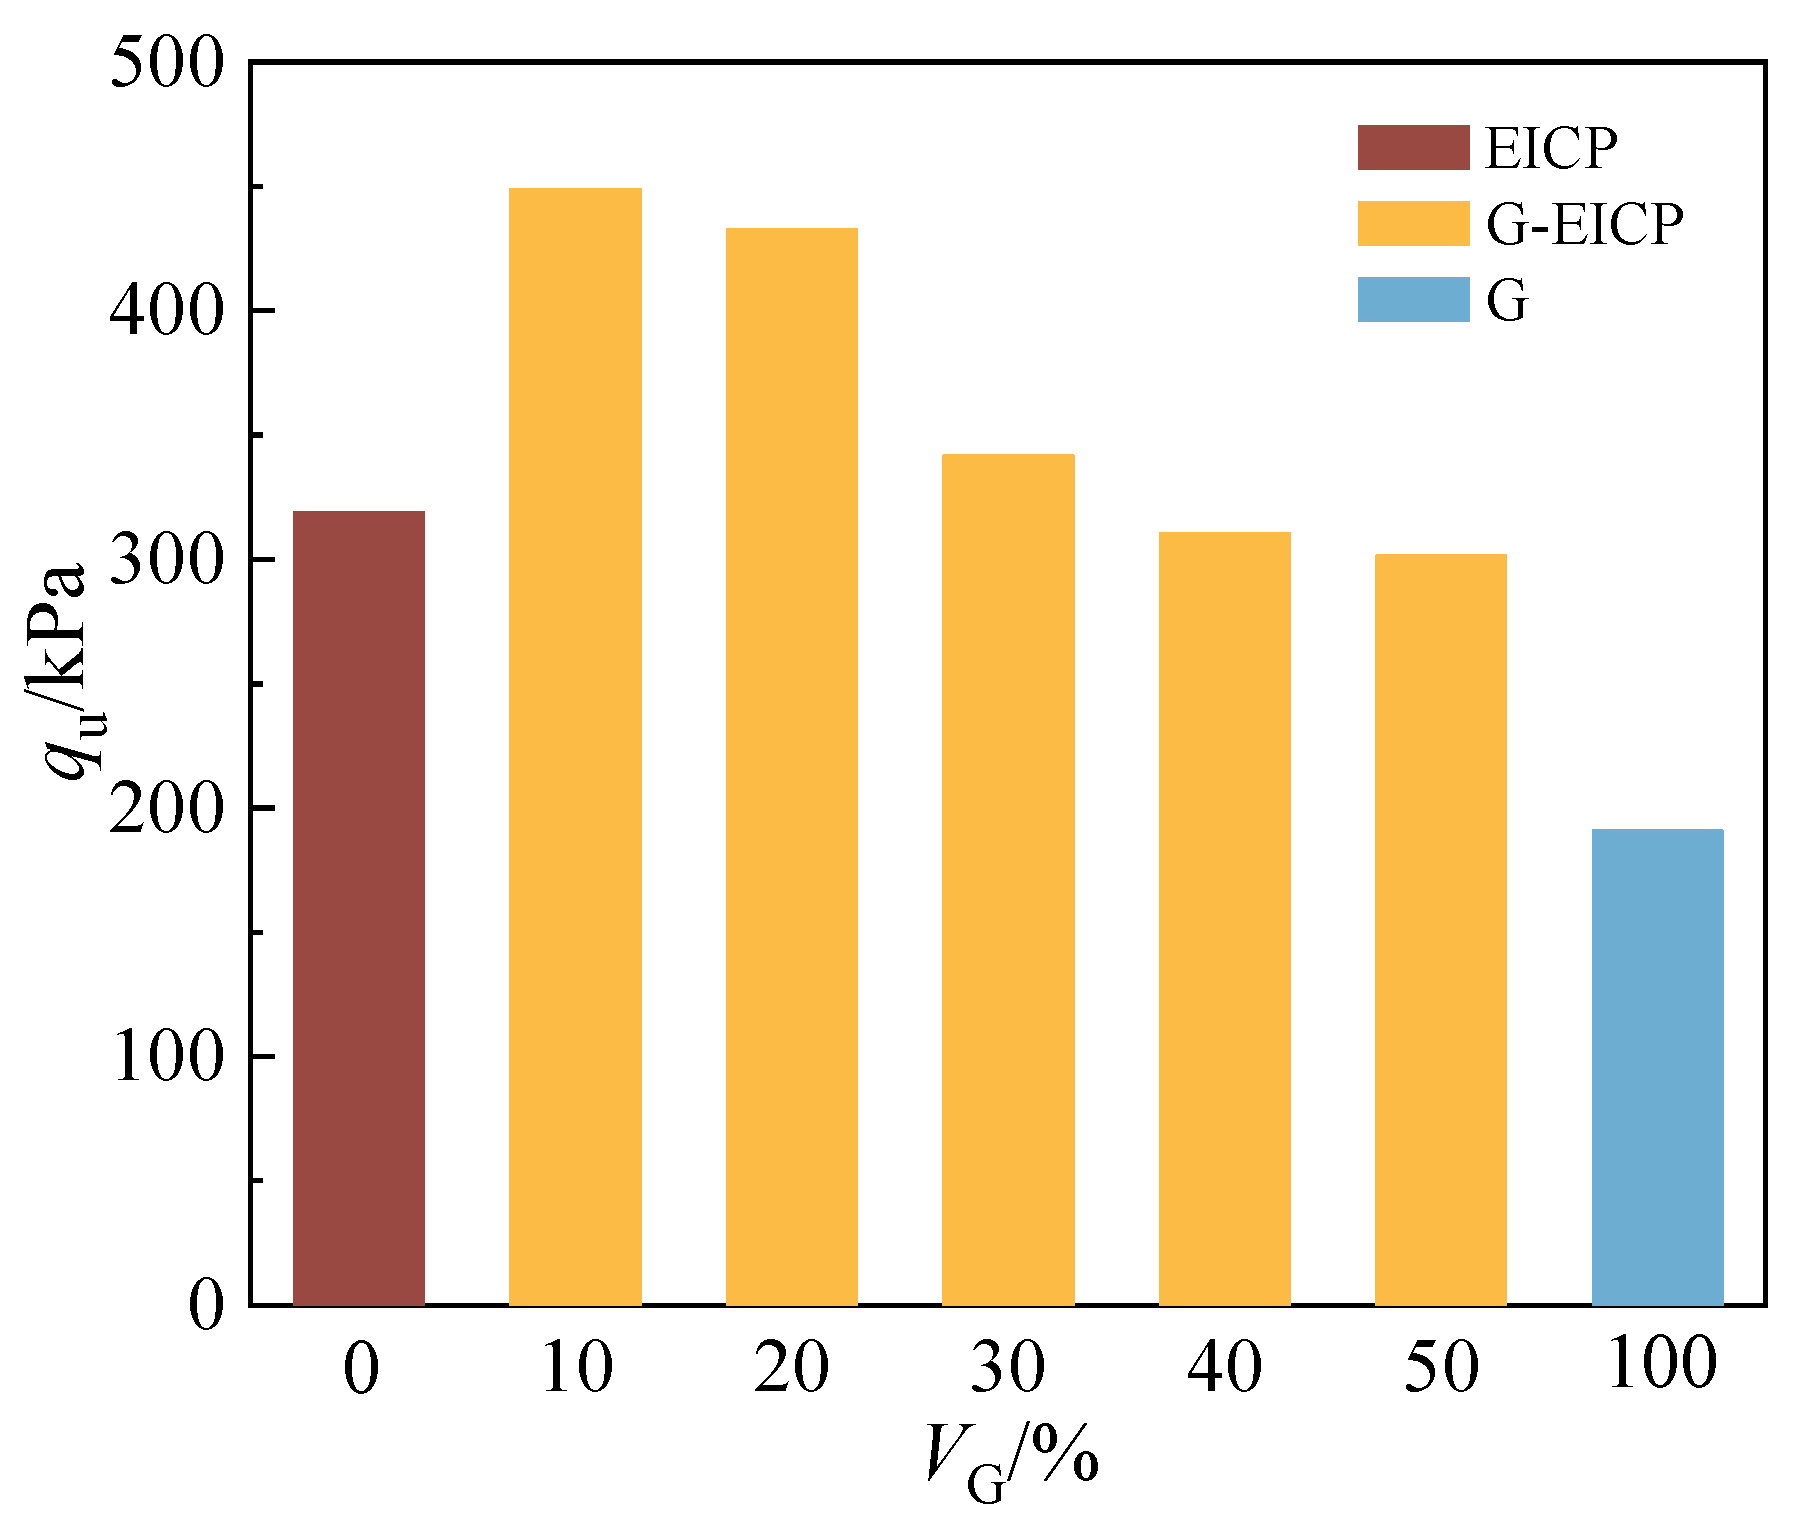
3.2. Analysis of UCS Test Results
3.3. Analysis of Micro- Mechanism of G-EIC- Reinforced Soil
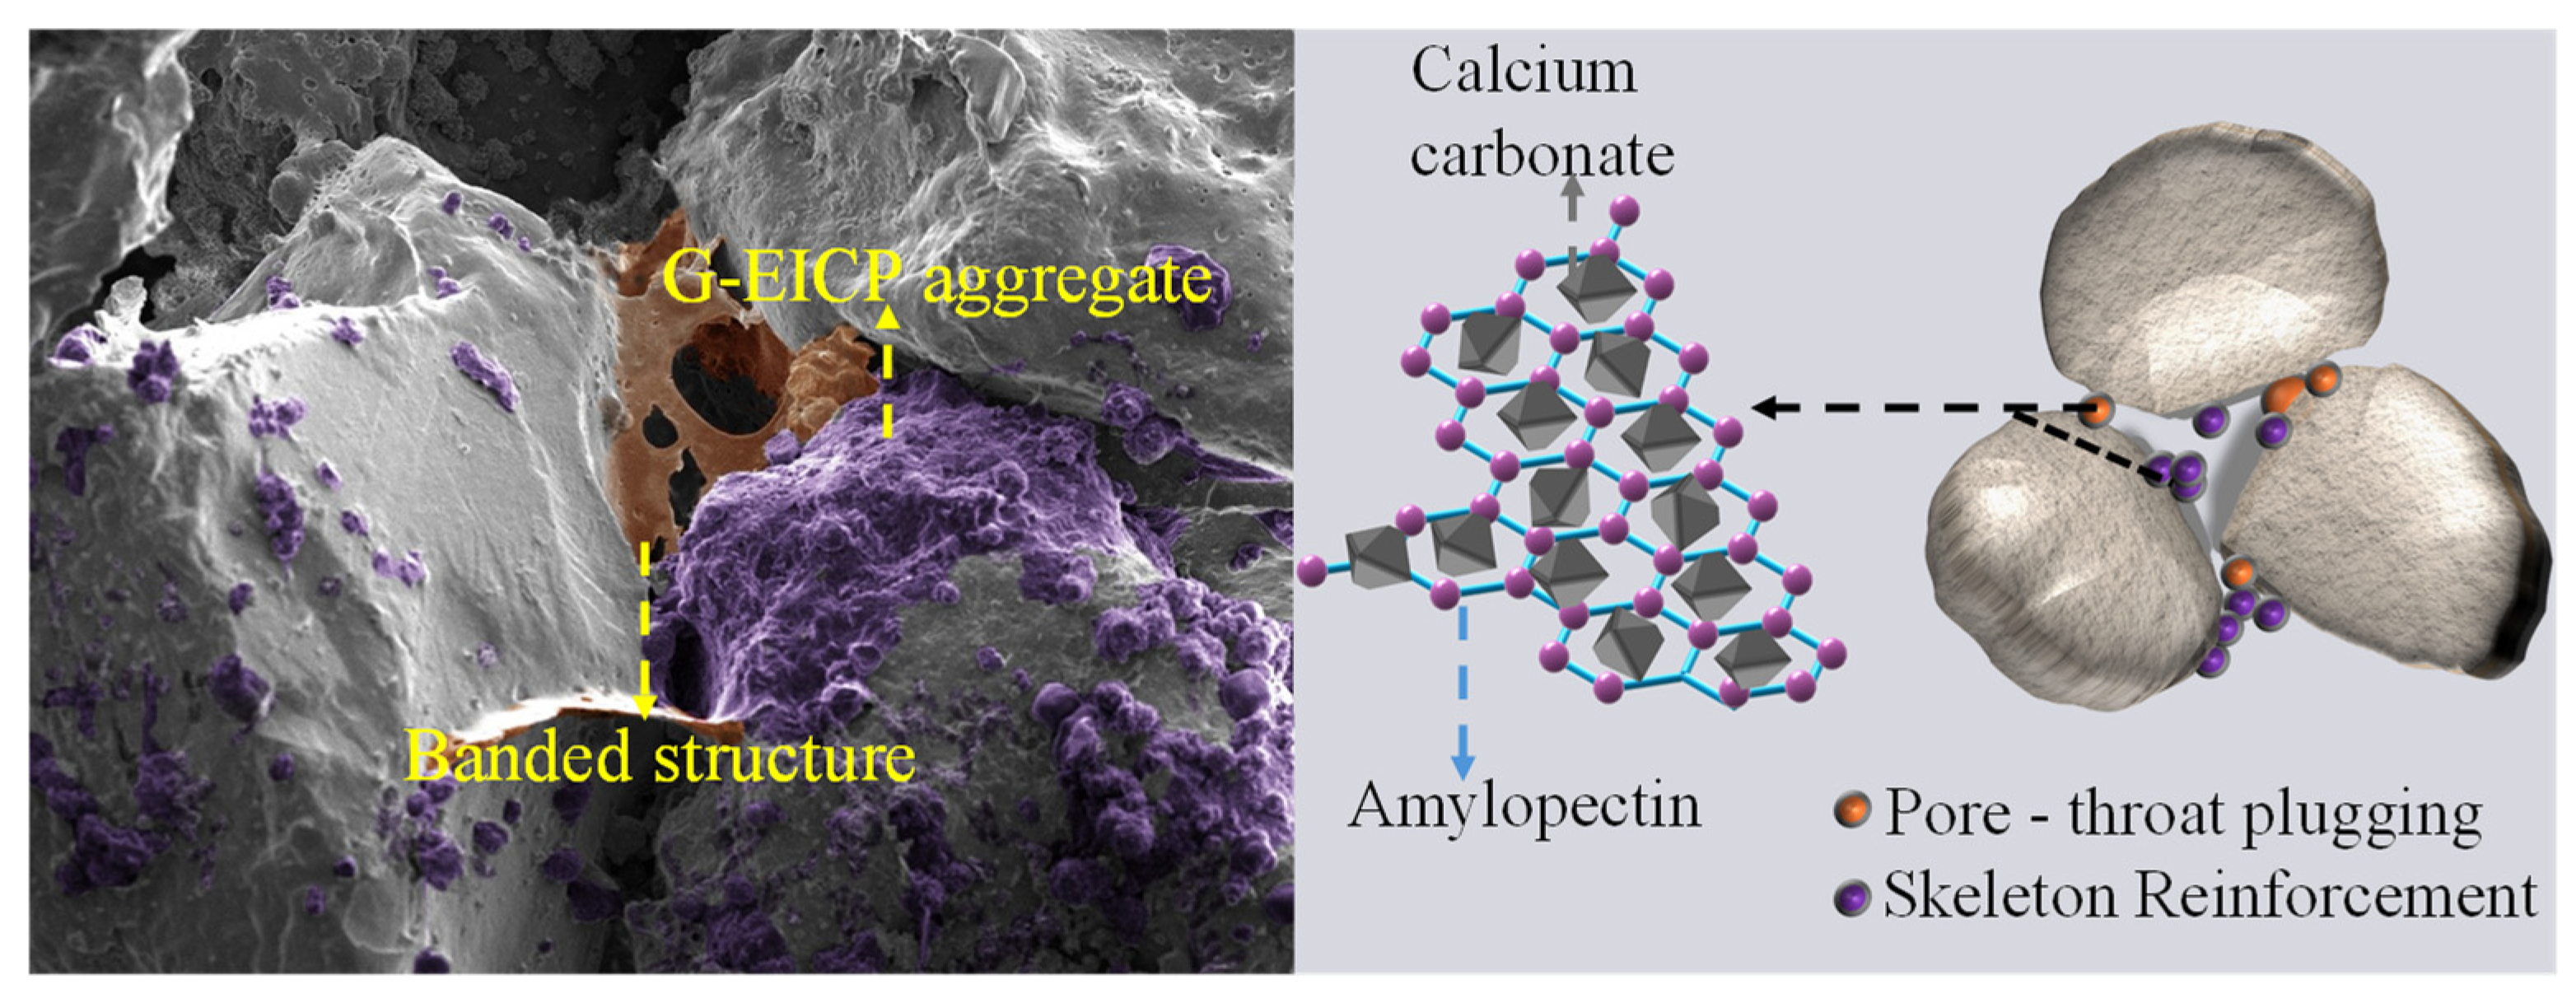
3.3.1. SEM Results Analysis
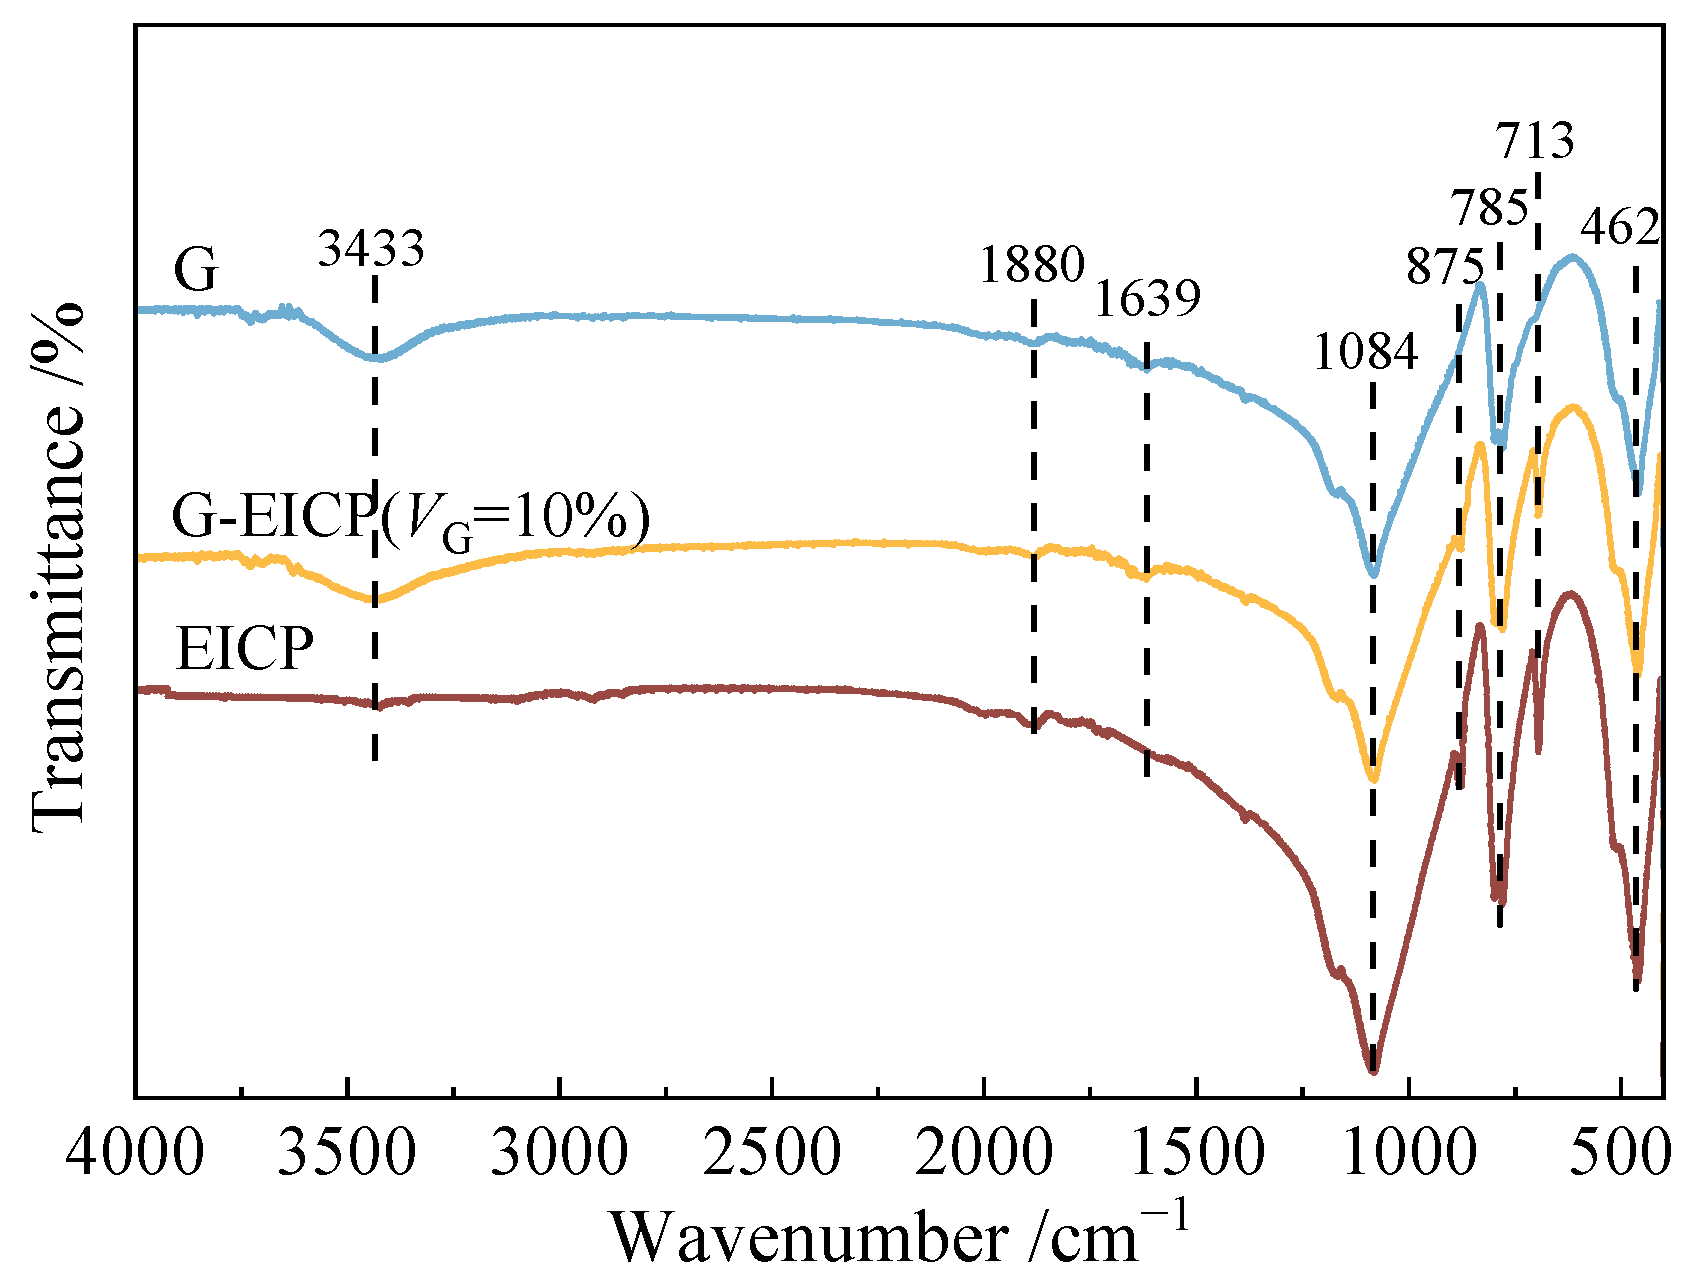
3.3.2. FTIR Results Analysis
3.4. Analysis of 3D Pore Structure of G-EICP-Reinforced Soil
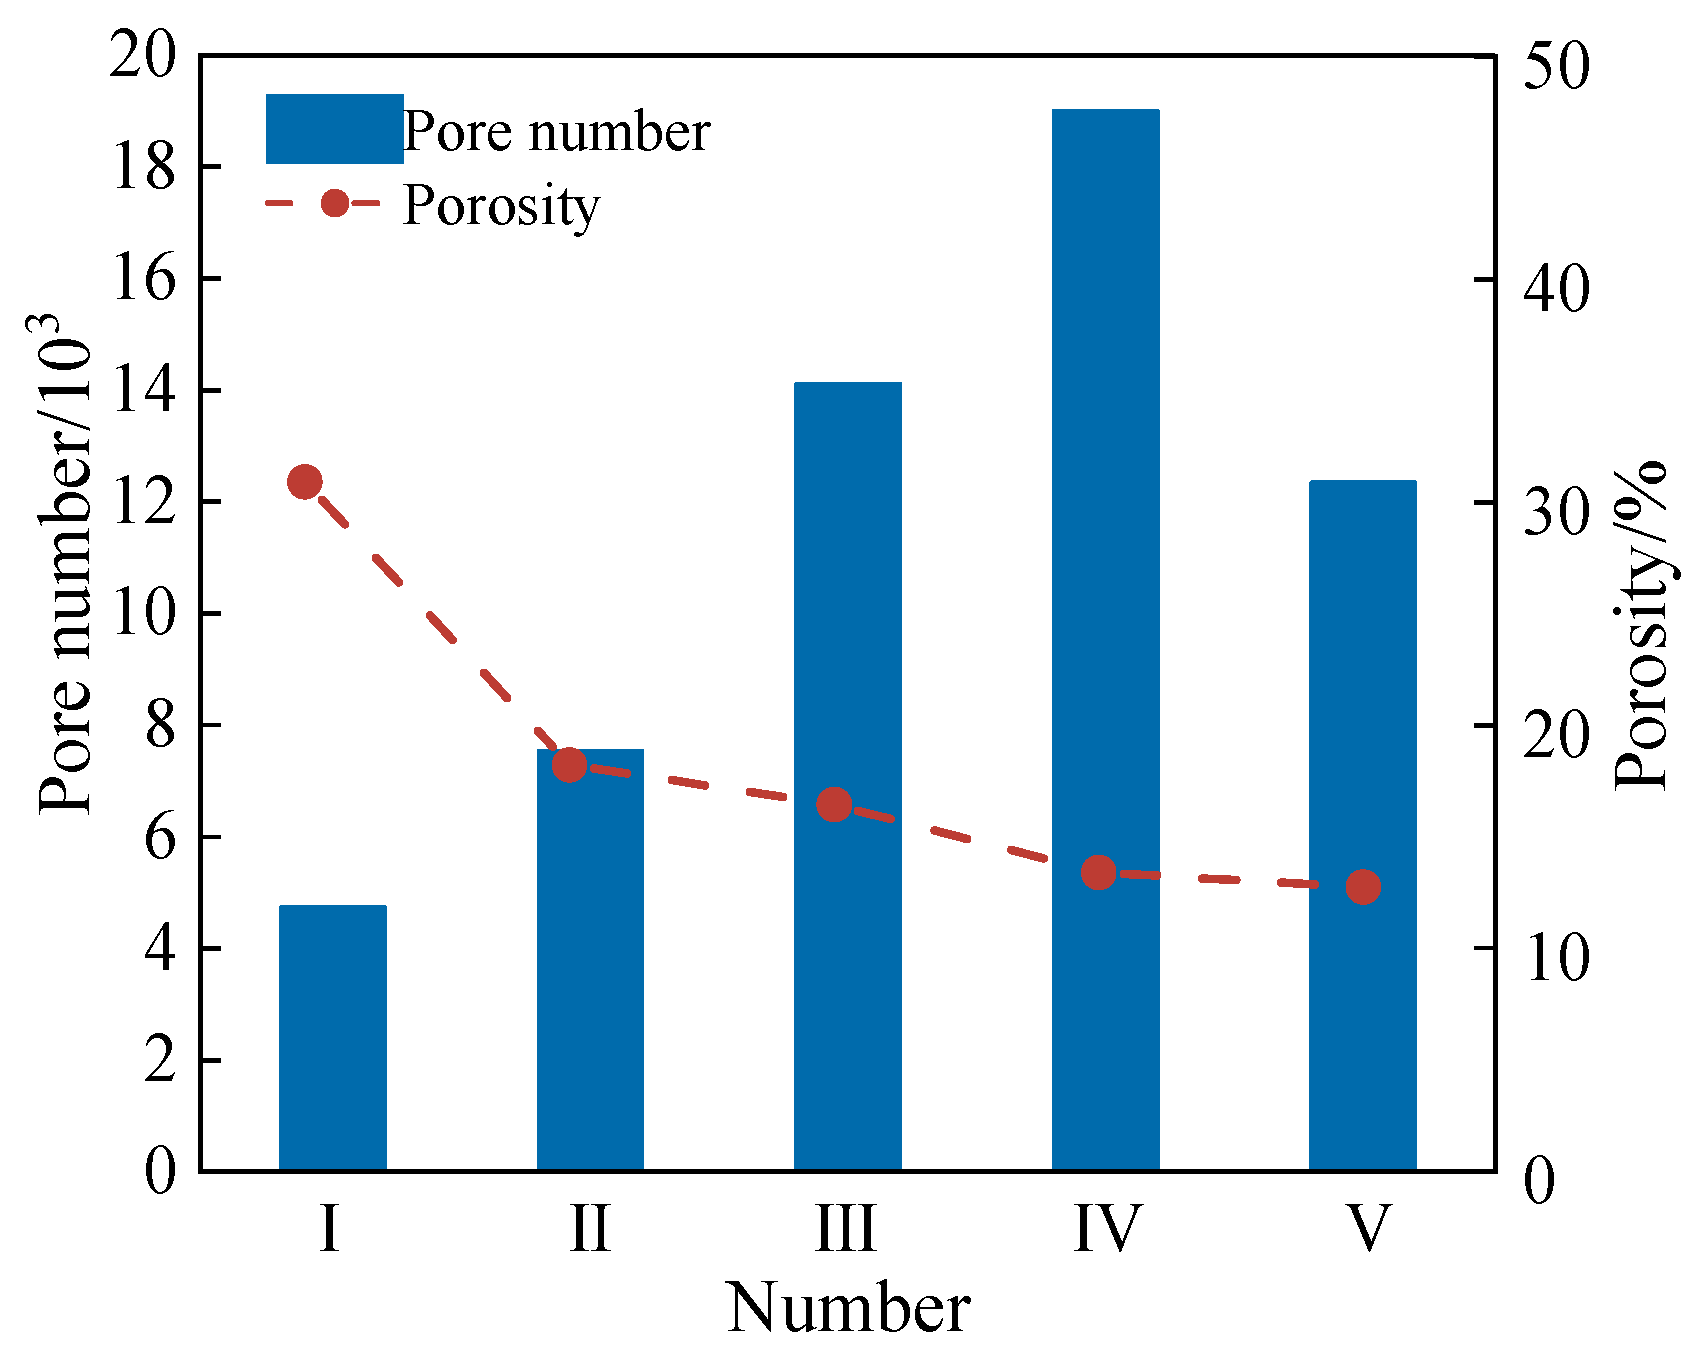
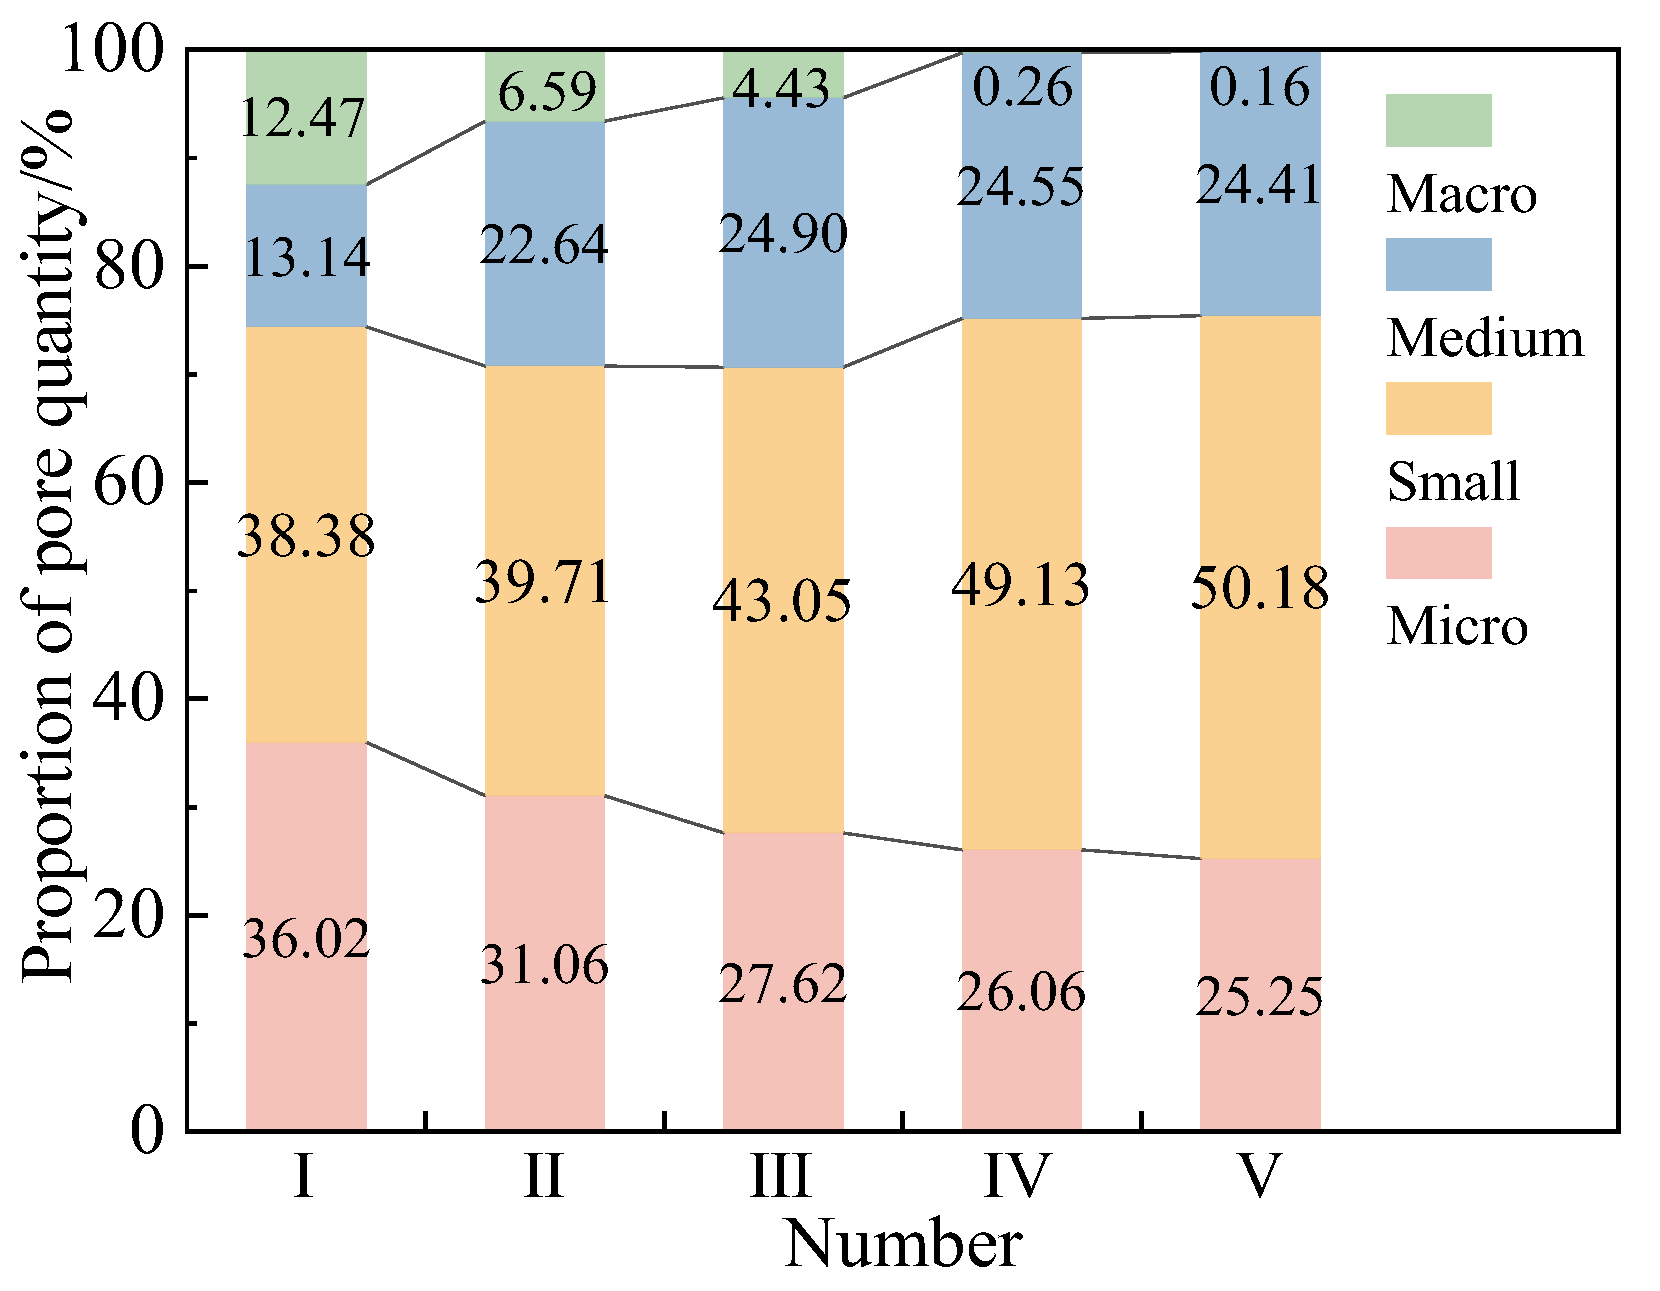
3.4.1. Analysis of Pore Structure Results
3.4.2. Analysis of Pore Connectivity
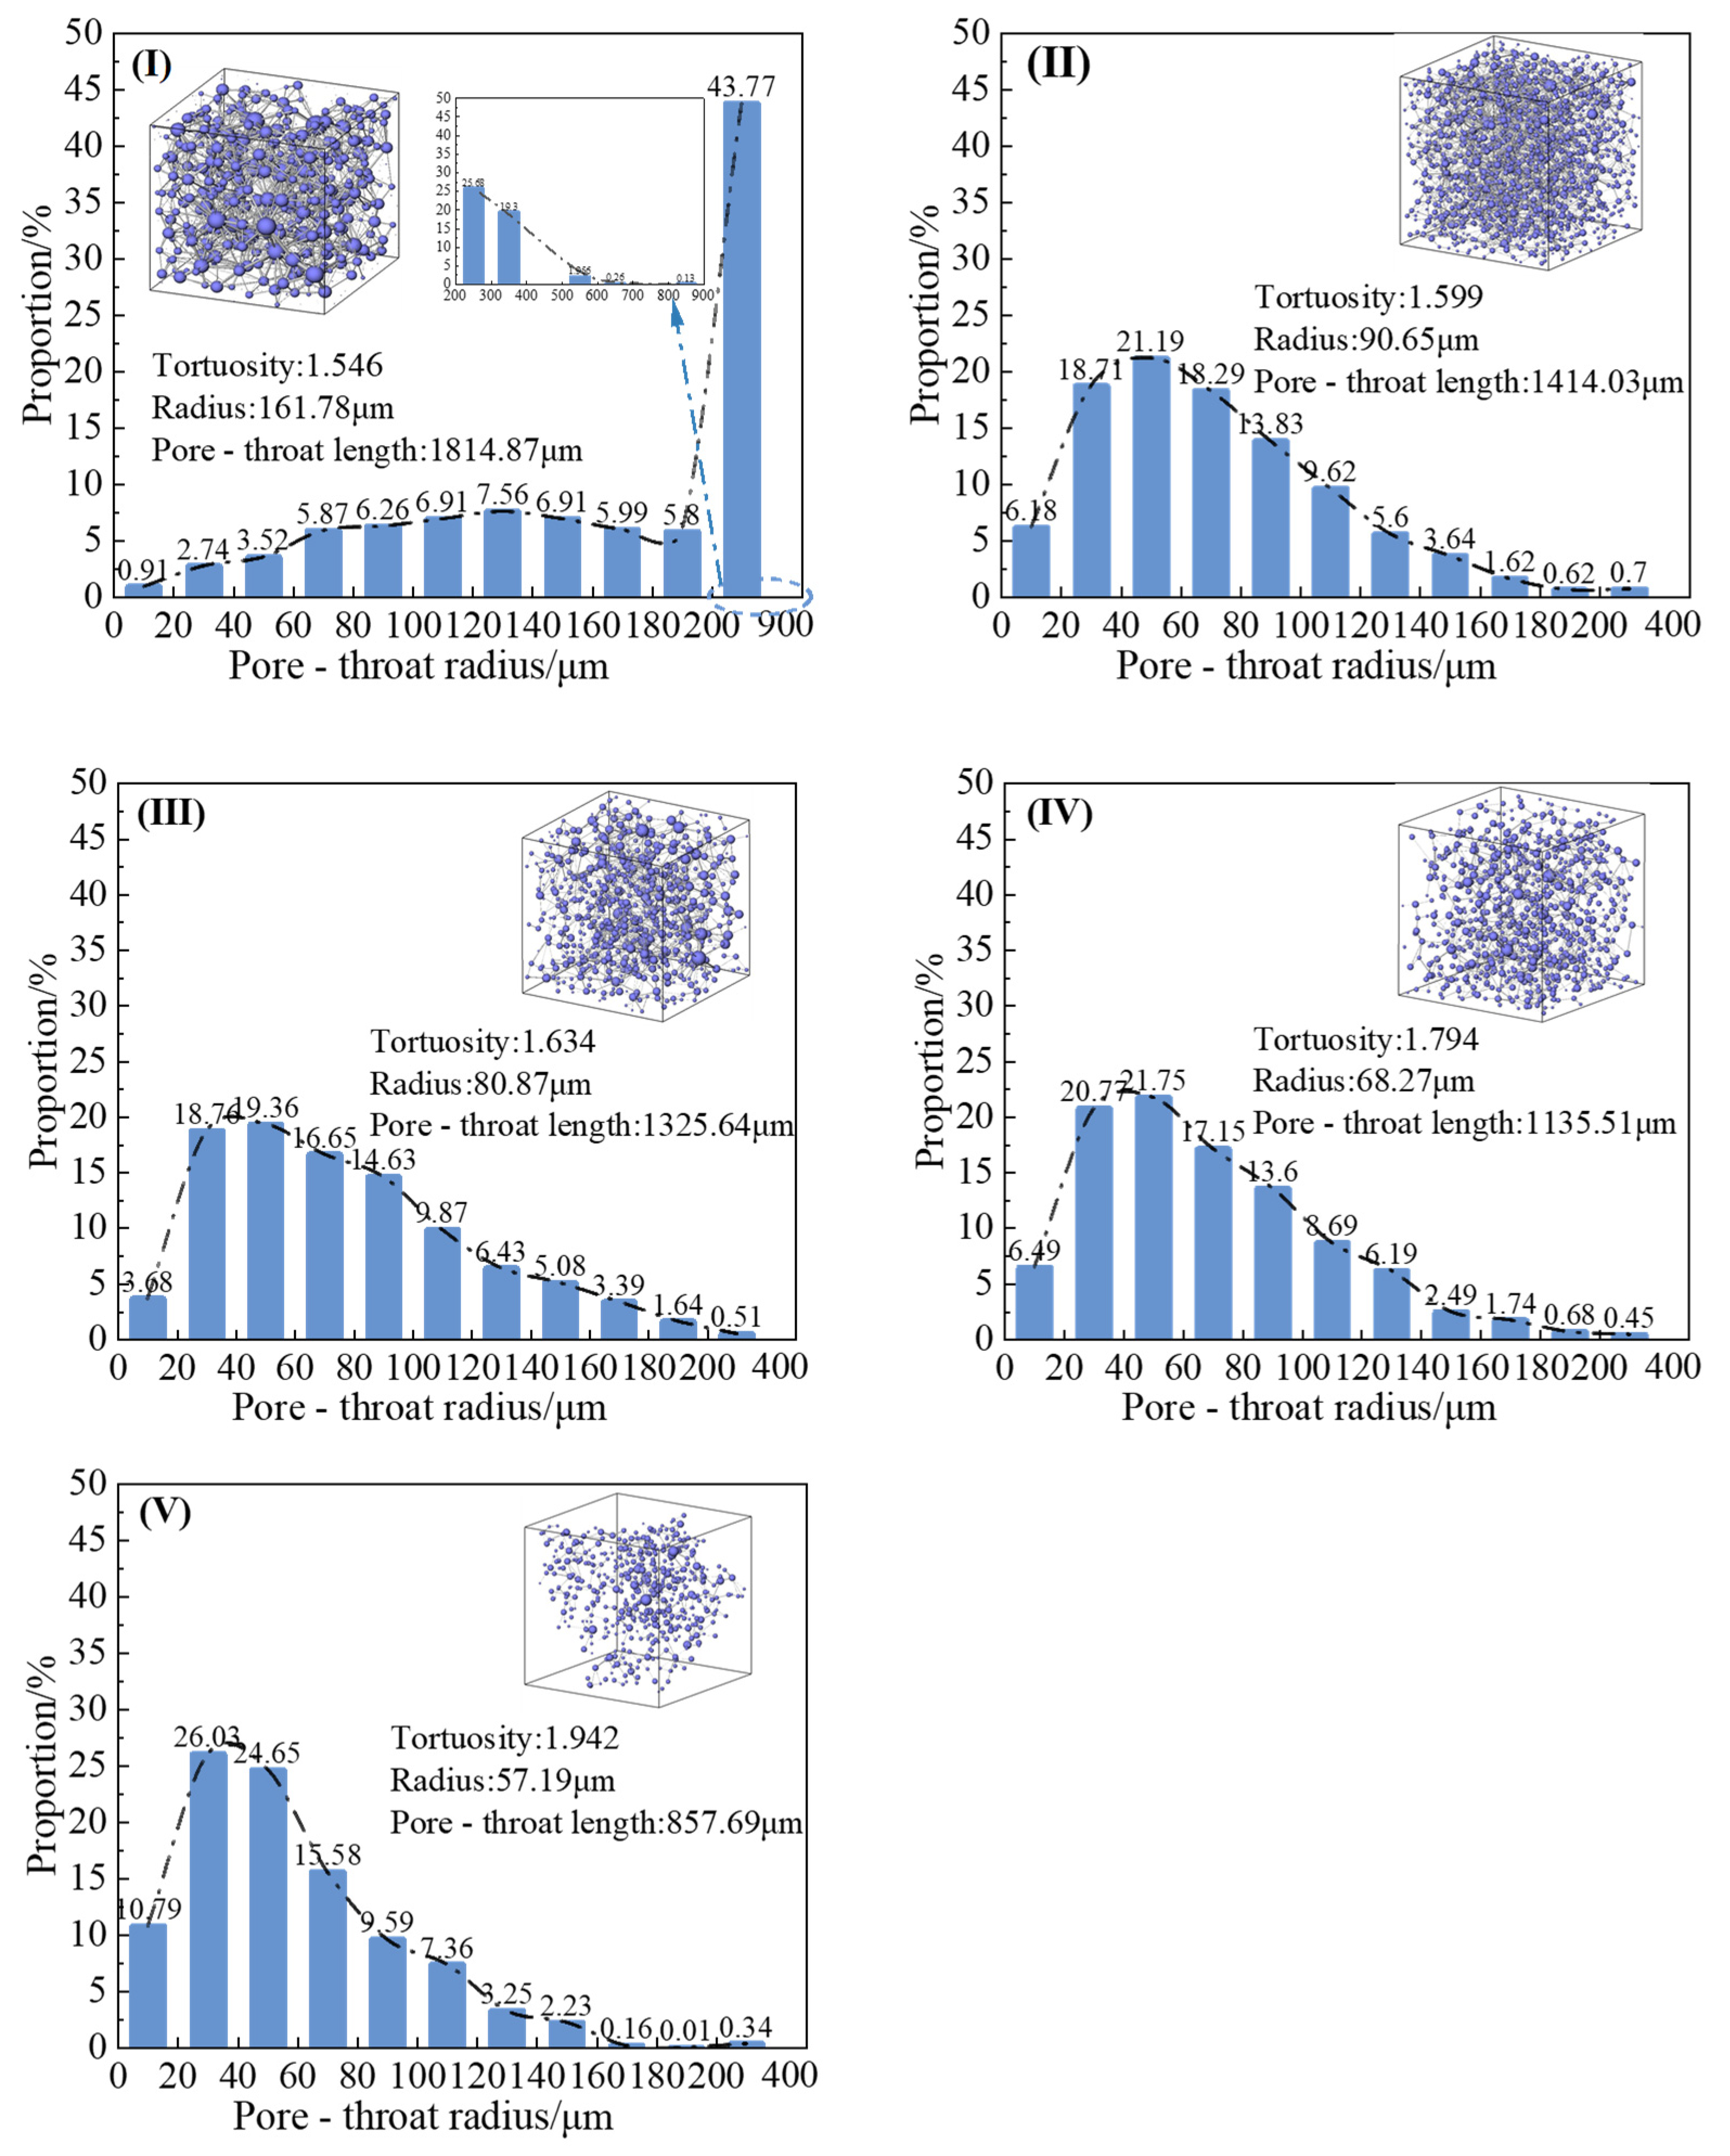
3.4.3. Analysis of Pore-Throat
4. Conclusions
- All reinforced soil specimens exhibited lower permeability coefficients than the untreated soil. The permeability coefficient gradually decreased with increasing relative density (Dr), glutinous rice slurry volume content (VG), seepage pressure (p), and confining pressure (σ3). Notably, more pronounced variations in permeability were observed during the initial stages of lower Dr and smaller VG.
- Significant differences in permeability and strength characteristics were observed in G-EICP-reinforced soil under varying glutinous rice slurry volume ratios. Specimens with low slurry ratios (VG = 0~20%) demonstrated superior strength performance, reaching a maximum unconfined compressive strength of 449.2 kPa at VG = 10%. Comparative analysis revealed that EICP-reinforced soil exhibited higher strength than G-reinforced soil when applied separately.
- Microstructural analysis demonstrated that glutinous rice slurry particles serve as nucleation sites for calcium carbonate precipitation in G-EICP-reinforced soil. This mechanism regulates the morphology, size distribution, and spatial arrangement of calcium carbonate crystals, forming distinctive slurry−calcium carbonate aggregates. These aggregates appear to contribute to soil stability, possibly through two mechanisms: “pore throat clogging” that reduces permeability and “skeleton reinforcement”, which improves structural integrity.
- All three treatment methods (EICP, G, and G-EICP) effectively reduced soil porosity while modifying the pore size distribution and spatial configuration. With increasing VG, the treated soil exhibited higher total pore counts, accompanied by reduced connectivity (manifested through decreased numbers of connected pores and coordination numbers) and increased tortuosity. These microstructural modifications collectively contributed to significant improvements in both the mechanical strength and hydraulic characteristics compared to untreated soil.
Author Contributions
Funding
Institutional Review Board Statement
Informed Consent Statement
Data Availability Statement
Conflicts of Interest
References
- Al-Mahbashi, A.M.; Almajed, A. The Role of Biopolymers on the Water Retention Capacity of Stabilized Sand. Sustainability 2024, 16, 8612. [Google Scholar] [CrossRef]
- Sathvik, S.; Oyebisi, S.; Kumar, R.; Shakor, P.; Adejonwo, O.; Tantri, A.; Suma, V. Analyzing the Influence of Manufactured Sand and Fly Ash on Concrete Strength through Experimental and Machine Learning Methods. Sci. Rep. 2025, 15, 4978. [Google Scholar]
- United Nations Convention to Combat Desertification. UN Global Land Outlook, 2nd ed.; United Nations: New York, NY, USA, 2022. [Google Scholar]
- Khaleghi, M.; Heidarvand, M. A novel study on hydro-mechanical characteristics of biopolymer-stabilized dune sand. J. Clean. Prod. 2023, 398, 136518. [Google Scholar]
- Alotaibi, E.; Arab, M.G.; Abdallah, M.; Nassif, N.; Omar, M. Life Cycle Assessment of Biocemented Sands Using Enzyme Induced Carbonate Precipitation (EICP) for Soil Stabilization Applications. Sci. Rep. 2022, 12, 6032. [Google Scholar]
- Arab, M.G.; Alsodi, R.; Almajed, A.; Yasuhara, H.; Zeiada, W.; Shahin, M.A. State-of-the-Art Review of Enzyme-Induced Calcite Precipitation (EICP) for Ground Improvement: Applications and Prospects. Geosciences 2021, 11, 492. [Google Scholar] [CrossRef]
- Yuan, H.; Ru, M.; Dong, W.; Zhu, X.; Zhao, Z. Crack Repair in In-Service Tunnel Linings Using Chitosan-Combined Enzyme-Induced Carbonate Precipitation. J. Mater. Civ. Eng. 2024, 36, 04024365. [Google Scholar]
- Mehmood, M.; Guo, Y.; Wang, L.; Liu, Y.; Uge, B.U.; Ali, S. Influence of Enzyme Induced Carbonate Precipitation (EICP) on the Engineering Characteristics of Expansive Soil. Arab. J. Sci. Eng. 2024, 49, 14101–14116. [Google Scholar]
- Khan, S.R.; Nawaz, M.M.; Sani, N.; Khan, W. Improvement of Strength and Permeability Attributes of Silty Sand Type of Soils using Enzyme Induced Calcite Precipitation. Sustain. Struct. Mater. 2023, 6, 1–12. [Google Scholar]
- Zango, M.U.; Kassim, K.A.; Ahmad, K.; Muhammed, A.S. Improvement of strength behaviour of residual soil via enzymatically induced calcite precipitation. Int. J. Geosynth. Ground Eng. 2021, 7, 78. [Google Scholar] [CrossRef]
- Ahenkorah, I.; Rahman, M.M.; Karim, M.R.; Beecham, S. Unconfined compressive strength of MICP and EICP treated sands subjected to cycles of wetting-drying, freezing-thawing and elevated temperature: Experimental and EPR modelling. J. Rock Mech. Geotech. Eng. 2023, 15, 1226–1247. [Google Scholar]
- Almajed, A.A. Enzyme Induced Carbonate Precipitation (EICP) for Soil Improvement. Ph.D. Thesis, Arizona State University, Tempe, AZ, USA, 2017. [Google Scholar]
- Zhang, J.; Yin, Y.; Shi, W.; Song, D.; Yu, L.; Shi, L.; Han, Z. Experimental Study on the Calcium Carbonate Production Rates and Crystal Size of EICP under Multi-Factor Coupling. Case Stud. Constr. Mater. 2023, 18, e01802. [Google Scholar] [CrossRef]
- Jain, S.; Alothman, S.; Kavazanjian Jr, E.; Zapata, C.E. Effect of EICP treatment on the unconfined compressive strength and soil water characteristic curve of a clayey sand material. In Proceedings of the Geo-Congress, Vancouver, BC, Canada, 25–28 February 2024; pp. 338–344. [Google Scholar]
- Lemboye, K.; Almajed, A.; Hamid, W.; Arab, M. Permeability Investigation on Sand Treated Using Enzyme-Induced Carbonate Precipitation and Biopolymers. Innov. Infrastruct. Solut. 2021, 6, 167. [Google Scholar] [CrossRef]
- Singh, S.P.; Das, R.; Seth, D. Plasticity and Strength Characteristics of Expansive Soil Treated with Xanthan Gum Biopolymer. In Problematic Soils and Geoenvironmental Concerns; Latha Gali, M., Raghuveer Rao, P., Eds.; Springer: Singapore, 2021; pp. 649–663. [Google Scholar]
- Almajed, A.; Tirkolaei, H.K.; Kavazanjian Jr, E.; Hamdan, N. Enzyme induced biocementated sand with high strength at low carbonate content. Sci. Rep. 2019, 9, 1135. [Google Scholar] [CrossRef] [PubMed]
- Urlacher, B.; Dalbe, B. Xanthan gum. In Thickening and Gelling Agents for Food; Springer: Boston, MA, USA, 1997; pp. 202–226. [Google Scholar]
- Ramírez-Partida, A.E.; García-Cayuela, T.; Amador-Castro, L.F.; Alper, H.S.; Carrillo-Nieves, D. Towards a biorefinery processing Sargassum seaweed: Techno-economic assessment of alginate and fucoidan production through SuperPro Designer® process simulation. Environ. Technol. Innov. 2024, 34, 103587. [Google Scholar] [CrossRef]
- Yang, F.W.; Zhang, B.J.; Ma, Q.L. Study of sticky rice-lime mortar technology for the restoration of historical masonry construction. Acc. Chem. Res. 2010, 43, 936–944. [Google Scholar] [CrossRef]
- Hoo, C.C.; Lee, J.H.; Lee, M.L.; Zhao, J.J.; Gofar, N. Use of Glutinous Rice Slurry for Reducing Compressibility and Cracking Potential of Kaolin and Lime-Treated Kaolin. Environ. Earth Sci. 2024, 83, 106. [Google Scholar] [CrossRef]
- Pei, Q.Q.; Wang, X.D.; Zhao, L.Y.; Zhang, B.; Guo, Q.L. A Sticky Rice Paste Preparation Method for Reinforcing Earthen Heritage Sites. J. Cult. Herit. 2020, 44, 98–109. [Google Scholar] [CrossRef]
- Zhang, Q.; Yu, X.; Fan, W. Effect of Glutinous Rice on the Microstructure of Bio-CaCO3 Cement and Its Application in Sand Consolidation. Geomicrobiol. J. 2025, 1–10. [Google Scholar] [CrossRef]
- Zhang, Q.; Chu, J.; Zhang, Z.; Wang, W.; Wu, S. Effect of sticky rice on the strength and permeability of bio-cemented sand. Biogeotechnics 2024, 100141. [Google Scholar] [CrossRef]
- Agency, I.E. Technology Roadmap—Low-Carbon Transition in the Cement Industry; International Energy Agency: Paris, France, 2018. [Google Scholar]
- JTG 3430-2020; Test Methods of Soils Highway Engineering. Research Institute of Highway Ministry of Transport: Beijing, China, 2020.
- Craig, R.F. Craig’s Soil Mechanics (Eighth Edition); Spon Press: New York, NY, USA, 2012. [Google Scholar]
- Peng, L.Y.; Du, X.T.; Qi, J.L.; Wang, J.Y.; Zhu, T.Y. Permeability Characteristics and Microscopic Mechanism of MICP-Stabilized Silty Soil. J. Beijing Jiaotong Univ. 2023, 47, 154–162. [Google Scholar]
- Yang, F.; Zhang, B.; Pan, C.; Zeng, Y. Traditional mortar represented by sticky rice lime mortar—One of the great inventions in ancient China. Sci. China Ser. E Technol. Sci. 2009, 52, 1641–1647. [Google Scholar] [CrossRef]
- Liu, M.; Cai, L.; Luo, H. Effect of nano-silica on microbiologically induced calcium carbonate precipitation. Constr. Build. Mater. 2022, 314, 125661. [Google Scholar] [CrossRef]

| ID | Dr | VG(%) | Test Type |
|---|---|---|---|
| Aij | 0.6, 0.7, 0.8, 0.9 | 0, 10, 20, 30, 40, 50, 100 | Permeability |
| Bi | 0.6, 0.7, 0.8, 0.9 | Plain sand | |
| Cj | 0.6 | 0, 10, 20, 30, 40, 50, 100 | UCS |
| Ⅰ | 0.6 | Plain sand | SEM, micro-CT, FTIR |
| Ⅱ | 0.6 | 0 | |
| Ⅲ | 0.6 | 10 | |
| Ⅳ | 0.6 | 50 | |
| Ⅴ | 0.6 | 100 |
| Sample ID | Ⅰ | Ⅱ | Ⅲ | Ⅳ | Ⅴ |
|---|---|---|---|---|---|
| Pore structure |  | 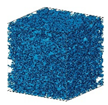 | 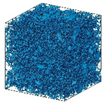 |  | 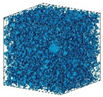 |
| Connected pores PNM | 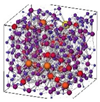 | 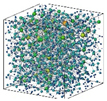 | 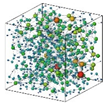 |  | 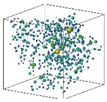 |
| Isolated pores | 267 | 516 | 709 | 814 | 1440 |
| Connected pores | 4472 | 7013 | 13,395 | 18,183 | 10,896 |
| Coordination number | 1.858 | 1.326 | 0.944 | 0.353 | 0.249 |
| k(σ3 = 50, p = 10 kPa) | 0.065 | 0.025 | 0.013 | 0.012 | 0.010 |
| Item | Plain Sand | EICP | G-EICP (VG = 15%) | G-EICP (VG = 50%) | G |
|---|---|---|---|---|---|
| Skewness | 2.50 | 0.39 | 0.32 | 0.46 | 0.77 |
| Kurtiosis | 5.20 | −1.38 | −1.47 | −1.27 | −0.74 |
Disclaimer/Publisher’s Note: The statements, opinions and data contained in all publications are solely those of the individual author(s) and contributor(s) and not of MDPI and/or the editor(s). MDPI and/or the editor(s) disclaim responsibility for any injury to people or property resulting from any ideas, methods, instructions or products referred to in the content. |
© 2025 by the authors. Licensee MDPI, Basel, Switzerland. This article is an open access article distributed under the terms and conditions of the Creative Commons Attribution (CC BY) license (https://creativecommons.org/licenses/by/4.0/).
Share and Cite
Wang, J.; Li, X.; Peng, L.; Zhang, J.; Lu, S.; Du, X. Microstructural Analysis of Sand Reinforced by EICP Combined with Glutinous Rice Slurry Based on CT Scanning. Materials 2025, 18, 1563. https://doi.org/10.3390/ma18071563
Wang J, Li X, Peng L, Zhang J, Lu S, Du X. Microstructural Analysis of Sand Reinforced by EICP Combined with Glutinous Rice Slurry Based on CT Scanning. Materials. 2025; 18(7):1563. https://doi.org/10.3390/ma18071563
Chicago/Turabian StyleWang, Jianye, Xiao Li, Liyun Peng, Jin Zhang, Shuang Lu, and Xintao Du. 2025. "Microstructural Analysis of Sand Reinforced by EICP Combined with Glutinous Rice Slurry Based on CT Scanning" Materials 18, no. 7: 1563. https://doi.org/10.3390/ma18071563
APA StyleWang, J., Li, X., Peng, L., Zhang, J., Lu, S., & Du, X. (2025). Microstructural Analysis of Sand Reinforced by EICP Combined with Glutinous Rice Slurry Based on CT Scanning. Materials, 18(7), 1563. https://doi.org/10.3390/ma18071563