
Enhancing the Early Hydration of Supersulfate Cement: The Effect of Sodium Aluminate

 and
and
Abstract
1. Introduction
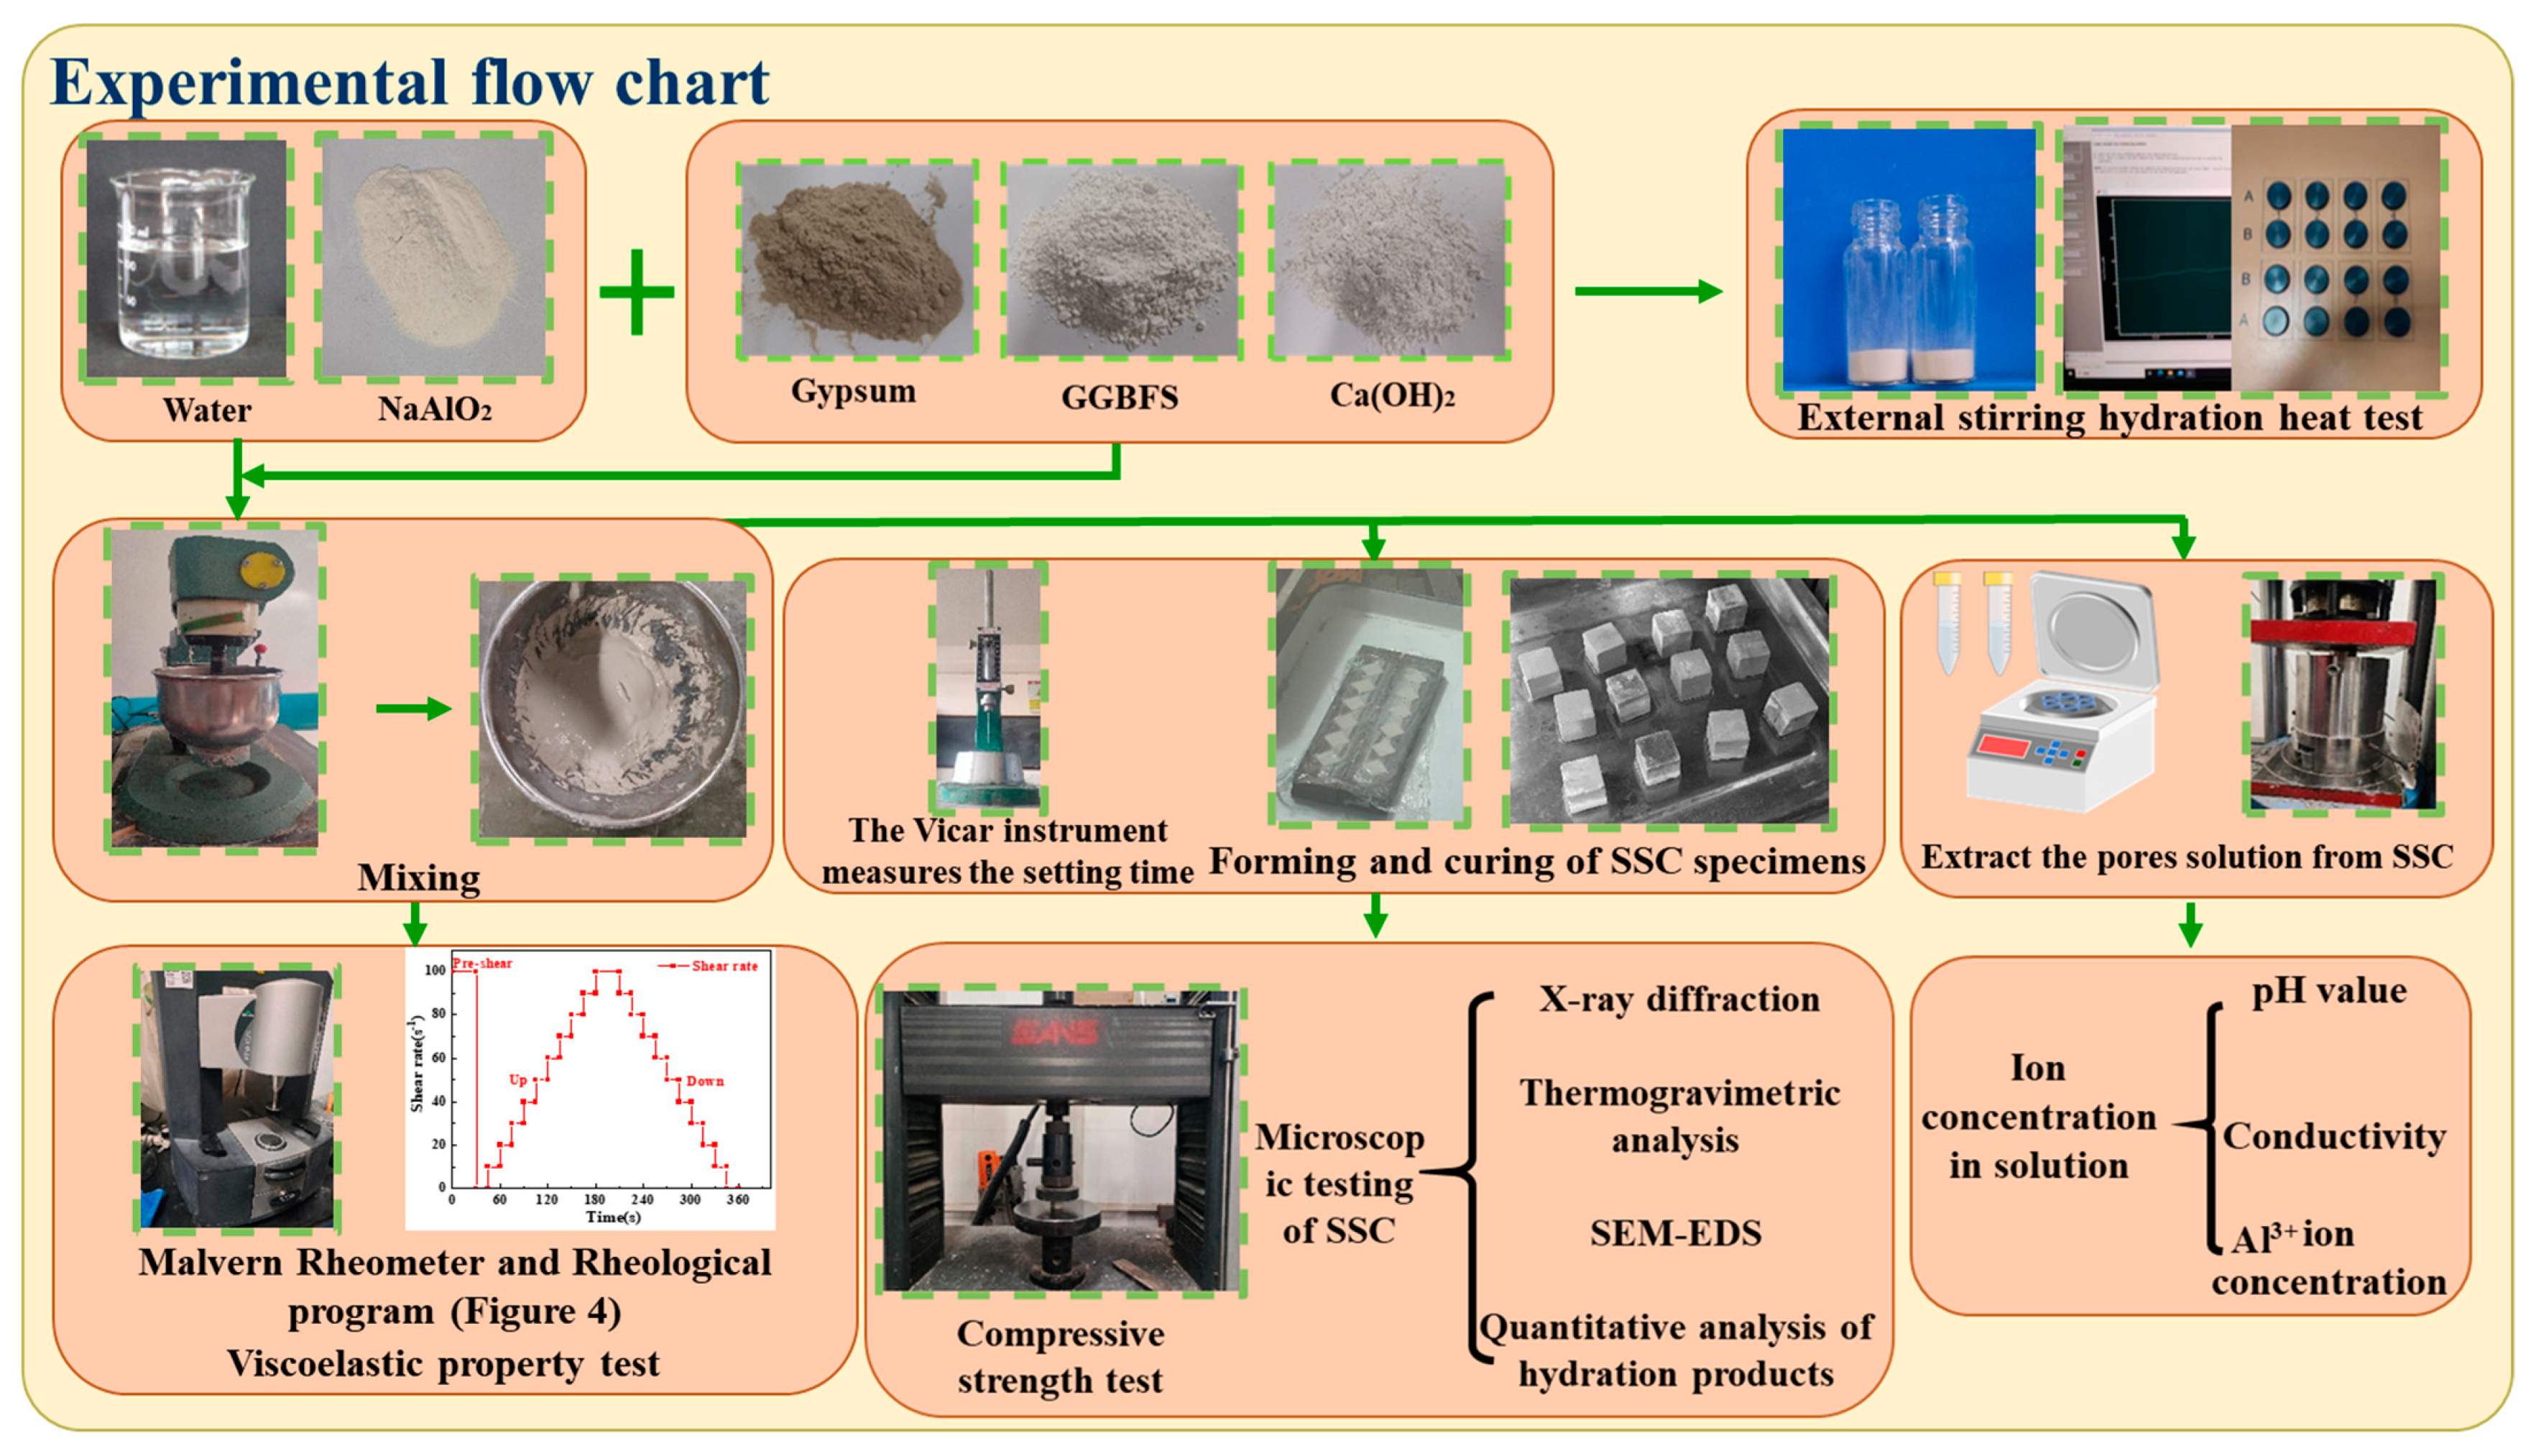
2. Materials and Methods
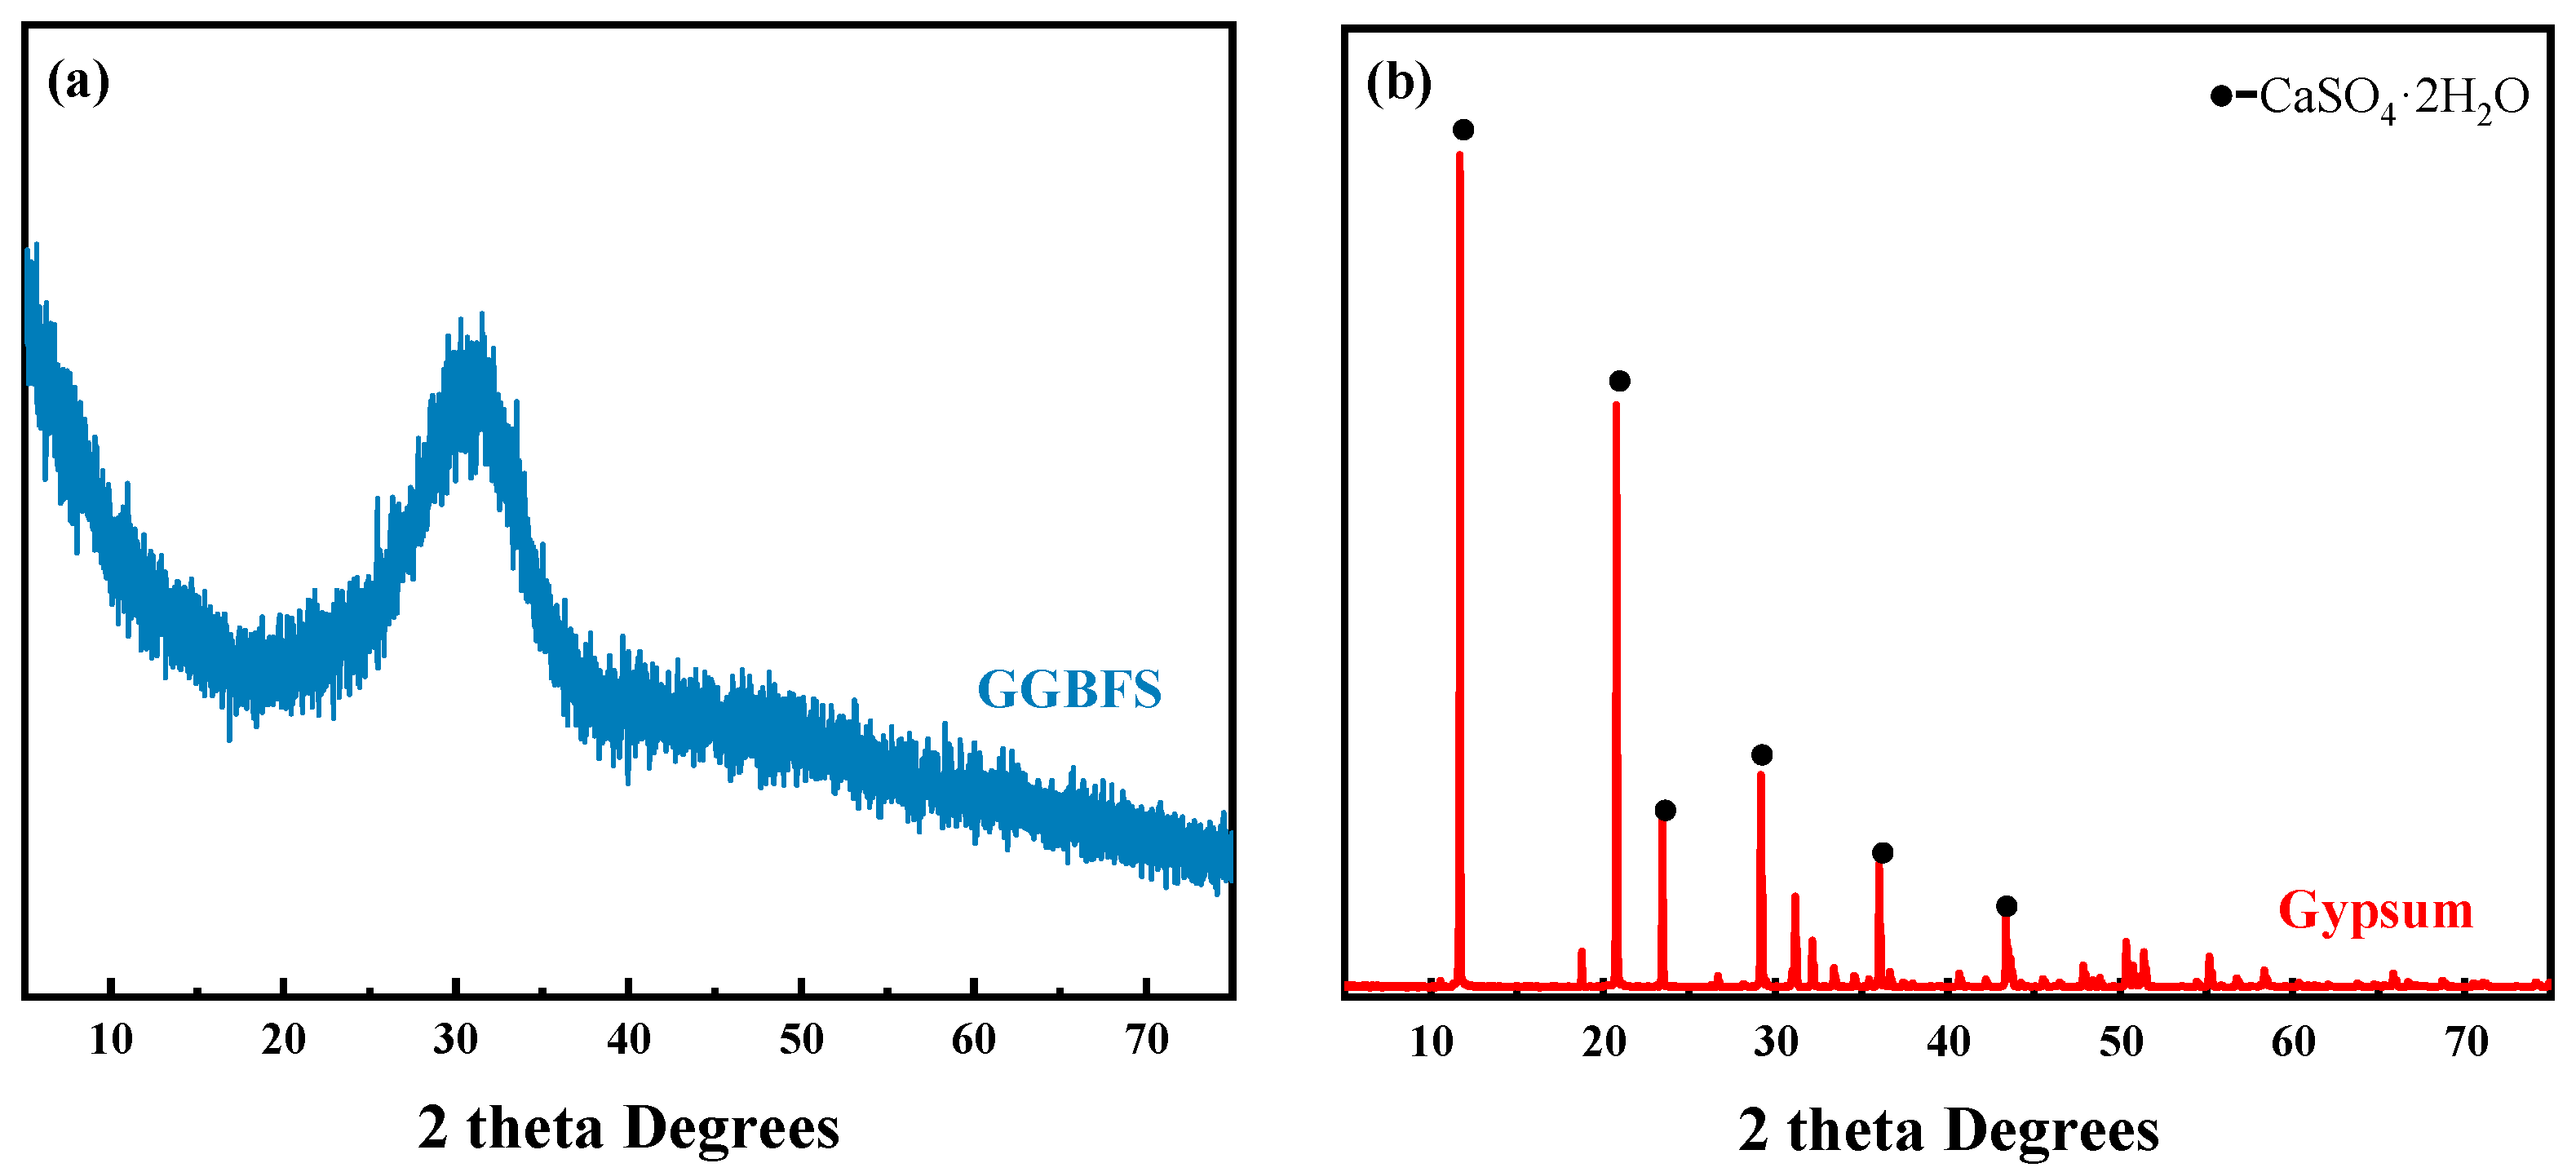
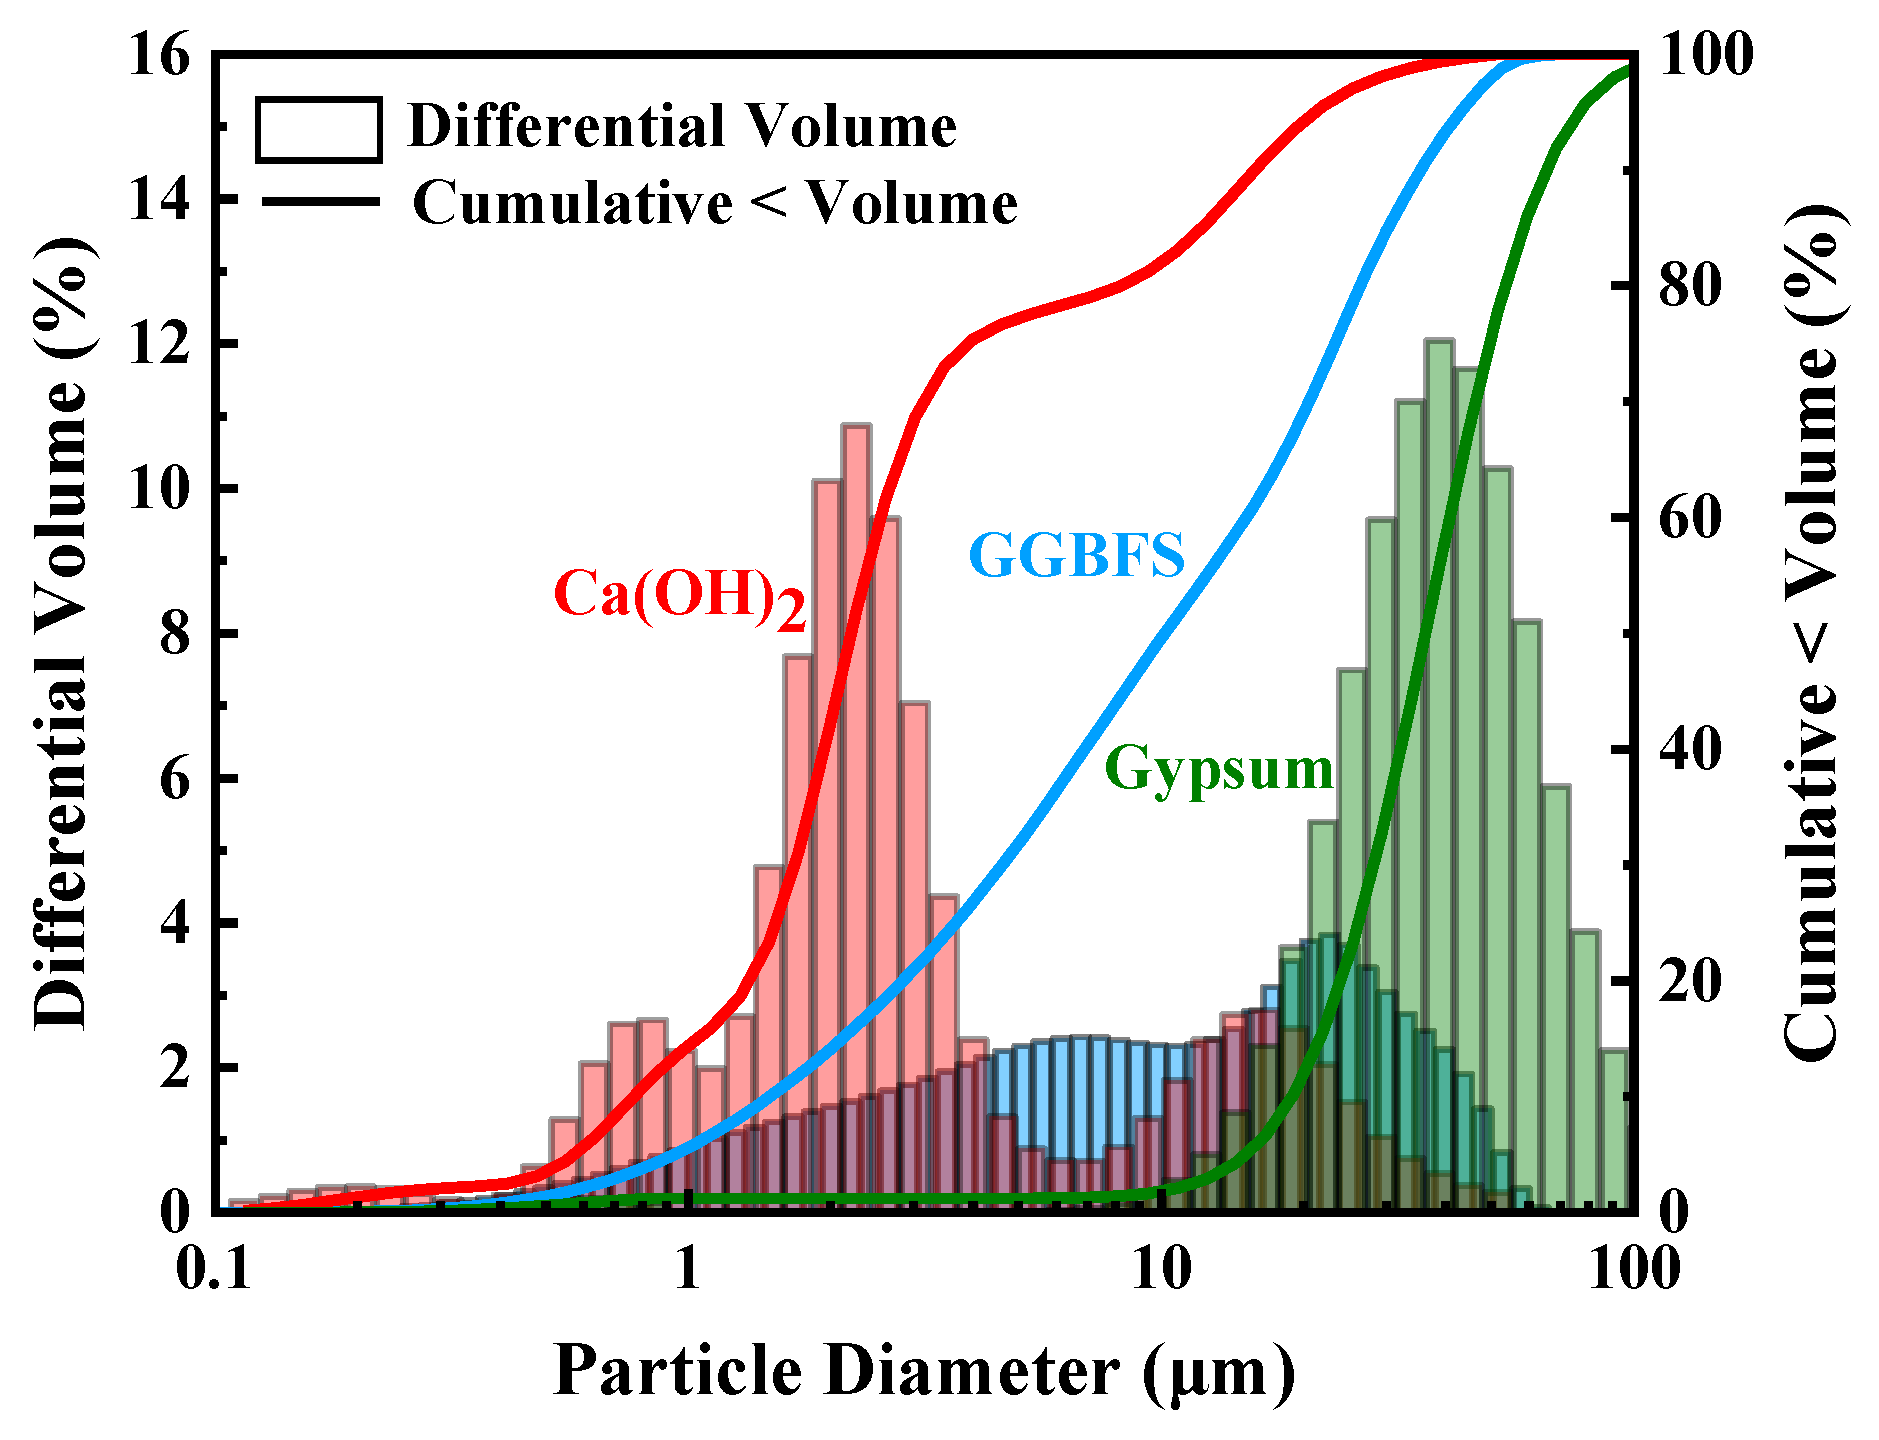
2.1. Raw Materials
2.2. SSC Preparation
2.3. Test Methods
2.3.1. Setting Time Test
2.3.2. Compressive Strength Test
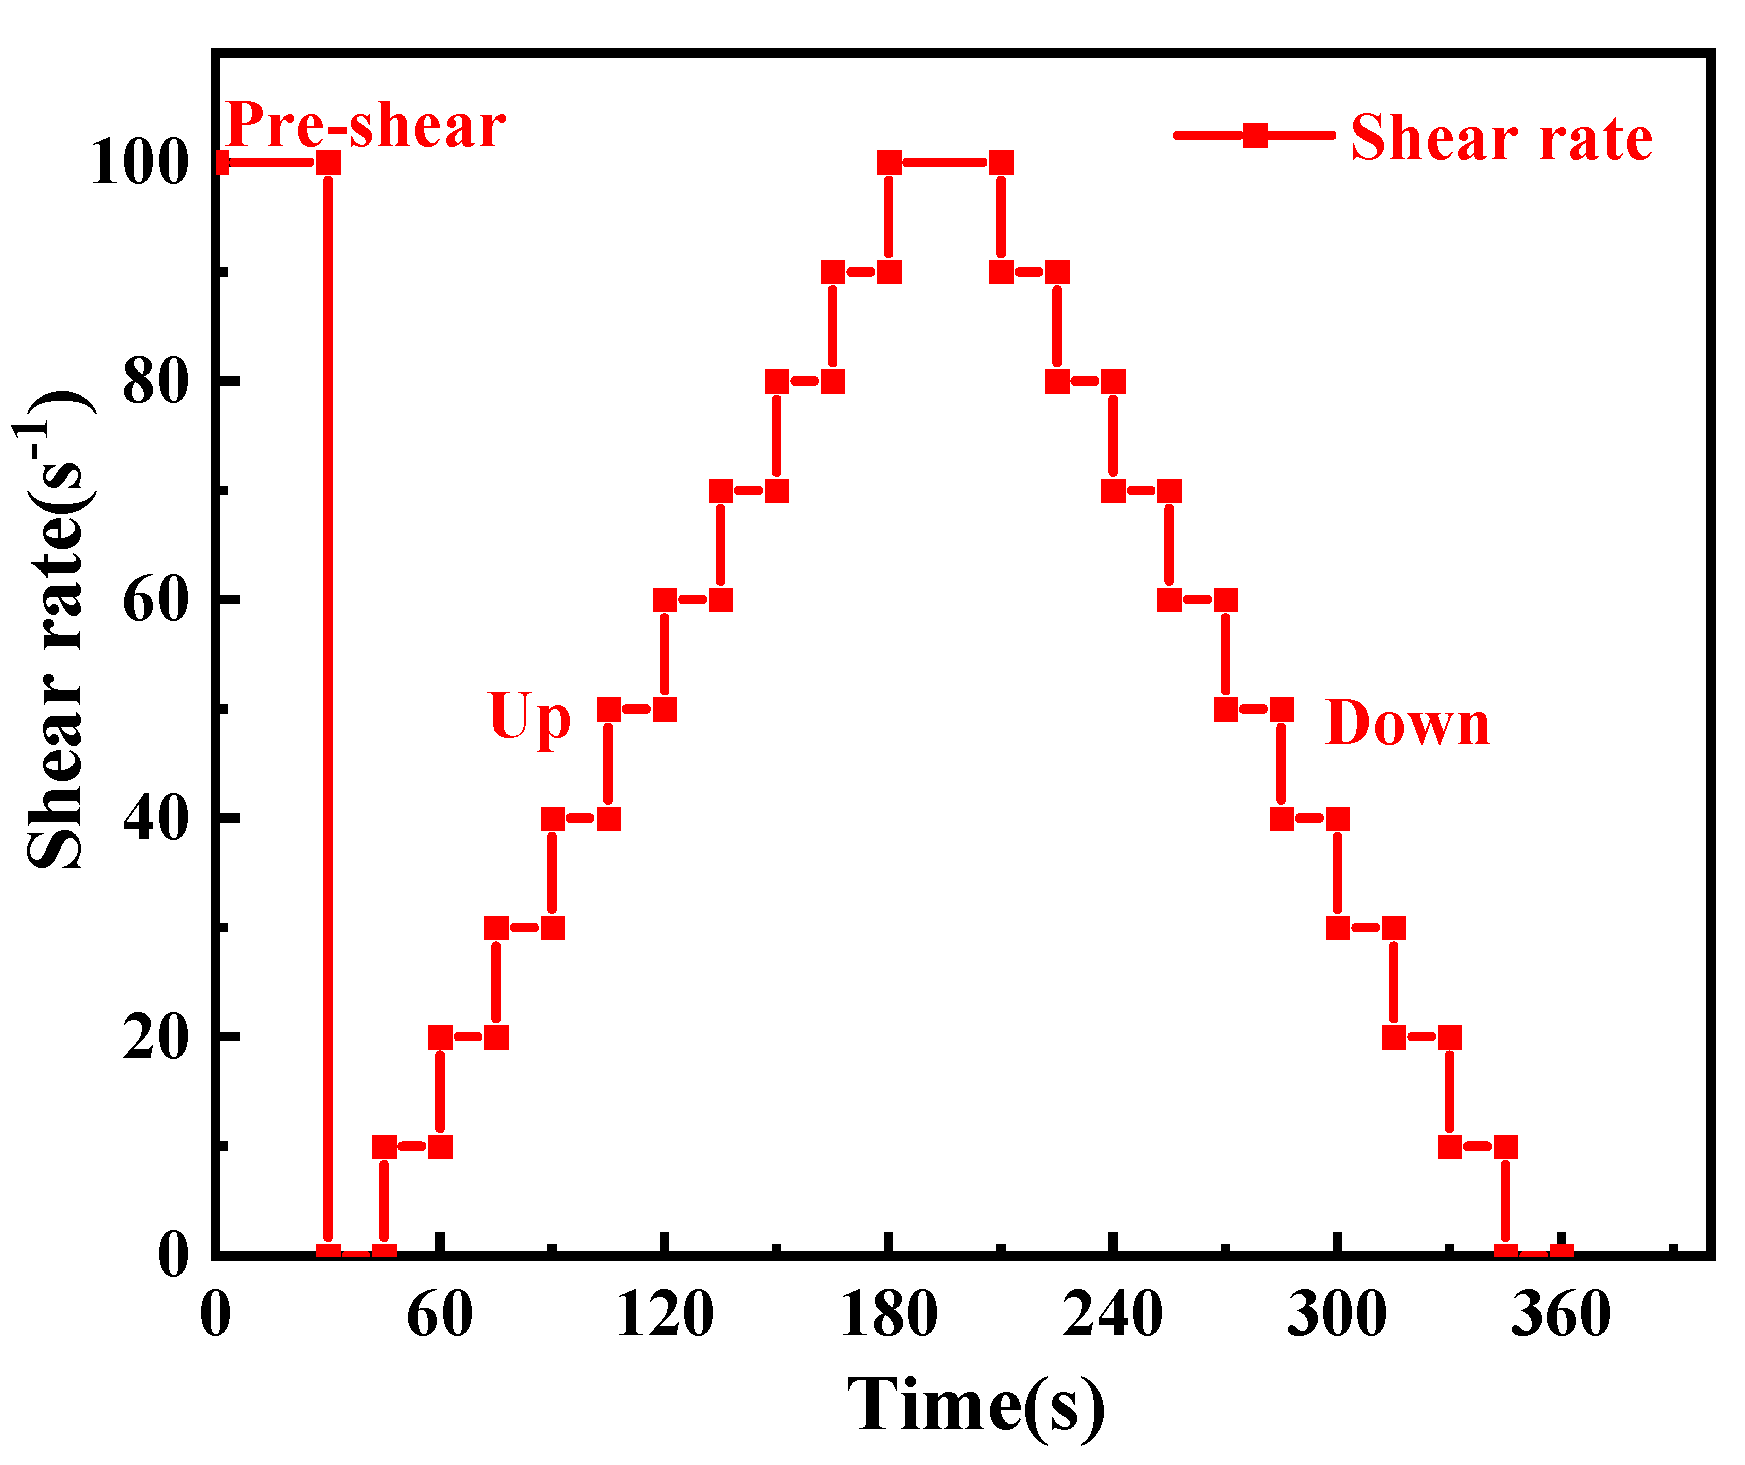
2.3.3. Rheological Performance Test
- Yield stress and viscosity test
- 2.
- Small-amplitude oscillatory shear (SAOS)
2.3.4. Calorimetric Test
2.3.5. Ion Concentration in Solution
2.3.6. X-Ray Diffraction (XRD)
2.3.7. Thermogravimetric (TG) Analysis
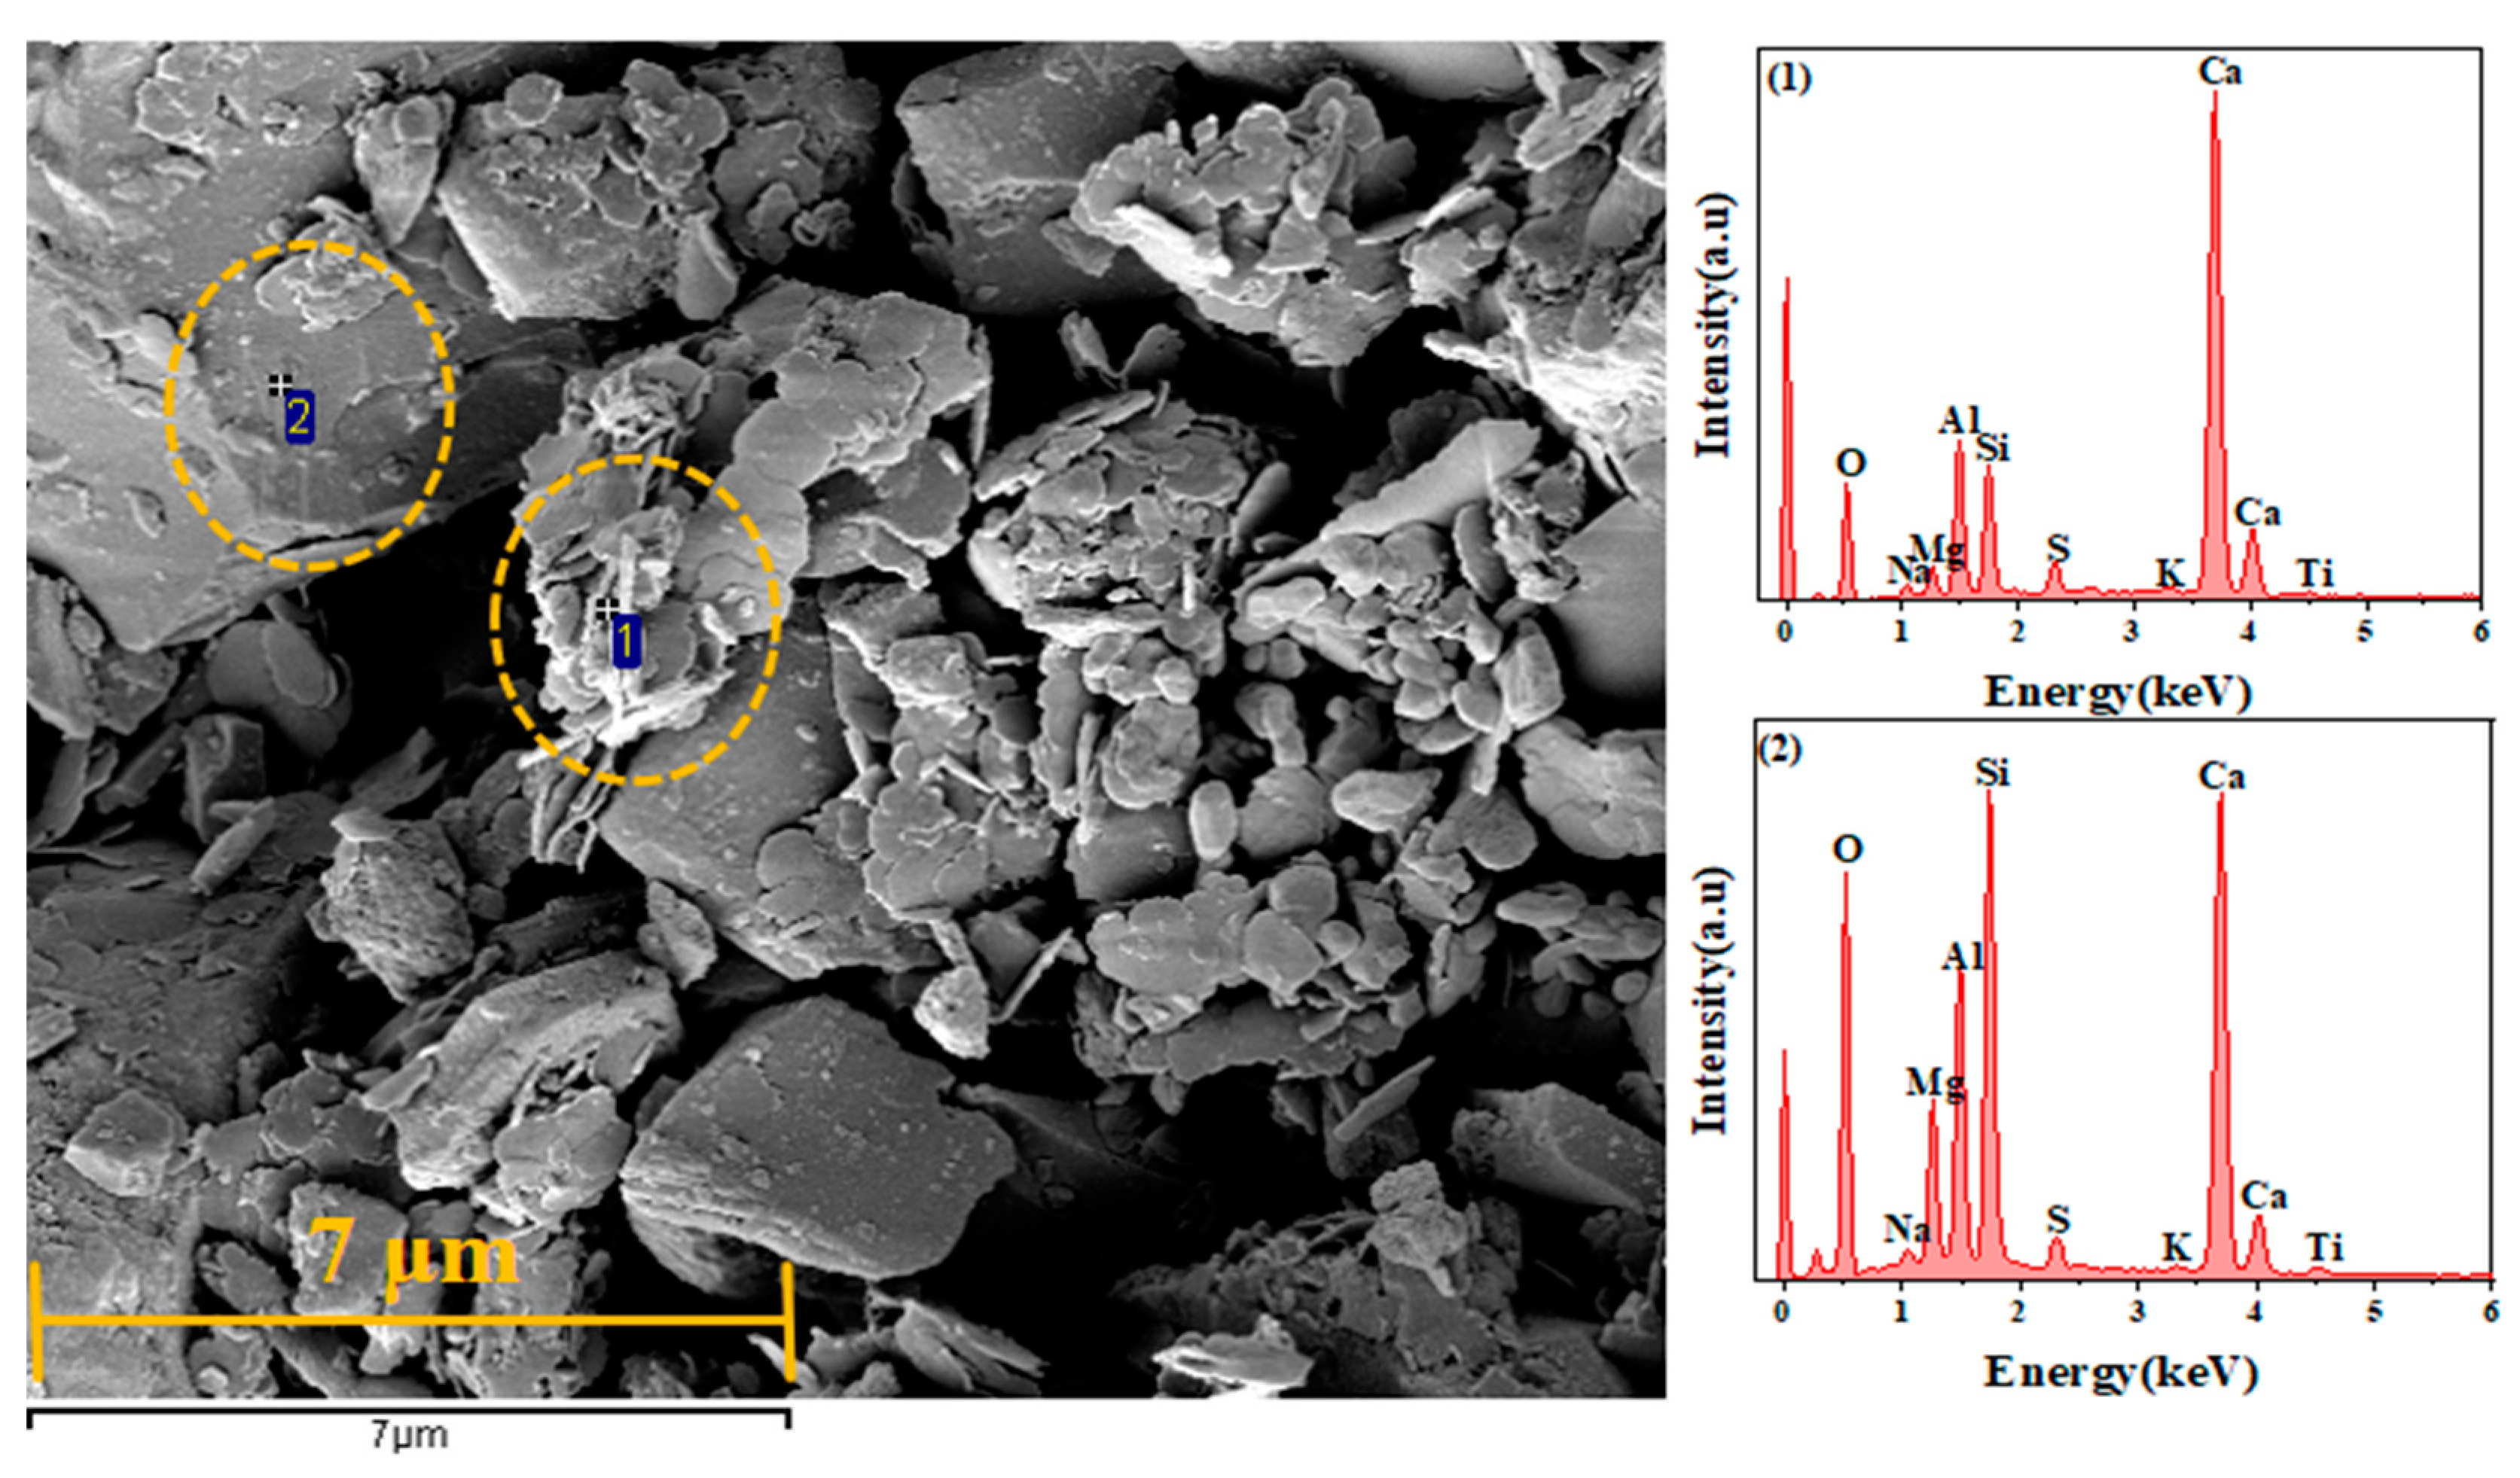
2.3.8. SEM-EDS
2.3.9. Quantitative Analysis of Hydration Products
3. Results
3.1. Effect of SA on Workability Performances of SSC
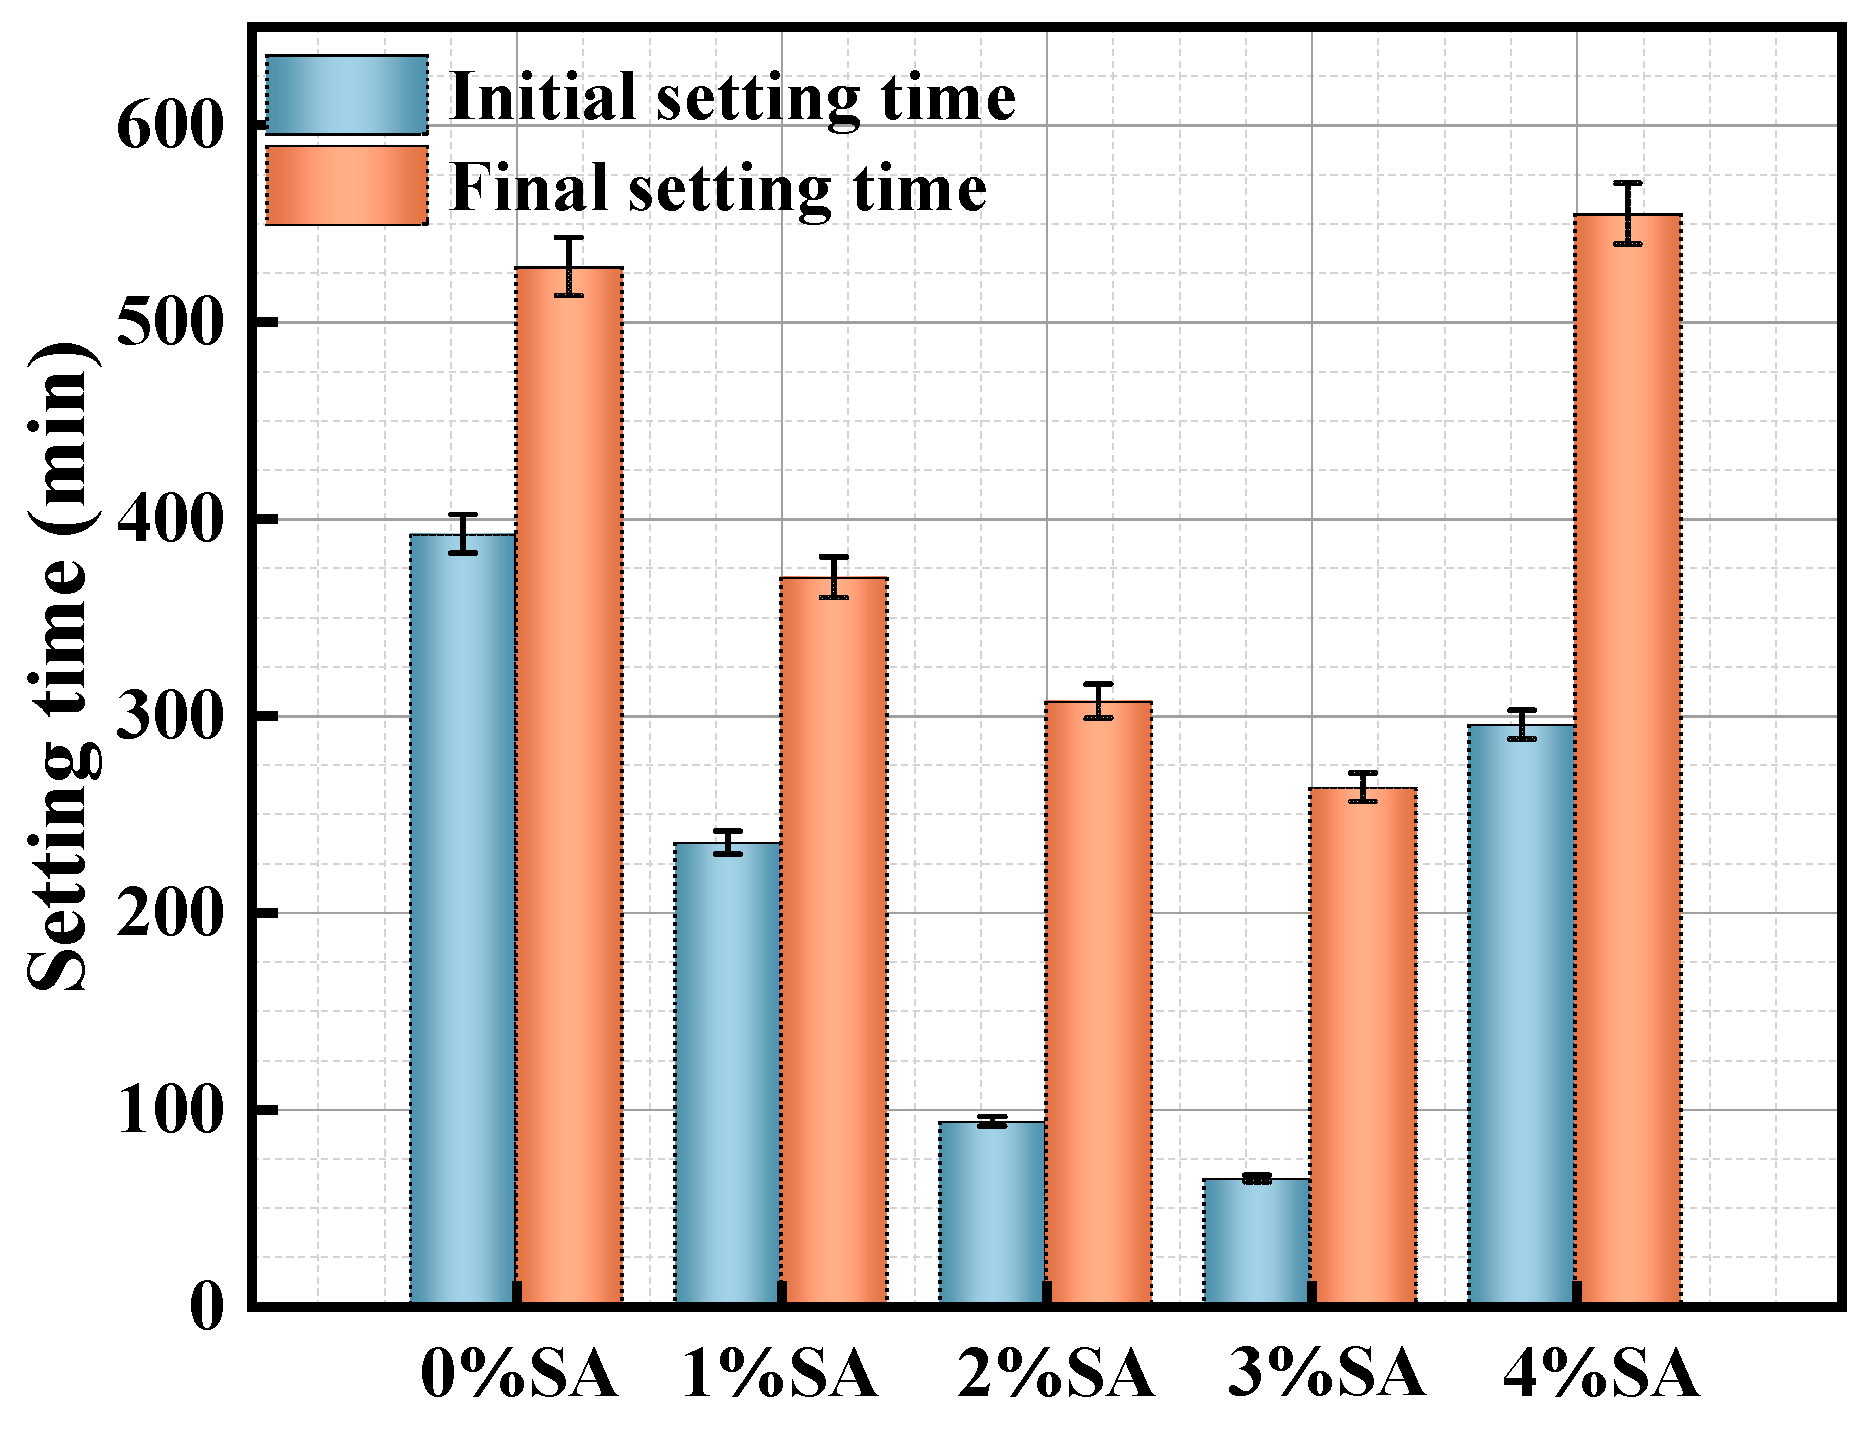
3.1.1. Setting Time
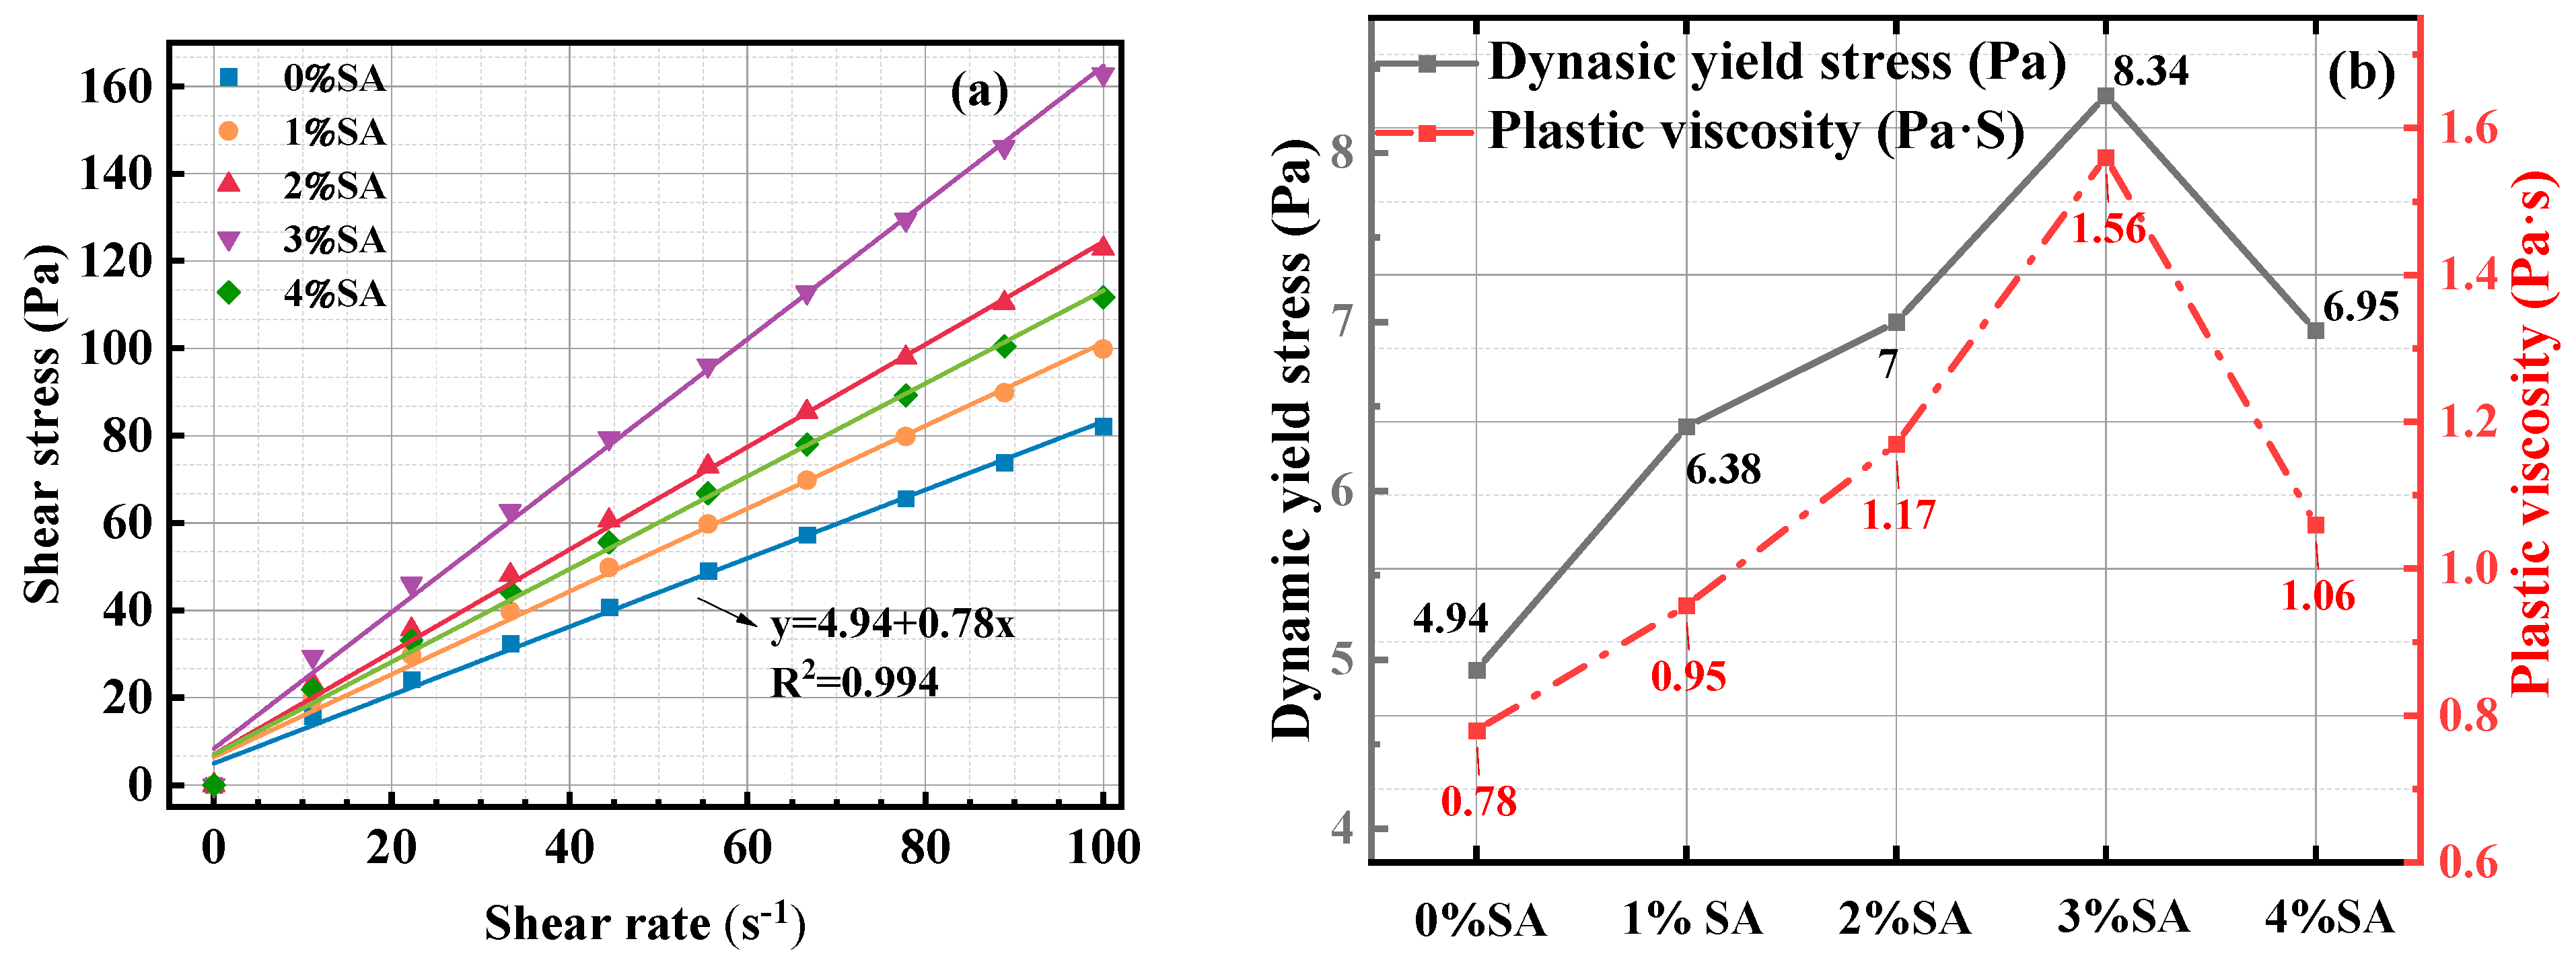
3.1.2. Viscosity Test
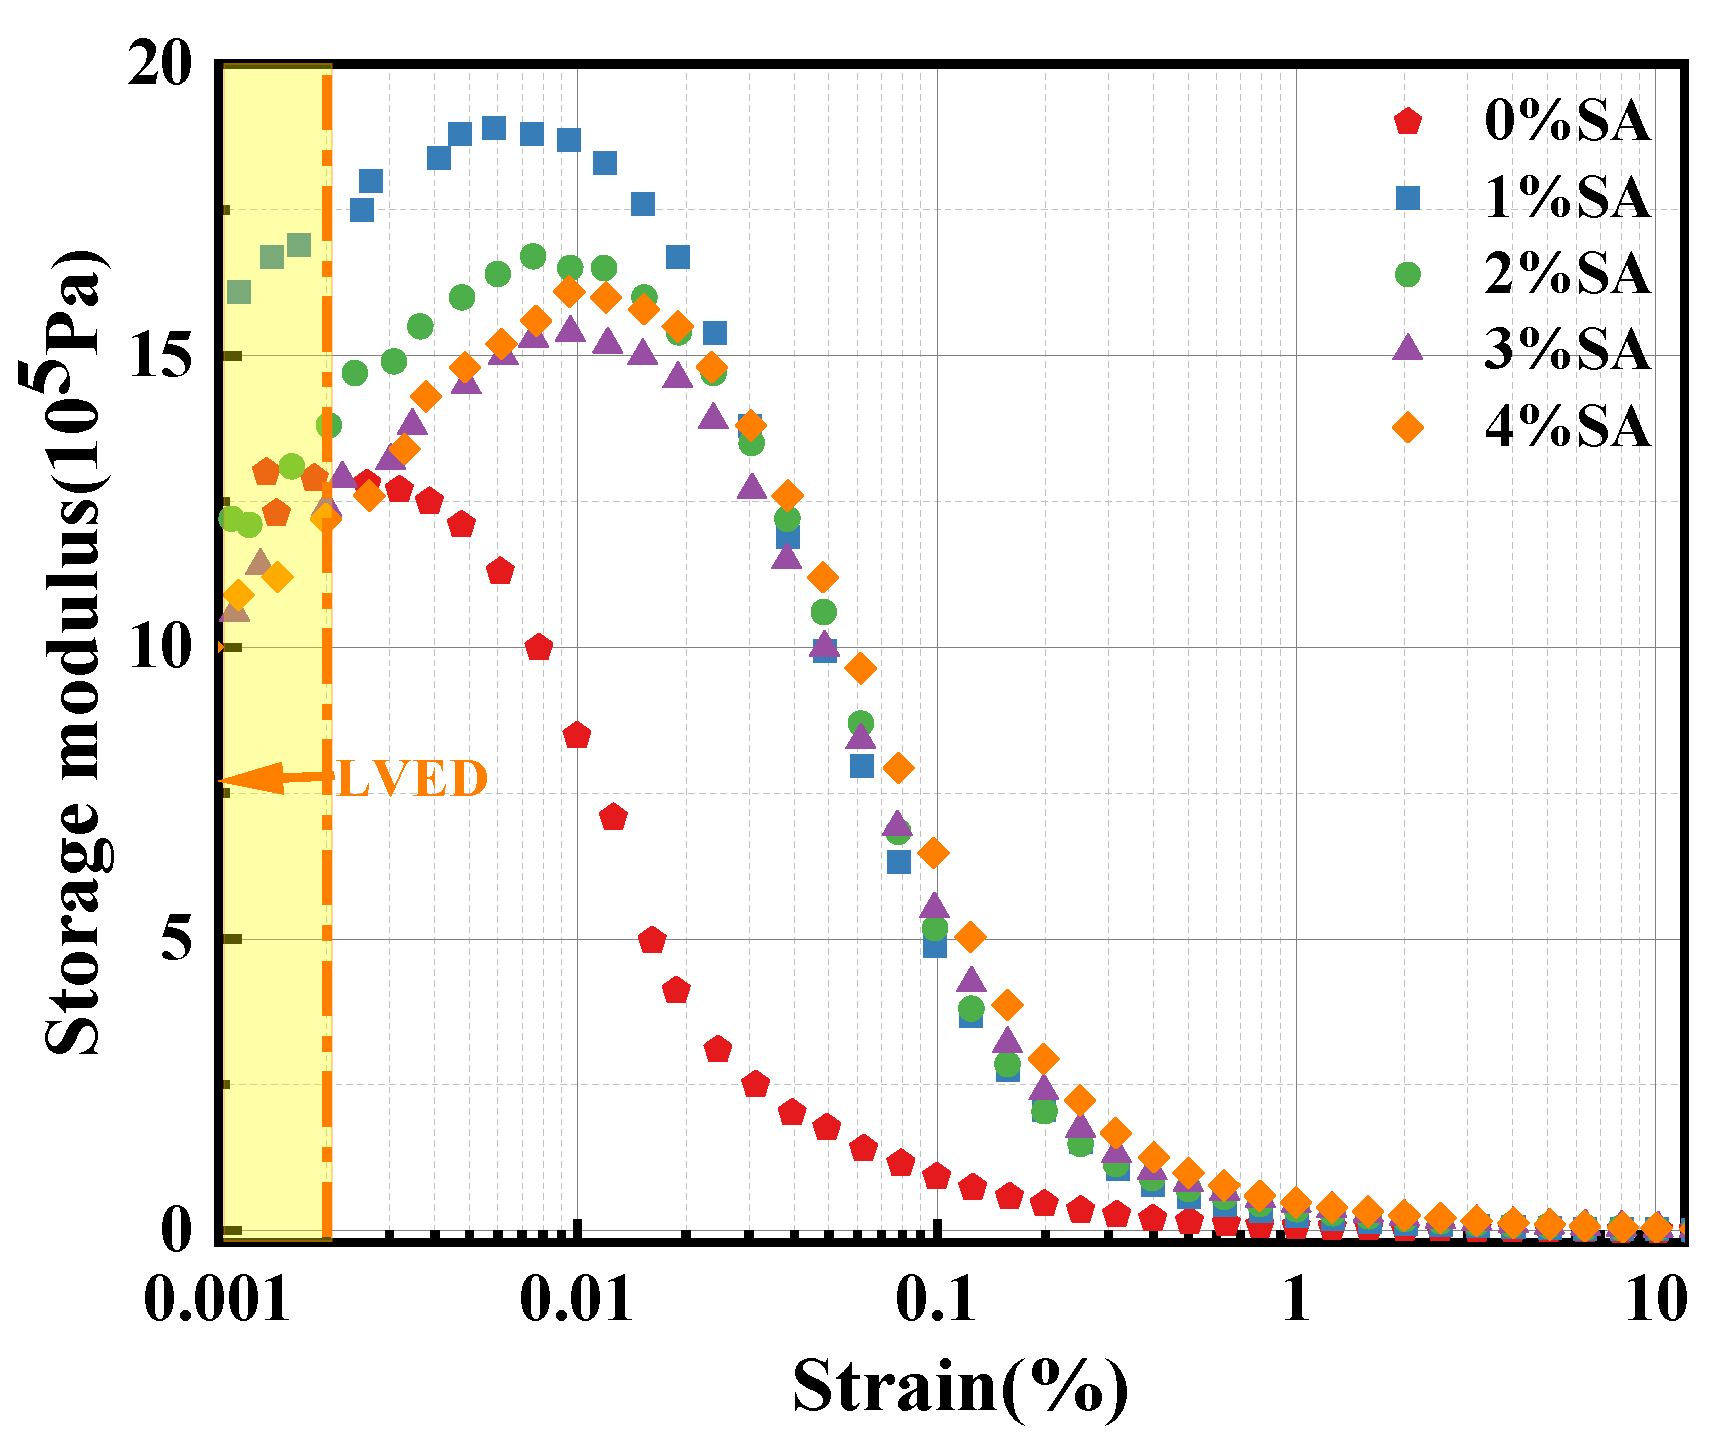
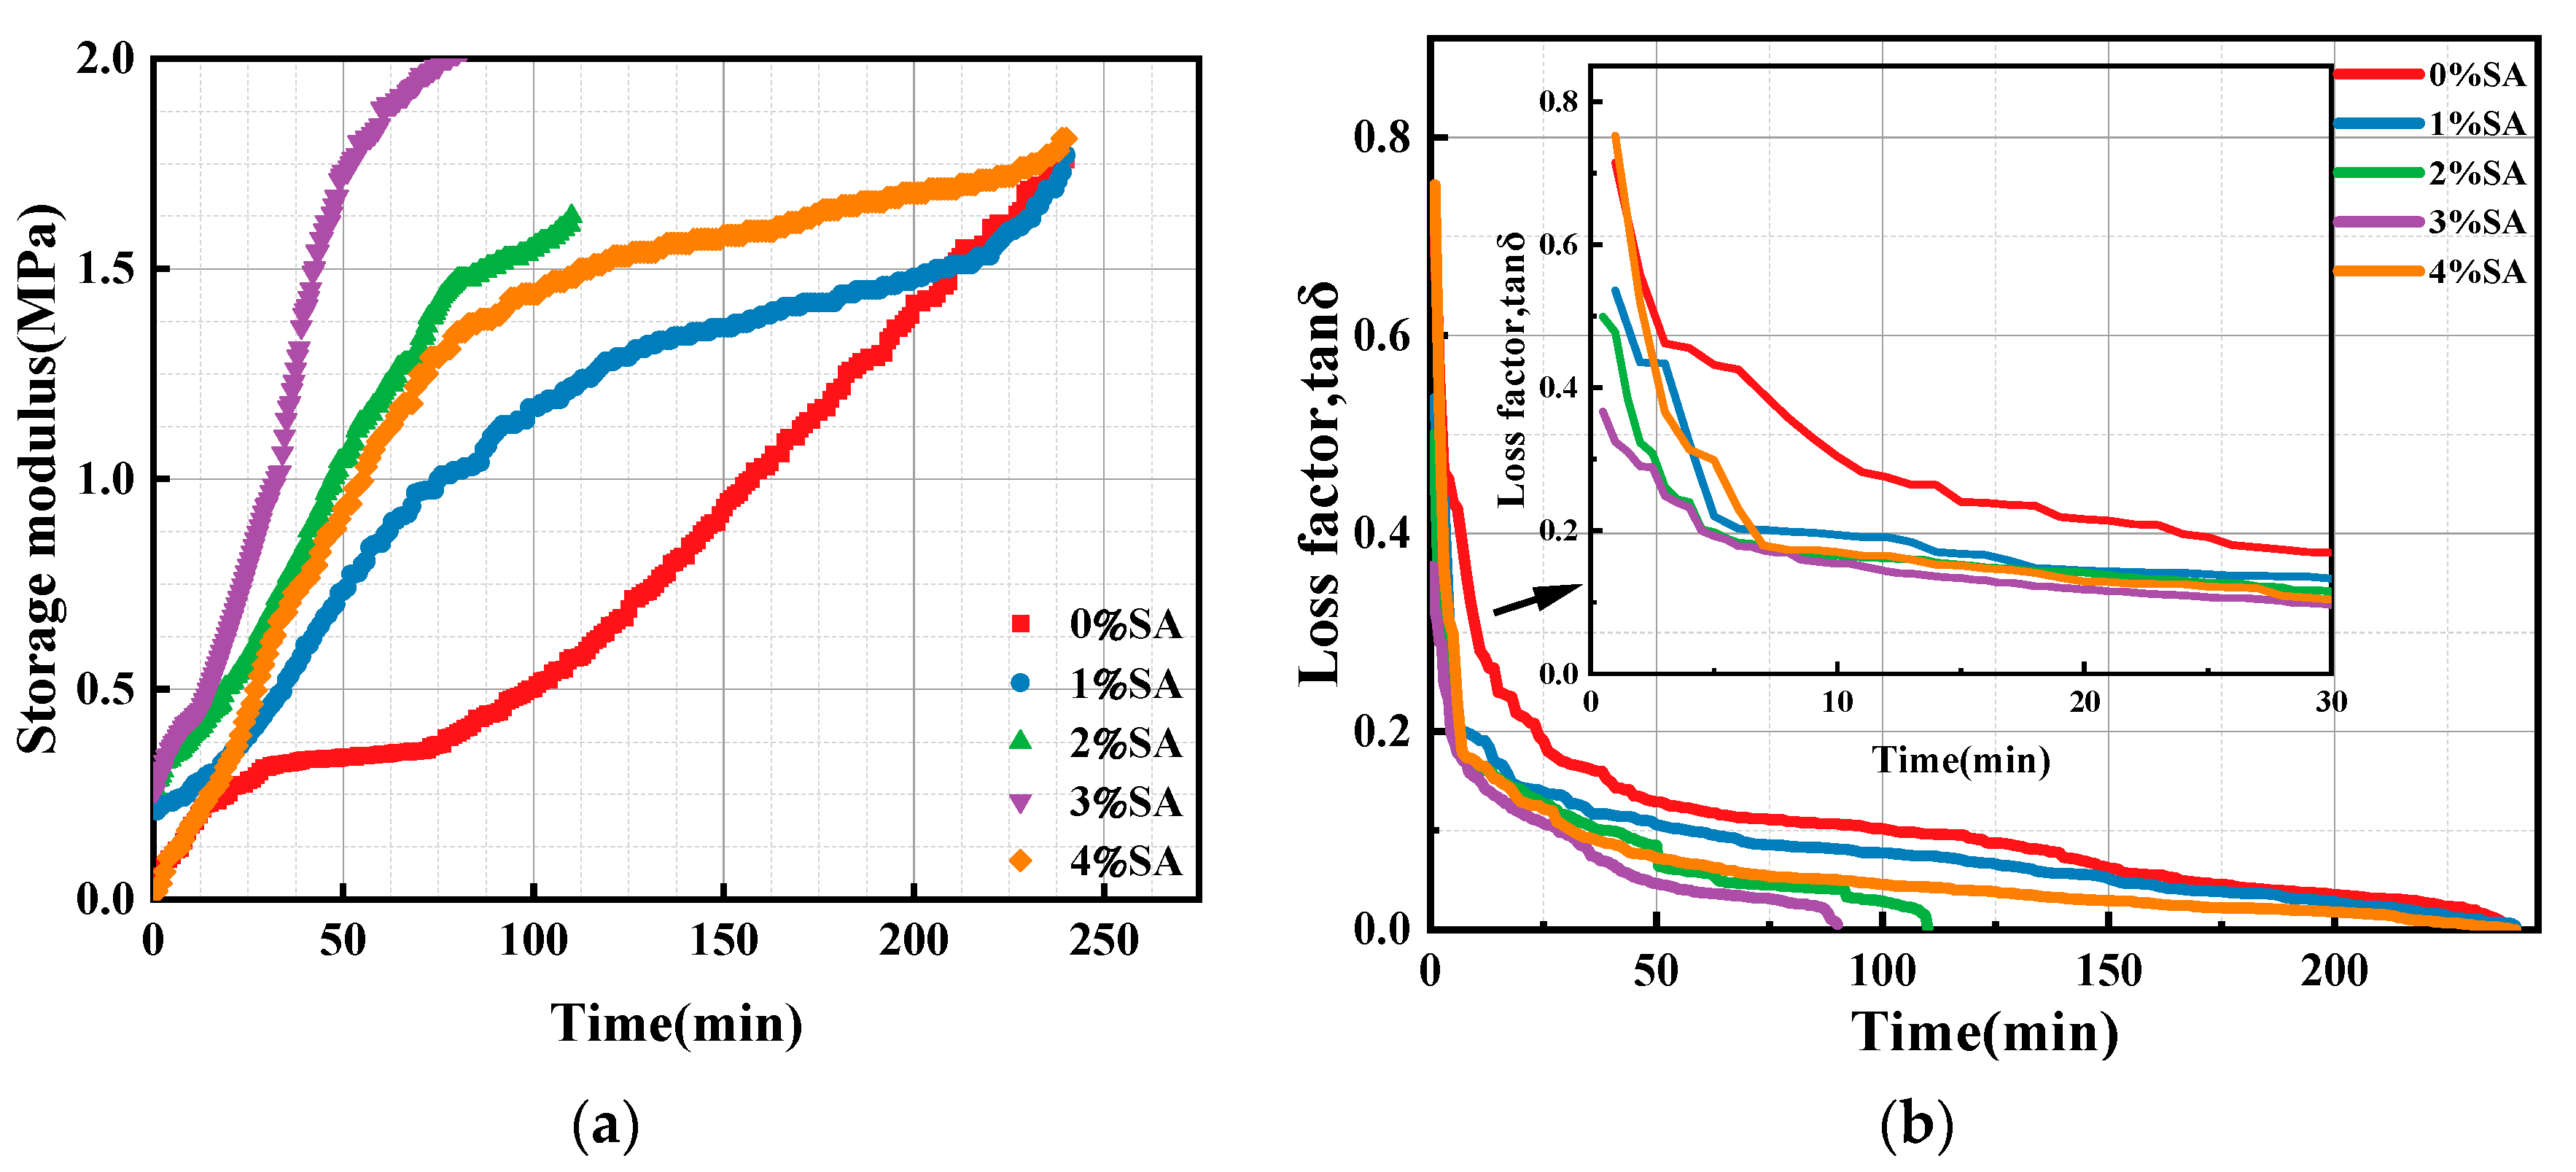
3.1.3. Effect of SA on the Storage Modulus of SSC Paste
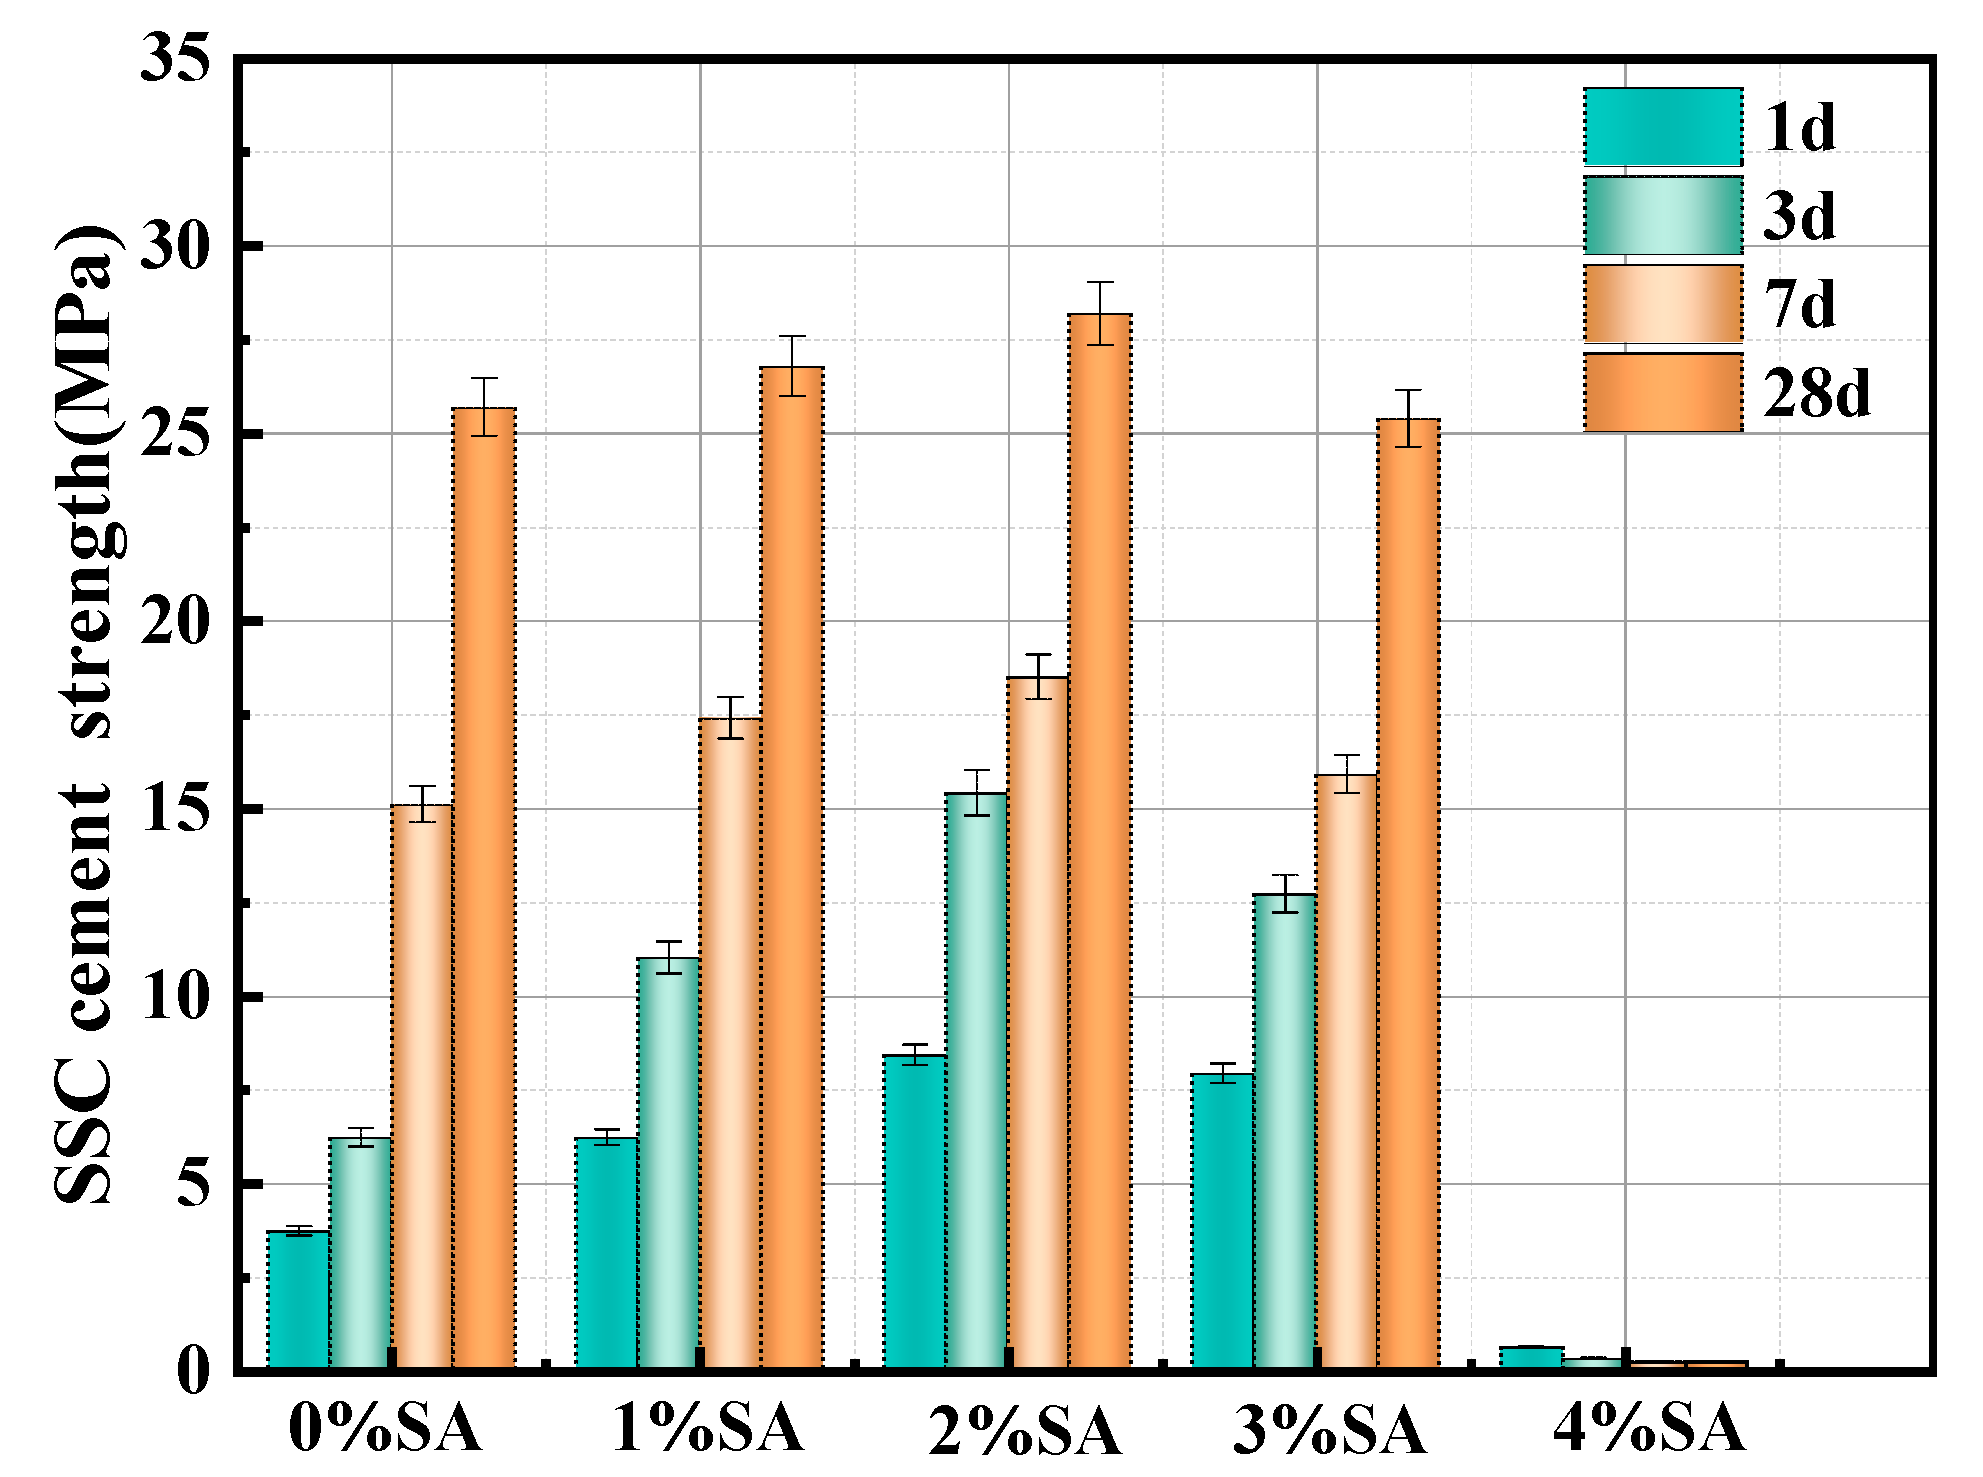
3.2. Compressive Strength
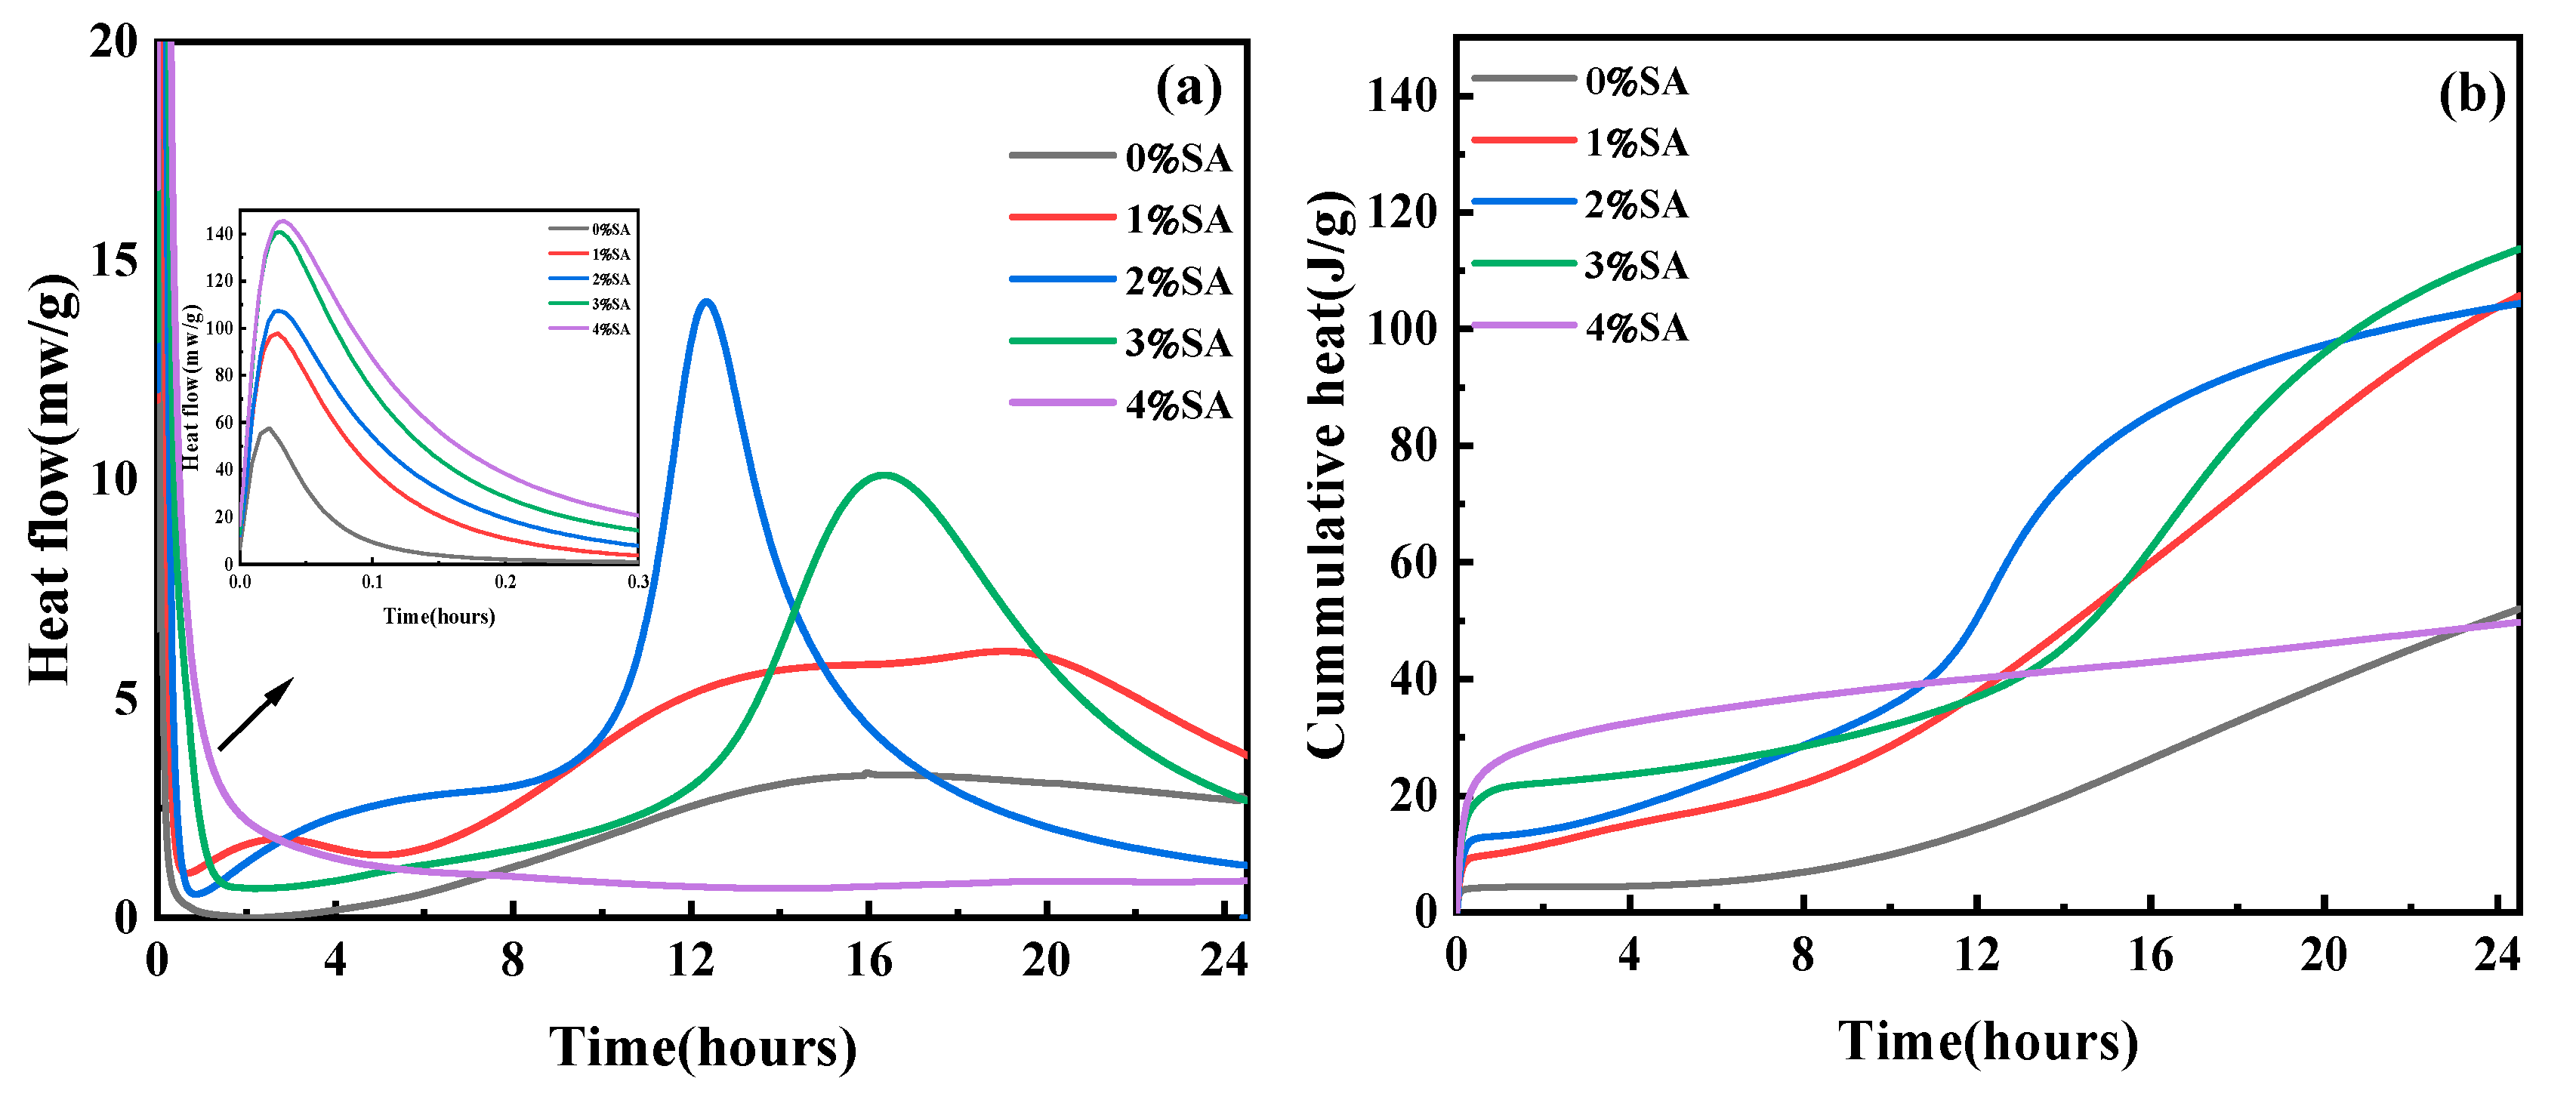
3.3. Hydration Heat
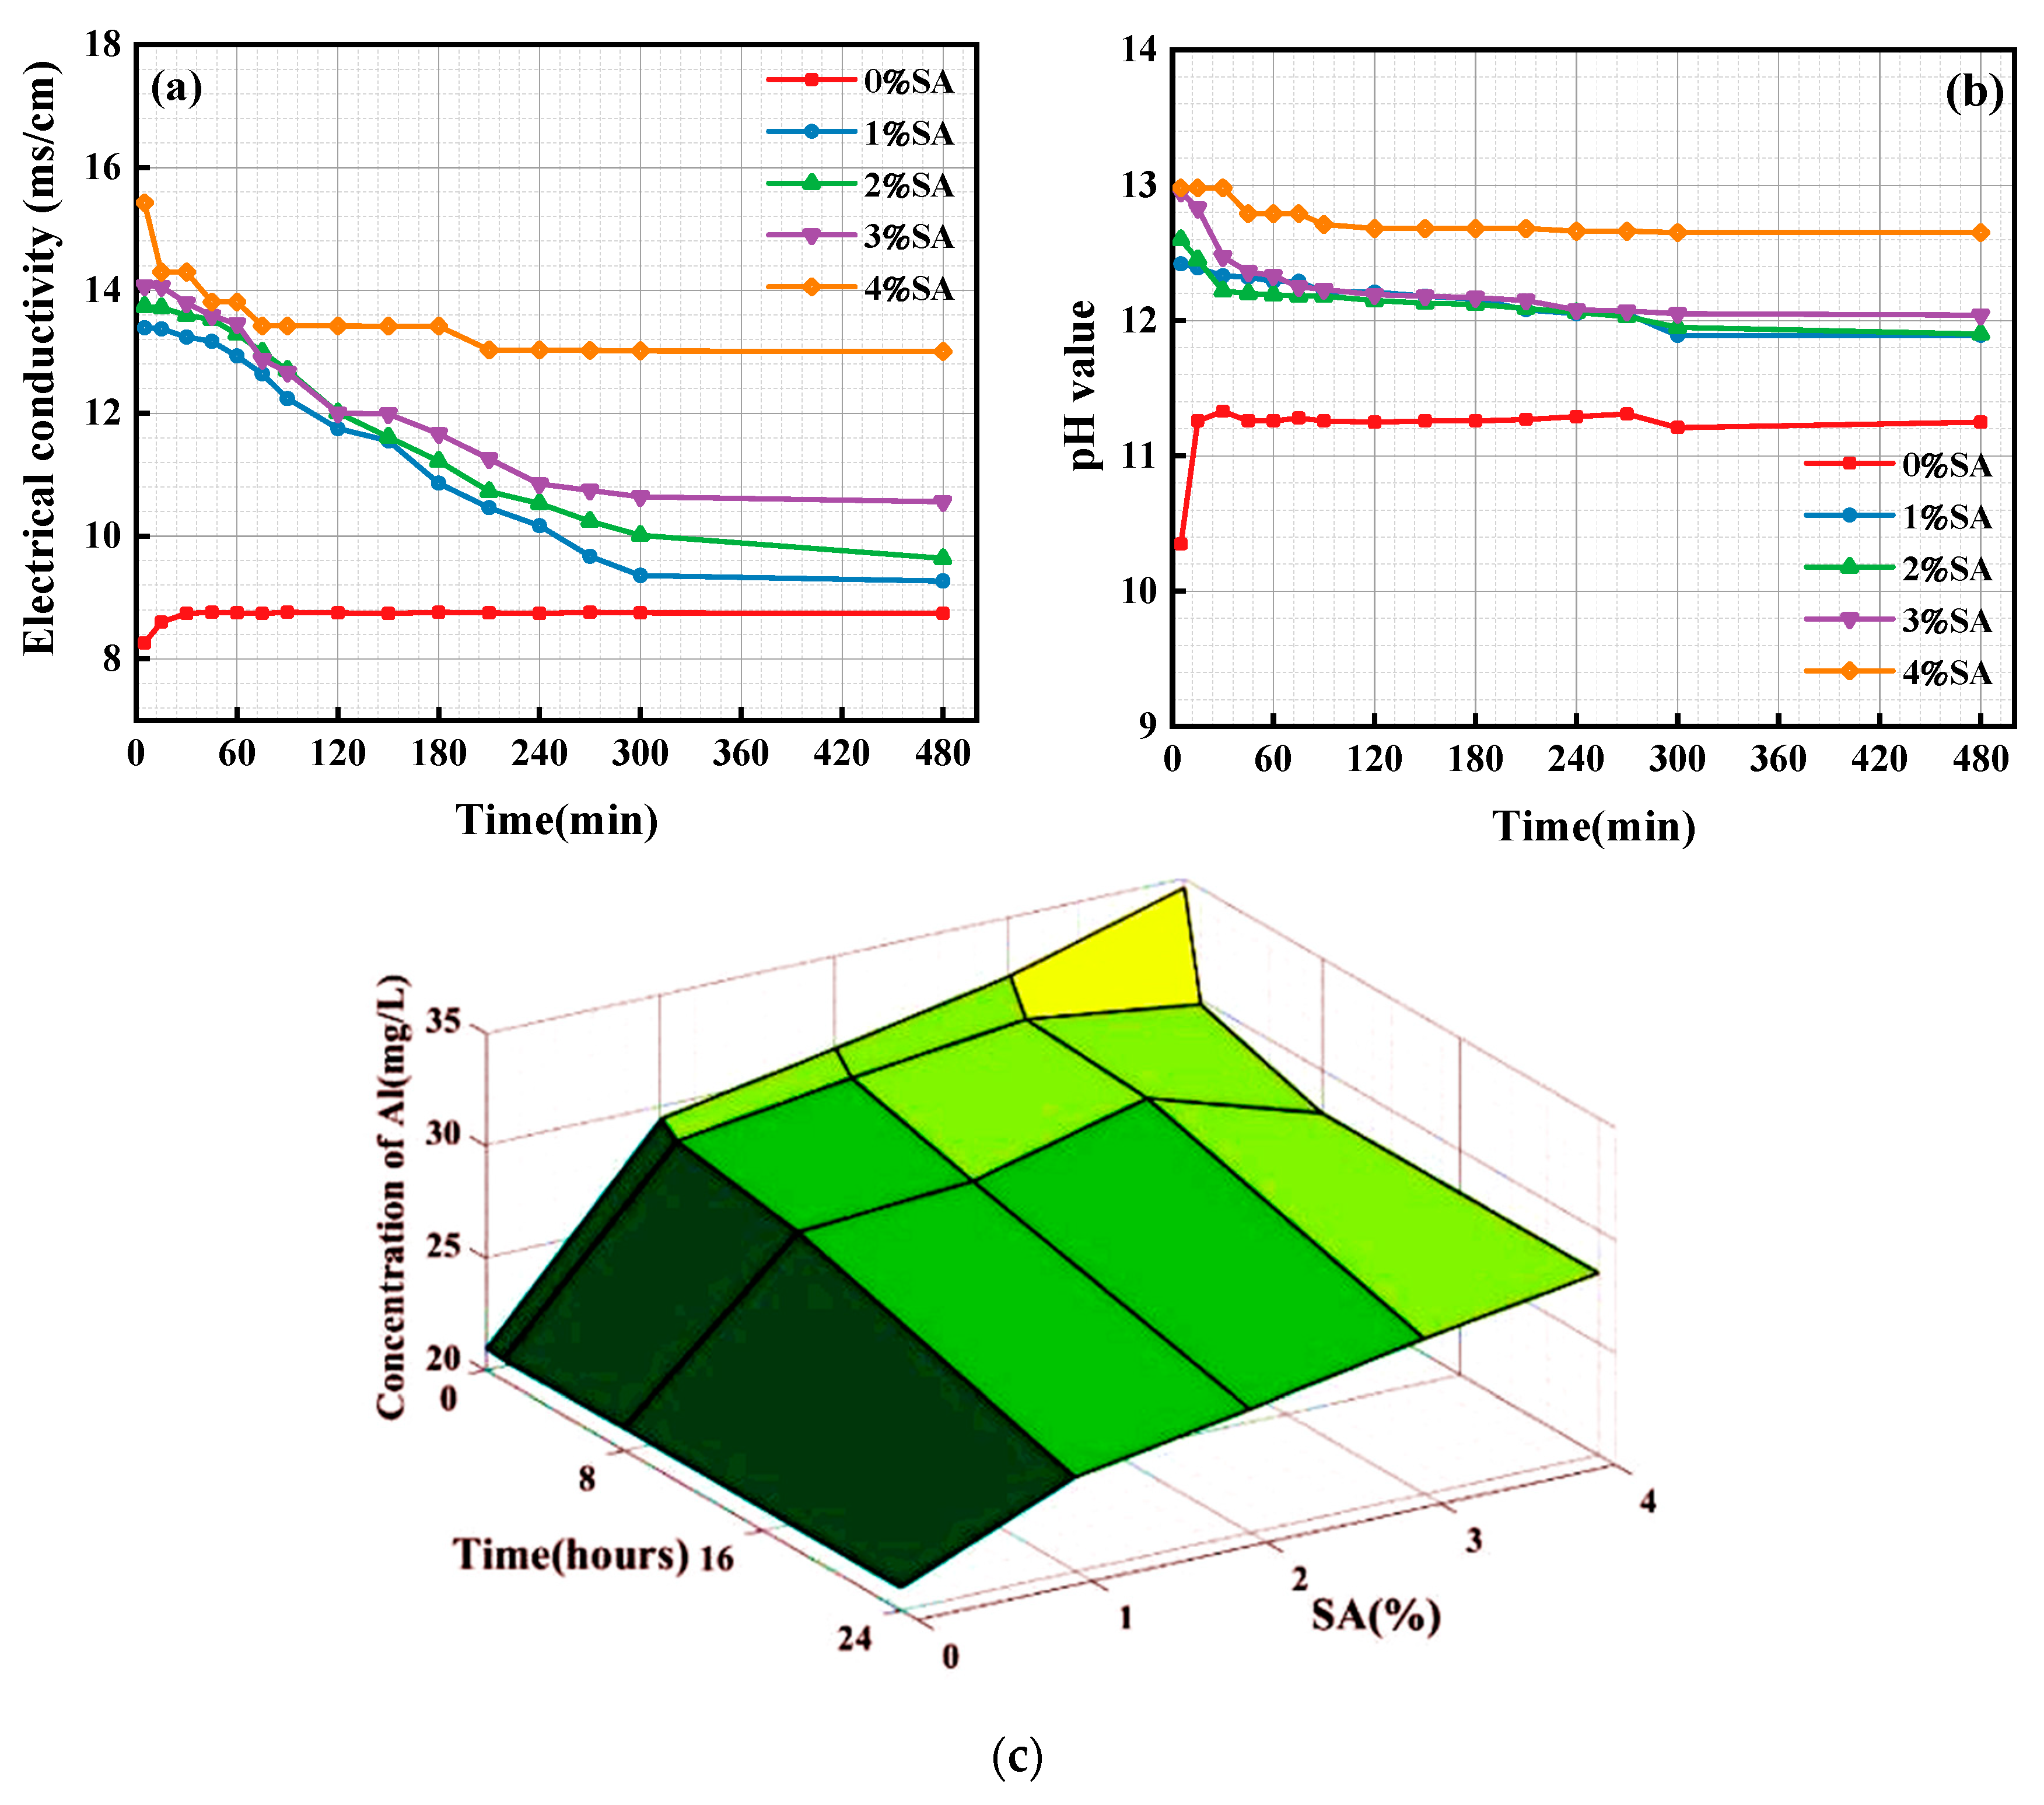
3.4. Ion Concentration and pH in Solution
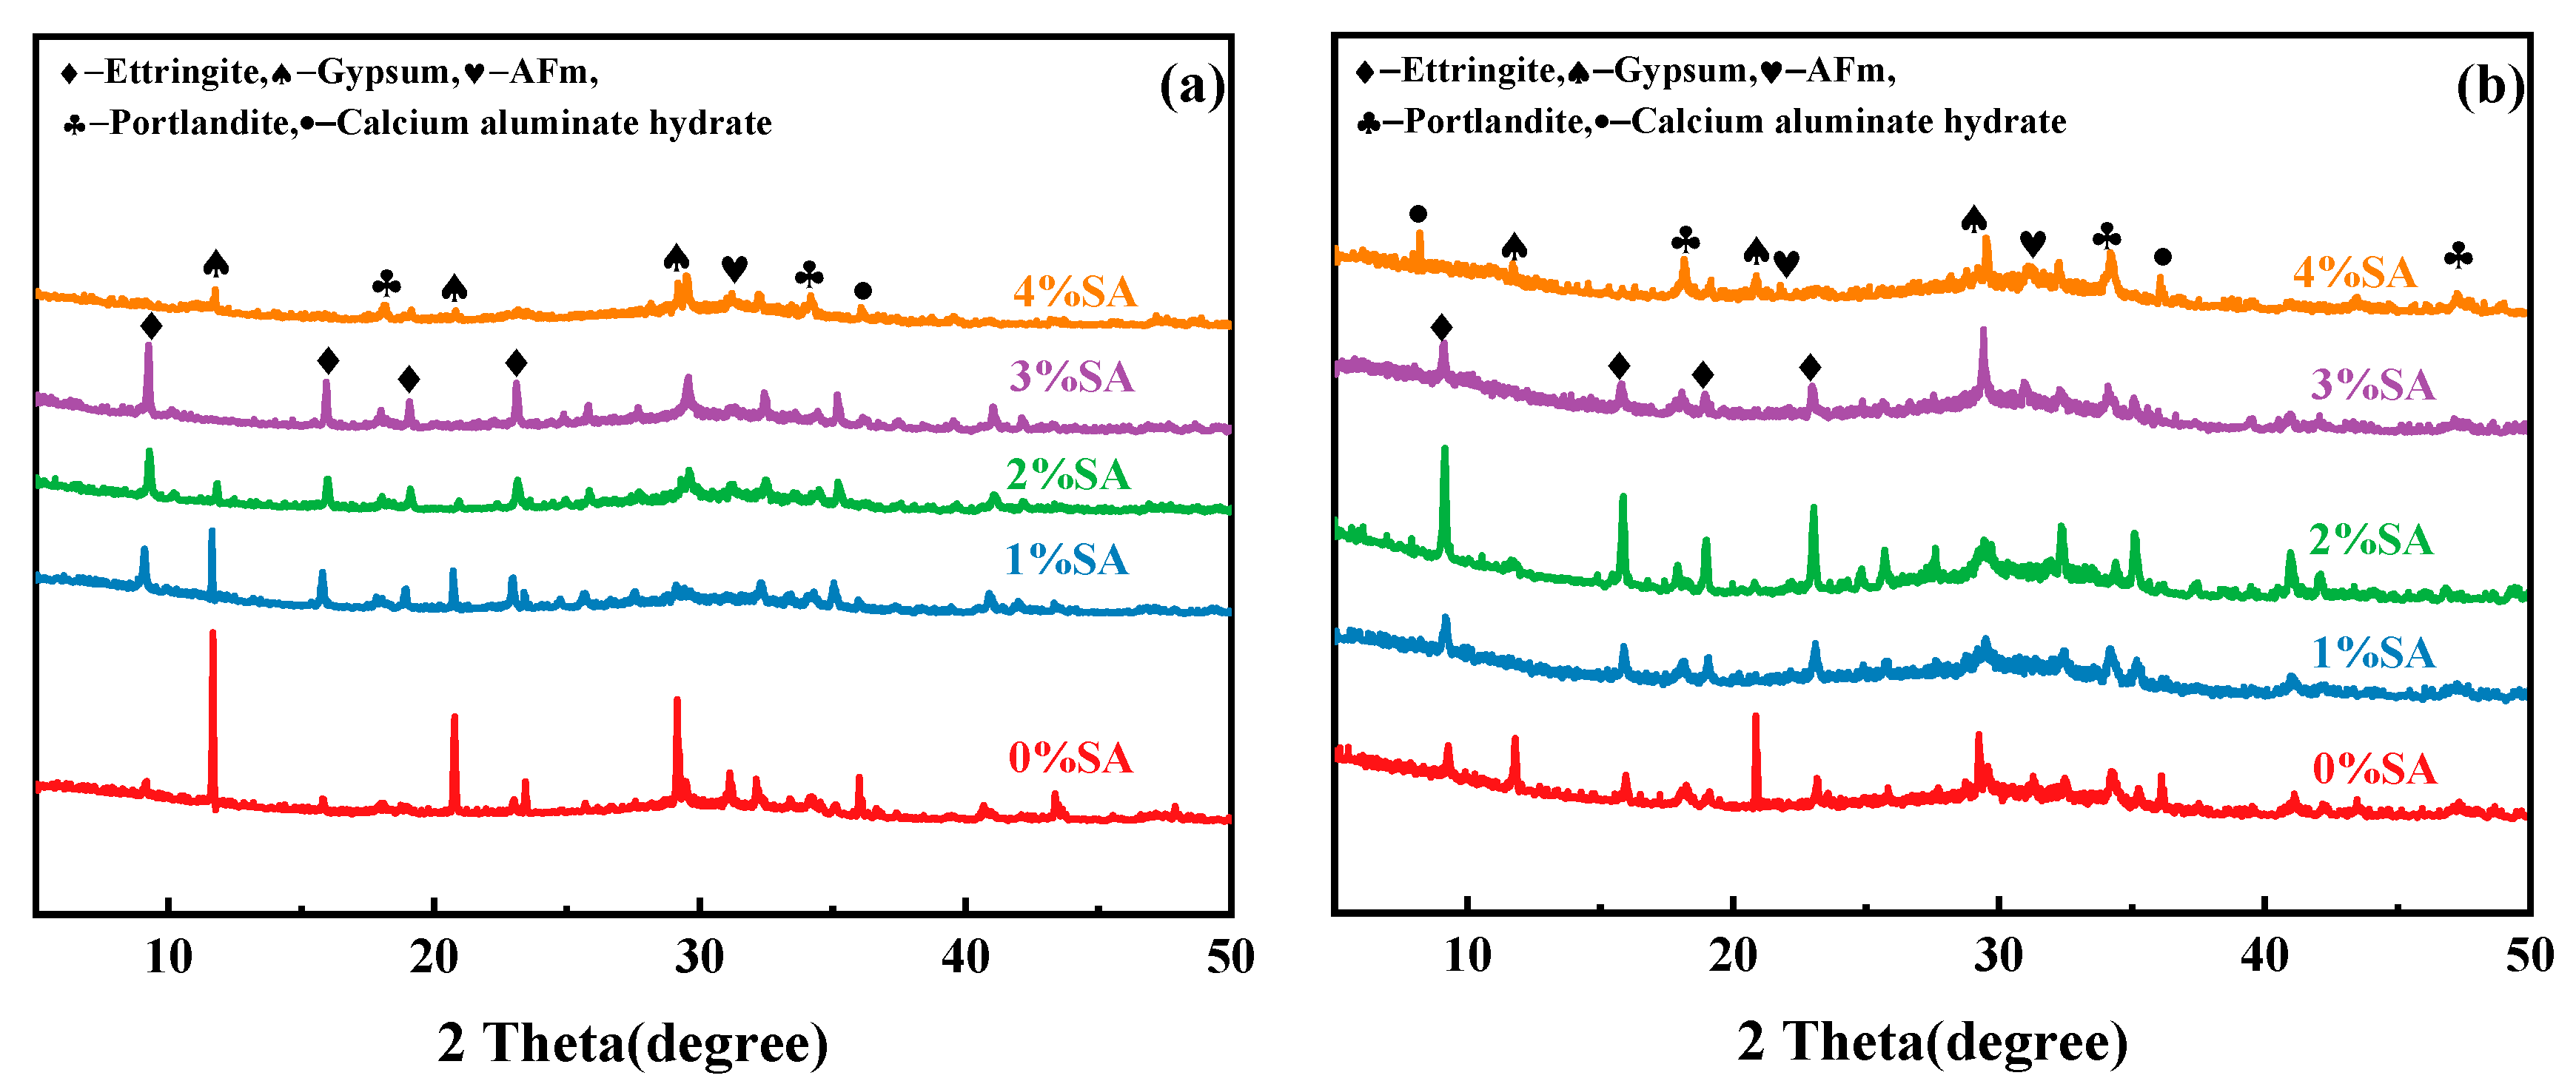
3.5. XRD
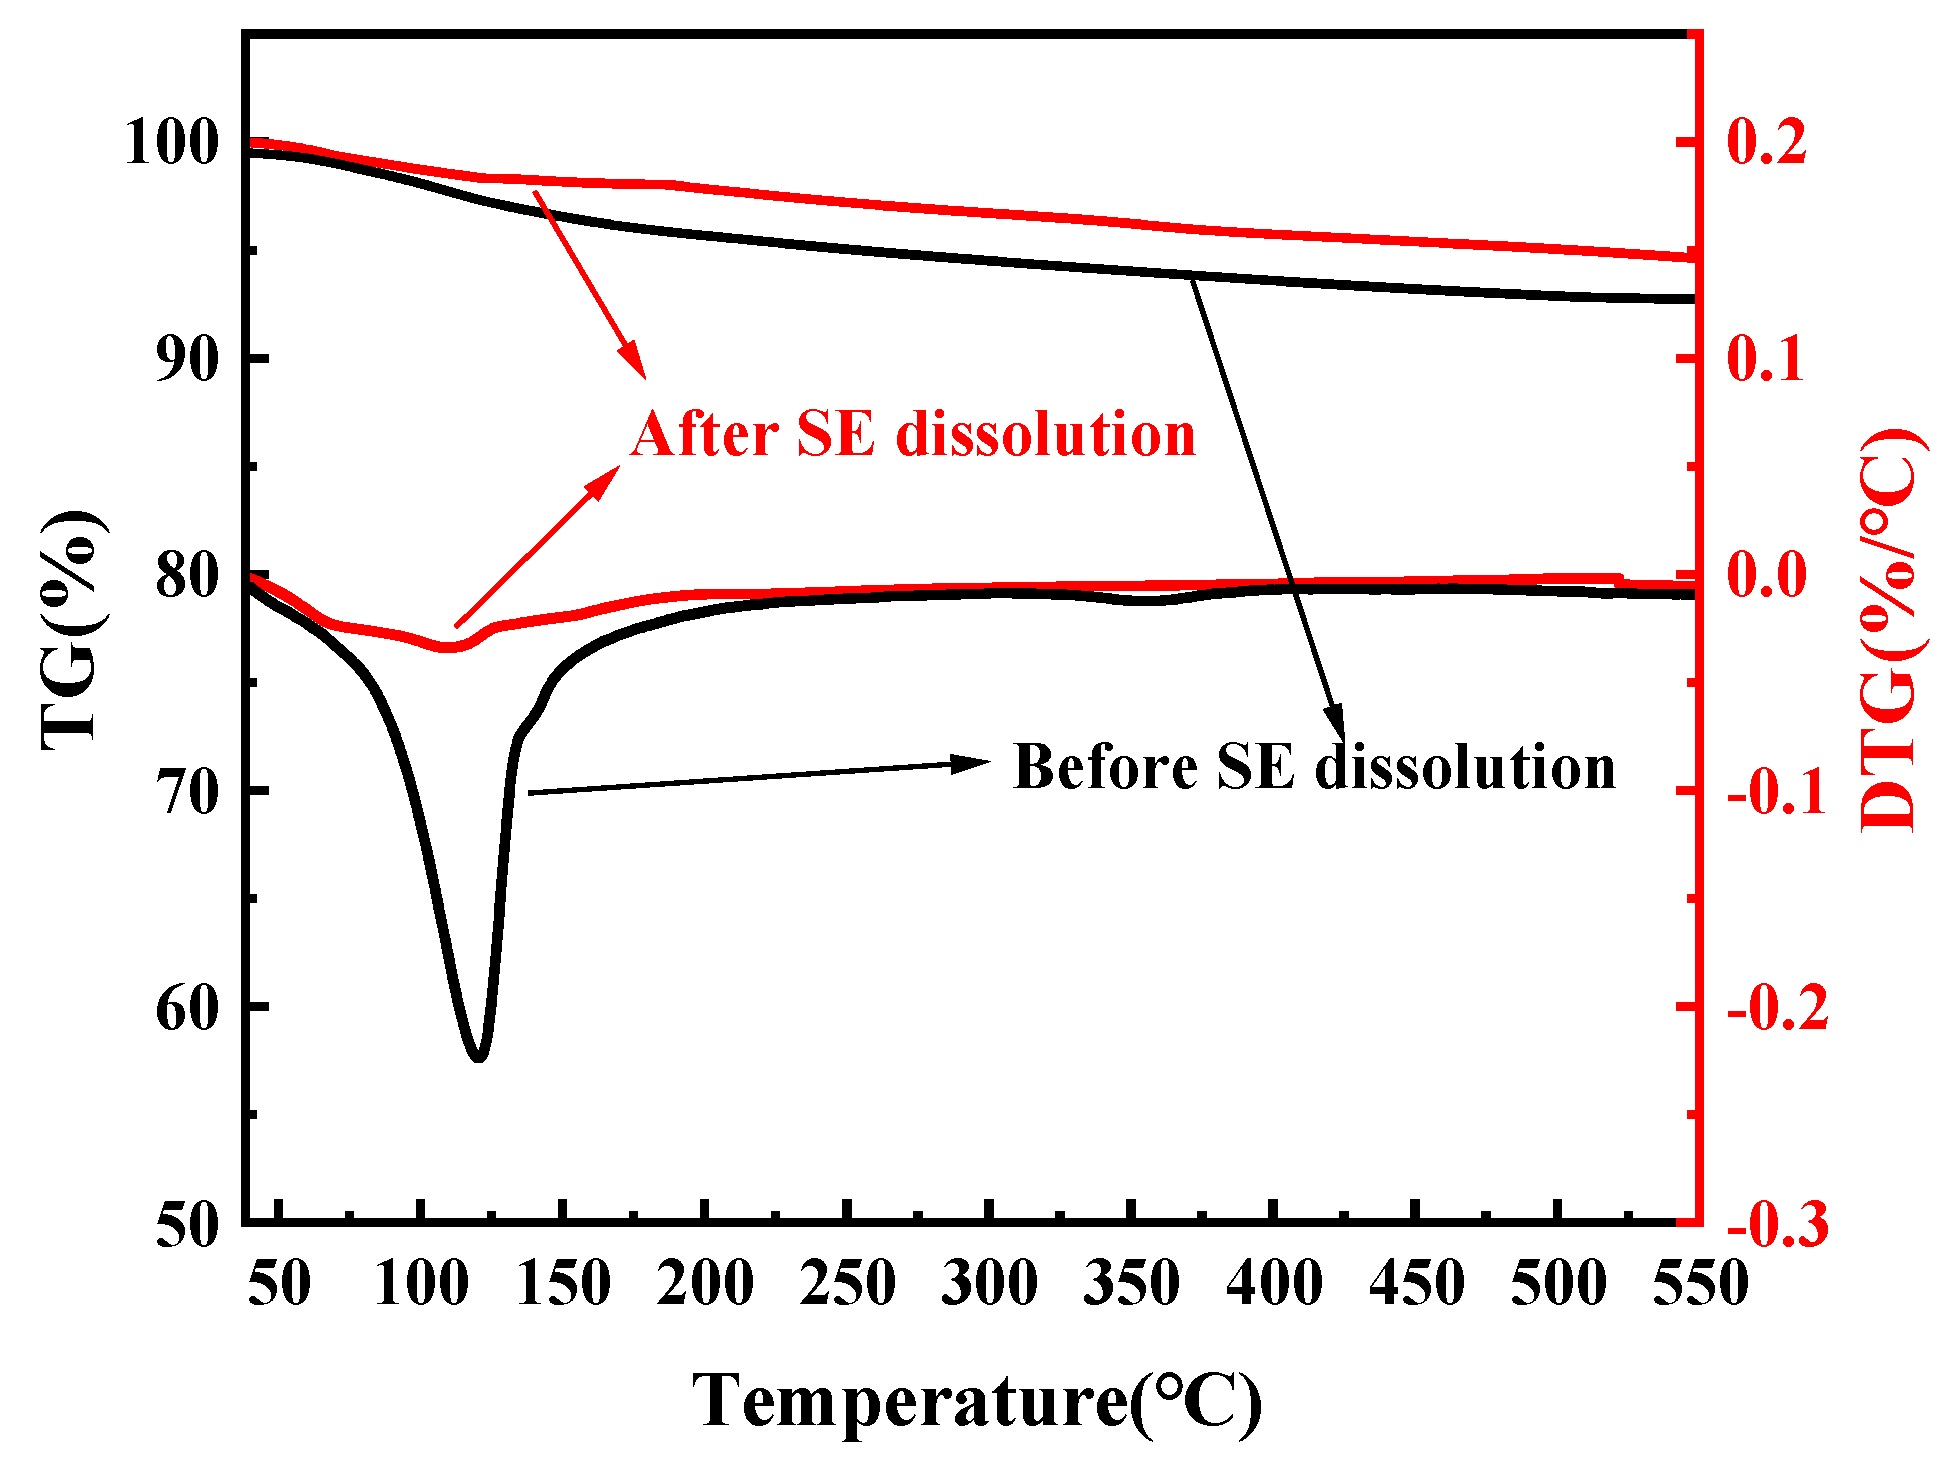
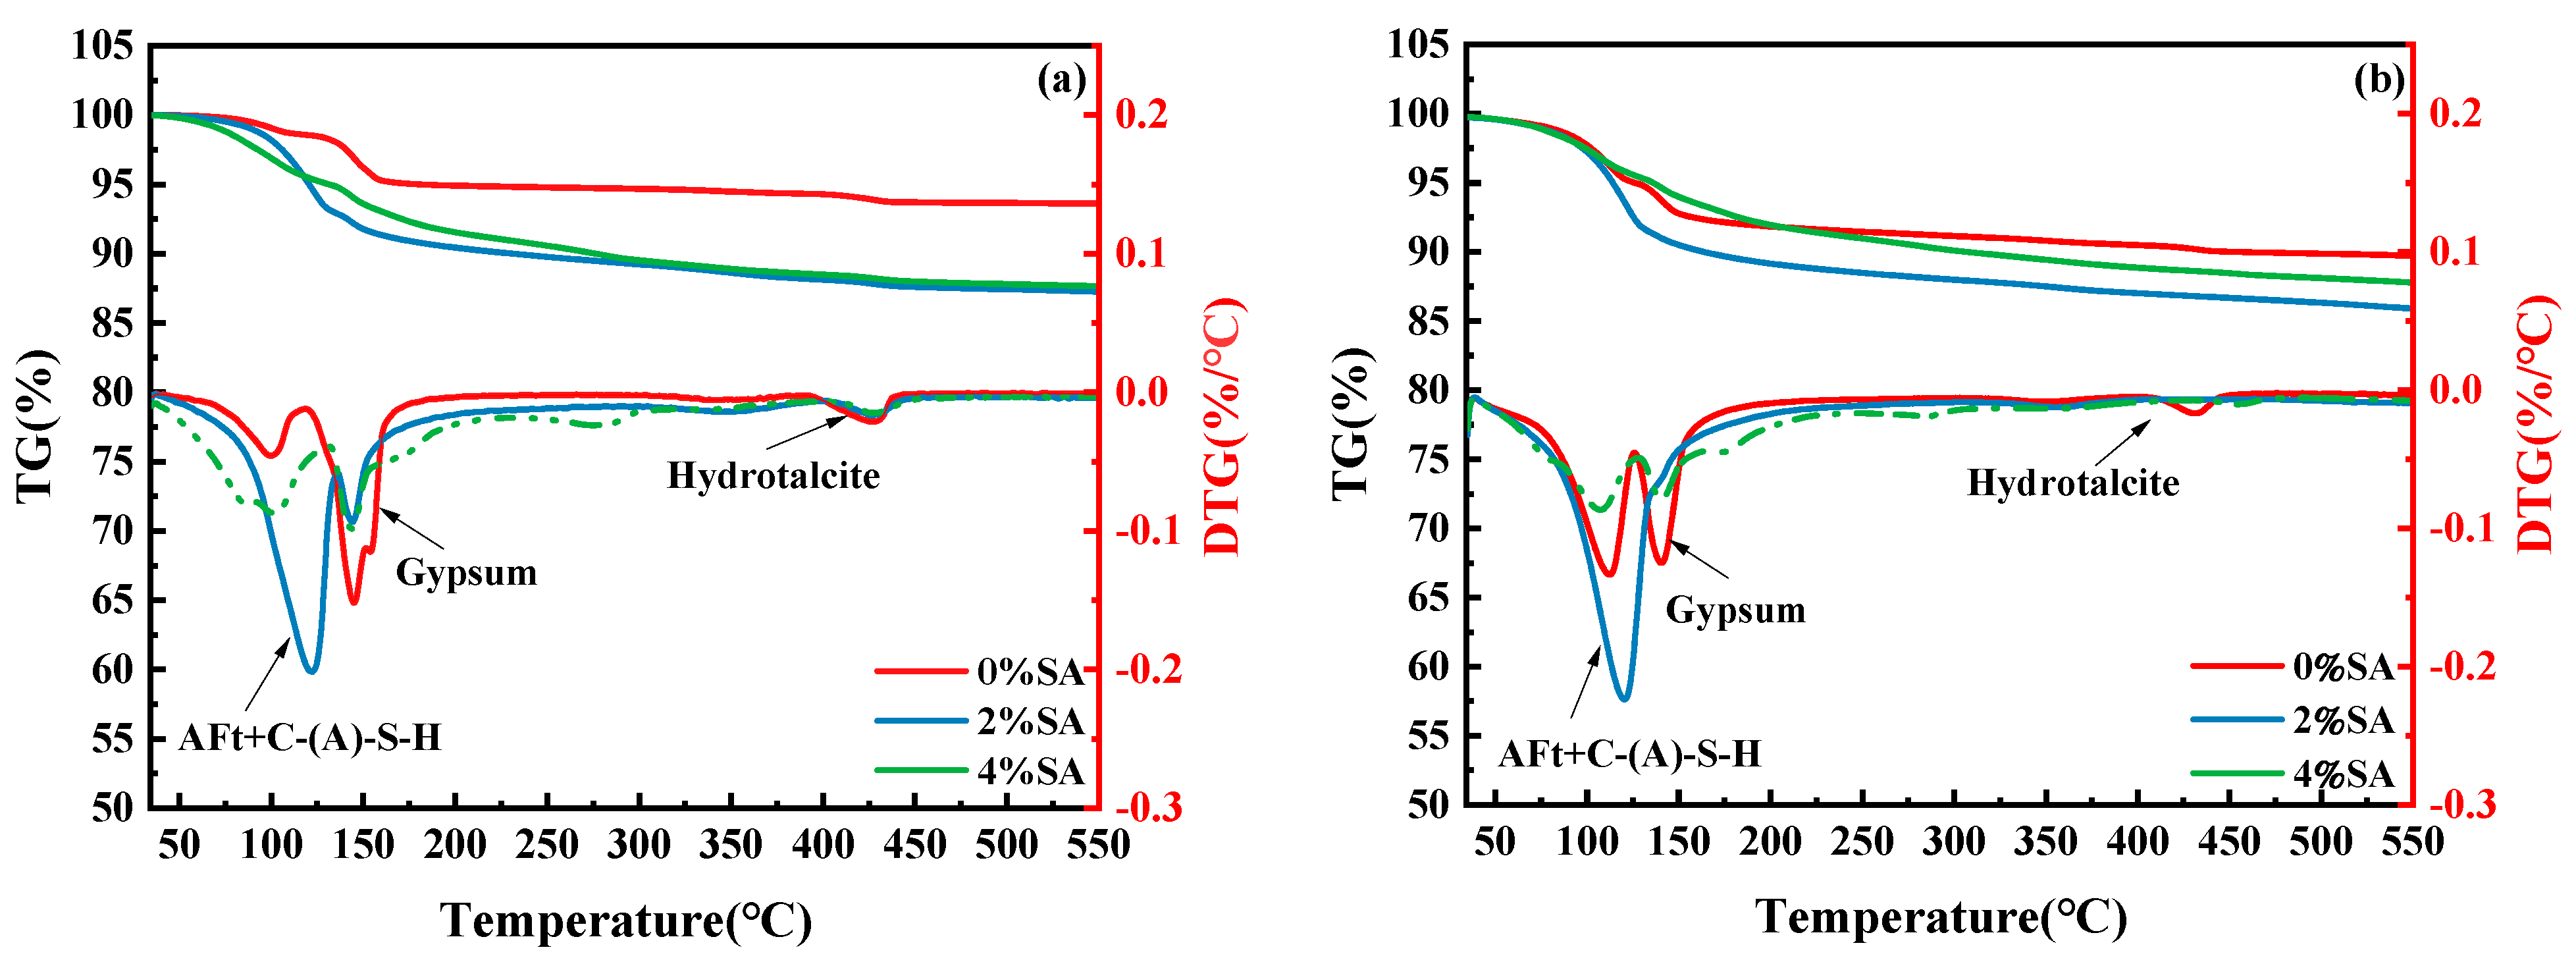
3.6. TG-DTG
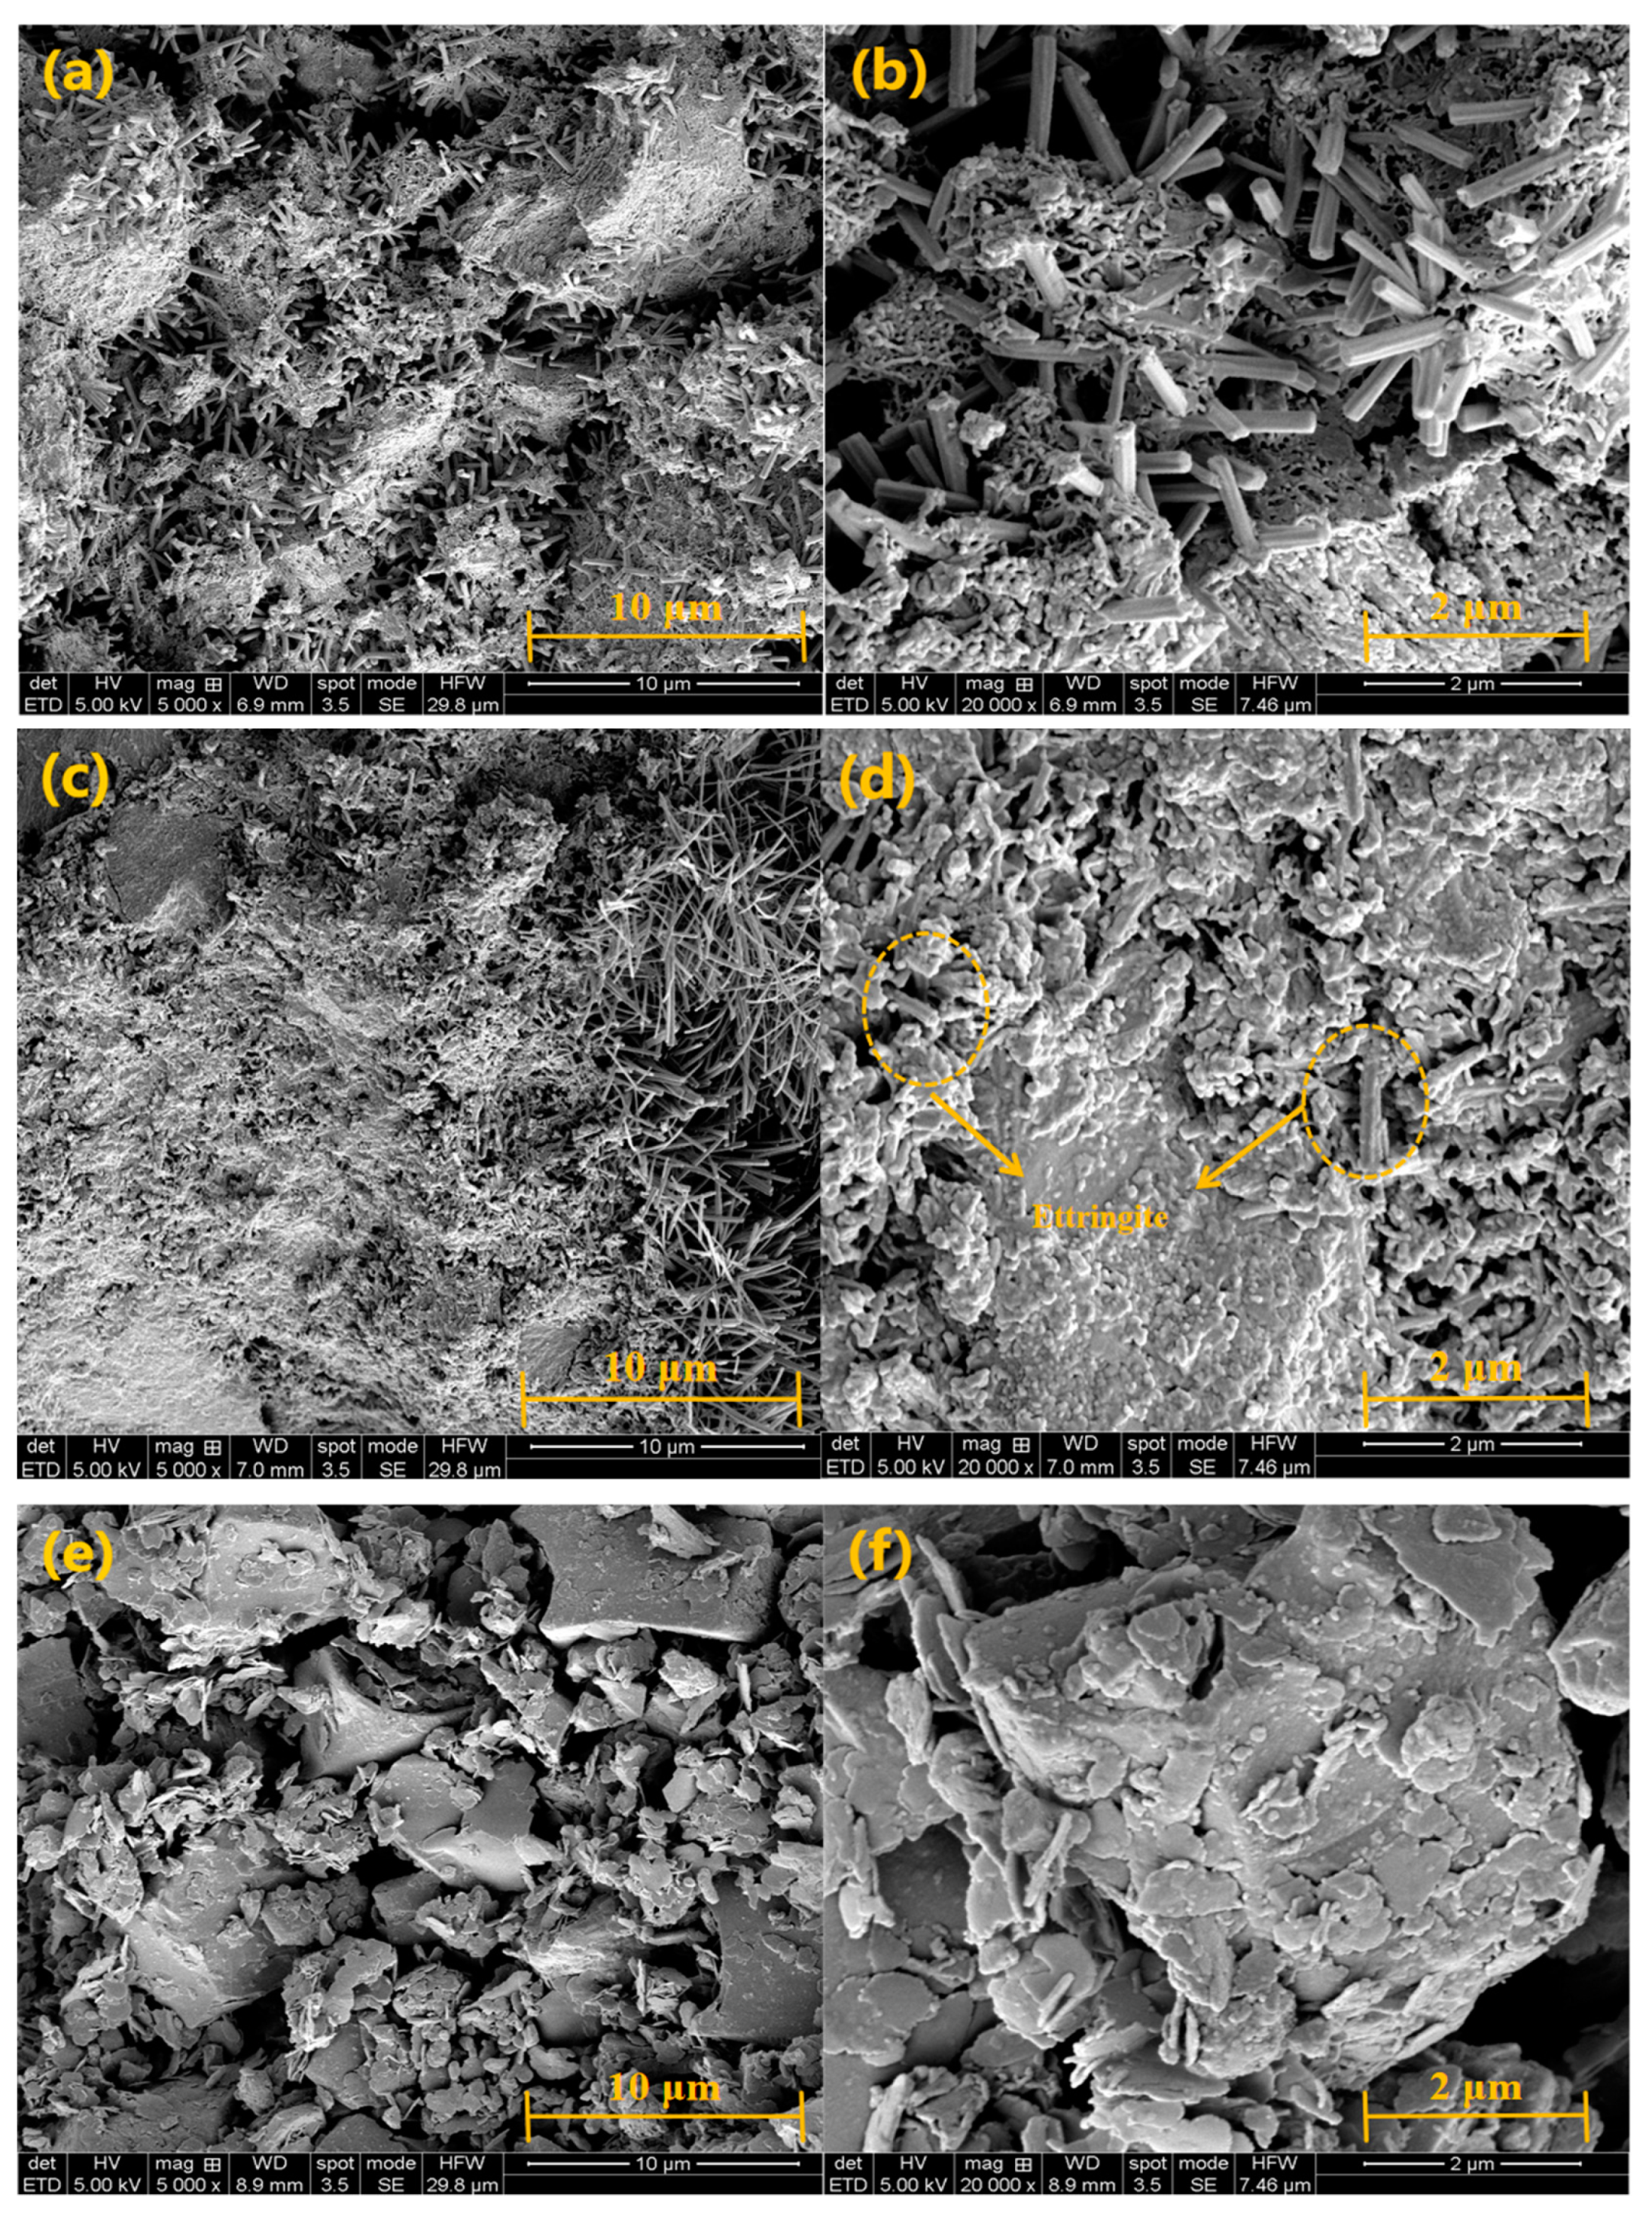
3.7. SEM Analysis
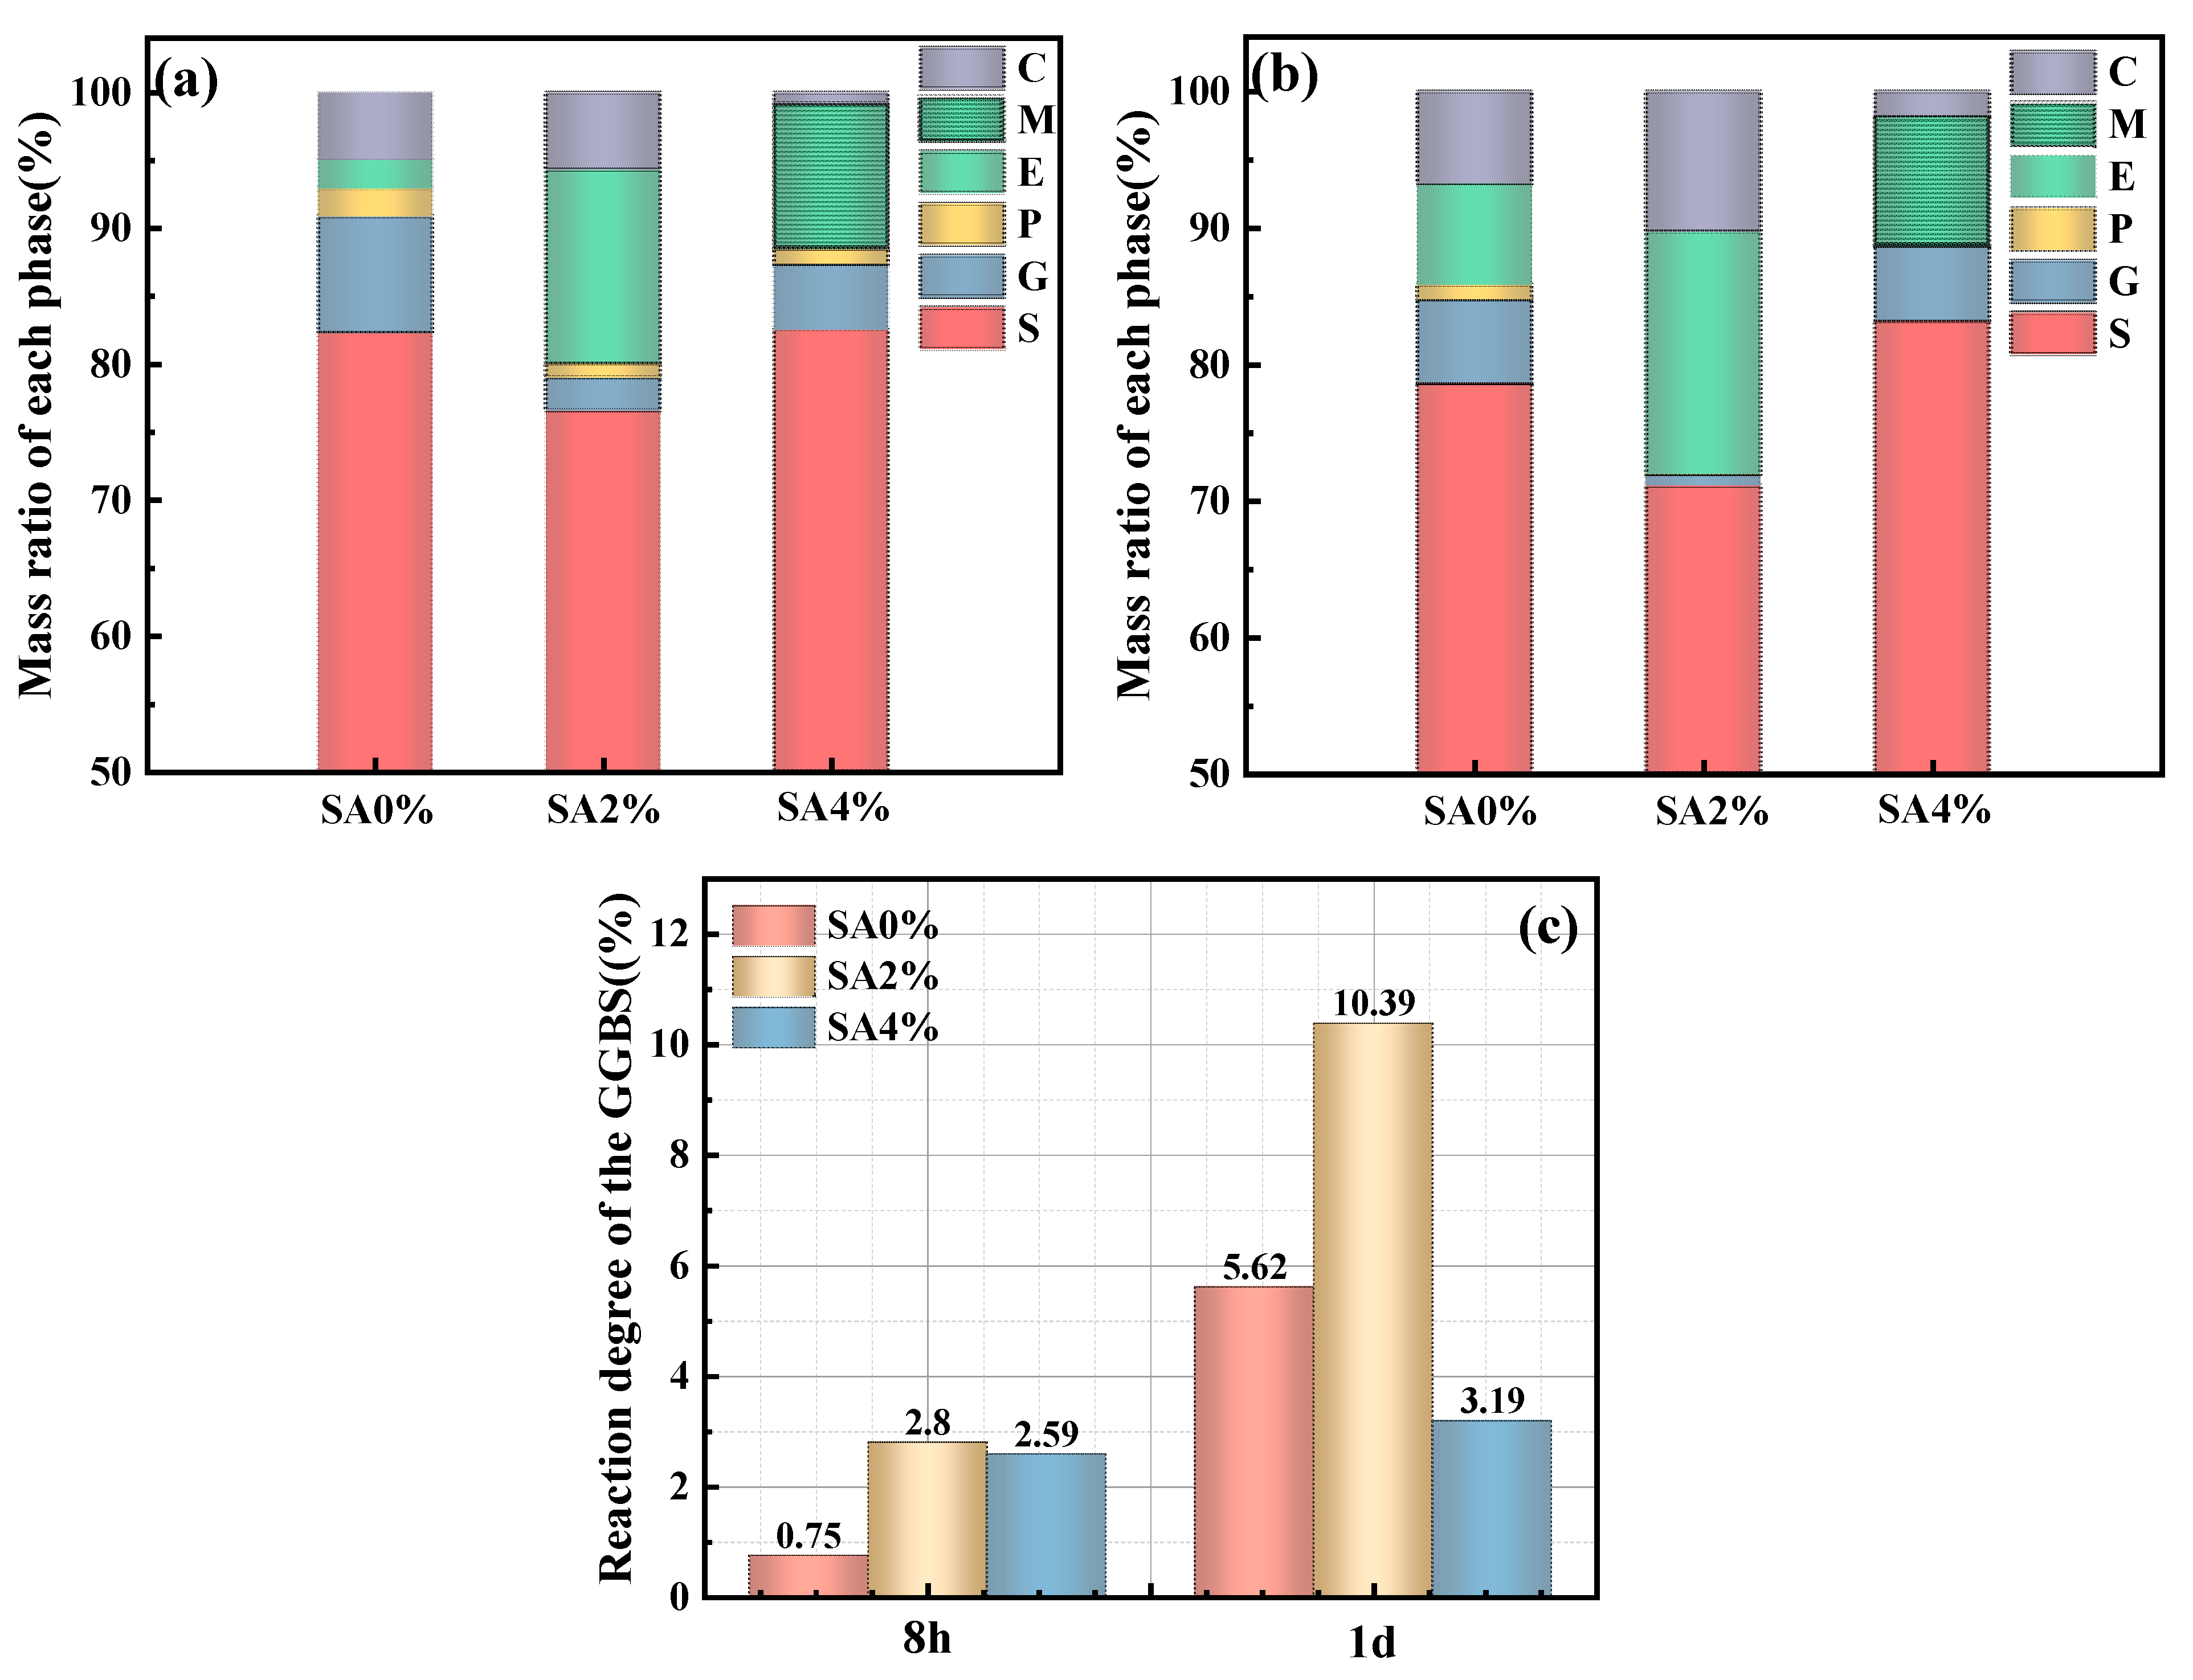
3.8. Degrees of GGBFS Hydration
4. Conclusions
- (1)
- SA increased the viscosity of SSC and promoted early-stage structural development, stabilized and solidified the paste, and shortened the setting time, as determined by rheological properties and setting time tests. However, excessive SA retarded the hardening process and prolonged the setting time;
- (2)
- The early compressive strength of SSC is significantly enhanced when an appropriate amount of SA. Specifically, when the SA content is 2%, the 1-day compressive strength increases by 127%, reaching up to 8.7 MPa. However, the compressive strength of SSC decreased when the SA content reached 4%;
- (3)
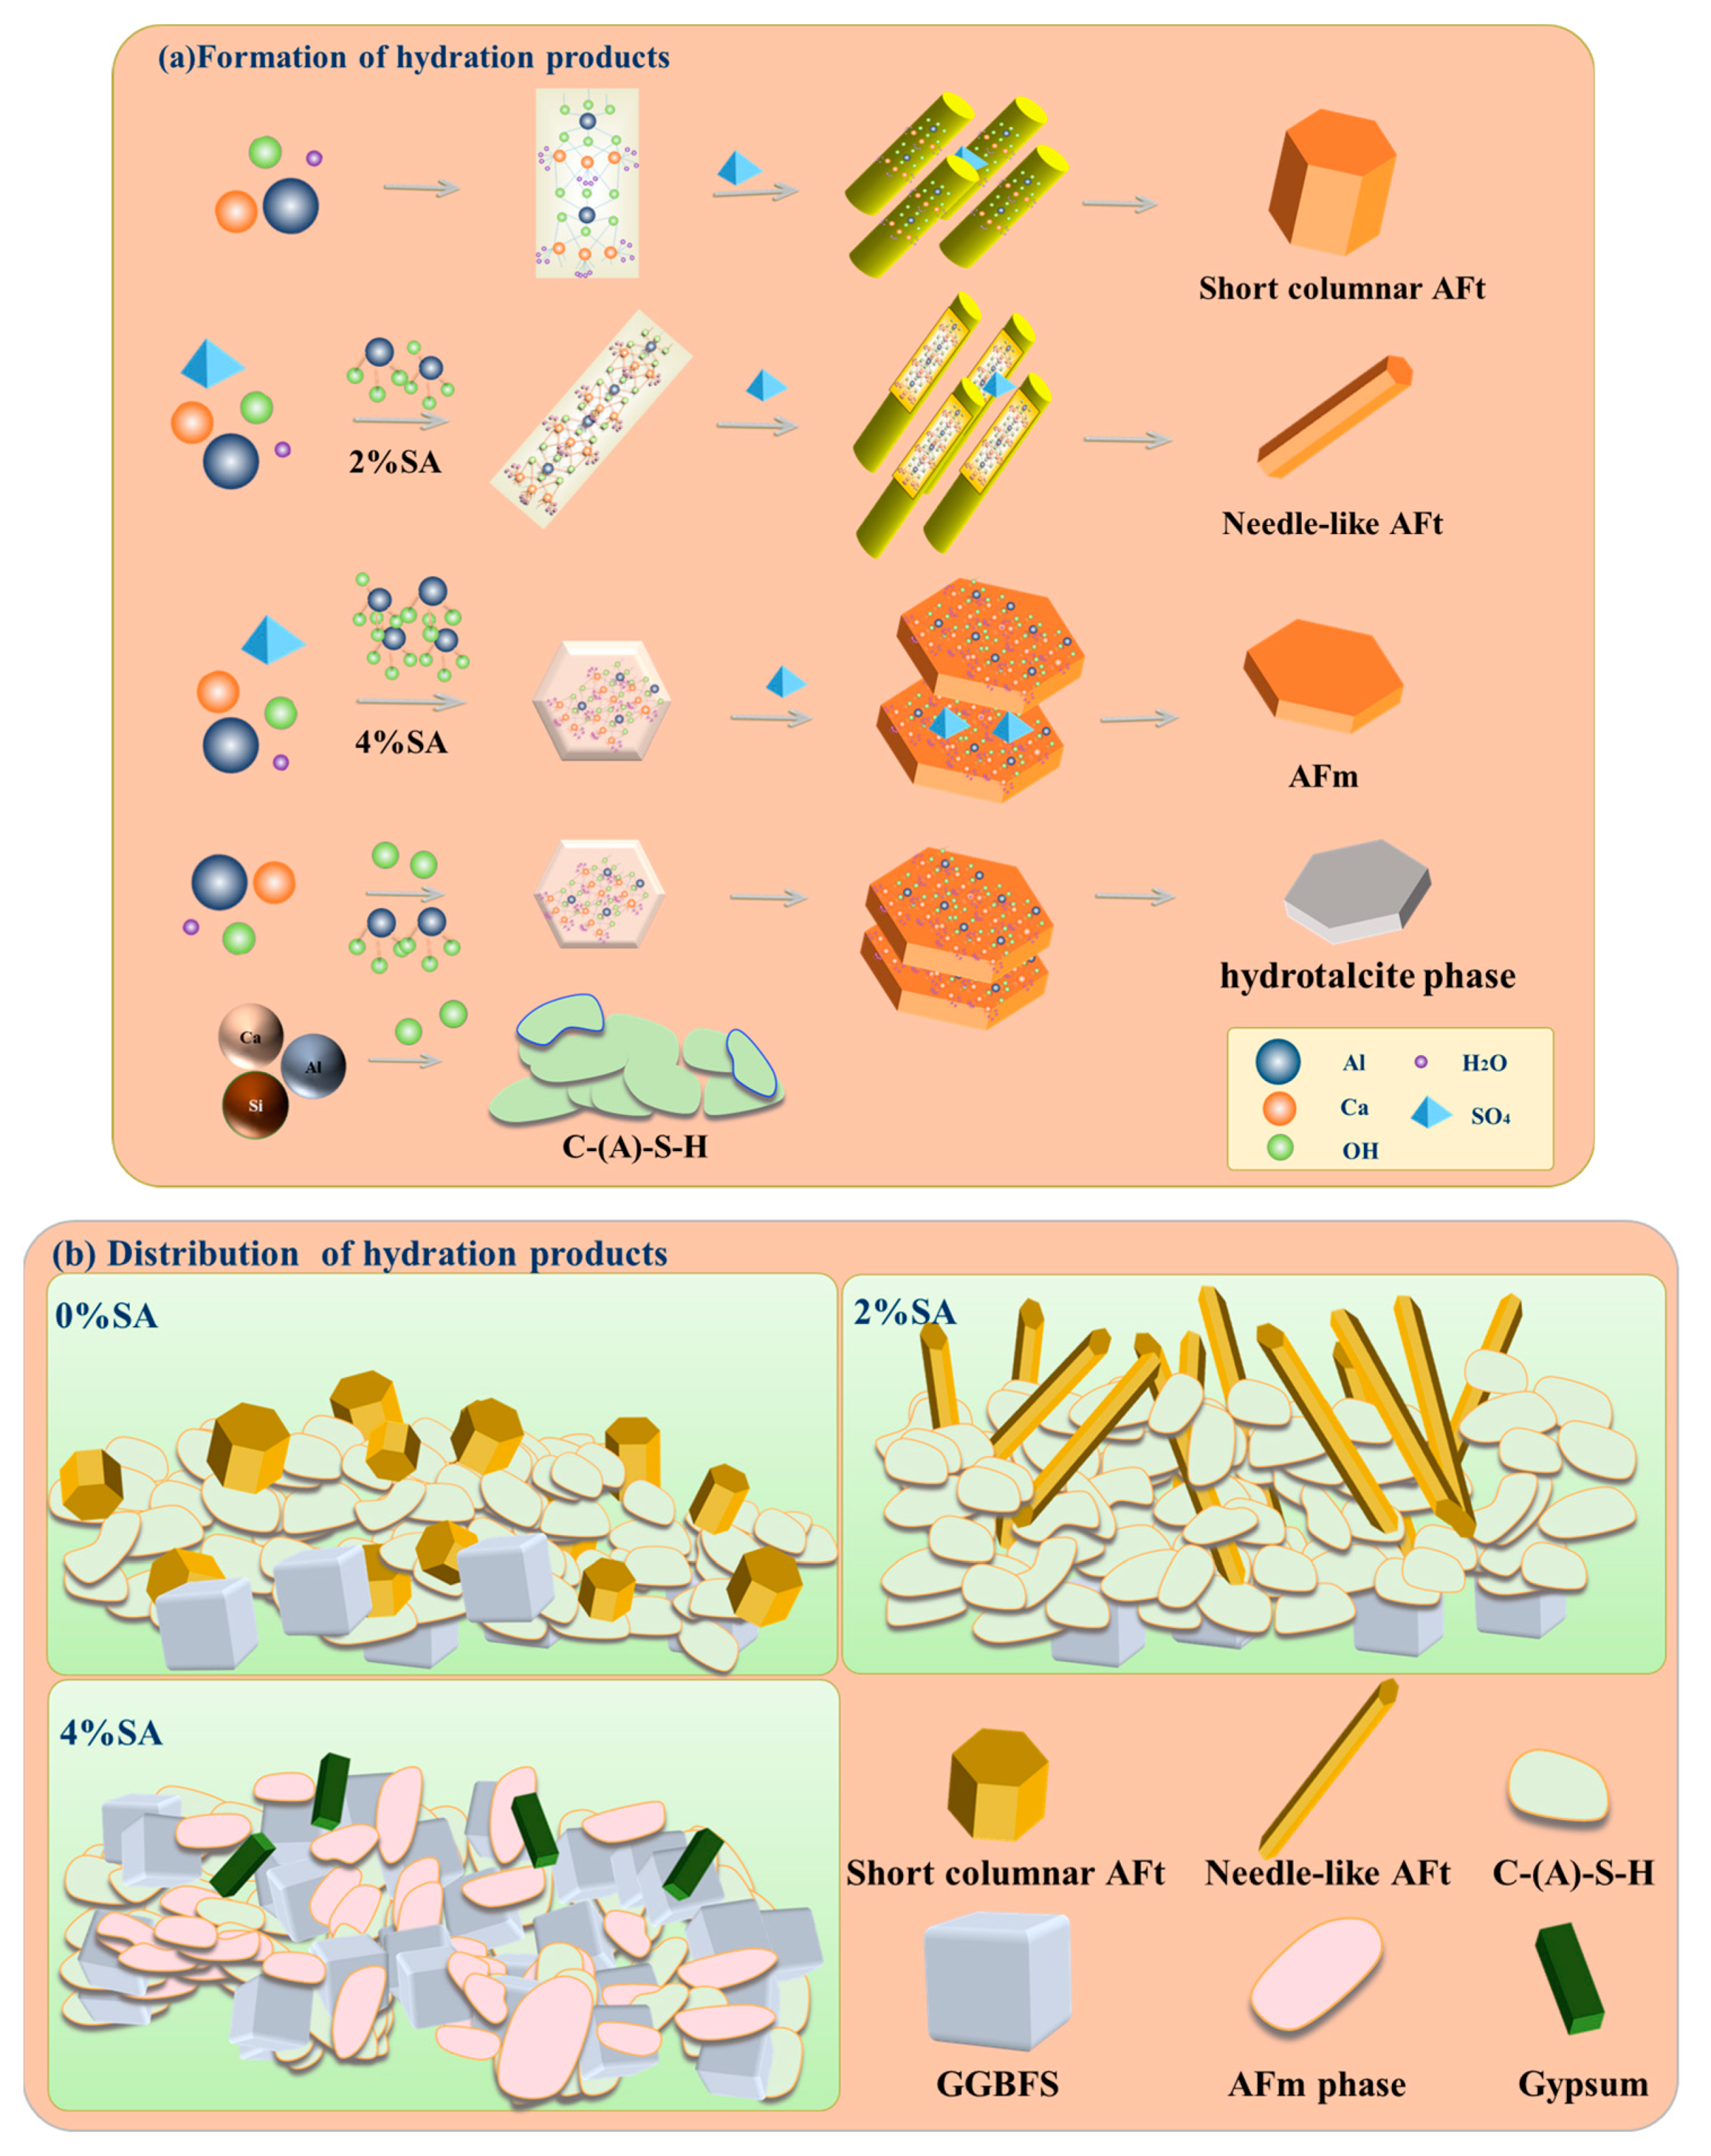
- SA not only raised the pH value of the SSC system but also functioned as a source of aluminum. This dual role enhanced the dissolution of GGBFS and facilitated the formation of AFt and C-(A)-S-H gel. An appropriate amount (2%) of SA transformed AFt from a short columnar to a needle-like morphology. This transformation enhanced the compatibility and microstructure of the crystal-gel network, ultimately leading to improved mechanical properties;
- (4)
- Excessive SA led to the generation of an AFm phase that coats the surface of the raw materials, consequently hindering the hydration process and playing an adverse role in the mechanical properties of SSC.
Author Contributions
Funding
Institutional Review Board Statement
Informed Consent Statement
Data Availability Statement
Conflicts of Interest
References
- Cabrera-Luna, K.; Maldonado-Bandala, E.E.; Nieves-Mendoza, D.; Escalante García, J.I. Supersulfated binders based on volcanic raw material: Optimization, microstructure and reaction products. Constr. Build. Mater. 2018, 176, 145–155. [Google Scholar] [CrossRef]
- Erdem, E.; Ölmez, H. The mechanical properties of supersulphated cement containing phosphogypsum. Cem. Concr. Res. 1993, 23, 115–121. [Google Scholar] [CrossRef]
- Yu, B.; Fang, Z.; Gao, Y.; Yang, W.; Wang, C.; Zhou, S. Carbonation of supersulfated cement concrete after 8 years of natural exposure. Cem. Concr. Compos. 2023, 142, 105165. [Google Scholar] [CrossRef]
- Wu, Q.; Xue, Q.; Yu, Z. Research status of super sulfate cement. J. Clean. Prod. 2021, 294, 126228. [Google Scholar] [CrossRef]
- Cabrera-Luna, K.; Maldonado-Bandala, E.E.; Nieves-Mendoza, D.; Castro-Borges, P.; García, J.I.E. Novel low emissions supersulfated cements of pumice in concrete; mechanical and electrochemical characterization. J. Clean. Prod. 2020, 272, 122520. [Google Scholar] [CrossRef]
- Pinto, S.R.; Angulski da Luz, C.; Munhoz, G.S.; Medeiros-Junior, R.A. Resistance of phosphogypsum-based supersulfated cement to carbonation and chloride ingress. Constr. Build. Mater. 2020, 263, 120640. [Google Scholar] [CrossRef]
- Chen, H.; Song, Z.; Liu, B.; Sun, G.; Hou, P.; Li, Q.; Wang, Y.; Zhang, P.; Cheng, X. Improving the carbonation resistance of supersulfated cement by nano SiO2 and silica fume. Cem. Concr. Compos. 2025, 158, 105984. [Google Scholar] [CrossRef]
- Xi, X.; Zheng, Y.; Zhuo, J.; Zhang, P.; Golewski, G.L.; Du, C. Mechanical properties and hydration mechanism of nano-silica modified alkali-activated thermally activated recycled cement. J. Build. Eng. 2024, 98, 110998. [Google Scholar] [CrossRef]
- Golewski, G.L. Determination of Fracture Mechanic Parameters of Concretes Based on Cement Matrix Enhanced by Fly Ash and Nano-Silica. Materials 2024, 17, 4230. [Google Scholar] [CrossRef]
- Deng, X.F.; Li, M.g.; Wang, Y.F.; Wang, J.T.; Zhang, J.J.; Yang, Z.W.; He, X.Y.; Yang, J.; Tan, H.B. Impact of ettringite seeding on hydration, strength and shrinkage of Na2SO4 activated slag. Compos. Part B 2024, 276, 111374. [Google Scholar] [CrossRef]
- Tambara Júnior, L.U.D.; de Matos, P.R.; Lima, G.S.; Silvestro, L.; Rocha, J.C.; Campos, C.E.M.; Gleize, P.J.P. Effect of the nanosilica source on the rheology and early-age hydration of calcium sulfoaluminate cement pastes. Constr. Build. Mater. 2022, 327, 126942. [Google Scholar] [CrossRef]
- Rubert, S.; Angulski da Luz, C.; Varela, M.V.F.; Pereira Filho, J.I.; Hooton, R.D. Hydration mechanisms of supersulfated cement. J. Therm. Anal. Calorim. 2018, 134, 971–980. [Google Scholar] [CrossRef]
- Xing, J.R.; Zhou, Y.; Peng, Z.C.; Wang, J.W.; Jin, Y.J.; Jin, M. The influence of different kinds of weak acid salts on the macro-performance, micro-structure, and hydration mechanism of the supersulfated cement. J. Build. Eng. 2023, 66, 105937. [Google Scholar] [CrossRef]
- Huang, J.Y.; Huang, J.; Min, J.j.; Lv, R.Y.; Kuang, H.; Hu, H.L.; Yang, R.; Tang, P.; Zhao, Q.L.; Jian, S.W.; et al. Hydration mechanism of a sodium-doped phosphogypsum-based hemihydrate whisker (omongwaite) in supersulfated cement system. Constr. Build. Mater. 2024, 427, 136236. [Google Scholar] [CrossRef]
- De Belie, N.; Grosse, C.U.; Kurz, J.; Reinhardt, H.W. Ultrasound monitoring of the influence of different accelerating admixtures and cement types for shotcrete on setting and hardening behaviour. Cem. Concr. Res. 2005, 35, 2087–2094. [Google Scholar] [CrossRef]
- Wang, H.C.; Feng, P.; Liu, X.; Shi, J.S.; Wang, C.; Wang, W.; Li, H.; Hong, J.X. The role of ettringite seeds in enhancing the ultra-early age strength of Portland cement containing aluminum sulfate accelerator. Compos. Part B 2024, 287, 111856. [Google Scholar] [CrossRef]
- Zhang, G.T.; Li, M.Q.; Zhu, Z.Y. Effect of Aluminium Substitution on Physical Adsorption of Chloride and Sulphate Ions in Cement-Based Materials. Materials 2023, 16, 6029. [Google Scholar] [CrossRef] [PubMed]
- Chang, N.; Li, H.; Liu, W.H.; Zheng, W.K.; Zhu, H.M.; Wan, Z.M.; Wu, X.Z.; Jiang, H.J.; Zhang, L. Improved macro-microscopic characteristic of gypsum-slag based cementitious materials by incorporating red mud/carbide slag binary alkaline waste-derived activator. Constr. Build. Mater. 2024, 428, 136425. [Google Scholar] [CrossRef]
- Li, H.; Xu, F.; Li, B.; Sun, T.; Huang, X.M.; Zhu, J.; Peng, C.; Lin, J.t.; Chen, Z.W. Investigation on mechanical properties of excess-sulfate phosphogypsum slag cement: From experiments to molecular dynamics simulation. Constr. Build. Mater. 2022, 315, 125685. [Google Scholar] [CrossRef]
- Gracioli, B.; Angulski da Luz, C.; Beutler, C.S.; Pereira Filho, J.I.; Frare, A.; Rocha, J.C.; Cheriaf, M.; Hooton, R.D. Influence of the calcination temperature of phosphogypsum on the performance of supersulfated cements. Constr. Build. Mater. 2020, 262, 119961. [Google Scholar] [CrossRef]
- Kang, C.; Kim, T. Effect of reverse-osmosis brine and sodium aluminate on the hydration properties and strength of alkali-activated slag cement. Case Stud. Constr. Mater. 2022, 16, e01078. [Google Scholar] [CrossRef]
- GB/T 1346-2011; Test Methods for Water Requirement of Normal Consistency, Setting Time and Soundness of the Portland cement. Standardization Administration of China: Beijing, China, 2011.
- GB/T 17671-2021; Test method of cement mortar strength. Standardization Administration of China: Beijing, China, 2021.
- Liu, H.; Jing, W.; Qin, L.; Duan, P.; Zhang, Z.; Guo, R.; Li, W. Thermal stability of geopolymer modified by different silicon source materials prepared from solid wastes. Constr. Build. Mater. 2022, 315, 125709. [Google Scholar] [CrossRef]
- Luan, C.; Yang, Q.; Lin, X.; Gao, X.; Cheng, H.; Huang, Y.; Du, P.; Zhou, Z.; Wang, J. The synergistic effects of ultrafine slag powder and limestone on the rheology behavior, microstructure, and fractal features of ultra-high performance concrete (UHPC). Matersial 2023, 16, 2281. [Google Scholar] [CrossRef] [PubMed]
- Mukherjee, S.; Kumar, R.; Behera, M.; Goyal, A.; Rahman, M.R.J.D.i.t.B.E. Rheology, mechanical properties and microstructure characterization of limestone calcined clay cement (LC3) incorporated sustainable lightweight self-compacting concrete. Dev. Built Environ. 2025, 21, 100601. [Google Scholar] [CrossRef]
- Zhao, D.; Williams, J.M.; Park, A.-H.A.; Kawashima, S.J.C.; Research, C. Rheology of cement pastes with calcium carbonate polymorphs. Cem. Concr. Res. 2023, 172, 107214. [Google Scholar] [CrossRef]
- Zhang, C.; Wang, J.W.; Zhang, X.Z.; Hou, J.; Huang, J.L.; Feng, S.X.; Wang, J.B.; Duan, G.B. Influence of limestone powder on water film thickness and plastic viscosity of UHPC. Case Stud. Constr. Mater. 2024, 20, e03036. [Google Scholar] [CrossRef]
- GB/T 5750.6-2023; Standard Examination Methods for Drinking Water—Part 6: Metal and Metalloid Indices. Standardization Administration of China: Beijing, China, 2023.
- van Aardt, J.H.P.; Visser, S. Thaumasite formation: A cause of deterioration of portland cement and related substances in the presence of sulphates. Cem. Concr. Res. 1975, 5, 225–232. [Google Scholar] [CrossRef]
- GB/T 12960-2019; Quantitative Determination of Constituents of Cement. Standardization Administration of China: Beijing, China, 2019.
- Qi, G.Z.; Zhang, Q.; Sun, Z.N. Mechanical properties and hydration mechanism of super-sulfated cement prepared with ordinary Portland cement, carbide slag, and sodium silicate. Front. Mater. 2024, 11, 1406045. [Google Scholar] [CrossRef]
- Li, B.B.; Hou, P.K.; Chen, H.; Zhao, P.Q.; Du, P.; Wang, S.D.; Cheng, X. GGBS hydration acceleration evidence in supersulfated cement by nanoSiO2. Cem. Concr. Compos. 2022, 132, 104609. [Google Scholar] [CrossRef]
- Way, S.J.; Shayan, A. Early hydration of a portland cement in water and sodium hydroxide solutions: Composition of solutions and nature of solid phases. Cem. Concr. Res. 1989, 19, 759–769. [Google Scholar] [CrossRef]
- Zarzuela, R.; Luna, M.; Carrascosa, L.M.; Yeste, M.P.; Garcia-Lodeiro, I.; Blanco-Varela, M.T.; Cauqui, M.A.; Rodríguez-Izquierdo, J.M.; Mosquera, M.J. Producing C-S-H gel by reaction between silica oligomers and portlandite: A promising approach to repair cementitious materials. Cem. Concr. Res. 2020, 130, 106008. [Google Scholar] [CrossRef]
- Zuo, Y.B.; Ye, G. Preliminary Interpretation of the Induction Period in Hydration of Sodium Hydroxide/Silicate Activated Slag. Materials 2020, 13, 4796. [Google Scholar] [CrossRef]
- Gou, M.F.; Hou, W.L.; Zhou, L.F.; Zhao, J.H.; Zhao, M.K. Preparation and properties of calcium aluminate cement with Bayer red mud. Constr. Build. Mater. 2023, 373, 130827. [Google Scholar] [CrossRef]
- Mostafa, A.M.; Yahia, A. New approach to assess build-up of cement-based suspensions. Cem. Concr. Res. 2016, 85, 174–182. [Google Scholar] [CrossRef]
- Zhang, C.; Zhang, X.Z.; Hou, J.; Wang, J.W.; Duan, G.B. Rheology and early microstructure evolution of fresh ultra-high performance concrete with polycarboxylate superplasticizer. Case Stud. Constr. Mater. 2022, 17, e01575. [Google Scholar] [CrossRef]
- Maach, N.; Georgin, J.F.; Berger, S.; Pommay, J. Chemical mechanisms and kinetic modeling of calcium aluminate cements hydration in diluted systems: Role of aluminium hydroxide formation. Cem. Concr. Res. 2021, 143, 106380. [Google Scholar] [CrossRef]
- Wang, L.; Gao, Z.Y.; Gao, F.H.; Li, X.Y.; Chang, S.; Liu, S.H. Comparing study on the evolution characteristics of performance and microstructure between Portland slag cement and supersulfated cement under chemical attacks. Constr. Build. Mater. 2024, 425, 135969. [Google Scholar] [CrossRef]
- Blotevogel, S.; Doussang, L.; Poirier, M.; André, L.; Canizarès, A.; Simon, P.; Montouillout, V.; Kaknic, J.; Patapy, C.; Martin, C. The influence of Al2O3, CaO, MgO and TiO2 content on the early-age reactivity of GGBS in blended cements, alkali-activated materials and supersulfated cements. Cem. Concr. Res. 2024, 178, 107439. [Google Scholar] [CrossRef]
- Herrera-Mesen, C.; Salvador, R.P.; Cavalaro, S.H.P.; Aguado, A. Effect of gypsum content in sprayed cementitious matrices: Early age hydration and mechanical properties. Cem. Concr. Compos. 2019, 95, 81–91. [Google Scholar] [CrossRef]
- Paglia, C.; Wombacher, F.; Böhni, H. The influence of alkali-free and alkaline shotcrete accelerators within cement systems: I. Characterization of the setting behavior. Cem. Concr. Res. 2001, 31, 913–918. [Google Scholar] [CrossRef]
- Garcia-Lodeiro, I.; Palomo, A.; Fernández-Jiménez, A.; Macphee, D.E. Compatibility studies between N-A-S-H and C-A-S-H gels. Study in the ternary diagram Na2O–CaO–Al2O3–SiO2–H2O. Cem. Concr. Res. 2011, 41, 923–931. [Google Scholar] [CrossRef]
- Ouyang, G.S.; Li, Z.W.; Sun, T.; Ye, Z.Y.; Deng, Y.Y.; Li, W.T. Greener phosphogypsum-based all-solid-waste cementitious binder with steel slag activation: Hydration, mechanical properties and durability. J. Clean. Prod. 2024, 443, 140996. [Google Scholar] [CrossRef]
- Burris, L.E.; Kurtis, K.E. Influence of set retarding admixtures on calcium sulfoaluminate cement hydration and property development. Cem. Concr. Res. 2018, 104, 105–113. [Google Scholar] [CrossRef]
- Ye, X.F.; Zhao, X.D.; Ming, Q.; Zhu, J.; Guo, J.M.; Sun, D.Q.; Zhang, S.; Xu, J.; Zhou, Z. Process optimization to enhance utilization efficiency of precipitants for chloride removal from flue gas desulfurization wastewater via Friedel’s salt precipitation. J. Environ. Manag. 2021, 299, 113682. [Google Scholar] [CrossRef] [PubMed]
- Han, J.G.; Wang, K.J.; Shi, J.Y.; Wang, Y. Influence of sodium aluminate on cement hydration and concrete properties. Constr. Build. Mater. 2014, 64, 342–349. [Google Scholar] [CrossRef]
- Christensen, A.N.; Jensen, T.R.; Hanson, J.C. Formation of ettringite, Ca6Al2(SO4)3(OH)12·26H2O, AFt, and monosulfate, Ca4Al2O6(SO4)·14H2O, AFm-14, in hydrothermal hydration of Portland cement and of calcium aluminum oxide—Calcium sulfate dihydrate mixtures studied by in situ synchrotron X-ray powder diffraction. J. Solid State Chem. 2004, 177, 1944–1951. [Google Scholar]
- Bian, Z.W.; Jin, G.W.; Ji, T. Effect of combined activator of Ca(OH)2 and Na2CO3 on workability and compressive strength of alkali-activated ferronickel slag system. Cem. Concr. Compos. 2021, 123, 104179. [Google Scholar] [CrossRef]
- Gijbels, K.; Pontikes, Y.; Samyn, P.; Schreurs, S.; Schroeyers, W. Effect of NaOH content on hydration, mineralogy, porosity and strength in alkali/sulfate-activated binders from ground granulated blast furnace slag and phosphogypsum. Cem. Concr. Res. 2020, 132, 106054. [Google Scholar] [CrossRef]
- Zhang, X.W.; Lu, C.X.; Shen, J.Y. Influence of tartaric acid on early hydration and mortar performance of Portland cement-calcium aluminate cement-anhydrite binder. Constr. Build. Mater. 2016, 112, 877–884. [Google Scholar]
- Li, Y.; Qiao, C.Y.; Ni, W. Green concrete with ground granulated blast-furnace slag activated by desulfurization gypsum and electric arc furnace reducing slag. J. Clean. Prod. 2020, 269, 122212. [Google Scholar] [CrossRef]
- Salvador, R.P.; Cavalaro, S.H.P.; Segura, I.; Figueiredo, A.D.; Pérez, J. Early age hydration of cement pastes with alkaline and alkali-free accelerators for sprayed concrete. Constr. Build. Mater. 2016, 111, 386–398. [Google Scholar] [CrossRef]
- Gevers, B.R.; Labuschagné, F.J.W.J. Green Synthesis of Hydrocalumite (CaAl-OH-LDH) from Ca(OH)2 and Al(OH)3 and the Parameters That Influence Its Formation and Speciation. Crystals 2020, 10, 672. [Google Scholar] [CrossRef]
- Wang, L.; He, Z.; Cai, X.H. Characterization of pozzolanic reaction and its effect on the C-S-H Gel in fly Ash-cement paste. J. Wuhan Univ. Technol. 2011, 26, 319–324. [Google Scholar] [CrossRef]
- Wang, X.G.; Zhu, J.L.; Lei, Y.X.; Lei, W.Y. Synthesis and characterization of layered double hydroxides hybrid microcapsules for anticorrosion via self-healing and chloride ion adsorption. Appl. Clay Sci. 2022, 221, 106481. [Google Scholar] [CrossRef]

| CaO | SiO2 | Al2O3 | Fe2O3 | MgO | K2O | SO3 | TiO2 | Others | |
|---|---|---|---|---|---|---|---|---|---|
| GGBFS | 34.46 | 32.63 | 16.90 | 0.26 | 10.56 | 0.35 | 2.37 | 0.69 | 1.78 |
| Gypsum | 37.18 | 2.10 | 0.74 | 0.40 | 1.13 | 0.14 | 44.79 | 0.03 | 13.49 |
Disclaimer/Publisher’s Note: The statements, opinions and data contained in all publications are solely those of the individual author(s) and contributor(s) and not of MDPI and/or the editor(s). MDPI and/or the editor(s) disclaim responsibility for any injury to people or property resulting from any ideas, methods, instructions or products referred to in the content. |
© 2025 by the authors. Licensee MDPI, Basel, Switzerland. This article is an open access article distributed under the terms and conditions of the Creative Commons Attribution (CC BY) license (https://creativecommons.org/licenses/by/4.0/).
Share and Cite
Wang, J.; Li, T.; Wang, J.; Zhang, C.; Zhang, X.; Duan, G. Enhancing the Early Hydration of Supersulfate Cement: The Effect of Sodium Aluminate. Materials 2025, 18, 1228. https://doi.org/10.3390/ma18061228
Wang J, Li T, Wang J, Zhang C, Zhang X, Duan G. Enhancing the Early Hydration of Supersulfate Cement: The Effect of Sodium Aluminate. Materials. 2025; 18(6):1228. https://doi.org/10.3390/ma18061228
Chicago/Turabian StyleWang, Jiawei, Ting Li, Jinbang Wang, Chong Zhang, Xiuzhi Zhang, and Guangbin Duan. 2025. "Enhancing the Early Hydration of Supersulfate Cement: The Effect of Sodium Aluminate" Materials 18, no. 6: 1228. https://doi.org/10.3390/ma18061228
APA StyleWang, J., Li, T., Wang, J., Zhang, C., Zhang, X., & Duan, G. (2025). Enhancing the Early Hydration of Supersulfate Cement: The Effect of Sodium Aluminate. Materials, 18(6), 1228. https://doi.org/10.3390/ma18061228