
Preparation of Temperature Resistant Terpolymer Fracturing Fluid Thickener and Its Working Mechanism Study via Simulation Methods


Abstract
1. Introduction
2. Materials and Methods
2.1. Materials
2.2. Synthesis of Terpolymer Thickener
2.3. Characterization of Terpolymer Thickener
- μ—Apparent viscosity of the sample, (mPa·s);
- α—100 r/min-Viscometer pointer reading at RPM;
- 5.077—Value of shear stress when α is 1, (10−1 Pa);
- 1.704—Value of shear rate for a viscometer rotation of 1 r/min, (s−1).
- γ—Viscosity increase rate, expressed as a percentage;
- η1—Viscosity value at the end of specimen preparation, (mPa·s);
- η2—Viscosity value of the specimen when resting for 4 h, (mPa·s).
- C3—Cake control loss coefficient, (m/min1/2);
- m—Slope of the filtration loss curve, (mL/min1/2);
- A—Filter loss area, (cm2);
- vc—Filtration rate, (m/min);
- t—Filtration time, (min).
3. Results and Discussion
3.1. Characterization of Terpolymer
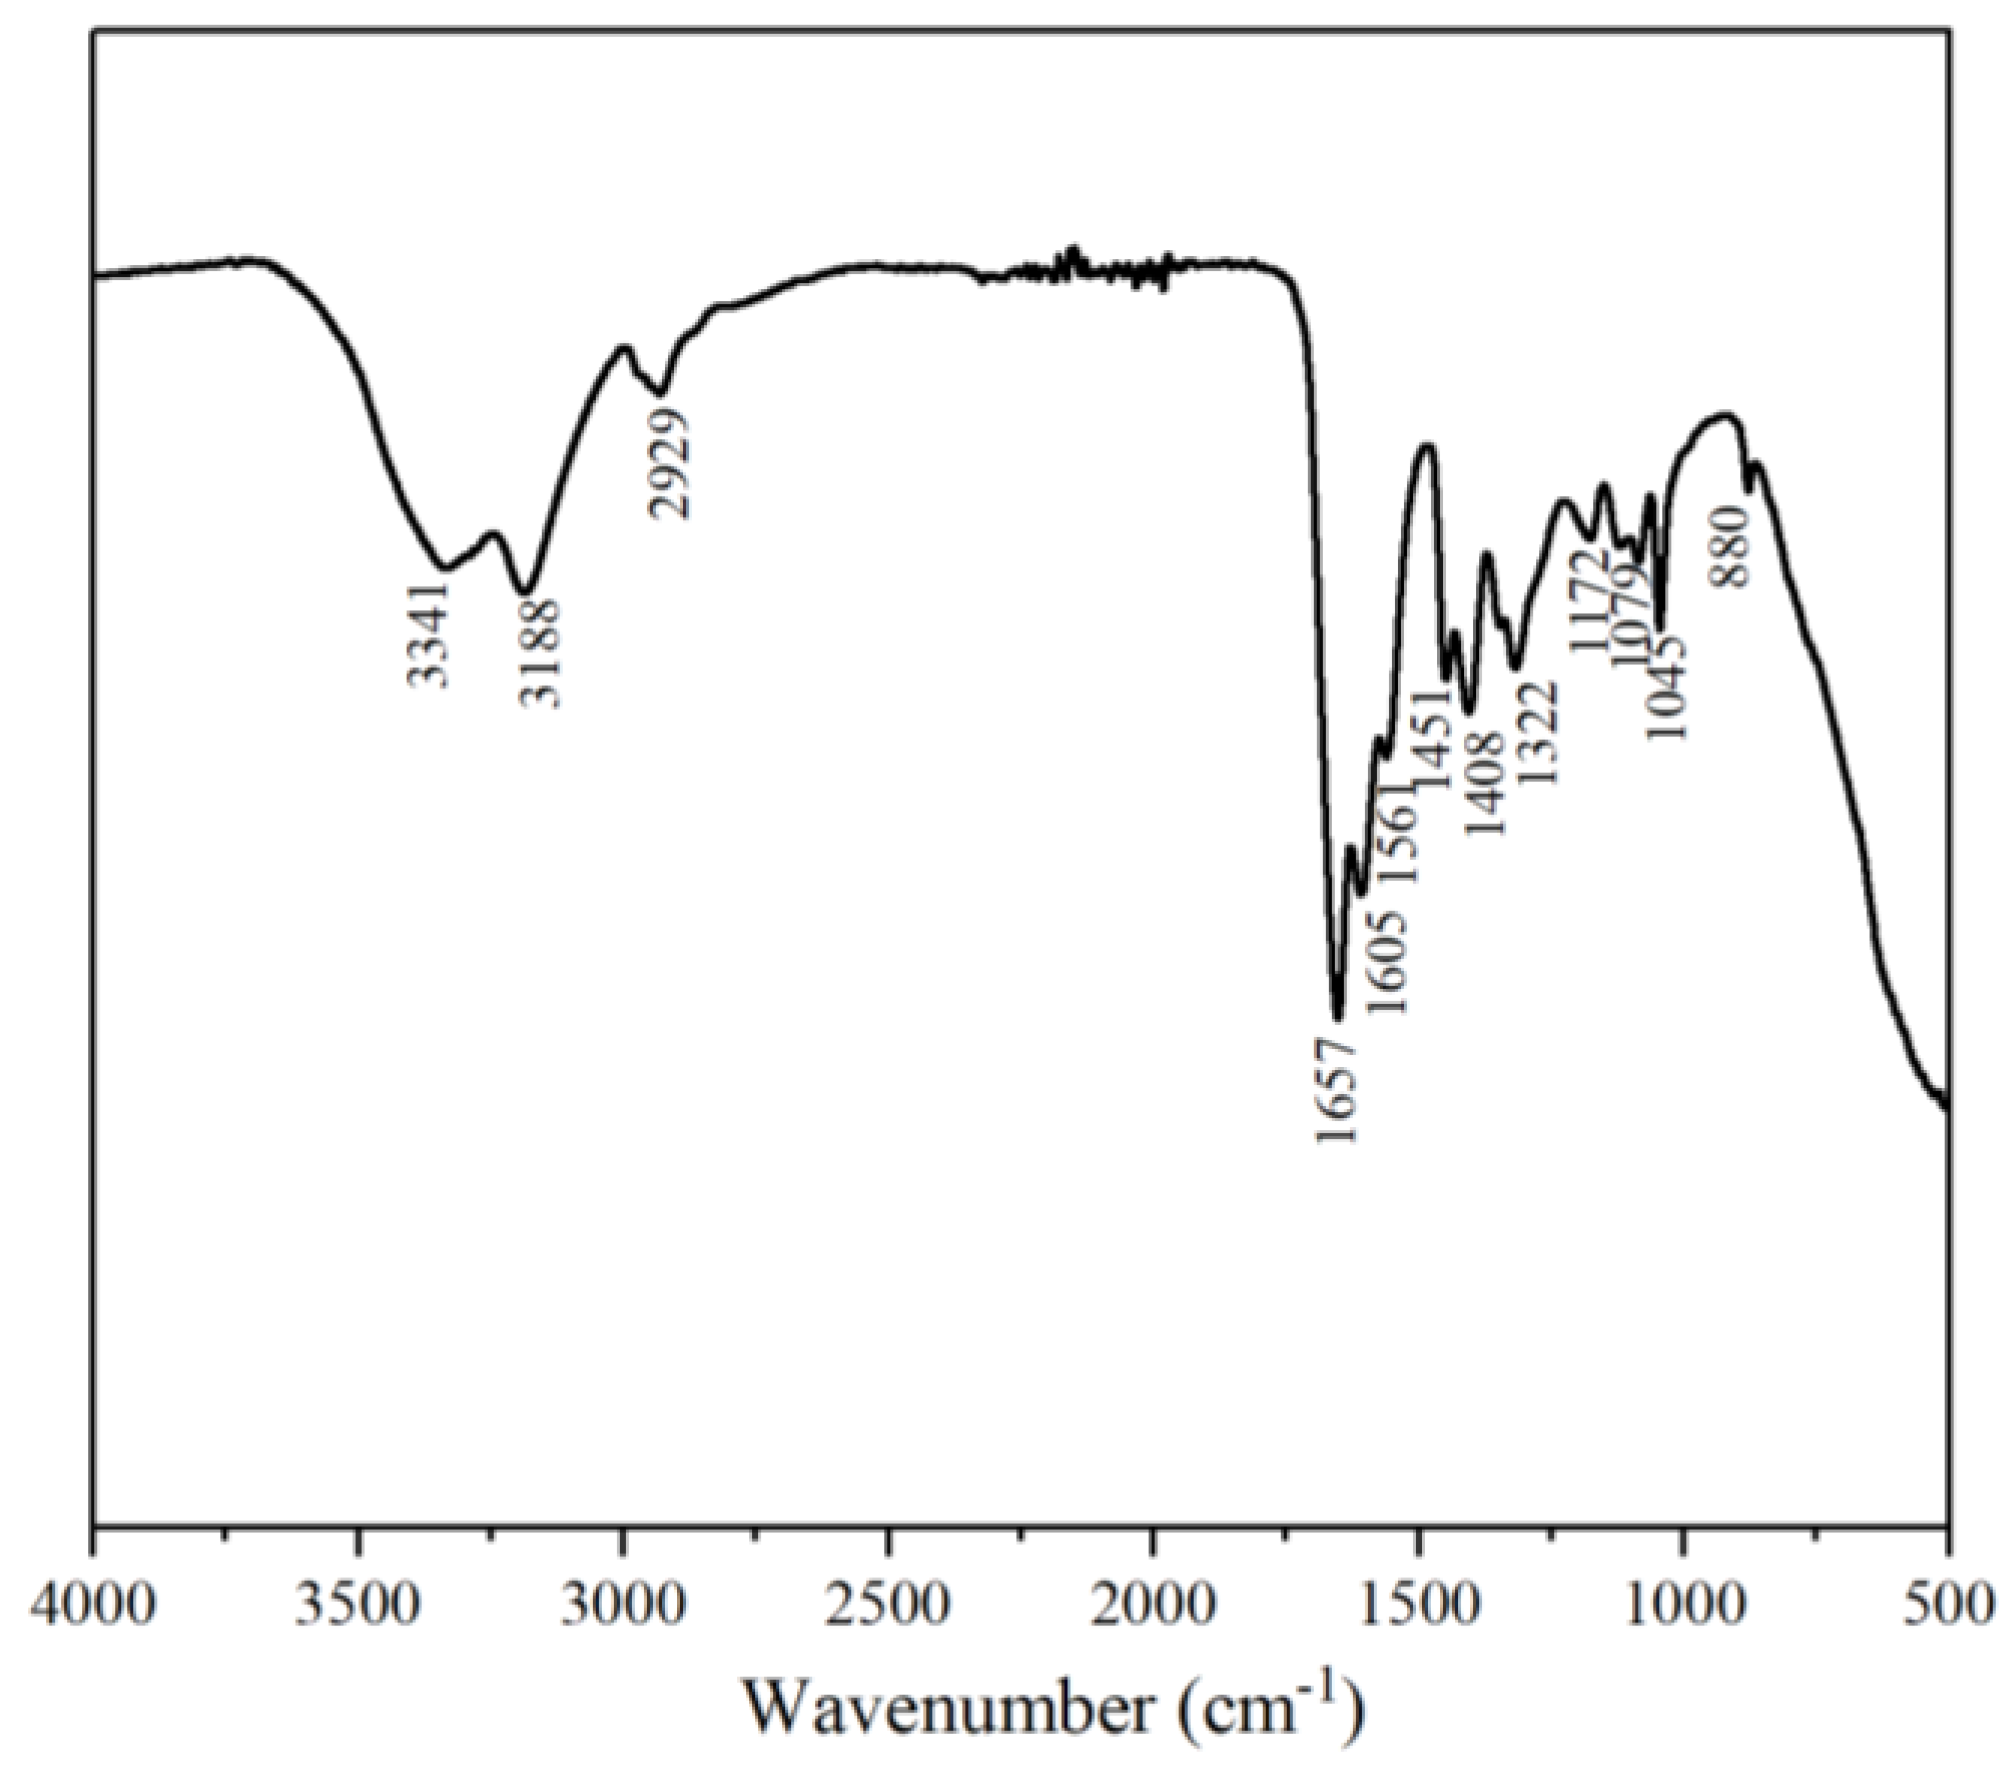
3.1.1. FTIR Analysis of MAC
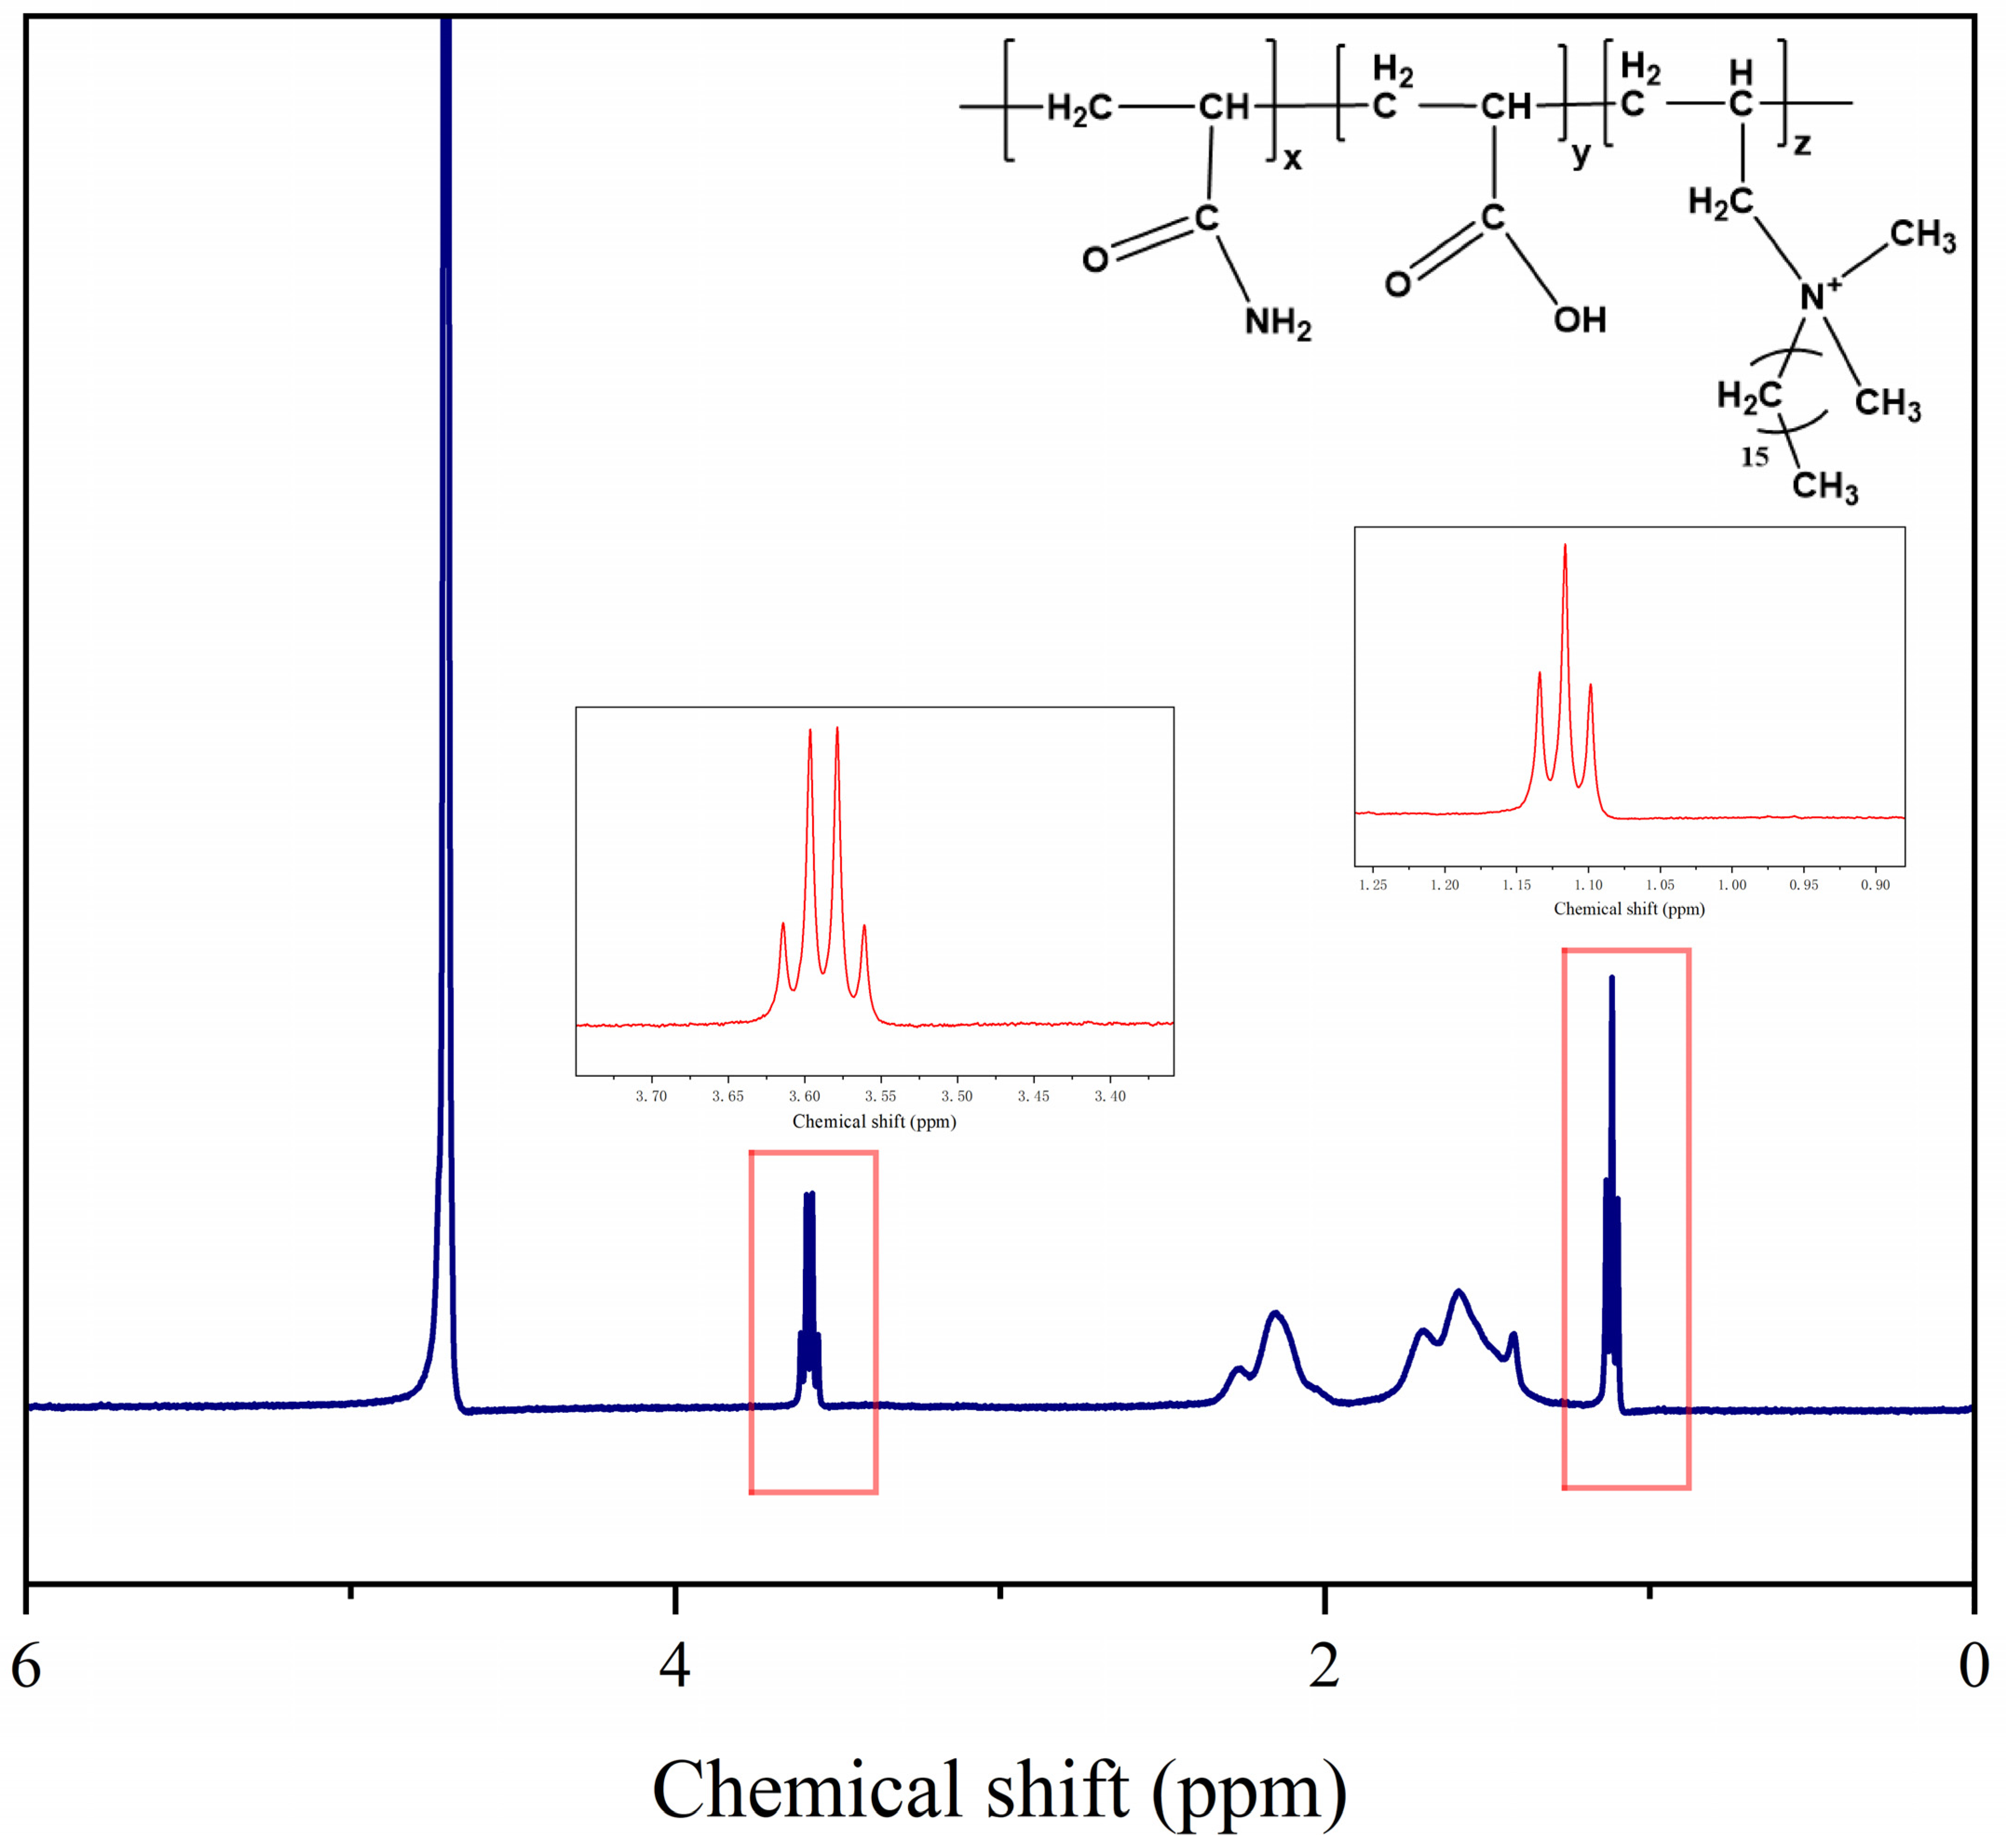
3.1.2. 1H NMR Analysis
3.1.3. GPC Analysis
3.2. Investigation into the Mechanism of Hydrophobic Association of Polymer MAC in Aqueous Solutions
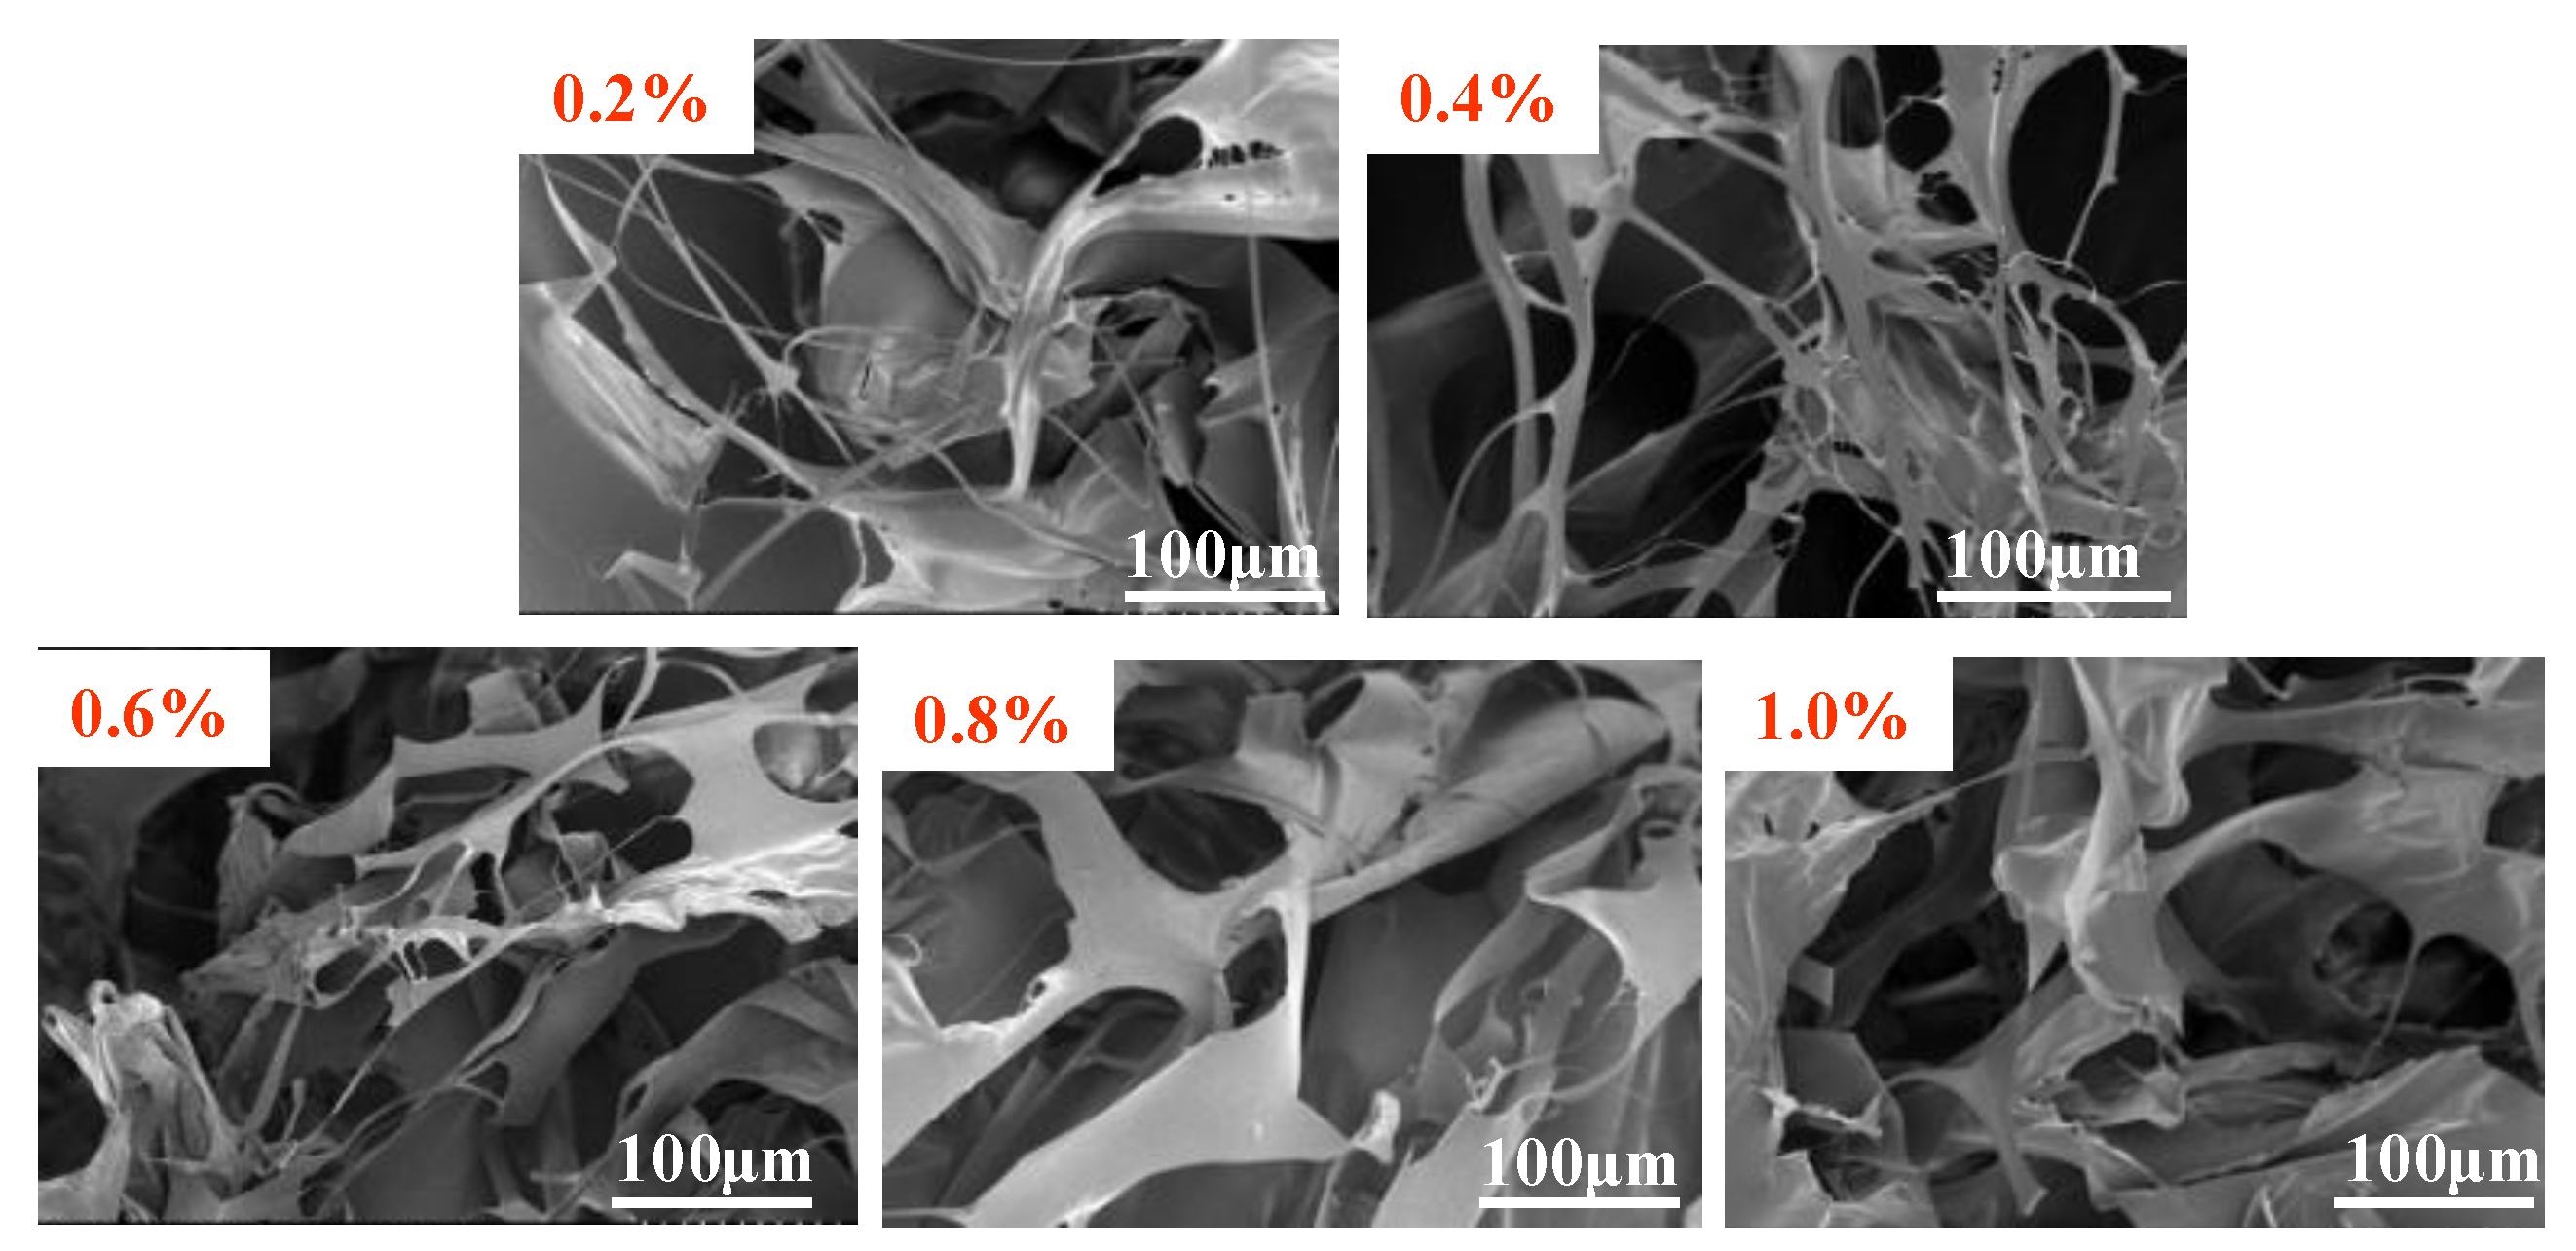
3.2.1. SEM Analysis
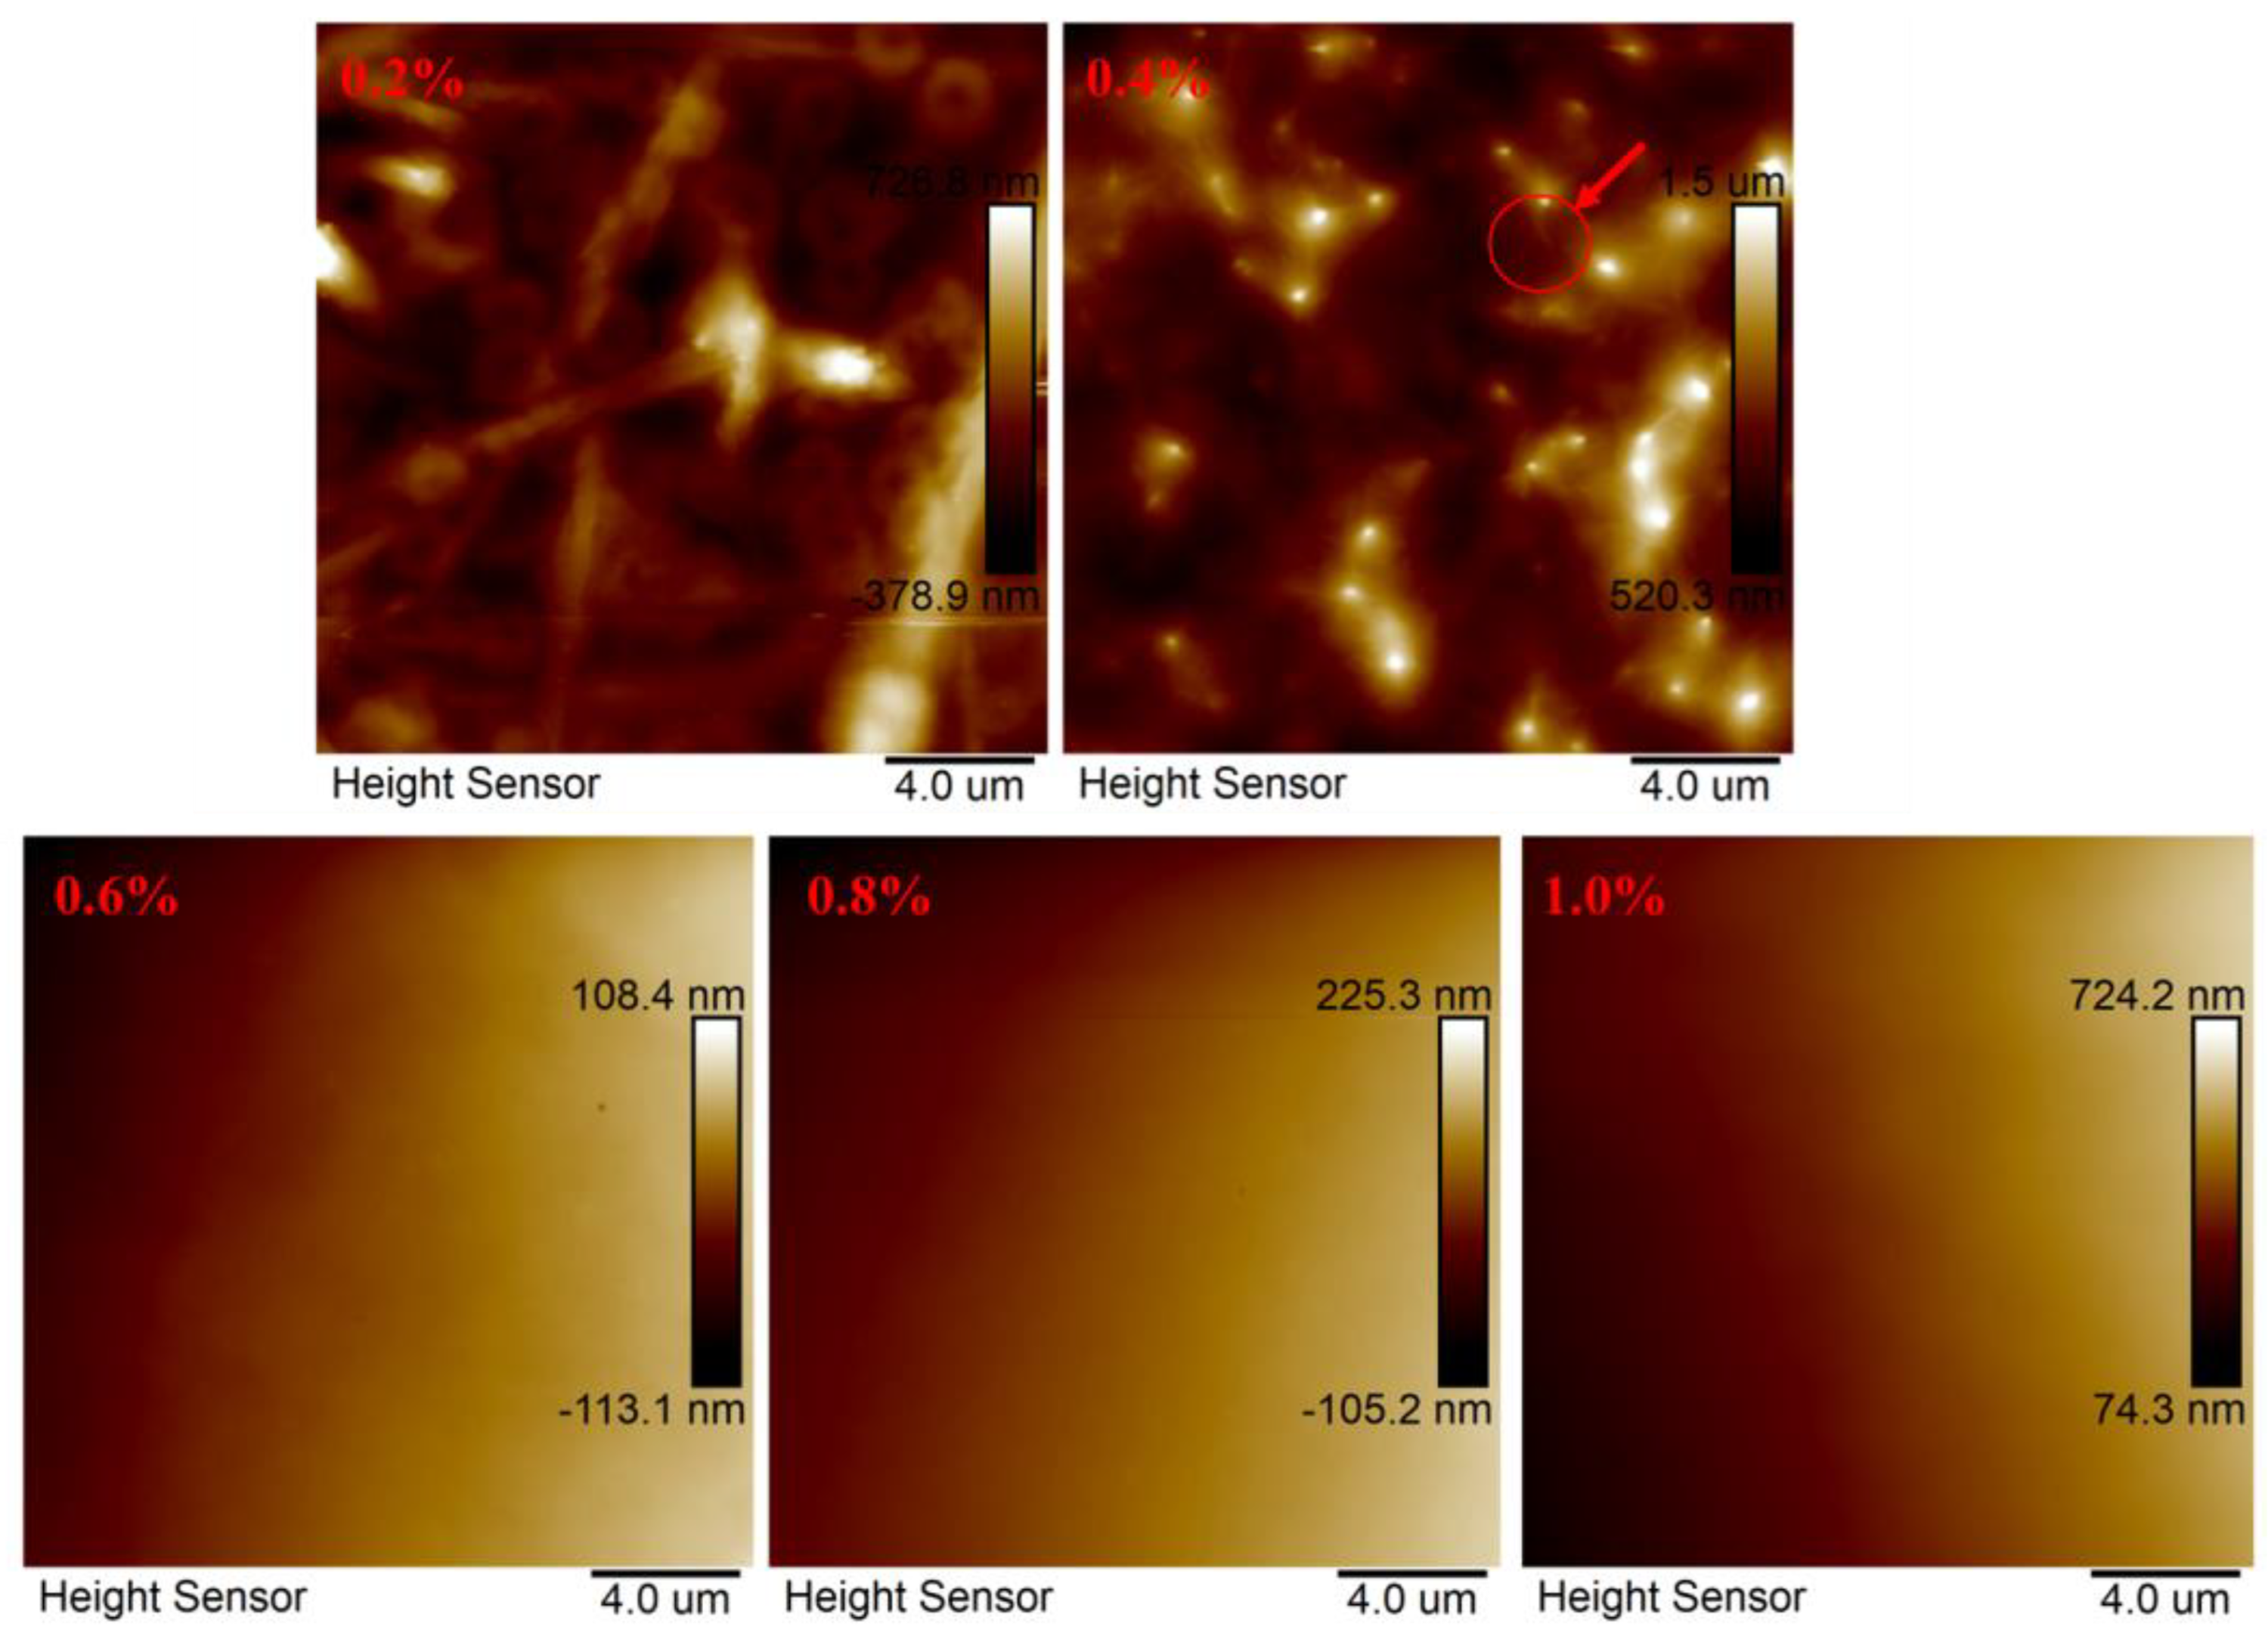
3.2.2. AFM Analysis
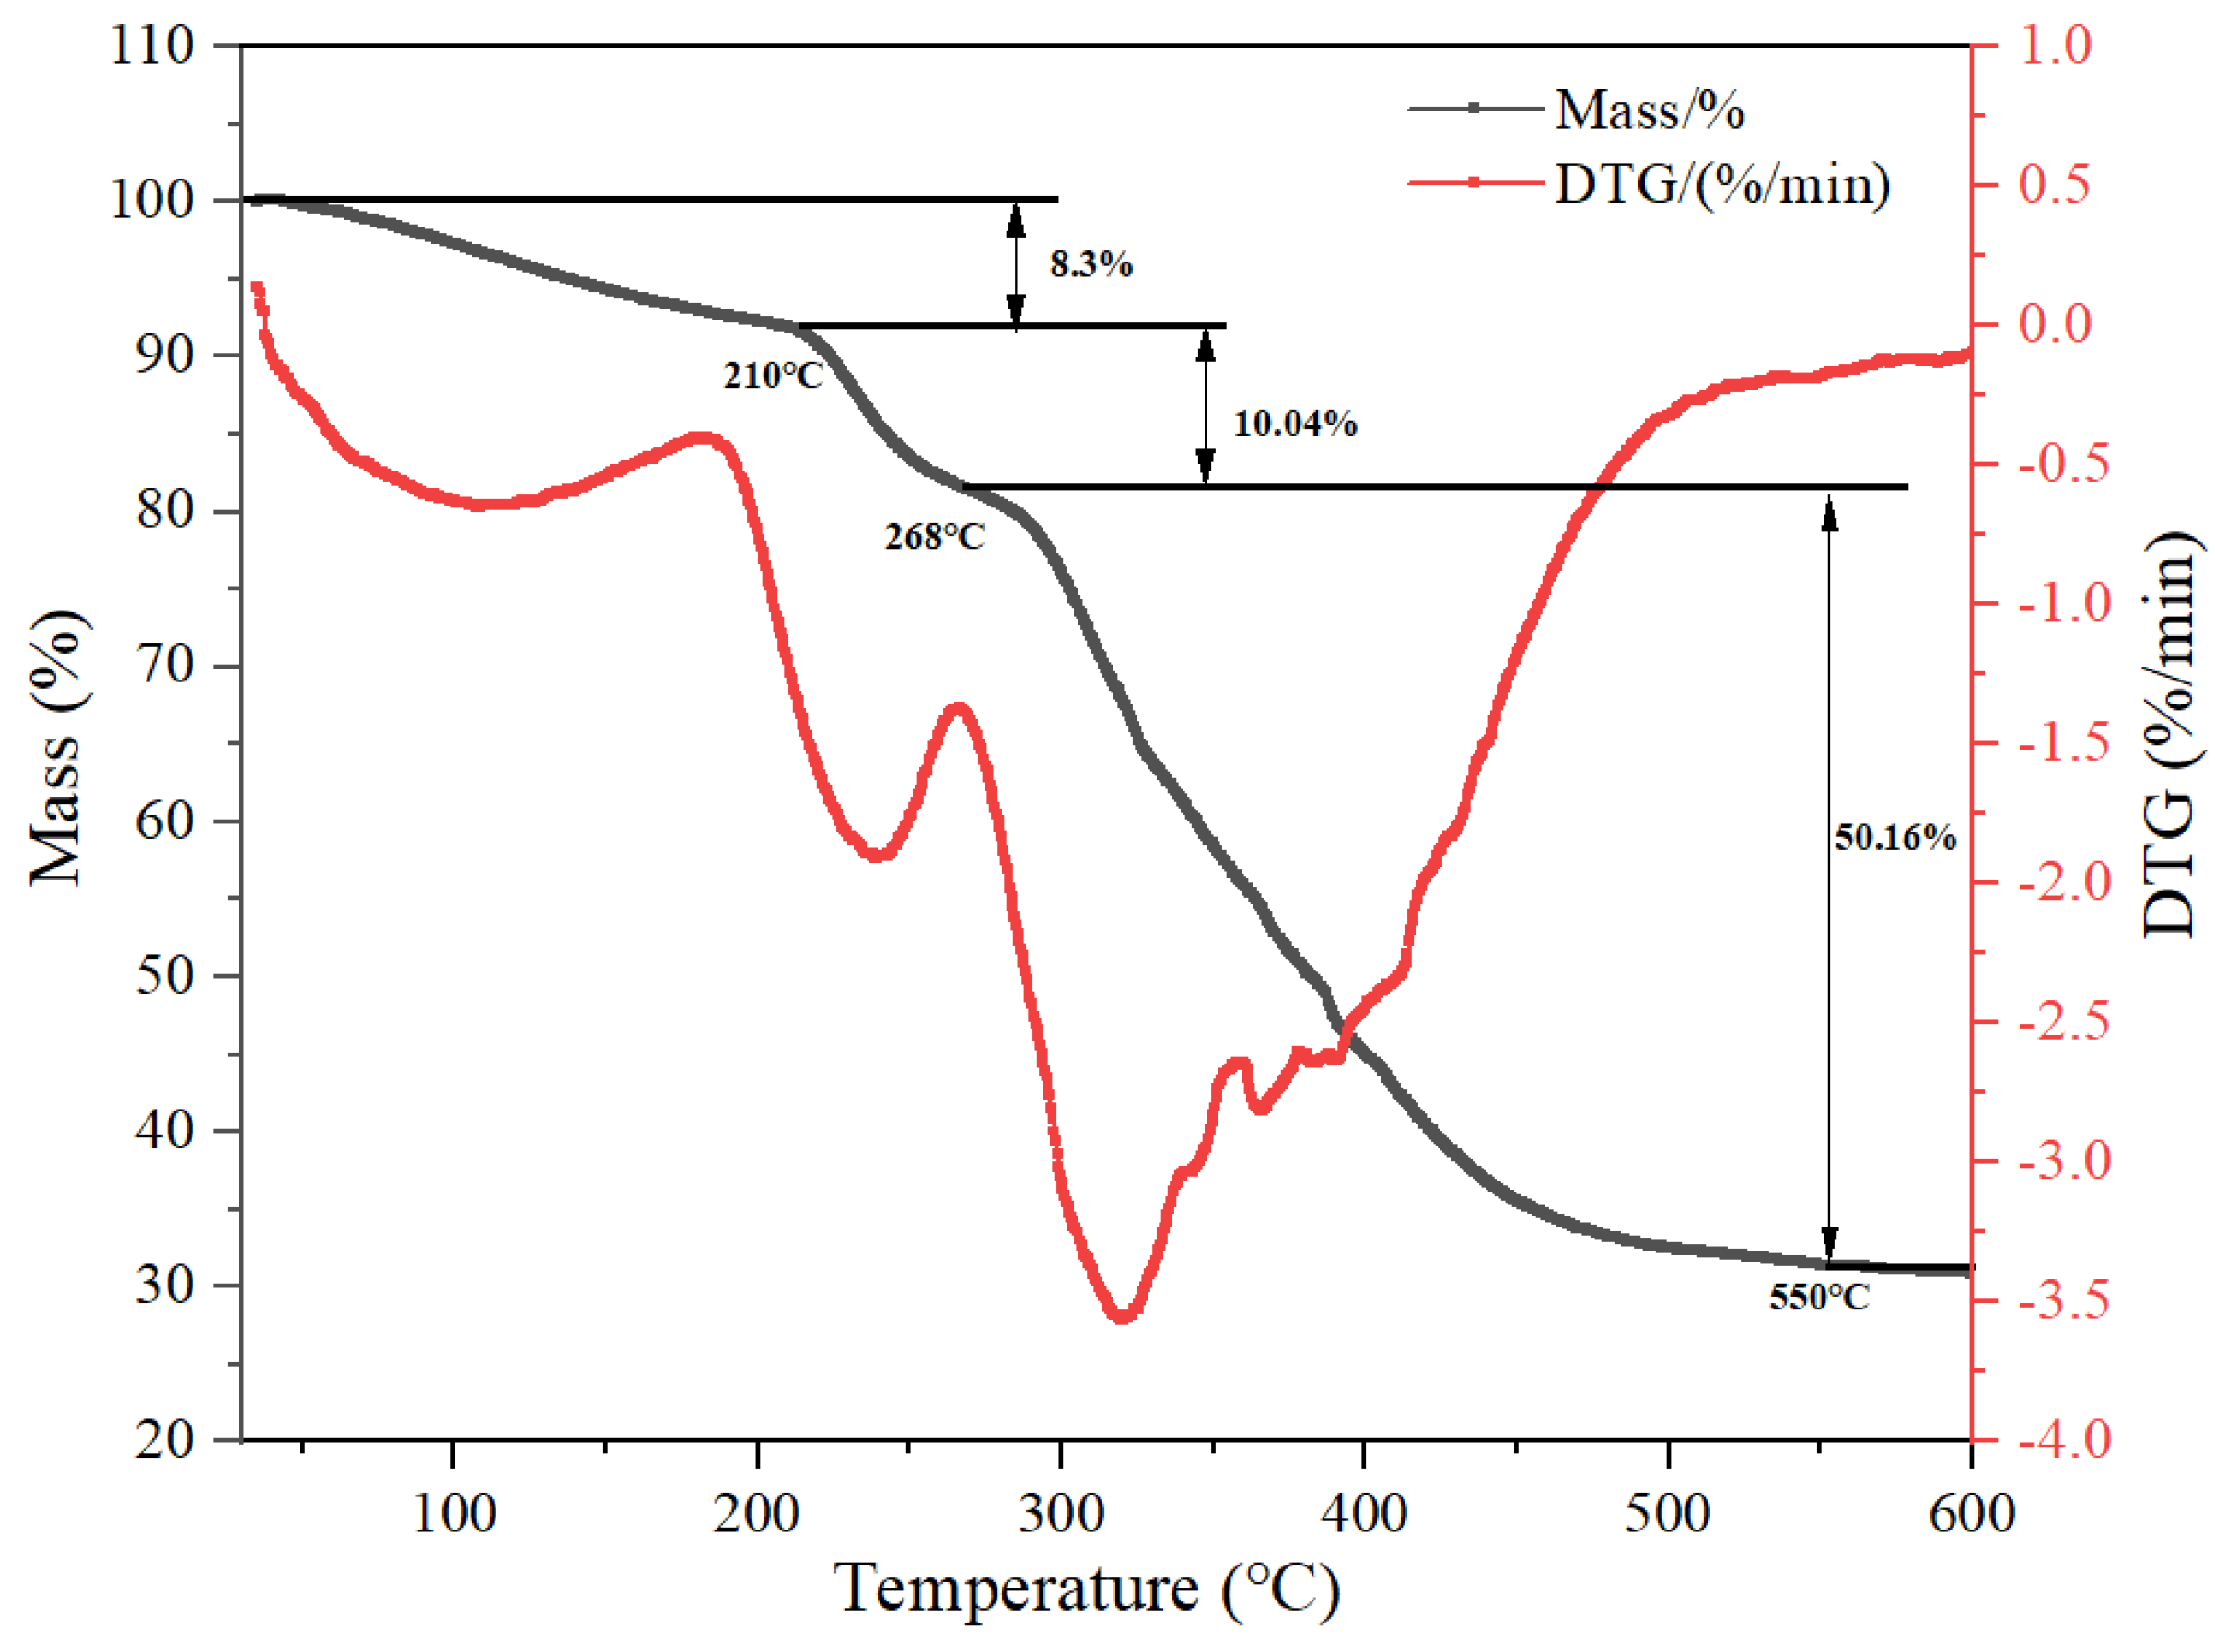
3.2.3. TGA Analysis of MAC
3.2.4. Dynamic Light Scattering (DLS)
3.3. Properties of MAC Aqueous Solution
3.3.1. Basic Properties
3.3.2. Apparent Viscosity and Viscosity Increase Rate
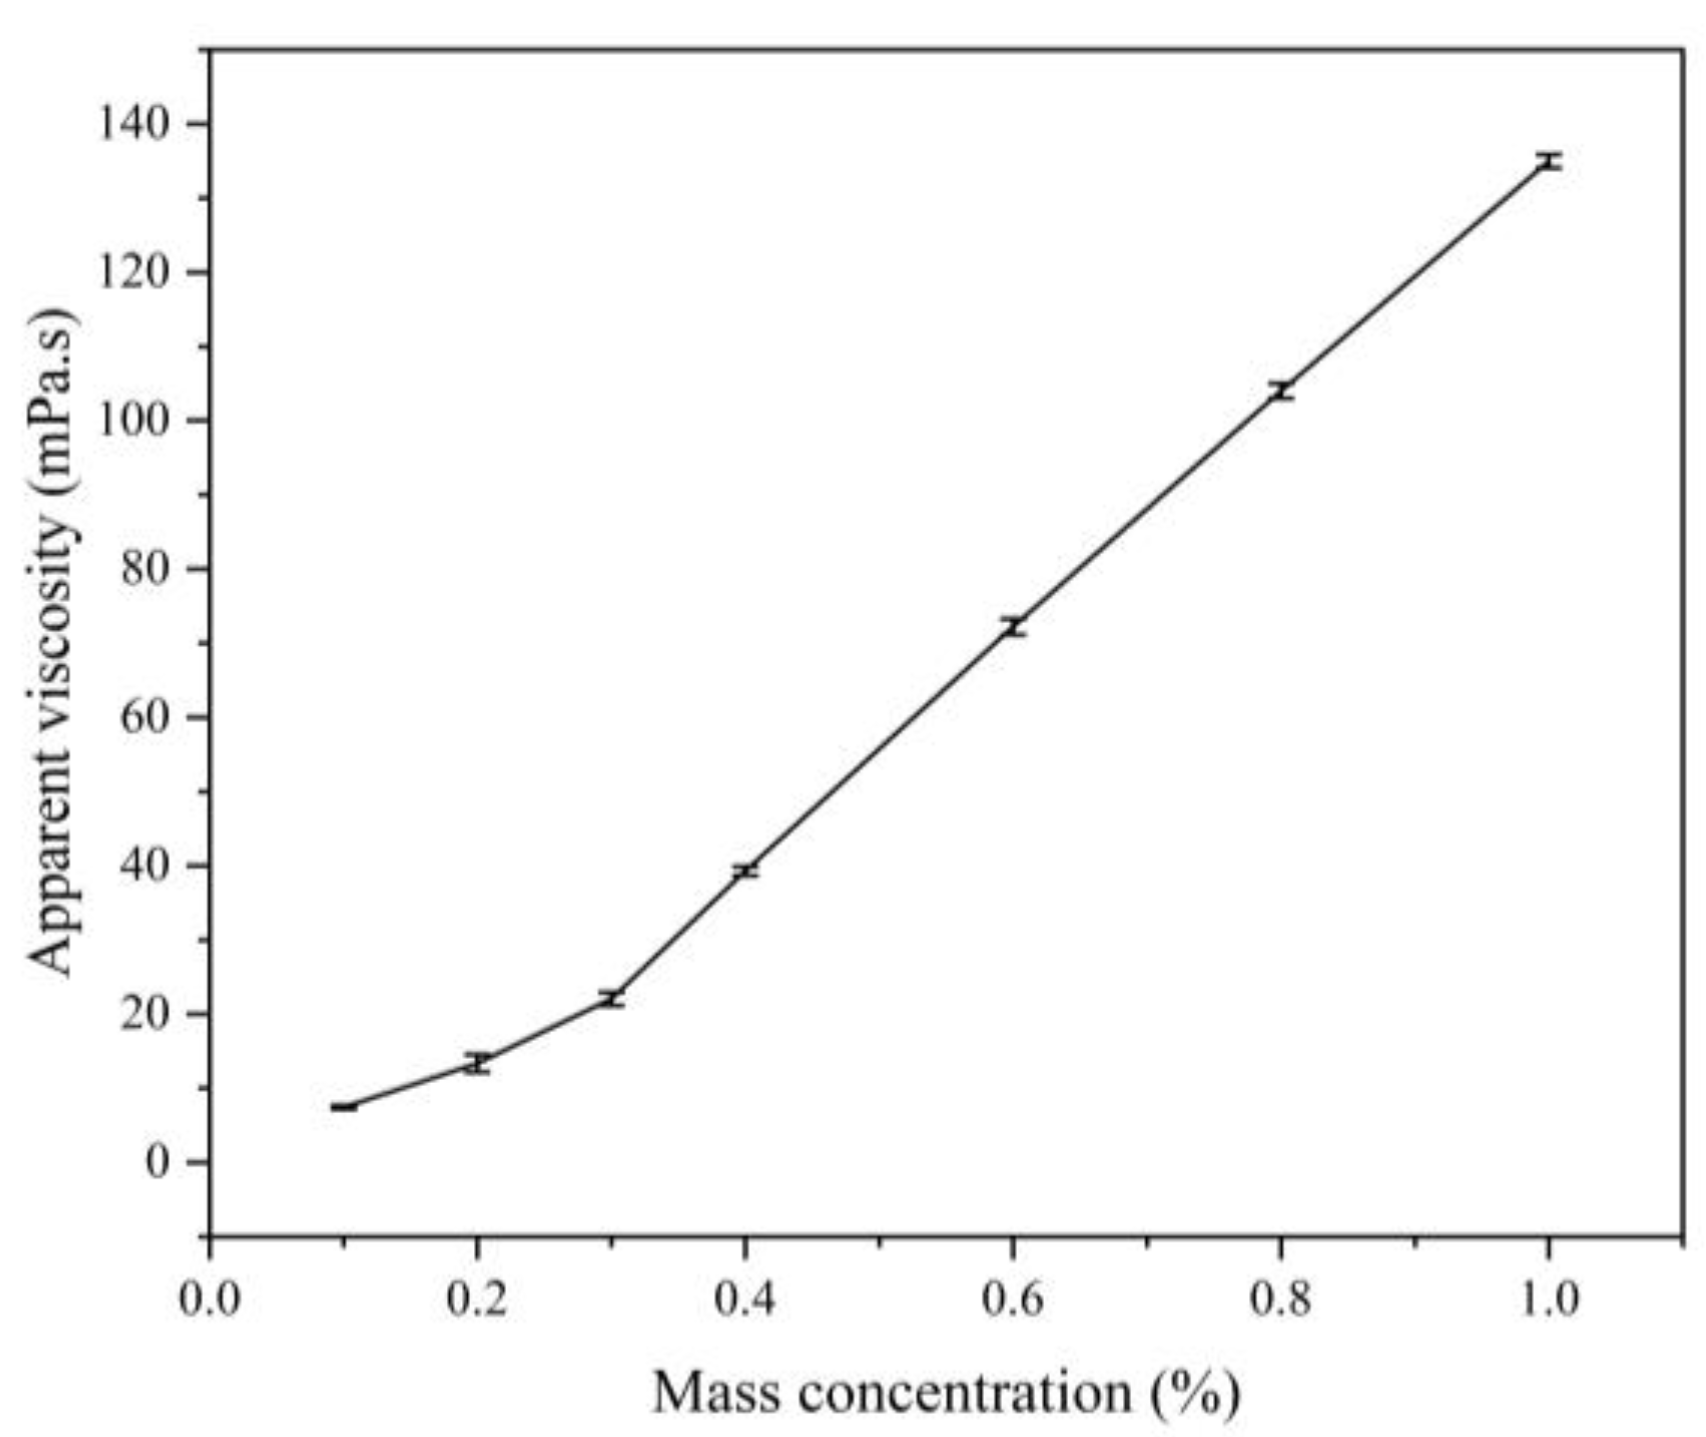
3.3.3. Effect of Concentration on the Apparent Viscosity of Polymers
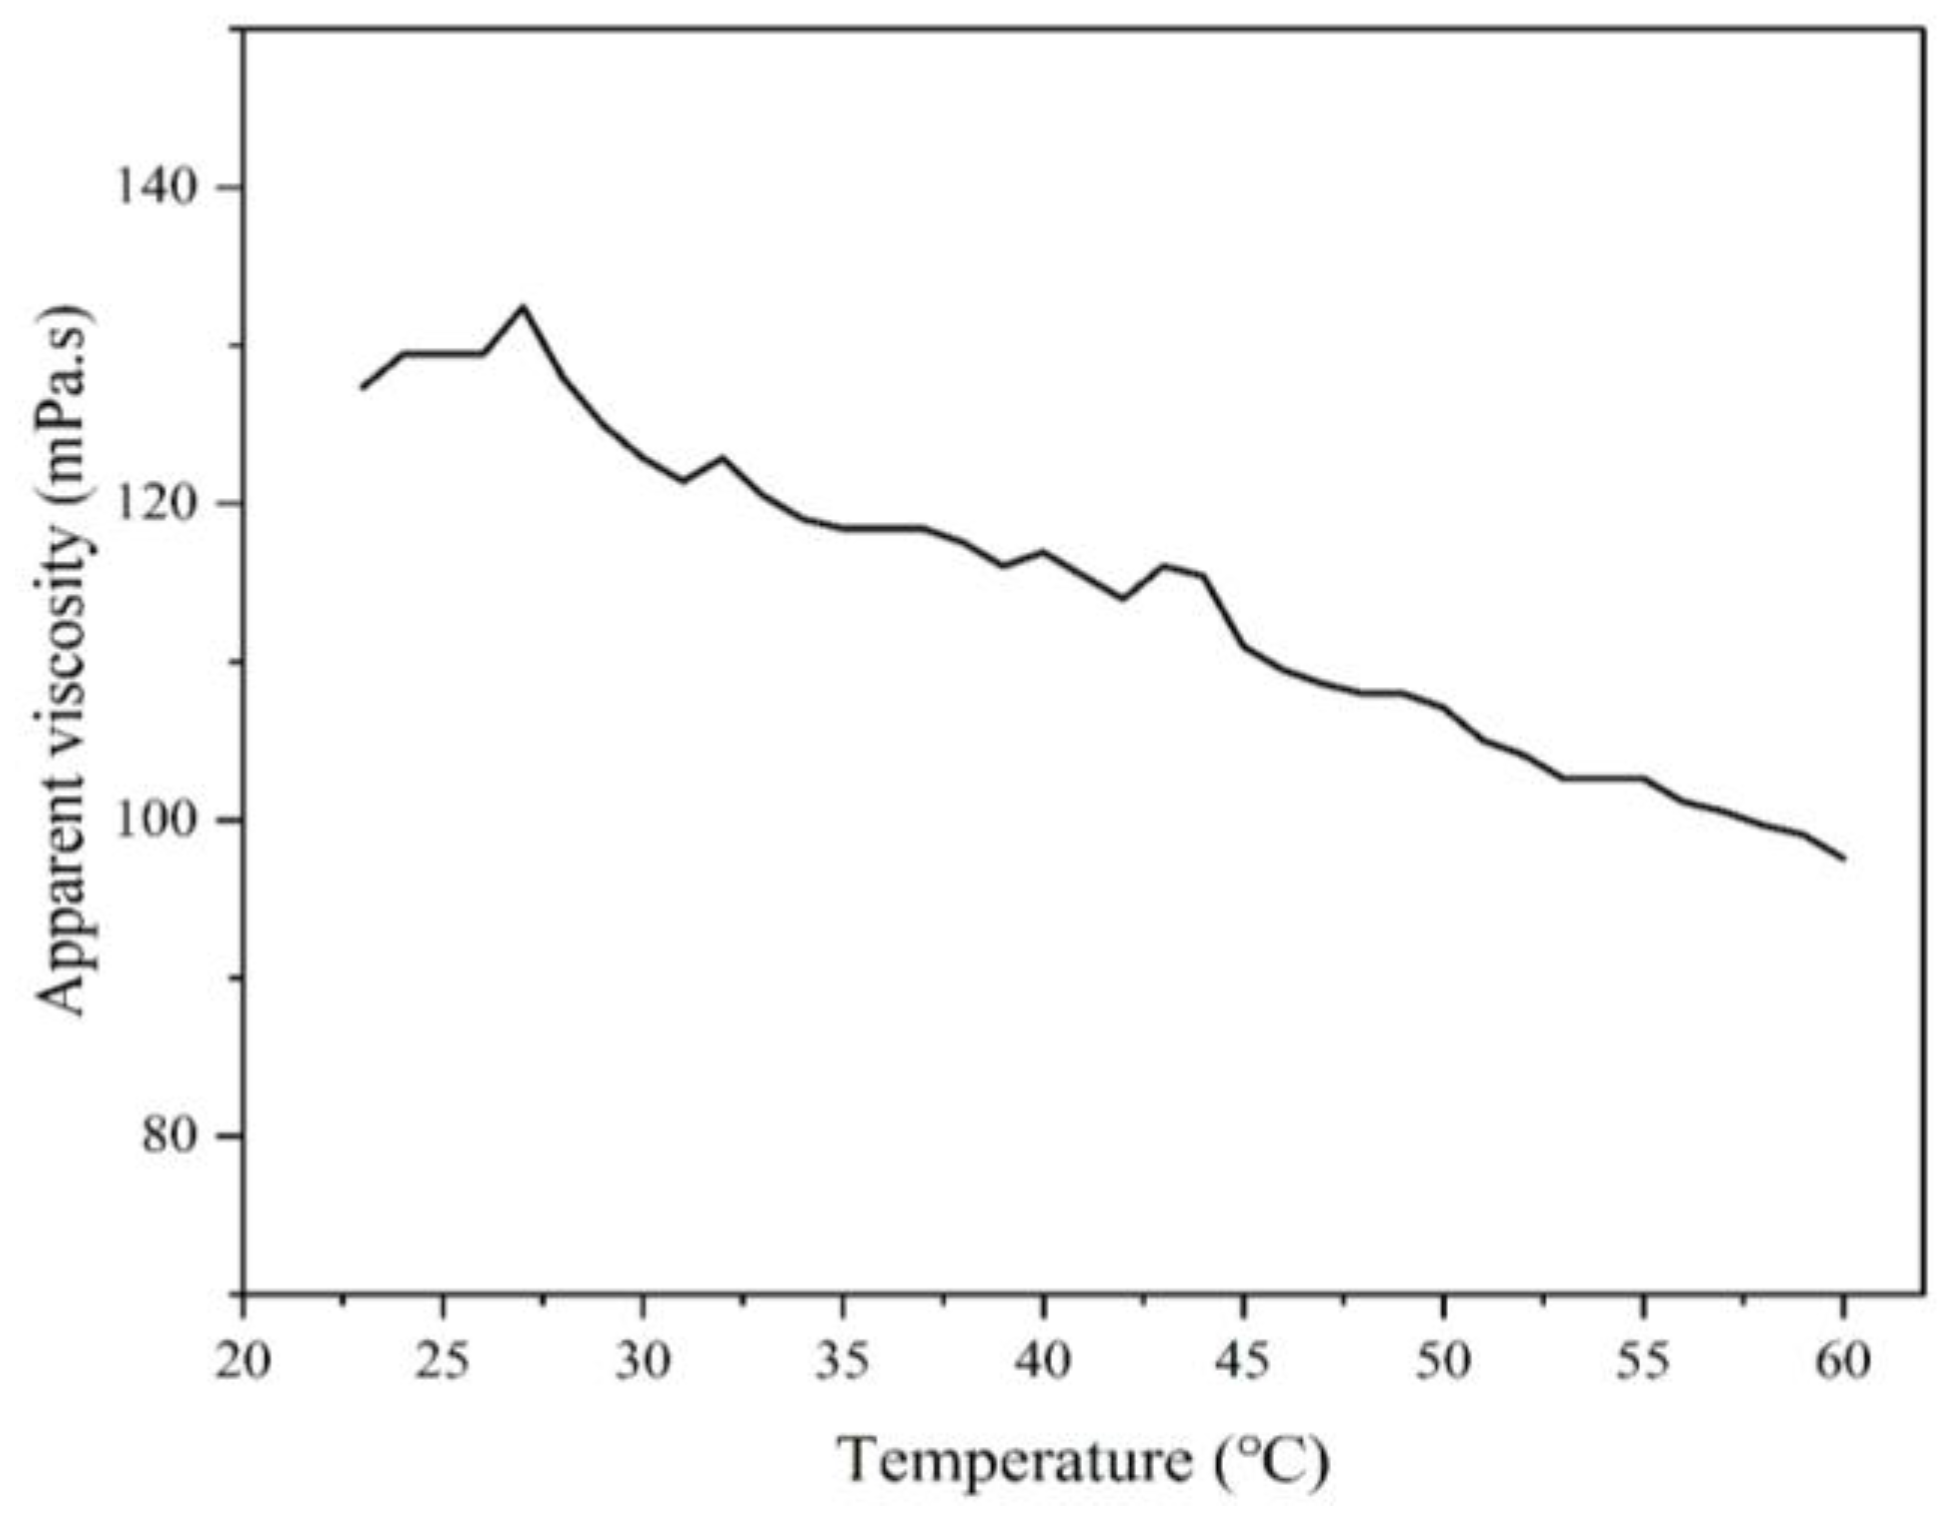
3.3.4. The Relationship Between Temperature and Apparent Viscosity
3.3.5. Temperature and Shear Resistance Performance
3.4. Properties of MAC Fracturing Fluid System
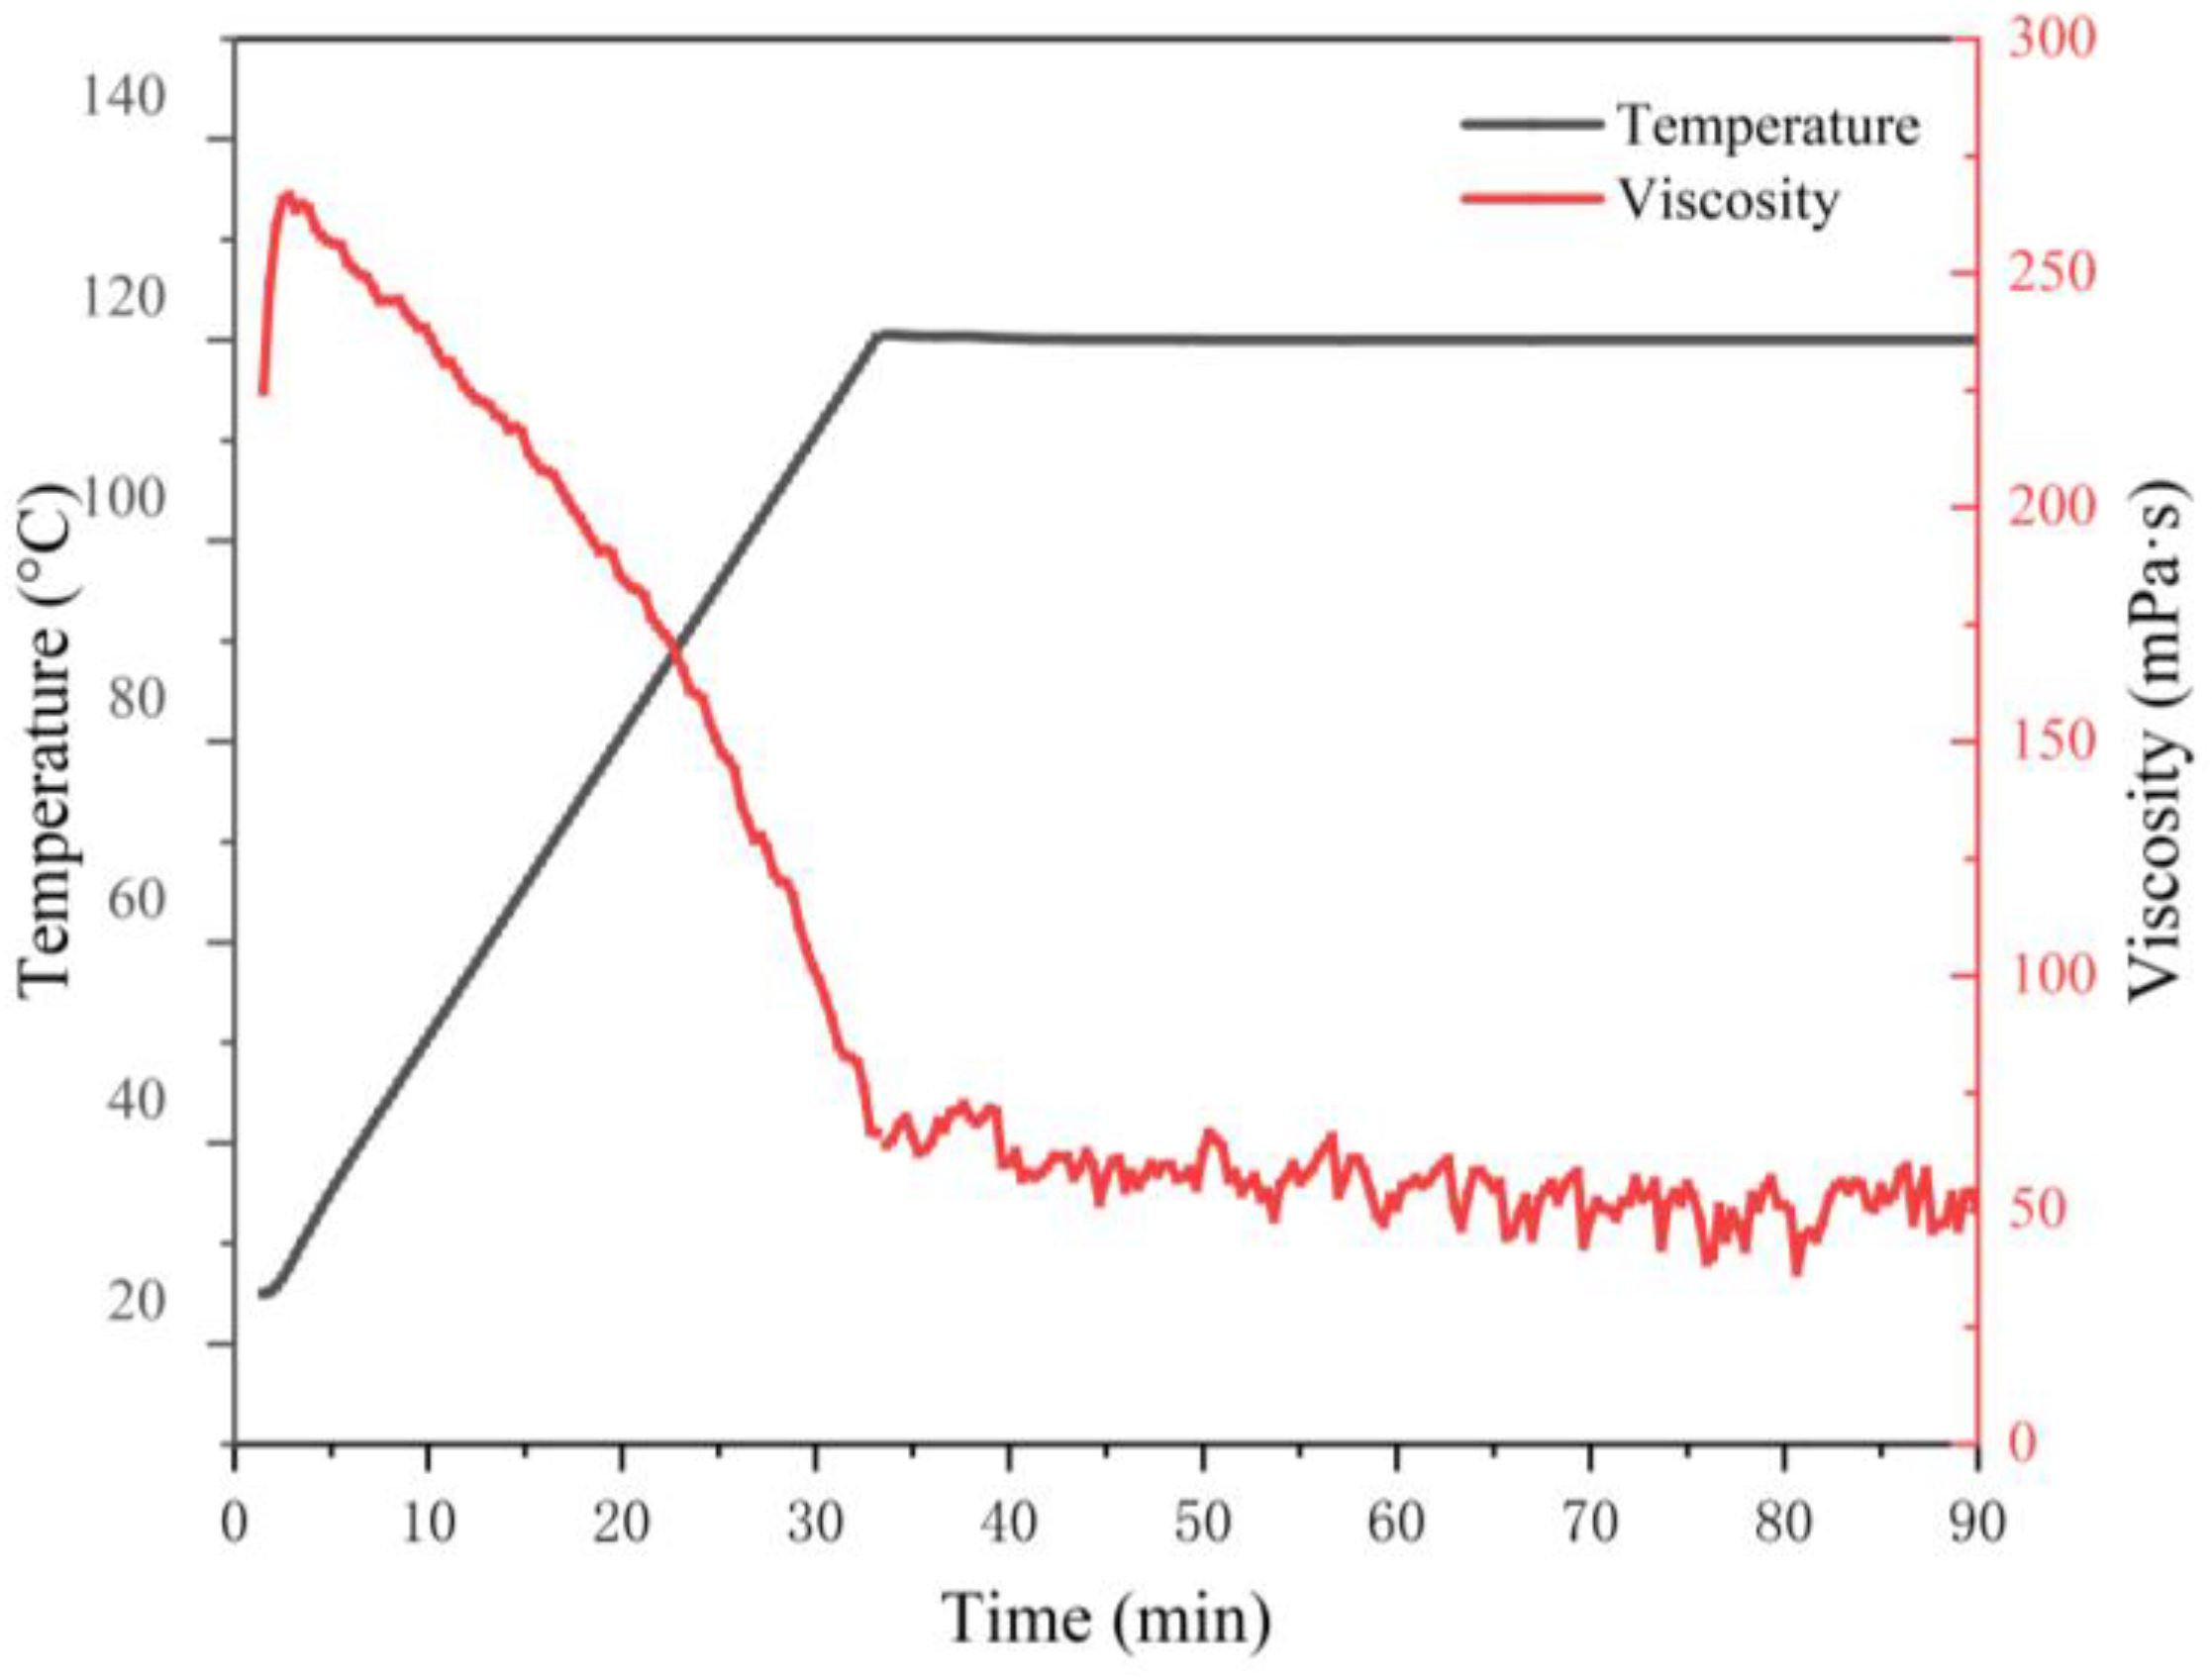
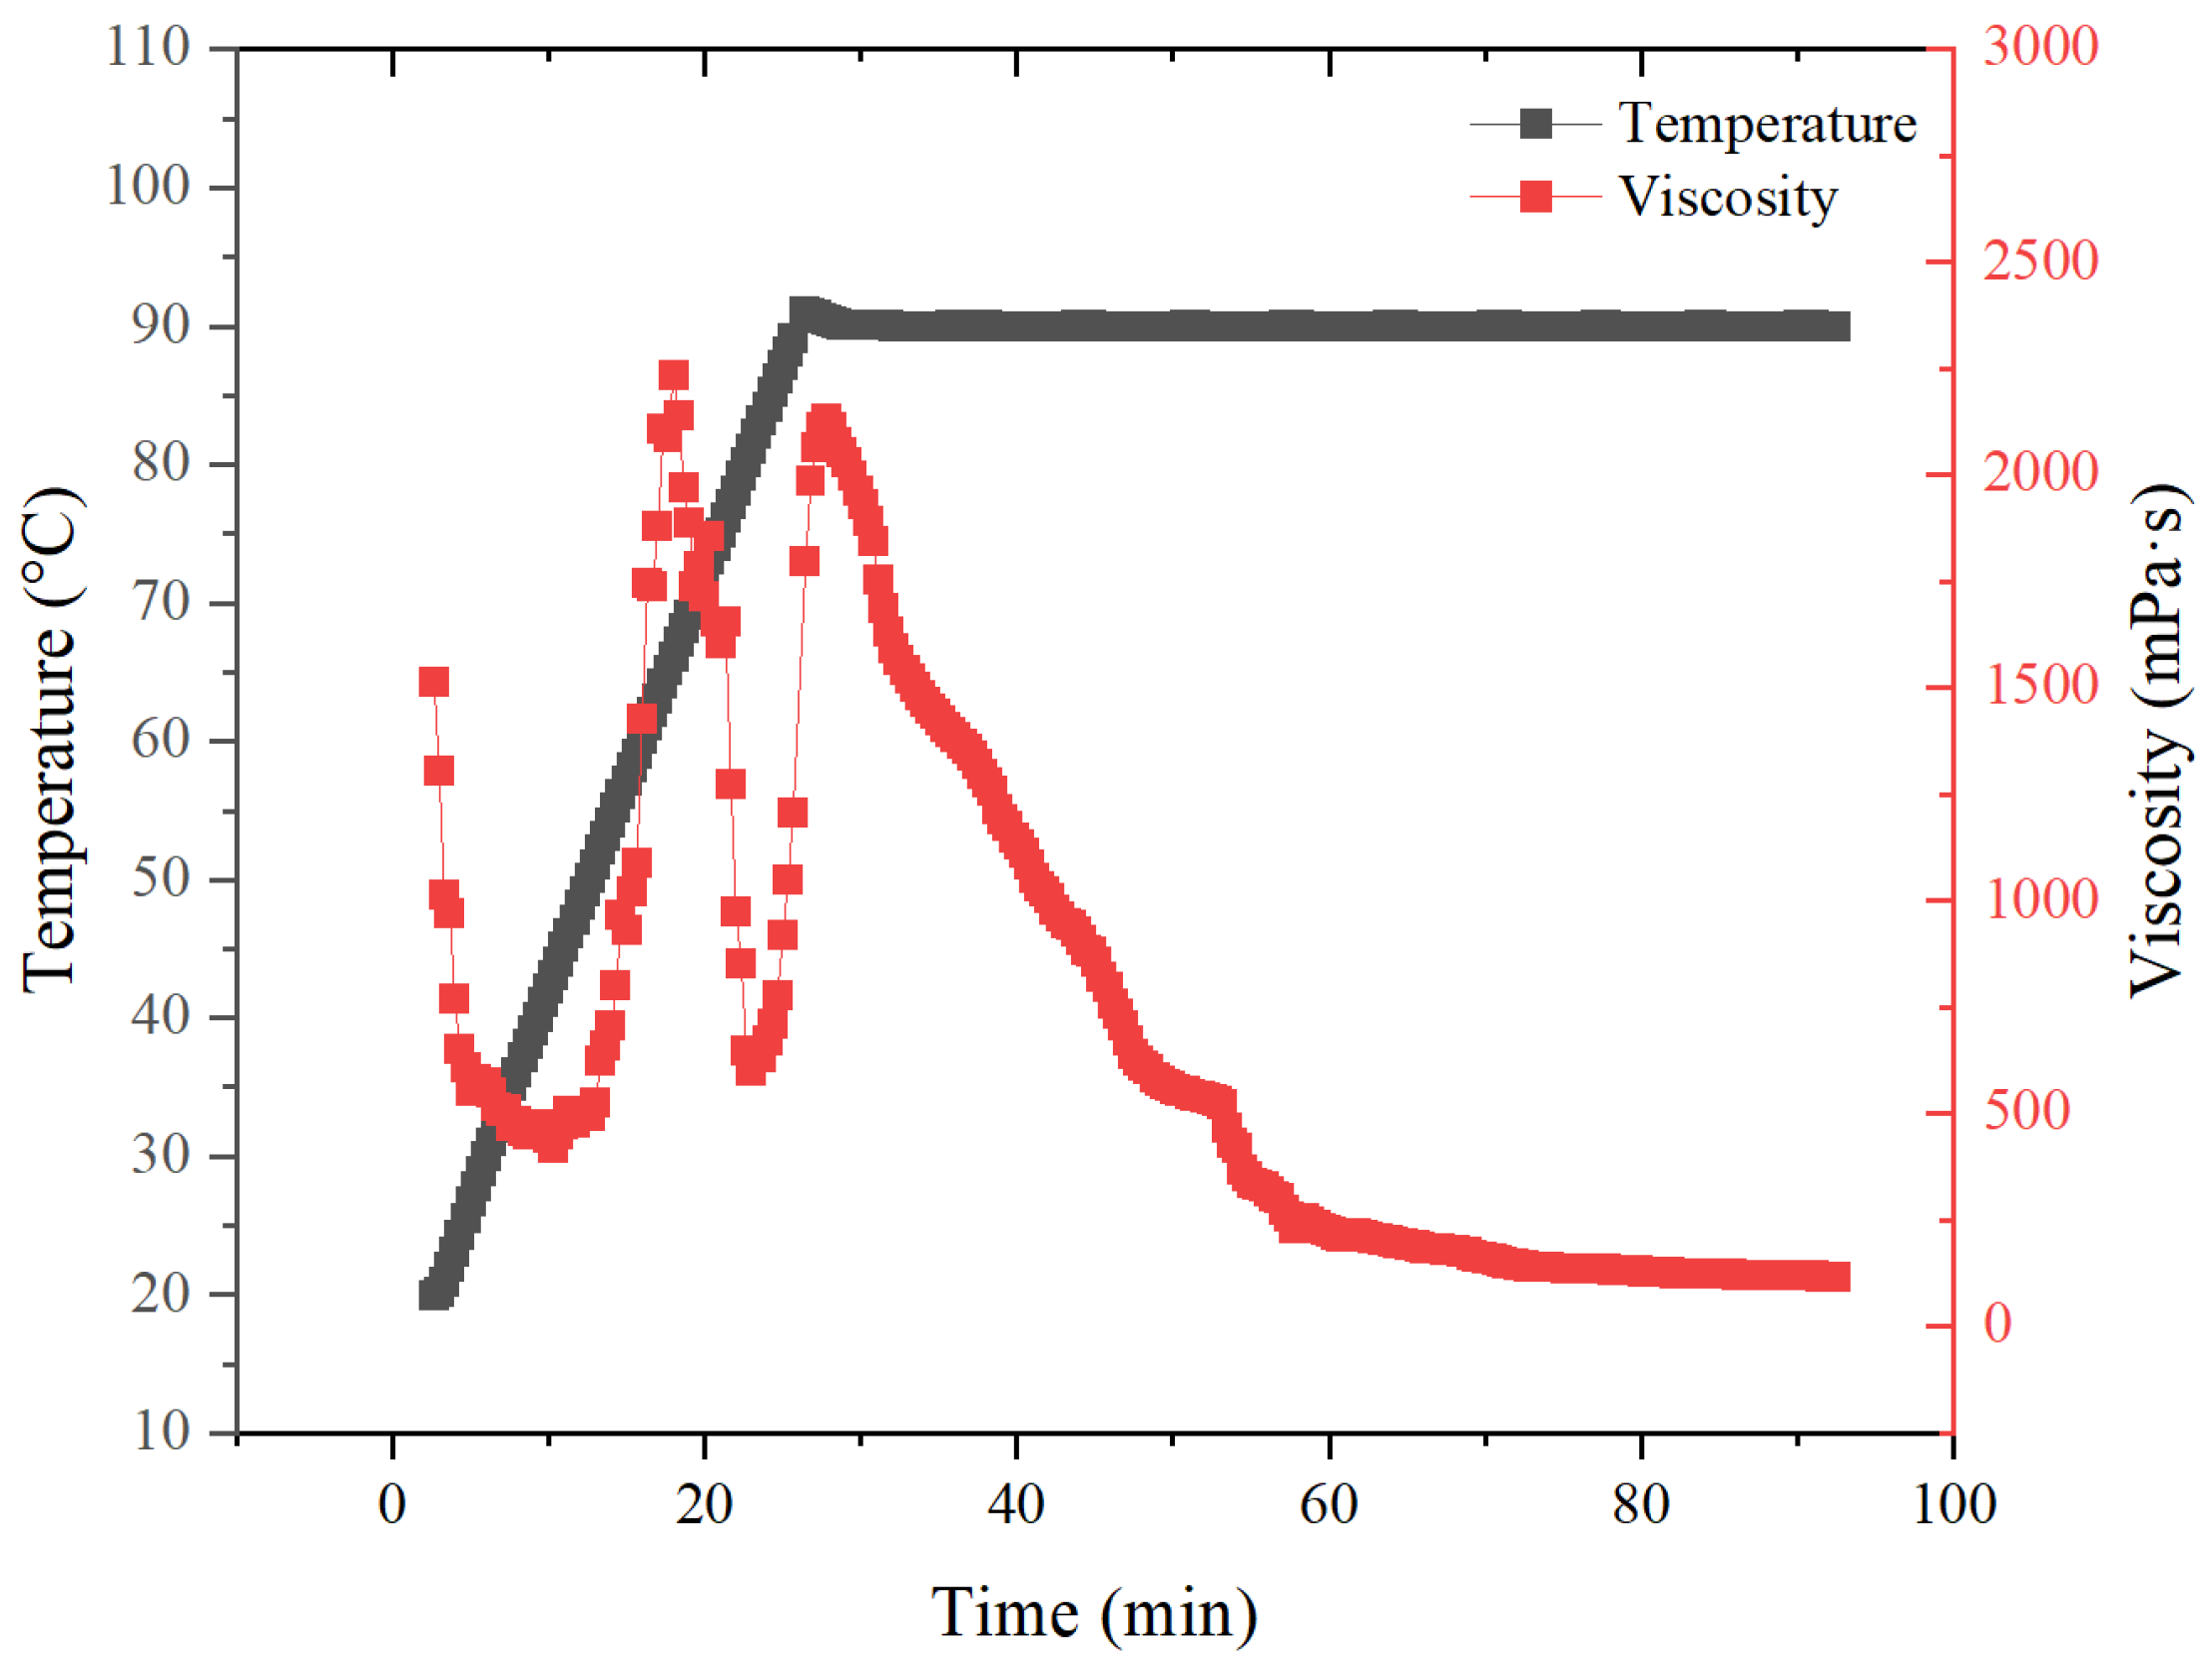
3.4.1. Temperature and Shear Resistance Performance
3.4.2. Crosslinking Time
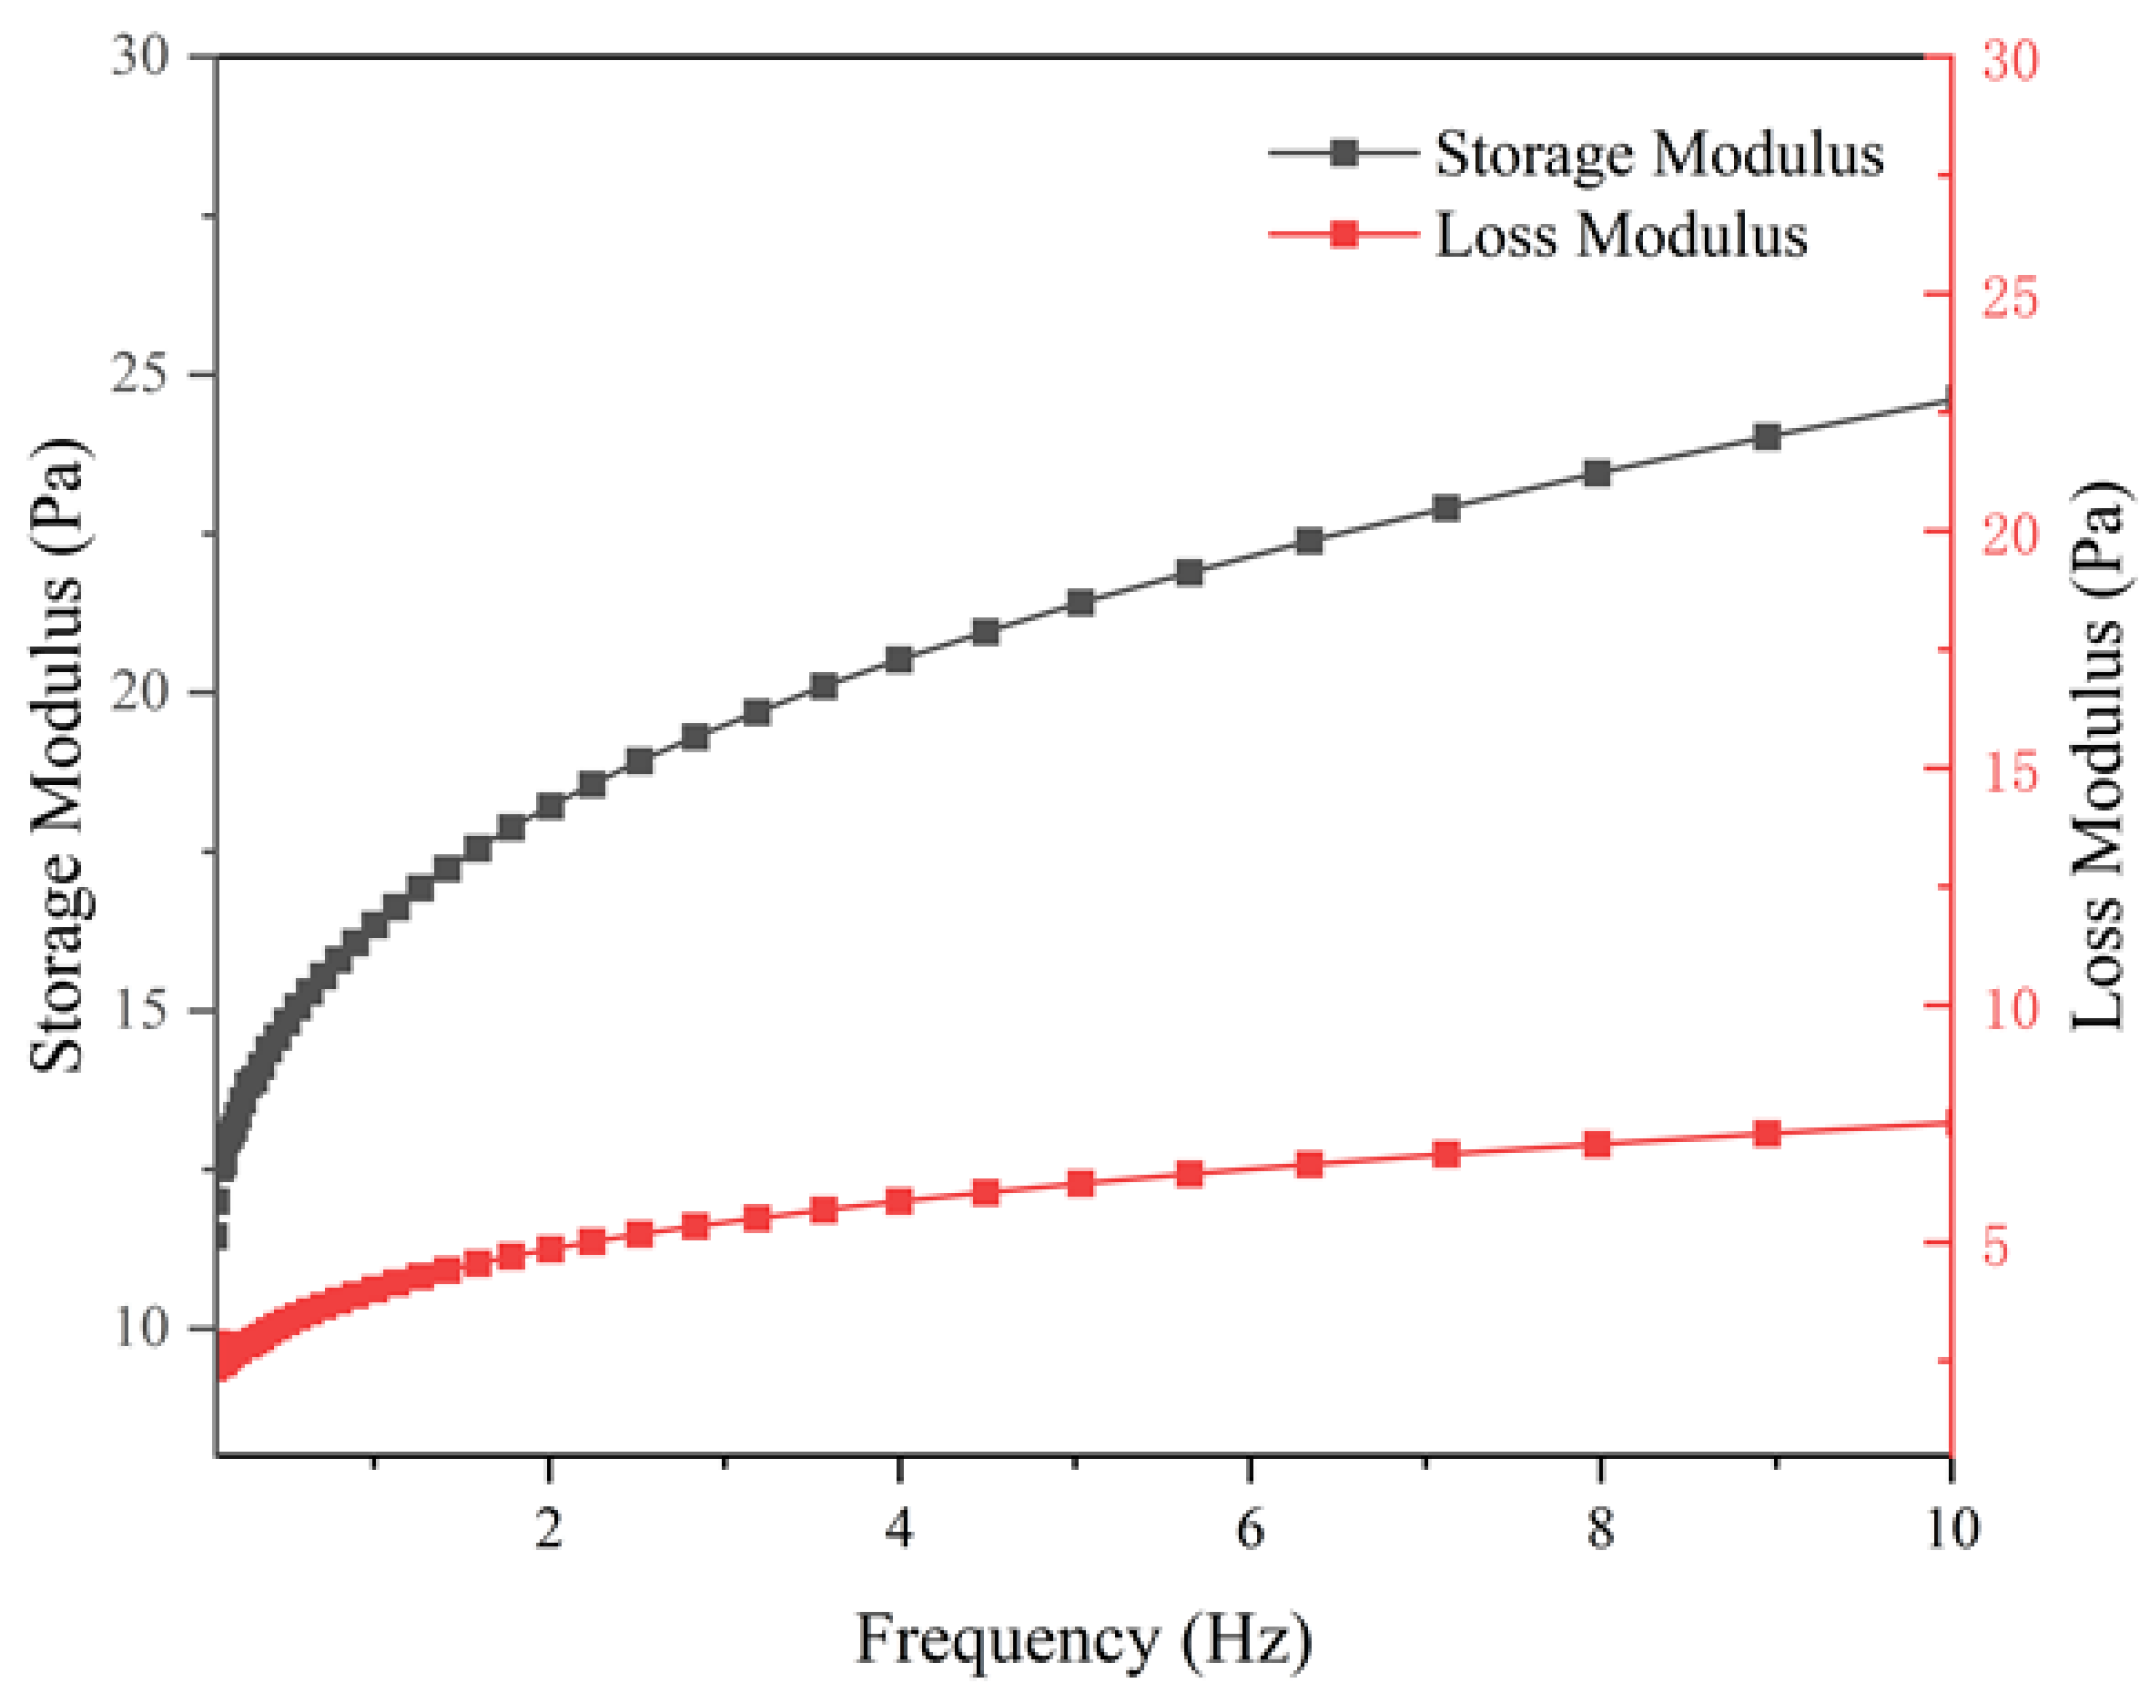
3.4.3. Viscoelasticity
3.4.4. Static Loss Performance
3.4.5. Residue Content
3.4.6. Compatibility
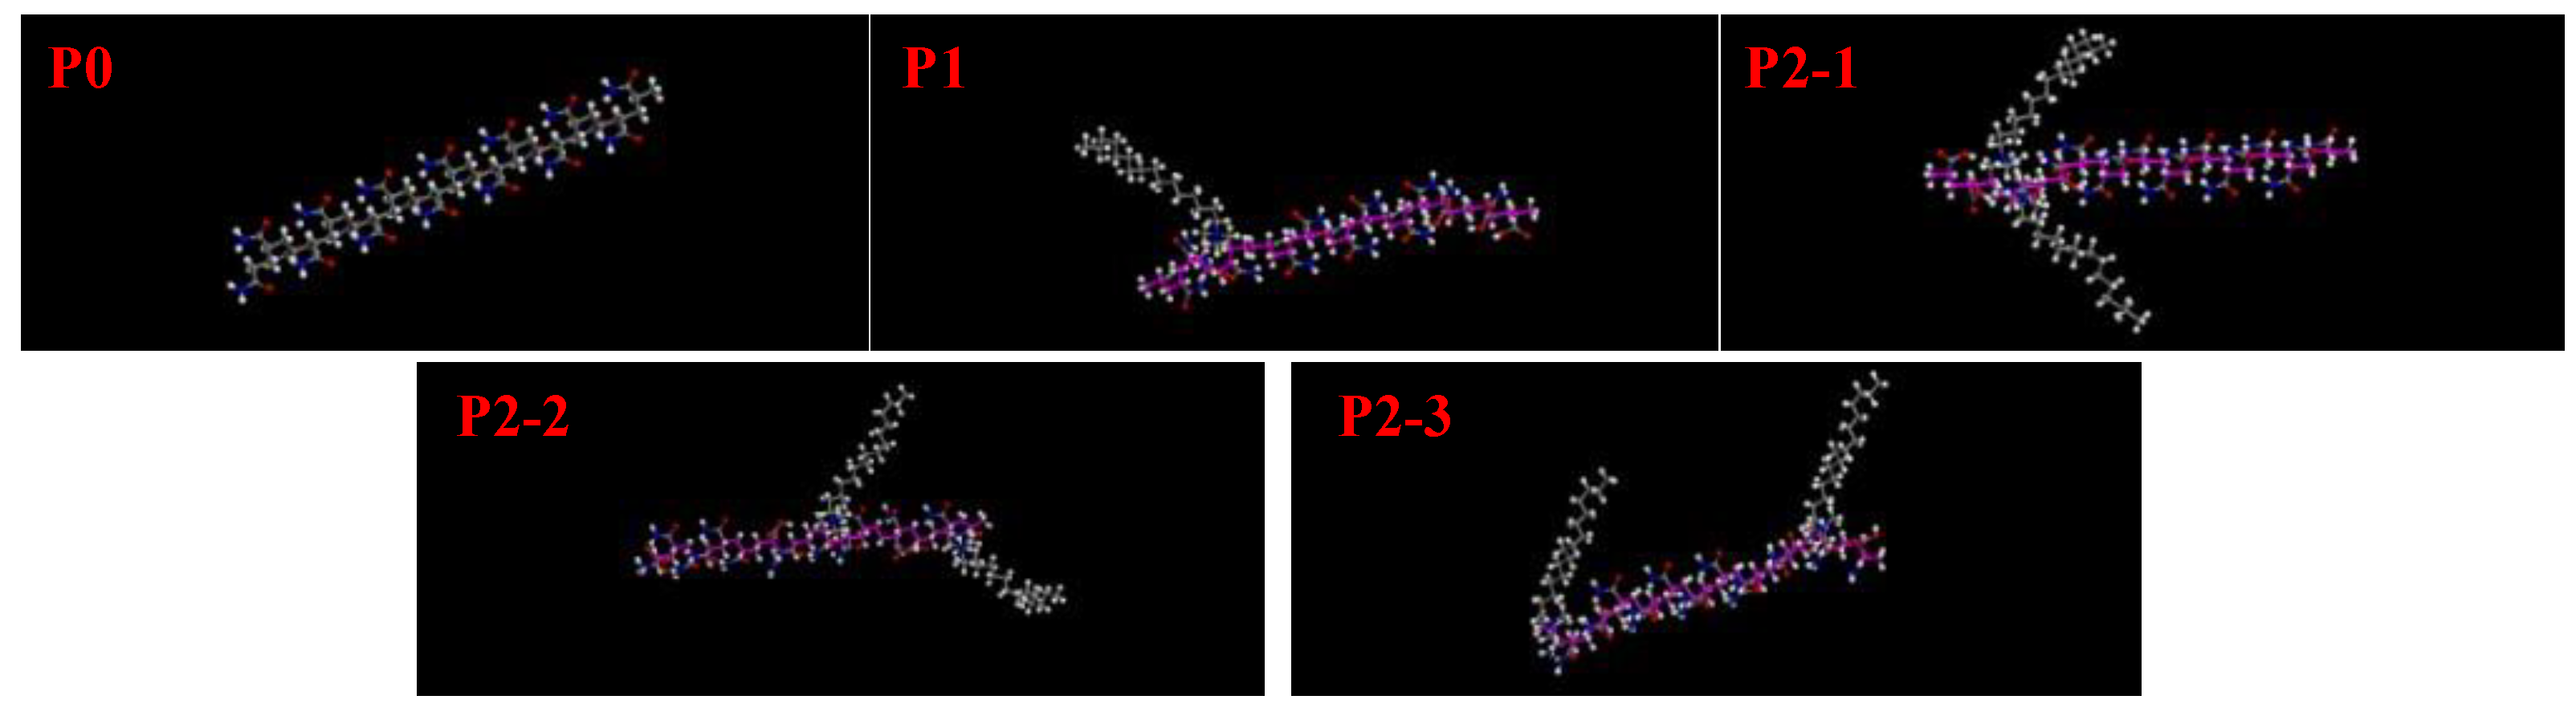
3.5. Effect of the Introduction of Hydrophobic Monomers on the Conformation of Polymer Chains
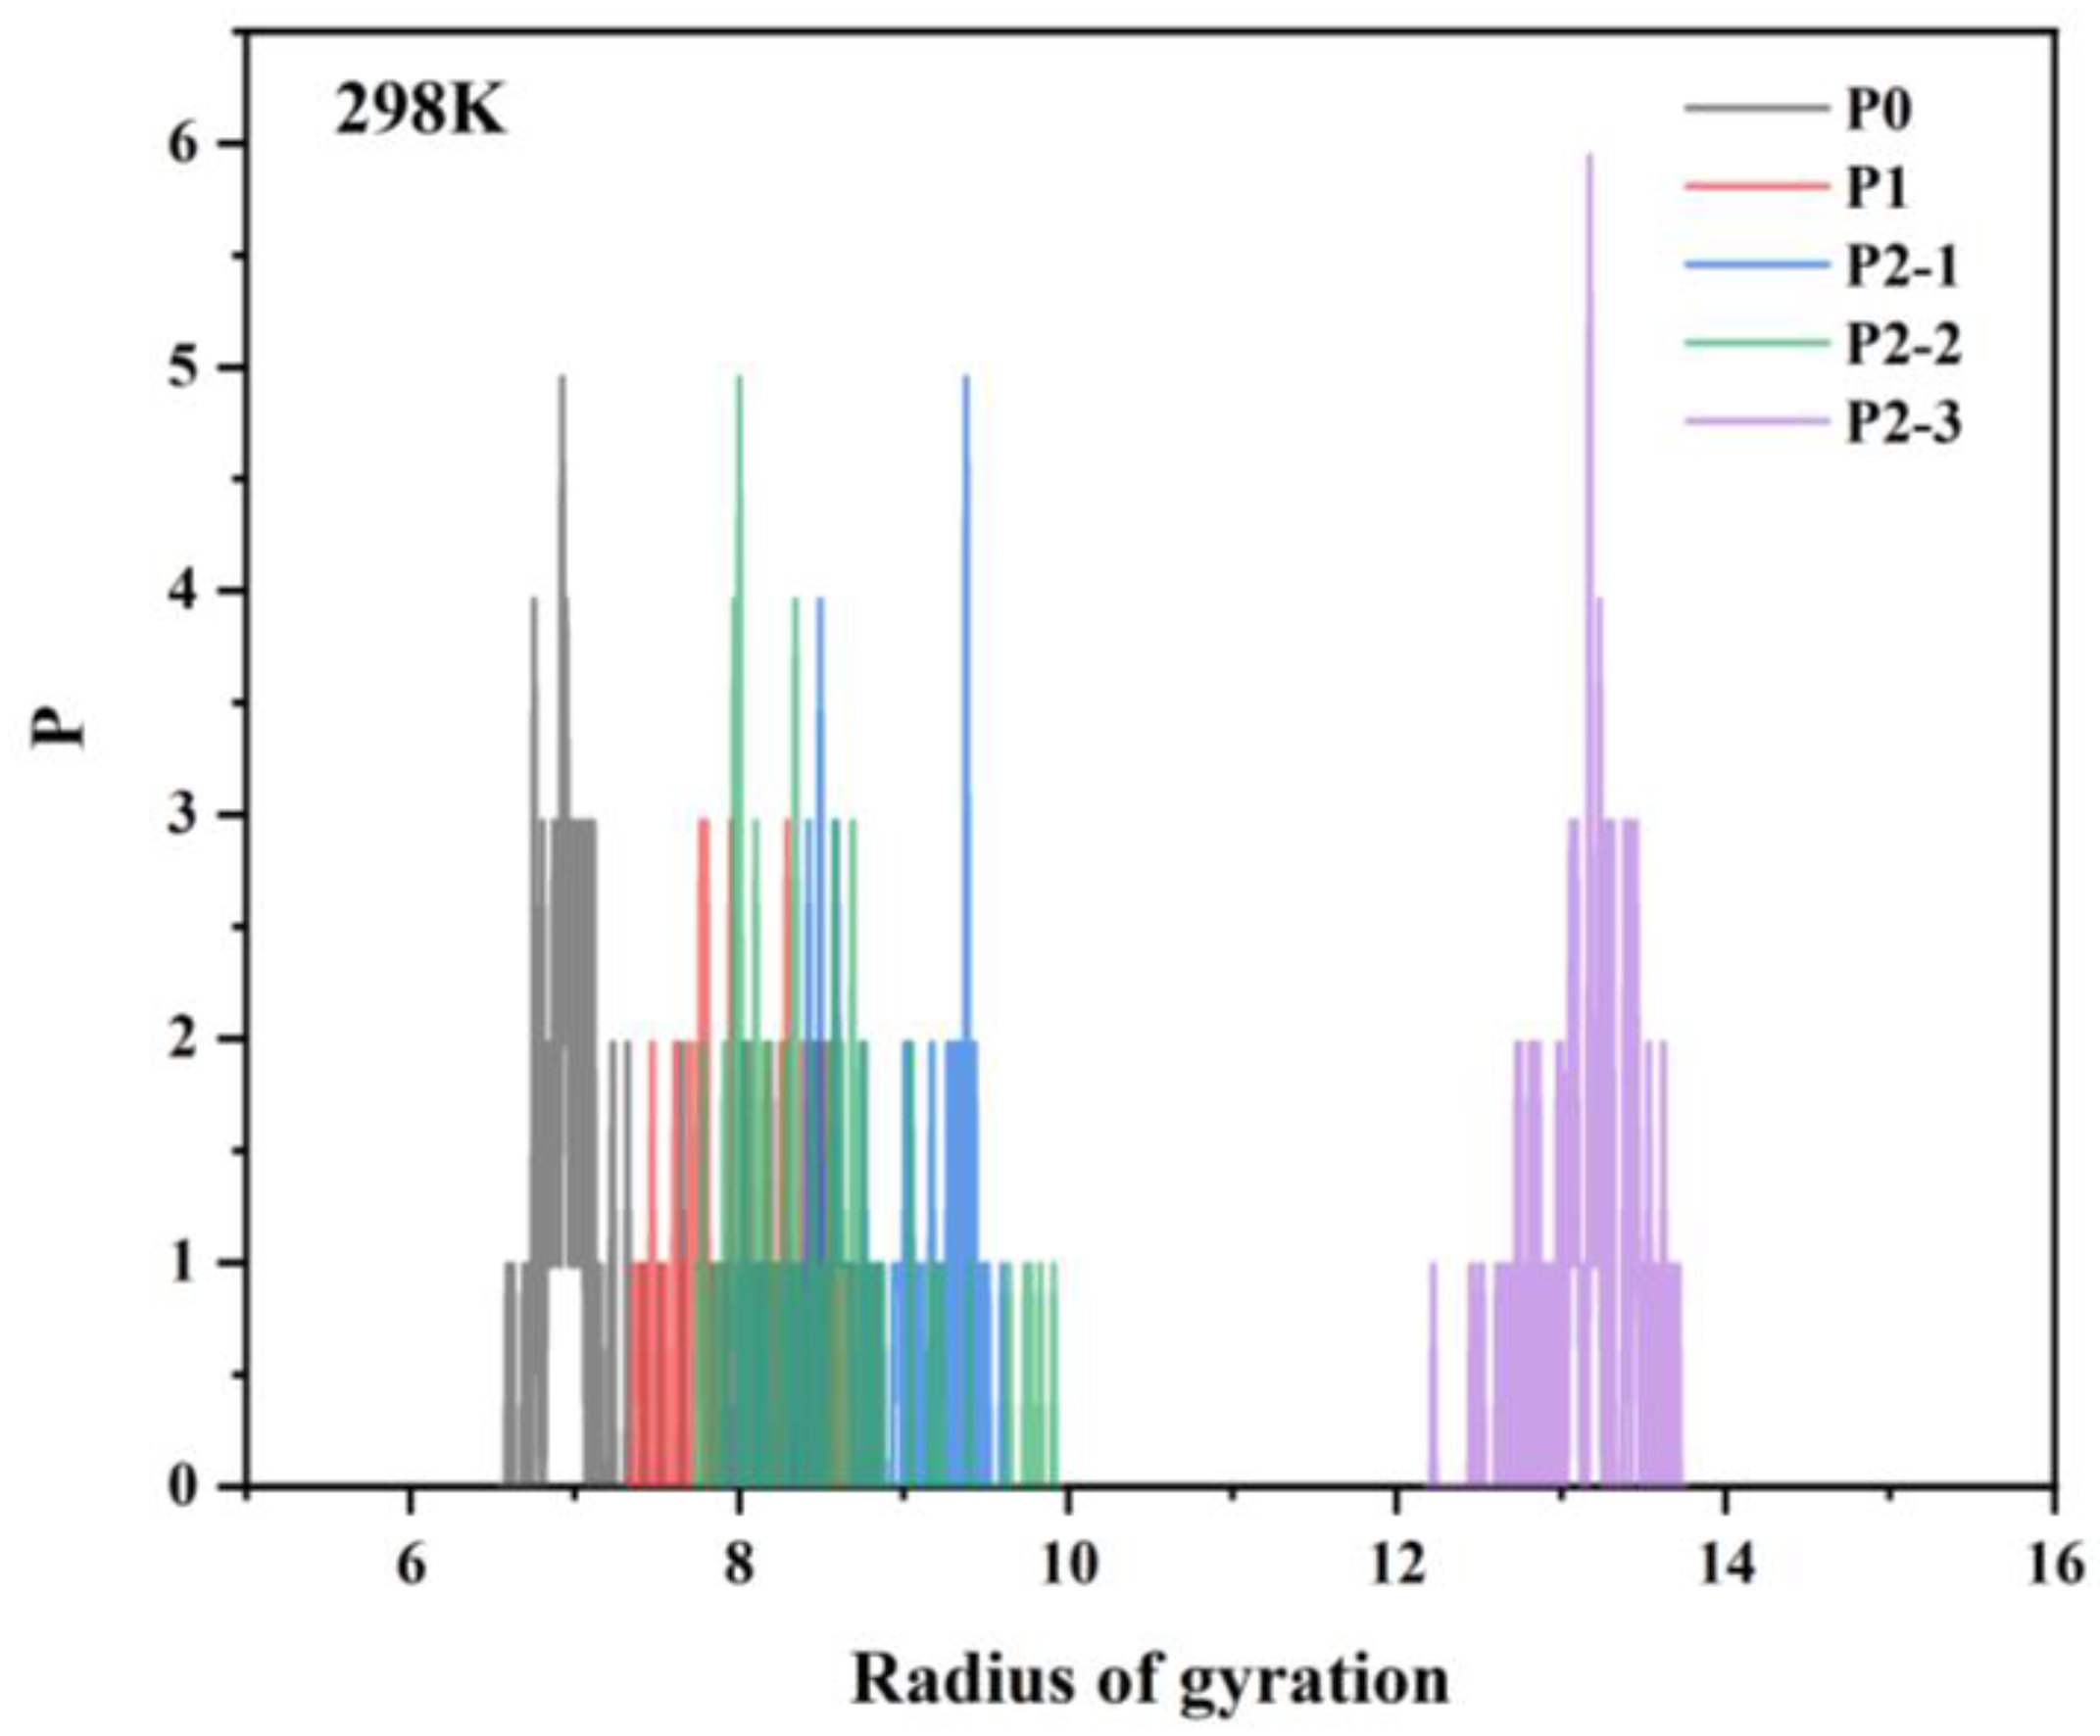
3.5.1. Effect of Hydrophobic Monomers on the Molecular Conformation of Ternary Polymers at Different Temperatures
3.5.2. Effect of AA Monomer on the Molecular Conformation of Ternary Polymer at Different Temperatures
4. Conclusions
- The results of FTIR and 1H NMR confirm the successful synthesis of the ternary hydrophobically linked polymers.
- The formation of the polymer MAC network structure primarily occurs through the process of contact twist conjugation, with significant intermolecular conjugation observed between 0.2% and 0.4%, consistent with the viscosity–concentration curve results.
- When 1% of the synthetic polymer was added to form the base fluid, the apparent viscosity of the fluid increased to 133.11 mPa·s, representing a 97% increase in viscosity. The base fluid was crosslinked with 1.5% crosslinker to form a gel. At 90 °C, the controlled loss coefficient (C3) and loss velocity (vc) of the filter cake were 0.84 × 10⁻³ m/min1/2 and 1.40 × 10⁻⁴ m/min, respectively, both of which met the technical requirements of water-based fracturing fluid.
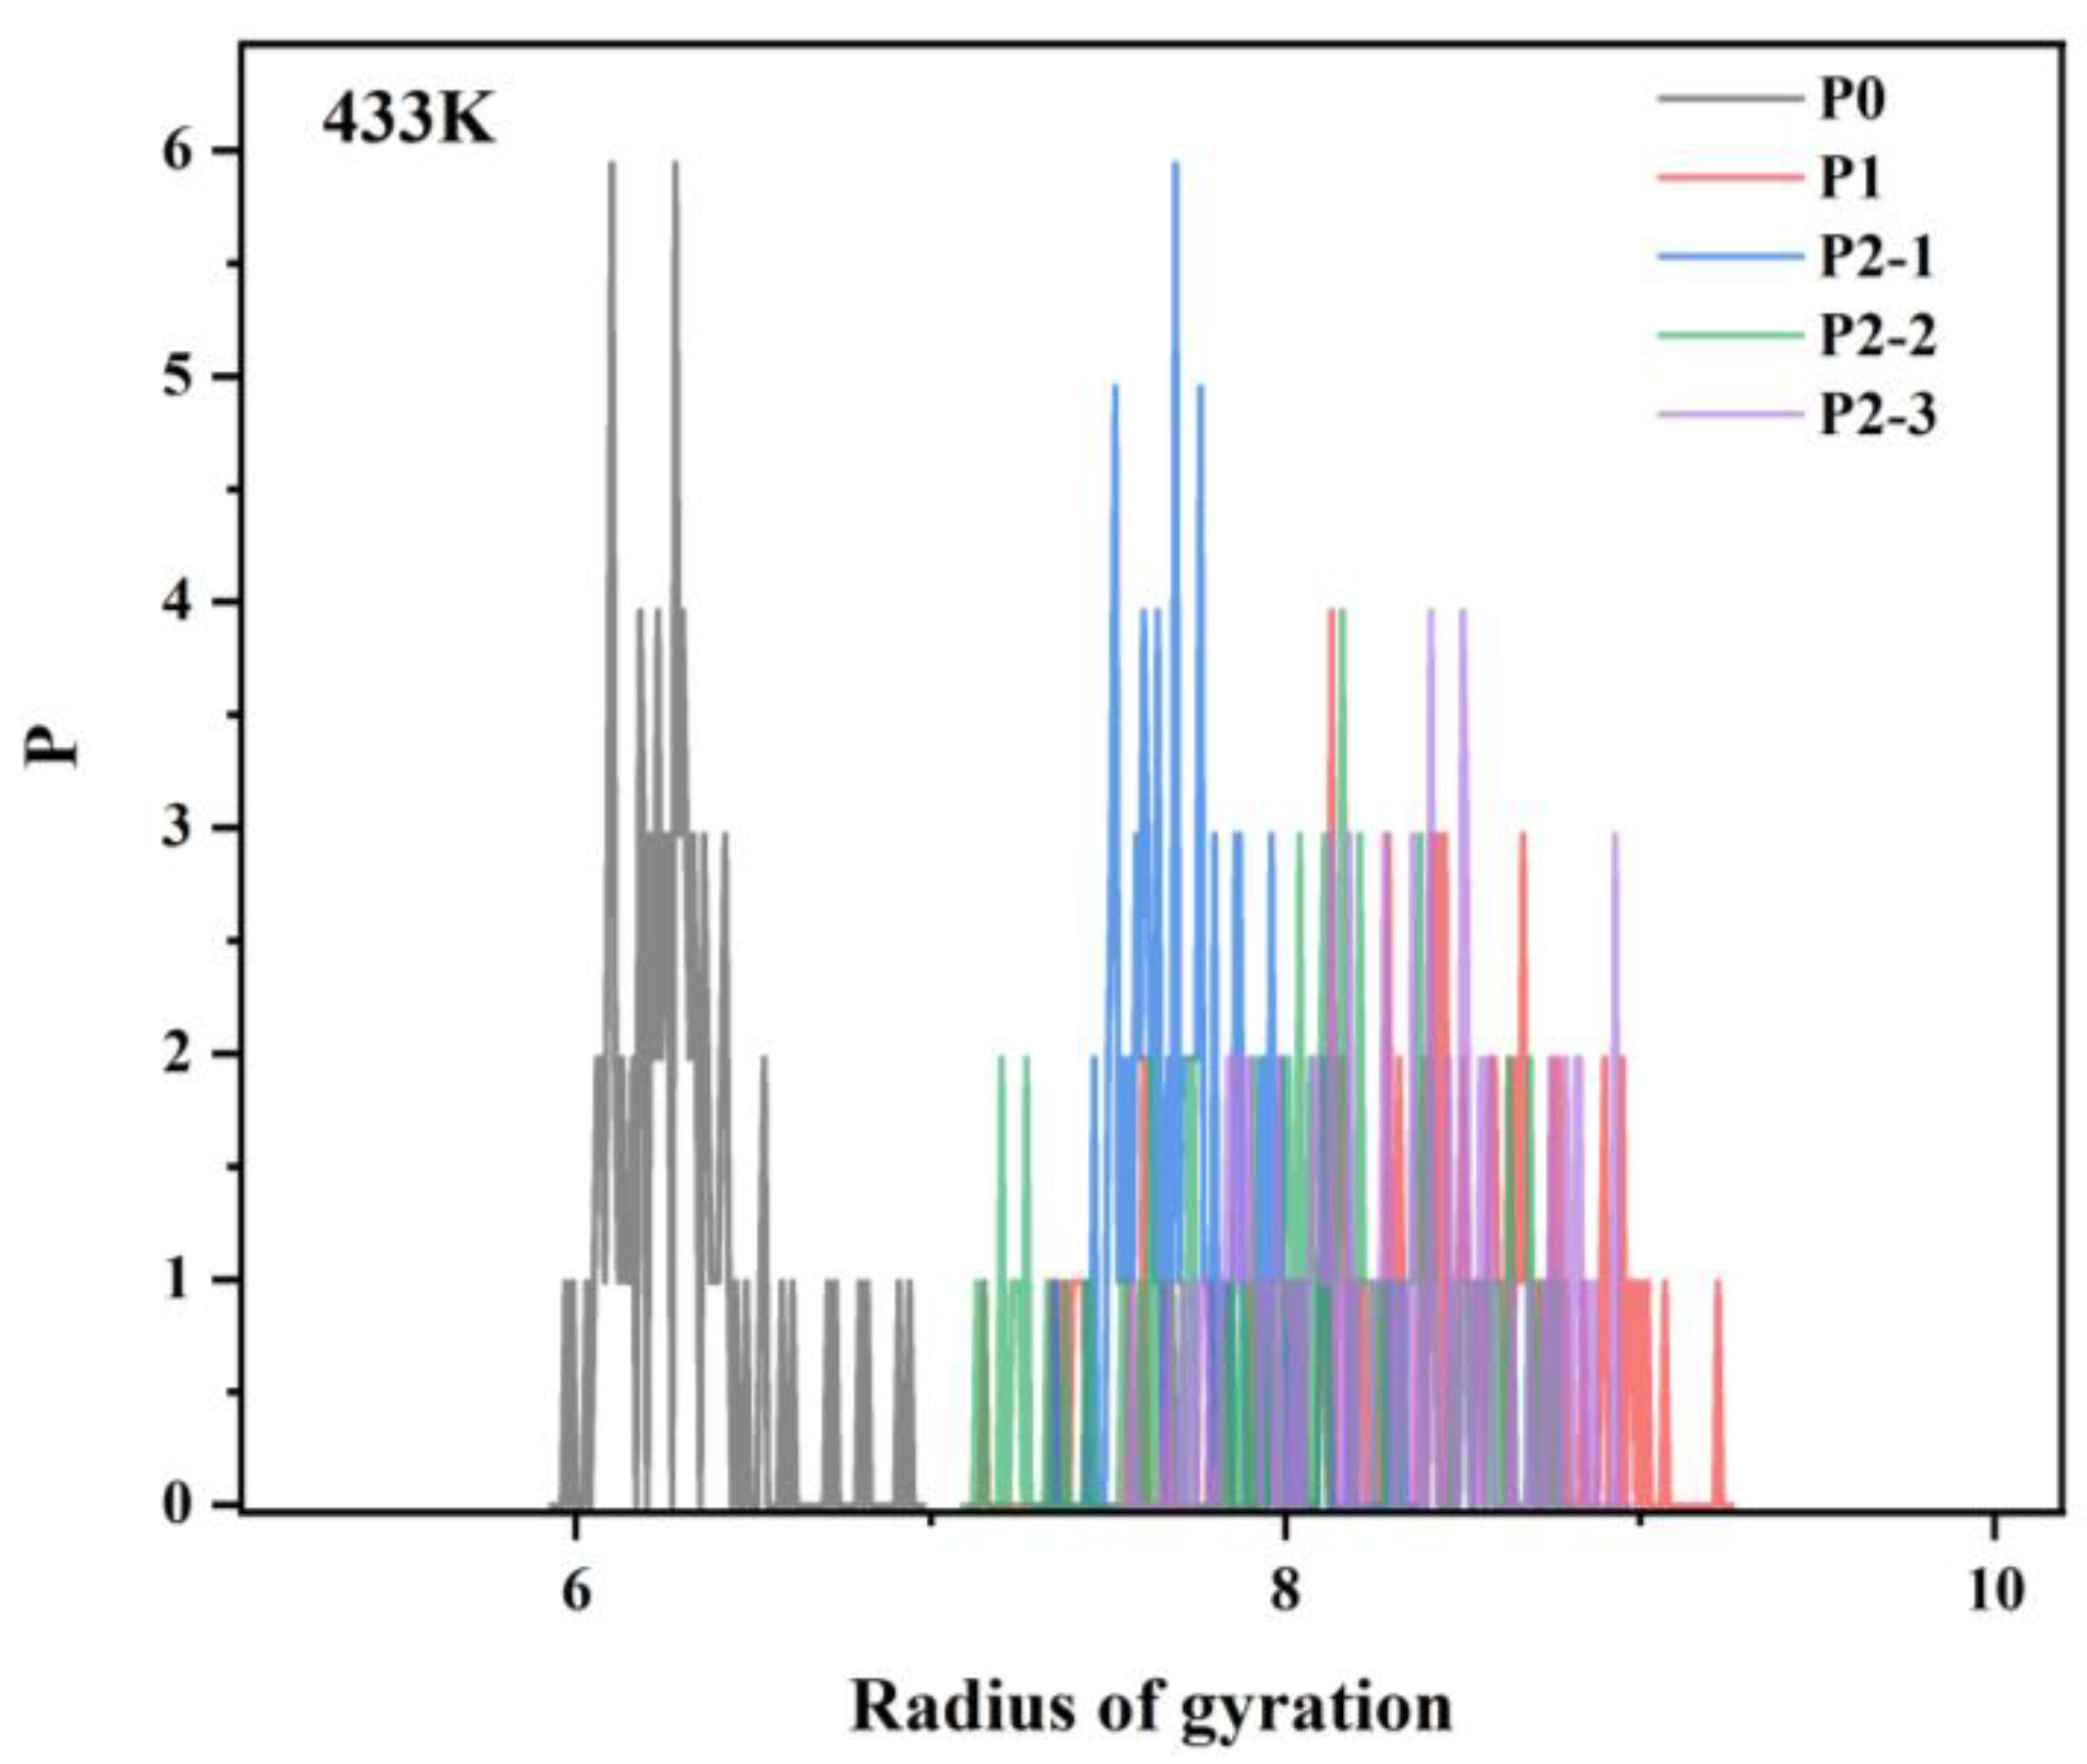
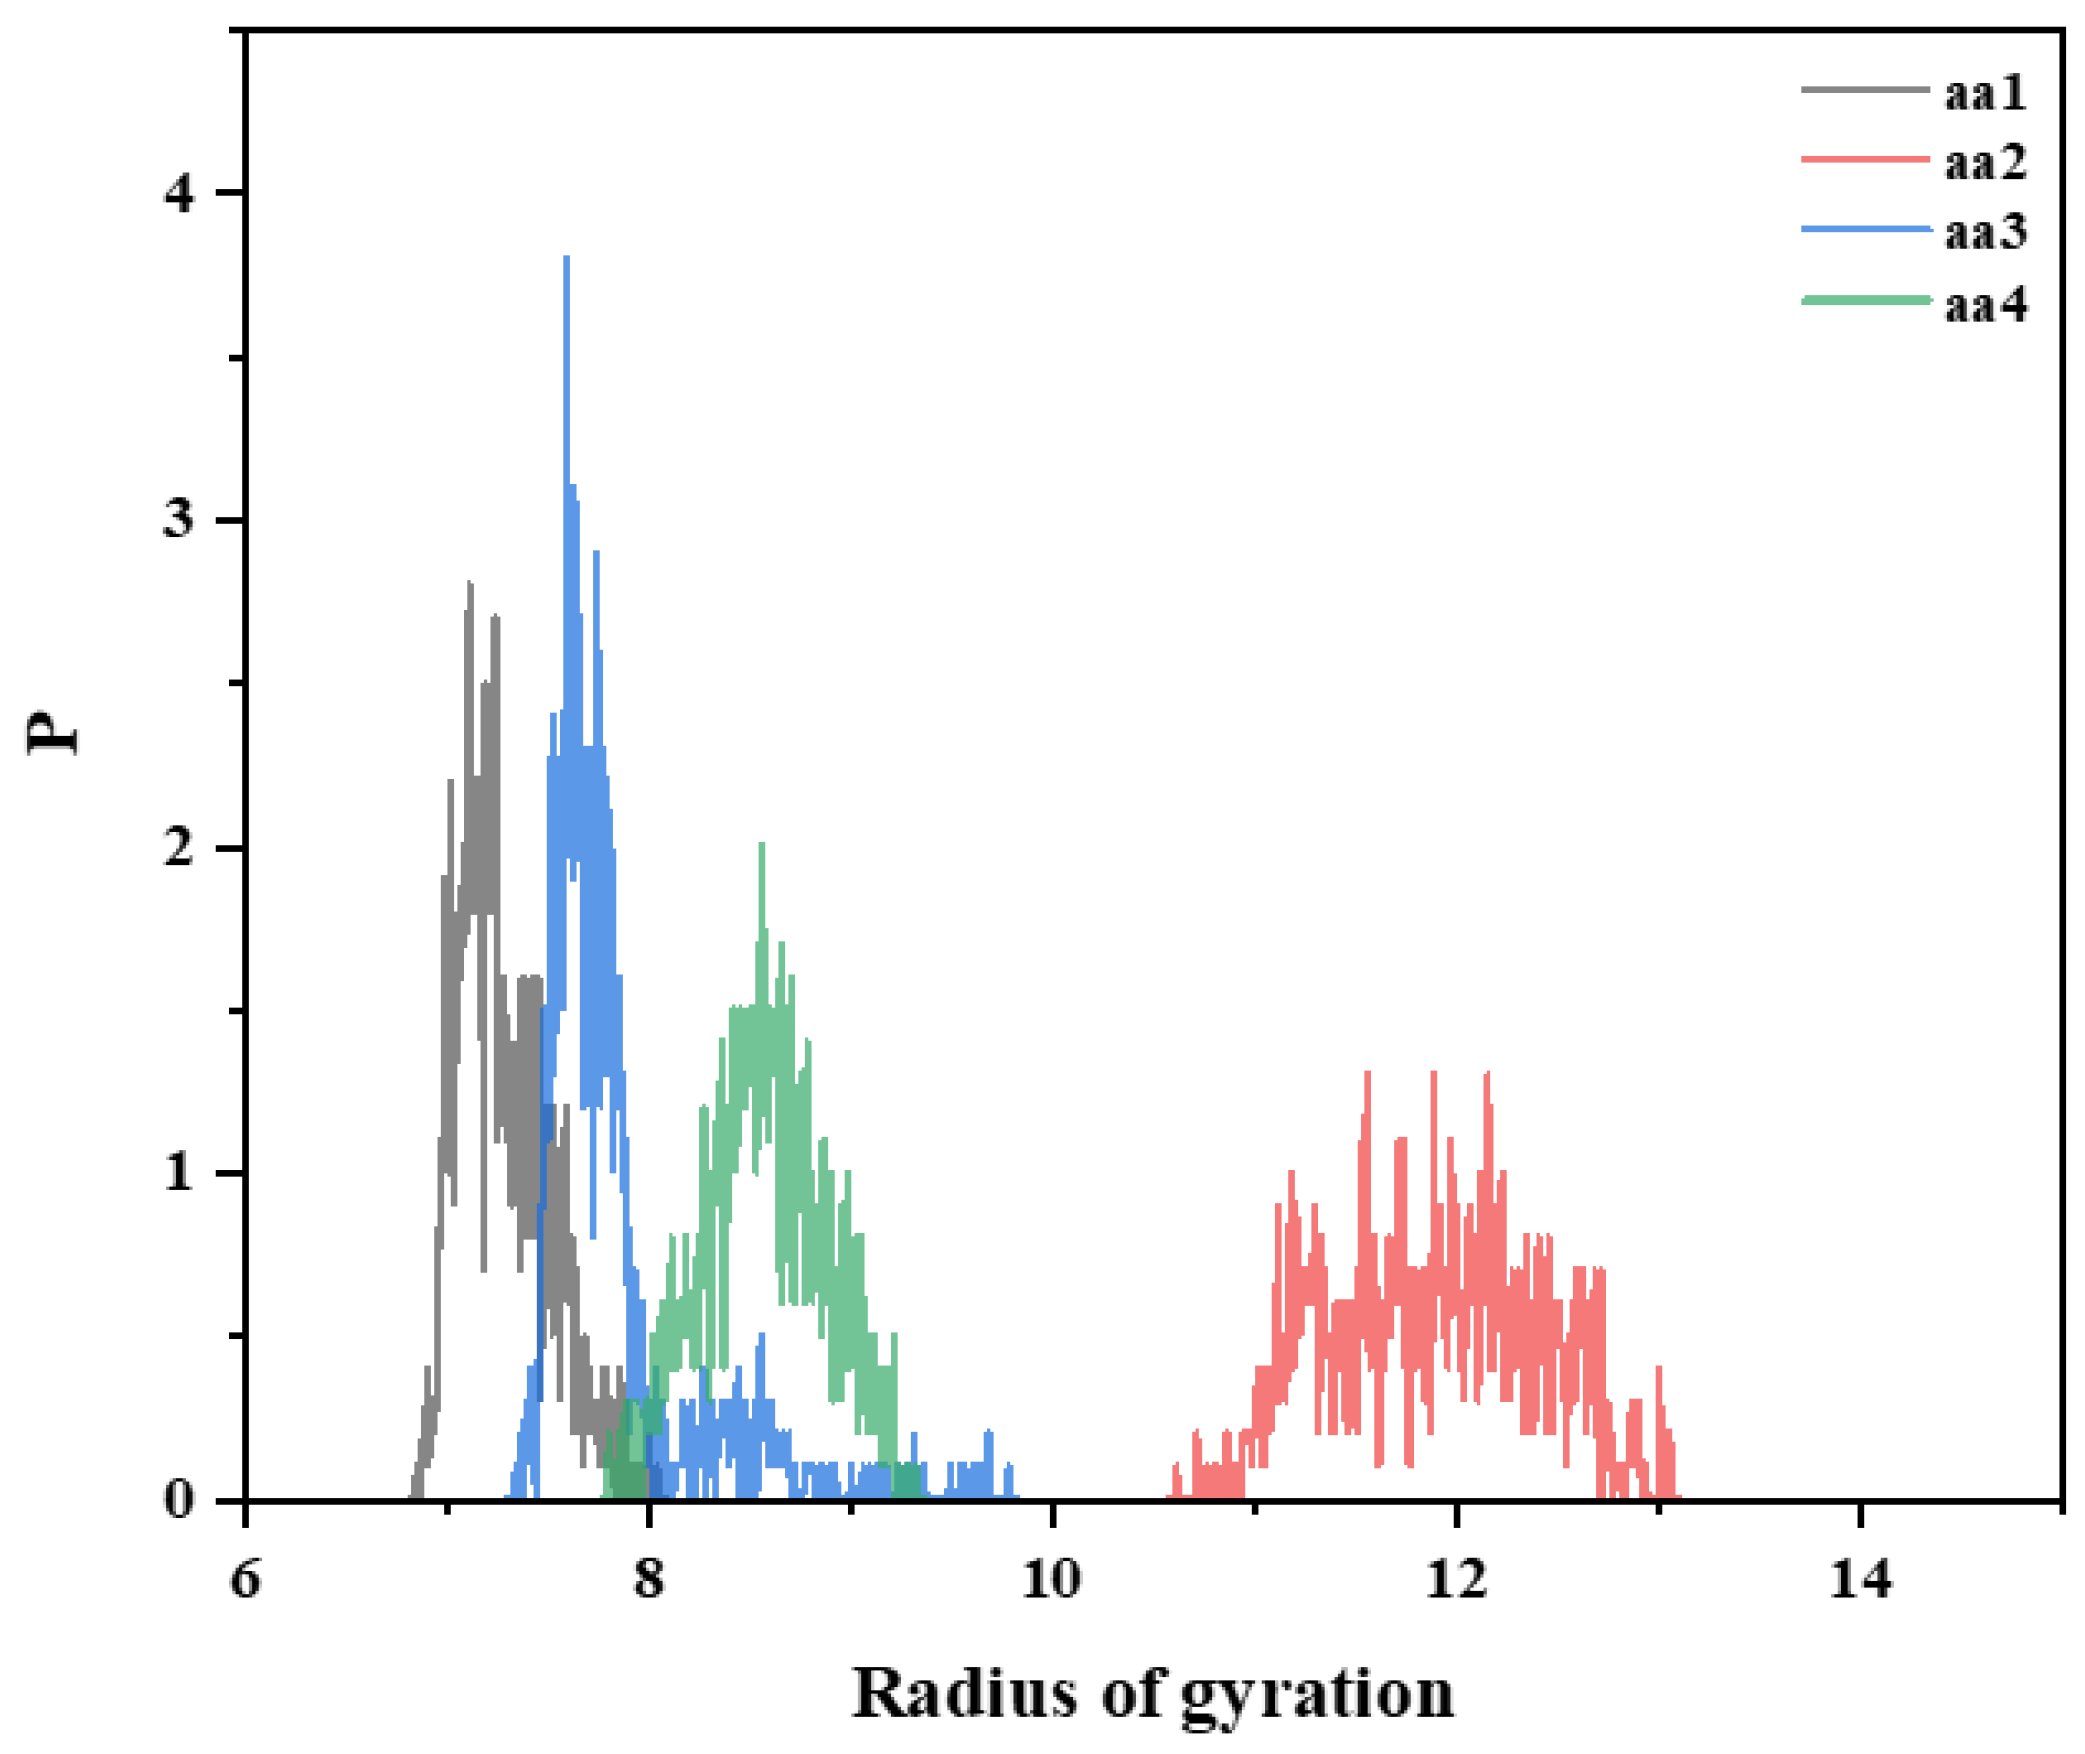
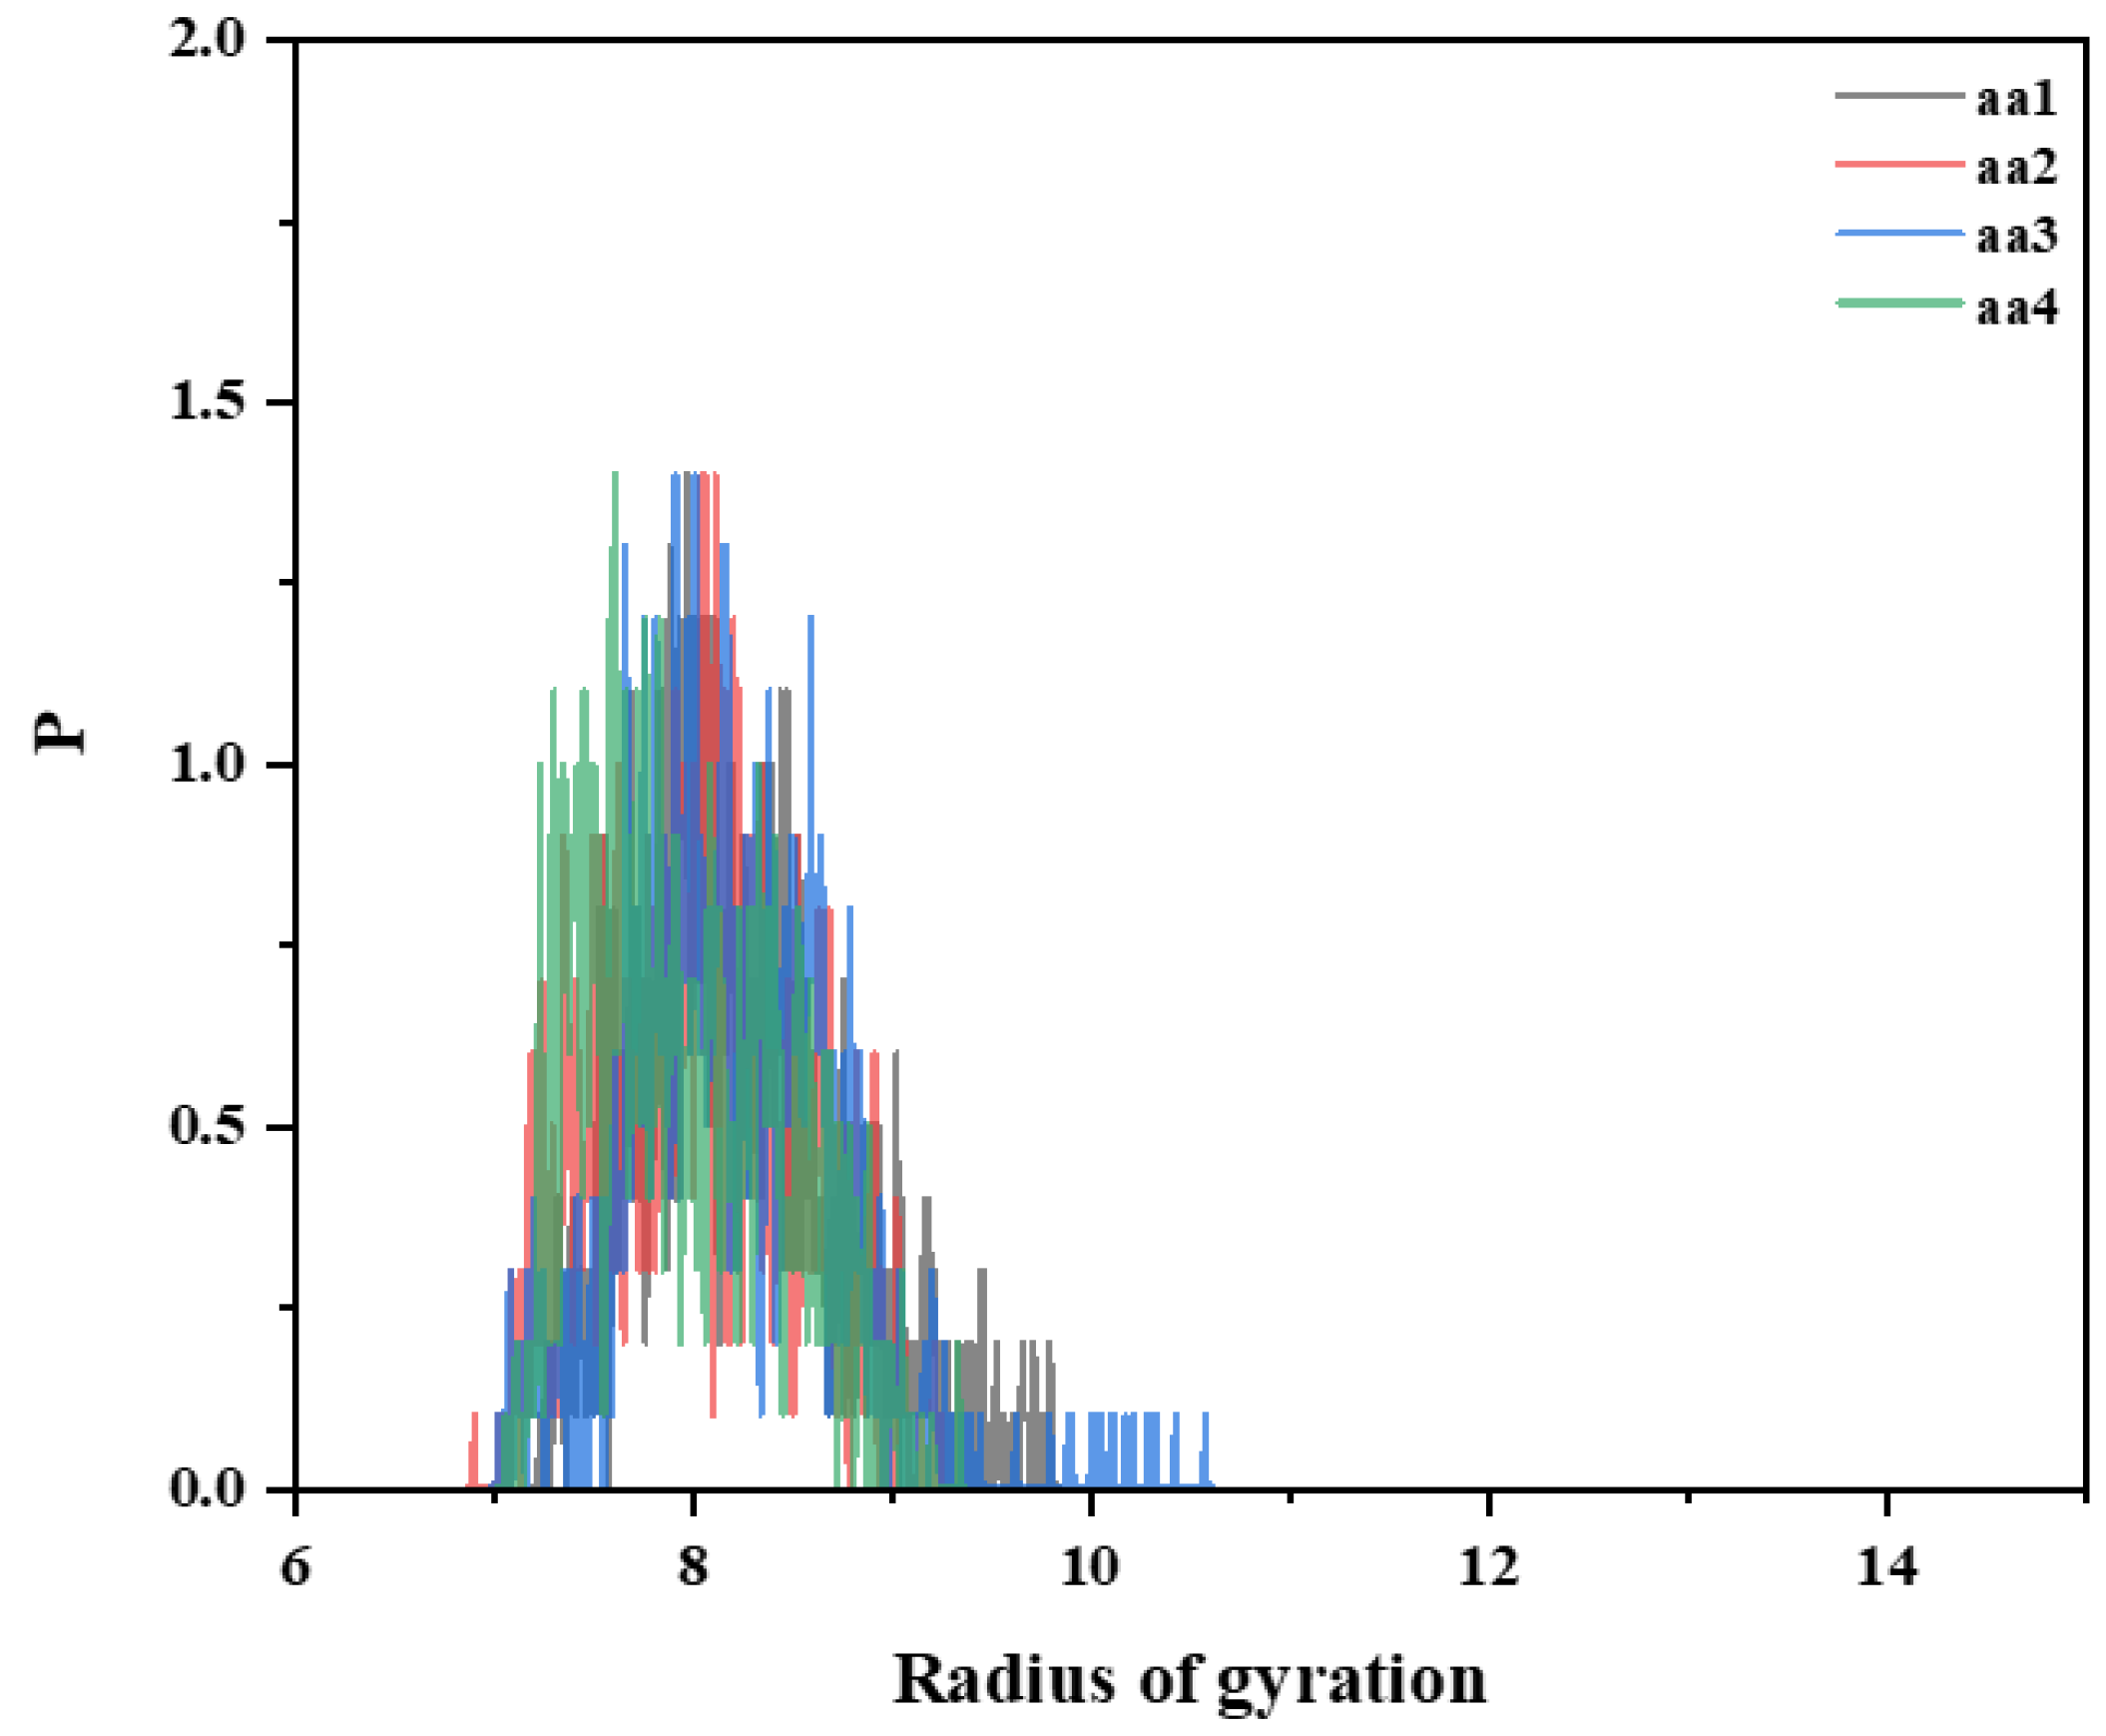
- Simulations revealed that the radius of gyration of the hydrophobically linked polymer chain segments decreases as temperature increases. This can be attributed to the increased thermal motion of the hydrophobic polymer chain segments at higher temperatures, which leads to reduced stretching and intertwining of the molecular chains. This results in greater mobility in the polymer chains, which reduces the viscosity of the solution. As a result, the viscosity of hydrophobically bound polymer solutions typically decreases at elevated temperatures.
Author Contributions
Funding
Institutional Review Board Statement
Informed Consent Statement
Data Availability Statement
Conflicts of Interest
References
- Wu, X.; Song, Z.; Zhen, J.; Wang, H.; Yao, L.; Zhao, M.; Dai, C. A smart recyclable VES fluid for high temperature and high pressure fracturing. J. Pet. Sci. Eng. 2020, 190, 107097. [Google Scholar] [CrossRef]
- Zhao, M.; Li, Y.; Xu, Z.; Wang, K.; Gao, M.; Lv, W.; Dai, C. Dynamic cross-linking mechanism of acid gel fracturing fluid. Colloids Surf. A Physicochem. Eng. Asp. 2020, 607, 125471. [Google Scholar] [CrossRef]
- Silin, M.; Magadova, L.; Malkin, D.; Krisanova, P.; Borodin, S.; Filatov, A. Applicability Assessment of Viscoelastic Surfactants and Synthetic Polymers as a Base of Hydraulic Fracturing Fluids. Energies 2022, 15, 2827. [Google Scholar] [CrossRef]
- Davoodi, S.; Al-Shargabi, M.; Wood, D.A.; Rukavishnikov, V.S. A comprehensive review of beneficial applications of viscoelastic surfactants in wellbore hydraulic fracturing fluids. Fuel 2023, 338, 127228. [Google Scholar] [CrossRef]
- Zhu, X.L.; Li, T.; Peng, X.; Yang, Z.; Wang, Q.X.; Zhang, Q.J. Study on Variability Production Characteristics of Fracturing Fluid Imbibition Displacement for Typical Shale. J. Phys. Conf. Ser. 2024, 2834, 012103. [Google Scholar] [CrossRef]
- Zuo, C.; Wu, Y.; Du, K.; Zhu, L.; Gou, Z.; Xia, Y.; Jia, Z.; Zeng, W. Preparation and laboratory study of a sodium carboxymethyl cellulose smart temperature-controlled crosslinked gel fracturing fluid system. J. Appl. Polym. Sci. 2023, 140, e54380. [Google Scholar] [CrossRef]
- Esmaeilirad, N.; Terry, C.; Carlson, K. Optimization of carboxylmethyl cellulose frac fluid in low TDS water sources based on pH and crosslinker concentrations. Fuel 2016, 185, 211–218. [Google Scholar] [CrossRef]
- Mikihito, I.; Sumihiko, M.; Kazuya, I.; Weiren, L. Stability of novel cellulose-nanofiber-containing foam as environmentally friendly fracturing fluid. J. Pet. Sci. Eng. 2022, 208, 109512. [Google Scholar]
- Al-Hajri, S.; Negash, B.M.; Rahman, M.M.; Haroun, M.; Al-Shami, T.M. Perspective Review of Polymers as Additives in Water-Based Fracturing Fluids. ACS Omega 2022, 7, 7431–7443. [Google Scholar] [CrossRef]
- Cao, X.; Shi, Y.; Li, W.; Zeng, P.; Zheng, Z.; Feng, Y.; Yin, H. Comparative Studies on Hydraulic Fracturing Fluids for High-Temperature and High-Salt Oil Reservoirs: Synthetic Polymer versus Guar Gum. ACS Omega 2021, 6, 25421–25429. [Google Scholar] [CrossRef]
- Wu, G.D.; Wang, L.K.; Zhao, C.Y.; Zhang, Z.J.; Yin, J.Y.; Anwaier, M.; Ren, H.D.; Yang, D.; Yin, S.L.; Cai, Z.L.; et al. Experimental study of reservoir damage of water-based fracturing fluids prepared by different polymers. Pet. Sci. 2024, 21, 3298–3306. [Google Scholar] [CrossRef]
- Almubarak, T.; Ng, J.H.; Nasr-El-Din, H.A.; Sokhanvrian, K.; AlKhaldi, M. Dual-Polymer Hydraulic-Fracturing Fluids: A Synergy Between Polysaccharides and Polyacrylamides. SPE J. 2019, 24, 2635–2652. [Google Scholar] [CrossRef]
- Huang, Y.P.; Hu, Y.; Liu, C.L.; Wu, Y.N.; Zou, C.W.; Zhang, L.Y.; Zhao, M.W.; Dai, C.L. Supramolecular polymer-based gel fracturing fluid with a double network applied in ultra-deep hydraulic fracturing. Pet. Sci. 2024, 21, 1875–1888. [Google Scholar] [CrossRef]
- Shi, S.; Sun, J.; Lv, K.; Wen, Q.; Bai, Y.; Wang, J.; Jin, J.; Liu, J.; Huang, X.; Li, J. Preparation and evaluation of acryloyl morpholine modified emulsion fracturing fluid thickener with high temperature resistance and salt resistance. J. Appl. Polym. Sci. 2022, 140, e53338. [Google Scholar] [CrossRef]
- Zheng, C.; Hou, Z.; Xu, K.; Weng, D.; Hou, Z.; Shi, Y.; Lai, J.; Liu, C.; Wang, T. Preparation and rheological properties of acrylamide-based penta-polymer for ultra-high temperature fracturing fluid. Colloids Surf. A Physicochem. Eng. Asp. 2023, 670, 131386. [Google Scholar] [CrossRef]
- Uranta, K.G.; Rezaei-Gomari, S.; Russell, P.; Hamad, F. Studying the Effectiveness of Polyacrylamide (PAM) Application in Hydrocarbon Reservoirs at Different Operational Conditions. Energies 2018, 11, 2201. [Google Scholar] [CrossRef]
- Mao, J.; Zhang, H.; Xue, J. Correction to: Investigation of a hydrophobically associating polymer’s temperature and salt resistance for fracturing fluid thickener. Colloid Polym. Sci. 2022, 300, 1111–1112. [Google Scholar] [CrossRef]
- Quan, Z.; Jincheng, M.; Yuemin, L.; Tao, X.; Heng, Z.; Anqi, D.; Xiaojiang, Y.; Chong, L.; Jinhua, M. Evaluation of temperature resistance of non chemical crosslinked double-tailed hydrophobically associating polymer fracturing fluid. React. Funct. Polym. 2022, 175, 105268. [Google Scholar]
- Shao, Y.; Mao, J.; Yang, B.; Zhao, J.; Yang, X. High Performance Hydrophobic Associated Polymer for Fracturing Fluids with Low-Dosage. Pet. Chem. 2020, 60, 219–225. [Google Scholar] [CrossRef]
- Dastan, S.; Hassnajili, S.; Abdollahi, E. Hydrophobically associating terpolymers of acrylamide, alkyl acrylamide, and methacrylic acid as EOR thickeners. J. Polym. Res. 2016, 23, 175. [Google Scholar] [CrossRef]
- Kusters, G.L.; Zhang, G.; Chen, Z.; Suo, Z. Amphiphilic monomers bridge hydrophobic polymers and water. Soft Matter 2023, 19, 9489–9495. [Google Scholar] [CrossRef] [PubMed]
- Yisheng, H.; Shengfeng, C. Chain conformations and phase separation in polymer solutions with varying solvent quality. J. Polym. Sci. 2021, 59, 2819–2831. [Google Scholar]
- SY/T 7627-2021; Technical Requirements for Water-Based Fracturing Fluid. Petroleum Industry Press: Beijing, China, 2021.
- Gao, Z.; Dai, C.; Sun, X.; Huang, Y.; Gao, M.; Zhao, M. Investigation of cellulose nanofiber enhanced viscoelastic fracturing fluid system: Increasing viscoelasticity and reducing filtration. Colloids Surf. A Physicochem. Eng. Asp. 2019, 582, 123938. [Google Scholar] [CrossRef]
- Li, Y.; Ren, Q. Synthesis, characterization, and solution properties of a surface-active hydrophobically associating polymer. J. Appl. Polym. Sci. 2018, 135, 46569. [Google Scholar] [CrossRef]
- Wan, T.; Zou, C.; Chen, L.; Zhou, Z.; Xu, M.; Cheng, W.; Li, R. Synthesis and Solution Properties of Hydrophobically Associative Polyacrylamides by Microemulsion Polymerization. J. Solut. Chem. 2014, 43, 1947–1962. [Google Scholar] [CrossRef]
- Yang, Q.; Song, C.; Chen, Q.; Zhang, P.; Wang, P. Synthesis and aqueous solution properties of hydrophobically modified anionic acrylamide copolymers. J. Polym. Sci. Part B Polym. Phys. 2008, 46, 2465–2474. [Google Scholar] [CrossRef]
- Yang, H.; Pan, S.; Jiang, H.; Zhang, J.; Li, H.; Xing, L.; Zhang, Y.; Sarsenbekuly, B.; Kang, W.; Zhang, X.; et al. Study of a high salt tolerant amphiphilic polymer and its salt thickening mechanism. J. Mol. Liq. 2024, 400, 124552. [Google Scholar] [CrossRef]
- Peng, Z.; Li, Y.; He, X.; Feng, Q.; Zheng, Y. Synthesis and performance study of amphoteric polymer suspension stabilizer for cementing slurry at ultra-high temperature. Colloids Surf. A Physicochem. Eng. Asp. 2024, 703, 135366. [Google Scholar] [CrossRef]
- Kang, W.; Cao, C.; Guo, S.; Tang, X.; Lashari, Z.A.; Gao, Y.; Zhang, X.; Iqbal, M.W.; Yang, H. Mechanism of silica nanoparticles’ better-thickening effect on amphiphilic polymers in high salinity condition. J. Mol. Liq. 2018, 277, 254–260. [Google Scholar] [CrossRef]
- Shi, J.; Wu, Z.; Deng, Q.; Liu, L.; Zhang, X.; Wu, X.; Wang, Y. Synthesis of hydrophobically associating polymer: Temperature resistance and salt tolerance properties. Polym. Bull. 2021, 79, 4581–4591. [Google Scholar] [CrossRef]
- Zhou, C.; Chen, Y.; Xiao, Y.; Wu, Y.; Yang, C.; Yu, M.; Liu, L. Preparation and performance analysis of nano-crosslinking agent for sulphonated guar gum fracturing fluid. Can. J. Chem. Eng. 2024, 103, 953–963. [Google Scholar] [CrossRef]
- Ma, X.; Mu, H.; Hu, Y.; Yang, S. Synthesis and properties of hydrophobically associating polymer fracturing fluid. Colloids Surf. A Physicochem. Eng. Asp. 2021, 626, 127013. [Google Scholar] [CrossRef]
- Zhang, Q.; Mao, J.; Liao, Y.; Mao, J.; Yang, X.; Lin, C.; Wang, Q.; Huang, Z.; Xu, T.; Liu, B.; et al. Salt resistance study and molecular dynamics simulation of hydrophobic-association polymer with internal salt structure. J. Mol. Liq. 2022, 367, 120520. [Google Scholar] [CrossRef]


| Samples | Mw |
|---|---|
| MAC | 1,190,046 |
| Concentration (%) | Particle Size (nm) |
|---|---|
| 0.2 | 2871 |
| 0.4 | 5811 |
| 0.6 | 7475 |
| MAC | Characteristic |
|---|---|
| Solubility | Readily soluble |
| Solvent | Fresh water (water with low salt content) |
| Molecular mass | 105~106 |
| Temperature resistance (°C) | ≥200 |
| Apparent viscosity of 1% polymer solution | 133.11 mPa·s |
| Experimental Group | Viscosity Value at the End of Specimen Preparation η1/mPa·s | Viscosity Value of the Specimen When Resting for 4 h η2/mPa·s |
|---|---|---|
| 1 | 128.74 | 132.61 |
| 2 | 127.84 | 131.72 |
| 3 | 131.12 | 134.99 |
| average value | 129.23 | 133.11 |
| Time/s | Cumulative Leachate Loss from Filtrate/mL |
|---|---|
| 1 | 3.20 |
| 2 | 4.10 |
| 4 | 6.30 |
| 9 | 10.10 |
| 16 | 13.90 |
| 25 | 18.00 |
| 36 | 22.00 |
| Experimental Temperature (°C) | PADM Residue Content (mg/L) |
|---|---|
| 90 | 28.10 |
Disclaimer/Publisher’s Note: The statements, opinions and data contained in all publications are solely those of the individual author(s) and contributor(s) and not of MDPI and/or the editor(s). MDPI and/or the editor(s) disclaim responsibility for any injury to people or property resulting from any ideas, methods, instructions or products referred to in the content. |
© 2025 by the authors. Licensee MDPI, Basel, Switzerland. This article is an open access article distributed under the terms and conditions of the Creative Commons Attribution (CC BY) license (https://creativecommons.org/licenses/by/4.0/).
Share and Cite
Zhang, B.; Guo, B.; Wu, G.; Li, S.; Shen, J.; Xing, S.; Ying, Y.; Yang, X.; Zhang, X.; Hu, M.; et al. Preparation of Temperature Resistant Terpolymer Fracturing Fluid Thickener and Its Working Mechanism Study via Simulation Methods. Materials 2025, 18, 1171. https://doi.org/10.3390/ma18051171
Zhang B, Guo B, Wu G, Li S, Shen J, Xing S, Ying Y, Yang X, Zhang X, Hu M, et al. Preparation of Temperature Resistant Terpolymer Fracturing Fluid Thickener and Its Working Mechanism Study via Simulation Methods. Materials. 2025; 18(5):1171. https://doi.org/10.3390/ma18051171
Chicago/Turabian StyleZhang, Bo, Bumin Guo, Guang’ai Wu, Shuan Li, Jinwei Shen, Susu Xing, Yujie Ying, Xiaoling Yang, Xinyang Zhang, Miaomiao Hu, and et al. 2025. "Preparation of Temperature Resistant Terpolymer Fracturing Fluid Thickener and Its Working Mechanism Study via Simulation Methods" Materials 18, no. 5: 1171. https://doi.org/10.3390/ma18051171
APA StyleZhang, B., Guo, B., Wu, G., Li, S., Shen, J., Xing, S., Ying, Y., Yang, X., Zhang, X., Hu, M., & Guo, J. (2025). Preparation of Temperature Resistant Terpolymer Fracturing Fluid Thickener and Its Working Mechanism Study via Simulation Methods. Materials, 18(5), 1171. https://doi.org/10.3390/ma18051171