Article

High-Level Lanthanide-Doped Upconversion Nanoparticles-Based Aptasensor to Increase Carcinoembryonic Antigen Detection Sensitivity

1
Key Laboratory of Automobile Materials of Ministry of Education, Department of Materials Science and Engineering, Jilin University, Changchun 130022, China
2
Department of Mechanical Engineering, McGill University, Montreal, QC H3A 0C3, Canada
3
State Key Laboratory on Integrated Optoelectronics College of Electronic Science and Engineering, Jilin University, Changchun 130012, China
4
The 49th Research Institute of China Electronics Technology Group Corporation, Harbin 150028, China
5
School of Materials Science and Engineering, Changchun University of Science and Technology, Changchun 130022, China
*
Author to whom correspondence should be addressed.
Materials 2025, 18(4), 796; https://doi.org/10.3390/ma18040796
Submission received: 29 November 2024 / Revised: 31 January 2025 / Accepted: 3 February 2025 / Published: 11 February 2025

Abstract

Boosting the accuracy and speed of cancer detection is highly desirous in tumor detection, and sensors capable of detecting carcinoembryonic antigen (CEA) have great application prospects in this field. A highly sensitive sensor is constructed based on the fluorescence resonance energy transfer (FRET) with heavily rare-earth-doped upconversion nanoparticles (UCNPs) as energy donors and polydopamine nanoparticles (PDA NPs) as energy acceptors. This sensor detects the fluctuations in CEA molecules via luminescence quenching and recovery resulting from a competitive binding assay between CEA and PDA NPs. The high-level-doped design of UCNPs (i.e., NaYF4@NaYbF4:1%Tm@NaYF4) is beneficial, providing upconversion luminescence intensity that is more than 10 times higher than that of the conventional low-level-doped UCNPs (i.e., NaYF4@NaYF4:20%Yb, 0.2%Tm@NaYF4). The sensor exhibits impressive sensitivity. Specifically, in diluted fetal bovine serum, the detection limit reaches 0.013 ng/mL in the range of 0–1.5 ng/mL (S/N = 3), while the detection limit is 1.38 ng/mL in the range of 1.5–250 ng/mL (S/N = 3). This method has great potential for future applications in the rapid and early diagnosis and treatment of cancer.

Graphical Abstract

1. Introduction

As a broad-spectrum tumor marker, carcinoembryonic antigen (CEA) can assist in the diagnosis of many types of cancers [1]. Fluctuations in the level of CEA reflect tumor activity and therapeutic efficacy during cancer treatment; therefore, the accurate detection of CEA levels is critical for oncological treatments at present. To date, numerous methods have been exploited for detecting CEA, for instance, the radioimmunoassay (RIA) [2,3], enzyme-linked immunosorbent assay (ELISA) [4,5], chemiluminescent immunoassay (CLIA) [6,7], and electrochemiluminescence immunoassay (ECLIA) [8,9]. Although satisfactory CEA detection results have been achieved to a certain extent, new strategies are still needed to further improve the sensitivity of CEA detection and achieve better results in this field. Among the diverse upgrading strategies, aptamer sensors constructed based on the fluorescence resonance energy transfer (FRET) [10,11] mechanism have high sensitivity [1,12], low toxicity [13], and good operability [14,15], which can further contribute to the improvement in the sensitivity of CEA detection.
In the many aptamer sensors based on the FRET mechanism, upconversion nanoparticles (UCNPs)–polydopamine nanoparticles (PDA NPs) biosensors have tremendous potential. UCNPs have unique luminescent properties that enable the conversion of low-energy near-infrared (NIR) light into high-energy visible light [16]. As a result of NIR excitation, the use of UCNPs as energy donors [17] in the FRET mechanism minimizes the interference from the autofluorescence of biomolecules and scattered light [18]. Notably, with careful design, nanoscale upconversion materials can achieve a higher quantum yield and luminescence efficiency relative to micrometer materials [19]. Nano-sized materials can be designed as a core–multishell structure, which enables the resistance of a negative-concentration quenching effect or allows tunable excitation to be achieved. All these characteristics are difficult to realize in bulk materials. Furthermore, UCNPs have superb biocompatibility [20,21], low toxicity [22], and resistance to photobleaching [23]. Another component of the FRET mechanism is based on the fact that PDA NPs, when used as energy acceptors, have a broad absorption spectrum [24], covering almost the entire ultraviolet–visible (UV–vis) and NIR regions, which makes them efficient fluorescent quenching agents. Moreover, PDA NPs have good biocompatibility [25], stability [26], and low toxicity [27]. Aptasensors based on a combination of UCNPs-PDA NPs effectively combine the advantages of both, featuring unique optical properties, high sensitivity, excellent biocompatibility, low toxicity, and stability.
Currently, a slew of aptasensors based on the combination of UCNPs-PDA NPs have been reported [28,29]. Nevertheless, there is still room for further improvement. One of the most effective focus points is the optimization of the donor structure of UCNPs. Conventional UCNPs are constructed based on a low-doping strategy; specifically, the optimal concentrations of both sensitizing ions and luminescent centers are limited to low levels (typically, Yb, 20–30%; Er, Tm, Ho less than 2% [30]). Continuing to increase the doping concentration is thought to cause the so-called “concentration quenching effect”, which in turn decreases the luminescence efficiency of the material. In the recent past, remarkable progress has been made in the construction of high-level rare-earth-doped upconversion systems, with the involvement of highly doped Er3+ core–shell structure material systems [31,32] and high-level Yb3+ doping systems [33,34]. These studies have considerably increased the optimal doping concentration of activators or sensitizers through various means (e.g., high excitation irradiance [35], dye sensitization [36], and inert-shell passivation [32,37]) and consequently enhanced the upconversion luminescence intensity by 1–3 orders of magnitude. In spite of this, pertinent research results have not been promptly applied to the detection of tumor markers, as represented by CEA. Currently, the vast majority of FRET-based assay systems are constructed using conventional low-doped UCNPs [29,38]. It is obvious that the introduction of a highly doped system into the relevant assay would reliably enhance the detection sensitivity of the sensor under the same instrumental testing conditions by improving the luminescence properties (high brightness) of the donor material, and, thus, this would be a scientific issue well worth investigating.
Herein, we constructed a PDA sensor based on a highly Yb3+-doped core–shell–shell nanostructures as energy donors for the detection of CEA (Figure 1). The synthesized UCNPs were confirmed to have excellent monodispersity and homogeneous dimensions by SEM, TEM, as well as element mapping. FTIR and UV–vis spectroscopy authenticated each other, confirming that the CEA aptamer was modified on the surface of the UCNPs. When PDA NPs were added to the UCNPs-CEA aptamer system, the CEA aptamer bound to PDA NPs to achieve the FRET process, and the fluorescence of the donors was quenched. Subsequently, CEA was added to the system, and specific binding between the CEA aptamer and CEA led to energy donor–acceptor separation, blocking the energy transfer process, and the donor fluorescence was restored. The relationship between the degree of fluorescence signal recovery of the system and the concentration of CEA was used to achieve the quantitative detection of CEA.

2. Materials and Methods

2.1. Materials and Apparatus

The materials used in this research were RECl3·6H2O (Re: Y > 99%), oleic acid (OA, 90%), and 1-octadecene (ODE, 90%), purchased from Sigma-Aldrich (St. Louis, MO, USA). Sodium trifluoroacetate CF3COONa (90%) was purchased from Macklin (Shanghai, China). RE2O3 (Re: Y, Yb, Tm > 99%), trifluoroacetic acid (99%), sodium hydroxide (NaOH, 99.9%), 2-morpholinoethanesulphonic acid (MES), 1-(3-dimethylaminopropyl)-3-ethylcarbodiimide (EDC), N-hydroxysulfosuccinimide sodium salt (Sulfo-NHS), 2-[4-(2-hydroxyethyl)piperazin-1-yl]ethanesulfonic acid (HEPES), poly(acrylic acid) (PAA), tris-hydrochloride buffer (PH 8.5), 4-(2-Amlnoethyl)benzene-1,2-diol (Dopamine, DA) (98%), acetone, glycine (Gly), L-ascorbic acid (L-AscH2), L-cysteine (L-Cys), glucose (GLU), bovine serum albumin (BSA), and sodium chloride (NaCl), were purchased from Aladdin (Shanghai, China). Ammonium fluoride (NH4F) was purchased from XILONG SCIENTIFIC (Shantou, China). Methanol, ethanol, and cyclohexane were purchased from Sinopharm (Shanghai, China). CEA and CEA aptamer were purchased from Sangon Biotech (Shanghai, China). The fetal bovine serum was purchased from Clark Bioscience (Richmond, VA, USA). All chemicals were used as received without further purification.
TEM, HRTEM images, and element mapping were performed with a Tecnai G2 F20S-TWIN D573 electron microscope (FEI Company, Hillsboro, OR, USA) at 300 kV. The X-ray diffraction (XRD) results were obtained with a Bruker D8-advance X-ray powder diffractometer with Cu Kα radiation (λ: 1.542 Å) (Billerica, MA, USA). The steady-state upconversion photoluminescence (UC PL) spectra were measured by a Zolix DCS300PA Data Acquisition System (Beijing, China). Fourier-transform infrared (FTIR) spectroscopy was performed with a Bruker ALPHA II spectrometer (Billerica, MA, USA). Ultraviolet–visible (UV–vis) absorption spectra were recorded on a Puxi T6 UV–vis spectroscopy spectrophotometer (Beijing, China).

2.2. Synthesis Procedures

(1)
Preparation of bare core UCNPs
A solvothermal method [39] was used to synthesize the 20 nm bare core of β-NaYF4. Typically, 6 mL of oleic acid (OA), 15 mL of 1-octadecene (ODE), and 1 mmol YCl3·6H2O were added simultaneously to a 100 mL three-necked flask and stirred at 160 °C for 20 min under an argon atmosphere until all the solids dissolved. The solution was then cooled down to room temperature, and 10 mL of methanol solution containing NaOH (2.5 mmol) and NH4F (4 mmol) was added and then stirred at 80 °C for 30 min. Subsequently, the solution temperature was raised to 300°C for 90 min under an argon atmosphere. The product was washed with ethanol and centrifuged twice. Finally, the obtained bare core nanoparticles were dispersed in cyclohexane.
(2)
Preparation of core–shell-structured UCNPs
Shell precursors were prepared before encapsulating the core with the shell. Y2O3 (1 mmol) was mixed with 20 mL of aqueous trifluoroacetic acid (50%) and refluxed at 110 °C until it became transparent. The yttrium trifluoroacetate precursor [(CF3COO)3Y] was obtained. The (CF3COO)3RE precursor can be obtained using the same method. Next, 1 mmol NaYF4:20%Yb, 0.2%Tm active shell was prepared as an example. Then, 1 mmol precursor CF3COONa, 0.798 mmol yttrium trifluoroacetate precursor [(CF3COO)3Y], 0.2 mmol ytterbium trifluoroacetate precursor [(CF3COO)3Yb], and 0.002 mmol thulium trifluoroacetate precursor [(CF3COO)3Tm] were added simultaneously to a 100 mL three-necked flask with 6 mL of OA and 15 mL of ODE and dissolved at 120 °C in an argon atmosphere to obtain the NaYF4:20%Yb, 0.2%Tm active shell precursor. Then, 0.25 mmol of NaYF4 bare cores as seeds, along with 6 mL OA and 15 mL ODE, were added into a 50 mL three-necked flask, and stirred at 300°C for 5 min in an argon atmosphere. We injected 0.6 mmol NaYF4:20%Yb, 0.2%Tm shell precursor three times at a uniform rate into this 50 mL three-necked flask with 15 min intervals between the first two times and 45 min for the last reaction. The solution was cooled down to room temperature, washed with ethanol, and centrifuged twice. Finally, the produced core–shell NaYF4@NaYF4:20%Yb, 0.2%Tm nanoparticles were dispersed in cyclohexane. For the encapsulation of the other shell layers, we followed the above experimental procedure.
(3)
Preparation of PDA NPs
A total of 12 mg of DA was weighed, dissolved in 25 mL of Tris-HCl buffer (pH 8.5), stirred at room temperature for 72 h, and protected from light until it turned black. At the end of the reaction, 25 mL of acetone was added to achieve sedimentation, then centrifuged at 12,000 r/min for 15 min. The precipitate was dispersed in 6 mL of pure water at a concentration of 2 mg/mL, then stored at 4°C.
(4)
Coupling of UCNPs with CEA aptamer
Firstly, PAA was used to modify the UCNPs. We added 60 mg of UCNPs to 20 mL of water containing 200 mg of PAA and stirred overnight. Then, the mixture was centrifuged at 12,000 r/min for 15 min and washed twice to obtain PAA-modified UCNPs (i.e., PAA-UCNPs). These PAA-UCNPs were dispersed in purified water and stored at 4°C. Next, the coupling of PAA-UCNPs and CEA aptamer was carried out using a cross-linking reaction between the amino and carboxyl groups. We added 5 mg (154 μL) of PAA-UCNPs to 3.5 mL of MES buffer (10 mmol/L, pH 5.5, the same later), followed by adding 500 μL of 5 mg/mL EDC, and finally 500 μL of 10 mg/mL Sulfo-NHS. The resulting mixture was stirred for 45 min and then centrifuged at 12,000 r/min for 15 min. The precipitate obtained was dispersed in 5 mL of MES buffer. Subsequently, 250 μL of 20 nmol/mL CEA aptamer solution was added to the mixed solution obtained above, and the reaction was continued overnight on an agitator. On the following day, the reaction solution was centrifuged at 12,000 r/min for 15 min and washed twice with HEPES buffer (10 mmol/L, pH 7.4), and the precipitate was dispersed in 2 mL of HEPES buffer (10 mmol/L, pH 7.4, 50 mmol/L NaCl) to a concentration of 2.5 mg/mL and stored at 4 °C.
(5)
Fluorescence quenching experiment
We added 20 μL of 2.5 mg/mL UCNPs-CEA aptamer (NaYF4@NaYbF4:1%Tm@NaYF4) and different volumes (10, 20, 30, 40, 50, 60, 70, 80, 90, and 100 μL) of 2 mg/mL PDA NP solution to a cuvette, and then the volume was adjusted to 400 μL with 10 mmol/L HEPES buffer (pH 7.4) and incubated at 37 °C for 30 min. The upconverted fluorescence intensity of each sample was measured at the selected PDA NP concentration (0.35 mg/mL) for different reaction durations of 0, 3, 5, 10, 15, 20, 25, 30, 35, 40, 45, and 50 min.
(6)
Determination of CEA in buffer solution/diluted fetal bovine serum
To determine CEA in HEPES buffer solution, 50 μL of 2.5 mg/mL UCNPs-CEA aptamer and different concentrations of CEA were added to a cuvette. The mixture was fixed to 825 μL and incubated at 37 °C for 1 h. Then, 175 μL of 2 mg/mL PDA NP was added. The mixture was fixed to 1000 μL and incubated for an additional 40 min. Then, the upconverted fluorescence intensity was measured for each sample solution. In order to investigate the selectivity of the UCNPs-CEA aptamer-PDA NPs sensor to CEA, a series of proteins, sugars, and other interfering substances were selected as replacements for the CEA under the same experimental conditions, and then the upconversion fluorescence was recorded at an 980 nm excitation wavelength. The method for detecting CEA in fetal bovine serum was the same as above, only the HEPES solution was replaced with 50-times-diluted fetal bovine serum. The main chemicals, precursors, and their corresponding concentrations in the above experimental parts are summarized in Table S1 of the Supplementary Materials. All abbreviations are listed in Table S2 of the Supplementary Materials.

3. Results and Discussion

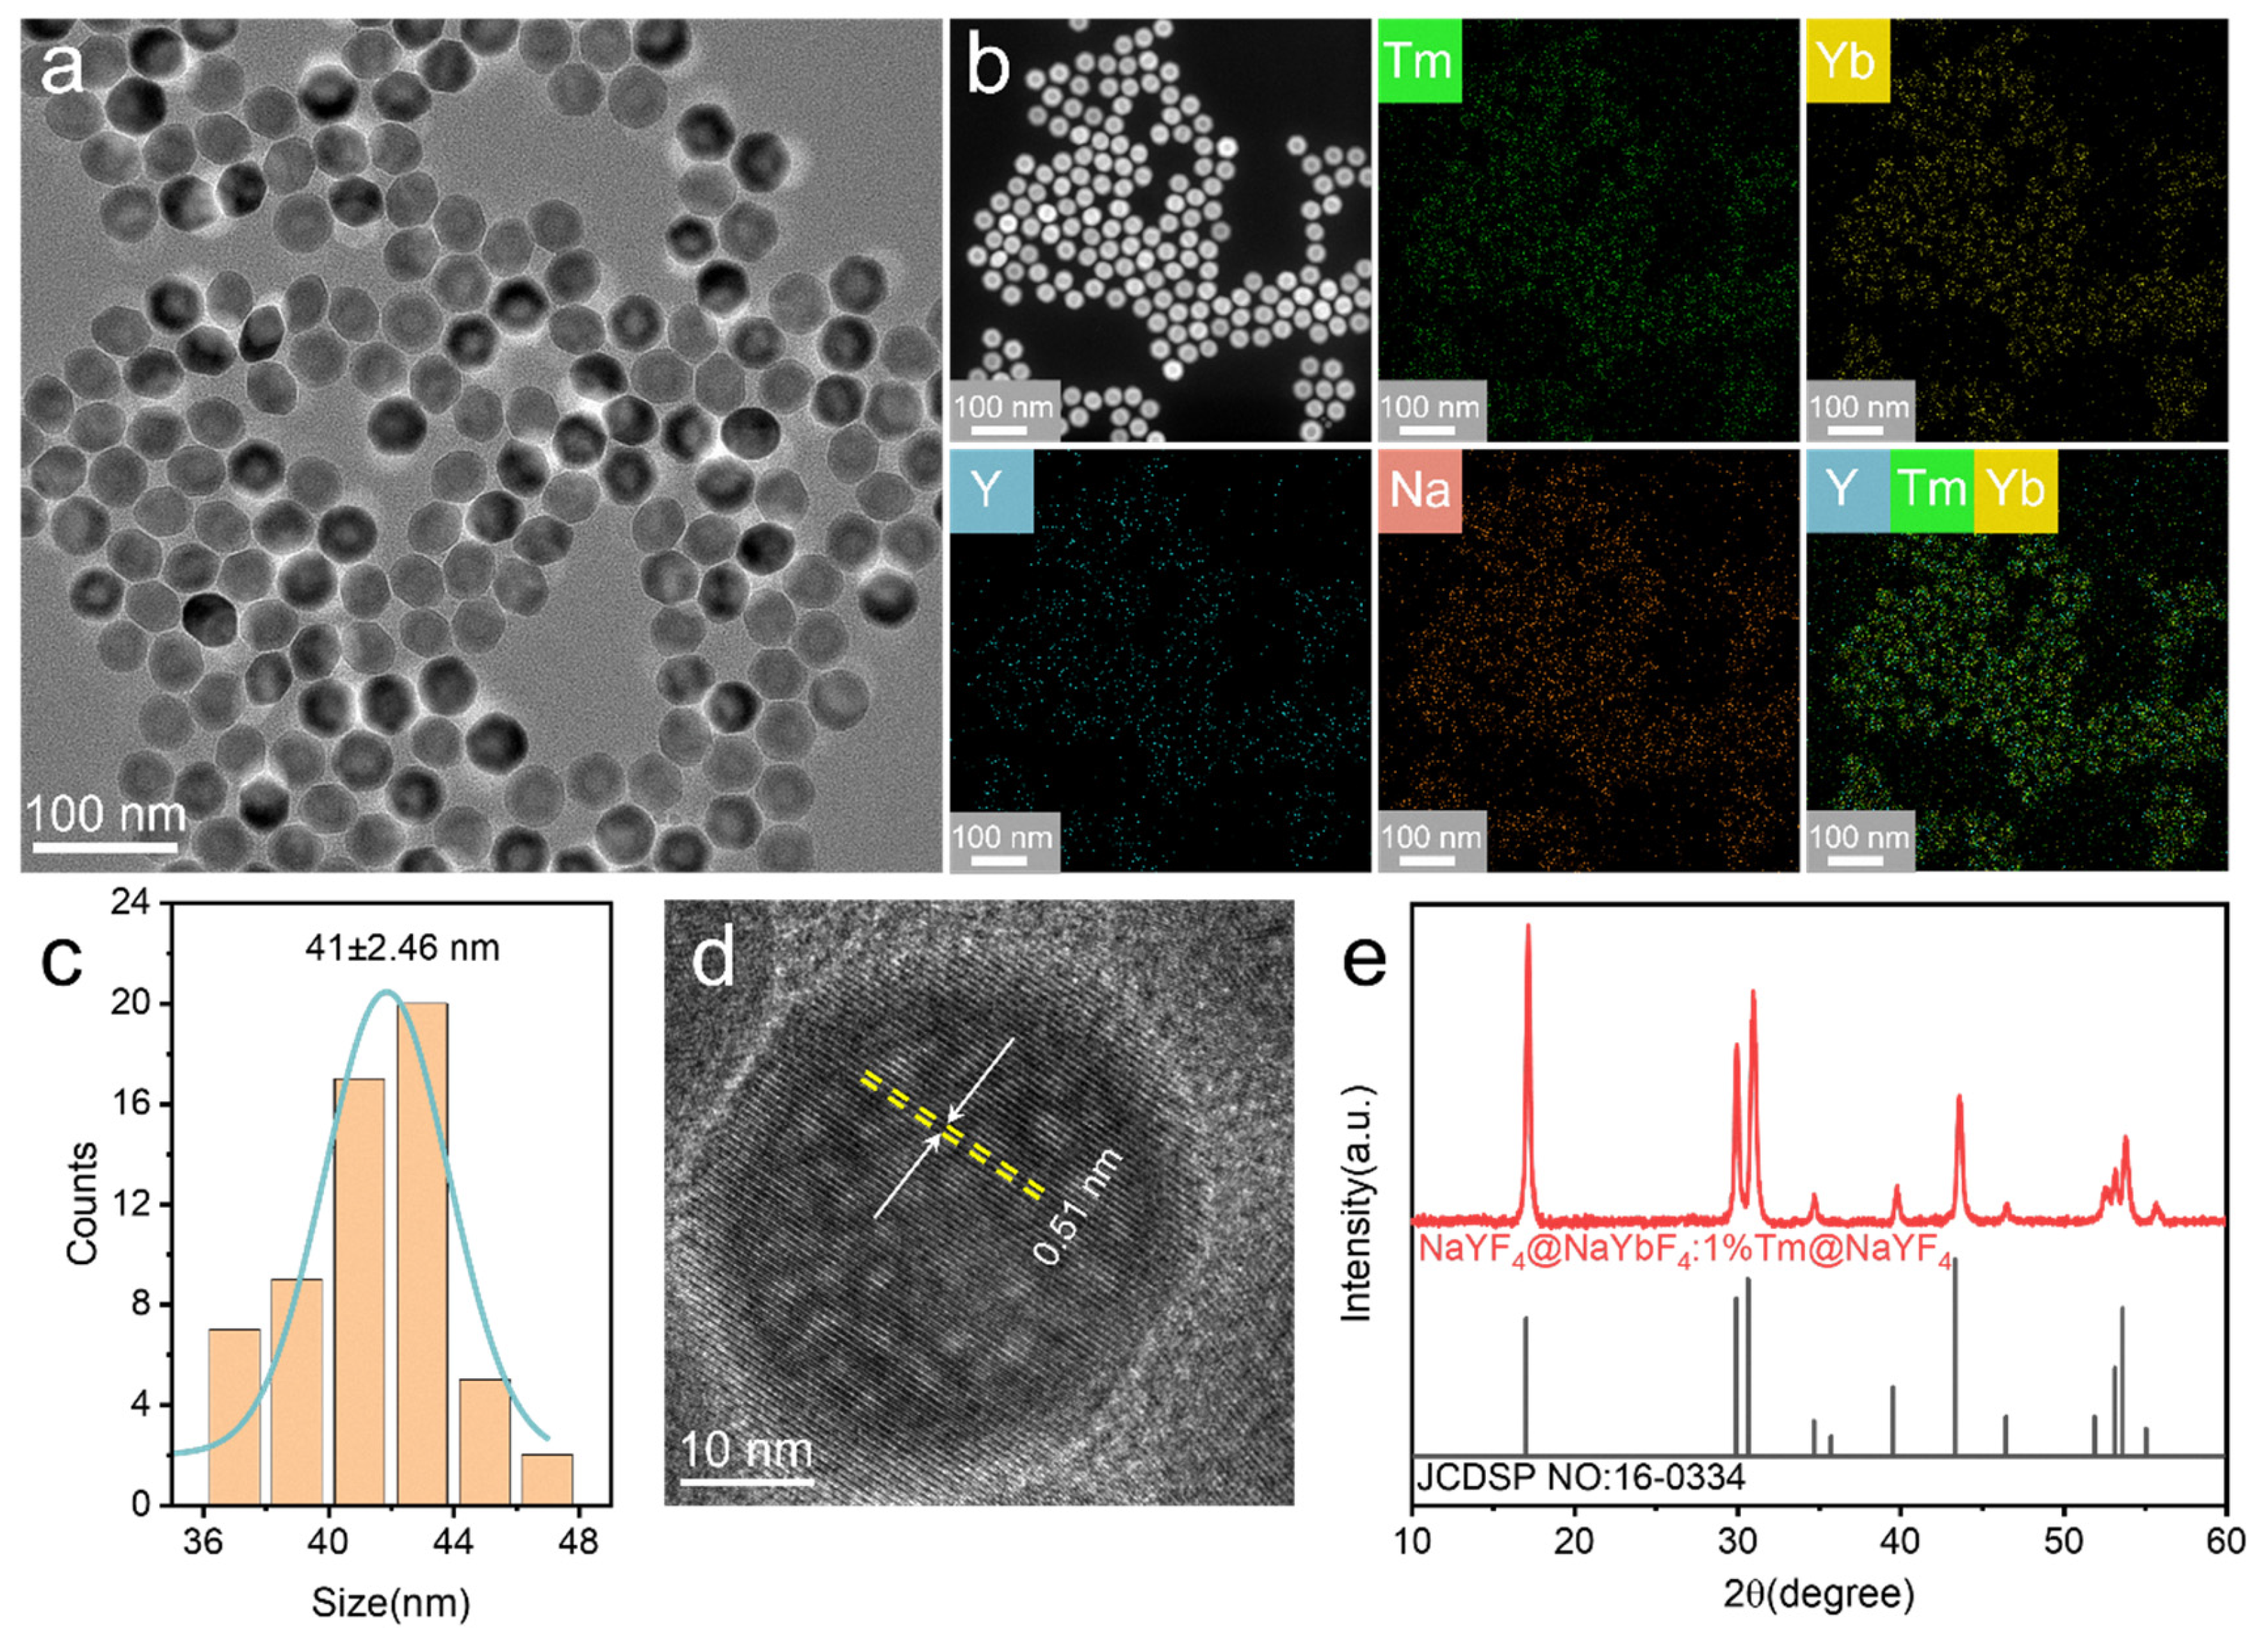
Firstly, a series of ytterbium–thulium (NaYF4@NaYbF4:1%Tm@NaYF4 and NaYF4@NaYF4:20%Yb, 0.2%Tm@NaYF4) core–shell–shell nanoparticles were carefully prepared. According to the TEM and SEM images, the bare core (NaYF4), core–shell (NaYF4@NaYbF4:1%Tm and NaYF4@NaYF4:20%Yb, 0.2%Tm) and core–shell–shell (NaYF4@NaYbF4:1%Tm@NaYF4 and NaYF4@NaYF4:20%Yb, 0.2%Tm@NaYF4) structures exhibited excellent monodispersity and homogeneous dimensions (Figure 2a and Figure S1). As shown in Figure 2a, taking Y@99Yb1Tm@Y (short for NaYF4@NaYbF4:1%Tm@NaYF4) as an example, the structural characteristics of the samples were observed using high-angle annular dark-field scanning transmission electron microscopy (HAADF-STEM). The core–shell–shell sandwich nanostructure was solidly confirmed by the different brightness of the heavy/light lanthanides in the HAADF-STEM imaging (Yb was located in the brighter part of the intermediate shell layer, while Y was located in the darker part of the core and exterior), which matched our design excellently. Additionally, as shown in Figure 2b, the elemental mapping further substantiated that the Yb and Tm were confined to the intermediate shell-layer region. In order to prevent the negative effects of surface quenching, the samples were coated with a 5 nm inert layer of NaYF4 as the outermost shell. The statistical results of the particle size revealed that the average diameter of the inner core was ≈ 22 nm, the average thickness of both the intermediate shell layer and the outermost shell layer was ≈ 5 nm, and the average size of the final synthesized Y@99Yb1Tm@Y sample was ≈ 41 nm (Figure 2c and Figure S2). Figure 2d shows the clear lattice fringe, with the d spacing of 0.51 nm corresponding to the (101) crystal plane in the high-resolution transmission electron microscopy (HRTEM) image. The XRD pattern further indicates that the synthesized UCNPs possessed pure hexagonal phases, whose diffraction peaks well matched the standard pattern with card number 16-0334 (Figure 2e and Figure S3).
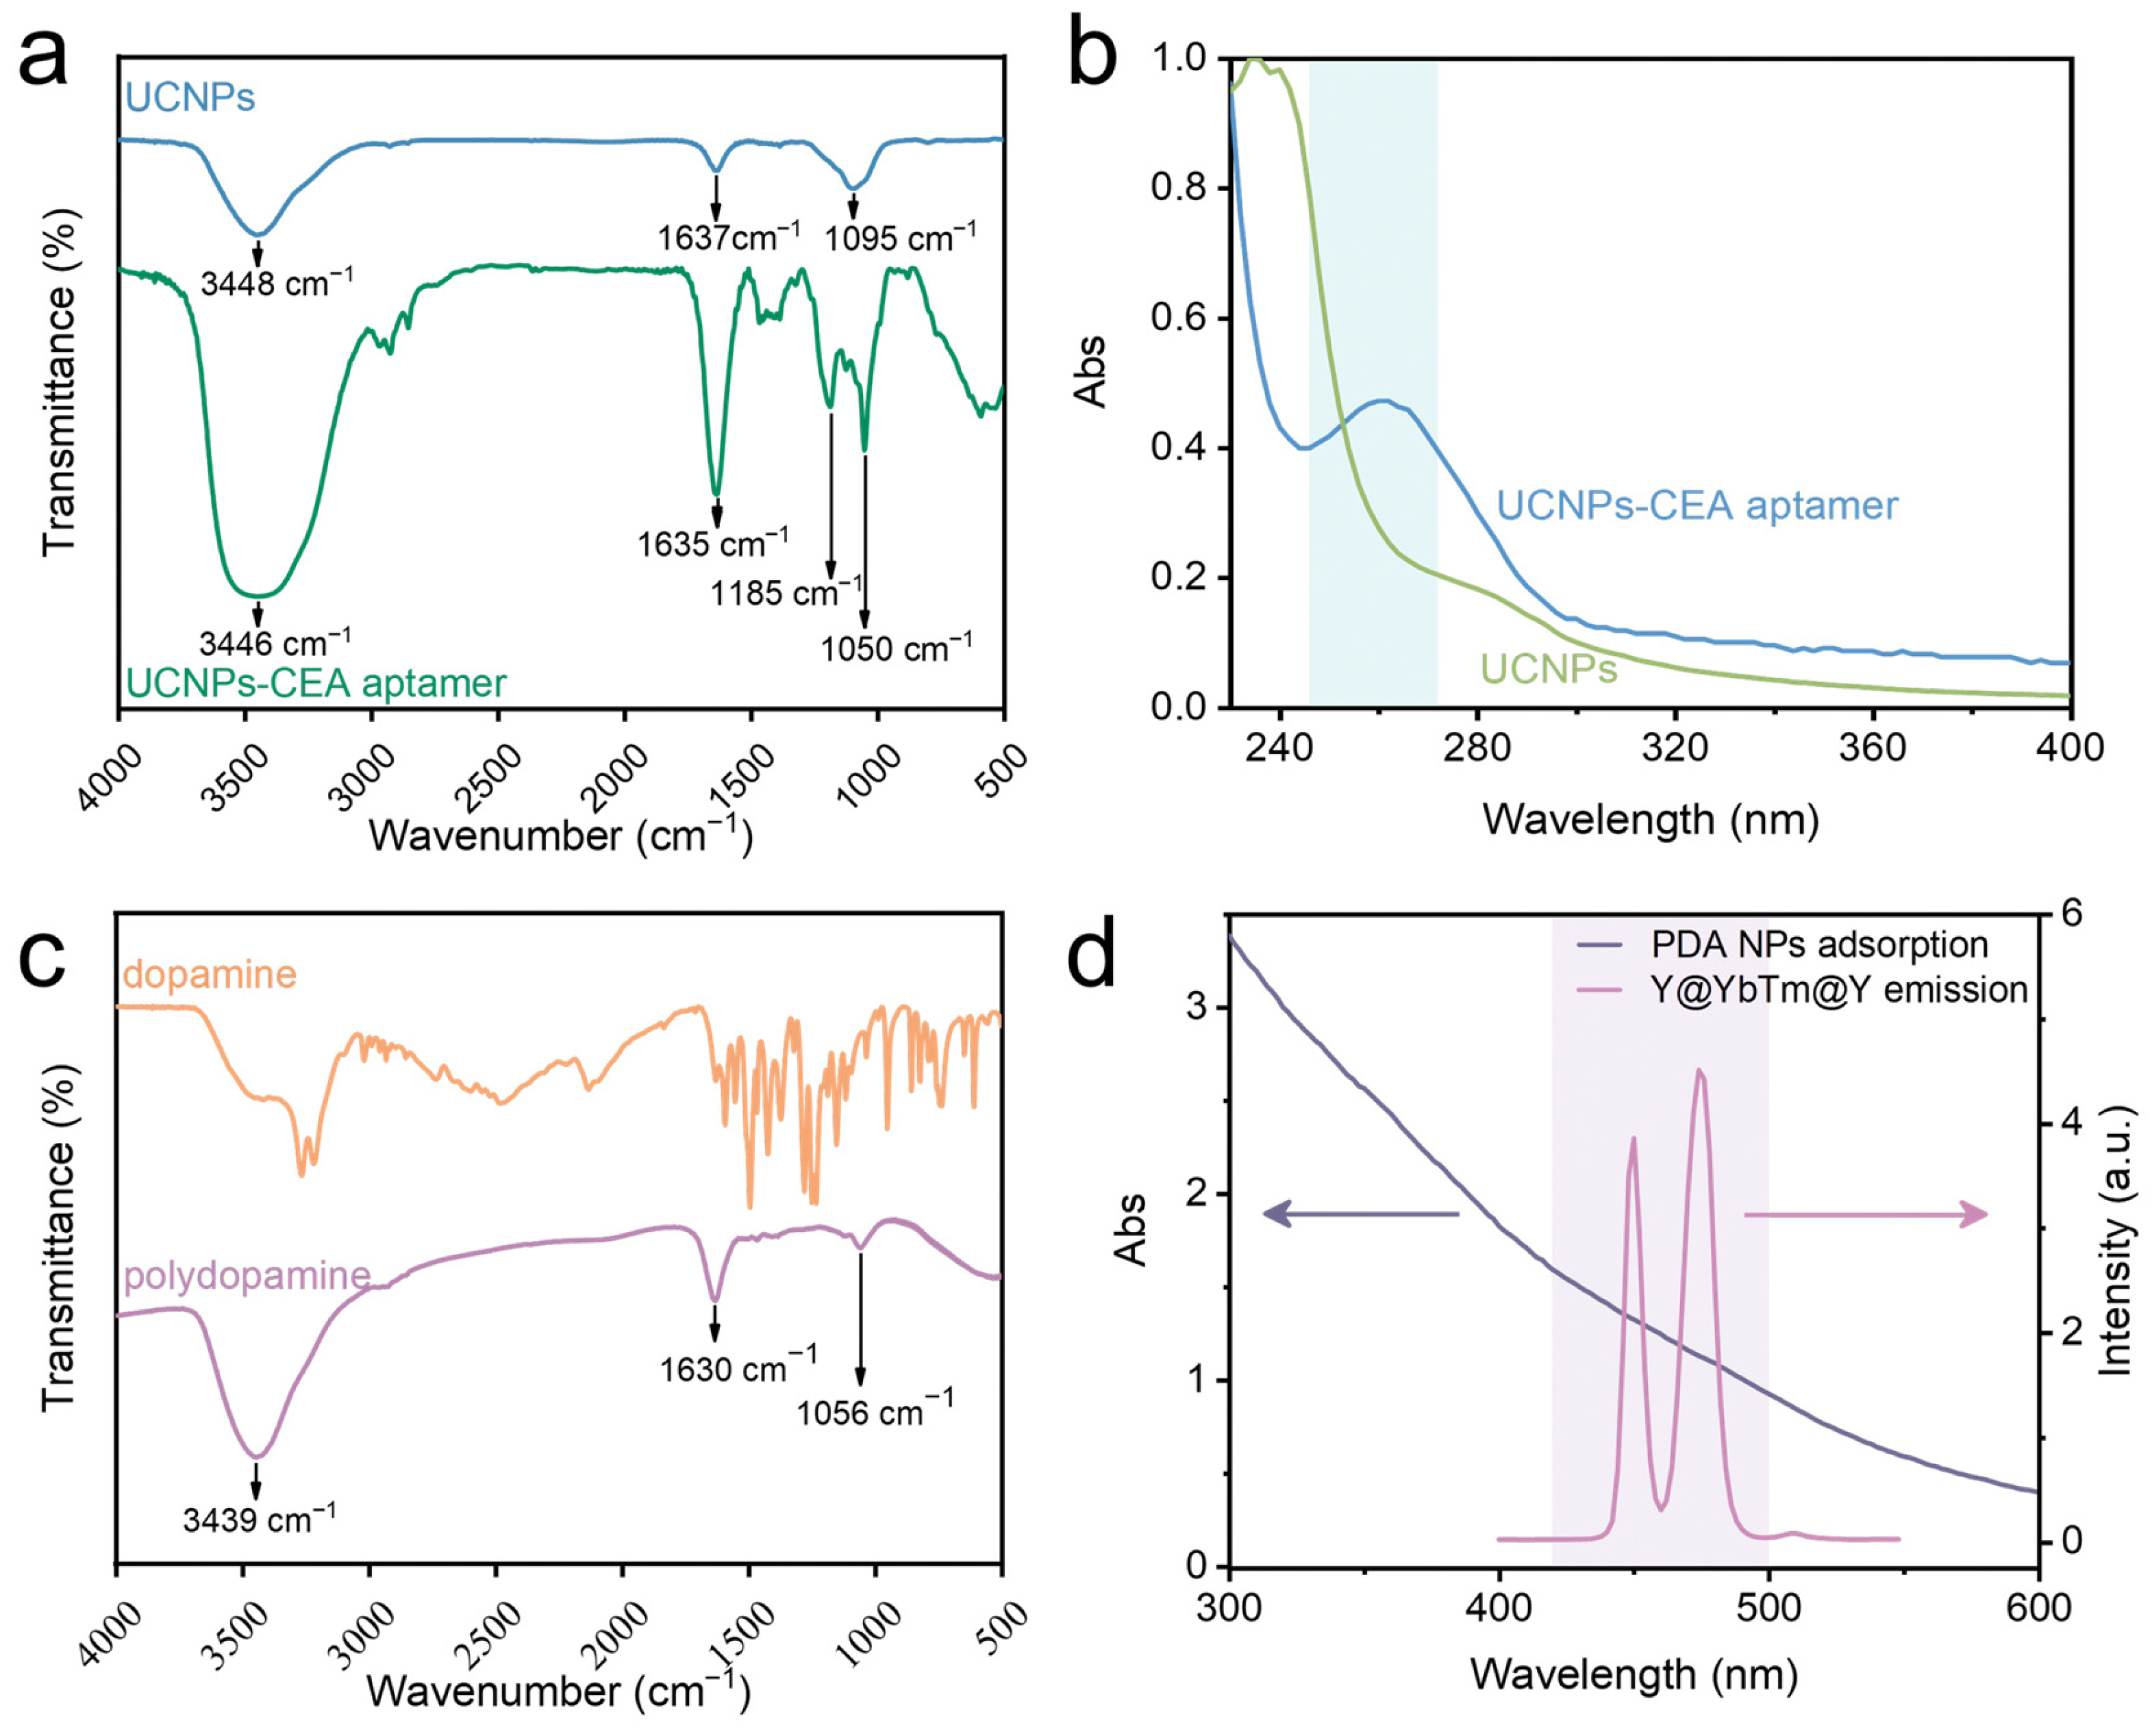
To prove the successful coupling of the UCNPs with the CEA aptamer, we used FTIR and UV–vis spectroscopy for testing. The FTIR spectrum of the UCNPs without organic ligands is shown in Figure 3a (bule line). However, after modification with the CEA aptamer, the FTIR spectrum of the UCNPs-CEA aptamer (green line in Figure 3a) exhibited several characteristic absorption peaks, such as the C–O stretching vibration peaks at 1050 cm−1 and 1185 cm−1, the stretching vibration peak of C=O at 1635 cm−1, and the stretching vibration of the N–H and O–H bonds’ peak at 3446 cm−1. The appearance of these characteristic peaks indicated the successful coupling of the UCNPs with the CEA aptamer. To further verify this, we obtained the UV–vis absorption spectra before and after the coupling. Figure 3b shows an apparent characteristic DNA absorption peak (derived from the CEA aptamers) around 260 nm after the coupling of the UCNPs with the CEA aptamer, which further indicated their successful coupling. Subsequently, to confirm that FRET can occur between the coupled UCNPs and PDA NPs, we performed FTIR and UV–vis spectroscopy testing on the PDA NPs (the diameter of the PDA NPs was about 185 nm; the relevant TEM image is displayed in Figure S4). Figure 3c shows that the FTIR absorption peak of the PDA NPs at 1056 cm−1 resulted from the stretching vibration of the C–O bonds, the peak at 1630 cm−1 as ascribed to the vibration of aromatic structures, and the peak at 3439 cm−1 was ascribed to the stretching vibration of symmetric and asymmetric N–H, which suggest that the PDA NPs possessed an aromatic ring structure and properties similar to those of π-conjugated polymers. When PDA NPs are added into the UCNPs-CEA aptamer system, “π–π stacking” interactions occur between the nucleobases of the single-stranded DNA and the aromatic groups of the PDA NPs [40]. This allows the single-stranded DNA (CEA aptamer) to assemble on the PDA surface with strong affinity, and then a combination of UCNPs-CEA aptamer-PDA NPs is formed. Moreover, we tested the absorption spectra of the PDA NPs and the fluorescence emission spectra of the UCNPs; as shown in Figure 3d, they were well-overlapped, which allowed FRET to occur.
Next, we optimized two reaction conditions of the FRET system constructed with the PDA NPs and UCNPs (taking Y@99Yb1Tm@Y as an example), i.e., (1) the PDA NP concentration and (2) the donor–acceptor reaction time. Firstly, we fixed the reaction time at 20 min, and different concentrations of PDA NPs were added to the Y@99Yb1Tm@Y-CEA aptamer system. The degree of fluorescence quenching of the system was directly related to the concentration of PDA NPs. Figure 4a shows that the relative fluorescence intensity, F/F0, of the Y@99Yb1Tm@Y-CEA aptamer system gradually decreased with the increase in the concentration of PDA NPs (F represents the fluorescence intensity of the Y@99Yb1Tm@Y-CEA aptamer system at 474 nm with the existence of PDA NPs, and F0 is the fluorescence intensity of the system without PDA NPs). When the concentration of added PDA NPs reached 0.35 μg/μL, the fluorescence quenching of the system was saturated. By continuing to increase the concentration of PDA NPs, the value of F/F0 remained unchanged, so we determined that 0.35 μg/μL was the optimal concentration of PDA NPs. Based on these results, we further investigated the effect of the reaction time on the fluorescence quenching. As shown in Figure 4b, the value of F/F0 gradually decreased with increasing reaction time (the concentration of added PDA NPs was fixed at 0.35 μg/μL) and started to reach a stable plateau at 40 min. Therefore, in the following study, to ensure the completeness of the quenching process, we chose a PDA NP concentration of 0.35 μg/μL and a reaction time of 50 min (guaranteeing a full reaction). In this case, the highest fluorescence quenching of the system reached 98% (Figure 4b), which confirmed the good quality of our designed FRET system.
Based on the above-mentioned optimization of the two reaction conditions, we further explored the effect of two different representative doping levels of lanthanide ions in the UCNP donor on the sensitivity of CEA detection. The optimal doping concentrations of traditional low-doping structures are 20% Yb3+ and <2% Tm3+ [41,42]. In recent years, highly Yb3+-doped systems have become a research hotspot and have stronger upconversion luminescence brightness compared to the low-doped systems [19,43]. To further clarify the optimal doping concentration relationship between Yb3+ and Tm3+ in the highly doped system, a series of studies were conducted, which finally confirmed that the optimal luminescence was realized when the doping concentrations of Tm were 0.5%~1% in highly Yb3+-doped cases. Therefore, we chose the representative structure of Y@99Yb1Tm@Y to construct the sensor, with the aim of obtaining a larger increase in sensor sensitivity. Additionally, the classical low-doped system Y@20Yb0.2Tm@Y (short for NaYF4@NaYF4:20%Yb, 0.2%Tm@NaYF4) [41,42] was selected as the reference group. Subsequently, we carried out parallel control experiments for both systems. Specifically, we added 0.35 μg/μL PDA NPs to the UCNPs-CEA aptamer-CEA systems. The results showed that the relative fluorescence intensities (i.e., the value of F/F0, where F represents the fluorescence intensity of the system at 474 nm in the presence of CEA, and F0 is the fluorescence intensity in the absence of CEA) of the systems all gradually recovered as the amount of CEA increased. As shown in Figure 5a, the F/F0 value of the highly doped Y@99Yb1Tm@Y system exhibited a segmented linear relationship with the concentration of CEA. When the concentration of CEA was in the range of 0~1.5 ng/mL, a detection limit of 0.0117 ng/mL was obtained (S/N = 3). When the concentration of CEA was in the range of 1.5~250 ng/mL, the detection limit was 1.14 ng/mL (S/N = 3). It is worth noting that this similar segmented relationship has also been reported in previous works [44,45]. On the other hand, the signal variation in the low-doped Y@20Yb0.2Tm@Y system only showed good linearity in the range of 1.5~250 ng/mL, with a relatively large detection limit value (3.23 ng/mL, S/N = 3, as shown in Figure 5b). In that case, it was not difficult to find that the biosensors constructed based on high-doped upconversion systems were significantly more sensitive. The relevant mechanism can be attributed to the high-level-doped donor having superior luminescence performance (e.g., its upconversion intensity was more than 10 times higher than that of the conventional low-doped system, Figure 5c), so that it could better overcome the negative influence of unfavorable factors such as instrumental noise. Additionally, the sensitivity obtained in this work is higher than that of most of the reported methods that also follow the FRET mechanism (as shown in Table 1).
In order to further evaluate the interference immunity of the constructed UCNPs-PDA NP biosensor for CEA detection. We chose several commonly used proteins and small molecules such as Gly, L-AscH2, L-Cys, GLU, BSA, and NaCl as the interfering substances, and all the interfering substance experiments were conducted under the same experimental conditions. The concentrations of all these interfering proteins and small molecules were raised to 1.0 μg/mL; on the contrary, the CEA concentration was limited to 50 ng/mL. As shown in Figure 5d, the fluorescence intensity of the sensor was significantly restored only after adding 50 ng/mL CEA, yet the interfering substances (1.0 μg/mL) did not have a significant effect on the fluorescence of the sensor. This result indicates that our designed sensor has good CEA selectivity.
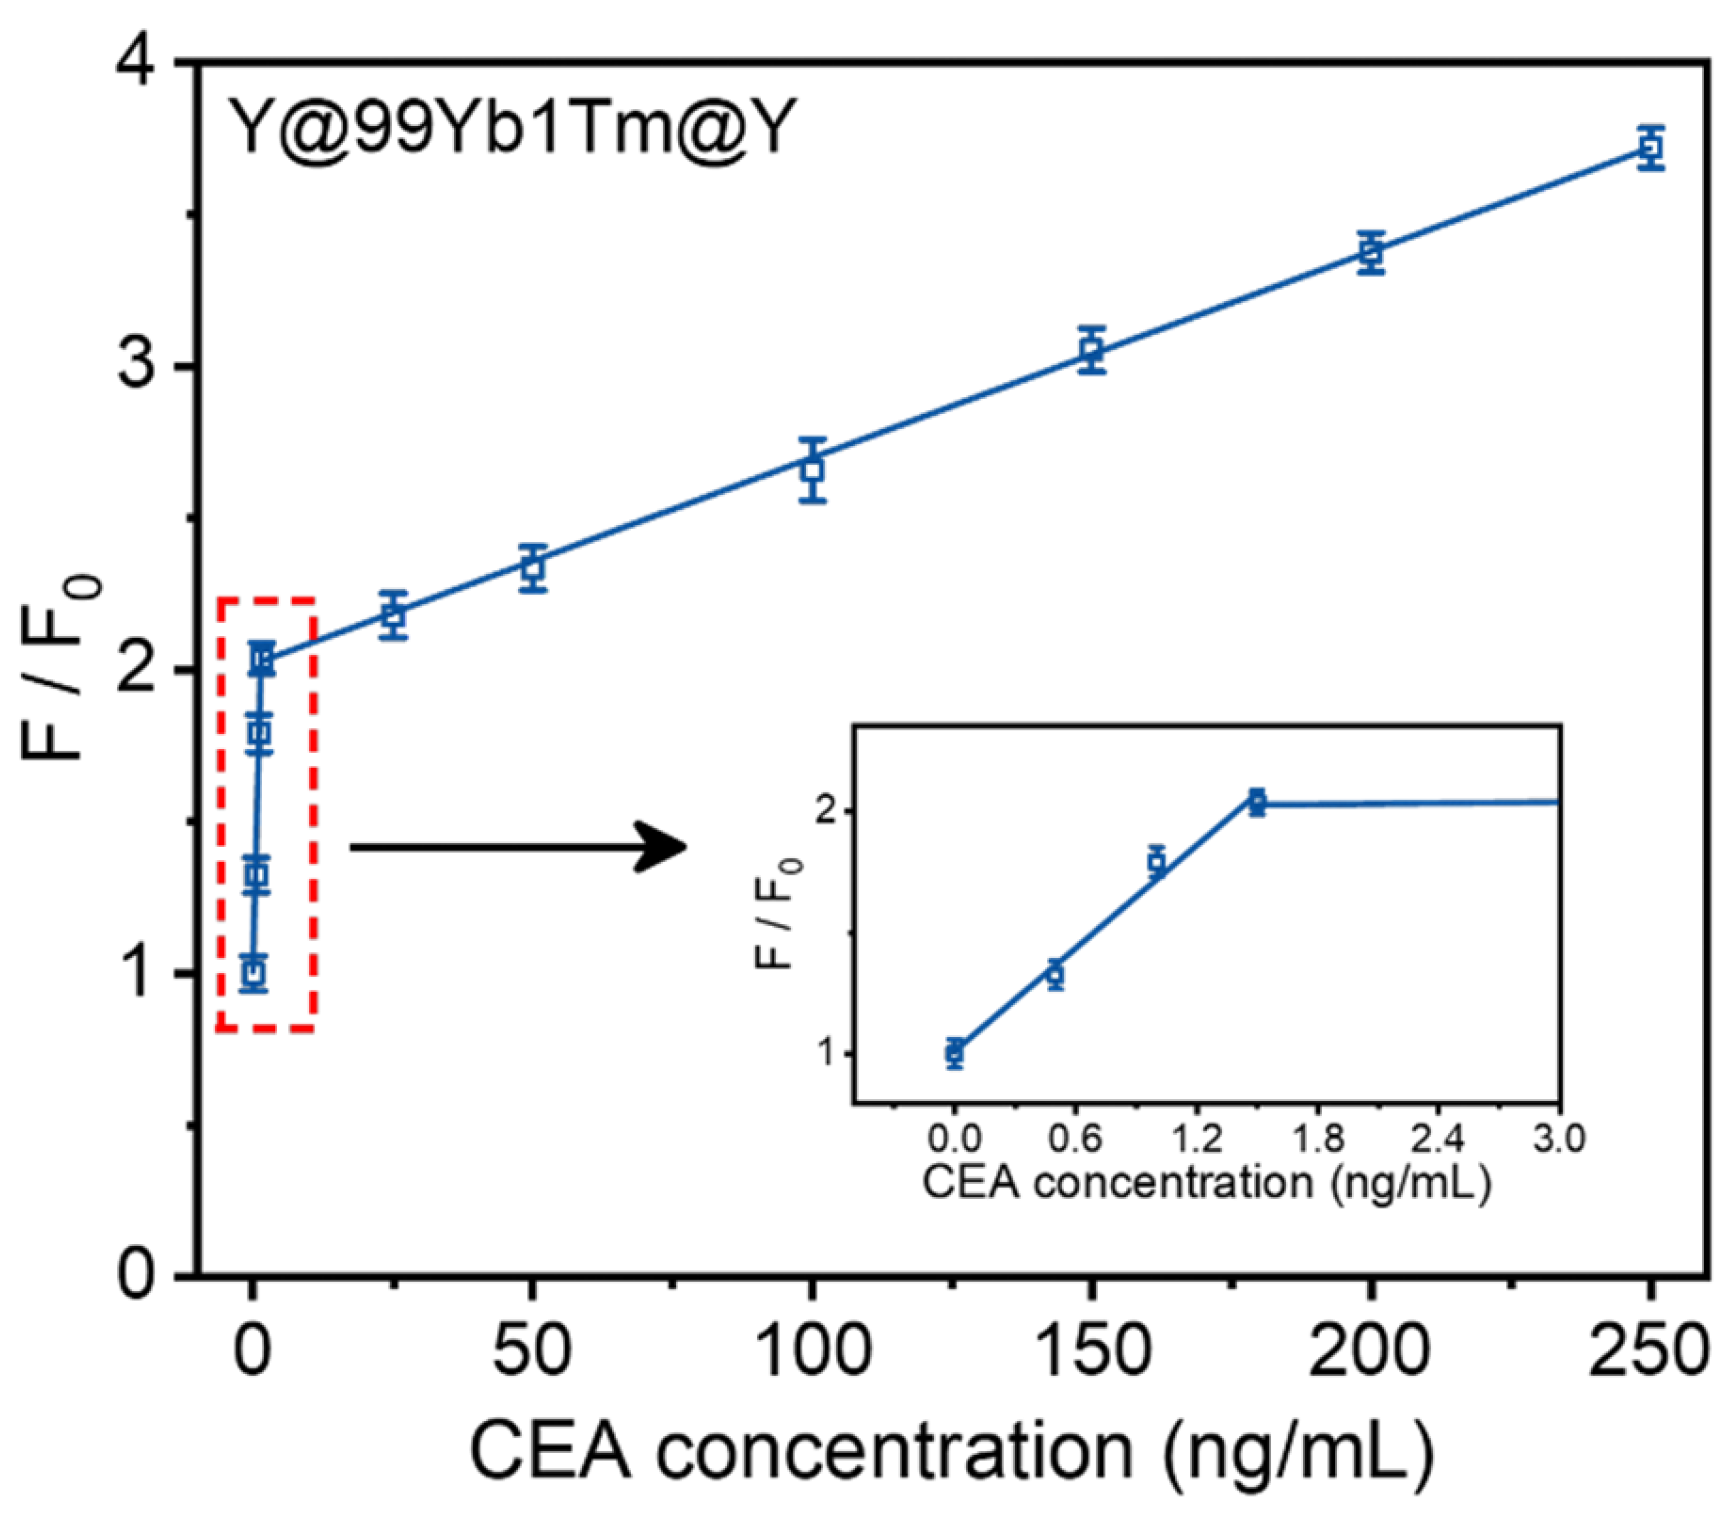
We further evaluated the detection capability of the Y@99Yb1Tm@Y-CEA aptamer-PDA NPs in complex biological matrices, and we conducted tests using 50-fold-diluted fetal bovine serum as the analytical medium. Similar to the results obtained in the HEPES buffer solution, the relationship between the upconverted relative fluorescence intensity (F/F0, where F represents the fluorescence intensity of the system at 474 nm in the presence of CEA, and F₀ is the fluorescence intensity in the absence of CEA) and CEA concentrations in diluted fetal bovine serum also showed a linear two-segment correlation. As shown in Figure 6, when the concentration of CEA was in the range of 0~1.5 ng/mL, the detection limit was 0.013 ng/mL (S/N = 3); when the concentration of CEA was in the range of 1.5~250 ng/mL, the detection limit was 1.38 ng/mL (S/N = 3). The similarity between the results above and those in the HEPES buffer suggests that our sensor maintains high sensitivity even in more complex biological matrices. The limits of detection in the diluted serum were slightly higher than those in the HEPES-buffered solutions due to the high complexity of the serum environment. As shown in Figure S5, the fluorescence images of the aptasensor correlated with the CEA concentrations, clearly showing the quenching and recovery processes at different CEA levels. In addition, a standard addition experiment was performed with four diluted serum samples. As shown in Table 2, the recovery rates ranged from 92.2% to 108.7%, and the relative standard deviation (RSD) remained below 6%. These results are acceptable for quantitative determination in biological samples.

4. Conclusions

To summarize, we successfully constructed a biosensor (UCNPs-CEA aptamer-PDA NP system) based on the FRET mechanism with high sensitivity in detecting CEA. The utilization of the high-level lanthanide-ion-doping strategy enabled a more than 10-times-higher luminescence intensity than the conventional low-level-doped UCNPs. Benefiting from the enhanced brightness, we achieved a remarkably low detection limit for CEA, which was as low as 0.0117 ng/mL when tested in a HEPES buffer solution and 0.013 ng/mL in diluted fetal bovine serum. Such high sensitivity can meet the common requirement for disease surveillance (≤5.0 ng/mL) and exhibits strong competitiveness compared with numerous counterparts. Given its exceptional sensitivity and reliability, our study provides an alternative sensitive sensor for CEA detection that shows great potential application in the diagnosis of early-stage clinical cancers.

Supplementary Materials

The following supporting information can be downloaded at https://www.mdpi.com/article/10.3390/ma18040796/s1, Table S1: Summary of the consumables, precursors, and concentrations in the Materials and Methods; Table S2: Appendix of all abbreviations; Figure S1: SEM images of (a) bare core NaYF4 upconversion nanoparticles (UCNPs); (b) core–shell NaYF4@NaYbF4:1%Tm UCNPs; (c) core–shell NaYF4@NaYF4:20%Yb,0.2%Tm UCNPs; (d) core–shell–shell NaYF4@NaYF4:20%Yb,0.2%Tm@NaYF4 UCNPs; Figure S2: (a) The average size of bare core NaYF4 particles, measured at 22 ± 1.6 nm. (b) The average size of core–shell NaYF4@NaYbF4:1%Tm particles, measured at 30 ± 1.48 nm. (c) The average size of core–shell NaYF4@NaYF4:20%Yb,0.2%Tm particles, measured at 33 ± 1.66 nm. (d) The average size of core–shell–shell NaYF4@NaYF4:20%Yb,0.2%Tm@NaYF4 particles, measured at 46 ± 2.97 nm; Figure S3: XRD patterns of NaYF4, NaYF4@NaYF4:20%Yb,0.2%Tm, NaYF4@NaYbF4:1%Tm, NaYF4@NaYF4:20%Yb,0.2%Tm@NaYF4 UCNPs, and JCDSP No. 16-0334; Figure S4: TEM image of polydopamine nanoparticles (PDA NPs); Figure S5: Images visualizing Y@99Yb1Tm@Y-PDA NPs aptasensor at different CEA levels.

Author Contributions

Conceptualization, J.Z. and L.N.; methodology, J.Z. and Q.S.; validation, L.N., Q.S. and S.W.; investigation, L.N., D.G., E.W., Y.C., L.X., X.L. and L.T.; resources, J.Z.; writing—original draft, L.N., Q.S. and S.W.; writing—review and editing, J.Z., L.T. and L.N.; visualization, L.S. and H.L.; supervision, J.Z.; project administration, J.Z. and L.N.; funding acquisition, J.Z. All authors have read and agreed to the published version of the manuscript.

Funding

This research was funded by the Jilin Provincial Department of Science and Technology (Grants 20240101319JC), the National Natural Science Foundation of China (grants 12104179, 12474416, 62305045, 12204192), the Fundamental Research Funds for the Central Universities, Jilin University, the National Key R&D Program of China (No. 2023YFC2811205), and the Laoshan Laboratory (No. LSKJ202203601).

Institutional Review Board Statement

Not applicable.

Informed Consent Statement

Not applicable.

Data Availability Statement

The original contributions presented in this study are included in the article/Supplementary Materials. Further inquiries can be directed to the corresponding author.

Conflicts of Interest

Authors Lu Xia and Xingyu Liu are employed by the company The 49th Research Institute of China Electronics Technology Group Corporation. The remaining authors declare that the research was conducted in the absence of any commercial or financial relationships that could be construed as a potential conflict of interest.

References

  1. Jo, Y.; Lee, J.-H.; Cho, E.-S.; Lee, H.S.; Shin, S.-J.; Park, E.J.; Baik, S.H.; Lee, K.Y.; Kang, J. Clinical significance of early carcinoembryonic antigen change in patients with nonmetastatic colorectal cancer. Front. Oncol. 2022, 12, 739614. [Google Scholar] [CrossRef]
  2. Sorokin, J.J.; Kupchik, H.Z.; Zamcheck, N.; Dhar, P. A clinical comparison of two radioimmunoassays for carcinoembryonic antigen (CEA). Immunol. Commun. 1972, 1, 11–24. [Google Scholar] [CrossRef] [PubMed]
  3. Tommasi, M.; Pieroni, C.; Cappelli, G. Radioimmunoassay of carcinoembryonic antigen: Observations and methodological variations. J. Nucl. Med. Allied. Sci. 1978, 22, 163–167. [Google Scholar]
  4. Schiedeck, T.H.K.; Wellm, C.; Roblick, U.J.; Broll, R.; Bruch, H.P. Diagnosis and monitoring of colorectal cancer by L6 blood serum polymerase chain reaction is superior to carcinoembryonic antigen-enzyme-linked immunosorbent assay. Dis. Colon. Rectum. 2003, 46, 818–825. [Google Scholar] [CrossRef]
  5. Huang, J.; Jiao, L.; Xu, W.; Fang, Q.; Wang, H.; Cai, X.; Yan, H.; Gu, W.; Zhu, C. Immobilizing enzymes on noble metal hydrogel nanozymes with synergistically enhanced peroxidase activity for ultrasensitive immunoassays by cascade signal amplification. ACS Appl. Mater. 2021, 13, 33383–33391. [Google Scholar] [CrossRef]
  6. Han, R.; Sun, Y.; Dai, Y.; Gao, D.; Wang, X.; Luo, C. A chemiluminescence aptasensor for sensitive detection of carcinoembryonic antigen based on dual aptamer-conjugates biorecognition. Sens. Actuators B Chem. 2021, 326, 128833. [Google Scholar] [CrossRef]
  7. Qin, X.; Zheng, C.; Li, Y.; Lu, X.; Mao, Q. Evaluation of the effect of hemolysis on quantitative chemiluminescent immunoassay results for 10 analytes. Clin. Lab. 2021, 67, 2423–2430. [Google Scholar] [CrossRef] [PubMed]
  8. Tang, Y.; Zhang, B.; Wang, Y.; Zhao, F.; Zeng, B. Electrochemiluminescence immunosensor for the detection of carcinoembryonic antigen based on oxygen vacancy-rich Co3O4 nanorods and luminol. ACS Appl. Nano Mater. 2021, 4, 7264–7271. [Google Scholar] [CrossRef]
  9. Wang, Y.; Ding, J.; Zhou, P.; Liu, J.; Qiao, Z.; Yu, K.; Jiang, J.; Su, B. Electrochemiluminescence distance and reactivity of coreactants determine the sensitivity of bead-based immunoassays. Angew. Chem. Int. Ed. 2023, 62, 2216525. [Google Scholar]
  10. Xu, Z.; Liu, X.; Zong, C.; Zhang, Q.; Gai, H. Homogeneous immunoassay utilizing fluorescence resonance energy transfer from quantum dots to tyramide dyes deposited on full immunocomplexes. Analyst. 2023, 148, 4877–4884. [Google Scholar] [CrossRef] [PubMed]
  11. Zhu, N.; Li, G.; Zhou, J.; Zhang, Y.; Kang, K.; Ying, B.; Yi, Q.; Wu, Y. A light-up fluorescence resonance energy transfer magnetic aptamer-sensor for ultra-sensitive lung cancer exosome detection. J. Mater. Chem. B. 2021, 9, 2483–2493. [Google Scholar] [CrossRef]
  12. Song, J.; Chen, Z.; Huang, D.; Xu, B. Prognostic impact of pretreatment elevated and normalized carcinoembryonic antigen levels after neoadjuvant chemoradiotherapy in resected locally advanced rectal cancer patients. Cancer Manag. Res. 2021, 13, 3713–3721. [Google Scholar] [CrossRef] [PubMed]
  13. Singh, R.D.; Shandilya, R.; Bhargava, A.; Kumar, R.; Tiwari, R.; Chaudhury, K.; Srivastava, R.K.; Goryacheva, I.Y.; Mishra, P.K. Quantum dot based nano-biosensors for detection of circulating cell free miRNAs in lung carcinogenesis: From biology to clinical translation. Front. Genet. 2018, 9, 616. [Google Scholar] [CrossRef]
  14. Wu, Z.; Li, H.; Liu, Z. An aptasensor for carcinoembryonic antigen based on upconversion fluorescence resonance energy transfer. Sens. Actuators B Chem. 2015, 206, 531–537. [Google Scholar] [CrossRef]
  15. Li, H.; Shi, L.; Sun, D.-e.; Li, P.; Liu, Z. Fluorescence resonance energy transfer biosensor between upconverting nanoparticles and palladium nanoparticles for ultrasensitive CEA detection. Biosens. Bioelectron. 2016, 86, 791–798. [Google Scholar] [CrossRef]
  16. Du, K.M.; Feng, J.; Gao, X.; Zhang, H.J. Nanocomposites based on lanthanide-doped upconversion nanoparticles: Diverse designs and applications. Light Sci. Appl. 2022, 11, 222. [Google Scholar] [CrossRef] [PubMed]
  17. Kotulska, A.M.; Pilch-Wrobel, A.; Lahtinen, S.; Soukka, T.; Bednarkiewicz, A. Upconversion FRET quantitation: The role of donor photoexcitation mode and compositional architecture on the decay and intensity based responses. Light Sci. Appl. 2022, 11, 256. [Google Scholar] [CrossRef] [PubMed]
  18. Sedlmeier, A.; Gorris, H.H. Surface modification and characterization of photon-upconverting nanoparticles for bioanalytical applications. Chem. Soc. Rev. 2015, 44, 1526–1560. [Google Scholar] [CrossRef] [PubMed]
  19. Li, F.; Tu, L.P.; Zhang, Y.Q.; Huang, D.X.; Liu, X.X.; Zhang, X.R.; Du, J.R.; Fan, R.W.; Yang, C.H.; Kraemer, K.W.; et al. Size-dependent lanthanide energy transfer amplifies upconversion luminescence quantum yields. Nat. Photonics 2024, 18, 440–449. [Google Scholar] [CrossRef]
  20. Xia, Q.; Zhang, Y.; Li, Z.; Hou, X.; Feng, N. Red blood cell membrane-camouflaged nanoparticles: A novel drug delivery system for antitumor application. Acta. Pharm. Sin. B 2019, 9, 675–689. [Google Scholar] [CrossRef] [PubMed]
  21. Ansari, A.A.; Parchur, A.K.; Li, Y.; Jia, T.; Lv, R.; Wang, Y.; Chen, G. Cytotoxicity and genotoxicity evaluation of chemically synthesized and functionalized upconversion nanoparticles. Coord. Chem. Rev. 2024, 504, 215672. [Google Scholar] [CrossRef]
  22. Ansari, A.A.; Aldajani, K.M.; AlHazaa, A.N.; Albrithen, H.A. Recent progress of fluorescent materials for fingermarks detection in forensic science and anti-counterfeiting. Coord. Chem. Rev. 2022, 462, 214523. [Google Scholar] [CrossRef]
  23. Park, Y.I.; Lee, K.T.; Suh, Y.D.; Hyeon, T. Upconverting nanoparticles: A versatile platform for wide-field two-photon microscopy and multi-modal in vivo imaging. Chem. Soc. Rev. 2015, 44, 1302–1317. [Google Scholar] [CrossRef] [PubMed]
  24. Lee, C.; Park, J.H.; Kim, M.; Kim, J.S.; Shim, T.S. Fabrication of a tunable photothermal actuator via in situ oxidative polymerization of polydopamine nanoparticles in hydrogel bilayers. Soft Matter 2022, 18, 4604–4612. [Google Scholar] [CrossRef] [PubMed]
  25. Li, S.; Ren, X.; Liu, Y.; Wang, L.; Zhou, Y.; Zhang, Y.; Yan, Z.; Lan, X.; Guo, L. Multifunctional carboxymethyl chitosan/oxidized carboxymethyl cellulose hydrogel loaded with ginsenoside Rg1 and polydopamine nanoparticles for infected diabetic wound healing. Int. J. Biol. Macromol. 2024, 282, 136686. [Google Scholar] [CrossRef] [PubMed]
  26. Chahar, D.; Yadav, B.; Venkatesu, P. Interactions of polydopamine nanoparticles with serine and cysteine proteases: Implications for enhancing protein stabilization and enzyme activity. ACS Appl. Nano Mater. 2024, 7, 26202–26214. [Google Scholar] [CrossRef]
  27. Ji, H.; Zhang, H.; Liu, G.; Hao, X. Nanoparticles based on polydopamine and honokiol for combination therapy of colorectal cancer. ACS Appl. Nano Mater. 2024, 7, 16852–16863. [Google Scholar] [CrossRef]
  28. Han, Y.-P.; Shen, L.; Li, Z.; Hu, C.-G.; Liu, Z.-H. An aptasensor based on upconversion nanoparticles-polydopamine nanoparticles nanosystem for detection of carcinoembryonic antigen. Chin. J. Anal. Chem. 2018, 46, 1178–1185. [Google Scholar]
  29. Yu, D.; Zha, Z.; Tang, S.; Qiu, Y.; Liu, D. Modification-free fluorescent biosensor for CEA based on polydopamine-coated upconversion nanoparticles. J. Fluoresc. 2022, 32, 1289–1297. [Google Scholar] [CrossRef] [PubMed]
  30. Krämer, K.W.; Biner, D.; Frei, G.; Güdel, H.U.; Hehlen, M.P.; Lüthi, S.R. Hexagonal sodium yttrium fluoride based green and blue emitting upconversion phosphors. Chem. Mater. 2004, 16, 1244–1251. [Google Scholar] [CrossRef]
  31. Johnson, N.J.J.; He, S.; Diao, S.; Chan, E.M.; Dai, H.J.; Almutairi, A. Direct evidence for coupled surface and concentration quenching dynamics in lanthanide-doped nanocrystals. J. Am. Chem. Soc 2017, 139, 3275–3282. [Google Scholar] [CrossRef] [PubMed]
  32. Zuo, J.; Li, Q.Q.; Xue, B.; Li, C.X.; Chang, Y.L.; Zhang, Y.L.; Liu, X.M.; Tu, L.P.; Zhang, H.; Kong, X.G. Employing shells to eliminate concentration quenching in photonic upconversion nanostructure. Nanoscale 2017, 9, 7941–7946. [Google Scholar] [CrossRef] [PubMed]
  33. Ma, C.; Xu, X.; Wang, F.; Zhou, Z.; Liu, D.; Zhao, J.; Guan, M.; Lang, C.I.; Jin, D. Optimal sensitizer concentration in single upconversion nanocrystals. Nano Lett. 2017, 17, 2858–2864. [Google Scholar] [CrossRef]
  34. Gao, D.; Chen, B.J.; Sha, X.Z.; Zhang, Y.H.; Chen, X.; Wang, L.; Zhang, X.Z.; Zhang, J.S.; Cao, Y.Z.; Wang, Y.C.; et al. Near infrared emissions from both high efficient quantum cutting (173%) and nearly-pure-color upconversion in NaY(WO4)2:Er3+/Yb3+ with thermal management capability for silicon-based solar cells. Light Sci. Appl. 2024, 13, 17. [Google Scholar] [CrossRef] [PubMed]
  35. Gargas, D.J.; Chan, E.M.; Ostrowski, A.D.; Aloni, S.; Altoe, M.V.P.; Barnard, E.S.; Sanii, B.; Urban, J.J.; Milliron, D.J.; Cohen, B.E.; et al. Engineering bright sub-10-nm upconverting nanocrystals for single-molecule imaging. Nat. Nanotechnol. 2014, 9, 300–305. [Google Scholar] [CrossRef] [PubMed]
  36. Wei, W.; Chen, G.; Baev, A.; He, G.S.; Shao, W.; Damasco, J.; Prasad, P.N. Alleviating luminescence concentration quenching in upconversion nanoparticles through organic dye sensitization. J. Am. Chem. Soc. 2016, 138, 15130–15133. [Google Scholar] [CrossRef] [PubMed]
  37. Wang, F.; Wang, J.; Liu, X. Direct evidence of a surface quenching effect on size-dependent luminescence of upconversion nanoparticles. Angew. Chem. Int. Ed. 2010, 49, 7456–7460. [Google Scholar] [CrossRef]
  38. Wang, Y.; Wei, Z.; Luo, X.; Wan, Q.; Qiu, R.; Wang, S. An ultrasensitive homogeneous aptasensor for carcinoembryonic antigen based on upconversion fluorescence resonance energy transfer. Talanta 2019, 195, 33–39. [Google Scholar] [CrossRef]
  39. Li, H.; Liu, X.; Li, X. Solvothermal synthesis and modification of NaYF4: Yb/Er@NaLuF4: Yb for enhanced up-conversion luminescence for bioimaging. RSC Adv. 2019, 9, 42163–42171. [Google Scholar] [CrossRef]
  40. Ma, S.; Qi, Y.-X.; Jiang, X.-Q.; Chen, J.-Q.; Zhou, Q.-Y.; Shi, G.; Zhang, M. Selective and sensitive monitoring of cerebral antioxidants based on the dye-Labeled DNA/polydopamine conjugates. Anal. Chem. 2016, 88, 11647–11653. [Google Scholar] [CrossRef] [PubMed]
  41. Zhou, Y.H.; Cheng, Y.; Xu, J.; Lin, H.; Wang, Y.S. Thermo-enhanced upconversion luminescence in inert-core/active-shell UCNPs: The inert core matters. Nanoscale 2021, 13, 6569–6576. [Google Scholar] [CrossRef] [PubMed]
  42. Huang, Z.Y.; Gao, H.P.; Mao, Y.L. Understanding the effect of Mn2+ on Yb3+/Er3+ upconversion and obtaining a maximum upconversion fluorescence enhancement in inert-core/active-shell/inert-shell structures. RSC Adv. 2016, 6, 83321–83327. [Google Scholar] [CrossRef]
  43. Zuo, J.; Tu, L.; Li, Q.; Feng, Y.; Que, I.; Zhang, Y.; Liu, X.; Xue, B.; Cruz, L.J.; Chang, Y.; et al. Near infrared light sensitive ultraviolet−blue nanophotoswitch for imaging-guided “Off−On” therapy. ACS Nano 2018, 12, 3217–3225. [Google Scholar] [CrossRef]
  44. Kamaç, M.B.; Altun, M.; Yilmaz, M.; Aktan, A.Y.; Aktan, S.; Sezgintürk, M.K. Point-of-care testing: A disposable label-free electrochemical CA125 and HE4 immunosensors for early detection of ovarian cancer. Biomed. Microdevices 2023, 25, 18. [Google Scholar]
  45. Kamaç, M.B.; Altun, M.; Yilmaz, M.; Sezgintürk, M.K. A label-free dual immunosensor for the simultaneous electrochemical determination of CA125 and HE4 biomarkers for the early diagnosis of ovarian cancer. Anal. Bioanal. Chem. 2023, 415, 1709–1718. [Google Scholar] [CrossRef] [PubMed]
  46. Xu, S.; Dong, B.; Zhou, D.L.; Yin, Z.; Cui, S.B.; Xu, W.; Chen, B.J.; Song, H.W. Paper-based upconversion fluorescence resonance energy transfer biosensor for sensitive detection of multiple cancer biomarkers. Sci. Rep. 2016, 6, 23406. [Google Scholar] [CrossRef] [PubMed]
  47. Li, R.; Feng, F.; Chen, Z.Z.; Bai, Y.F.; Guo, F.F.; Wu, F.Y.; Zhou, G. Sensitive detection of carcinoembryonic antigen using surface plasmon resonance biosensor with gold nanoparticles signal amplification. Talanta 2015, 140, 143–149. [Google Scholar] [CrossRef] [PubMed]
  48. Lin, Z.; Zhang, G.; Yang, W.; Qiu, B.; Chen, G. CEA fluorescence biosensor based on the FRET between polymer dots and Au nanoparticles. Chem. Comm. 2012, 48, 9918–9920. [Google Scholar] [CrossRef]
  49. Li, X.H.; Sun, W.M.; Wu, J.; Gao, Y.; Chen, J.H.; Chen, M.; Ou, Q.S. An ultrasensitive fluorescence aptasensor for carcino-embryonic antigen detection based on fluorescence resonance energy transfer from upconversion phosphors to Au nanoparticles. Anal. Methods 2018, 10, 1552–1559. [Google Scholar] [CrossRef]
  50. Bhuckory, S.; Wegner, K.D.; Qiu, X.; Wu, Y.T.; Jennings, T.L.; Incamps, A.; Hildebrandt, N. Triplexed CEA-NSE-PSA immunoassay using time-gated terbium-to-quantum dot FRET. Molecules 2020, 25, 3679. [Google Scholar] [CrossRef] [PubMed]
  51. Qian, J.; Wang, C.Q.; Pan, X.H.; Liu, S.Q. A high-throughput homogeneous immunoassay based on Förster resonance energy transfer between quantum dots and gold nanoparticles. Anal. Chim. Acta 2013, 763, 43–49. [Google Scholar] [CrossRef] [PubMed]
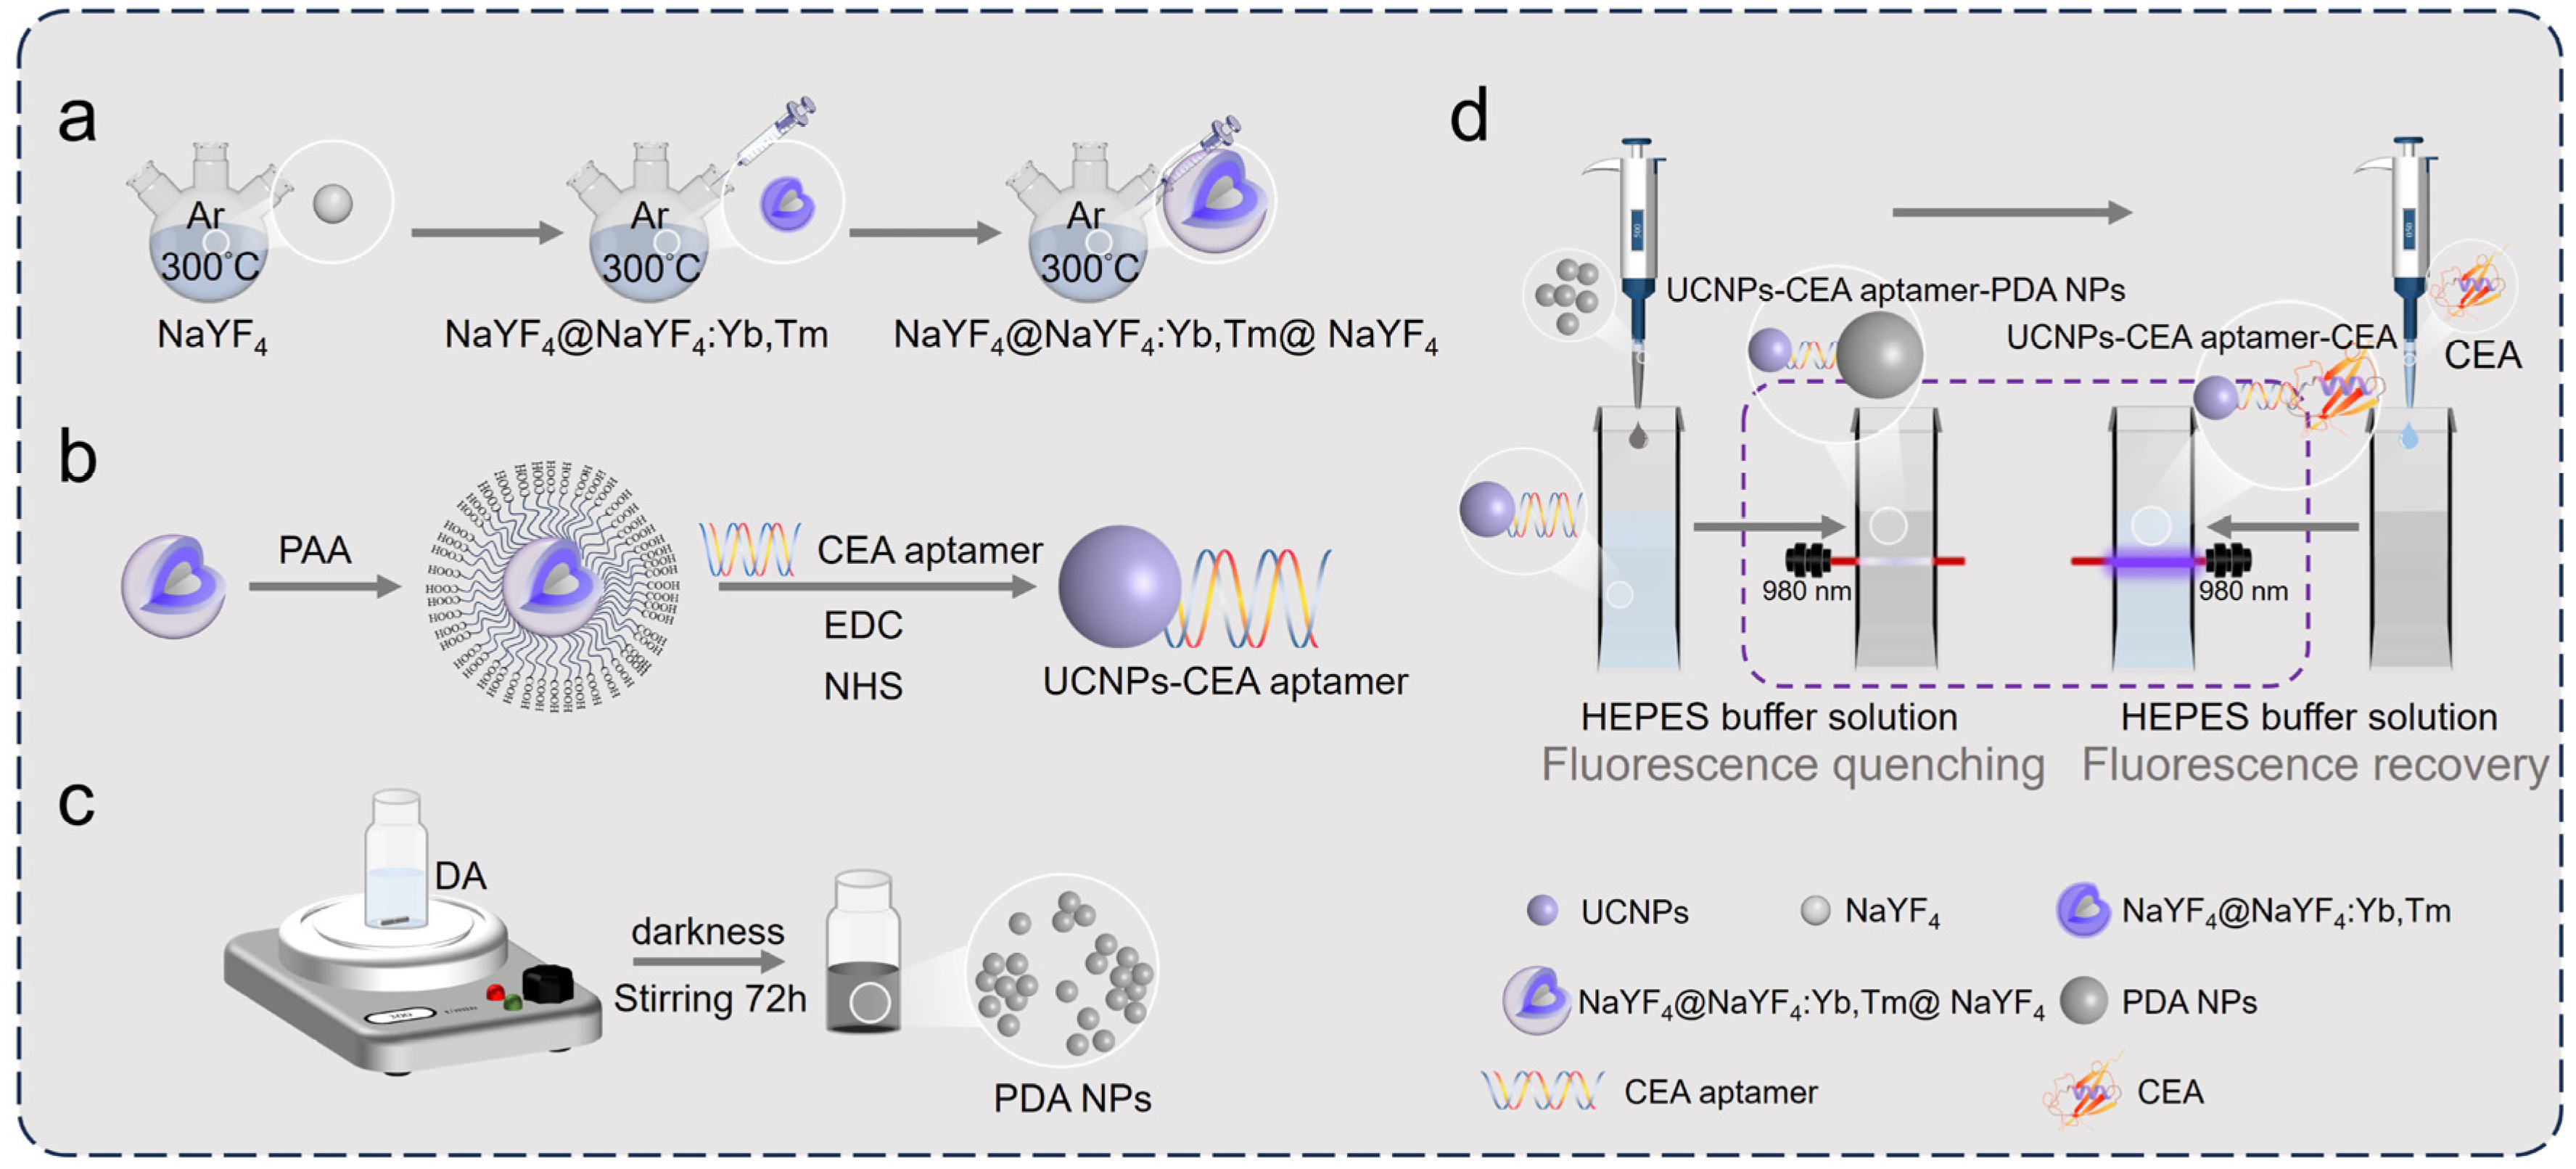
Figure 1. A schematic illustration of the formation of a biosensor for detecting carcinoembryonic antigen (CEA) based on upconversion nanoparticles (UCNPs)-polydopamine nanoparticles (PDA NPs): (a) the synthesis process of NaYF4@NaYF4:Yb,Tm@NaYF4 core–shell–shell UCNPs; (b) the construction of the UCNP and CEA aptamer combination; (c) polydopamine synthesis; (d) the fluorescence quenching and fluorescence recovery processes of the detecting system.
Materials 18 00796 g001
Figure 2. Characterization of synthesized nanoparticles: (a) HAADF-STEM image of NaYF4@NaYbF4:1%Tm@NaYF4 core–shell–shell nanoparticles; (b) scanning TEM image and element mappings of Tm, Yb, Y, and Na, with an overlap of Y, Tm, and Yb for the sample in panel a; (c) the particle size distribution of the sample in panel a; (d) high-resolution TEM image of one NaYF4@NaYbF4:1%Tm@NaYF4 core–shell–shell nanoparticle; (e) XRD image of NaYF4@NaYbF4:1%Tm@NaYF4 and the standard card (JCDSP No. 16-0334).
Materials 18 00796 g002
Figure 3. (a) FTIR spectra of NaYF4@NaYbF4:1%Tm@NaYF4 (without an organic layer, bule line), and NaYF4@NaYbF4:1%Tm@NaYF4-CEA aptamer (green line); (b) UV–vis absorption spectra of NaYF4@NaYbF4:1%Tm@NaYF4 and NaYF4@NaYbF4:1%Tm@NaYF4-CEA aptamer; (c) FTIR spectra of dopamine and PDA NPs; (d) absorption spectra of PDA NPs, and emission spectra of NaYF4@NaYbF4:1%Tm@NaYF4 UCNPs.
Materials 18 00796 g003
Figure 4. (a) Fluorescence quenching of NaYF4@NaYbF4:1%Tm@NaYF4-CEA aptamer system with different concentrations of PDA NPs (the reaction time was fixed at 20 min); (b) reaction-time-dependent fluorescence quenching of NaYF4@NaYbF4:1%Tm@NaYF4-CEA aptamer-PDA system (the concentration of PDA NPs was fixed at 0.35 μg/μL).
Materials 18 00796 g004
Figure 5. (a) Fluorescence recovery of Y@99Yb1Tm@Y-CEA aptamer-PDA NP system with different CEA concentrations; (b) fluorescence recovery of Y@20Yb0.2Tm@Y-CEA aptamer-PDA NP system with different CEA concentrations; (c) steady-state emission spectra of two types of UCNP under 980 nm laser irradiation (0.80 W cm−2); (d) relative fluorescence intensity of sensor (0.01 mg/mL) in presence of Gly (1.0 μg/mL), L-AscH2 (1.0 μg/mL), L-Cys (1.0 μg/mL), Glu (1.0 μg/mL), BSA (1.0 μg/mL), NaCl (1.0 μg/mL), and CEA (50 ng/mL). Experiments were performed in HEPES buffer (10 mM, pH 7.4).
Materials 18 00796 g005
Figure 6. Fluorescence recovery of Y@99Yb1Tm@Y-CEA aptamer-PDA NPs system with different CEA concentrations in diluted fetal bovine serum.
Materials 18 00796 g006
Table 1. The reported CEA detection limits of several different fluorescence resonance energy transfer (FRET)-based sensors.
Type of SensorLabelLimit of Detection (LOD) (ng/mL)Linear Concentration RangeReference
FRETUCNPs@PDA/AuNPs-CEA aptamer0.0310.1 ng/mL
to 100 ng/mL
[29]
FRETMagnetic NPs/UCNPs0.10.1 ng/mL
to 40 ng/mL
[14]
FRETUCNPs/FITC0.890.1 ng/mL
to 100 ng/mL
[46]
FRETUCNPs/carbon nanoparticle1.01 ng/mL
to 60 ng/mL
[47]
FRETPoly(9,9-dioctylfluorenyl-2,7-diyl) dots (PFO dots)/Au-NPs2.00.1 ng/mL
to 10 ng/mL
[48]
FRETUCNPs/Au-NPs0.020.05 ng/mL
to 2.0ng/mL
[49]
FRETTime-gated terbium/quantum dots3.60 ng/mL
to 120 ng/mL
[50]
FRETQuantum dots/gold nanoparticles0.31 ng/mL
to 110 ng/mL
[51]
FRETQuantum dots/tyramide Alexa 5940.280.08 ng/mL
to 20 ng/mL
[10]
FRETUCNPs/PDA NPs0.0117
or 1.14
0 ng/mL
to 1.5 ng/mL
or 1.5 ng/mL
to 250 ng/mL
This work
Table 2. Recoveries of CEA in diluted fetal bovine serum with Y@99Yb1Tm@Y-CEA aptamer-PDA NPs aptasensor (the relative standard deviation (RSD) between three parallel experiments (n = 3)).
Sample No.Added (ng/mL)Found (ng/mL)Recovery (%)Relative Standard Deviation (%, n=3)
10.50.48296.42.34
21.51.46797.764.13
31010.872108.73.5
45046.192.25.65
Disclaimer/Publisher’s Note: The statements, opinions and data contained in all publications are solely those of the individual author(s) and contributor(s) and not of MDPI and/or the editor(s). MDPI and/or the editor(s) disclaim responsibility for any injury to people or property resulting from any ideas, methods, instructions or products referred to in the content.