Article

Different Methods for Calculation of Activation Energies During Non-Isothermal Annealing of Mg72Zn27Pt1 and Mg72Zn27Cu1 Metallic Glasses

1
Faculty of Foundry Engineering, AGH University of Krakow, 30 Mickiewicza Street, 30-059 Kraków, Poland
2
Foundry Institute, Technische Universität Bergakademie Freiberg, 4 Bernhard-von-Cotta-Str., 09599 Freiberg, Germany
*
Authors to whom correspondence should be addressed.
Materials 2025, 18(3), 694; https://doi.org/10.3390/ma18030694
Submission received: 31 December 2024 / Revised: 30 January 2025 / Accepted: 3 February 2025 / Published: 5 February 2025

Abstract

:
Mg72Zn27Pt1 and Mg72Zn27Cu1 metallic glasses were produced using a melt-spinner. Their crystallization kinetics were investigated during annealing with five heating rates using DSC. Amorphous Mg72Zn27Pt1 crystallized in the form of one and Mg72Zn27Cu1 crystallized in the form of two exothermic crystallization peaks. It was noticed that the glass transition, the onset crystallization and the crystallization peak temperatures were strongly heating-rate-dependent. The addition of Pt and Cu increased the stability compared to that of binary Mg-Zn glass, and especially so with Pt, due to its higher melting point and different atom size to those of Mg and Zn. The activation energies were calculated using six model-free methods: the Kissinger, Ozawa–Flynn–Wall, Boswell, Tang, Augis–Bennett and Gao–Wang methods. The Augis–Bennett and Gao–Wang methods allow for the calculation of only the activation energy at the crystallization peak but they are the only ones that consider T x or d x / d T . For Mg72Zn27Pt1, the calculated values fluctuate in the ranges 114.60–117.99 kJ/mol, 102.46–105.98 kJ/mol and 71.16–98.62 kJ/mol for E g , E x and E p , respectively, whereas, for Mg72Zn27Cu1, the calculated values are in the ranges of 98.51–101.77 kJ/mol, 95.15–98.51 kJ/mol and 55.15–93.34 kJ/mol for E g , E x and E p , respectively. Both alloys are meta-stable in the amorphous state and crystallization occurs spontaneously. The Kissinger, Ozawa–Flynn–Wall, Tang and Boswell methods give similar values for the activation energy. The Gao–Wang method significantly underestimates values compared to other methods. The Augis–Bennett method shows much lower values for the local activation energy. Considering the ease of their formulas, best convergence and widespread use in the literature, the Kissinger and Ozawa–Flynn–Wall methods will work very well for any comparison.

1. Introduction

In recent years, growing interest in metallic glasses has been observed. This is due to their unique properties such as their high strength or high corrosion and abrasion resistance [1,2,3]. Amorphous metals are alloys without a long-range atomic arrangement, obtained usually by rapid solidification. However, metallic glasses are energetically meta-stable materials. Their non-crystalline state can easily transform into crystalline over time, especially with increasing temperature. This involves a complete change in their properties. The thermal stability and properties of each metallic glass strictly depend on its chemical composition [1,2,3].
The crystallization behavior and the thermal stability of amorphous alloys have still not been thoroughly investigated, although many studies have been conducted. Differential Scanning Calorimetry (DSC) is the most frequently used technique to attempt to understand these issues [1,4]. The interpretation of DSC thermograms designates values to characteristic temperatures such as the glass transition temperature T g , onset crystallization temperature T x , crystallization peak temperature T p and melting point T m . The data from thermograms can be used to determine the kinetic parameters of the analyzed process like the activation energy, reaction model, reaction constants or pre-crystallization kinetics [1,2,4]. DSC experiments can be carried out in both isothermal and non-isothermal conditions. To calculate the activation energy of a transition, it is necessary to use annealing with a few different heating rates.
The activation energy of a transition is an important kinetic parameter during the analysis of the crystallization of the amorphous alloy. This corresponds to the value of energy that is necessary to overcome the energy barrier and initiates, e.g., the rearrangement of atoms, nucleation or crystal growth [3]. In the literature, there are several methods used to calculate the activation energy of reactions. The main classification of these methods involves isokinetic techniques (e.g., the JMA model [5,6] and the Matusita–Sakka [7]) and iso-conversional techniques (e.g., the Kissinger [8], Ozawa–Flynn–Wall [9,10], Boswell [11], Tang [12], Augis–Bennett [13], Gao–Wang [14] and Friedman methods [15]). In isokinetic (model-fitting) methods, the reaction rate is constant over a full range of temperatures or times. Thus, the kinetic parameters are assumed to also be constant with time and temperature. However, in iso-conversional (model-free) methods, the reaction rate is only a function of temperature (for a constant degree of transformation), but kinetic parameters are dependent on the transformation degree at any time and the temperature.
Numerous metallic glasses have been synthesized in binary, ternary, quaternary and more complex alloy systems, but the relative ease of the glass transition is guaranteed by the choice of more element systems [2]. So far, Mg72Zn27Pt1 and Mg72Zn27Ag1 amorphous alloys have, in part, been examined, with particular emphasis on the crystallization mechanism (using DSC and the Jeziorny–Avrami method) and the interpretation of phases arising during the heating process (using XRD) [16]. This article aims to determine the values of characteristic and local activation energies during non-isothermal annealing of amorphous Mg72Zn27Pt1 and Mg72Zn27Cu1 alloys with different heating rates. In this work, only the first Mg72Zn27Cu1 crystallization peak was analyzed for a representative comparison for both alloys. For the calculation, six iso-conversional methods (Kissinger, Ozawa–Flynn–Wall, Boswell, Tang, Augis–Bennett and Gao–Wang) were used and all the results were compared to each other. The aim is to explain the differences between the mentioned methods and to indicate the most advantageous one.

2. Materials and Methods

The crystalline base alloys were prepared by melting in an induction furnace under argon. The metal was cast in a cylindrical metal mold. Samples up to 10 mm wide were cut from the ingots. The samples were rinsed in acetone and dried, then placed in a glass capsule. The prepared capsules were placed individually in a melt-spinner with a built-in induction furnace and a copper wheel for rapid solidification. The linear speed of the wheel was 50 m/s. The thin ribbons of amorphous Mg72Zn27Pt1 and Mg72Zn27Cu1 alloy were manufactured under an argon atmosphere.
The ribbon amorphousness was confirmed using X-ray diffraction by a Panalytical Empyrean diffractometer equipped with a Cu Kα X-ray source. Additionally, amorphousness was confirmed during SEM observations using a TESCAN VEGA 3 microscope (Brno, Czech Republic).
Then, five specimens of the ribbon of about 10.2–17.1 mg weight were individually annealed from room temperature to 723 K at heating rates β = 5, 10, 20, 40 and 80 K/min. The thermal behavior of these samples was investigated using a differential scanning calorimeter TA DSC Q20 (Eschborn, Germany) under a flowing argon gas atmosphere (40 mL/min). All required parameters for applying the kinetic equations were recorded by DSC during the experiment.

3. Results

On the XRD pattern of amorphous Mg72Zn27Pt1 and Mg72Zn27Cu1 (Figure 1a), the wide and high halo peaks are visible in the area equal to 32–45 and 60–70. There are no significant crystallinity peaks, which confirms the amorphous structure of the samples. However, there is a visible variation in the intensities for those samples originating from different measurement time; hence, it is hard to tell the difference. Therefore, normalization of the XRD patterns is helpful to judge the difference between them (Figure 1b). As is apparent, the differences are marginal, suggesting similar disorder in both alloys. Moreover, the SEM images presented in Figure 2 allow one to assume that no visible grains appeared in the structure of the produced metallic glasses.
The DSC thermograms of the amorphous Mg72Zn27Pt1 and Mg72Zn27Cu1 for various heating rates are shown in Figure 3. On the DSC thermogram, there is only one exothermic peak that matches the crystallization (Figure 3a). However, high-temperature XRD research on amorphous Mg72Zn27Pt1 [16] showed reflections corresponding to α-Mg and Mg12Zn13, whereas two exothermic peaks corresponding to crystallization and one endothermic peak corresponding to melting are visible on each curve for Mg72Zn27Cu1 (Figure 3b). This work will only include calculations for the first crystallization peak of Mg72Zn27Cu1.
The values of the glass transition temperature T g , onset crystallization temperature T x , crystallization peak temperature T p and end of crystallization temperature T x _ e n d are estimated and compiled in Table 1. β [K/min] represents the heating rate. In order to determine T g , a bend in the curve was sought before the crystallization peak occurred. T g is the midpoint between heat flow baselines (inset in Figure 3a). In order to determine T x , two tangents were determined, first at the baseline and the second along the increasing side of the peak; T x is their intersection (inset in Figure 3a). T p corresponds to the temperature at the maximum of the peak. To estimate T x _ e n d , two tangents were used, similarly to T x , first on the decreasing side of peak and the second at the baseline in the melting direction; the value sought is the intersection of the tangents. Additionally, in the curves presented in Figure 3, it can be observed that the amount of heat obtained from the endothermic peak is about three times greater than the total amount of heat obtained from the exothermic peaks. A. Calka et al. in their publication [17] observed the same phenomenon. This phenomenon is probably due to the large excess specific heat of the supercooled liquid relative to the solid and perhaps a small loss of enthalpy during heating to the crystallization temperature.
The values of T g , T x , T p and the end of crystallization temperatures T x _ e n d are estimated using tangents and are compiled in Table 1. All the mentioned temperatures increase with the heating rate. Moreover, at lower heating rates, the crystallization peaks are small and narrow, which means that at higher heating rates, a greater thermal effect is achieved. This shows that the transition behavior of amorphous Mg72Zn27Pt1 and Mg72Zn27Cu1 alloy is dependent on the heating rate. This is caused by the thermal activation of the nucleation and grain growth for the crystallization process and amorphous relaxation for the glass transition area [3].
The data given in Table 1 allow one to determine the thermal stability of the amorphous phase. The thermal stability of the amorphous phase can be estimated based on the glass transition temperature ( T g ), crystallization temperature ( T x ) and T x = T g T x , which is defined by the temperature difference between T g and T x . T x is the area of the supercooled liquid before crystallization during heating of the amorphous phase. For the platinum-containing alloy, T x varies from 10.92 K to 18.77 K, while for the copper-containing alloy, T x varies from 10.56 K to 13.95 K. Since the large T x of the amorphous alloy is attributed to the slow kinetics of nucleation and growth in the supercooled liquid, the high glass forming ability (GFA) of the amorphous alloy can be inferred from the large T x .
The addition of platinum and copper increases the T x value compared to that of binary amorphous Mg72Zn28 [18] to about 48–62 K (dependent on the heating rate) and 30–43 K for Mg72Zn27Pt1 and Mg72Zn27Cu1, respectively. The reason for this is the higher melting point for platinum (1768.3 °C/2041.4 K) [19] and zinc (1084.6 °C/1358.7 K) [19].
There have been some other DSC studies on three- and four-component amorphous alloys with bases of Mg and Zn. The addition of calcium in amorphous Mg72Zn24Ca4 [20] significantly shifts the onset of crystallization towards higher temperatures by ~100 K. Similarly to the investigated alloys, the characteristic temperatures increase with heating rates. Two overlapping peaks are also visible for 5 and 10 K/min, but for 20–80 K/min, there is only one crystallization peak. For three amorphous alloys with the addition of 4 at% of Ag [21], a non-isothermal experiment was performed with heating rates 5, 10, 20 and 40 K/min. The characteristic temperatures also increase with heating rates. For Mg73Zn23Ag4 and Mg70Zn26Ag4, there are also two overlapping peaks visible, but, for Mg67Zn28Ag4, there exists a third peak in the range 481.1–501.2 K. The relative current volume of crystalline phase x was calculated using definite integrals, as follows [22]:
x = T x T d H d T d T T x T x _ e n d d H d T d T
where T [K] is a given temperature, T x [K] is the onset of crystallization, T x _ e n d [K] is the end of crystallization and H [W/g] is the heat flow. In other words, the relative current volume corresponds to the area from under the curve between T x and a given temperature to the whole area under the crystallization peak.
All of the curves in Figure 4 display a characteristic sigmoidal style, as reported for different amorphous alloys during non-isothermal crystallization [3,16,18,20]. The temperature range of the crystallization process is much larger for higher heating rates.
Then, the activation energies of the glass transition, onset crystallization and peak of crystallization were calculated through the six chosen model-free methods based on the determined T g , T x and T p values, respectively. The rules of plotting in either approach are collected in Table 2. Every graph shows five points, each of which corresponds to the value of the heating rate. On their basis, a trend line is created, and its slope multiplied by the appropriate parameter (Table 2, column 6) allows for the calculation of the values of the activation energies.

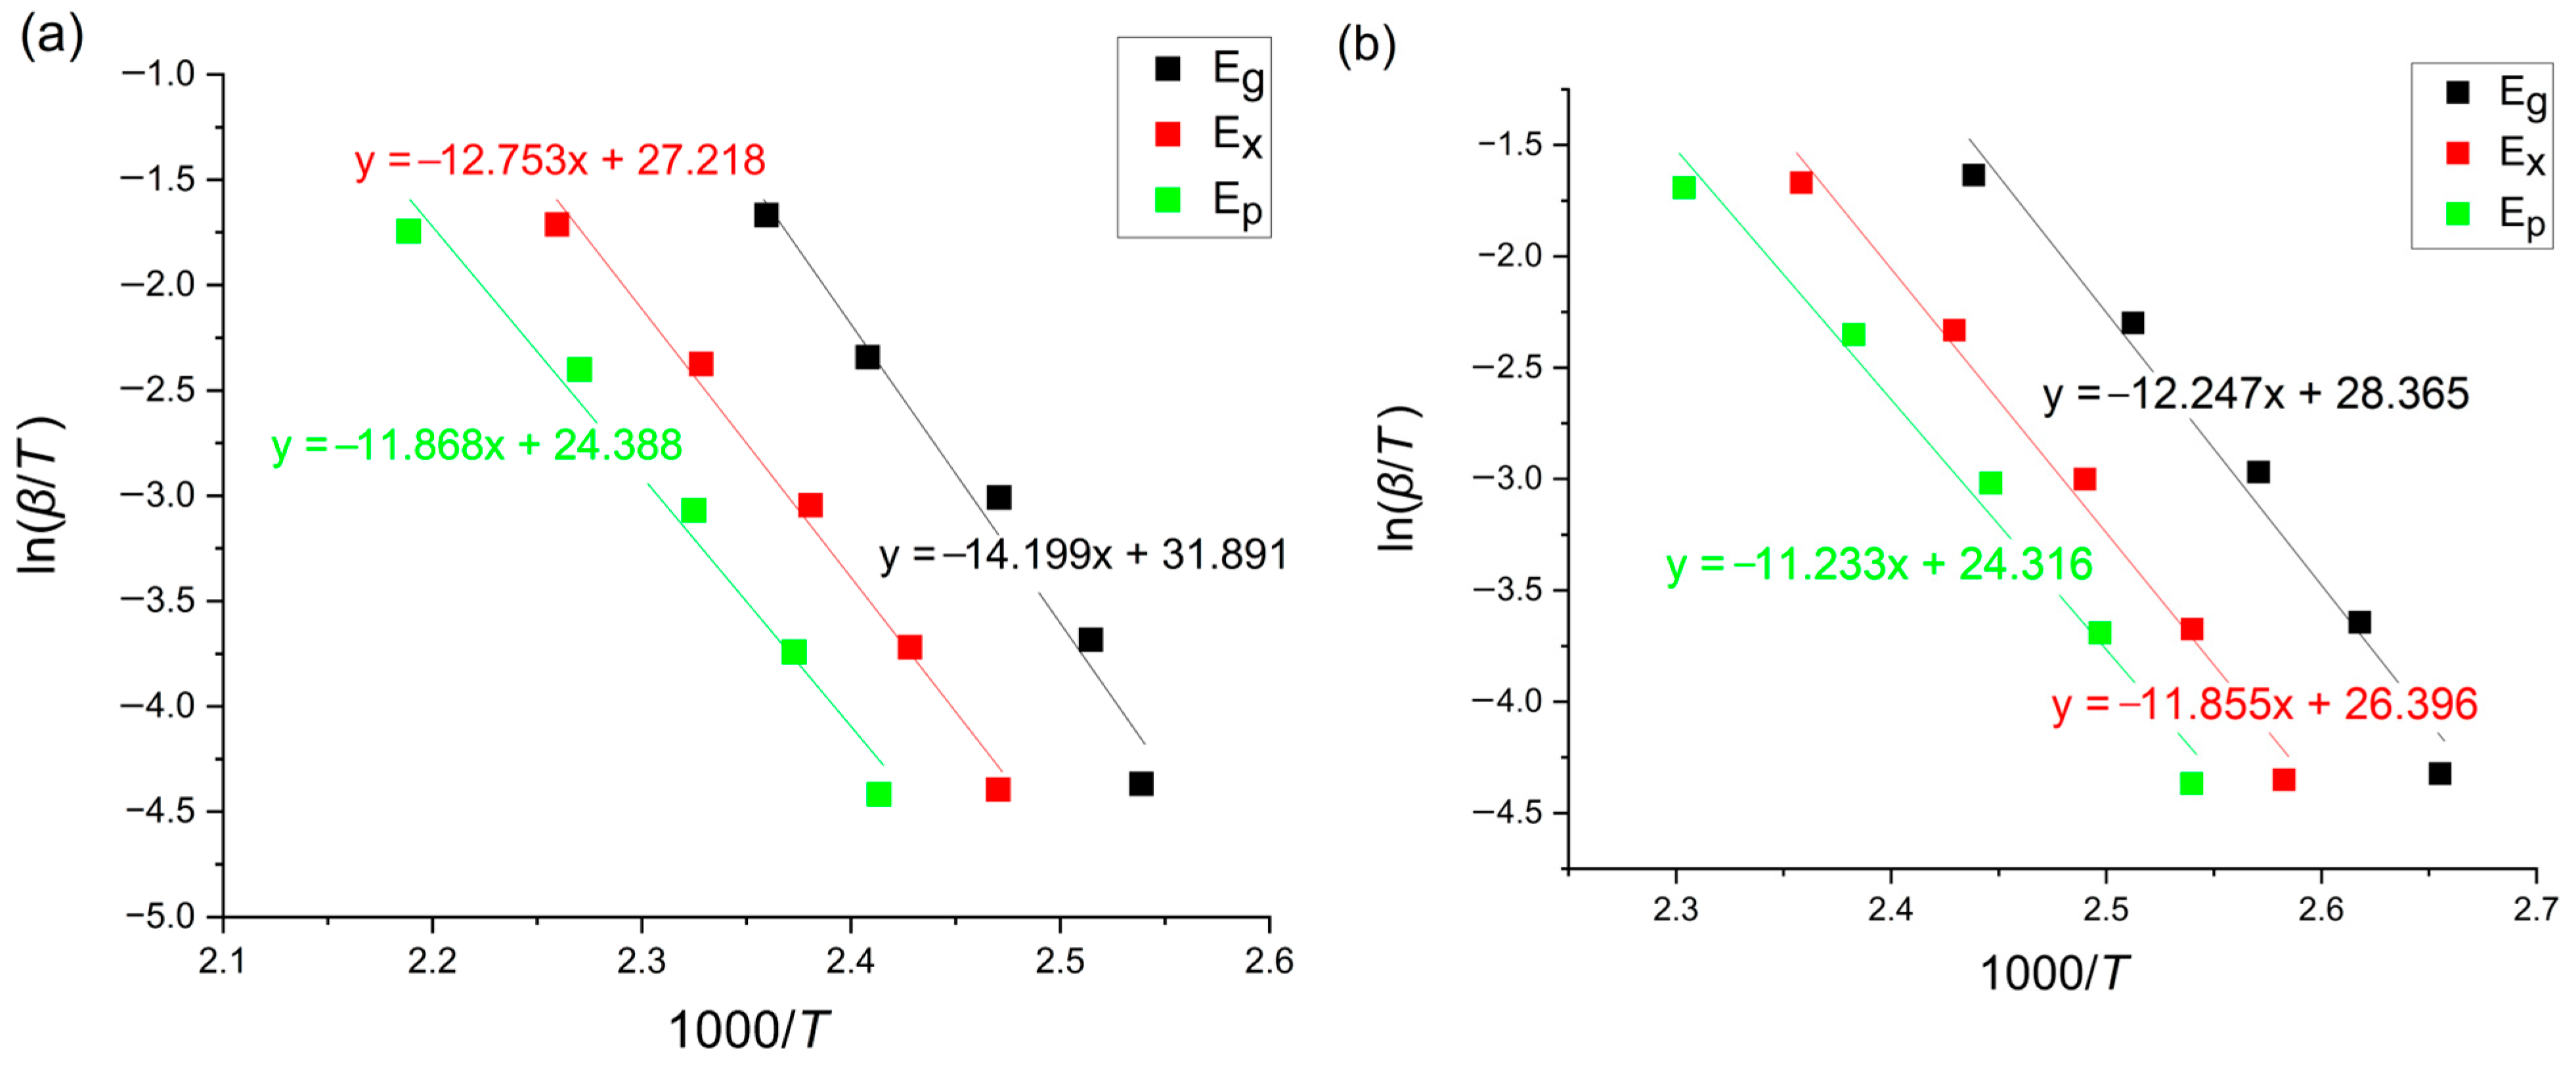
3.1. Kissinger Method

According to the popular Kissinger method, the activation energies of the reaction are calculated using the following equation [8,22]:
l n β T 2 = E R T + ln k 0 R E
where β [K/min] is the heating rate, T is a given temperature, E [kJ/mol] is an activation energy, R is the universal gas constant equaling 8.31 [J/mol K] and k 0 [ s 1 ] is the pre-exponential factor. The Kissinger plots for the glass transition, onset of crystallization and crystallization peak region are presented in Figure 5.

3.2. Ozawa–Flynn–Wall Method (OFW)
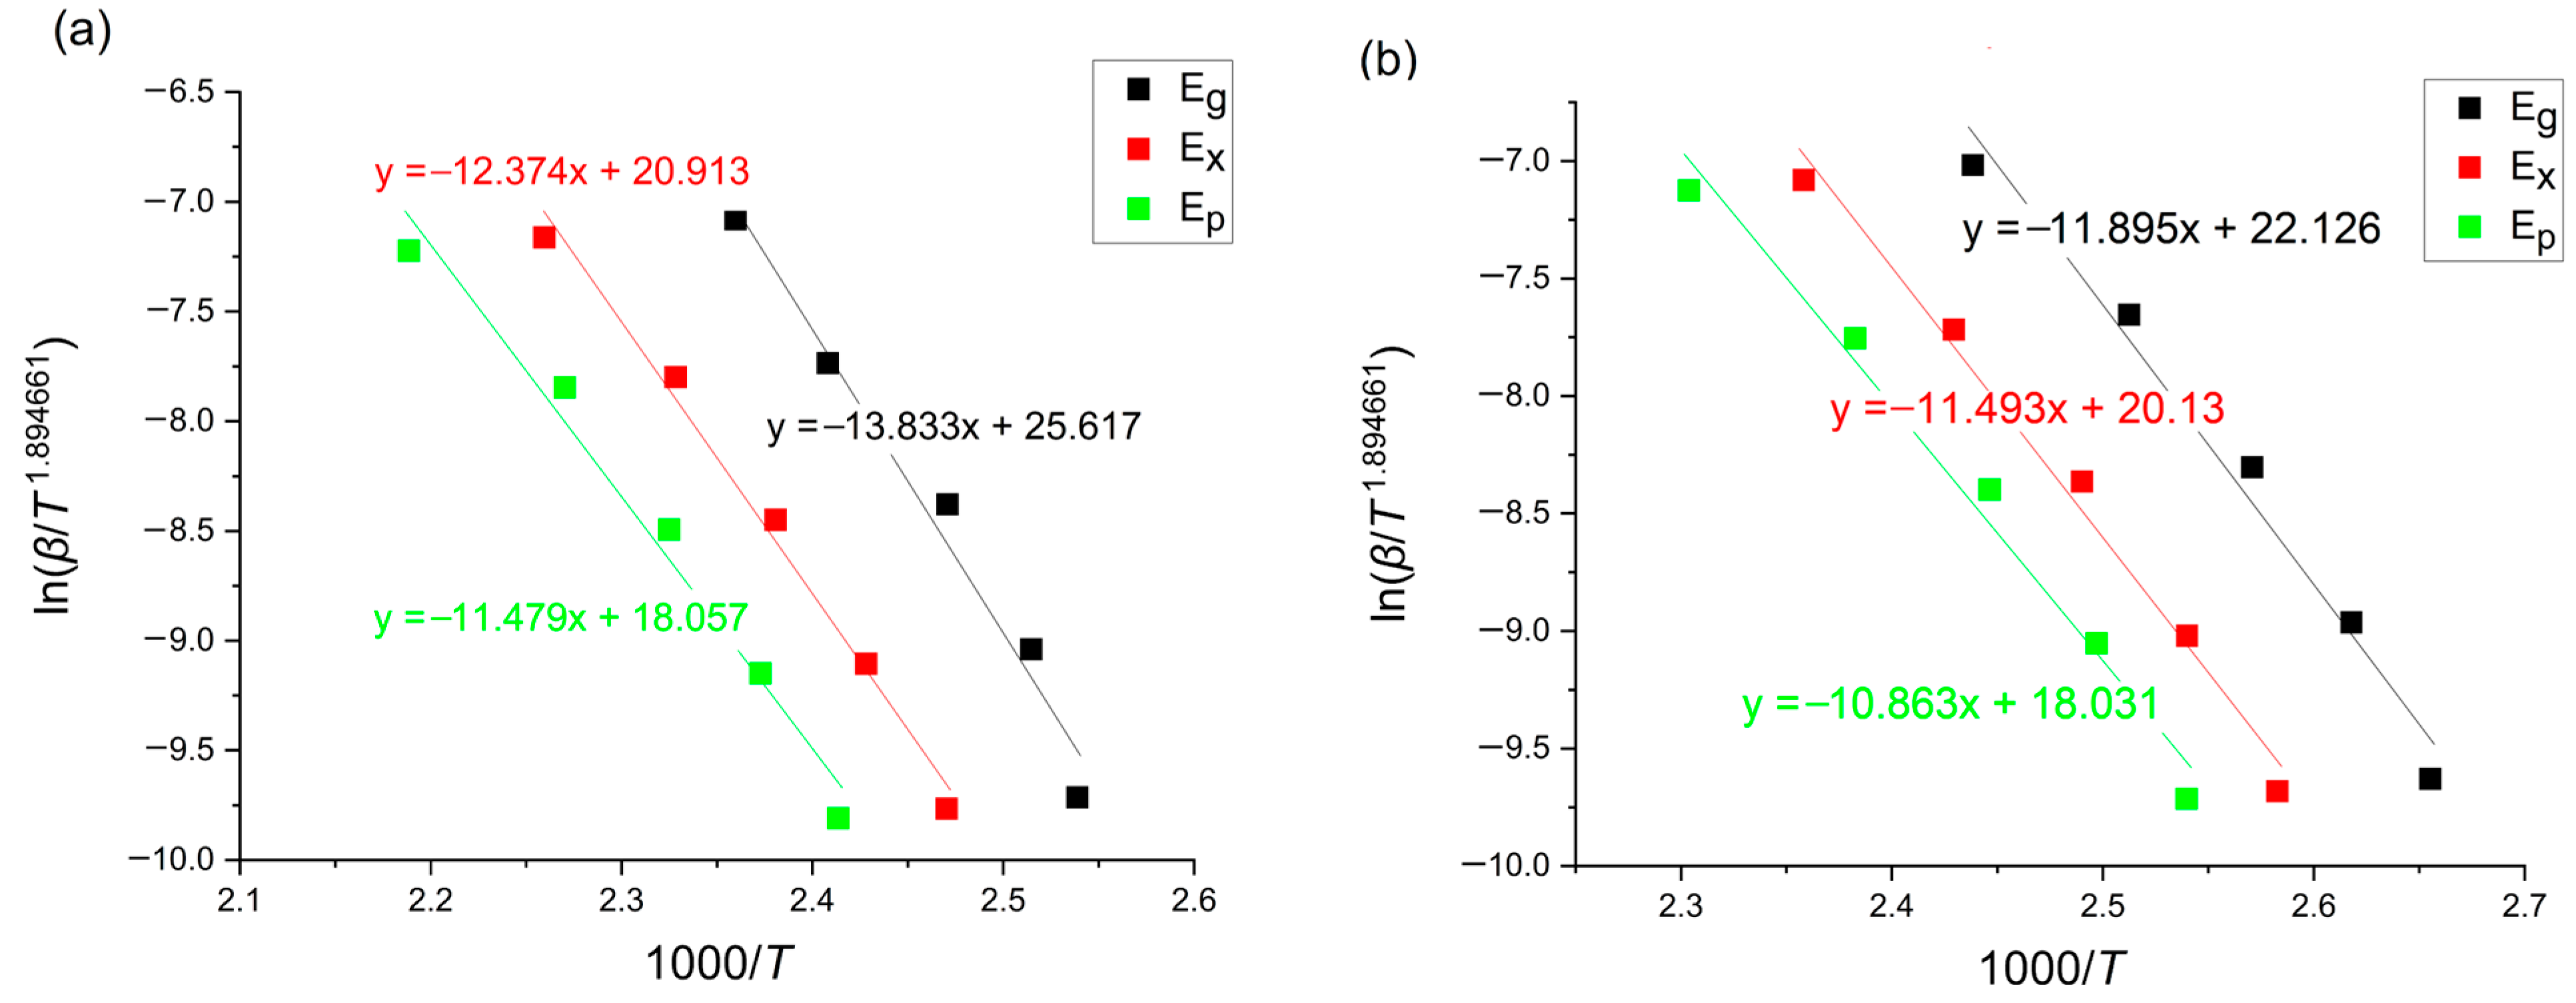
In the OFW method, the activation energies of the reaction are calculated through the following equation [9,10,21]:
l n β = 1.0516 E R T + c o n s t
where β [K/min] is the heating rate, E [kJ/mol] is the activation energy, R is the universal gas constant equaling 8.31 [J/molK] and T is a given temperature. The OFW plots for the three analyzed regions are shown in Figure 6.

3.3. Boswell Method

According to the Boswell method, the values of the activation energies are calculated through the following equation [11,22]:
l n β T = E R T + c o n s t
where β [K/min] is the heating rate, T is a given temperature, E [kJ/mol] is the activation energy and R is the universal gas constant equaling 8.31 [J/molK]. The Boswell plots for the glass transition, onset of crystallization and crystallization peak region are presented in Figure 7.

3.4. Tang Method

This method is based on the following equation [12,22]:
ln β T 1.894661 = 1.00145033 E R T + c o n s t
where β [K/min] is the heating rate, T is a given temperature, E [kJ/mol] is an activation energy and R is the universal gas constant equaling 8.31 [J/molK]. The Tang plots for the glass transition, onset of crystallization and crystallization peak region are presented in Figure 8.

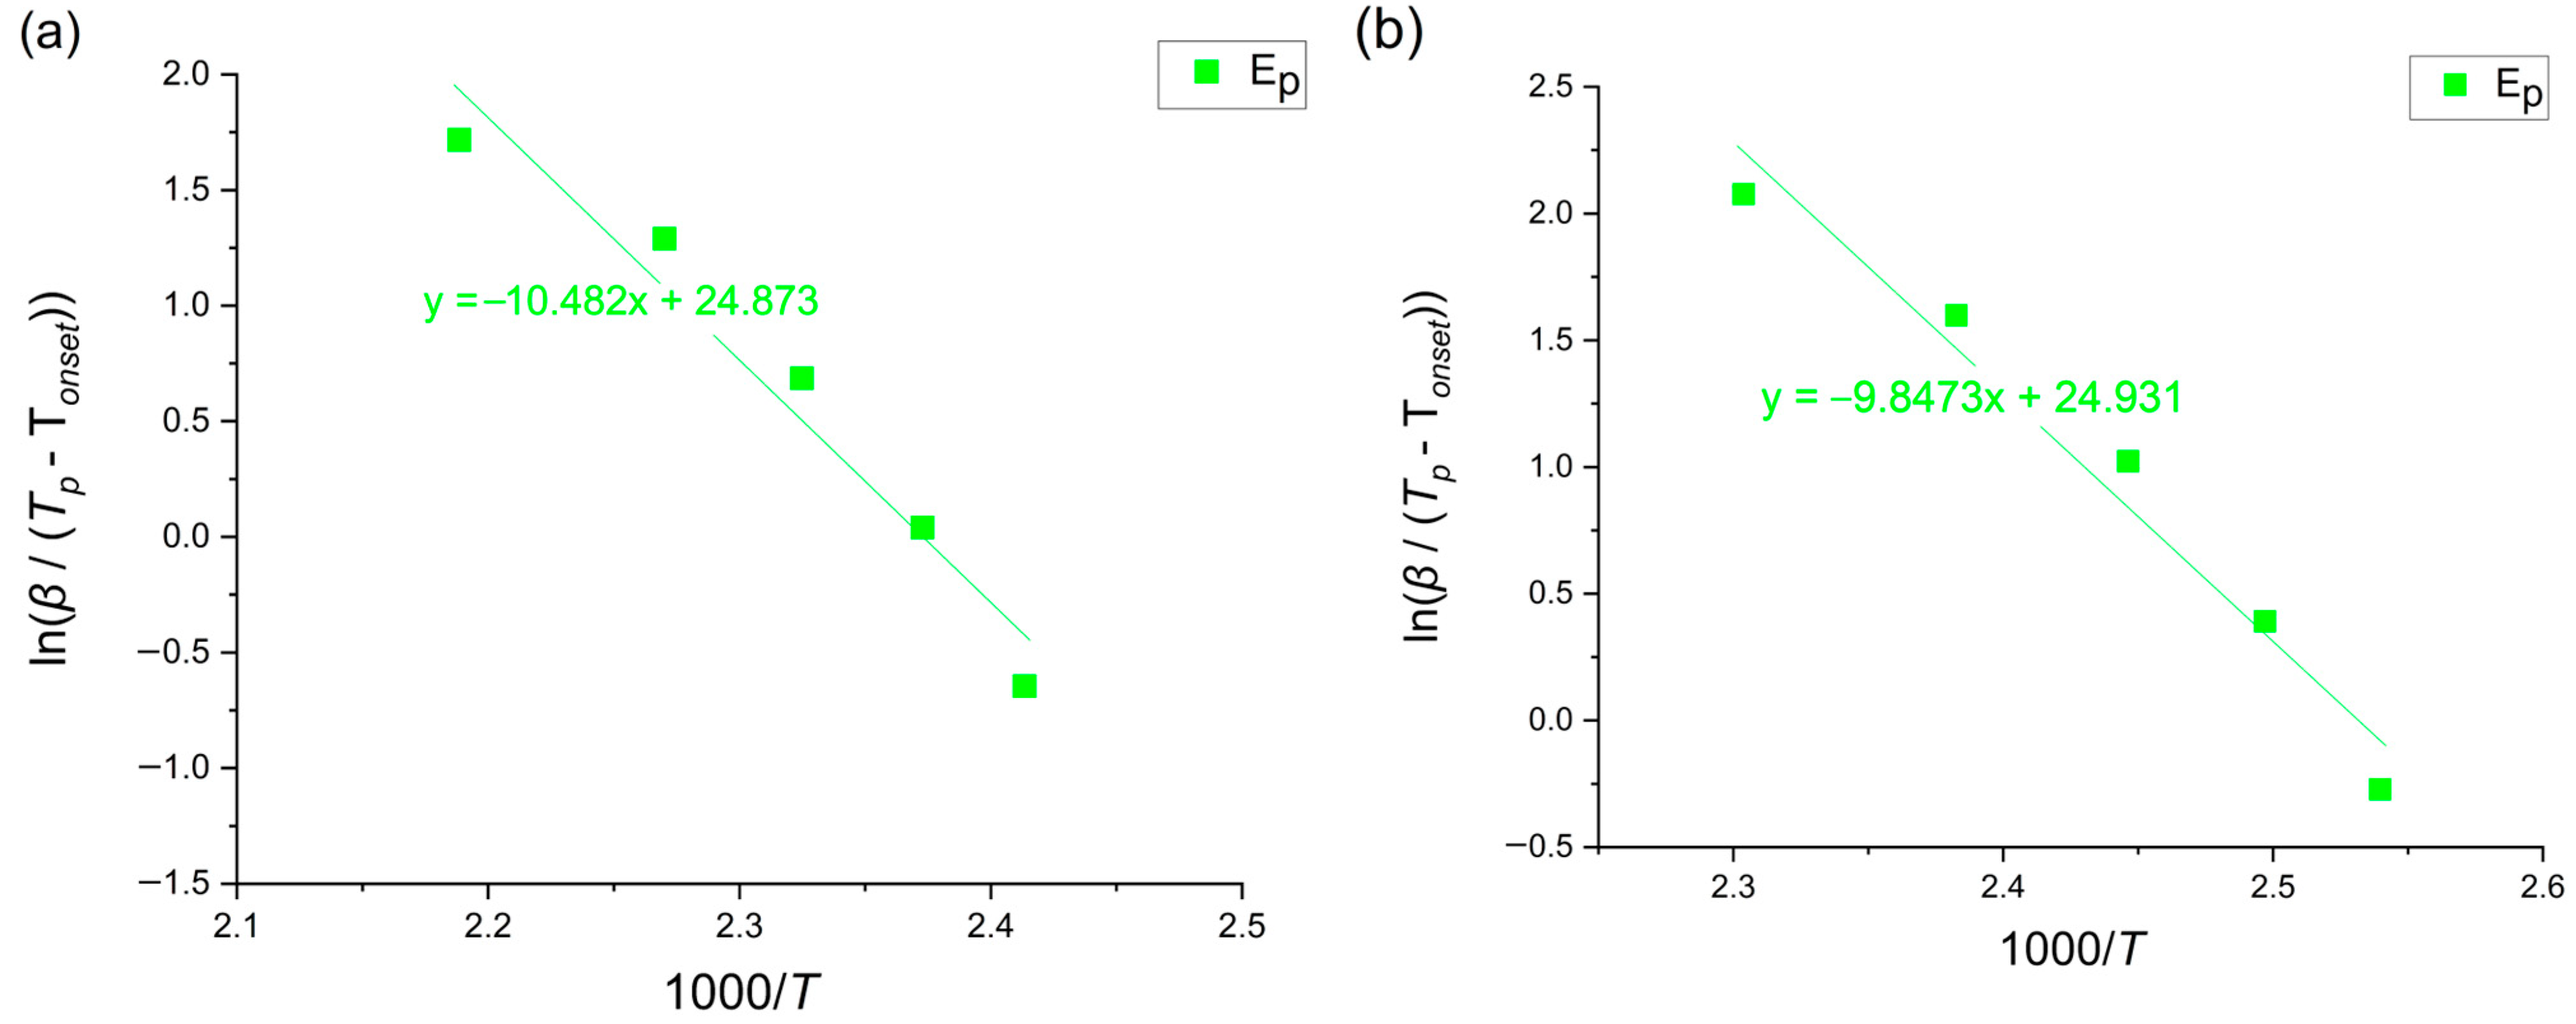
3.5. Augis–Bennett Method

This method allows for calculations only after crystallization has started, so, in this case, it is only possible to calculate the value at the peak. The activation energy can be calculated using the following equation [13,22]:
l n β T T x = E R T + ln k 0
where β [K/min] is the heating rate, T [K] is a given temperature, T x [K] is the onset of crystallization temperature, E [kJ/mol] is the activation energy, R is the universal gas constant equals 8.31 [J/molK] and k 0 [ s 1 ] is the pre-exponential factor. The Augis–Bennett plots for the crystallization peak region are presented in Figure 9.

3.6. Gao–Wang Method

The Gao–Wang method [14] is a special version of the Friedman method [15], which allows one to also determine the value of the activation energy at the crystallization peak temperature. It includes the d x / d T ratio at the peak point. The activation energy value was calculated through the following equation [14]:
ln β d x d T p = E R T + c o n s t
where β [K/min] is the heating rate, d x / d T [K] is the increase in the crystallized volume with the given temperature, E [kJ/mol] is the activation energy, R is the universal gas constant equaling 8.31 [J/molK], T [K] is a given temperature, and the Gao–Wang plot for the crystallization peak region is presented in Figure 10.
All of the calculated activation energies for the transitions are compared in Table 3. The most similar values are obtained using the Kissinger and Tang methods. The OFW method also gives values close to those provided by the Kissinger and Tang methods. The highest calculated values are obtained with the Boswell method (they are also not too different to the others). The Kissinger, Ozawa, Boswell and Tang methods have a similar equation structure and allow for the calculation of the activation energy of all the characteristic regions, i.e., the glass transition, crystallization onset and peak. The Kissinger method is undoubtedly the most common in the literature, which does not necessarily mean it has the highest accuracy. However, methods taking into account additional parameters ( T x and d x / d T ), such as the Augis–Bennett and Gao–Wang methods, give much lower results. As mentioned, the Augis–Bennett and Gao–Wang methods only allow for the calculation of the activation energy after the start of crystallization, in this case, only for the maximum crystallization peaks E p . For the Mg72Zn27Pt1 and the first Mg72Zn27Cu1 peak, the values obtained by the Augis–Bennett method are lower by only about 8 kJ/mol. The lowest and most inconsistent values were obtained using the Gao–Wang method.
The E g ,   E x   a n d   E p values correspond to the energy necessary for atomic rearrangement in the glass transition region, nucleation and crystal growth of each phase, respectively. Under normal conditions, the system tends to lower its energy. For both alloys, E g   > E x > E p , which indicates meta-stability in the amorphous state and that crystallization occurs spontaneously.
The values of the activation energy are higher for Mg72Zn27Pt1, which indicates its greater thermal stability due to the difference in the size of the atoms of all alloy components [16,19]. The atomic radius (van der Waals) equals 173 pm, 139 pm, 209 pm and 140 pm for Mg, Zn, Pt and Cu, respectively [19]. The more diverse the sizes of the constituent atoms in a metallic glass, the more stable it will be.
During non-isothermal annealing, the activation energy is not constant throughout the whole crystallization range. Hence, the values of the local activation energies were also calculated using the six methods described before. In each equation, the T parameter is the temperature corresponding to the same degree of crystallized volume (each 0.05) on every DSC curve. The E l o c values give information about the average activation energy at each analyzed crystallized volume. Kissinger’s method considering the temperature of the relative volume of the crystallized phase is called the Kissinger–Akahira–Sunose (KAS) modification [22].
The values obtained by the Kissinger, Ozawa, Boswell and Tang methods are quite similar. However, the results from the Augis–Bennett and Gao–Wang methods are much lower than those from the others. Despite this, in Figure 11, it is visible that the courses of all of the curves (created from calculated points) are very similar.
Mohammadi Rahvard et al. [23] calculated the values of E g ,   E x 1 ,   E p 1 , E x 2 , E p 2 for the Zr56Co28Al16 and Zr56Co24Ag4Al16 alloys using the Kissinger and Ozawa methods. Similarly to this work, these methods gave results relatively close to each other; they, on average, varied from 10 to 15 kJ/mol in each case, while in this work, the differences in the calculations using the Ozawa and Kissinger methods are only of the order of 2–3 kJ/mol. Moreover, as in this work, in [23], each selected method indicates dependencies E x > E p and E p 1 > E p 2 .
Razei-Shareza et al. [24] analyzed the activation energies of amorphous alloys (Fe41Co7Cr15Mo14Y2C15B6)100-xCux (where x = 0, 0.25 and 0.5 at.%) using the Kissinger–Akahira–Sunose (KAS), Ozawa–Flynn–Wall (OFW), Augis–Bennett and Gao–Wang methods. The values of the peak points calculated using these different methods differed significantly in each case. There was no clear relationship between the results, but most often (opposite to the findings of this work), the highest values were obtained using the Gao–Wang or Augis–Bennet methods, and the lowest were found with the OFW method. Additionally, in [24], the local energy values calculated by the KAS and OFW methods were very close, and the curves maintained a similar course.
Zhang [25] in his review describes selected kinetic methods in thermal analysis. Zhang considers the Kissinger and Ozawa methods to be the most popular and intended for simple reactions. According to [25], the Boswell and Augis–Bennett methods are methods intended for transformations in the solid state, whereas the Friedmann method (and also the Gao–Wang method based on the Friedmann method) shows a greater accuracy for complex systems. Therefore, methods based on Friedmann and intended for the analysis of transformations in a solid may provide greater accuracy for investigating alloys.
For analyzing complex crystallization processes with random nucleation, Zhang [25] recommends the Kissinger–Akahira–Sunose (KAS) and Matusita–Sakka modifications. The KAS method was used in this work; however, it does not differ in accuracy from other methods that take into account the dependence of temperature of the relative crystallized volume, such as the OWF and Tang local methods. In contrast, the Matusita–Sakka method includes additional parameters like the Avrami exponent n and the coefficient corresponding to the dimensionality of crystal growth m. Therefore, it is no longer a simple model.
A similar analysis of the local transformation activation energy was used for the non-isothermal annealing of LiFePO4 olivine using the KAS and OFW methods [26]. The values obtained using these two methods were also close to each other; however, higher values (about 10–15 kJ/mol) were obtained with the Kissinger method, unlike the results from this publication. The authors will use the results from the Kissinger method in further analyses.

4. Conclusions

Based on the research conducted, the following conclusions can be drawn:
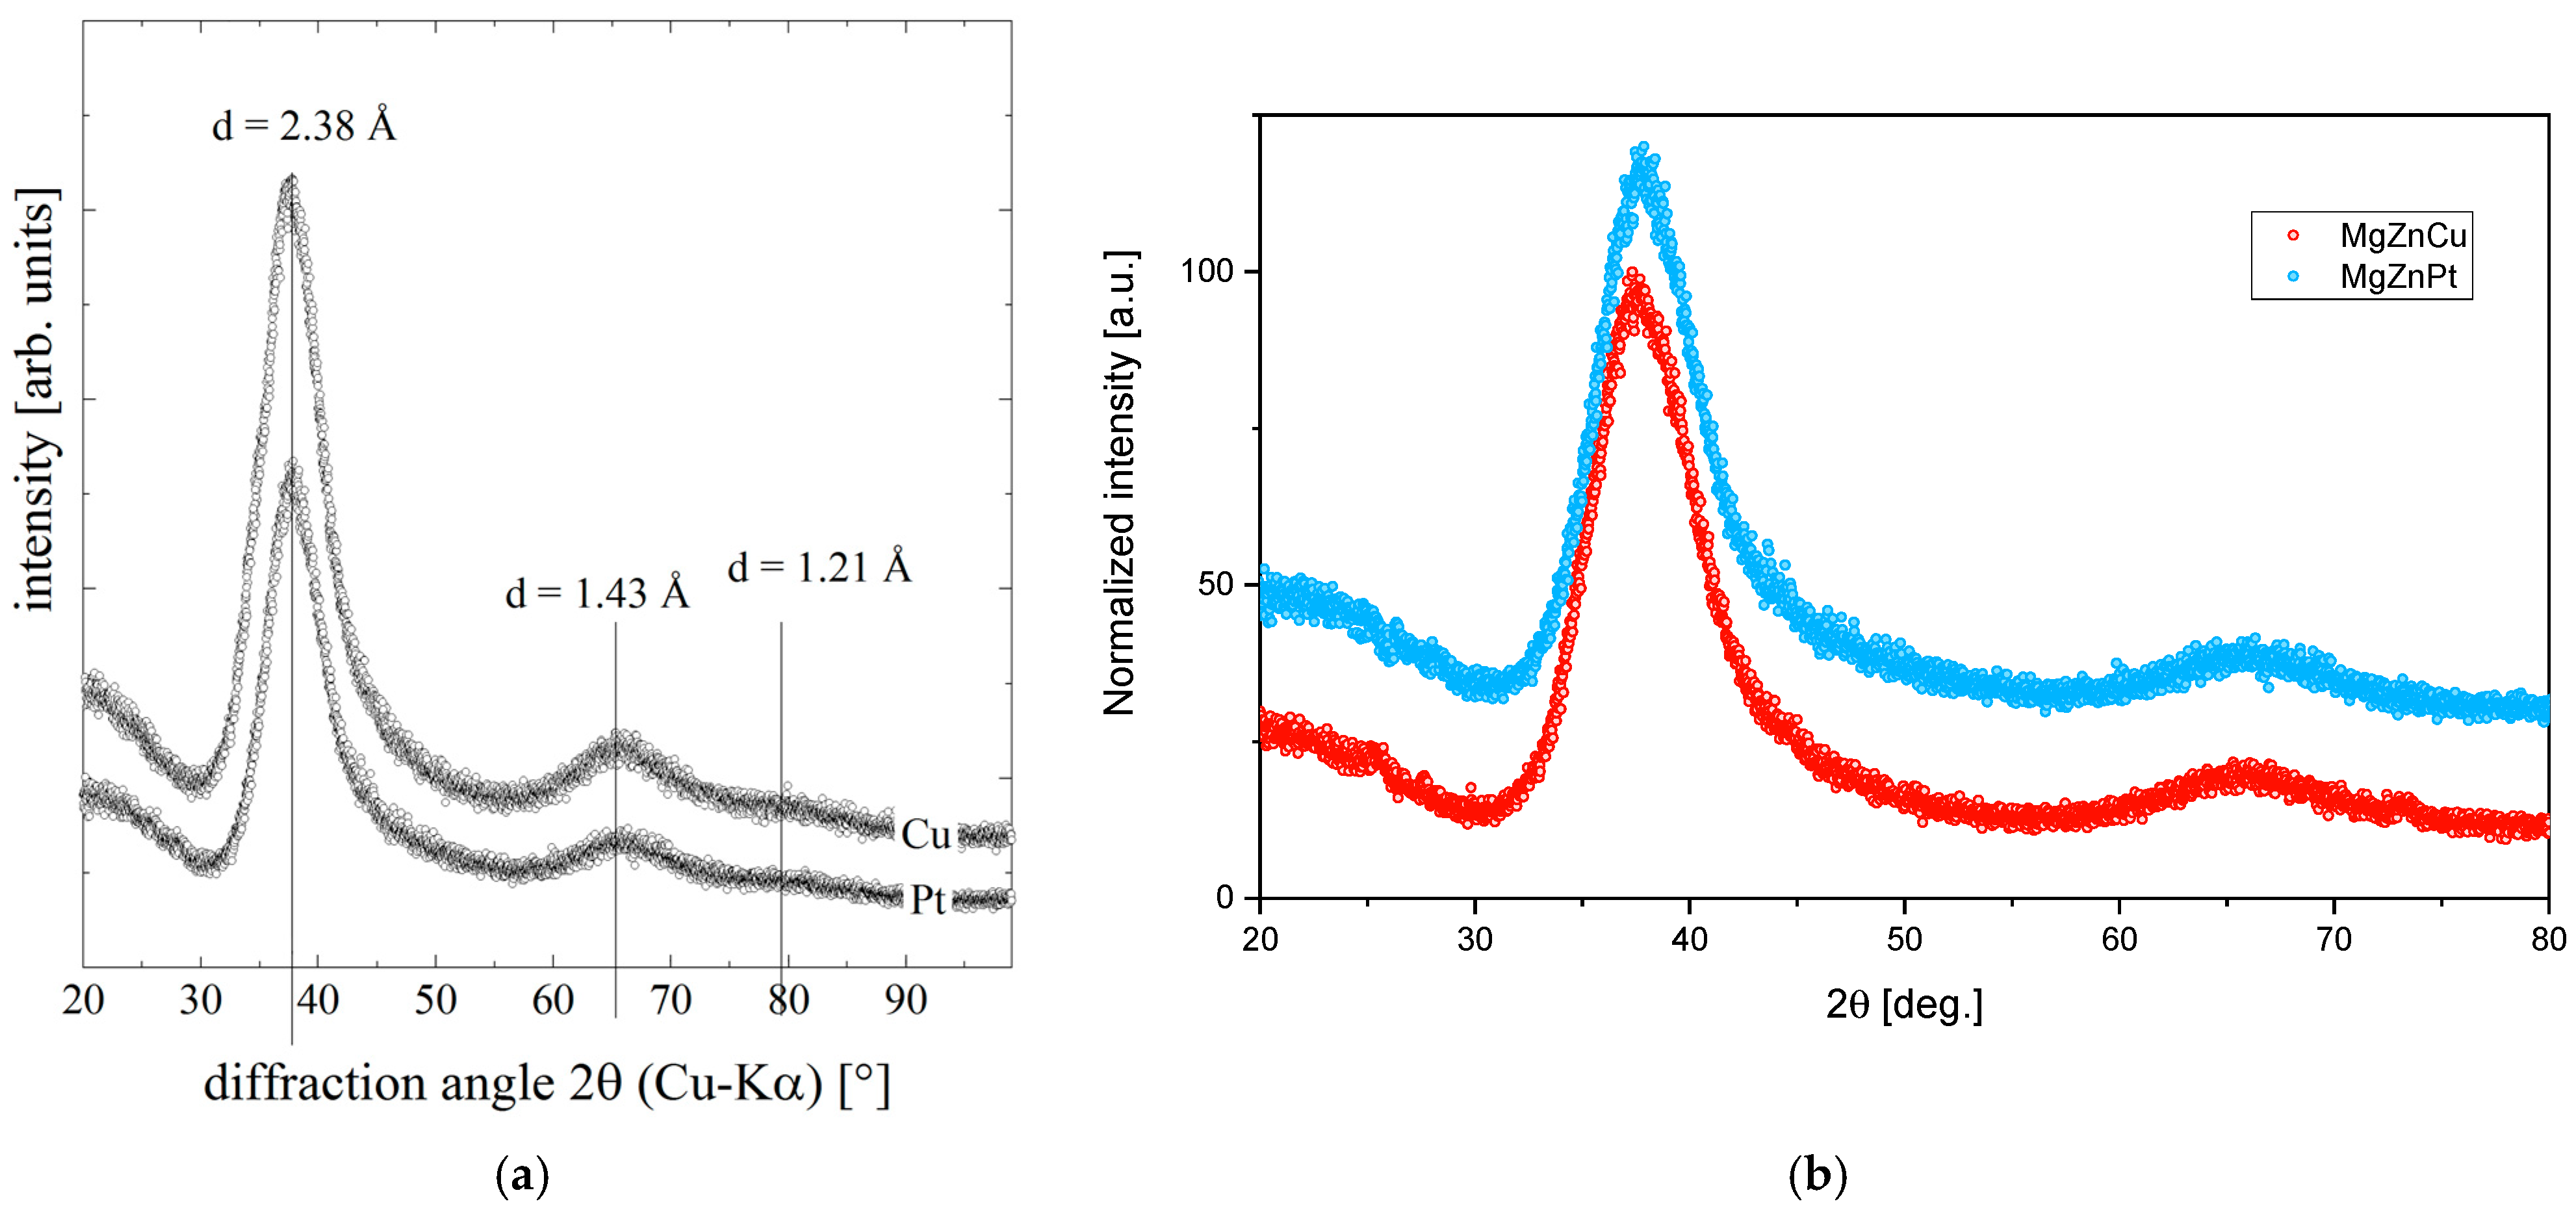
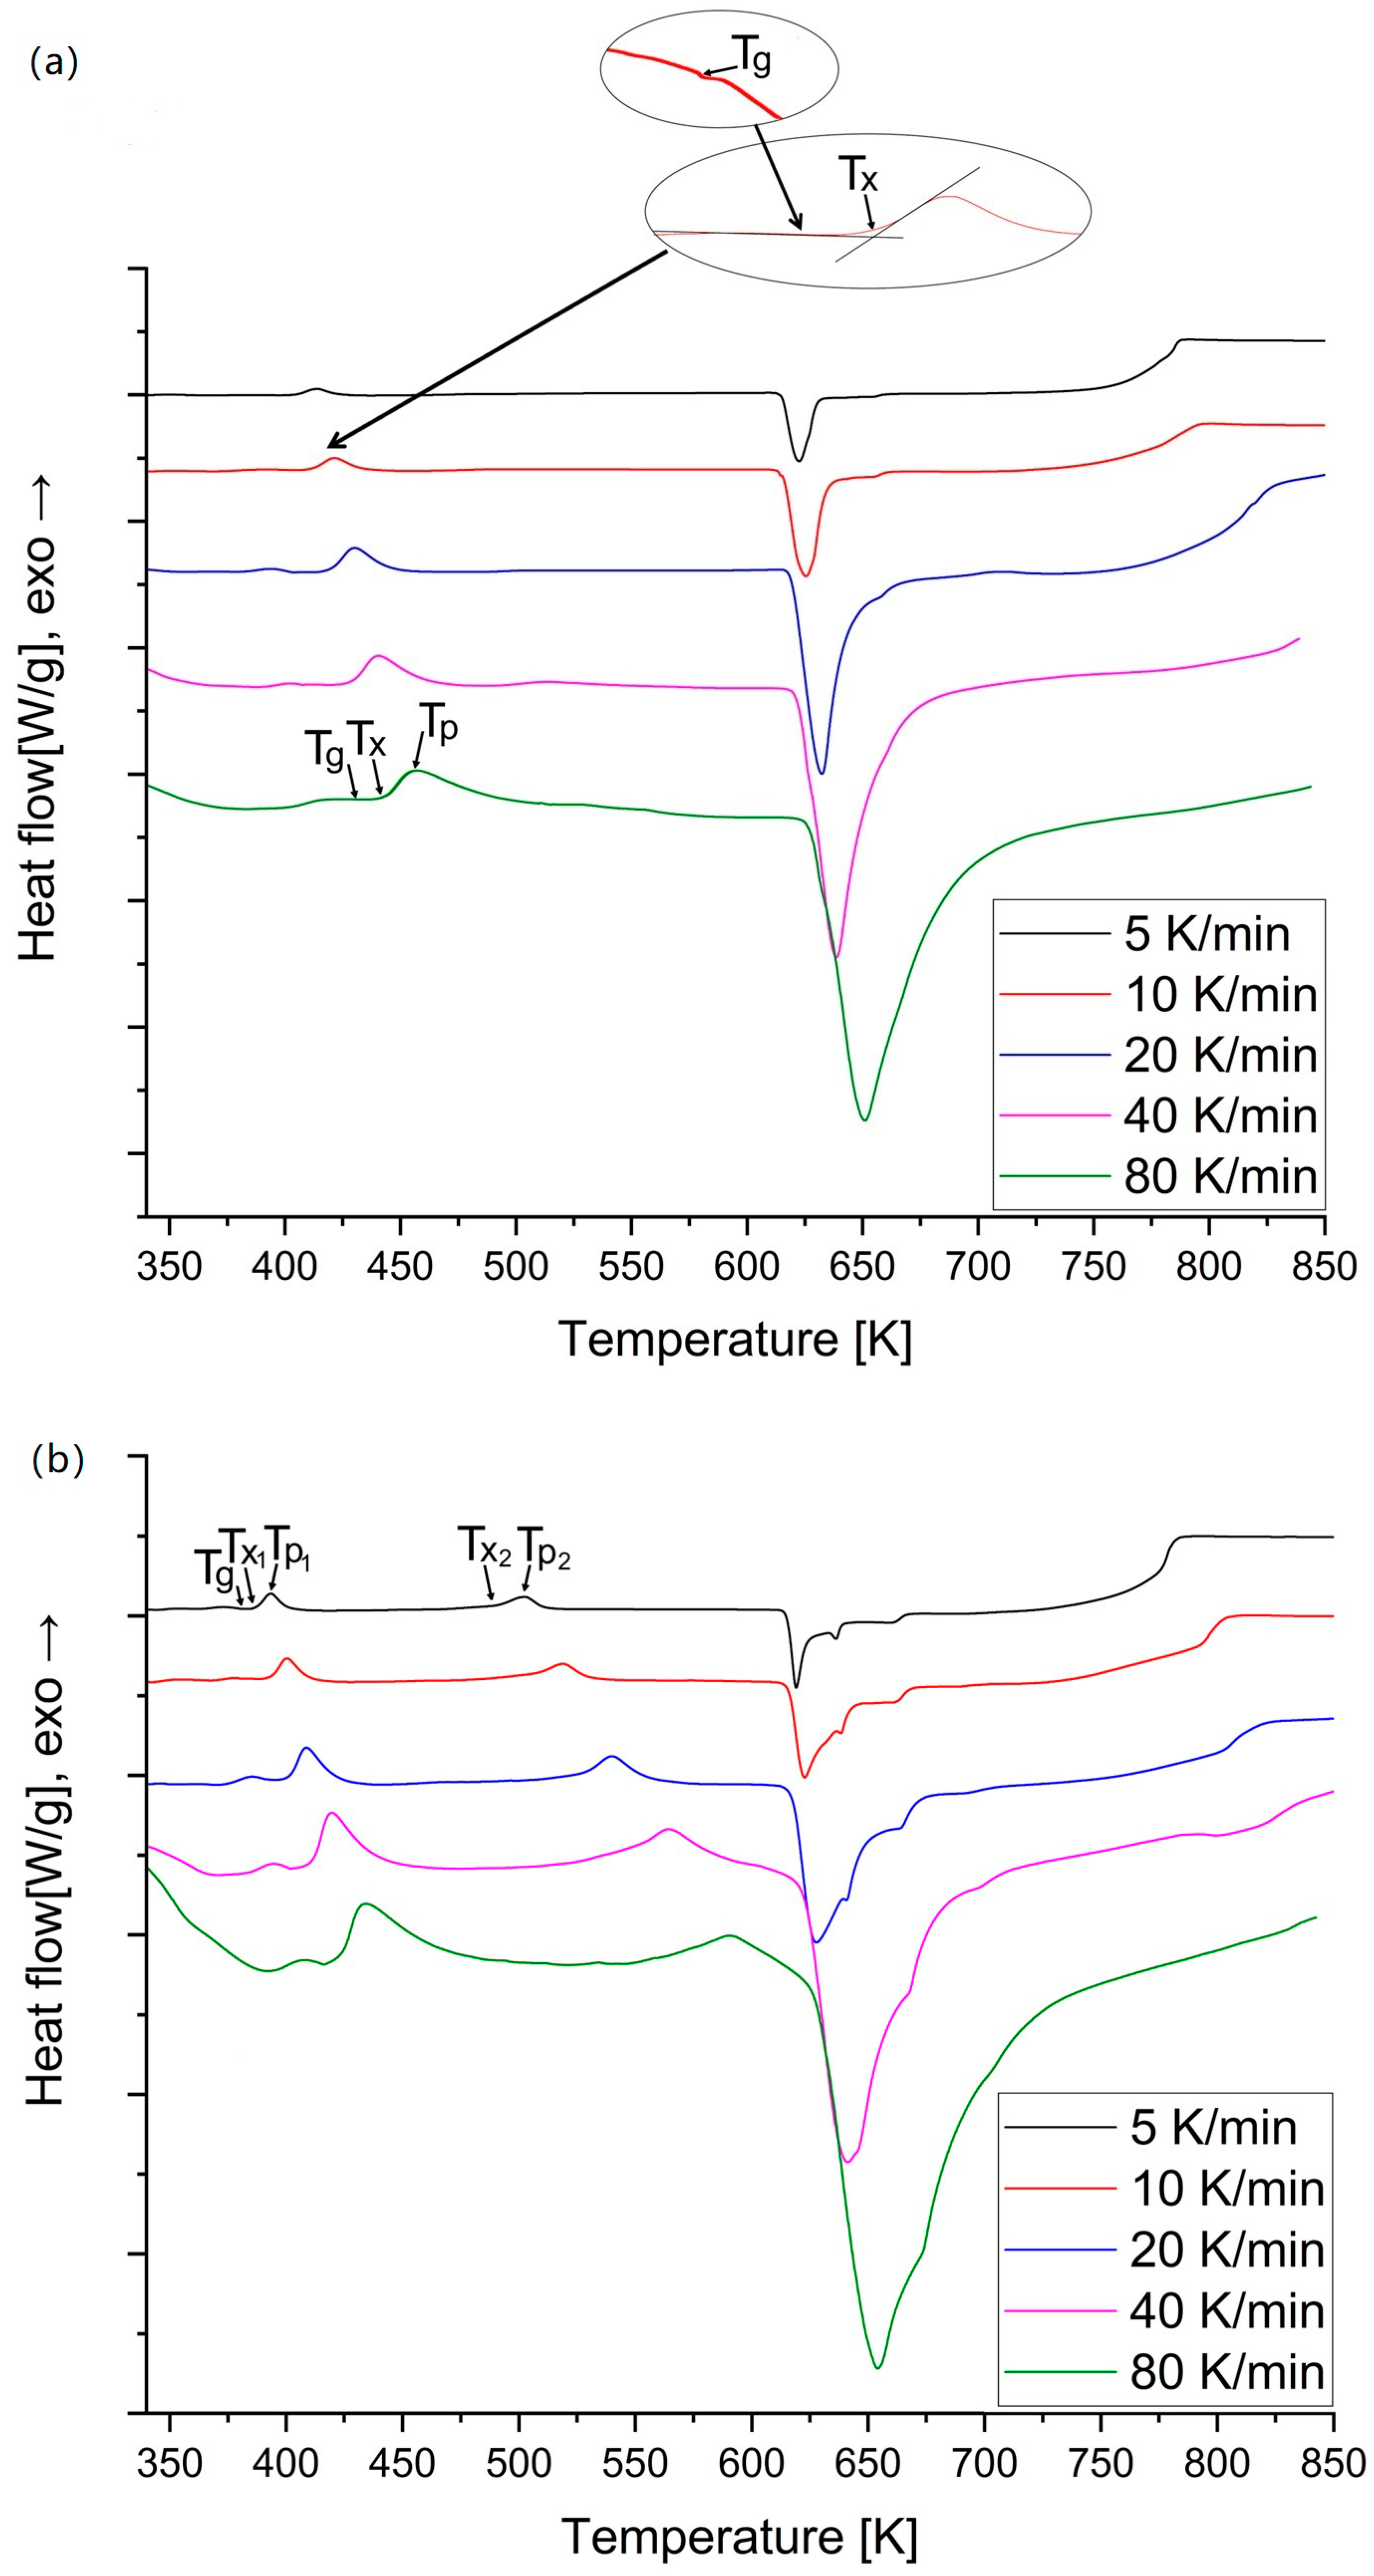
  • Crystallization proceeds with one exothermic peak for amorphous Mg72Zn27Pt1 alloy and with two exothermic peaks for amorphous Mg72Zn27Cu1 alloy, respectively.
  • The characteristic temperatures   T g , T x and T p are strongly dependent on the heating rate during non-isothermal annealing. The addition of Pt and Cu increases the characteristic temperatures toward higher values and, consequently, the stability of metallic glass compared to two-component Mg72Zn28 glass [17], especially that with Pt, due to its higher melting point and different atom size to those of Mg and Zn.
  • The activation energies for the amorphous Mg72Zn27Pt1 alloy fluctuate in the range of 114.60–117.99 kJ/mol, 102.46–105.98 kJ/mol and 71.16–98.62 kJ/mol for E g , E x and E p , respectively, whereas, for Mg72Zn27Cu1, the calculated values are in the range of 98.51–101.77 kJ/mol, 95.15–98.51 kJ/mol and 55.15–93.34 kJ/mol for E g , E x and E p , respectively.
  • Based on the E g ,   E x ,   E p and local energy values, it can be confirmed that both alloys are meta-stable in the amorphous state and crystallization occurs spontaneously.
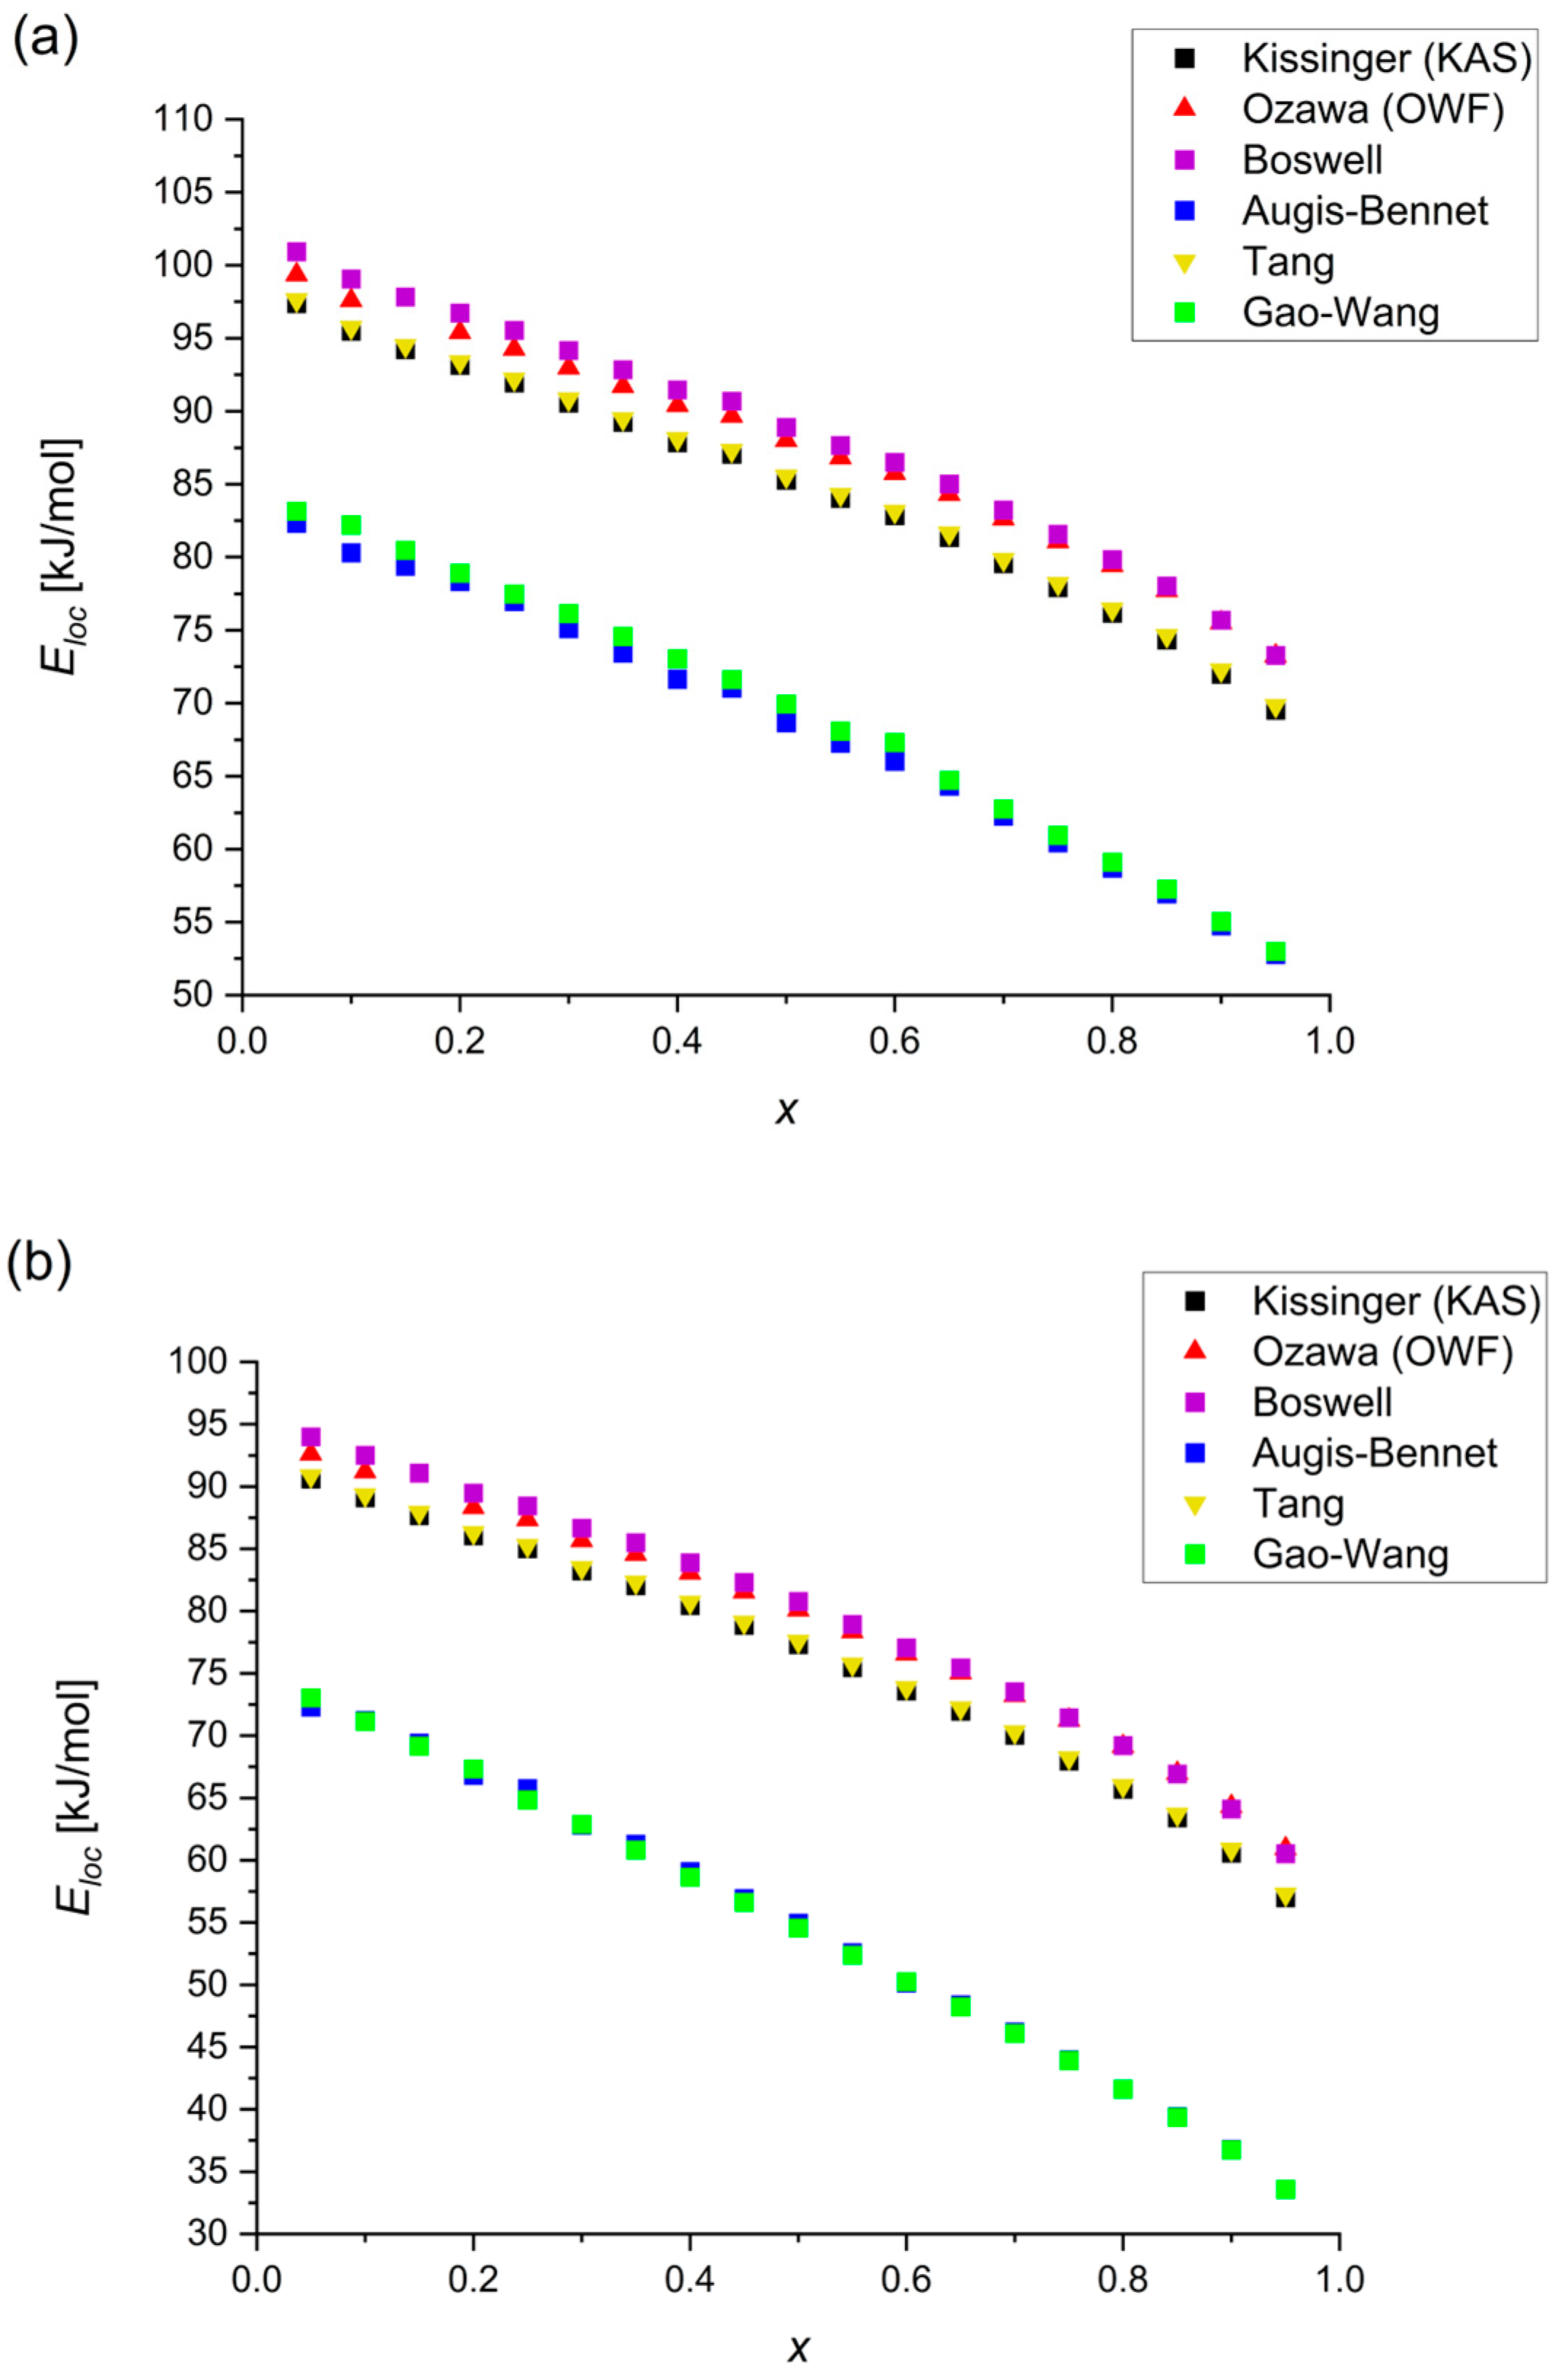
  • The most similar values of the activation energy for three characteristic regions are given by the Kissinger, Ozawa, Tang and Boswell methods, because the structures of their equations are similar. The Boswell method gives the highest results, and the Augis–Bennett and Gao–Wang methods give significantly lower results.
  • The Augis–Bennett and Gao–Wang methods allow for the calculation of the activation energy at the crystallization peak and they are the only ones that consider T x or d x / d T .
  • The use of the Gao–Wang method to analyze an alloy with two crystallization peaks may be difficult due to the inclusion of d x / d T .
  • The Augis–Bennett method, despite only slightly lower values for the peak activation energies, shows significantly lower values for the local activation energy.
  • Taking into account the ease of their formulas, their best convergence, and their widespread use in the literature, the KAS and OFW methods will work very well for all comparisons.

Author Contributions

Conceptualization, A.P. and J.L.; methodology, A.P. and J.L.; investigation, A.P., J.L., H.K. and M.S.; writing—original draft preparation, A.P. and J.L.; writing—review and editing, H.K. and M.S.; funding acquisition, J.L. All authors have read and agreed to the published version of the manuscript.

Funding

This research was founded by “The Excellent Initiative—Research University” (IDUB) program, grant number 501.696.7996 (action 4, 1658).

Institutional Review Board Statement

Not applicable.

Informed Consent Statement

Not applicable.

Data Availability Statement

The data presented in this study are available on request from the authors—A.P. pierwola@agh.edu.pl.

Acknowledgments

We would like to thank David Rafaja and Christian Schimpf from the Institute of Materials Science of TU Bergakademie Freiberg from Germany and also Łukasz Gondek from the Faculty of Physics and Applied Informatics AGH University of Krakow from Poland for their help during the preparation of this manuscript.

Conflicts of Interest

The authors declare that they have no conflicts of interest.

References

  1. Patel, A.T.; Pratap, A. Kinetics of crystallization of Zr52Cu18Ni14Al10Ti6 metallic glass. J. Therm. Anal. Calorim. 2012, 10, 159–165. [Google Scholar] [CrossRef]
  2. Suryanarayana, C.; Inoue, A. Bulk Metallic Glasses; CRC Press: Boca Raton, FL, USA, 2011. [Google Scholar]
  3. Lu, S.; Sun, S.; Li, K.; Li, H.; Huang, X.; Tu, G. The effect of Y addition on the crystallization behaviors of Zr-Cu-Ni-Al bulk metallic glasses. J. Alloys Compd. 2019, 799, 501–512. [Google Scholar] [CrossRef]
  4. Thomas, L.C. An Introduction To The Techniques of Differential Scanning Calorimetry (DSC) and Modulated Dsc®. 2005. Available online: https://api.core.ac.uk/oai/oai:ruc.udc.es:2183/11493 (accessed on 11 February 2021).
  5. Avrami, M. Granulation, phase change, and microstructure kinetics of phase change. III. J. Chem. Phys. 1941, 9, 177–184. [Google Scholar] [CrossRef]
  6. Johnson, W.A.; Mehl, R.F. Reaction Kinetics in Processes of Nucleation and Growth. Am. Inst. Min. Metall. Eng. 1939, 135, 416–458. [Google Scholar]
  7. Matusita, K.; Sakka, S.; Matsui, Y. Determination of the activation energy for crystal growth by differential thermal analysis. J. Mater. Sci. 1975, 10, 961–966. [Google Scholar] [CrossRef]
  8. Kissinger, H.E. Reaction kinetics in differential thermal analysis. Anal. Chem. 1957, 29, 1702–1706. [Google Scholar] [CrossRef]
  9. Ozawa, J.E. A new method of analyzing thermogravimetric data. Bull. Chem. Soc. Jpn. 1965, 38, 1881–1886. [Google Scholar] [CrossRef]
  10. Flynn, J.H.; Wall, L.A. General treatment of the thermogravimetry of polymers. J. Res. Natl. Inst. Stand. Technol. 1966, 70, 487–523. [Google Scholar] [CrossRef]
  11. Boswell, P.G. On the calculation of activation energies using a modified Kissinger method. J. Therm. Anal. 1980, 18, 353–358. [Google Scholar] [CrossRef]
  12. Tang, W.; Liu, Y.; Zhang, H.; Wang, C. New approximate formula for Arrhenius temperature integral. Thermochim. Acta 2003, 408, 39–43. [Google Scholar] [CrossRef]
  13. Augis, J.; Bennett, A. Calculation of the Avrami parameters for heterogeneous solid state reactions using a modification of the Kissinger method. J. Therm. Anal. 1978, 13, 283–292. [Google Scholar] [CrossRef]
  14. Gao, Y.Q.; Wang, W. On the activation energy of crystallization in metallic glasses. J. Non-Cryst. Solids 1986, 81, 129–134. [Google Scholar] [CrossRef]
  15. Friedman, H.L. Kinetics of thermal degradation of char-forming plastics from thermogravimetry. Application to a phenolic plastic. J. Polym. Sci. Part C Polym. Symp. 2007, 6, 183–195. [Google Scholar] [CrossRef]
  16. Pierwoła, A.; Lelito, J.; Krawiec, H.; Szucki, M.; Gondek, Ł.; Kozieł, T.; Babilas, R. Non-Isothermal Analysis of the Crystallization Kinetics of Amorphous Mg72Zn27Pt1 and Mg72Zn27Ag1 Alloys. Materials 2024, 17, 408. [Google Scholar] [CrossRef] [PubMed]
  17. Calka, A.; Madhava, M.; Polk, D.E.; Giessen, B.C. A Transition-Metal-Free Amorphous Alloy: Mg.70Zn.30. Scr. Metall. 1977, II, 65–70. [Google Scholar] [CrossRef]
  18. Opitek, B.; Gracz, B.; Lelito, J.; Krajewski, W.K.; Łucarz, M.; Bała, P.; Kozieł, T.; Gondek, Ł.; Szucki, M. Crystallization Kinetics Analysis of the Binary Amorphous Mg72Zn28 Alloy. Materials 2023, 16, 2727. [Google Scholar] [CrossRef]
  19. National Center for Biotechnology Information. Atomic Radius in the Periodic Table of Elements. 2023. Available online: https://pubchem.ncbi.nlm.nih.gov/periodic-table/atomic-radius (accessed on 18 August 2024).
  20. Opitek, B.; Lelito, J.; Szucki, M.; Piwowarski, G.; Gondek, Ł.; Rogal, Ł. Analysis of the Crystallization Kinetics and Thermal Stability of the Amorphous Mg72Zn24Ca4 Alloy. Materials 2021, 14, 3583. [Google Scholar] [CrossRef]
  21. Wang, J.; Meng, L.; Xie, W.; Ji, C.; Wang, R.; Zhang, P.; Jin, L.; Sheng, L.; Zheng, Y. Corrosion and in vitro cytocompatibility investigation on the designed Mg-Zn-Ag metallic glasses for biomedical application. J. Magnes. Alloys 2022, 15, 2172. [Google Scholar] [CrossRef]
  22. Rashidi, R.; Malekana, M.; Gholamipour, R. Crystallization kinetics of Cu47Zr47Al6 and (Cu47Zr47Al6)99Sn1 bulk metallic glasses. J. Non-Cryst. Solids 2018, 498, 272–280. [Google Scholar] [CrossRef]
  23. Mohammadi Rahvard, M.; Tamizifar, M.; Boutorabi, S.M.A. The effect of Ag addition on the non-isothermal crystallization kinetics and fragility of Zr56Co28Al16 bulk metallic glass. J. Non-Cryst. Solids 2018, 481, 74–84. [Google Scholar] [CrossRef]
  24. Rezaei-Shahreza, P.; Seifoddini, A.; Hasani, S.; Jaafari, Z.; Śliwa, A.; Nabiałek, M. Isokinetic Analysis of Fe41Co7Cr15Mo14Y2C15B6 Bulk Metallic Glass: Effect of Minor Copper Addition. Materials 2020, 13, 3704. [Google Scholar] [CrossRef] [PubMed]
  25. Zhang, X. Applications of Kinetic Methods in Thermal Analysis: A Review. Eng. Sci. 2021, 14, 1–13. [Google Scholar] [CrossRef]
  26. Amri, A.; Hendri, Y.B.; Saputra, E.; Heltina, D.; Yin, C.-Y.; Rahman, M.M.; Minakshi, M.; Mondinos, N.; Jiang, Z.-T. Formation kinetics of sol-gel derived LiFePO4 olivine analyzed by reliable non-isothermal approach. Ceram. Int. 2022, 48, 17729–17737. [Google Scholar] [CrossRef]
Figure 1. XRD patterns of amorphous Mg72Zn27Pt1 and Mg72Zn27Cu1 before (a) and after (b) normalization.
Materials 18 00694 g001
Figure 2. SEM images for Mg72Zn27Pt1 metallic glass at magnifications of (a) ×100 and (b) ×500, and Mg72Zn27Cu1 metallic glass at magnifications of (c) ×100 and (d) ×500.
Materials 18 00694 g002
Figure 3. The DSC traces of amorphous (a) Mg72Zn27Pt1 and (b) Mg72Zn27Cu1 at various heating rates: 5, 10, 20, 40, 80 K/min.
Materials 18 00694 g003
Figure 4. Relative crystallinity of (a) Mg72Zn27Pt1, (b) first peak of Mg72Zn27Cu1 alloy versus temperature at various heating rates: 5, 10, 20, 40, 80 K/min.
Materials 18 00694 g004
Figure 5. Kissinger plots of amorphous (a) Mg72Zn27Pt1 and (b) Mg72Zn27Cu1.
Materials 18 00694 g005
Figure 6. OFW plots of amorphous (a) Mg72Zn27Pt1 and (b) Mg72Zn27Cu1.
Materials 18 00694 g006
Figure 7. Boswell plots of amorphous (a) Mg72Zn27Pt1 and (b) Mg72Zn27Cu1.
Materials 18 00694 g007
Figure 8. Tang plots of amorphous (a) Mg72Zn27Pt1 and (b) Mg72Zn27Cu1.
Materials 18 00694 g008
Figure 9. Augis–Bennett plots of amorphous (a) Mg72Zn27Pt1 and (b) Mg72Zn27Cu1.
Materials 18 00694 g009
Figure 10. Gao–Wang plot of amorphous (a) Mg72Zn27Pt1 and (b) Mg72Zn27Cu1.
Materials 18 00694 g010
Figure 11. Local values of activation energy for (a) Mg72Zn27Pt1; (b) first peak of Mg72Zn27Cu1 calculated by various methods.
Materials 18 00694 g011
Table 1. Values of characteristic temperatures for Mg72Zn27Pt1 and Mg72Zn27Cu1 alloy at various heating rates.
Alloyβ [K/min] T g [K] T x [K] T p [K] T x _ e n d [K] T x 2 [K] T p 2 [K] T x 2 _ e n d [K]
Mg72Zn27Pt15393.90404.82414.35426.88
10397.69411.85421.45437.47
20404.75420.07430.14448.85
40415.29429.50440.50461.86
80423.80442.57456.93491.17
Mg72Zn27Cu15376.64387.20393.76400.90487.92502.72510.39
10382.00393.72400.48410.69505.90519.56529.39
20389.00401.60408.79426.25528.08540.29557.17
40398.00411.63419.71453.18551.02565.14588.27
80410.11424.06434.08476.35579.91591.59617.22
Table 2. The rules of plotting and the parameters for slope multiplying for each method.
MethodGlass TransitionOnset of Crystallization Crystallization Peak Parameter for Slope Multiplying
Kissinger l n β T g 2   vs .   1000 T g l n β T x 2   vs .   1000 T x l n β T p 2   vs .   1000 T p ( R )
Ozawa–Flynn–Wall l n β   vs .   1000 T g l n β   vs .   1000 T x l n β   vs .   1000 T p R 1.0516
Boswell l n β T g   vs .   1000 T g l n β T x   vs .   1000 T x l n β T p   vs .   1000 T p ( R )
Tang l n β T g 1.894661   vs .   1000 T g l n β T x 1.894661   vs .   1000 T x l n β T p 1.894661   vs .   1000 T p R 1.00145033
Augis–Bennett l n β T p T x   vs .   1000 T p ( R )
Gao–Wang ln β d x d T p   vs .   1000 T p ( R )
Table 3. Values of activation energies of Mg72Zn27Pt1 and Mg72Zn27Cu1 calculated by various methods.
AlloyMethod E g [kJ/mol] E x [kJ/mol] E p [kJ/mol]
Mg72Zn27Pt1Kissinger114.60102.4695.01
Ozawa–Flynn–Wall115.43104.1297.22
Boswell117.99105.9898.62
Tang114.79102.6895.25
Augis–Bennett 87.11
Gao–Wang 71.16
Mg72Zn27Cu1Kissinger98.5195.1589.91
Ozawa–Flynn–Wall99.8896.8892.03
Boswell101.7798.5193.34
Tang98.7195.3790.14
Augis–Bennett 81.83
Gao–Wang 55.15
Disclaimer/Publisher’s Note: The statements, opinions and data contained in all publications are solely those of the individual author(s) and contributor(s) and not of MDPI and/or the editor(s). MDPI and/or the editor(s) disclaim responsibility for any injury to people or property resulting from any ideas, methods, instructions or products referred to in the content.

