

Preparation and Study of Physicochemical and Adsorption Properties of Alginate Composites


Abstract
1. Introduction
2. Materials and Methods
2.1. Chemicals
2.2. Material Preparation
2.3. Methodology
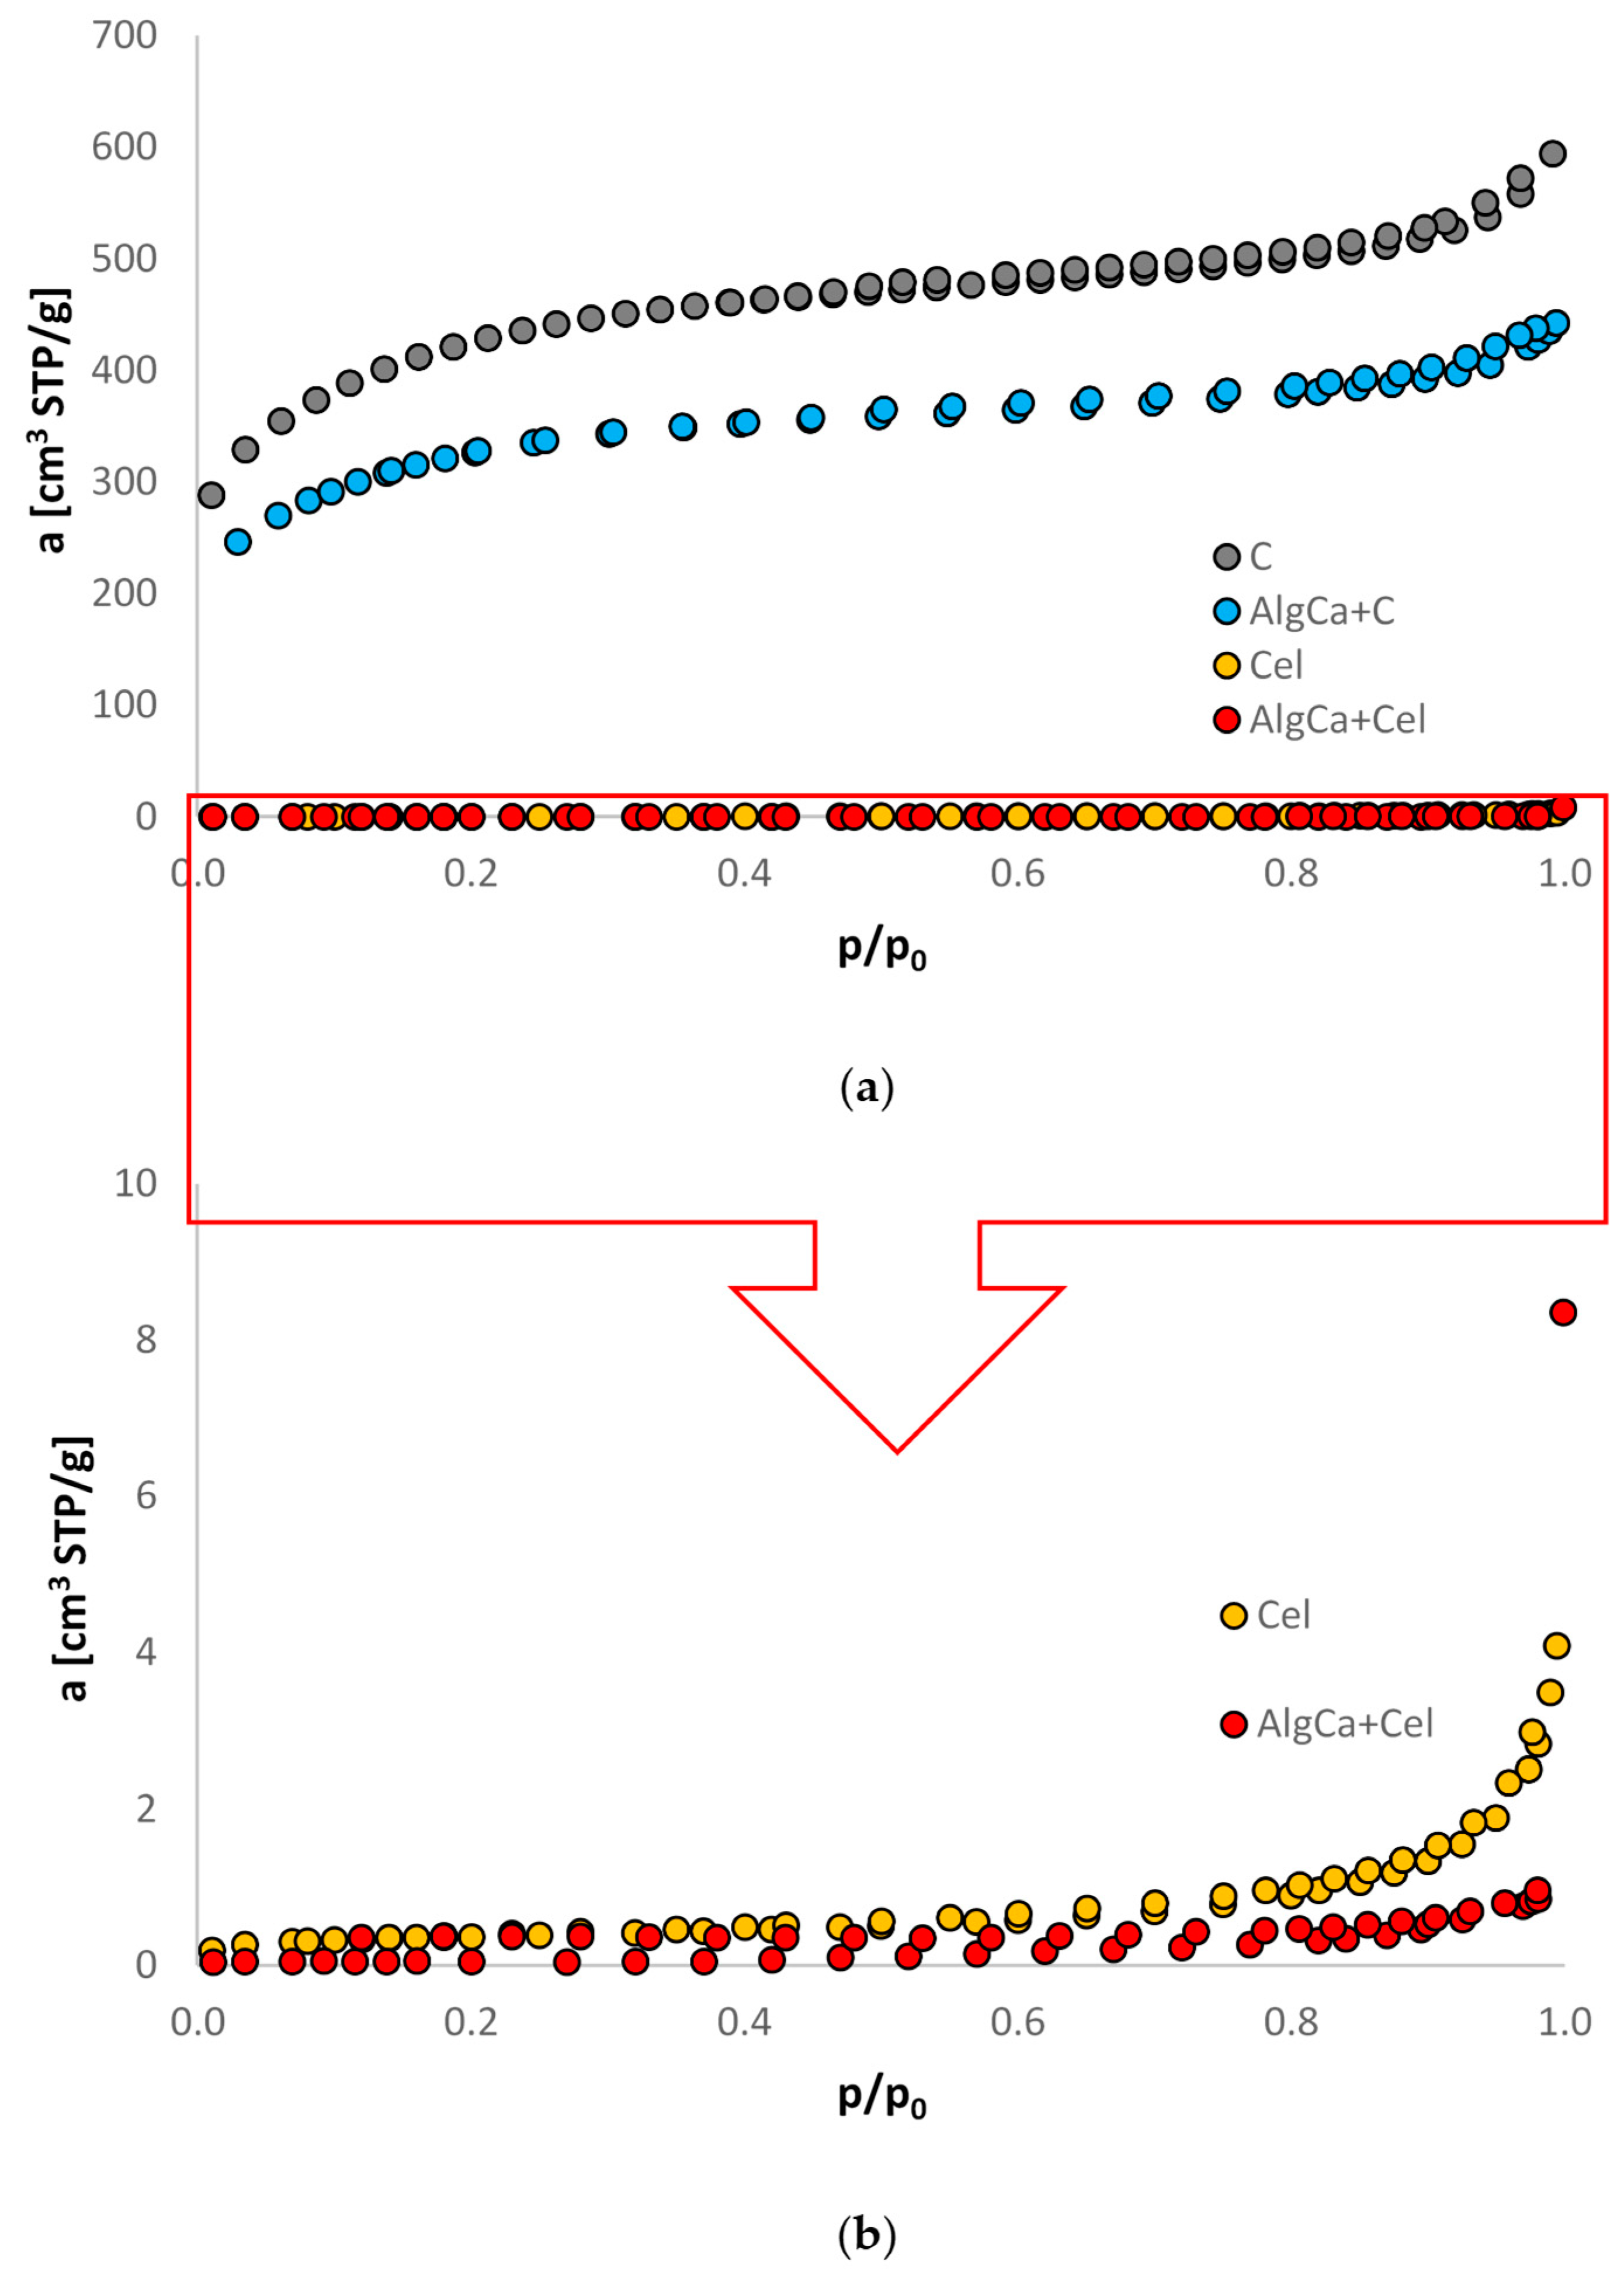
2.3.1. Nitrogen Adsorption/Desorption Tests
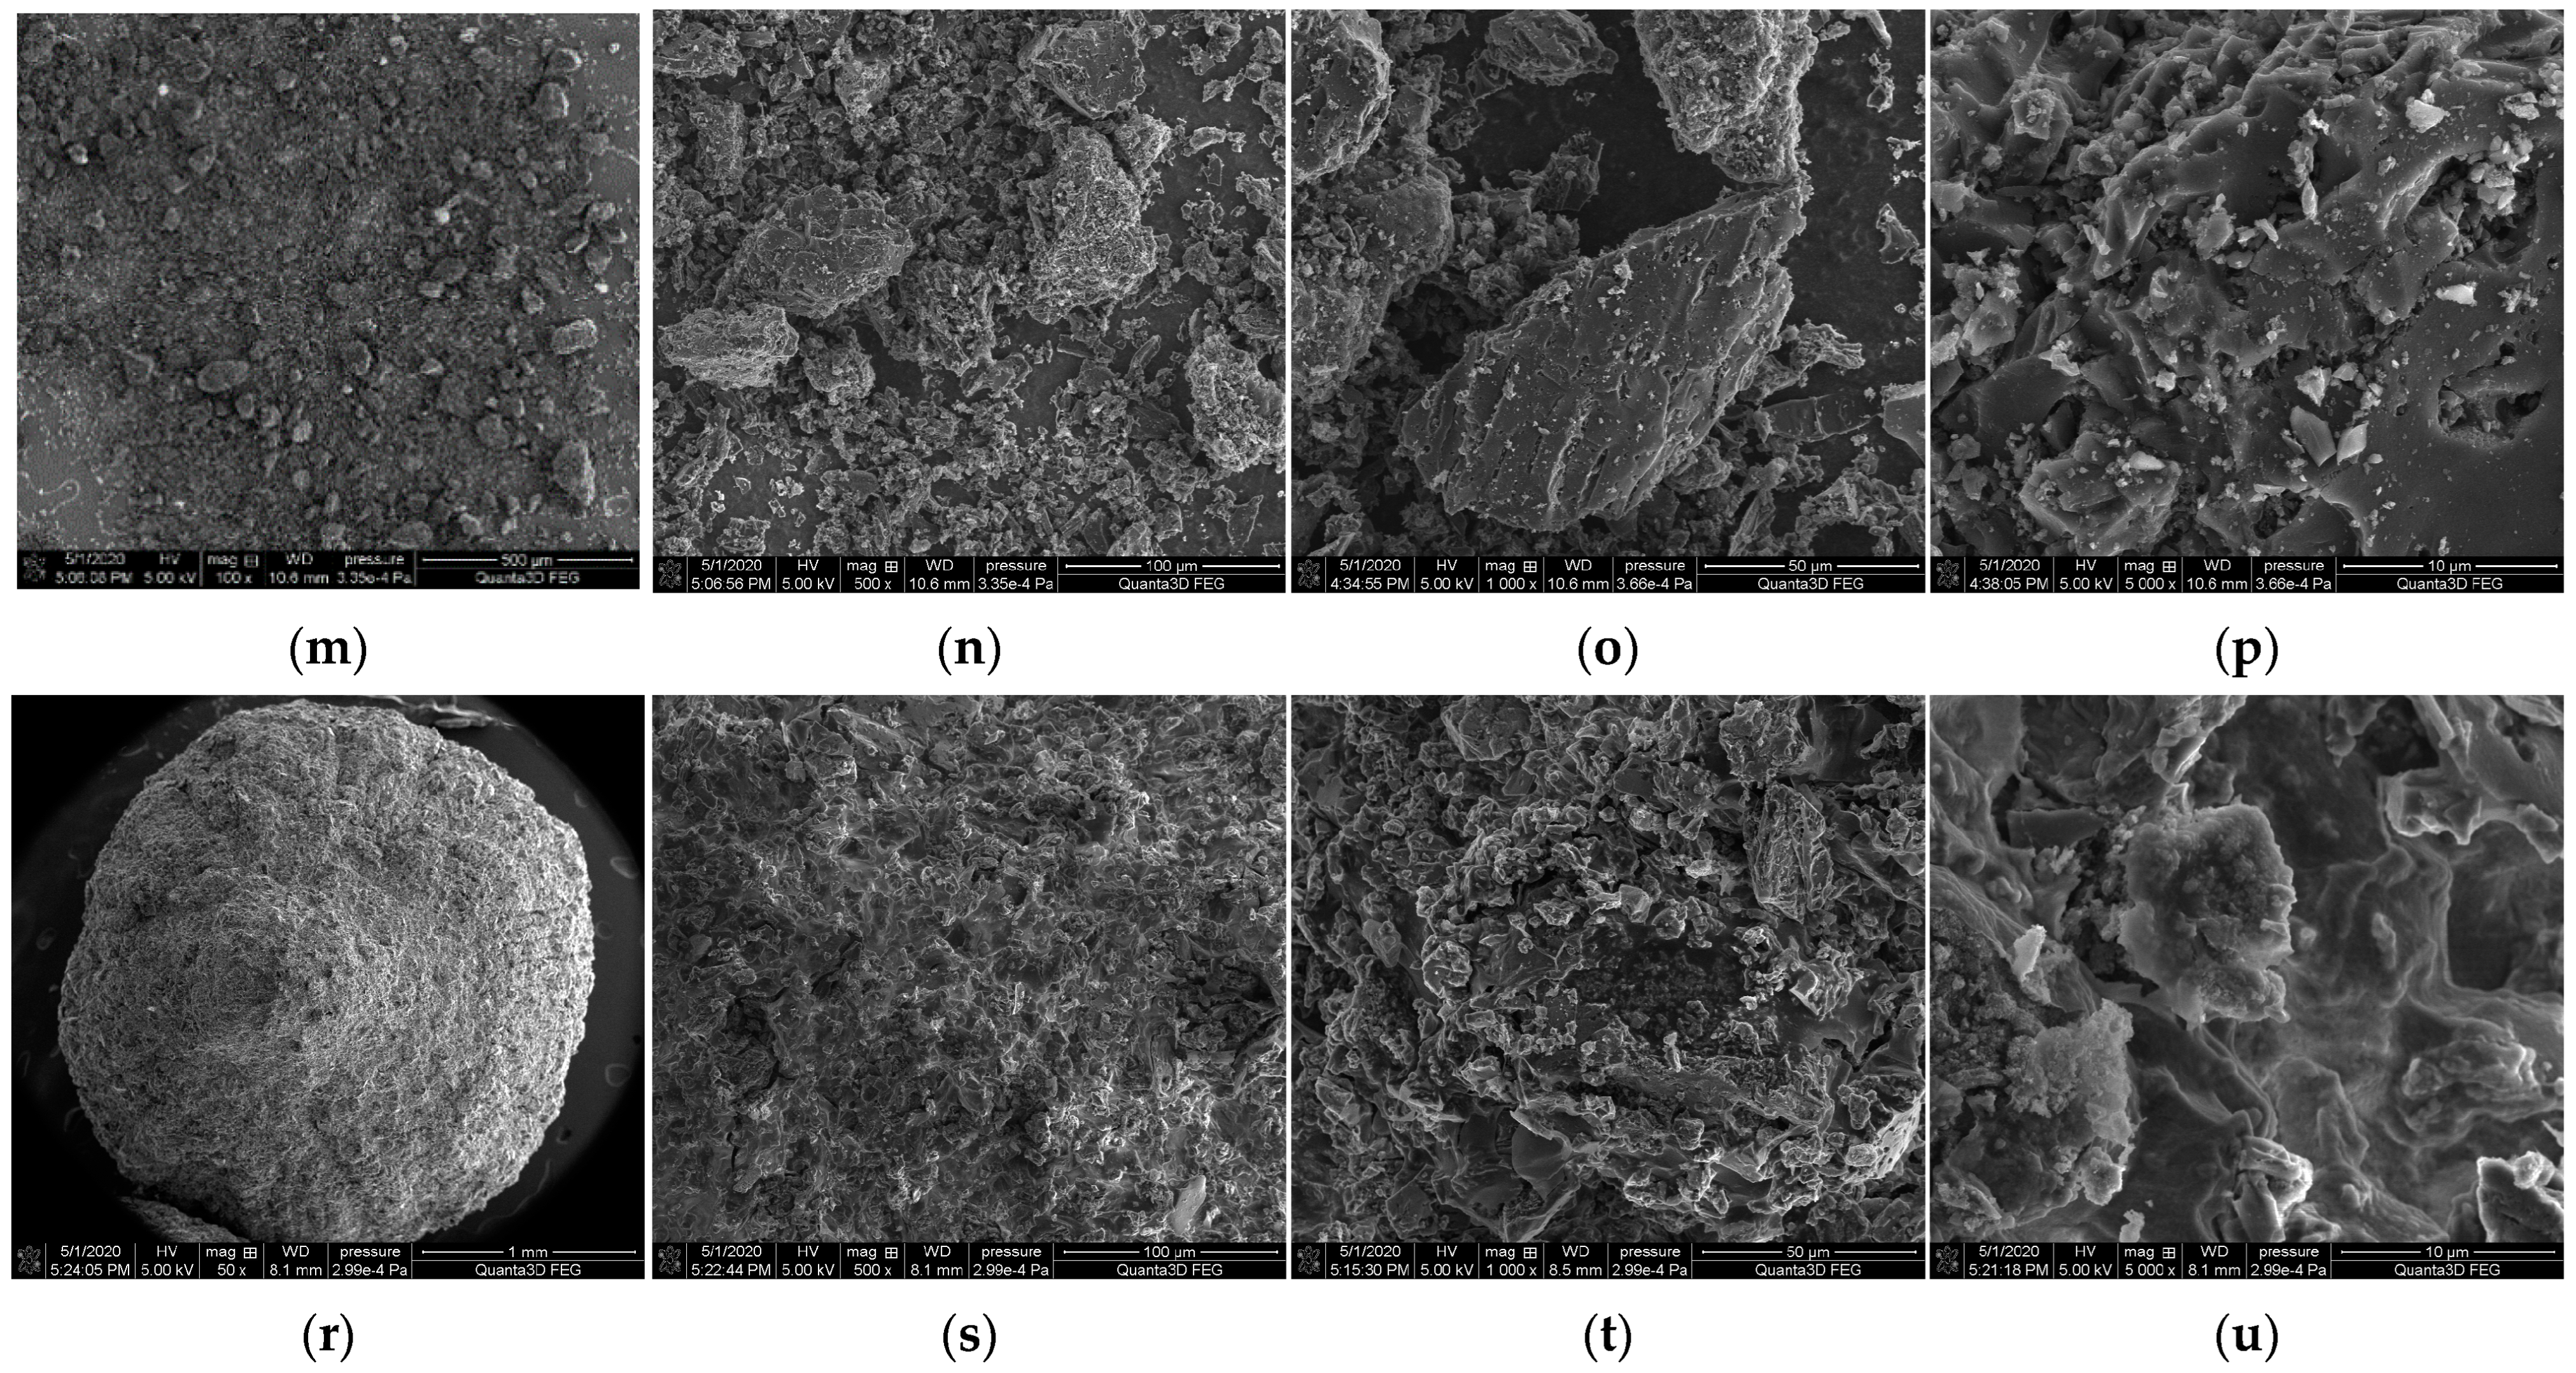
2.3.2. SEM
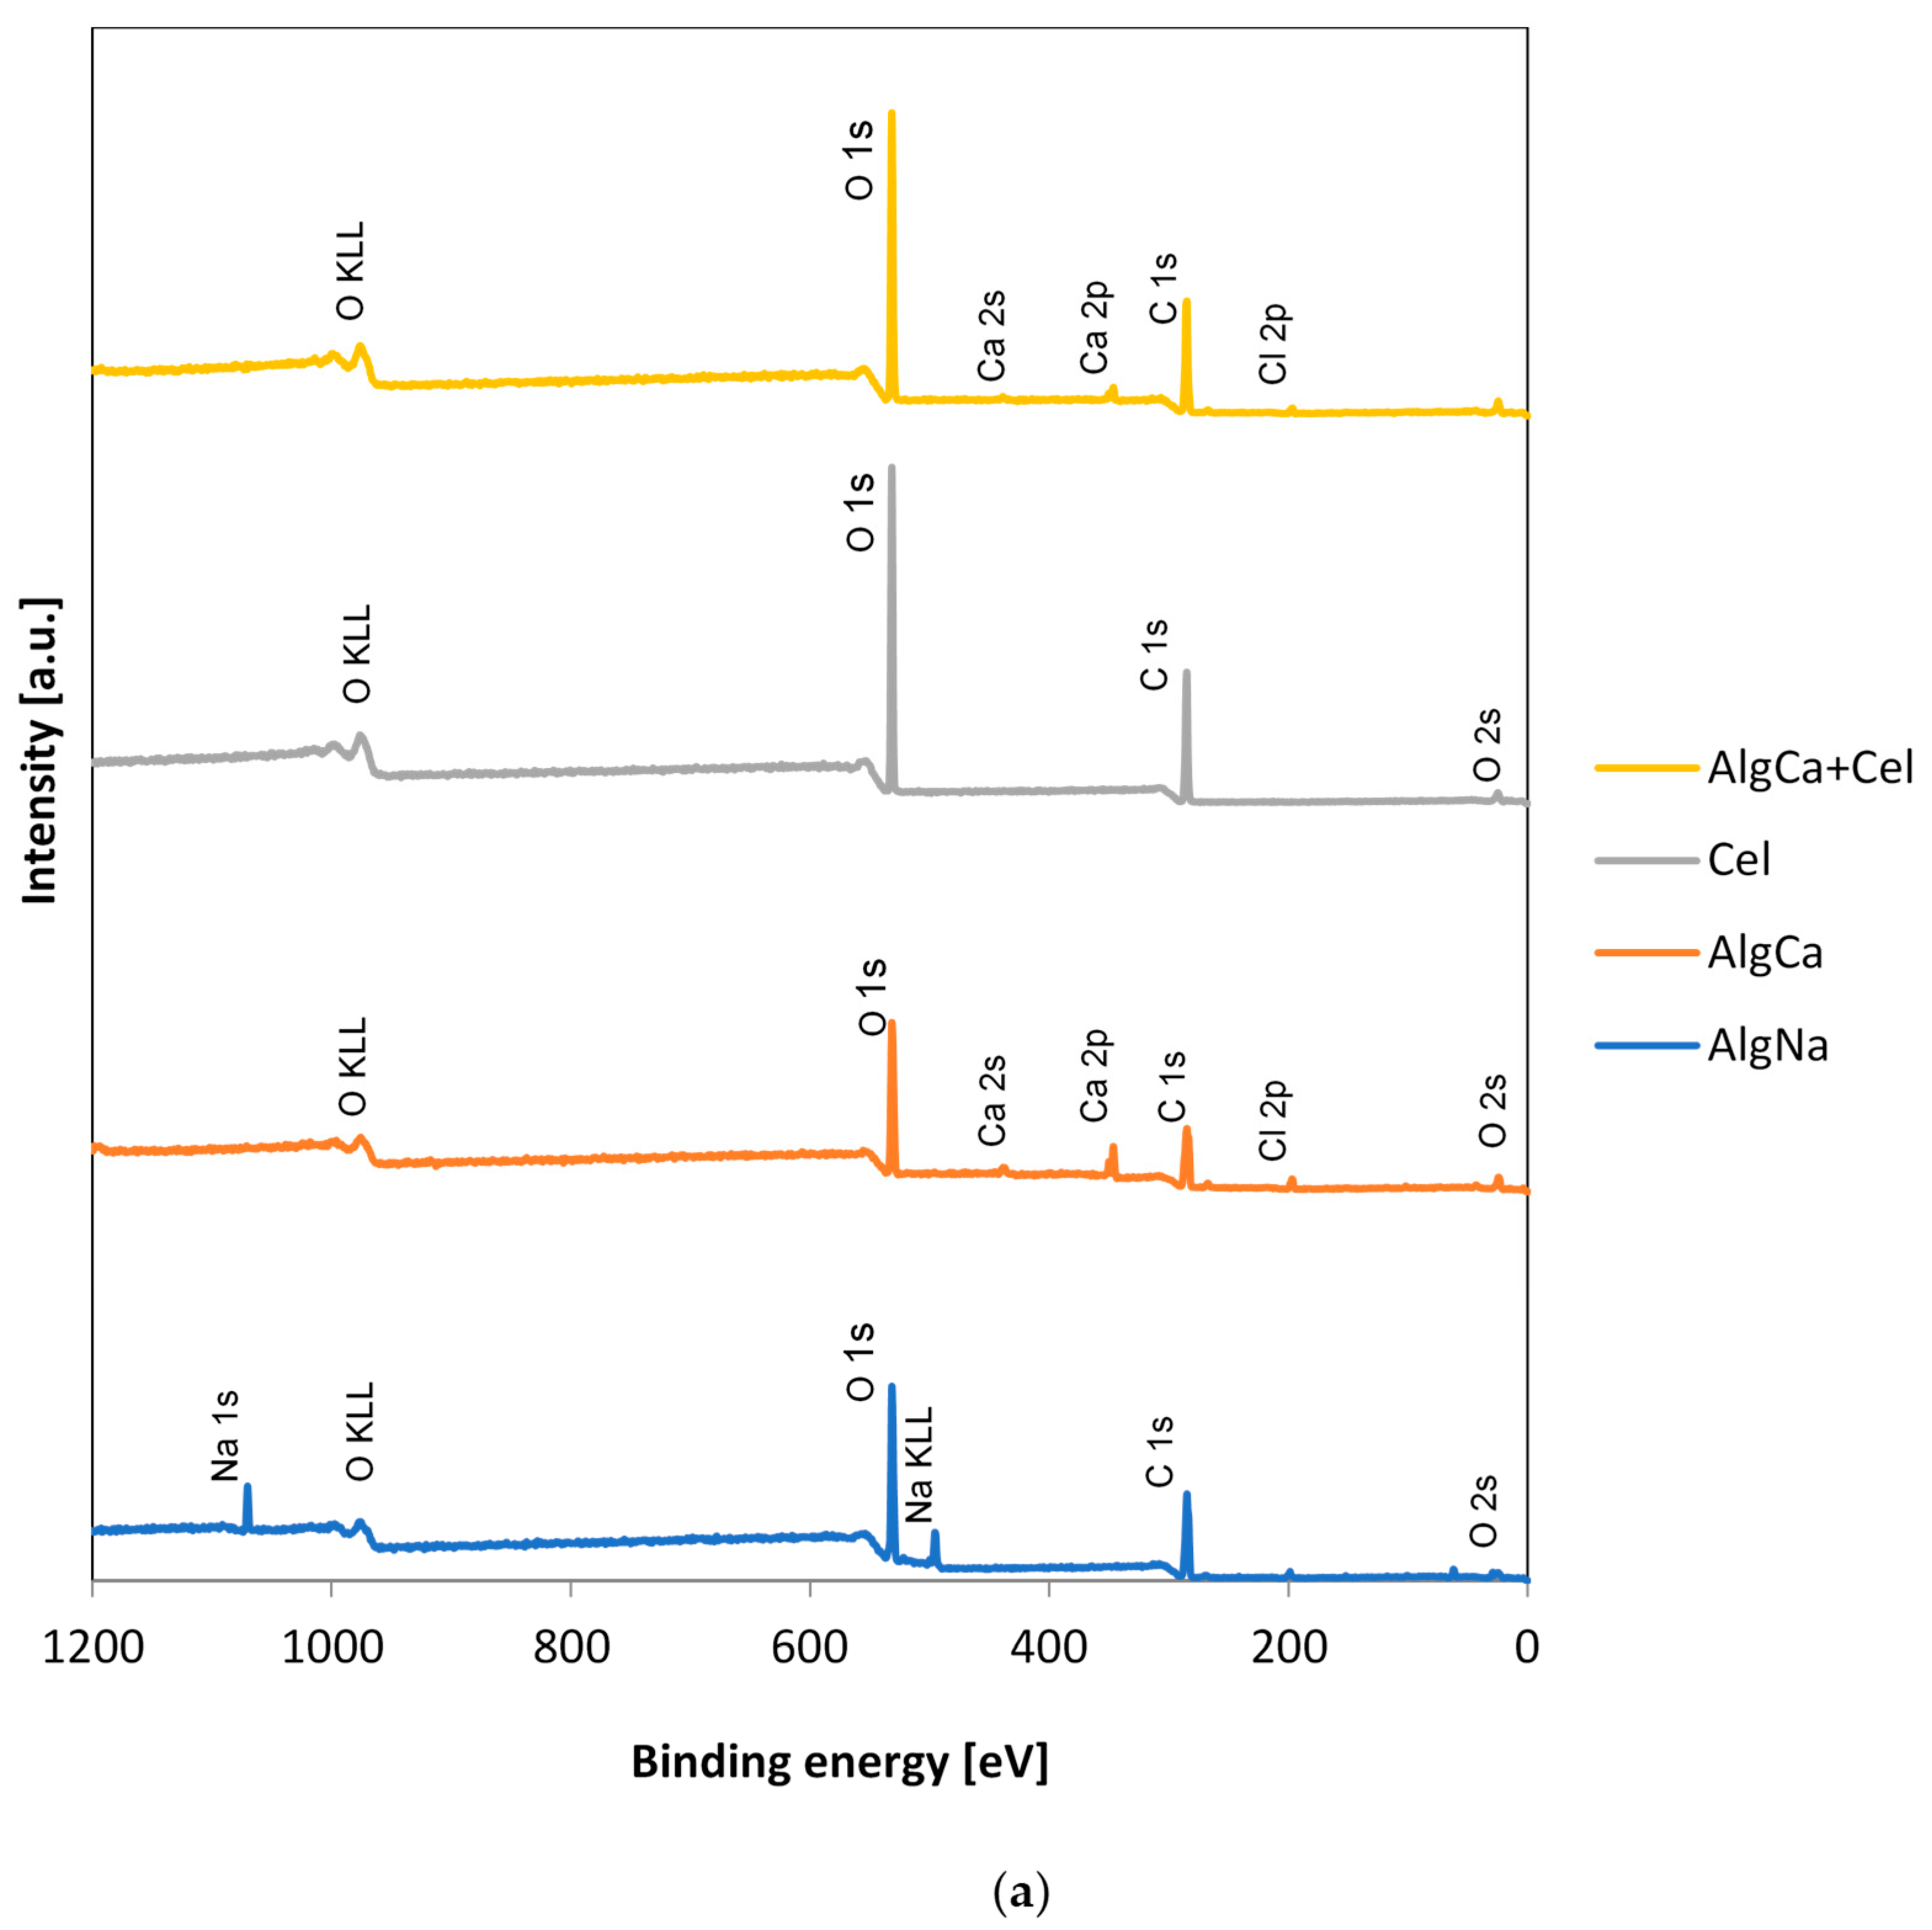
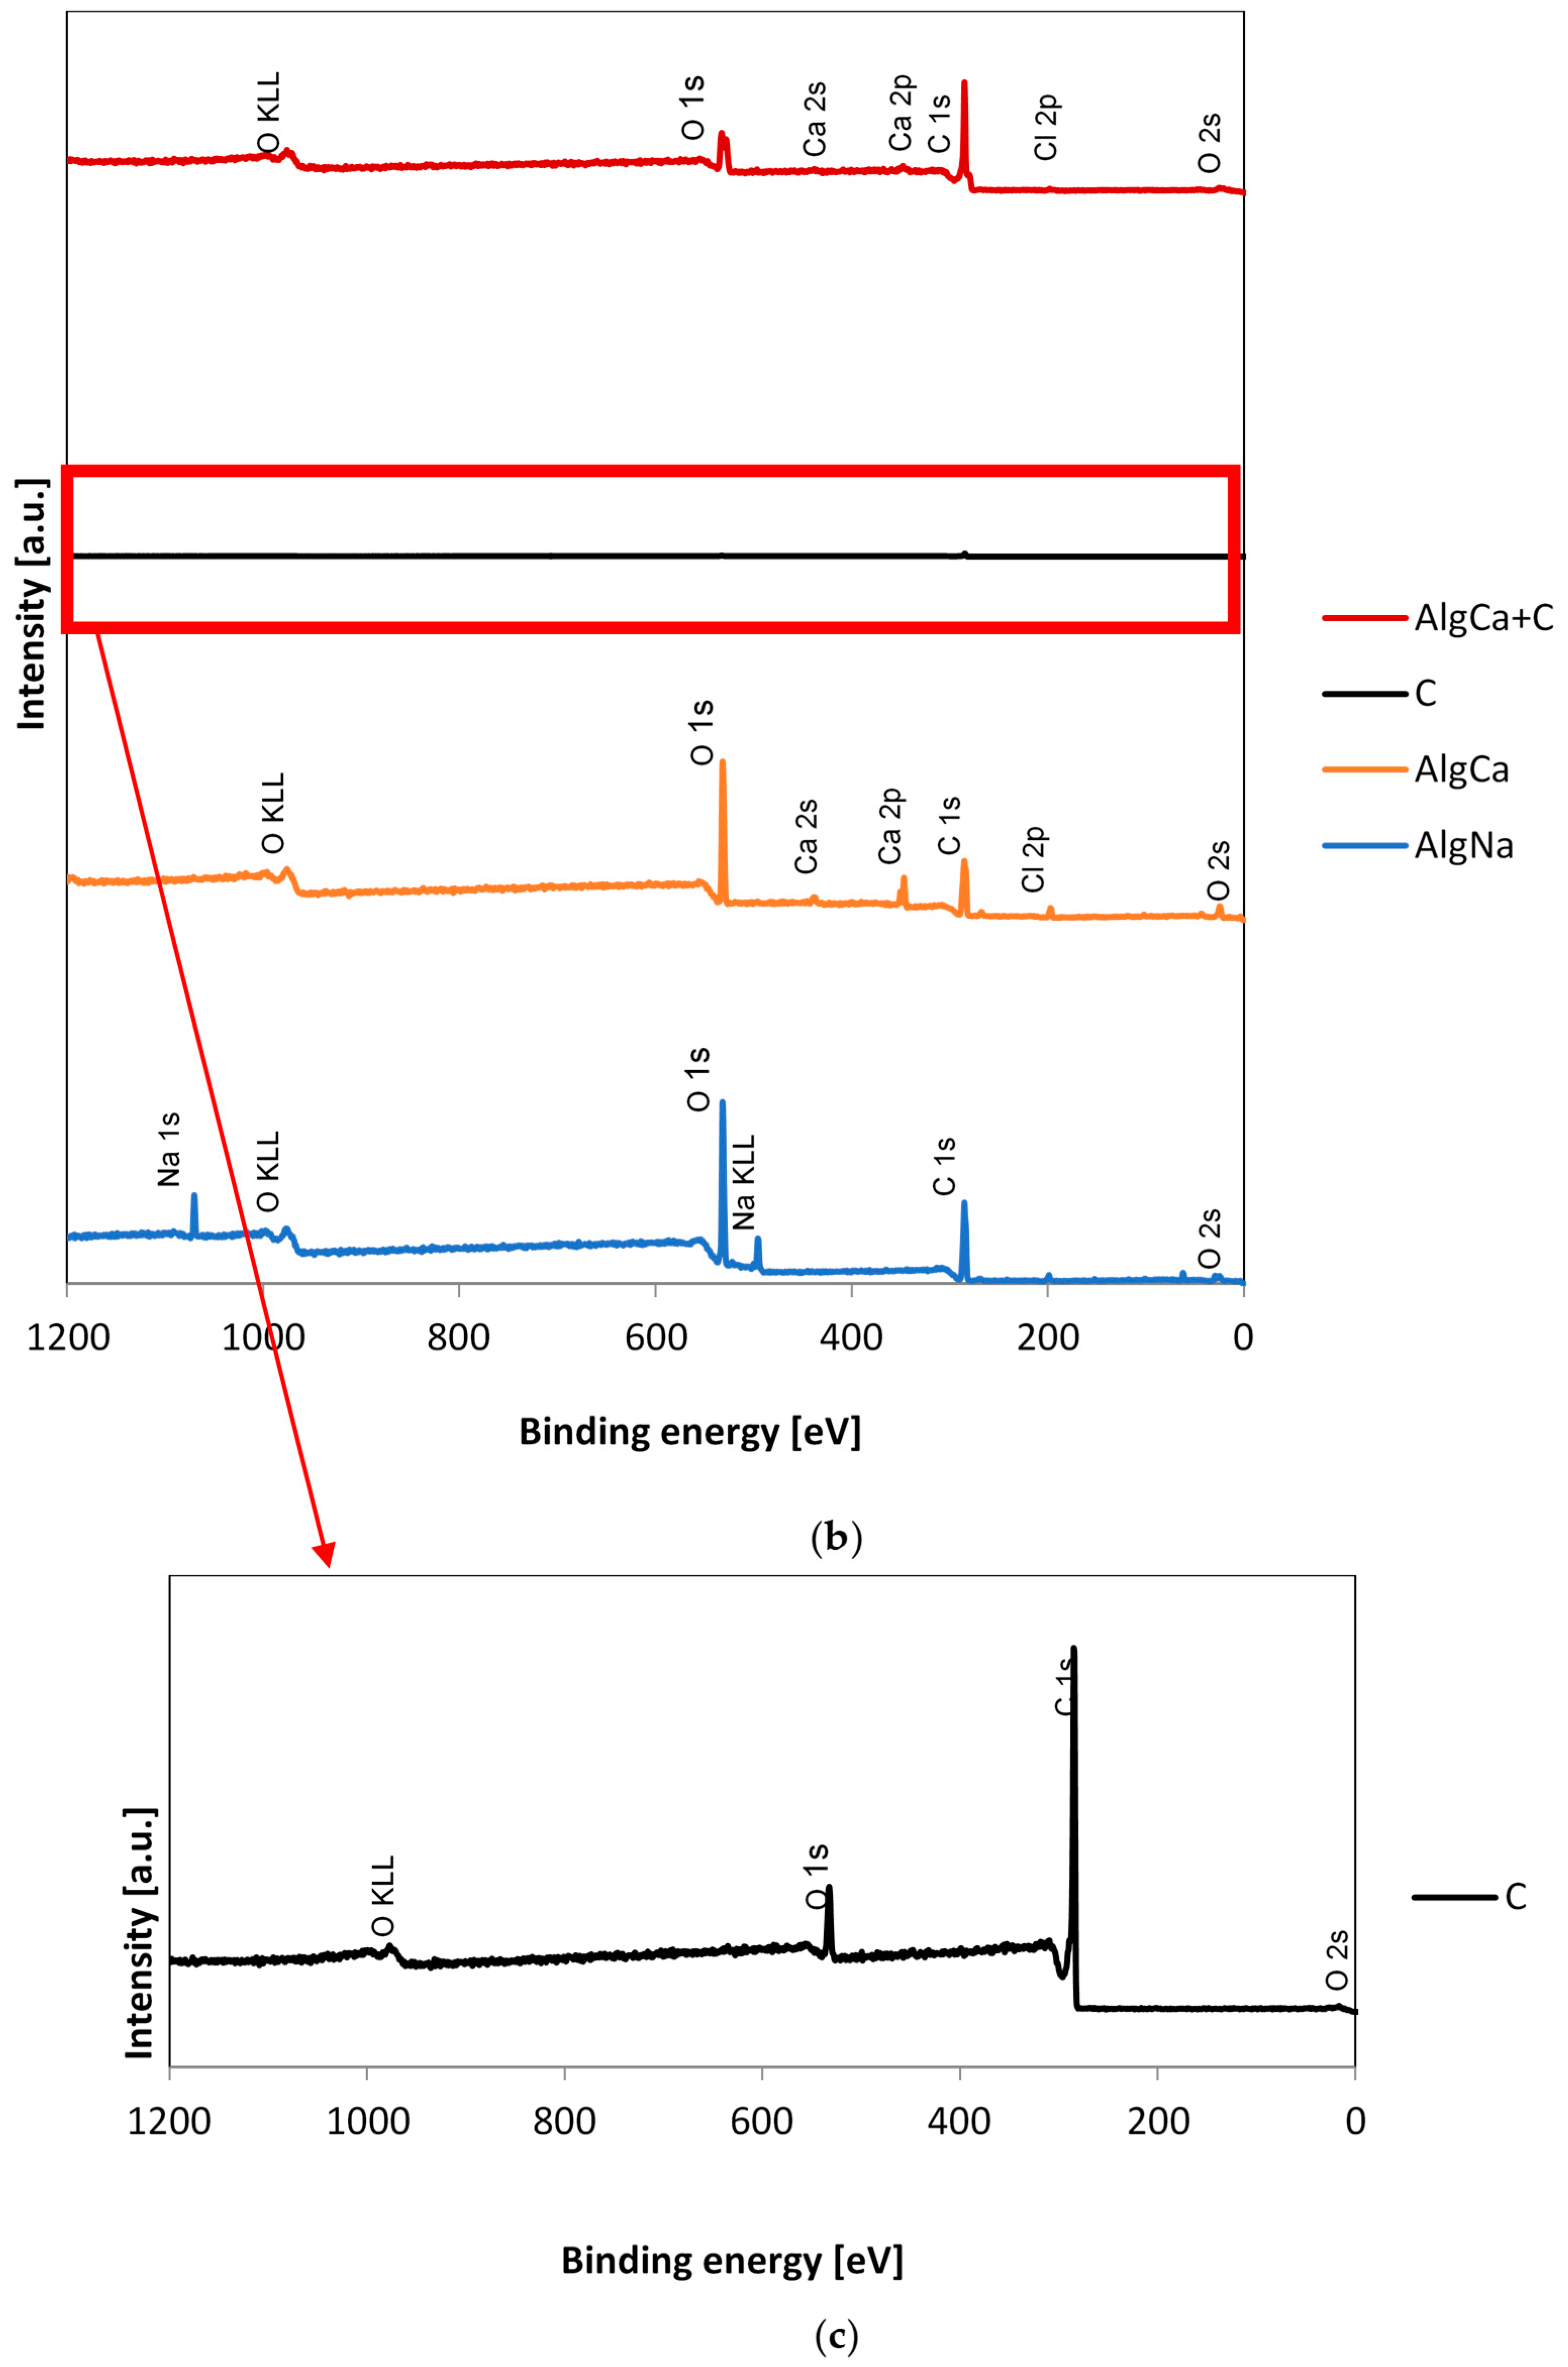
2.3.3. XPS
2.3.4. Thermal Analysis
2.3.5. pH Drift Method
2.3.6. Swelling Study
2.3.7. Adsorption Equilibrium
2.3.8. Adsorption Kinetics
3. Results
3.1. Nitrogen Adsorption/Desorption Studies
3.2. SEM
3.3. XPS
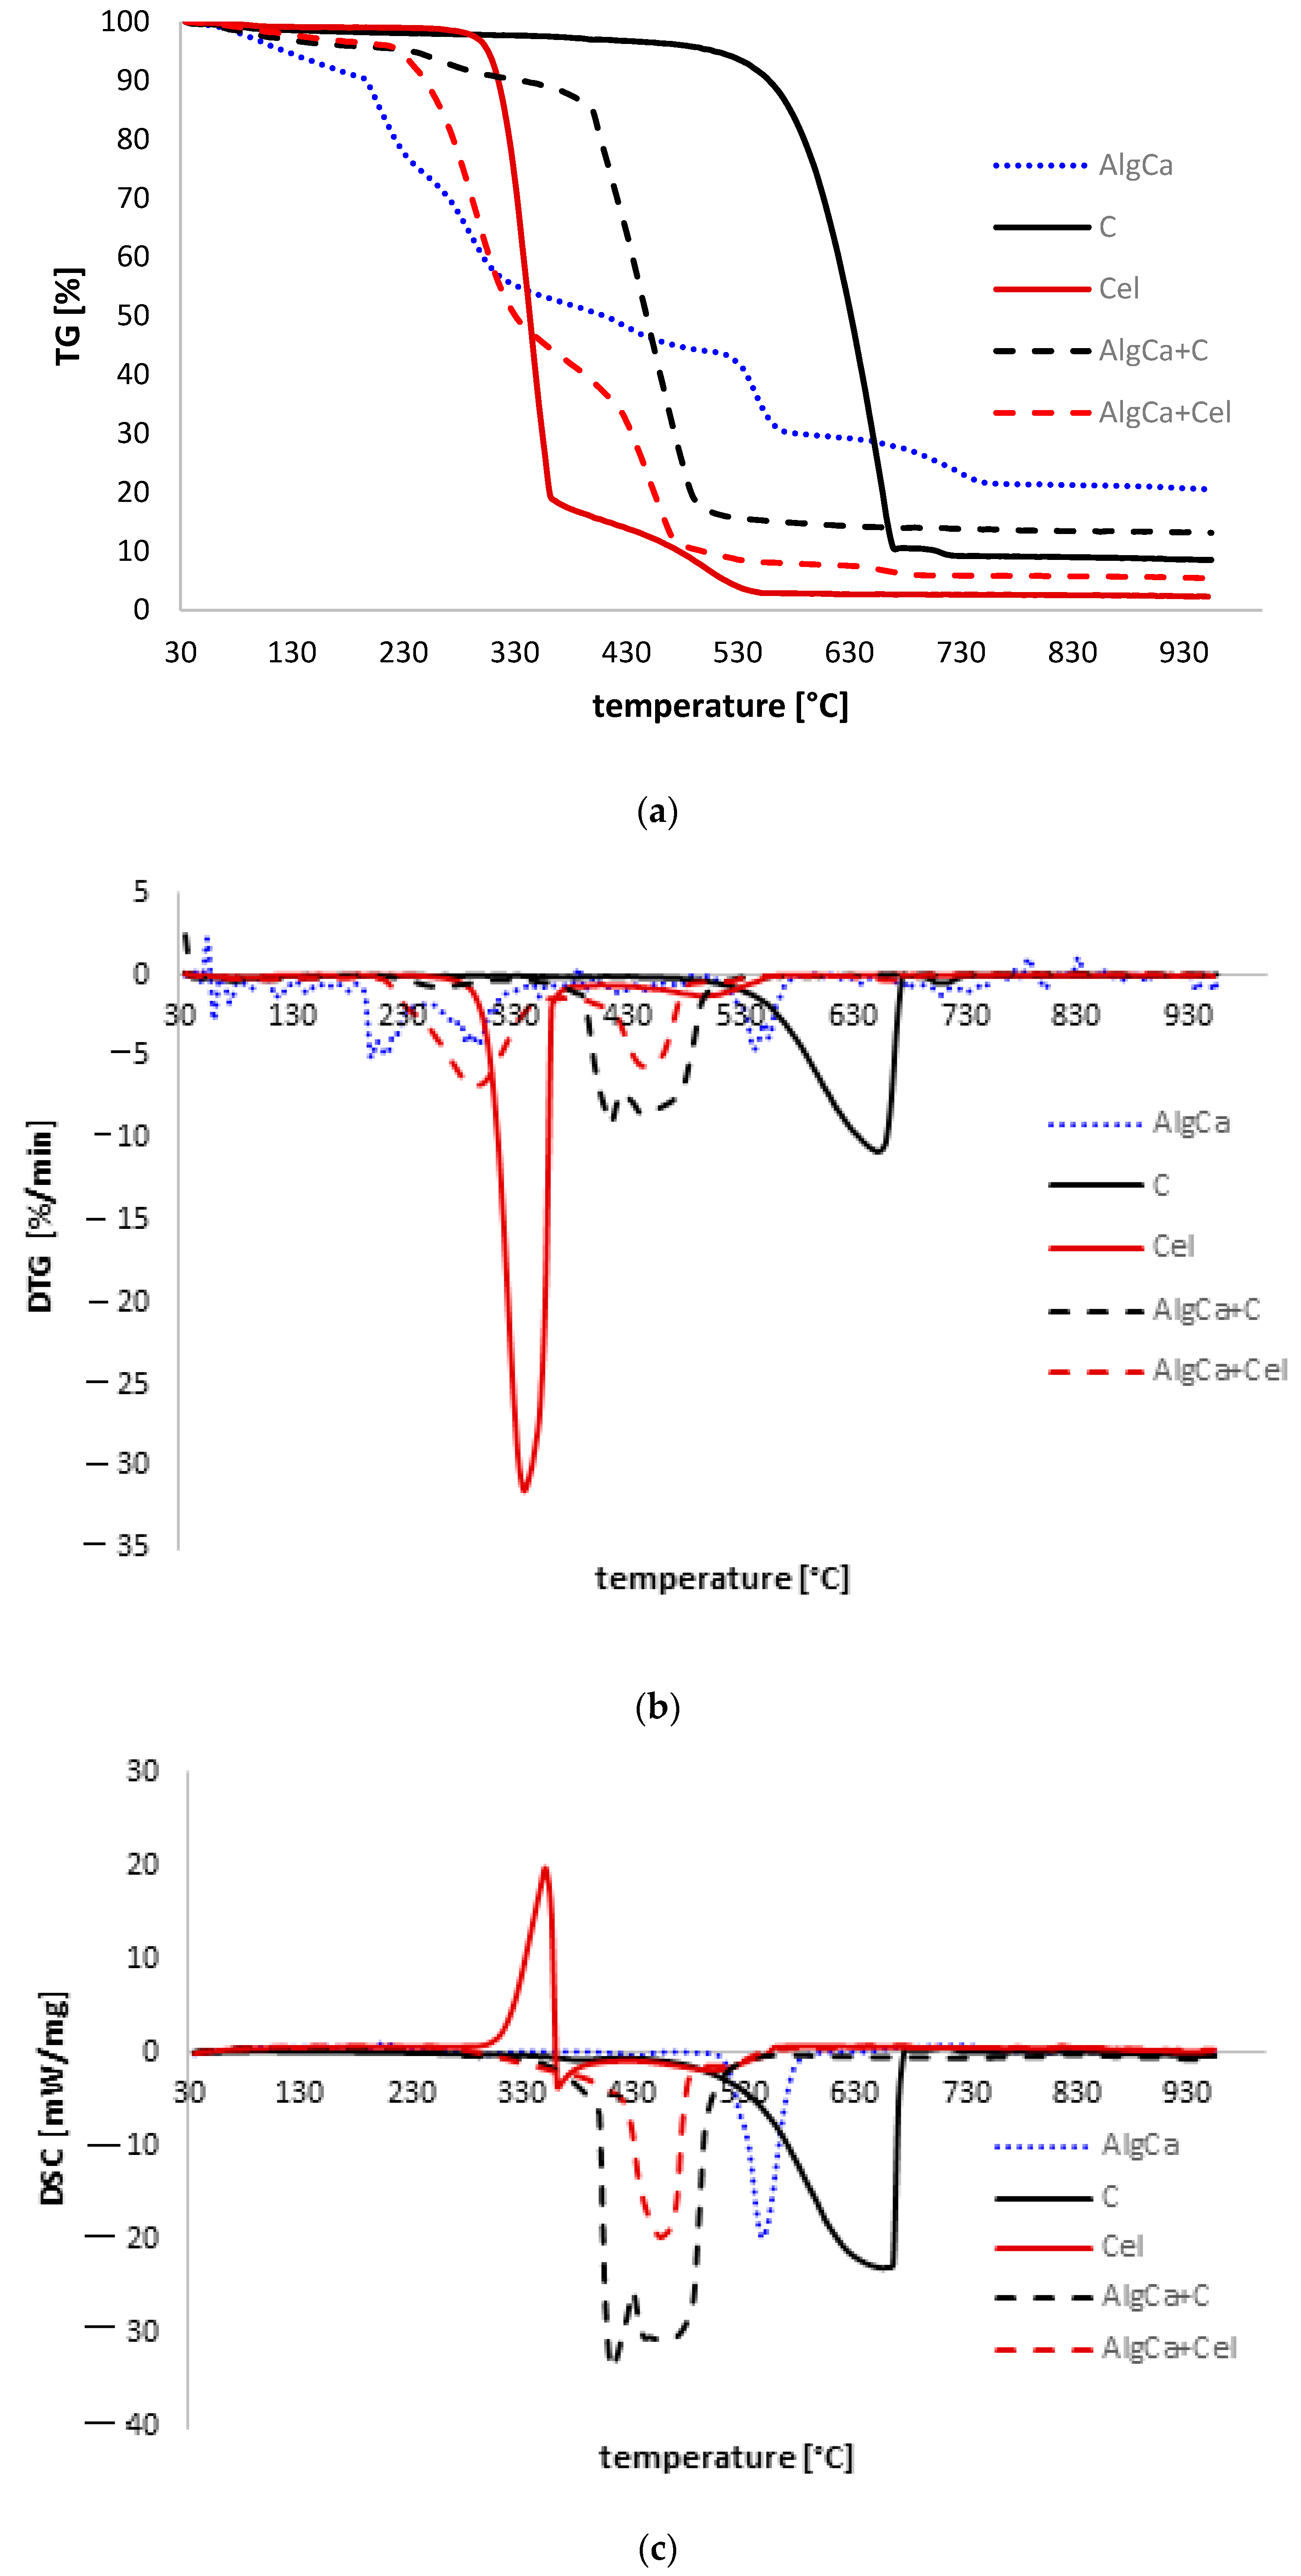
3.4. Thermal Analysis
3.5. pH Drift Method
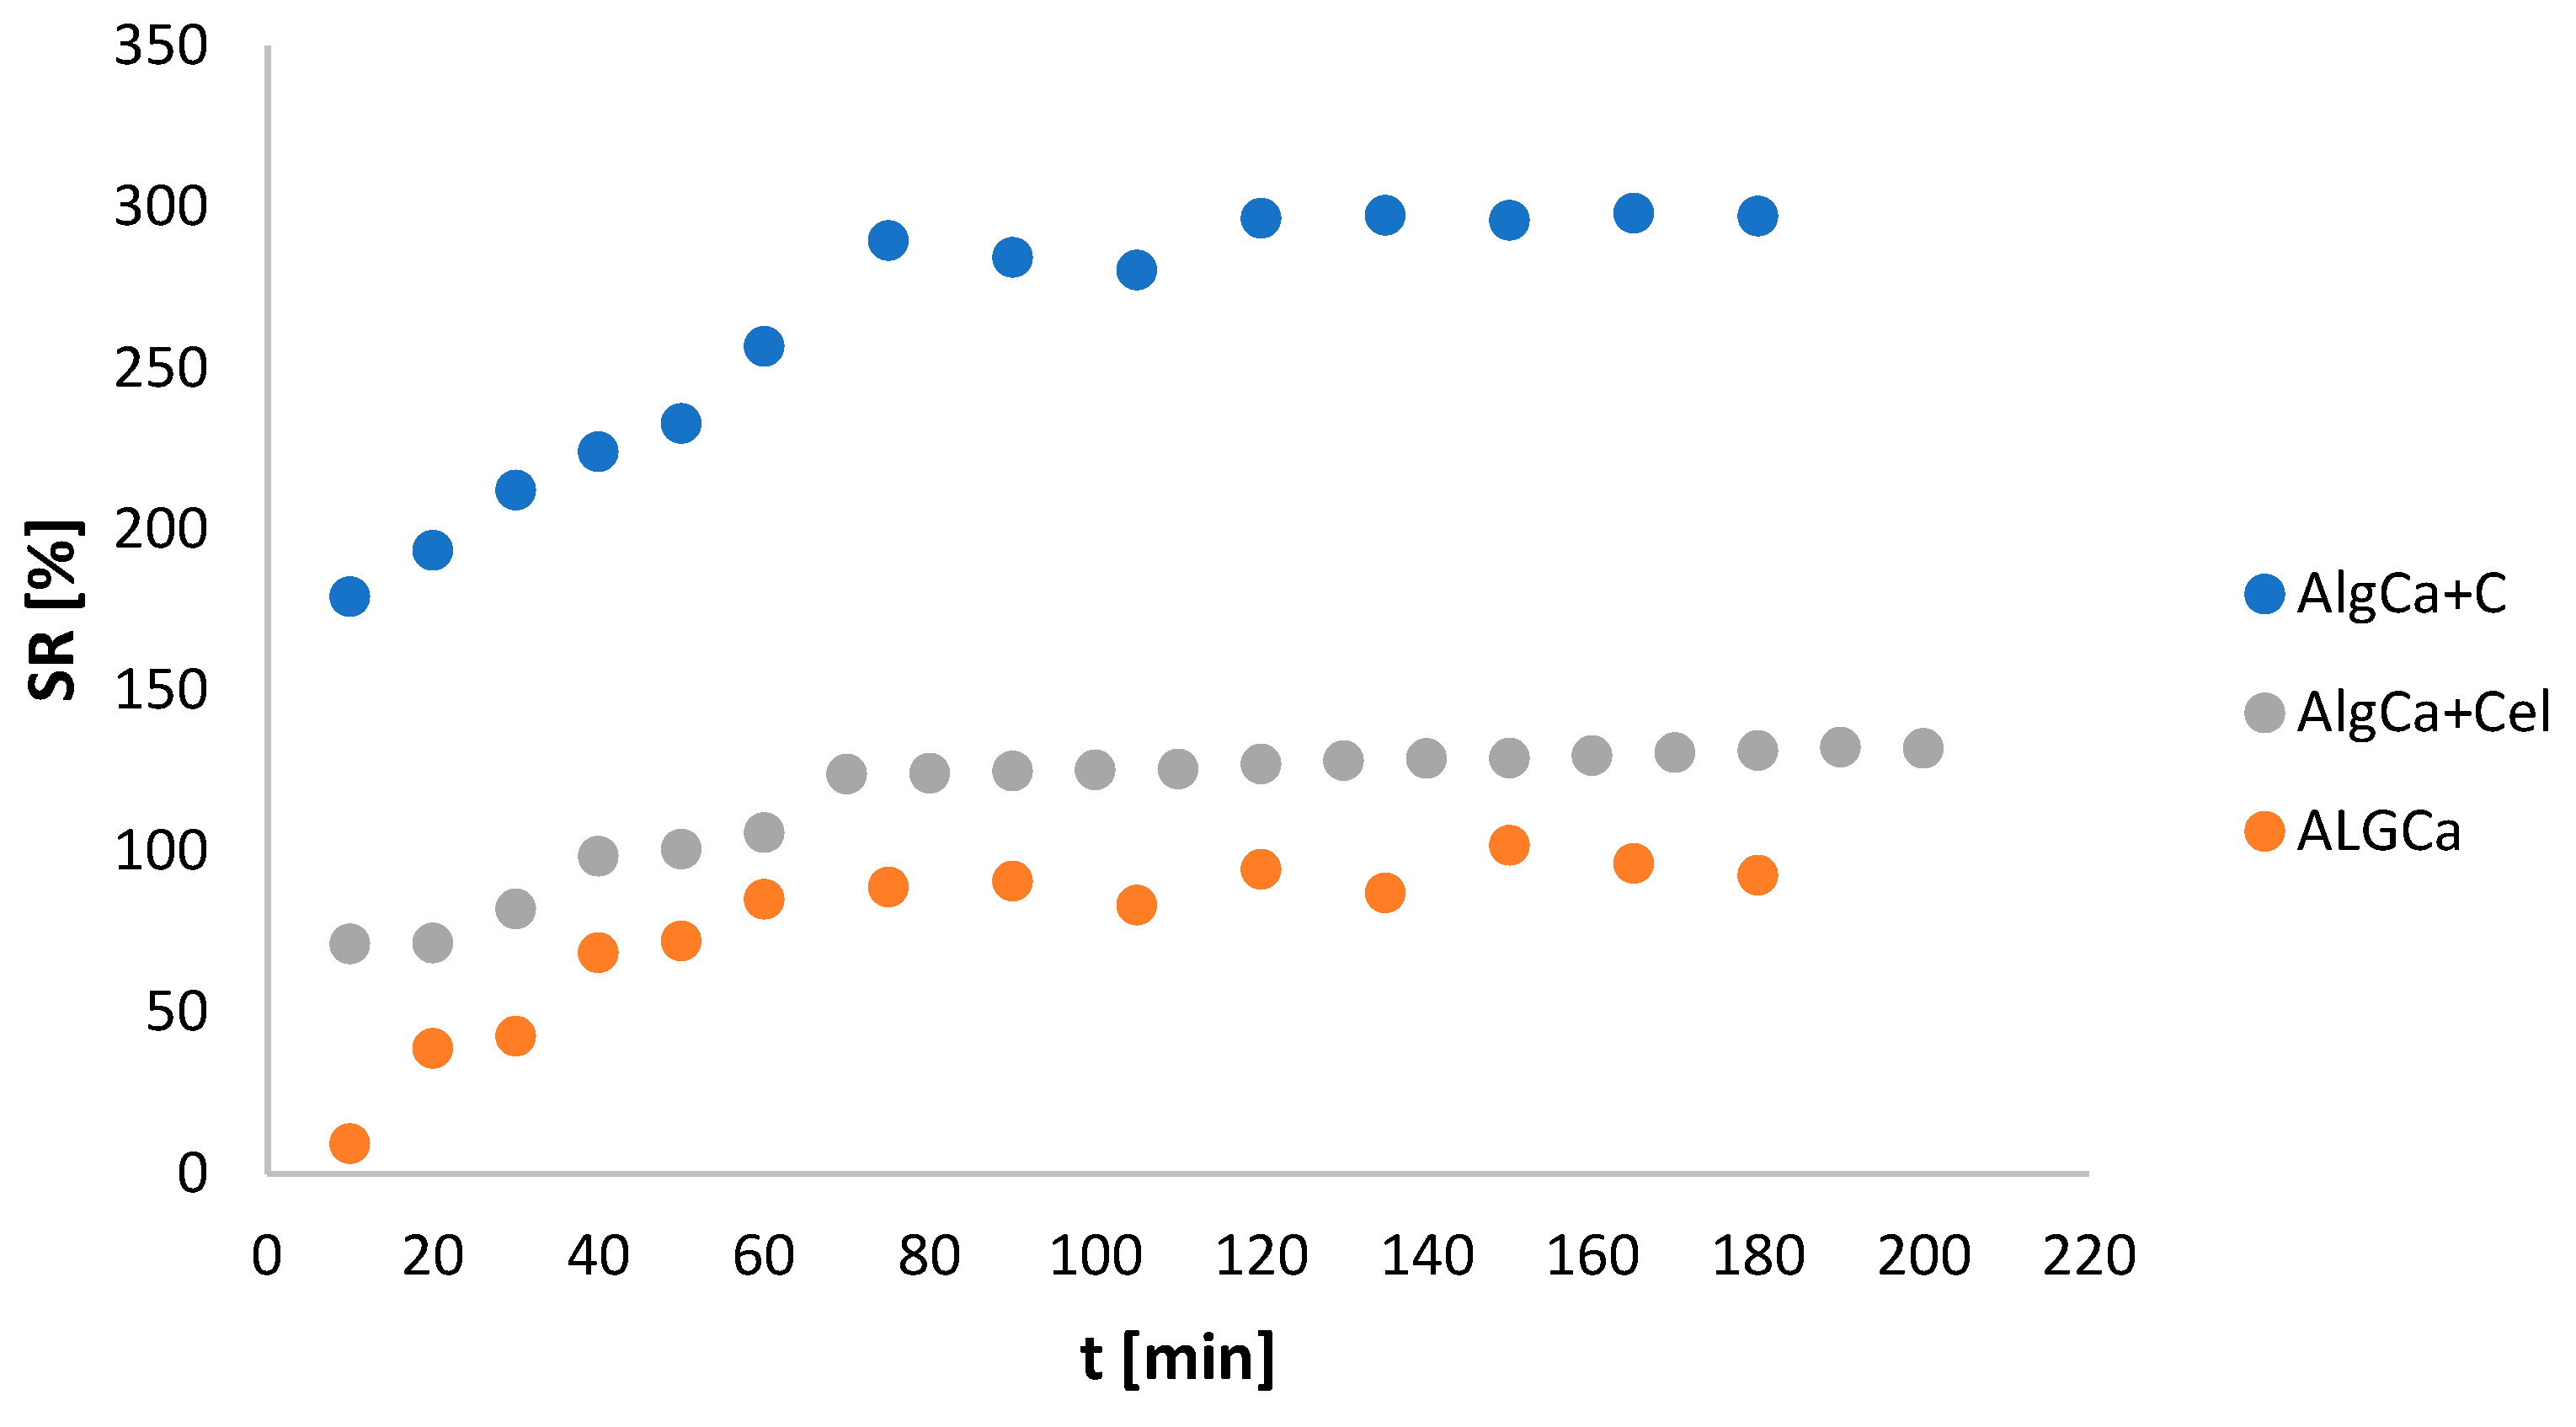
3.6. Determination of Swelling Index
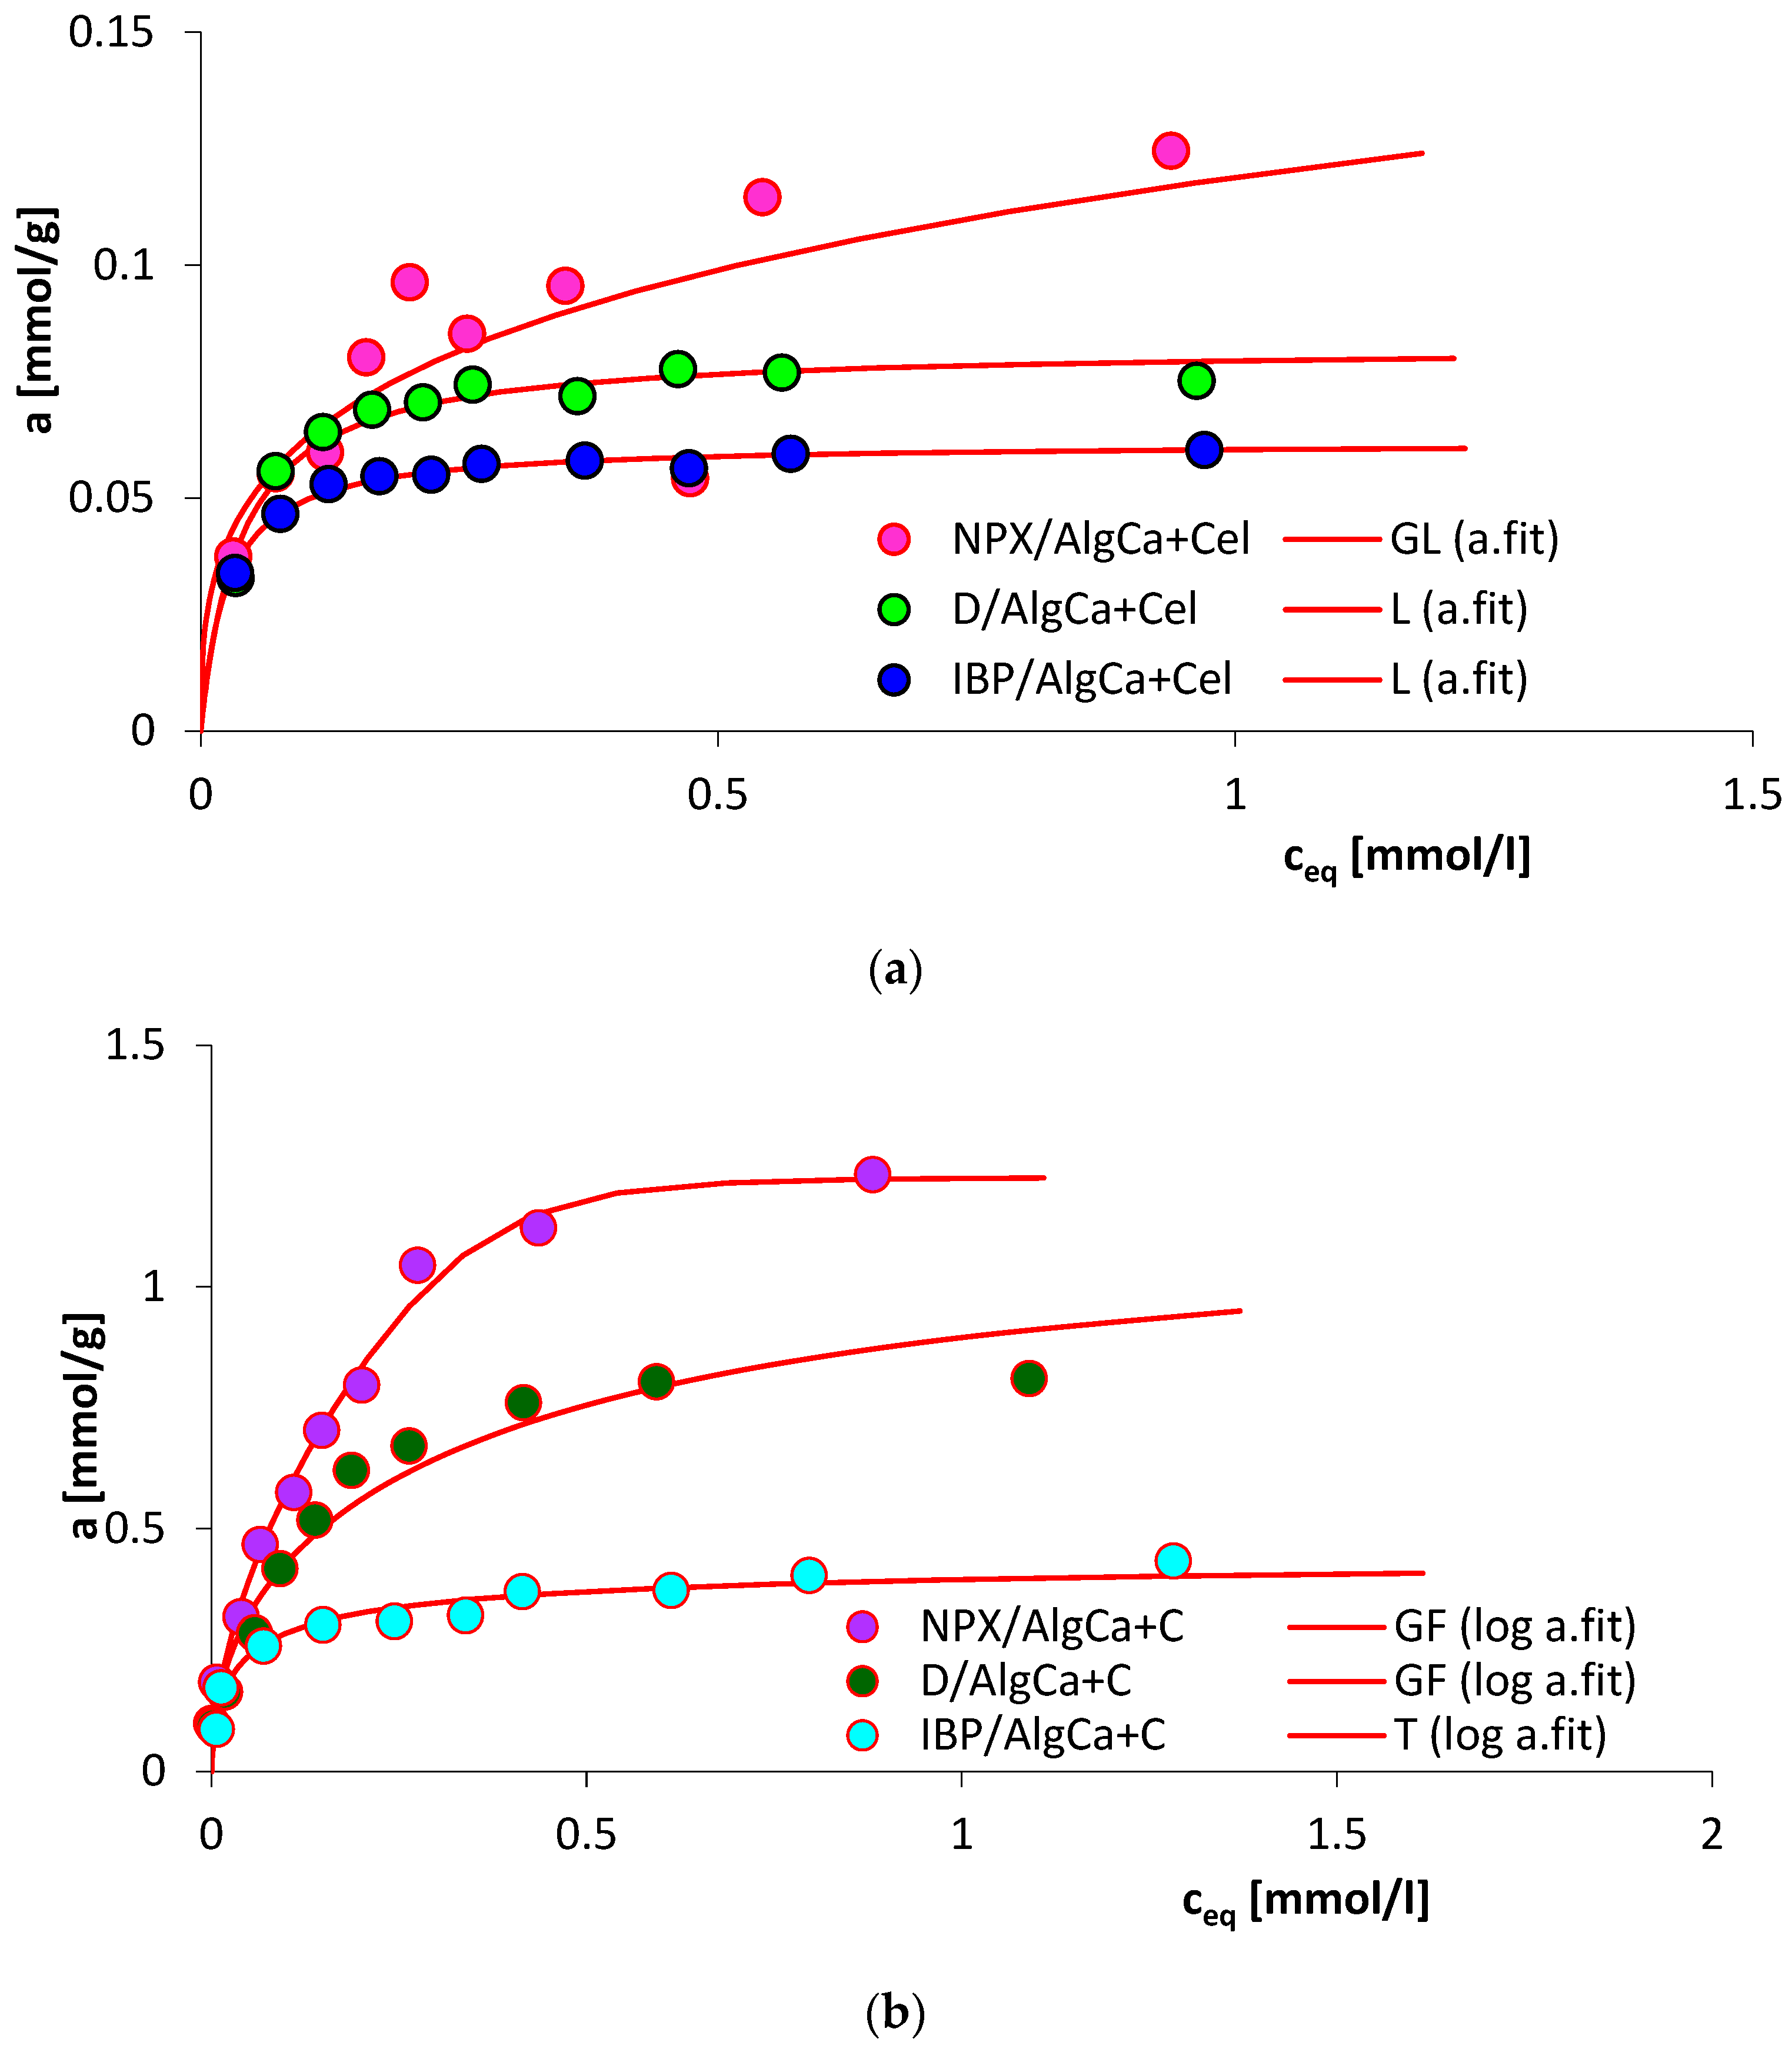
3.7. Adsorption Equilibrium
3.8. Adsorption Kinetics
4. Discussion
5. Conclusions
Supplementary Materials
Author Contributions
Funding
Institutional Review Board Statement
Informed Consent Statement
Data Availability Statement
Conflicts of Interest
References
- Kumar, A.; Patra, C.; Rajendran, H.K.; Narayanasamy, S. Activated carbon-chitosan based adsorbent for the efficient removal of the emerging contaminant diclofenac: Synthesis, characterization and phytotoxicity studies. Chemosphere 2022, 307, 135806. [Google Scholar] [CrossRef] [PubMed]
- Sigonya, S.; Mokhothu, T.H.; Mokhena, T.C.; Makhanya, T.R. Mitigation of Non-Steroidal Anti-Inflammatory and Antiretroviral Drugs as Environmental Pollutants by Adsorption Using Nanomaterials as Viable Solution—A Critical Review. Appl. Sci. 2023, 13, 772. [Google Scholar] [CrossRef]
- Lin, J.; Zhang, Y.; Bian, Y.; Zhang, Y.; Du, R.; Li, M.; Tan, Y.; Feng, X. Non-steroidal anti-inflammatory drugs (NSAIDs) in the environment: Recent updates on the occurrence, fate, hazards and removal technologies. Sci. Total Environ. 2023, 904, 166897. [Google Scholar] [CrossRef]
- Baratta, M.; Tursi, A.; Curcio, M.; Cirillo, G.; Nezhdanov, A.V.; Mashin, A.I.; Nicoletta, F.P.; De Filpo, G. Removal of Non-Steroidal Anti-Inflammatory Drugs from Drinking Water Sources by GO-SWCNT Buckypapers. Molecules 2022, 27, 7674. [Google Scholar] [CrossRef] [PubMed]
- Chu, K.H.; Al-Hamadani, Y.A.J.; Park, C.M.; Lee, G.; Jang, M.; Jang, A.; Her, N.; Son, A.; Yoon, Y. Ultrasonic treatment of endocrine disrupting compounds, pharmaceuticals, and personal care products in water: A review. Chem. Eng. J. 2017, 327, 629–647. [Google Scholar] [CrossRef]
- Ahmed, M.J. Adsorption of non-steroidal anti-inflammatory drugs from aqueous solution using activated carbons: Review. J. Environ. Manag. 2017, 190, 274–282. [Google Scholar] [CrossRef] [PubMed]
- Gadipelly, C.; Pérez-González, A.; Yadav, G.D.; Ortiz, I.; Ibáñez, R.; Rathod, V.K.; Marathe, K.V. Pharmaceutical Industry Wastewater: Review of the Technologies for Water Treatment and Reuse. Ind. Eng. Chem. Res. 2014, 53, 11571–11592. [Google Scholar] [CrossRef]
- Mansouri, F.; Chouchene, K.; Roche, N.; Ksibi, M. Removal of Pharmaceuticals from Water by Adsorption and Advanced Oxidation Processes: State of the Art and Trends. Appl. Sci. 2021, 11, 6659. [Google Scholar] [CrossRef]
- Mlunguza, N.Y.; Ncube, S.; Nokwethemba Mahlambi, P.; Chimuka, L.; Madikizela, L.M. Adsorbents and removal strategies of non-steroidal anti-inflammatory drugs from contaminated water bodies. J. Environ. Chem. Eng. 2019, 7, 103142. [Google Scholar] [CrossRef]
- Sarker, M.; Song, J.Y.; Jhung, S.H. Adsorptive removal of anti-inflammatory drugs from water using graphene oxide/metal-organic framework composites. Chem. Eng. J. 2018, 335, 74–81. [Google Scholar] [CrossRef]
- Simelane, N.P.; Asante, J.K.O.; Ndibewu, P.P.; Mramba, A.S.; Sibali, L.L. Biopolymer composites for removal of toxic organic compounds in pharmaceutical effluents—A review. Carbohydr. Polym. Technol. Appl. 2022, 4, 100239. [Google Scholar] [CrossRef]
- Persano, F.; Malitesta, C.; Mazzotta, E. Cellulose-Based Hydrogels for Wastewater Treatment: A Focus on Metal Ions Removal. Polymers 2024, 16, 1292. [Google Scholar] [CrossRef] [PubMed]
- Zhang, W.; Ou, J.; Wang, B.; Wang, H.; He, Q.; Song, J.; Zhang, H.; Tang, M.; Zhou, L.; Gao, Y.; et al. Efficient heavy metal removal from water by alginate-based porous nanocomposite hydrogels: The enhanced removal mechanism and influencing factor insight. J. Hazard. Mater. 2021, 418, 126358. [Google Scholar] [CrossRef]
- Chen, M.; Long, A.; Zhang, W.; Wang, Z.; Xiao, X.; Gao, Y.; Zhou, L.; Li, Y.; Wang, J.; Sun, S.; et al. Recent advances in alginate-based hydrogels for the adsorption–desorption of heavy metal ions from water: A review. Sep. Purif. Technol. 2025, 353, 128265. [Google Scholar] [CrossRef]
- Hu, Z.H.; Omer, A.M.; Ouyang, X.K.; Yu, D. Fabrication of carboxylated cellulose nanocrystal/sodium alginate hydrogel beads for adsorption of Pb(II) from aqueous solution. Int. J. Biol. Macromol. 2018, 108, 149–157. [Google Scholar] [CrossRef] [PubMed]
- Dong, Y.D.; Zhang, H.; Zhong, G.J.; Yao, G.; Lai, B. Cellulose/carbon Composites and their Applications in Water Treatment—A Review. Chem. Eng. J. 2021, 405, 126980. [Google Scholar] [CrossRef]
- Qamar, S.A.; Qamar, M.; Basharat, A.; Bilal, M.; Cheng, H.; Iqbal, H.M.N. Alginate-based nano-adsorbent materials—Bioinspired solution to mitigate hazardous environmental pollutants. Chemosphere 2022, 288, 132618. [Google Scholar] [CrossRef] [PubMed]
- Wasilewska, M.; Deryło-Marczewska, A. Adsorption of Non-Steroidal Anti-Inflammatory Drugs on Alginate-Carbon Composites—Equilibrium and Kinetics. Materials 2022, 15, 6049. [Google Scholar] [CrossRef]
- Available online: http://pubchem.ncbi.nlm.nih.gov (accessed on 18 November 2024).
- Liu, Y.; An, M.; Wang, L.; Qiu, H. Preparation and characterization of chitosan-gelatin/glutaraldehyde scaffolds. J. Macromol. Sci. Part B 2014, 53, 309–325. [Google Scholar] [CrossRef]
- Marczewski, A.W.; Jaroniec, M. A new isotherm equation for single-solute adsorption from dilute solutions on energetically heterogeneous solids—Short communication. Monatshefte Chem. Chem. Mon. 1983, 114, 711–715. [Google Scholar] [CrossRef]
- Jaroniec, M.; Marczewski, A.W. Physical adsorption of gases on energetically heterogeneous solids I. Generalized Langmuir equation and its energy distribution. Monatshefte Chem. Chem. Mon. 1984, 115, 997–1012. [Google Scholar] [CrossRef]
- Lagergren, S. Zur Theorie der Sogenannten Adsorption Geloster Stoffe. K. Sven. Vetensk. Akad. Handl. 1898, 24, 1–39. [Google Scholar]
- Azizian, S. Kinetic models of sorption: A theoretical analysis. J. Colloid Interface Sci. 2004, 276, 47–52. [Google Scholar] [CrossRef]
- Marczewski, A.W. Kinetics and equilibrium of adsorption of organic solutes on mesoporous carbons. Appl. Surf. Sci. 2007, 253, 5818–5826. [Google Scholar] [CrossRef]
- Ho, Y.S.; McKay, G. Sorption of dye from aqueous solution by peat. Chem. Eng. J. 1988, 70, 115–124. [Google Scholar] [CrossRef]
- Marczewski, A.W. Application of mixed order rate equations to adsorption of methylene blue on mesoporous carbons. Appl. Surf. Sci. 2010, 256, 145–5152. [Google Scholar] [CrossRef]
- Marczewski, A.W. Analysis of kinetic Langmuir model. Part I: Integrated kinetic Langmuir equation (IKL): A new complete analytical solution of the Langmuir rate equation. Langmuir 2010, 26, 15229–15238. [Google Scholar] [CrossRef] [PubMed]
- Marczewski, A.W.; Deryło-Marczwska, A.; Słota, A. Adsorption and desorption kinetics of benzene derivatives on mesoporous carbons. Adsorption 2013, 19, 391–406. [Google Scholar] [CrossRef]
- Haerifar, M.; Azizian, S. Fractal-like adsorption kinetics at the solid/solution interface. J. Phys. Chem. C 2012, 116, 13111–13119. [Google Scholar] [CrossRef]
- Alothman, Z.A. A review: Fundamental aspects of silicate mesoporous materials. Materials 2012, 5, 2874–2902. [Google Scholar] [CrossRef]
- Sing, K.S.W.; Williams, R.T. Physisorption hysteresis loops and the characterization of nanoporous materials. Adsorpt. Sci. Technol. 2004, 22, 772–782. [Google Scholar] [CrossRef]
- Shamsudin, M.S.; Azha, S.F.; Sellaoui, L.; Badawi, M.; Bonilla-Petriciolet, A.; Ismail, S. Performance and interactions of diclofenac adsorption using Alginate/Carbon-based Films: Experimental investigation and statistical physics modelling. Chem. Eng. J. 2022, 428, 131929. [Google Scholar] [CrossRef]
- Lee, J.W.; Han, J.; Choi, Y.K.; Park, S.; Lee, S.H. Reswellable alginate/activated carbon/carboxymethyl cellulose hydrogel beads for ibuprofen adsorption from aqueous solutions. Int. J. Biol. Macromol. 2023, 249, 126053. [Google Scholar] [CrossRef] [PubMed]
- Show, S.; Sarkhel, R.; Halder, G. Elucidating sorptive eradication of ibuprofen using calcium chloride caged bentonite clay and acid activated alginate beads in a fixed bed upward flow column reactor. Sustain. Chem. Pharm. 2022, 27, 100698. [Google Scholar] [CrossRef]
- Silva, E.C.; Soares, V.R.; Fajardo, A.R. Removal of pharmaceuticals from aqueous medium by alginate/polypyrrole/ZnFe2O4 beads via magnetic field enhanced adsorption. Chemosphere 2023, 316, 137734. [Google Scholar] [CrossRef] [PubMed]
- Chakraborty, P.; Halder, G. Ibuprofen sorptive efficacy of zirconium caged date seed derived steam activated alginate beads in a static bed column. RSC Adv. 2020, 10, 24293–24307. [Google Scholar] [CrossRef]
- Karimi, S.; Namazi, H. Efficient adsorptive removal of used drugs during the COVID-19 pandemic from contaminated water by magnetic graphene oxide/MIL-88 metal-organic framework/alginate hydrogel beads. Chemosphere 2024, 352, 141397. [Google Scholar] [CrossRef] [PubMed]
- Liu, Y.; Xiong, Y.S.; Li, M.X.; Li, W.; Li, K. Polyethyleneimine-functionalized magnetic sugarcane bagasse cellulose film for the efficient adsorption of ibuprofen. Int. J. Biol. Macromol. 2024, 265, 130969. [Google Scholar] [CrossRef]
- Al-Hazmi, G.A.A.M.; Alayyafi, A.A.A.; El-Desouky, M.G.; El-Bindary, A.A. Guava seed activated carbon loaded calcium alginate aerogel for the adsorption of diclofenac sodium: Characterization, isotherm, kinetics, and optimization via Box-Behnken design. Int. J. Biol. Macromol. 2024, 262, 129995. [Google Scholar] [CrossRef]


| Adsorbate | Chemical Formula | M a [g/mol] | cs b [mg/mL at 25 °C] | pKa c | d m.p. [°C] | e b.p. [°C] | f T.P.S.A. [Å2] |
|---|---|---|---|---|---|---|---|
| IBP |  | 228.26 | 100 | 4.91 | 75–77 | 319.6 | 40.1 |
| NPX |  | 252.24 | 76 | 4.15 | 250–251 | 403.9 | 49.4 |
| D |  | 318.13 | 50 | 4.15 | 288–290 | 412 | 52.2 |
| Adsorbent | Surface Area [m2/g] | Pore Volume [cm3/g] | Pore Size [nm] | |||
|---|---|---|---|---|---|---|
| SBET a | Sext b | Vt c | Vmes d | Vmic e | Dh f | |
| C | 1376 | 691 | 0.87 | 0.21 | 0.55 | 2.68 |
| AlgCa + C | 1151 | 709 | 0.69 | 0.28 | 0.23 | 3.76 |
| Cel | 1.35 | 0.97 | 0.0065 | 0.0039 | - | 19.13 |
| AlgCa + Cel | 0.18 | 0.18 | 0.0013 | - | - | 16.97 |
| Sample | Name | Peak Position [eV] | Full Width at Half Maximum (FWHM) | Atomic Concentration [at.%] |
|---|---|---|---|---|
| AlgNa | C 1s | 285.0 | 3.3 | 64.4 |
| O 1s | 531.8 | 2.3 | 33.3 | |
| Na 1s | 1070.3 | 1.9 | 2.3 | |
| AlgCa | C 1s | 285.0 | 4.3 | 57.4 |
| O 1s | 531.8 | 2.8 | 33.9 | |
| Ca 2p | 346.5 | 2.0 | 4.3 | |
| Cl 2p | 197.3 | 2.9 | 3.0 | |
| Cel | C 1s | 285.0 | 2.0 | 59.2 |
| O 1s | 531.8 | 1.8 | 40.8 | |
| C | C 1s | 284.0 | 2.25 | 95.1 |
| O 1s | 531.5 | 3.93 | 4.9 | |
| AlgCa + Cel | C 1s | 285.0 | 2.2 | 57.2 |
| O 1s | 531.8 | 2.0 | 40.1 | |
| Ca 2p | 346.5 | 1.9 | 1.4 | |
| Cl 2p | 196.5 | 3.1 | 1.3 | |
| AlgCa + C | C 1s | 285.0 | 2.1 | 78.3 |
| O 1s | 532.5 | 7.5 | 19.5 | |
| Ca 2p | 347.3 | 3.5 | 0.7 | |
| Cl 2p | 198.0 | 2.0 | 1.5 |
| Sample | Name | Peak Position [eV] | Full Width at Half Maximum (FWHM) | Atomic Concentration [at.%] | Suggested Binding |
|---|---|---|---|---|---|
| AlgNa | C 1s A | 285.0 | 1.2 | 26.3 | C-C/C-H |
| C 1s B | 286.6 | 1.1 | 30.9 | C-OH/C-O-C | |
| C 1s C | 288.1 | 1.4 | 12.5 | O-C-O | |
| C 1s D | 289.3 | 1.3 | 1.3 | COOR | |
| O 1s A | 531.4 | 1.38 | 21.3 | O=C-O-R/O-Na | |
| O 1s B | 532.9 | 1.35 | 54.1 | C-OH | |
| O 1s C | 533.4 | 1.35 | 24.6 | C-O-C/O=C-O-R | |
| AlgCa | C 1s A | 285.0 | 1.3 | 36.2 | C-C/C-H |
| C 1s B | 286.8 | 1.4 | 42.3 | C-OH/C-O-C | |
| C 1s C | 288.5 | 1.4 | 18.4 | O-C-O | |
| C 1s D | 289.3 | 1.3 | 3.1 | COOR | |
| O 1s A | 531.8 | 1.53 | 29.6 | O=C-O-R/O-Ca | |
| O 1s B | 533.1 | 1.58 | 48.5 | C-OH | |
| O 1s C | 533.7 | 1.58 | 21.9 | C-O-C/O=C-O-R | |
| Ca 2p A | 347.9 | 1.45 | 52.6 | Ca 2p 3/2 | |
| Ca 2p B | 351.4 | 1.48 | 47.4 | Ca 2p 1/2 | |
| Cel | C 1s A | 285.0 | 1.3 | 10.1 | C-C/C-H |
| C 1s B | 286.7 | 1.1 | 73.0 | C-OH/C-O-C | |
| C 1s C | 288.1 | 1.0 | 14.9 | C-OH | |
| C 1s D | 289.1 | 1.4 | 2.0 | COOH | |
| O 1s A | 532.9 | 1.25 | 60.0 | C-OH | |
| O 1s B | 533.5 | 1.25 | 40.0 | C-O-C | |
| C | C 1s A | 285.00 | 0.71 | 8.5 | C-H sp3 |
| C 1s B | 284.53 | 0.66 | 56.7 | C=C sp2 | |
| C 1s C | 285.67 | 0.73 | 4.1 | C-C sp3 | |
| C 1s D | 286.32 | 0.75 | 3.1 | C-OH | |
| C 1s E | 287.13 | 0.79 | 1.3 | C-O-C | |
| C 1s F | 288.24 | 0.77 | 0.2 | C=O | |
| C 1s G | 284.10 | 0.66 | 26.2 | O=C-O- | |
| O 1s A | 530.30 | 1.34 | 12.67 | O−2, O=<=>=O | |
| O 1s B | 531.43 | 1.32 | 26.67 | O=C-O, O=C | |
| O 1s C | 532.68 | 1.32 | 33.03 | C-O, O=C | |
| O 1s D | 533.75 | 1.32 | 18.95 | OH-C, O-C=O | |
| O 1s E | 535.40 | 1.70 | 8.68 | H2O/O2 | |
| AlgCa + Cel | C 1s A | 285.0 | 1.2 | 13.9 | C-C/C-H |
| C 1s B | 286.8 | 1.1 | 67.9 | C-OH/C-O-C | |
| C 1s C | 288.2 | 1.0 | 13.9 | C-OH | |
| C 1s D | 289.0 | 1.3 | 4.3 | COOH | |
| O 1s A | 533.0 | 1.29 | 54.6 | C-OH | |
| O 1s B | 533.6 | 1.29 | 36.4 | C-O-C | |
| O 1s C | 531.6 | 1.62 | 9.0 | O-Ca/O=C-O-R | |
| Ca 2p A | 347.9 | 1.48 | 50.5 | Ca 2p 3/2 | |
| Ca 2p B | 351.5 | 1.50 | 49.5 | Ca 2p 1/2 | |
| AlgCa + C | C 1s A | 284.4 | 0.9 | 66.1 | C=C sp2 (carbon) |
| C 1s B | 286.5 | 1.5 | 5.9 | C-OH (carbon) | |
| C 1s C | 288.0 | 1.5 | 2.7 | C=O (carbon) | |
| C 1s D | 289.2 | 1.5 | 1.8 | COOR (carbon) | |
| C 1s E | 278.9 | 1.5 | 7.5 | C-C/C-H (alginate) | |
| C 1s F | 280.7 | 1.5 | 7.5 | C-OH/C-O-C (alginate) | |
| C 1s G | 282.2 | 1.4 | 4.2 | O-C-O (alginate) | |
| C 1s H | 283.2 | 1.5 | 4.3 | COOR (alginate) |
| System | Isotherm Type | am a | m b | n b | logK c | R2 d | SD(a) e |
|---|---|---|---|---|---|---|---|
| NPX/AlgCa + C | GF | 1.24 | 0.51 | 1 | 0.47 | 0.988 | 0.018 |
| IBP/AlgCa + C | T | 0.47 | 1 | 0.53 | 1.96 | 0.961 | 0.046 |
| D/AlgCa + C | GF | 0.89 | 0.48 | 1 | 0.11 | 0.975 | 0.041 |
| NPX/AlgCa + Cel | GL | 0.14 | 0.78 | 0.54 | 0.31 | 0.941 | 0.043 |
| IBP/AlgCa + Cel | L | 0.06 | 1 | 1 | 0.87 | 0.948 | 0.062 |
| D/AlgCa + Cel | L | 0.08 | 1 | 1 | 0.91 | 0.962 | 0.045 |
| System | m-exp [%] | FOE [%] | SOE [%] | MOE [%] | f-FOE [%] | f-SOE [%] | f-MOE [%] |
|---|---|---|---|---|---|---|---|
| NPX/AlgCa + C | 0.798 | 2.489 | 3.105 | 1.129 | 0.983 | 1.984 | 0.864 |
| IBP/AlgCa + C | 0.739 | 2.991 | 3.115 | 0.926 | 1.041 | 1.684 | 1.101 |
| D/AlgCa + C | 0.871 | 5.312 | 2.009 | 1.078 | 0.903 | 1.742 | 0.986 |
| System | f1 a, log k1 b | f2 a, log k2 b | ueq c | t1/2 d [min] | SD(c)/co e [%] | 1 − R2 f |
|---|---|---|---|---|---|---|
| NPX/AlgCa + C | 0.532, −3.14 | 0.468, −2.48 | 0.996 | 415.7 | 0.798 | 6.5 × 10⁻⁴ |
| IBP/AlgCa + C | 0.538, −3.26 | 0.462, −2.58 | 1 | 529.8 | 0.739 | 3.9 × 10⁻⁴ |
| D/AlgCa + C | 0.719, −3.36 | 0.281, −2.52 | 1 | 842.3 | 0.871 | 6.9 × 10⁻⁴ |
| Adsorbent | Adsorbate | pH | Dosage (g L−1) | T (K) | qmax (mg g−1) | SBET (m2 g−1) | Reference |
|---|---|---|---|---|---|---|---|
| activated carbon–chitosan beads | diclofenac | 6 | 1.5 | 313 | 99.29 | [1] | |
| alginate–carbon films | diclofenac | 3 | 1 | 303 | 37.01 | 35.16 | [33] |
| alginate (Alg) composite beads with activated carbon (AC) | ibuprofen | 39.6 | [34] | ||||
| alginate (Alg) composite beads with activated carbon (AC) and carboxymethyl cellulose (CMC) | ibuprofen | 48.1 | [34] | ||||
| calcium chloride-caged acid-activated tamarind seed and bentonite alginate beads | ibuprofen | 17.54 | [35] | ||||
| alginate/polypyrrole/ZnFe2O4 beads | ibuprofen | 7 | 298 | 108.2 | [36] | ||
| alginate/polypyrrole/ZnFe2O4 beads | acetaminophen | 7 | 298 | 106.7 | [36] | ||
| zirconium allied alginate beads | ibuprofen | 23.33 | [37] | ||||
| alginate hydrogel beads of magnetic graphene oxide@MIL-88 metal–organic framework | naproxen | 298 | 55.55 | [38] | |||
| polyethyleneimine-modified magnetic sugarcane bagasse cellulose film | ibuprofen | 4 | 0.25 | 318 | 370.52 | [39] | |
| guava seed-activated carbon-loaded calcium alginate aerogel | diclofenac | 489.97 | 738.82 | [40] |
Disclaimer/Publisher’s Note: The statements, opinions and data contained in all publications are solely those of the individual author(s) and contributor(s) and not of MDPI and/or the editor(s). MDPI and/or the editor(s) disclaim responsibility for any injury to people or property resulting from any ideas, methods, instructions or products referred to in the content. |
© 2025 by the authors. Licensee MDPI, Basel, Switzerland. This article is an open access article distributed under the terms and conditions of the Creative Commons Attribution (CC BY) license (https://creativecommons.org/licenses/by/4.0/).
Share and Cite
Wasilewska, M.; Gubernat, S.; Gil-Kulik, P. Preparation and Study of Physicochemical and Adsorption Properties of Alginate Composites. Materials 2025, 18, 629. https://doi.org/10.3390/ma18030629
Wasilewska M, Gubernat S, Gil-Kulik P. Preparation and Study of Physicochemical and Adsorption Properties of Alginate Composites. Materials. 2025; 18(3):629. https://doi.org/10.3390/ma18030629
Chicago/Turabian StyleWasilewska, Małgorzata, Sylwia Gubernat, and Paulina Gil-Kulik. 2025. "Preparation and Study of Physicochemical and Adsorption Properties of Alginate Composites" Materials 18, no. 3: 629. https://doi.org/10.3390/ma18030629
APA StyleWasilewska, M., Gubernat, S., & Gil-Kulik, P. (2025). Preparation and Study of Physicochemical and Adsorption Properties of Alginate Composites. Materials, 18(3), 629. https://doi.org/10.3390/ma18030629