1. Introduction
The increasing population and rapid industrialization are escalating energy demand, leading to the production of various energy sources. The dependence on non-renewable energy has raised significant environmental concerns, including the depletion of fossil fuels and the worsening of climate change [
1]. Consequently, researchers are concentrating their research efforts on alternative green energy solutions [
2]. Solar energy has emerged as a crucial area of research due to its sustainability and immense potential [
3].
The solar industry has focused on developing highly efficient, long-term stable, and cost-effective photovoltaic (PV) technologies. PV cells, commonly known as solar cells, convert light energy into electrical energy through the photoelectric effect [
4]. To date, several types of solar cells have emerged, including silicon solar cells [
5], perovskite solar cells (PSCs) [
6], organic solar cells (OSCs) [
7], quantum dot solar cells (QDSCs) [
8], and dye-sensitized solar cells (DSSCs) [
9]. Most solar cells have complex fabrication processes requiring expensive infrastructure, which has hindered further efficiency and sustainability improvements. However, DSSCs offer promising costs and ease of manufacturing alternatives [
10]. DSSCs are recognized for their simple and low-cost production methods, light tunability, semitransparency, and ability to perform efficiently even in cloudy conditions [
11].
Since O’Regan and Grätzel’s initial report in 1991 [
9], the power conversion efficiency (PCE) of dye-sensitized solar cells (DSSCs) has significantly increased, now exceeding 15% [
12]. The DSSC industry has committed to ongoing efforts to enhance efficiency and has attracted growing research interest through the engineering of materials, layers, and architectures. A typical DSSC has a sandwich configuration consisting of a photoanode, dye as a sensitizer, an electrolyte, and a counter electrode (CE) [
13]. Advances in materials for sensitizers, electrolytes, CEs, and particularly photoanodes have greatly improved the performance of DSSCs. Enhancements can be achieved by modifying dye properties to broaden optical absorption, optimizing interfaces to minimize charge recombination, and aligning energy levels between dyes and semiconductor films [
14]. The photoanode plays a crucial role in electron transport and is one of the most extensively studied components of DSSCs [
15]. Furthermore, diffusion resistance at the photoanode has a significant impact on the overall performance of the solar cell [
14].
Nanomaterials used as photoanodes have significant potential to enhance electron transport and enable higher dye loading by optimizing band alignment, morphology, dye adsorption, and optical properties [
16]. Various metal oxide semiconductors, including zinc oxide (ZnO) [
17], titanium dioxide (TiO
2) [
18], and tin oxide (SnO
2) [
19], have been investigated as photoanode materials for DSSCs. Among these, TiO
2 is particularly notable as one of the most extensively studied photoanode materials due to its high chemical and thermal stability, low cost, high refractive index, and favorable conduction band, all of which facilitate efficient electron injection from sensitizers [
20,
21,
22]. These challenges can be mitigated by utilizing one-dimensional (1D) nanostructures like nanotubes, nanowires, and nanorods [
23]. However, despite the advantages of TiO
2 nanoparticles, challenges such as charge recombination, limited electron diffusion length, and electrolyte diffusion issues still need to be addressed. These challenges can be mitigated by utilizing one-dimensional (1D) nanostructures like nanotubes, nanowires, and nanorods [
24]. The performance of DSSCs is greatly influenced by the physical and structural properties of TiO
2, including crystal size, morphology, phase composition, porosity, thickness of the TiO
2 layer, and specific surface area [
21,
25]. These structures have gained attention due to their direct connection of photogeneration of electrons/holes [
26] with the charge collection electrode, as well as improved dye adsorption, ultimately enhancing cell performance.
The preparation of a TiO
2 nanostructure presents challenges, and adjusting parameters such as growth time, growth temperature, starting reactant concentration, acidity, and additives can influence the diameter, length, and density of the structures [
27]. Complex morphologies of TiO
2 nanotubes can be synthesized using anodization and hydrothermal methods [
28,
29]. TiO
2 nanotubes produced through the hydrothermal method tend to have random orientations [
30] and present difficulties in achieving consistent size and uniformity. TiO
2 nanotubes produced through anodization offer precise control over dimensions and result in highly ordered, vertically aligned arrays with improved uniformity, which are referred to as TiO
2 nanotube arrays (TNAs) [
18]. However, the performance enhancement of DSSCs utilizing TNAs encounters obstacles such as limited surface area, which impacts dye loading and light absorption, as well as poor electron transfer due to high internal resistance and charge carrier trapping that impede current generation due to the barrier layer under the bottom of the TNAs. Additionally, while the outer structure of TNAs is cylindrical, the inner structure is conical, meaning TNAs have distinct configurations.
This study investigates how the structural configuration of freestanding TiO2 nanotube arrays (f-TNAs) influences the power conversion efficiency in DSSCs. TNAs produced through anodization were separated from the Ti plate to form f-TNAs, and the barrier layer under the bottom of the f-TNAs was removed and made open using an etching process to investigate the influence of the barrier layer on DSSC performance. We examined the impact of parameters such as current density (Jsc), open-circuit voltage (Voc), fill factor (FF), and power conversion efficiency (PCE) on the configurations of TNAs in DSSCs. Our findings provide insights into how the orientation of the nanotube and variations in nanotube length, wall thickness, and surface area impact the photovoltaic performance.
3. Results and Discussion
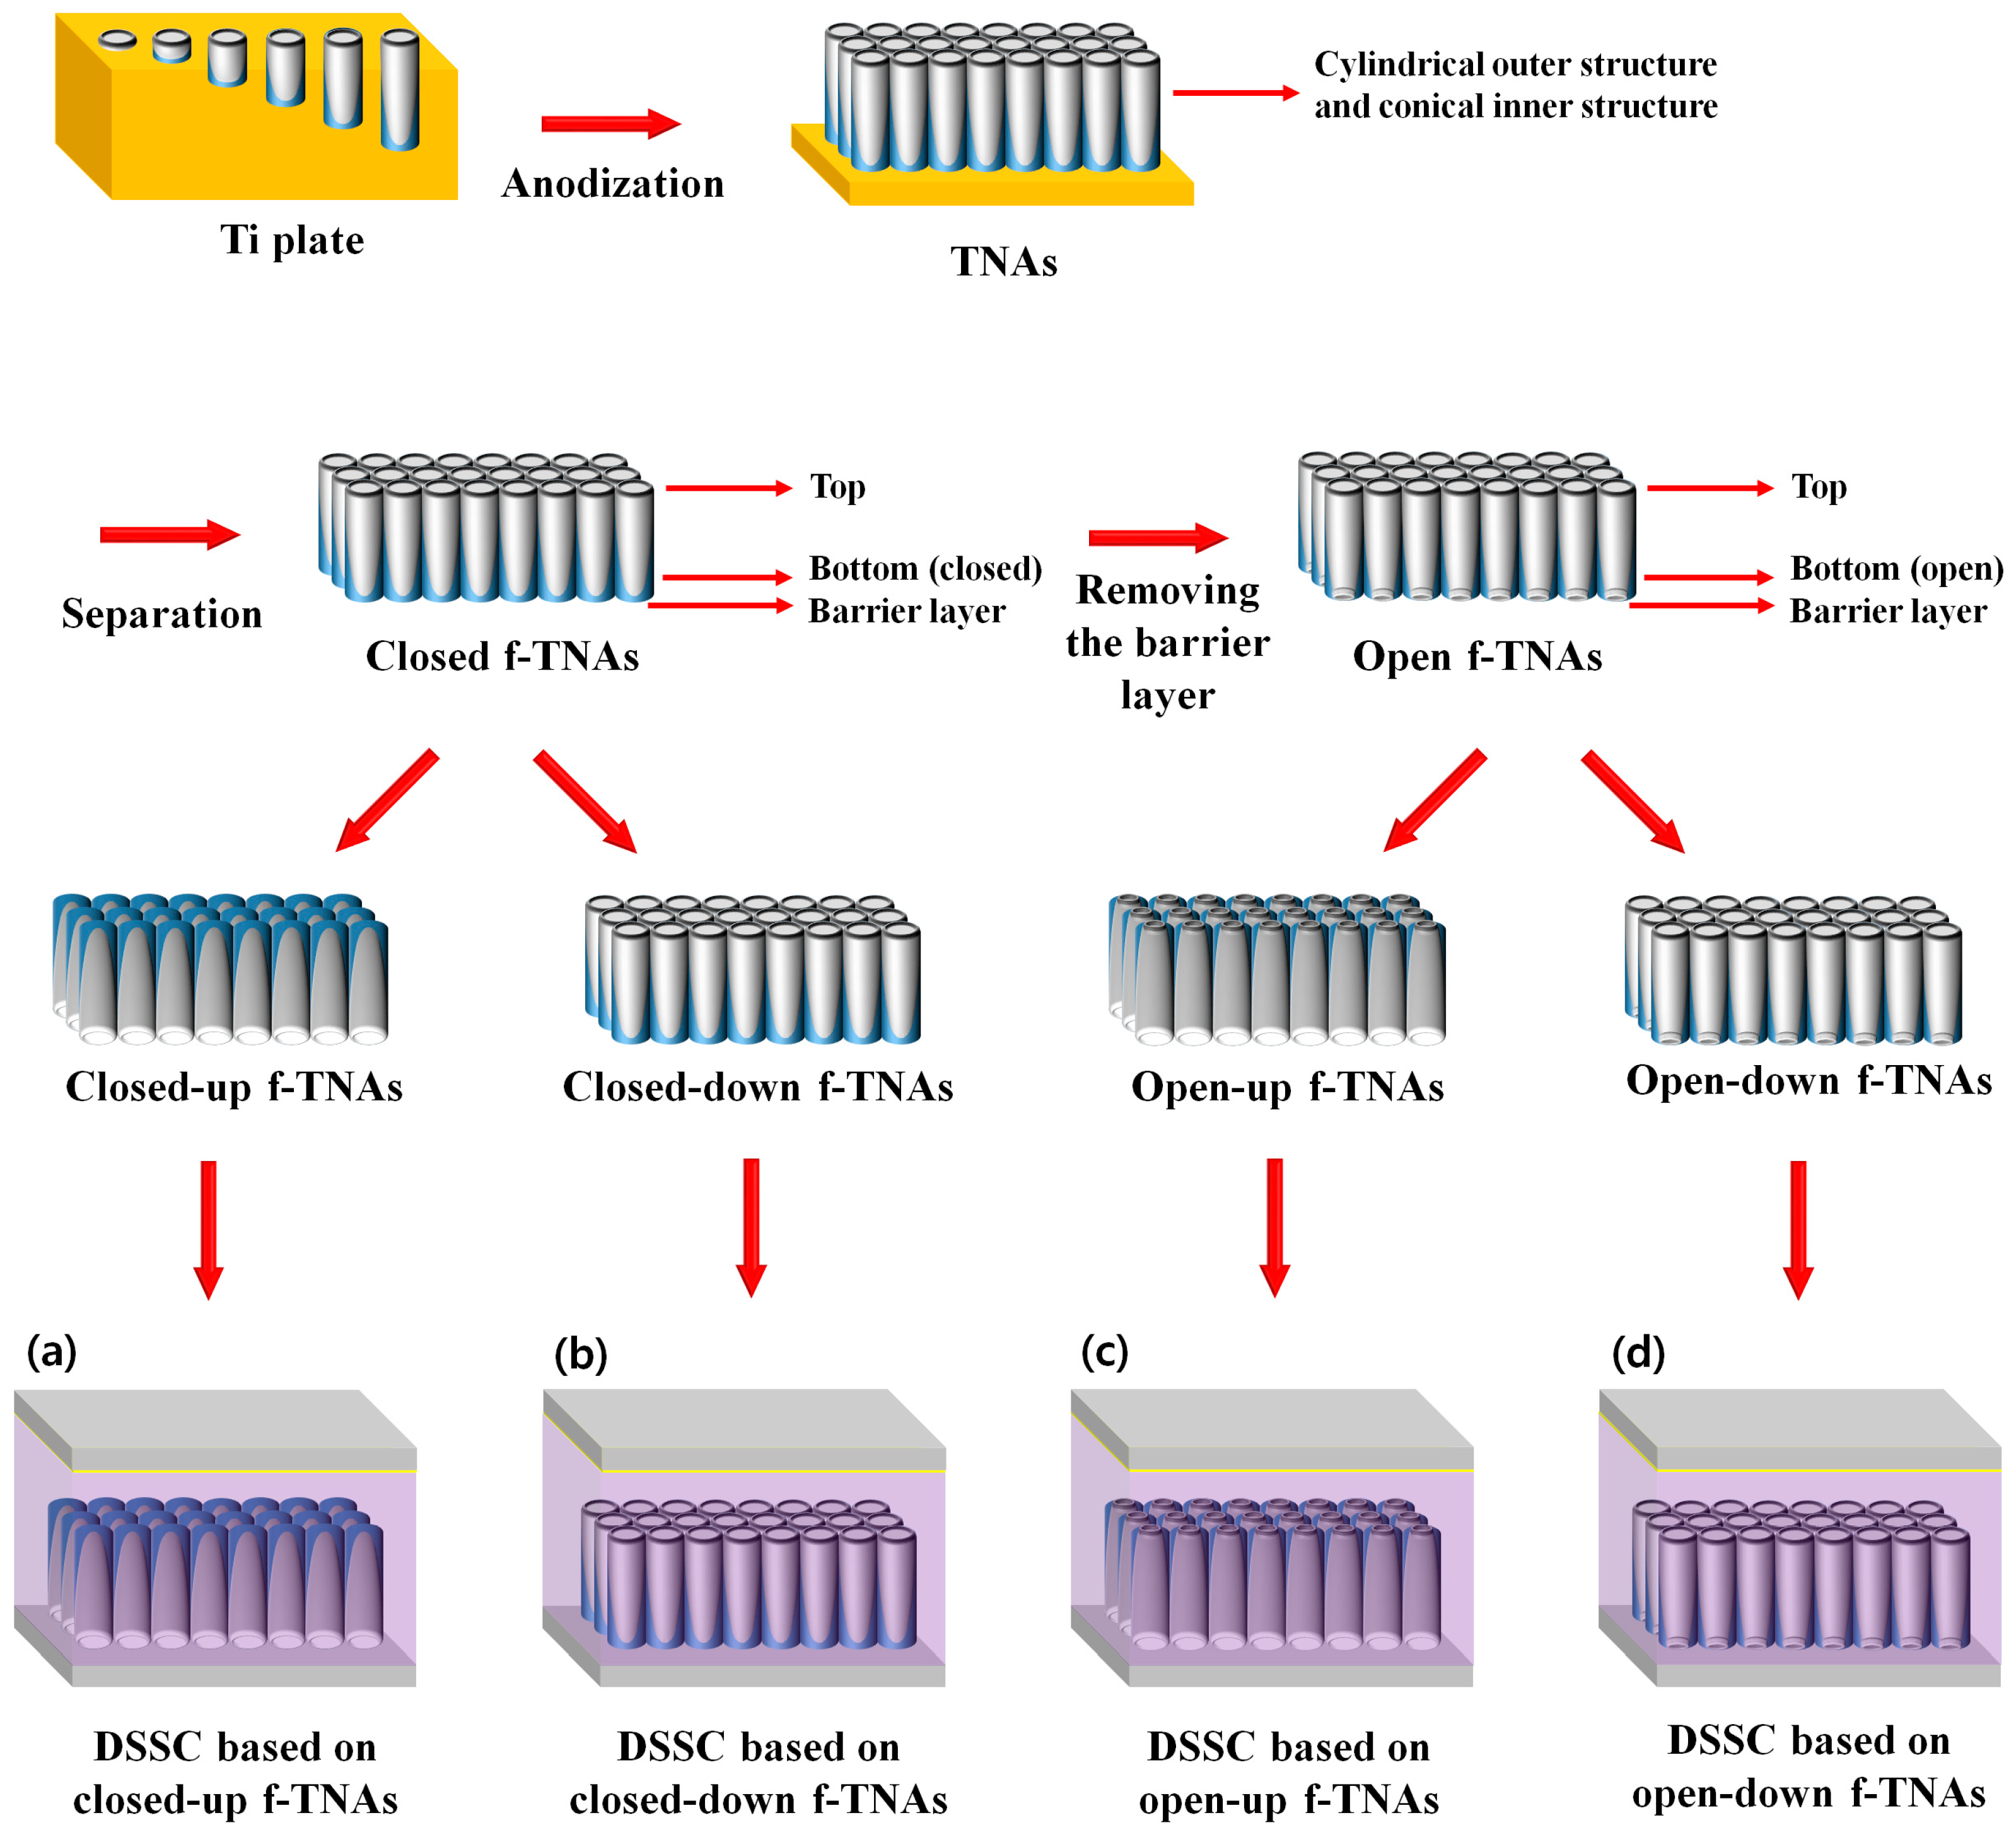
A schematic representation of dye-sensitized solar cells (DSSCs) incorporating freestanding TiO
2 nanotube arrays (f-TNAs) is depicted in
Figure 1. The TNAs were synthesized via anodization and subsequently detached from the Ti plate to yield f-TNAs. The f-TNAs exhibit a distinctive morphology characterized by a cylindrical outer structure and a conical inner structure, resulting from the interplay between field-assisted oxidation and dissolution processes. The formation mechanism of TNAs can be divided into two primary processes. The underlying mechanism for the formation of anodic TiO
2 nanotube arrays is well established and can be attributed to the conventional field-assisted oxidation and dissolution model. Detailed equations and derivations related to this mechanism are provided in the
Supporting Information for clarity [
31,
32].
DSSCs were fabricated using closed or open f-TNAs in four configurations: closed-up f-TNAs, closed-down f-TNAs, open-up f-TNAs, and open-down f-TNAs. DSSCs fabricated with closed f-TNAs, where the bottom is not open and is in a reversed structure on the fluorine-doped tin oxide (FTO) glass, are referred to as ‘DSSCs based on closed-up f-TNAs,’ as shown in
Figure 1a. Similarly, DSSCs fabricated with closed f-TNAs in a normal structure on the FTO glass, where the bottom is not open, are referred to as ‘DSSCs based on closed-down f-TNAs,’ as shown in
Figure 1b. DSSCs fabricated with open f-TNAs, where the bottom is open and in a reversed structure on the FTO glass, are referred to as ‘DSSCs based on open-up f-TNAs,’ as shown in
Figure 1c. Similarly, DSSCs fabricated with open f-TNAs in a normal structure on the FTO glass, where the bottom is open, are referred to as ‘DSSCs based on open-down f-TNAs,’ as shown in
Figure 1d.
Regarding the effects of the structural configuration of f-TNAs in DSSCs, the first consideration is dye adsorption. Dye adsorption is conducted after the annealing process to secure the f-TNAs on FTO glass. If dye adsorption is conducted before the annealing step, the dye decomposes during the annealing process. However, after the annealing process, the structural configuration of f-TNAs influences dye adsorption. The second effect concerns electrolyte diffusion during DSSC operation. For DSSCs to function under light exposure, a redox reaction takes place within the electrolyte, which depends on electrolyte diffusion, a process also affected by the structural configuration of f-TNAs. Accordingly, we prepared DSSCs based on four f-TNAs configurations: closed-up, closed-down, open-up, and open-down.
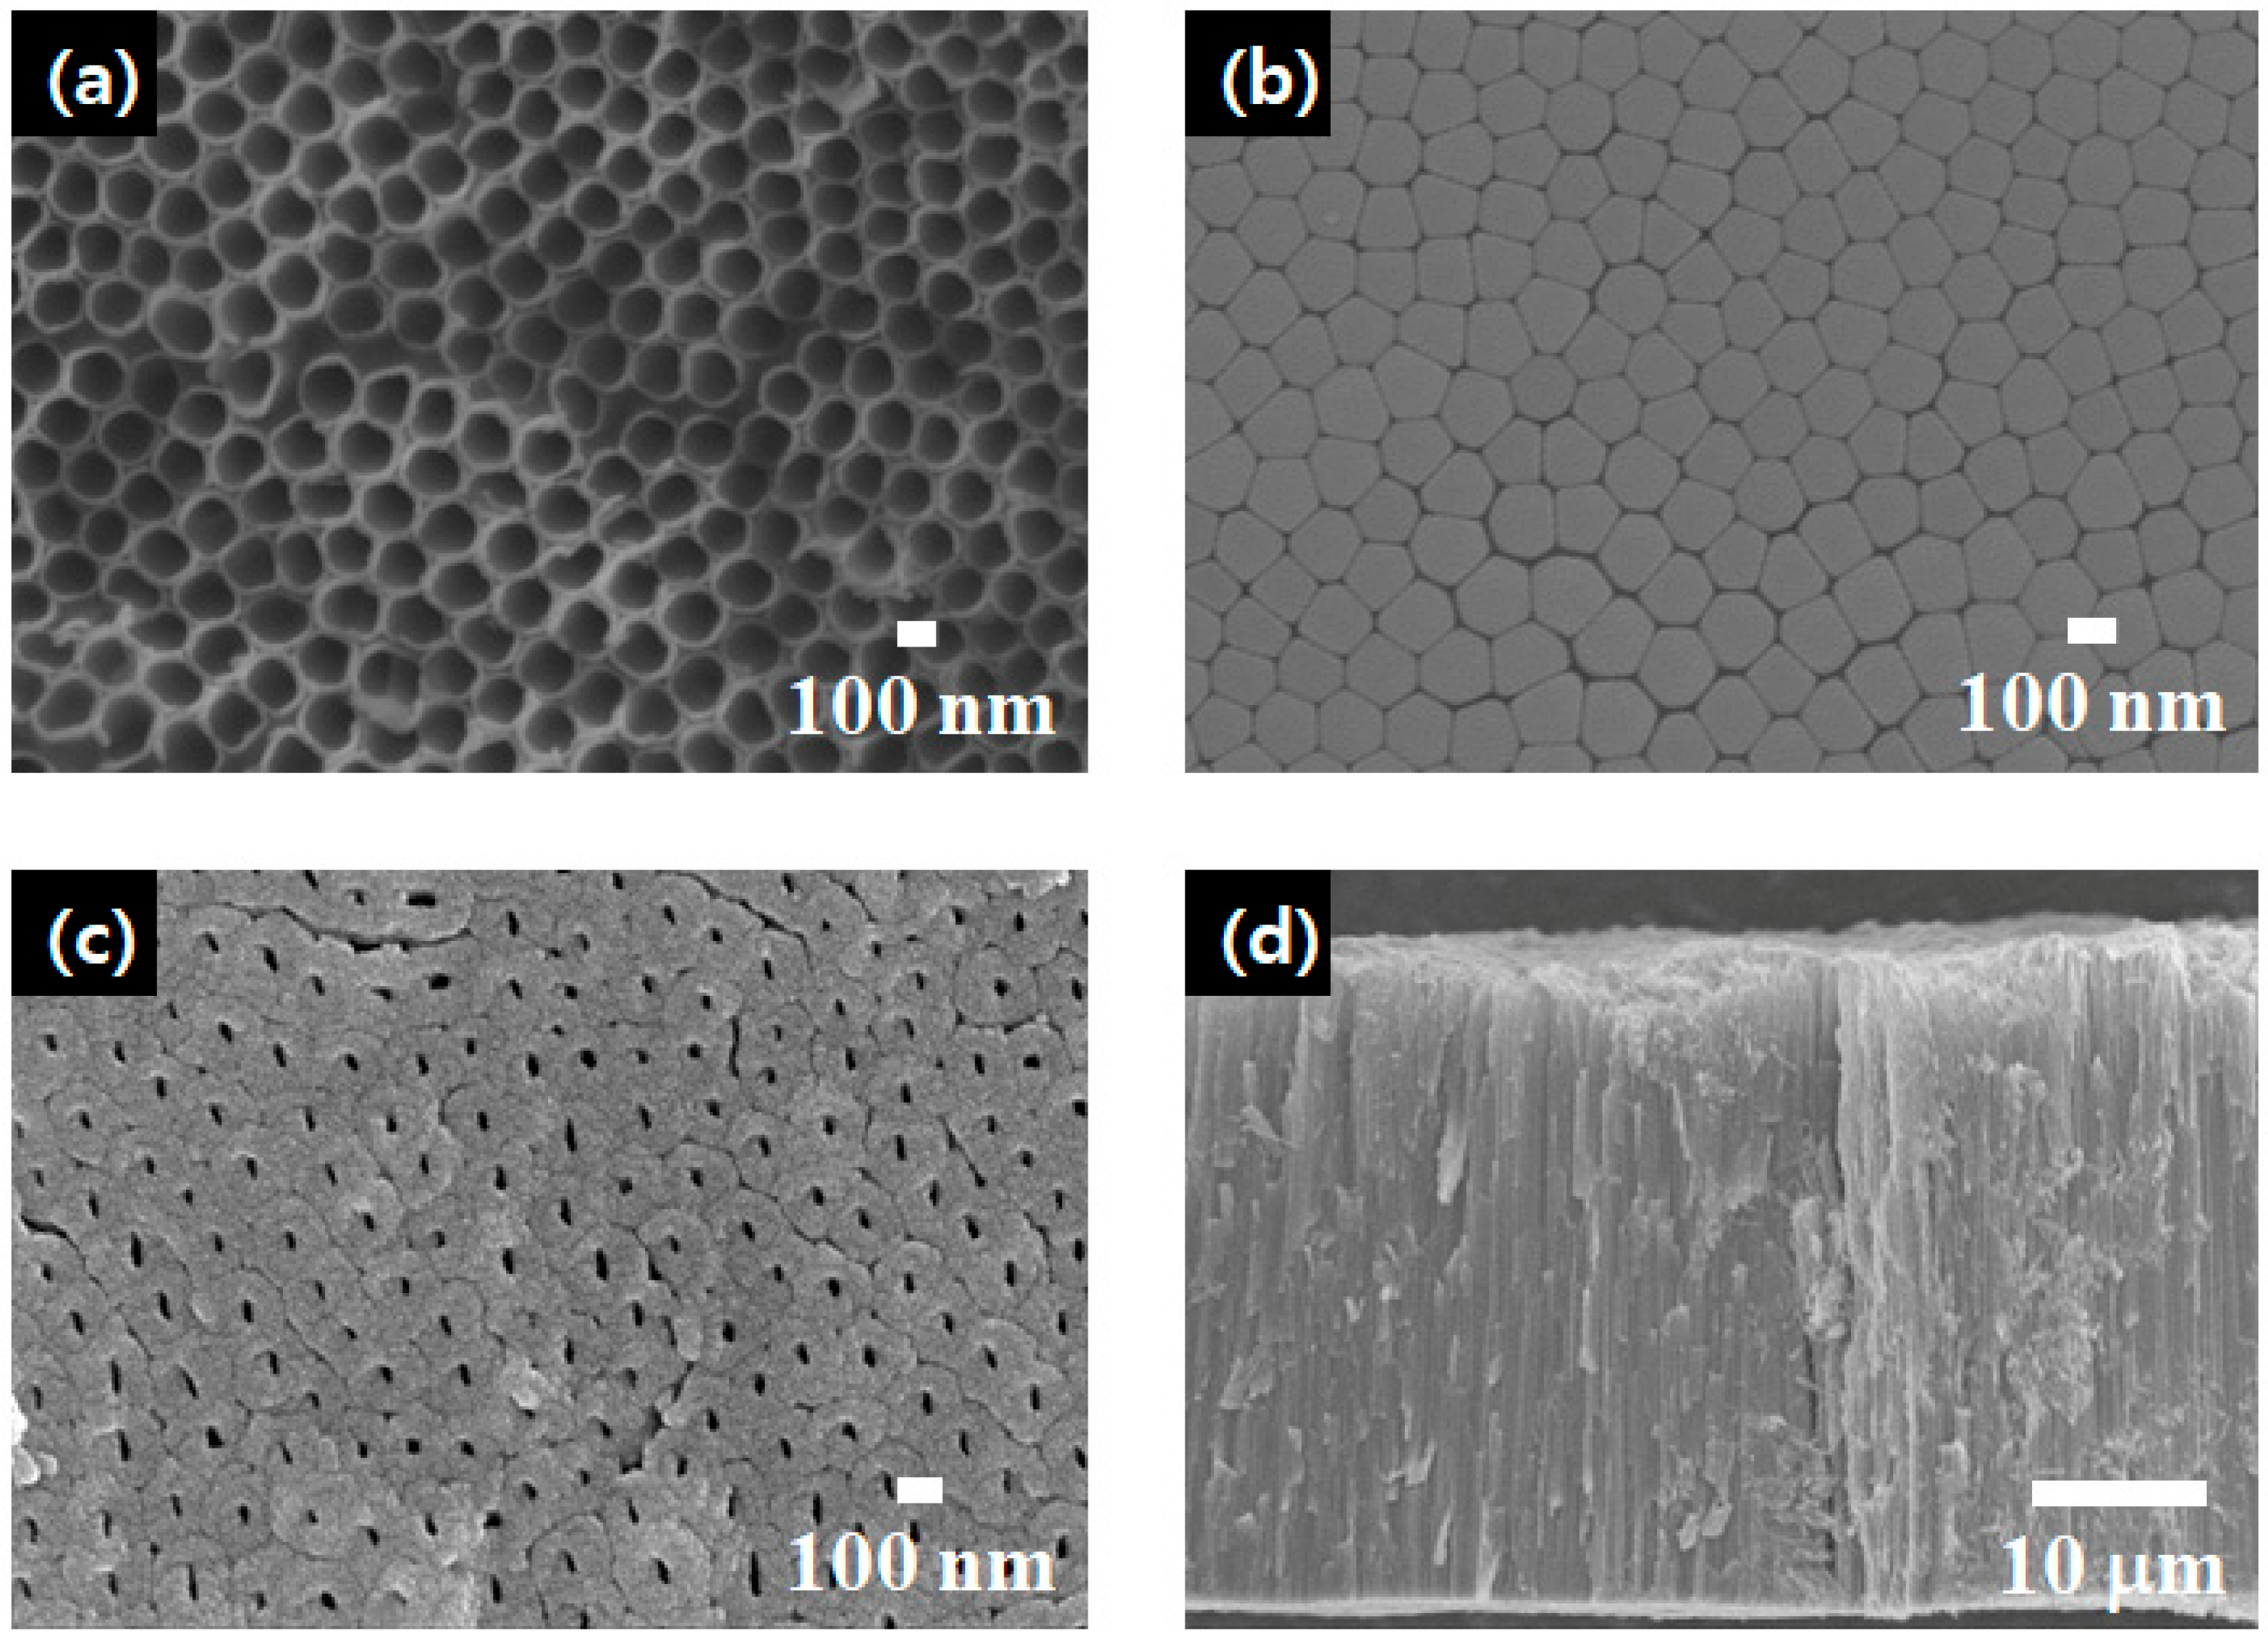
The morphology of the f-TNAs was characterized using field emission scanning electron microscopy (FE-SEM), as shown in
Figure 2. The top of the f-TNAs has a pore size of 150 nm, as shown in
Figure 2a. In contrast, the bottom, which includes a barrier layer, also has a thickness of 150 nm, as shown in
Figure 2b. Notably, the barrier layer remains intact beneath the bottom of the f-TNAs after the anodization. After the ion milling, the barrier layer is removed and the bottom of f-TNAs is opened. The bottom without the barrier layer retains a size of 150 nm; however, the pore size in the bottom is 25 nm, as shown in
Figure 2c. Since the outer diameter of f-TNAs is consistently 150 nm, the f-TNAs exhibit a cylindrical structure, as shown in
Figure 2a,b. However,
Figure 2c shows that the inner nanotube structure of the f-TNAs is conical, where the pore size at the top is significantly larger than at the bottom. Additionally, the wall thickness at the top (5 nm) is thinner compared to the 62 nm wall thickness at the bottom. The total length of the f-TNAs is 37 μm, as shown in
Figure 2d. Overall, the external structure of the f-TNAs is cylindrical, while the internal structure is conical. The pore size at the top is approximately 150 nm, with a wall thickness of about 15 nm. At the bottom, the pore size is around 25 nm, and the wall thickness is approximately 70 nm. The total length of the f-TNAs is 37 μm. The thickness of the TiO
2 compact layer is approximately 80 nm, while the TiO
2 nanoparticle layer has a thickness of 3 μm, as determined after thermal treatment.
The crystallinity of TNAs is an important factor in preparing f-TNAs. After the 1st anodization of the Ti plate, an initial layer of amorphous TNAs forms on the Ti plate without crystallinity. In this state, the initial layer of amorphous TNAs is not only highly unstable in chemical reagents but also exhibits low electron transport in DSSCs [
33]. However, following an annealing step, the initial layer of amorphous TNAs develops crystallinity, referred to as a first layer of crystalline TNAs, becoming more stable in chemical environments. To prepare f-TNAs, a 2nd anodization is required, which subsequently takes place in an electrolyte. In the 2nd anodization, the first layer of crystalline TNAs is more stable within the electrolyte. After the 2nd anodization, a second layer of amorphous TNAs forms at the base of the first layer of crystalline TNAs. As the second layer of amorphous TNAs is unstable in chemical reagents, it is removed using oxidizing agents. Once the second layer of amorphous TNAs is removed, the first layer of crystalline TNAs is detached from the Ti plate, resulting in f-TNAs with improved structural and electron properties suitable for application in DSSCs.
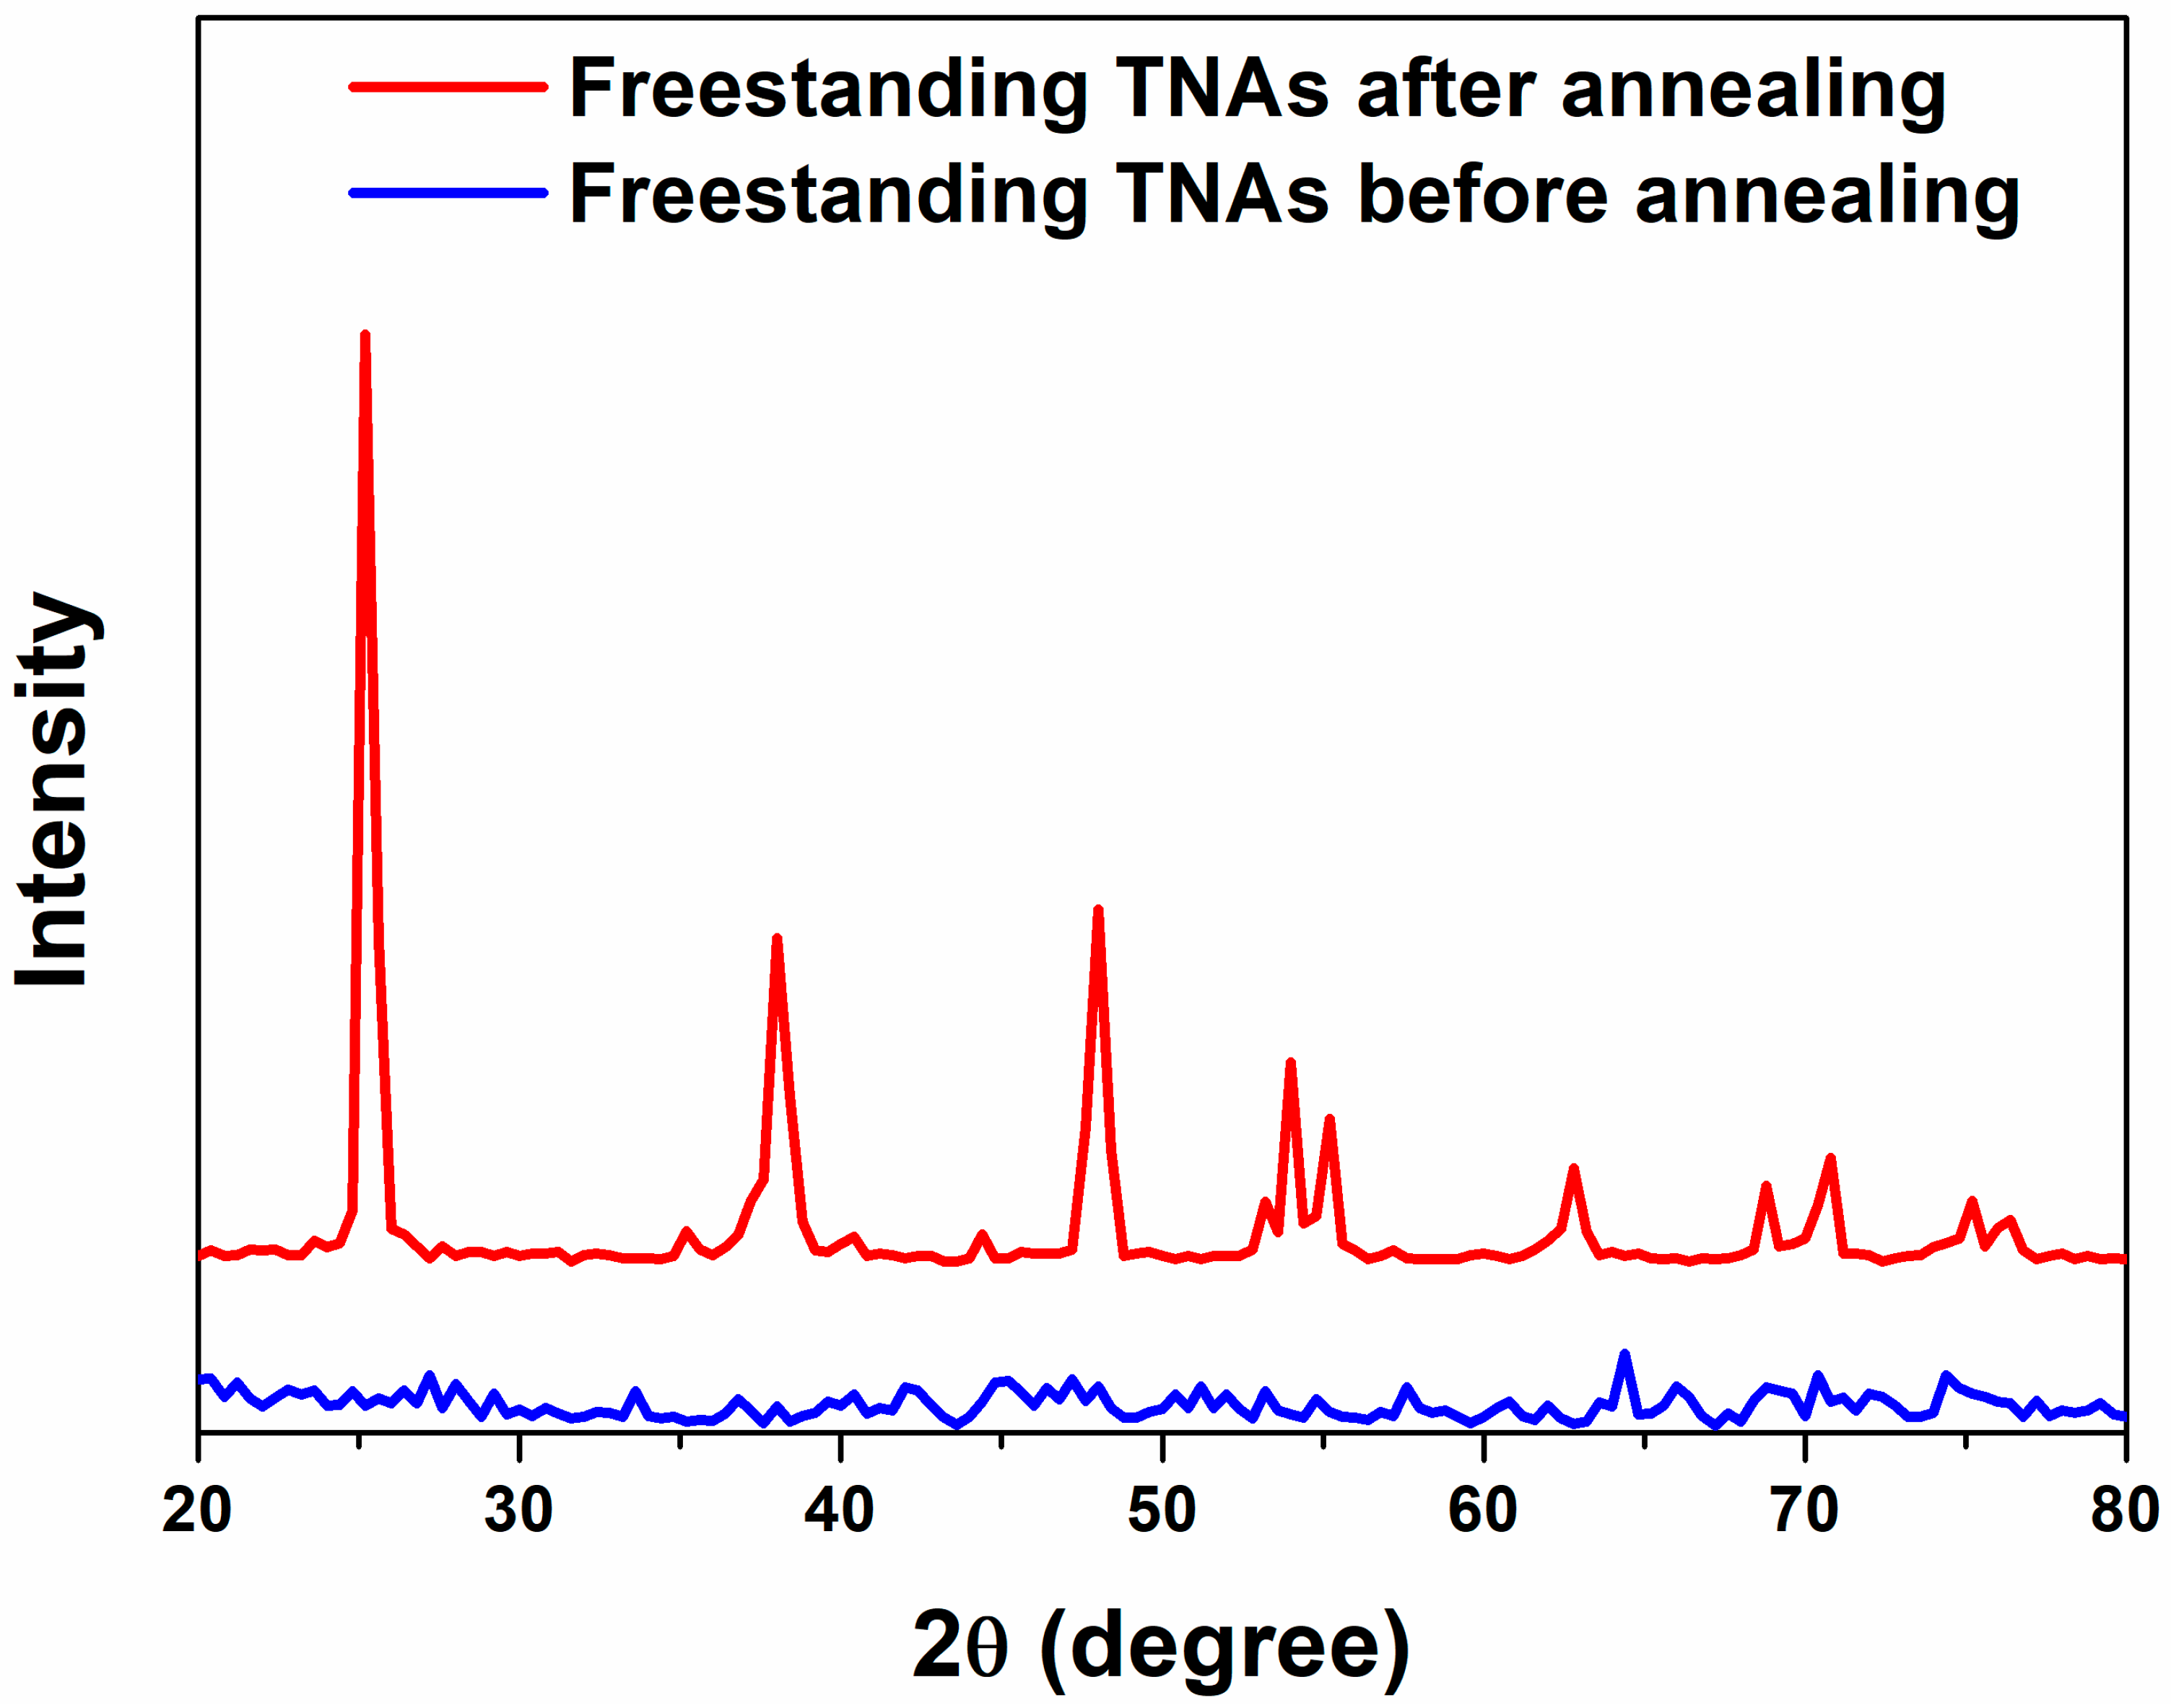
Figure 3 shows the crystallinity of f-TNAs with and without the annealing step, as characterized by X-ray diffraction (XRD). Before the annealing step, the f-TNAs exhibited amorphous structure, as represented by the blue line. After the annealing step, crystallinity significantly improves, as depicted by the red line. The crystal structure with the largest intensity peak is appeared in the (101) plane corresponding to 25°. The crystal planes of f-TNAs after annealing at (004), (200), (105), (211), (204), (116), (220), and (215) corresponding to 2θ angles 37.74°, 48.02°, 53.82°, 55.10°, 62.56°, 68.82°, 70.18°, and 75.18° confirm the anatase phase of f-TNAs, respectively [
34]. After the barrier layer under the bottom layer of f-TNAs is removed by the ion milling, the crystallinity remains consistent with that of the f-TNAs that still have the barrier layer. This indicates that the removal of the barrier layer does not affect the overall crystallinity of the f-TNAs.
The parameters of DSSCs based on closed-up, closed-down, open-up, and open-down f-TNAs, including current density (
Jsc), open-circuit voltage (
Voc), fill factor (FF), and power conversion efficiency (PCE), are summarized in
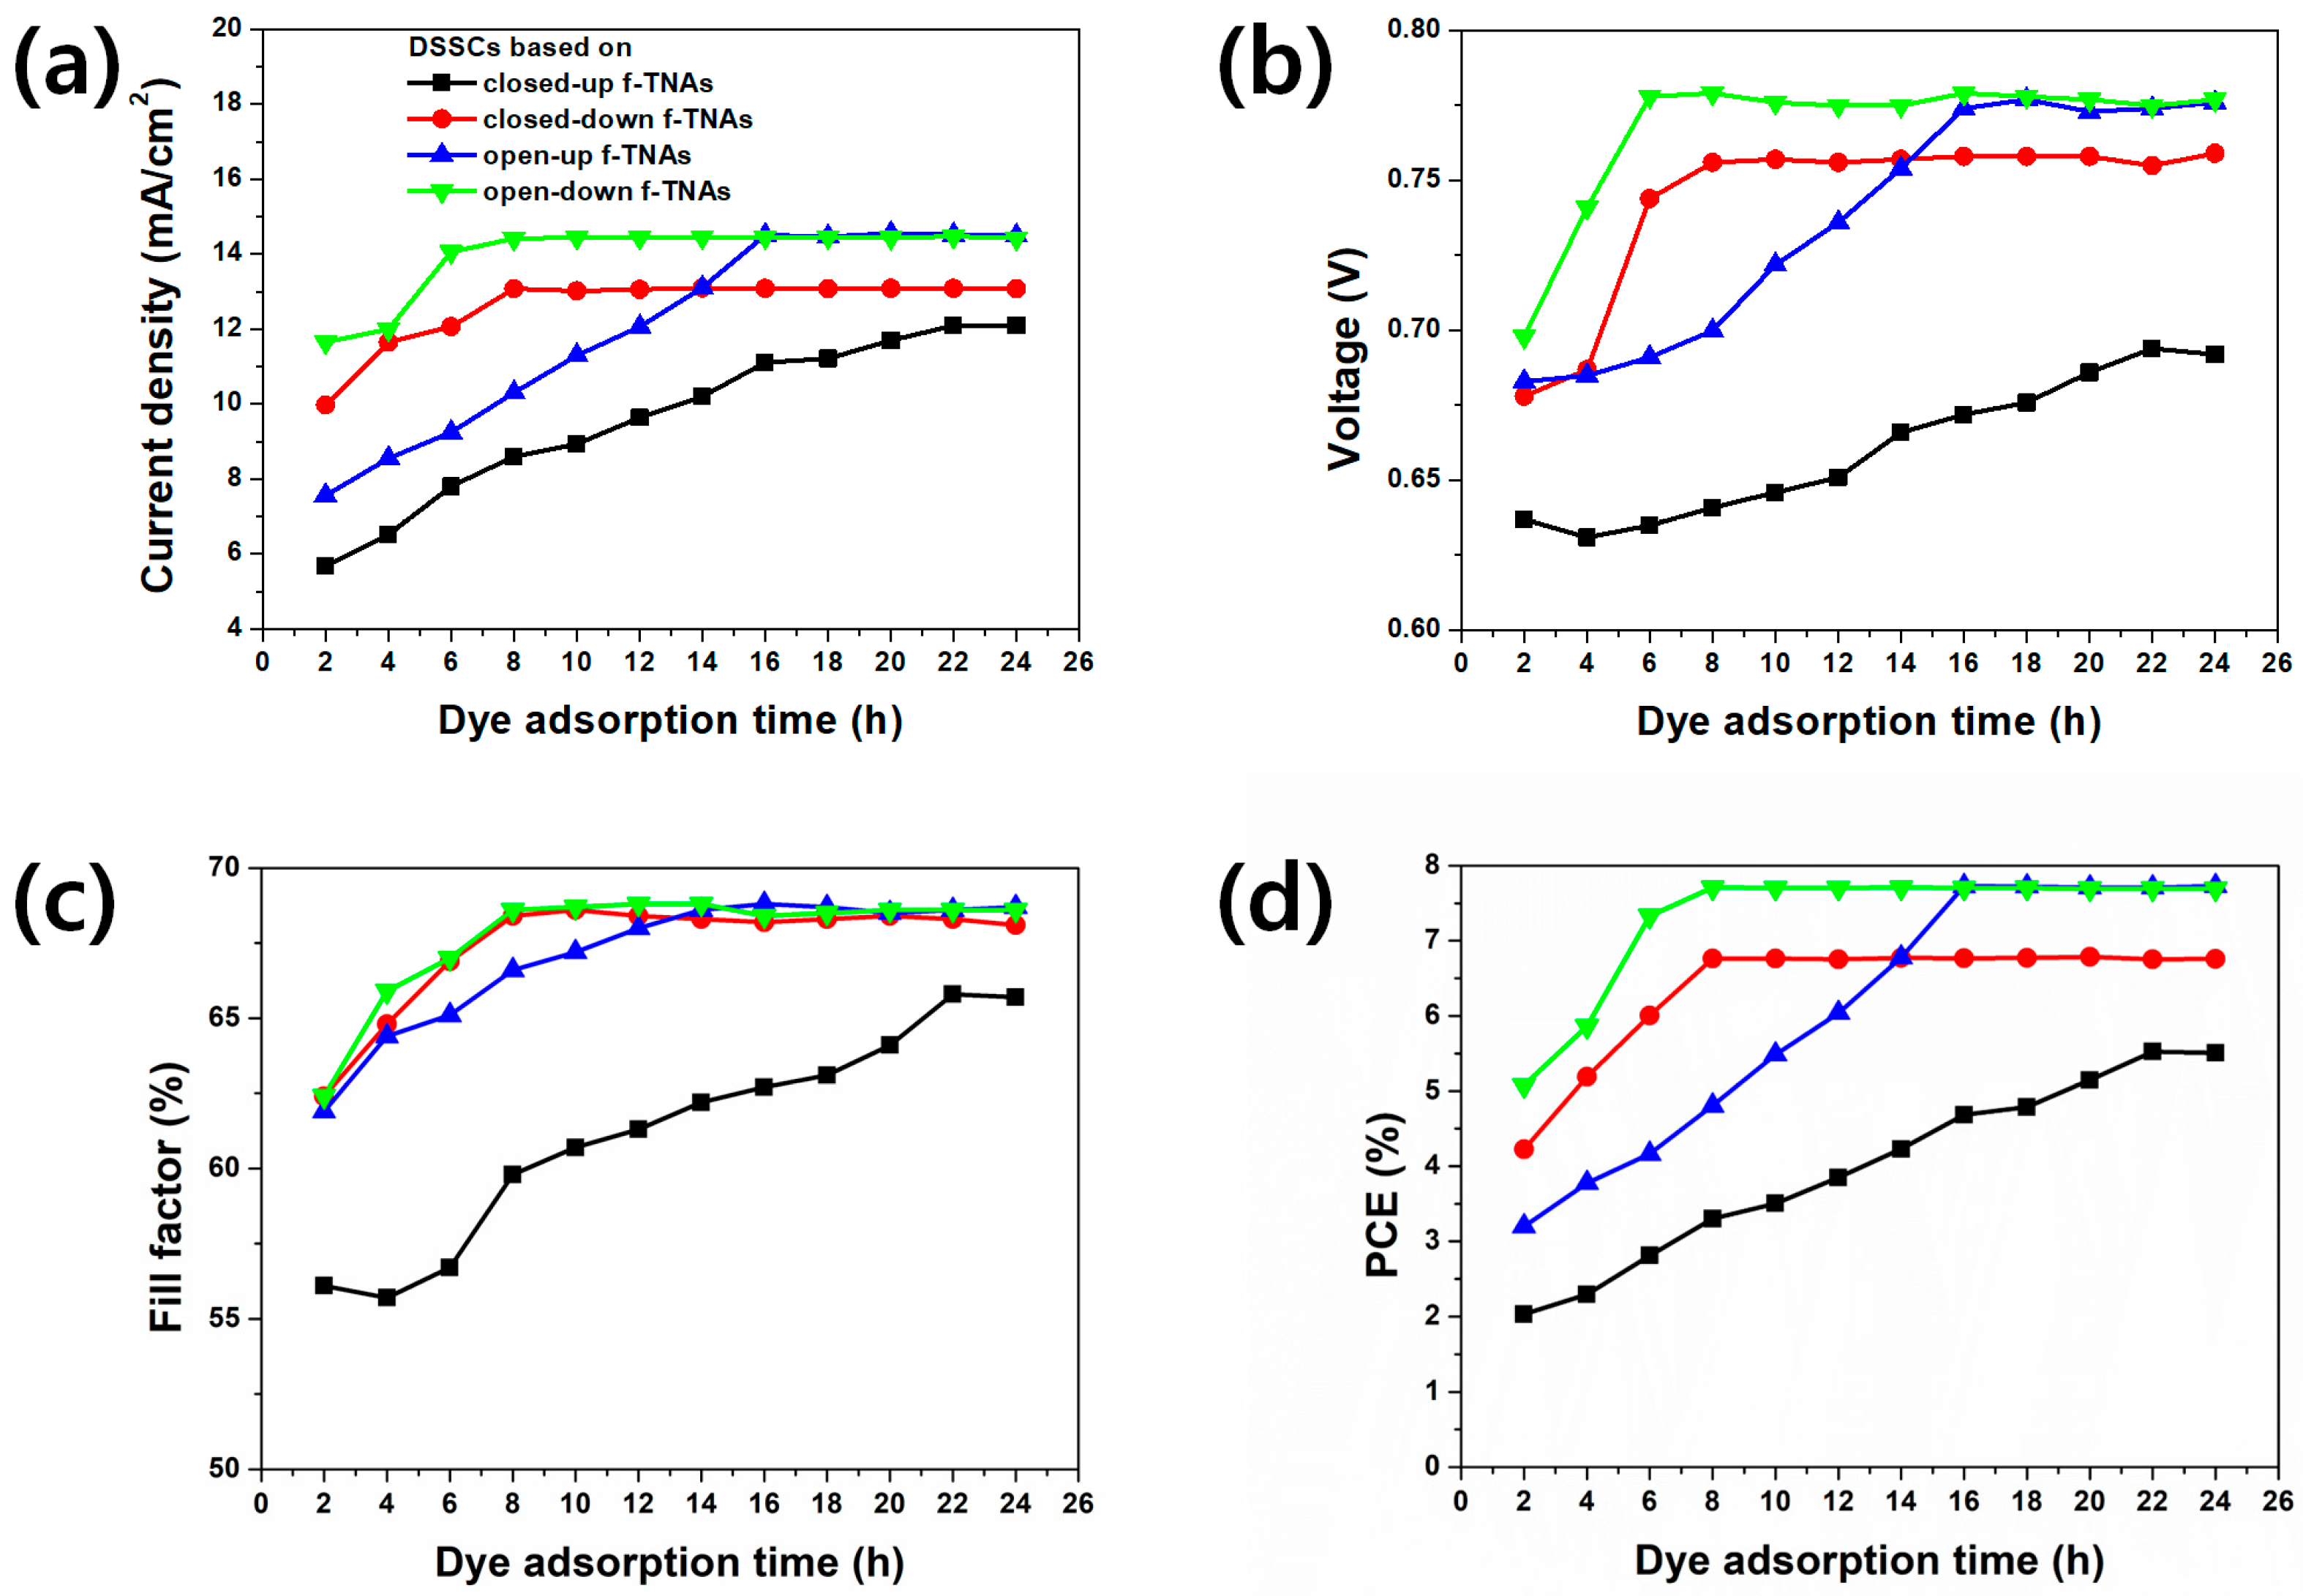
Tables S1–S4. The best PCE values for DSSCs using these different configurations of f-TNAs are presented in
Figure 4 and summarized in
Table 1. The dye adsorption time ranged from 2 to 24 h. Ten samples were fabricated for each configuration, and the standard deviation of the PCE for each sample is shown in
Table 1. Power conversion efficiency (PCE, %) of DSSCs as a function of dye adsorption time for closed-up, open-up, closed-down, and open-down freestanding TiO
2 nanotube arrays (f-TNAs) is shown in
Figure S3. Error bars represent standard deviation from replicate measurements.
After 2 h of dye adsorption time, the Jsc, Voc, FF, and PCE had the lowest values for all DSSCs. The PCE of DSSCs based on closed-down and open-down f-TNAs showed their best performance after 8 h of dye adsorption, reaching PCE of 6.78% and 7.71%, respectively. The DSSCs based on open-up f-TNAs showed the maximum PCE of 7.73% after 16 h of dye adsorption, whereas the DSSC based on closed-up f-TNAs achieved its best PCE of 5.52% after 22 h of dye adsorption time. Overall, the PCE increased with longer dye adsorption times. DSSCs based on closed-down, closed-up, open-down, and open-up f-TNAs demonstrated the highest PCEs after sufficient dye adsorption time. The highest PCE of DSSCs based on closed-down f-TNAs requires a dye adsorption time of 8 h, while for DSSCs based on closed-up f-TNAs require 22 h. In this case, the PCE of DSSCs based on closed-down f-TNAs is higher than that based on closed-up f-TNAs.
The PCE of DSSCs is significantly influenced by the structural configuration of f-TNAs. DSSCs based on closed-up f-TNAs exhibit diminished PCE, primarily due to constraints in dye adsorption and electrolyte diffusion during operation. Similarly, DSSCs based on closed-down f-TNAs yield lower PCE compared to DSSCs based on open-up or open-down f-TNAs, potentially attributable to the presence of a barrier layer under the bottom of the f-TNAs base. Interestingly, DSSCs based on open-up and open-down f-TNAs demonstrate comparable PCE values after sufficient dye adsorption periods. While DSSCs based on open-down f-TNAs initially show higher PCE than open-up configurations at 8 h, both structures converge to identical PCE values at 16 h. Moreover, the maximum efficiency of ~7.73% achieved in the open configurations lies within the upper range of typical TiO2 nanotube-based DSSCs (generally reported around 6–8%), highlighting that our devices reach competitive performance levels solely through structural optimization without the need for additional dopants or co-sensitizers. The relationship between f-TNAs structural configurations and dye adsorption is further corroborated by time-dependent dye loading measurements.
To evaluate the long-term operational stability of the DSSCs, each device was subjected to continuous one-sun light-soaking tests according to the ISOS-L2 [
35] protocol. The PCE values were measured at several time intervals over 120 h. As summarized in
Table S5, all devices exhibited gradual decreases in PCE with extended irradiation, but maintained high efficiency retention rates of 86–88% after 120 h. These results demonstrate the robust long-term stability and durability of the barrier-layer-free f-TNA-based DSSCs under prolonged operating conditions. Barrier-layer-free TiO
2 nanotube DSSCs exhibit excellent short-term stability with over 90% PCE retention after 72–120 h of light soaking when properly fabricated and sealed, but their long-term durability may still be affected by electrochemical or environmental degradation if structural or sealing defects are present.
Details of the EQE spectra and integrated
Jsc values for all DSSC configurations are provided in the
Supporting Information (Figure S4). The integrated
Jsc derived from the EQE spectra closely matches the
Jsc obtained from
J–V measurements, confirming the reliability of the photocurrent response and the effect of nanotube structure on spectral performance.
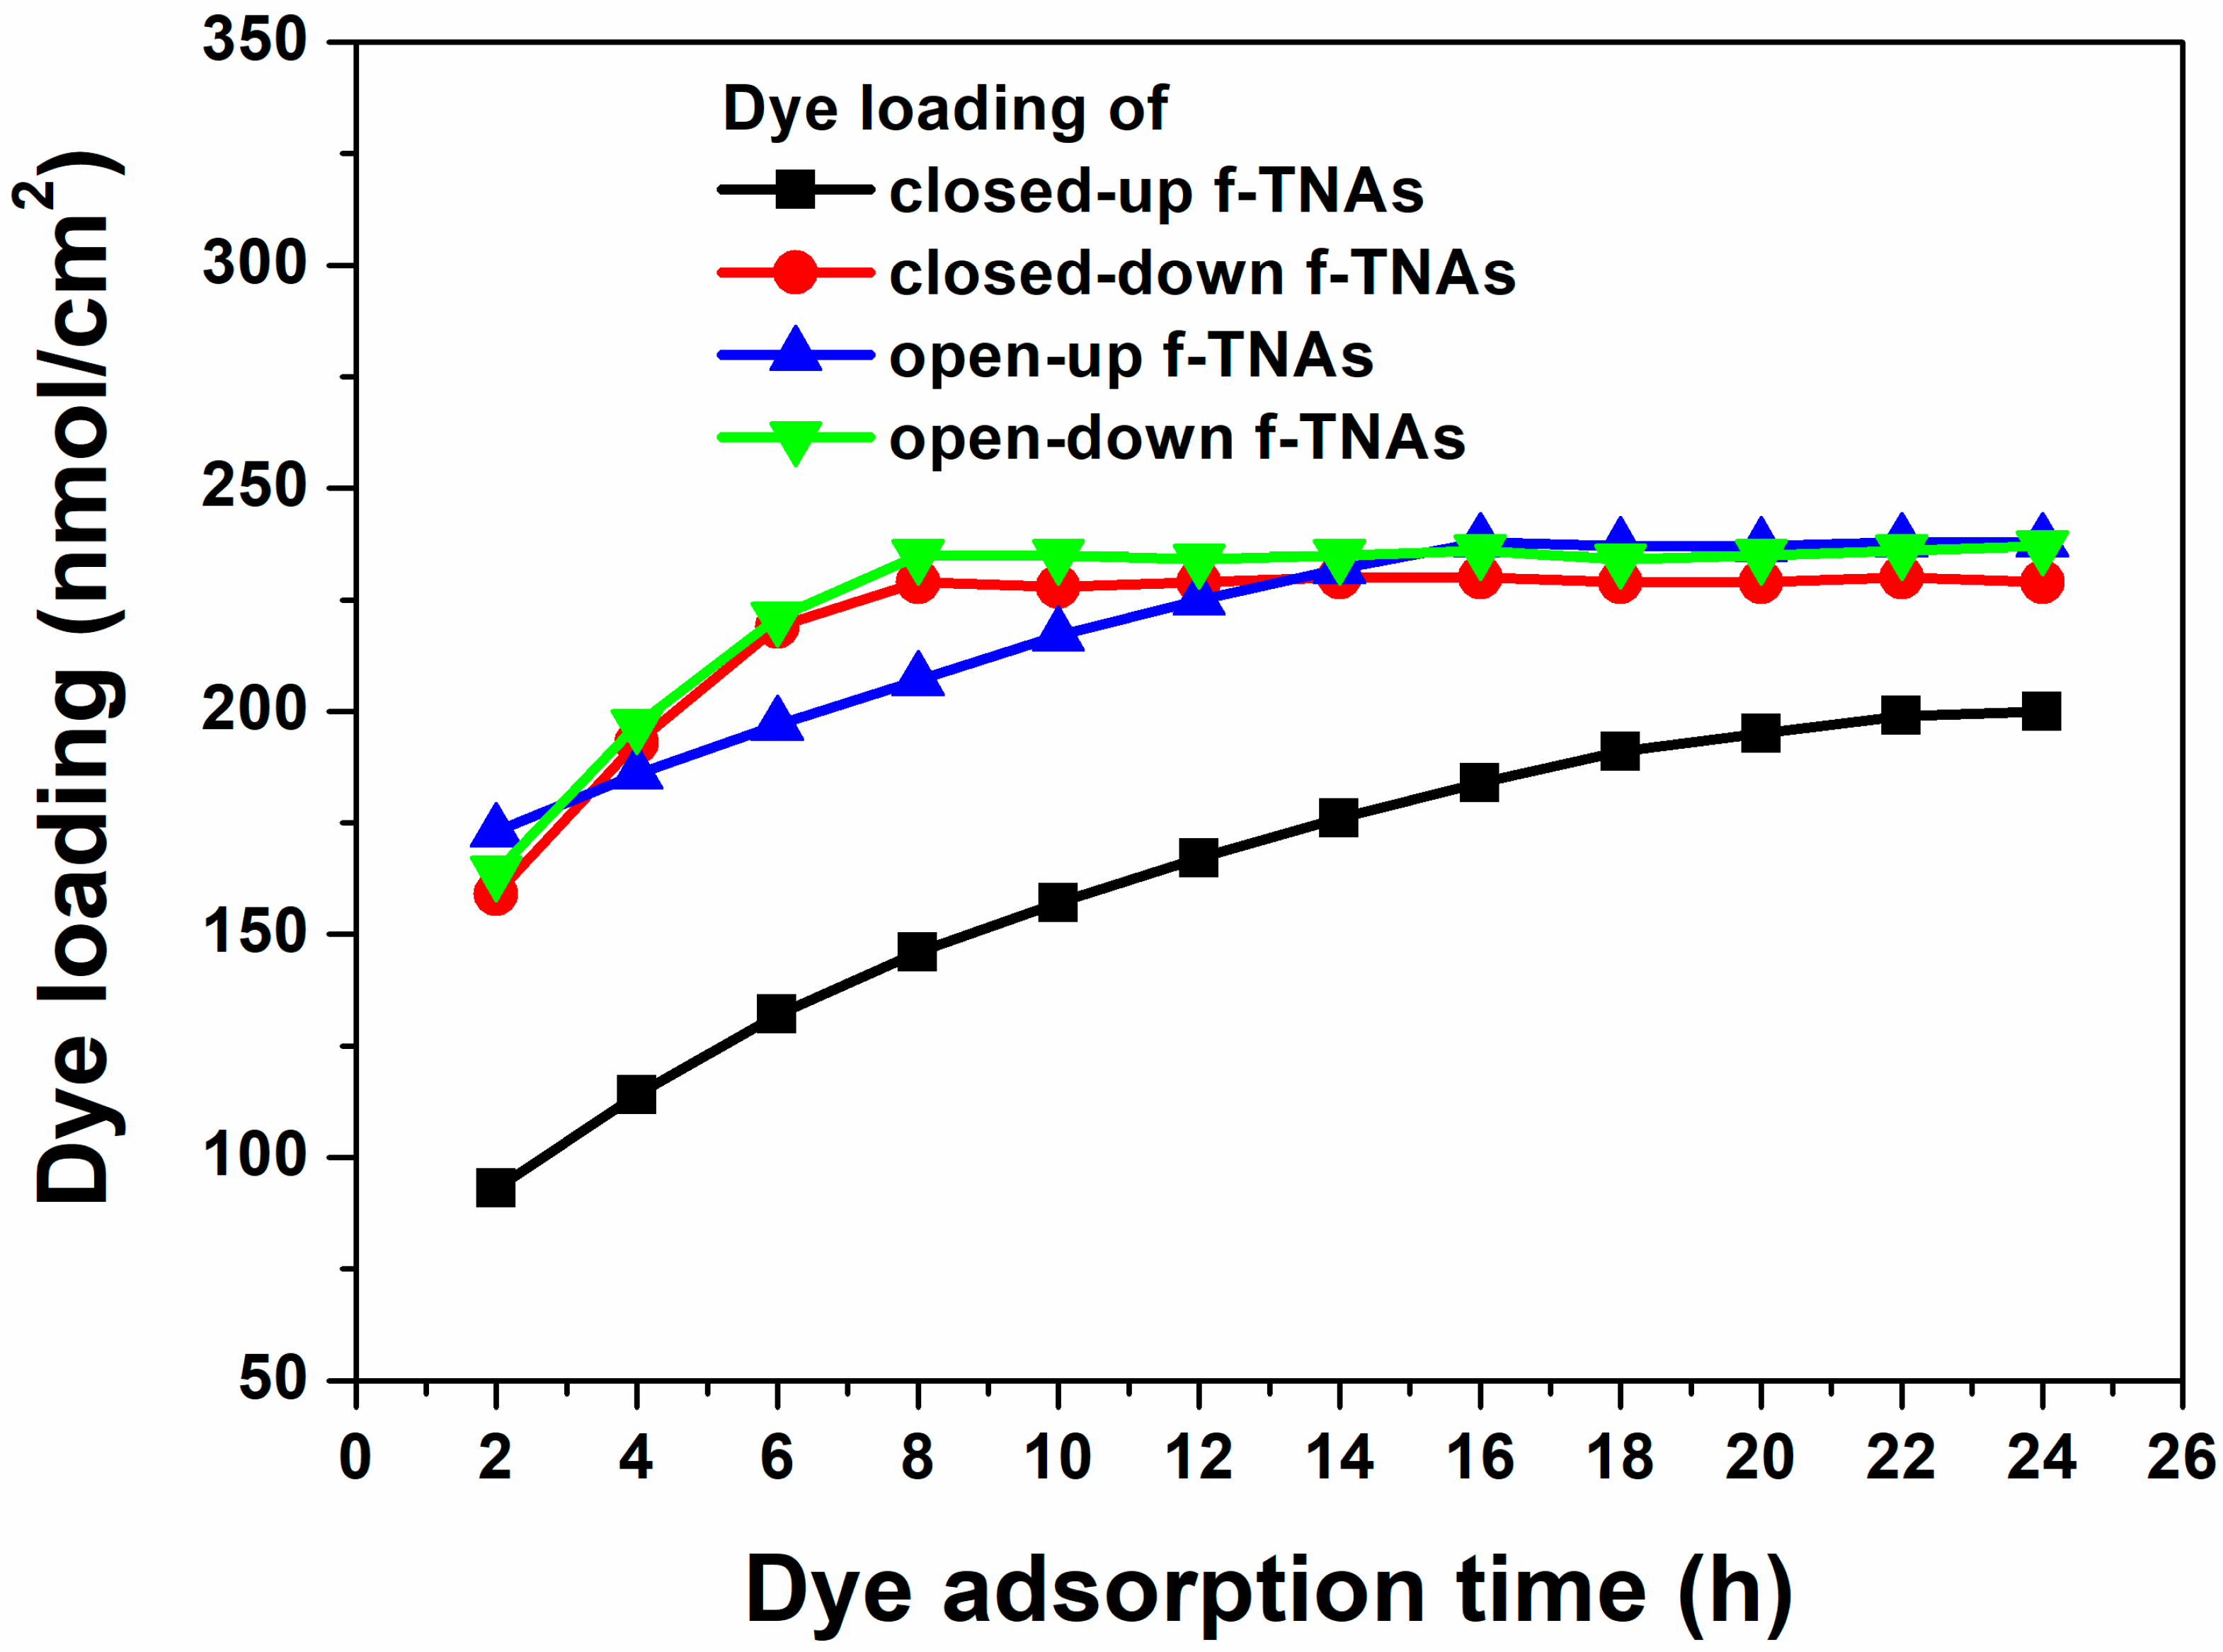
Dye loading was measured at various intervals to investigate how dye adsorption time affects the performance of DSSCs based on closed-up, closed-down, open-up, and open-down f-TNAs, as shown in
Figure 5 and summarized in
Table S6. The amount of dye is related to
Jsc,
Voc, FF, and PCE in DSSCs.
The dye loading of closed-up f-TNAs increases from 93 nmol/cm2 to 199 nmol/cm2 up to 22 h. At the same time, the Jsc, Voc, FF, and PCE of DSSCs based on closed-up f-TNAs also increase from 5.68 mA/cm2 to 12.10 mA/cm2, 0.64 V to 0.694 V, 56.1% to 65.8%, and 2.03% to 5.52%, respectively. Considering the dye adsorption rate of about 4.818 nmol/h, the dye adsorption is hindered by closed-up f-TNAs, preventing sufficient dye adsorption. On closed-up TNAs, the dye solution has difficulty penetrating the inner surface of f-TNAs. As a result, the dyes are first adsorbed on the outer surface of f-TNAs and then slowly adsorbed on the inner surface of f-TNAs during the long dye adsorption time. Nevertheless, the best PCE (5.52%) of DSSCs based on closed-up f-TNAs is still lower than that of any other DSSCs with f-TNAs. This highlights the control of dye adsorption imposed by the structural design of closed-up f-TNAs in facilitating effective dye loading and, consequently, optimal PCE.
The dye loading of closed-down f-TNAs increases from 159 nmol/cm2 to 229 nmol/cm2 up to 8 h. Accordingly, Jsc, Voc, FF, and PCE of DSSCs based on closed-down f-TNAs also increase from 9.99 mA/cm2 to 13.08 mA/cm2, 0.68 V to 0.76 V, 62.4% to 68.4%, and 4.22% to 6.76%, respectively. The best PCE of DSSCs based on closed-down f-TNAs is 6.78%, with Jsc, Voc, and FF of 13.09 mA/cm2, 0.76 V, and 68.4%, respectively. The dye adsorption rate of closed-down f-TNAs is about 8.75 nmol/h, which is faster than that of closed-up f-TNAs. In this case, the pore size at the top of f-TNAs is 150 nm, which means the dyes are smoothly permeated into the channels of f-TNAs and easily adsorbed on the inner and outer surfaces of f-TNAs. After 8 h, the dye loading does not increase further, and the PCE of DSSCs remains similar to that of other DSSCs.
For open-up f-TNAs, the dye loading increases from 173 nmol/cm2 to 238 nmol/cm2 up to 16 h. The Jsc, Voc, FF, and PCE of DSSCs based on open-up f-TNAs also increase from 7.57 mA/cm2 to 14.51 mA/cm2, 0.68 V to 0.77 V, 61.9% to 68.8%, and 3.20% to 7.73%, respectively. The best PCE of DSSCs based on open-up f-TNAs is 7.73%, with Jsc, Voc, and FF of 14.50 mA/cm2, 0.78 V, and 68.7%, respectively. The dye adsorption rate of open-up f-TNAs is 4.06 nmol/h, which is lower than that of closed-down f-TNAs despite the bottom layer of f-TNAs being removed and fully opened. However, after 2 h, the dye loading is considerably higher than in any other f-TNAs. This suggests that while the dye adsorption rate is moderate, the open-up structure effectively enhances initial dye absorption.
After anodization, the shape of TNAs has a cylindrical structure, meaning both the top and bottom have the same size. However, the pore size of the top TNAs is 150 nm, while the pore size of the bottom TNAs is 25 nm. In other words, the wall thickness of the top f-TNAs (about 5 nm) is thin, and the wall thickness of the bottom f-TNAs (62 nm) is thick, as shown in
Figure 2a,c. In closed-down f-TNAs, the dye solution passes through the pores of bottom f-TNAs, and the dye is adsorbed on the surface of the bottom of f-TNAs. Due to the substantial wall thickness at the bottom, the initial dye loading amount is much higher compared to other f-TNA configurations after 2 h. However, before 16 h, the amount of dye loading increases slowly due to the thin wall thickness of f-TNAs. After 16 h, no further increase in dye loading is observed, and the PCE of the DSSCs stabilizes, remaining similar to that of DSSCs using other types of f-TNAs.
The dye loading of open-down f-TNAs increases from 164 nmol/cm2 to 235 nmol/cm2 up to 8 h. The Jsc, Voc, FF, and PCE of DSSCs based on open-down f-TNAs also increase from 11.66 mA/cm2 to 14.42 mA/cm2, from 0.70 V to 0.78 V, from 62.4% to 68.6%, and from 5.08% to 7.71%, respectively. The best PCE of DSSCs based on open-down f-TNAs is 7.71%, with Jsc, Voc, and FF of 14.42 mA/cm2, 0.78 V, and 68.6%, respectively. The dye adsorption rate of open-down f-TNAs is about 8.87 nmol/h, which is higher than that of the closed-up f-TNAs. In this case, the pore size at the top of f-TNAs is 150 nm, which means the dyes are smoothly permeated into the channels of f-TNAs and easily adsorbed on the inner and outer surfaces of f-TNAs, similar to the closed-up f-TNAs. After 8 h, the dye loading does not increase further, and the PCE of DSSCs remains similar to that of other DSSCs.
The PCE of DSSCs based on closed-up, closed-down, open-up, and open-down f-TNAs is influenced by the dye loading, which directly affects the
Jsc. However, the electron transport or transfer could not be explained solely by dye loading. Instead, the electron transport or transfer is dependent on the resistance in the structure of DSSCs.
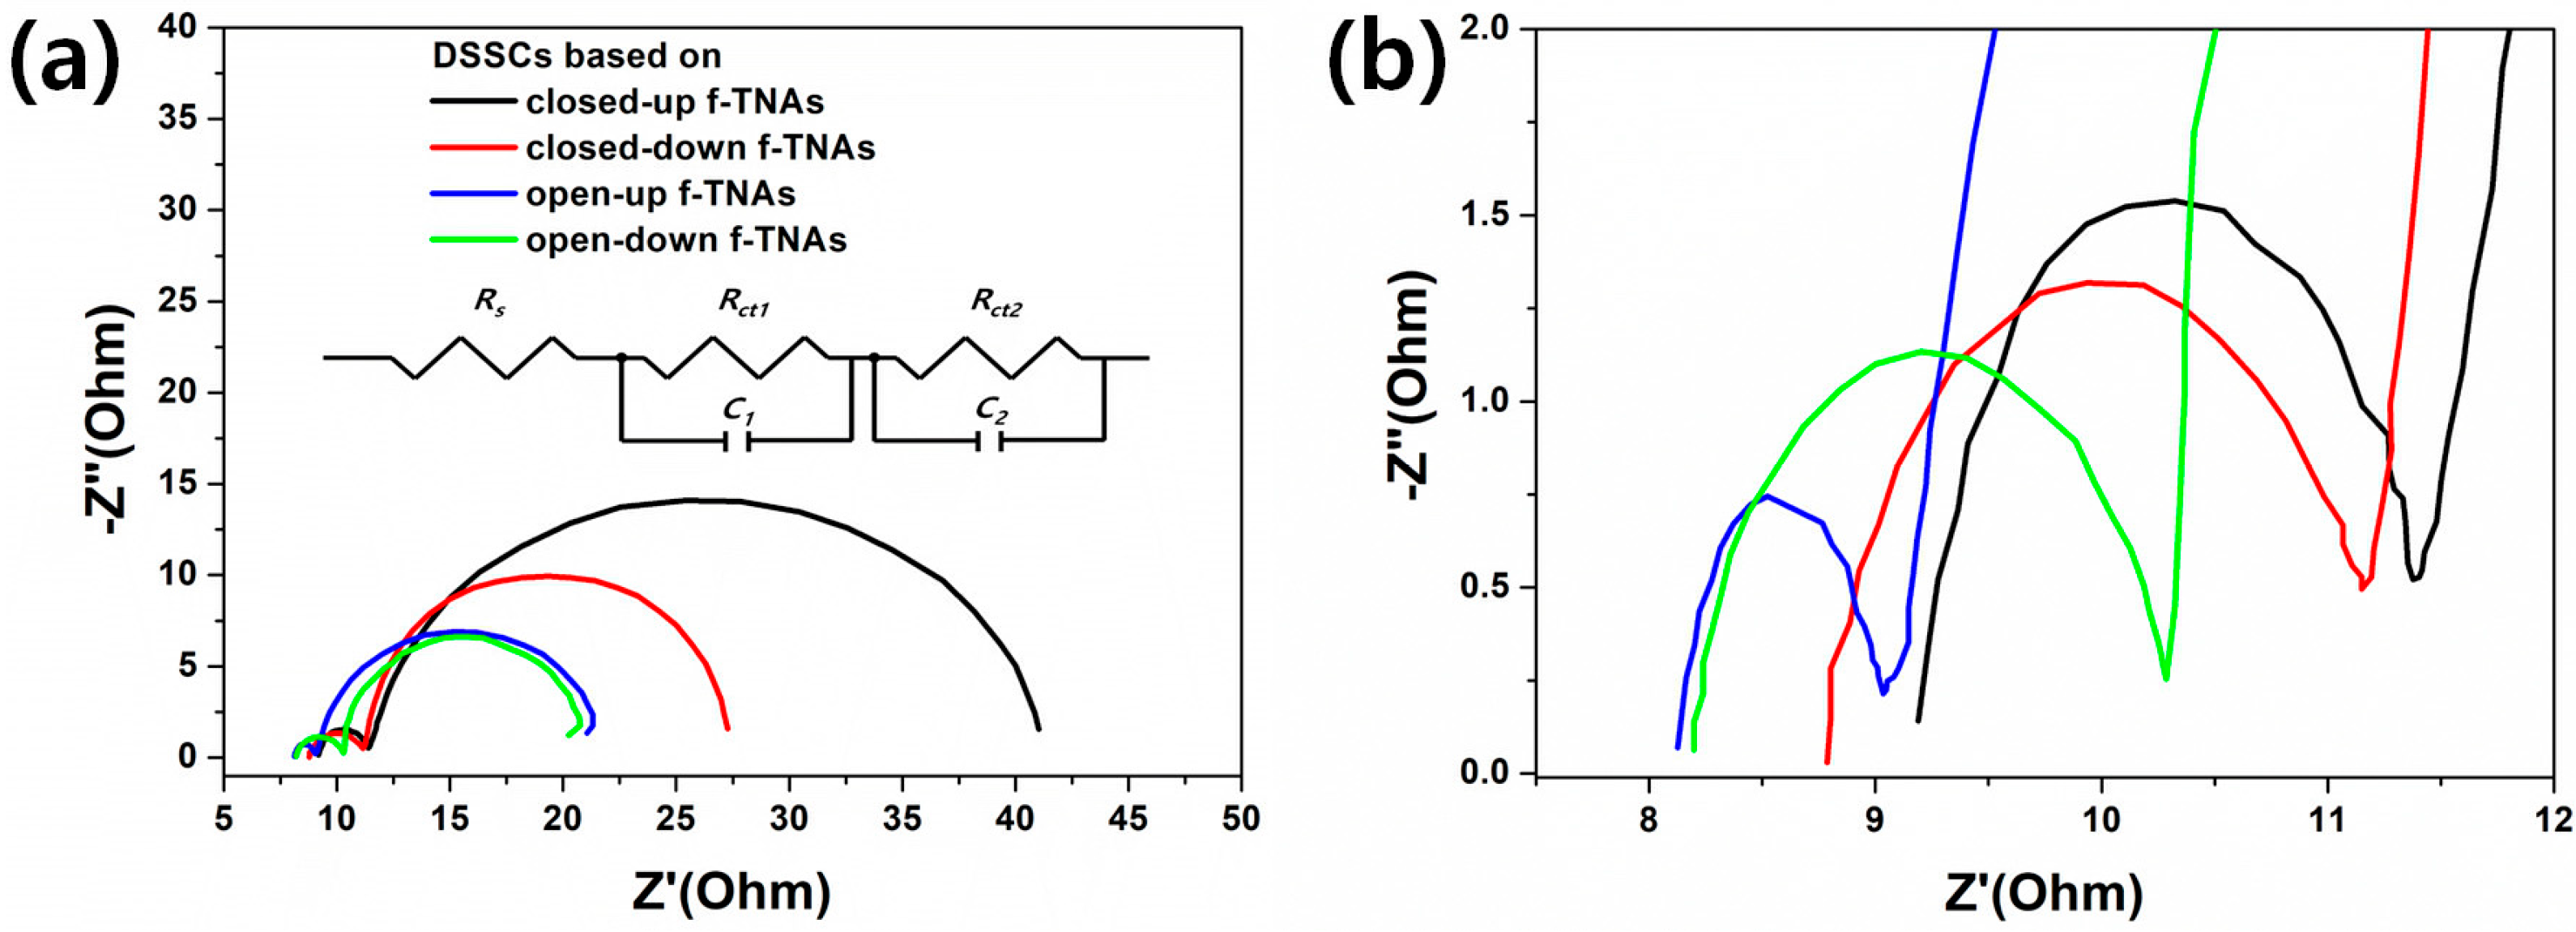
Figure 6 shows the Nyquist plots of the DSSCs based on different f-TNAs, with the corresponding equivalent circuit illustrated in the inset. In this circuit, Rs represents the series resistance originating from the conductive substrate, wiring, and electrolyte, and is typically extracted from the high-frequency intercept of the plot.
Rct1 and
C1 model the charge-transfer resistance and double-layer capacitance, respectively, at the counter electrode (Pt/electrolyte) interface, corresponding to the first semicircle in the Nyquist plot.
Rct2 and
C2 represent the charge-transfer resistance and interfacial capacitance at the photoanode/electrolyte (TiO
2 NTs/electrolyte) interface and are responsible for the second semicircle. This two-RC circuit effectively separates the interfacial kinetics of the counter electrode and photoanode, consistent with the two distinct semicircles observed experimentally. The detailed fitting parameters, including
Rs,
Rct1,
C1,
Rct2, and
C2, as well as the goodness-of-fit indicators (
χ2,
R2), are summarized in
Table 2. Each value is reported with its associated fitting uncertainty (± standard error) as estimated from the fitting algorithm. The very low
χ2 values and high
R2 values confirm the excellent quality of the model fit. Warburg-type (diffusion) elements were not included, as our spectra are dominated by charge-transfer processes under these conditions. This equivalent circuit approach is in line with standard practice in DSSC EIS analysis and allows us to quantitatively compare the electrochemical properties of the different f-TNA architectures [
36,
37]. The DSSC based on closed-up f-TNAs shows high
Rs (9.04 Ω),
Rct1 (2.58 Ω), and
Rct2 (28.72 Ω), respectively. The f-TNAs in DSSCs have a reverse structure, where the top is in contact with the FTO glass, and the bottom is in contact with the electrolyte. The electrons generated on dyes circulate through f-TNAs, FTO electrode, Pt electrode, electrolyte, and back to dyes [
38]. During the redox process in the electrolyte, the dyes are reduced by electrons. However, in DSSCs based on closed-up f-TNAs, the electrolyte is not able to easily penetrate the inner dyes of f-TNAs due to the lack of pores on the bottom of closed-up f-TNAs. Consequently, the resistances
Rs,
Rct1, and
Rct2 have higher values compared to other DSSCs with f-TNAs. The DSSCs based on closed-down f-TNAs show lower
Rs (8.69 Ω),
Rct1 (2.38 Ω), and
Rct2 (17.32 Ω), respectively. The f-TNAs have a normal structure, which means the bottom is in contact with the FTO glass and the top is in contact with the electrolyte. The electrolyte can easily penetrate to the inner dyes of f-TNAs through the top pores of f-TNAs, and the dyes are easily reduced by electrons during the redox process. Consequently, the resistance
Rct2 of closed-down f-TNAs is decreased compared to the
Rct2 of closed-up f-TNAs. The DSSCs based on open-up f-TNAs show
Rs (8.00 Ω),
Rct1 (1.12 Ω), and
Rct2 (12.88 Ω), respectively. The f-TNAs have a reverse structure, which means the top is in contact with the FTO glass, and the bottom is in contact with the electrolyte. Compared to the closed-up f-TNAs, the difference is that the bottom is open with a pore size of 25 nm. The electrolyte can easily penetrate the inner dyes of f-TNAs through the bottom pores of f-TNAs, and the dyes are reduced by electrons during the redox process. Consequently, the resistance
Rct2 of open-up f-TNAs is lower compared to the
Rct2 of closed-up or closed-down f-TNAs. The DSSCs based on open-down f-TNAs show
Rs (8.11 Ω),
Rct1 (2.06 Ω), and
Rct2 (11.19 Ω). The f-TNAs have a normal structure, which means the bottom is in contact with the FTO glass, and the top is in contact with the electrolyte. The electrolyte can easily penetrate to the inner dyes of f-TNAs through the top pores of f-TNAs, and the dyes are easily reduced by electrons during the redox process. Consequently, the resistance
Rct2 of open-down f-TNAs is lower compared to the
Rct2 of closed-up or closed-down f-TNAs. The structural orientation facilitates better electrolyte infiltration and more efficient electron transport, thereby reducing resistances and enhancing the DSSC performance.
Compared to the DSSCs based on closed-down or open-down f-TNAs, the dye adsorption time is 8 h, and the best PCE of DSSCs based on closed-down or open-down f-TNAs is 6.78% or 7.71%, despite the dye loading being 7 nmol/cm2. The difference between these two configurations is the presence of a barrier layer beneath the bottom of the closed-down f-TNAs. In this case, as the barrier layer significantly impedes the electron transfer from f-TNAs to FTO glass, the Rct1 (2.06 Ω) of DSSCs based on open-down f-TNAs is lower than that (2.38 Ω) of DSSCs based on closed-down f-TNAs.
Compared to the DSSCs based on open-up or open-down f-TNAs, both configurations achieve their optimal power conversion efficiency (PCE) and dye loading after sufficient dye adsorption times: 7.73% with 238 nmol/cm2 for open-up f-TNAs after 16 h and 7.71% with 235 nmol/cm2 for open-down f-TNAs after 8 h. The resistance of DSSCs based on open-down f-TNAs shows a slight difference compared to DSSCs based on open-up f-TNAs. Especially, the Rct1 (2.06 Ω) of DSSCs based on open-down f-TNAs is higher than that (1.12 Ω) of DSSCs based on open-up f-TNAs. In contrast, the Rct2 (11.19 Ω) of DSSCs based on open-down f-TNAs is lower than that (12.88 Ω) of DSSCs based on open-up f-TNAs. The f-TNAs have a cylindrical structure featuring a conical inner design. The top wall is thin (5 nm), which leads to a large pore size of 150 nm. In contrast, the bottom wall is thicker (approximately 62 nm), resulting in a smaller pore size of 25 nm. Consequently, the structural configurations of the f-TNAs influence the parameters of DSSCs, and these parameters are verified through resistance measurements. Rct1 is the resistance at the FTO/f-TNAs/dye interface. Low resistance indicates low recombination because a thin wall is advantageous for charge carrier transport, resulting in reduced recombination, better charge separation, and faster electron transport. Consequently, the DSSCs based on open-up f-TNAs are effective for Rct1. Rct2 is the resistance at the TNAs/dye/electrolyte interface. To reduce the resistance of Rct2, the interface between the dye and electrolyte should not be disturbed, as the large pore size is suitable for electrolyte diffusion. Consequently, the open-down f-TNAs are beneficial for Rct2.
3.1. Structural Configurations and Performance Characteristics of f-TNAs
This study investigates the impact of various structural configurations of f-TNAs on the performance in DSSCs. Four distinct configurations are examined: closed-up, closed-down, open-up, and open-down f-TNAs.
3.1.1. Closed-Up f-TNAs
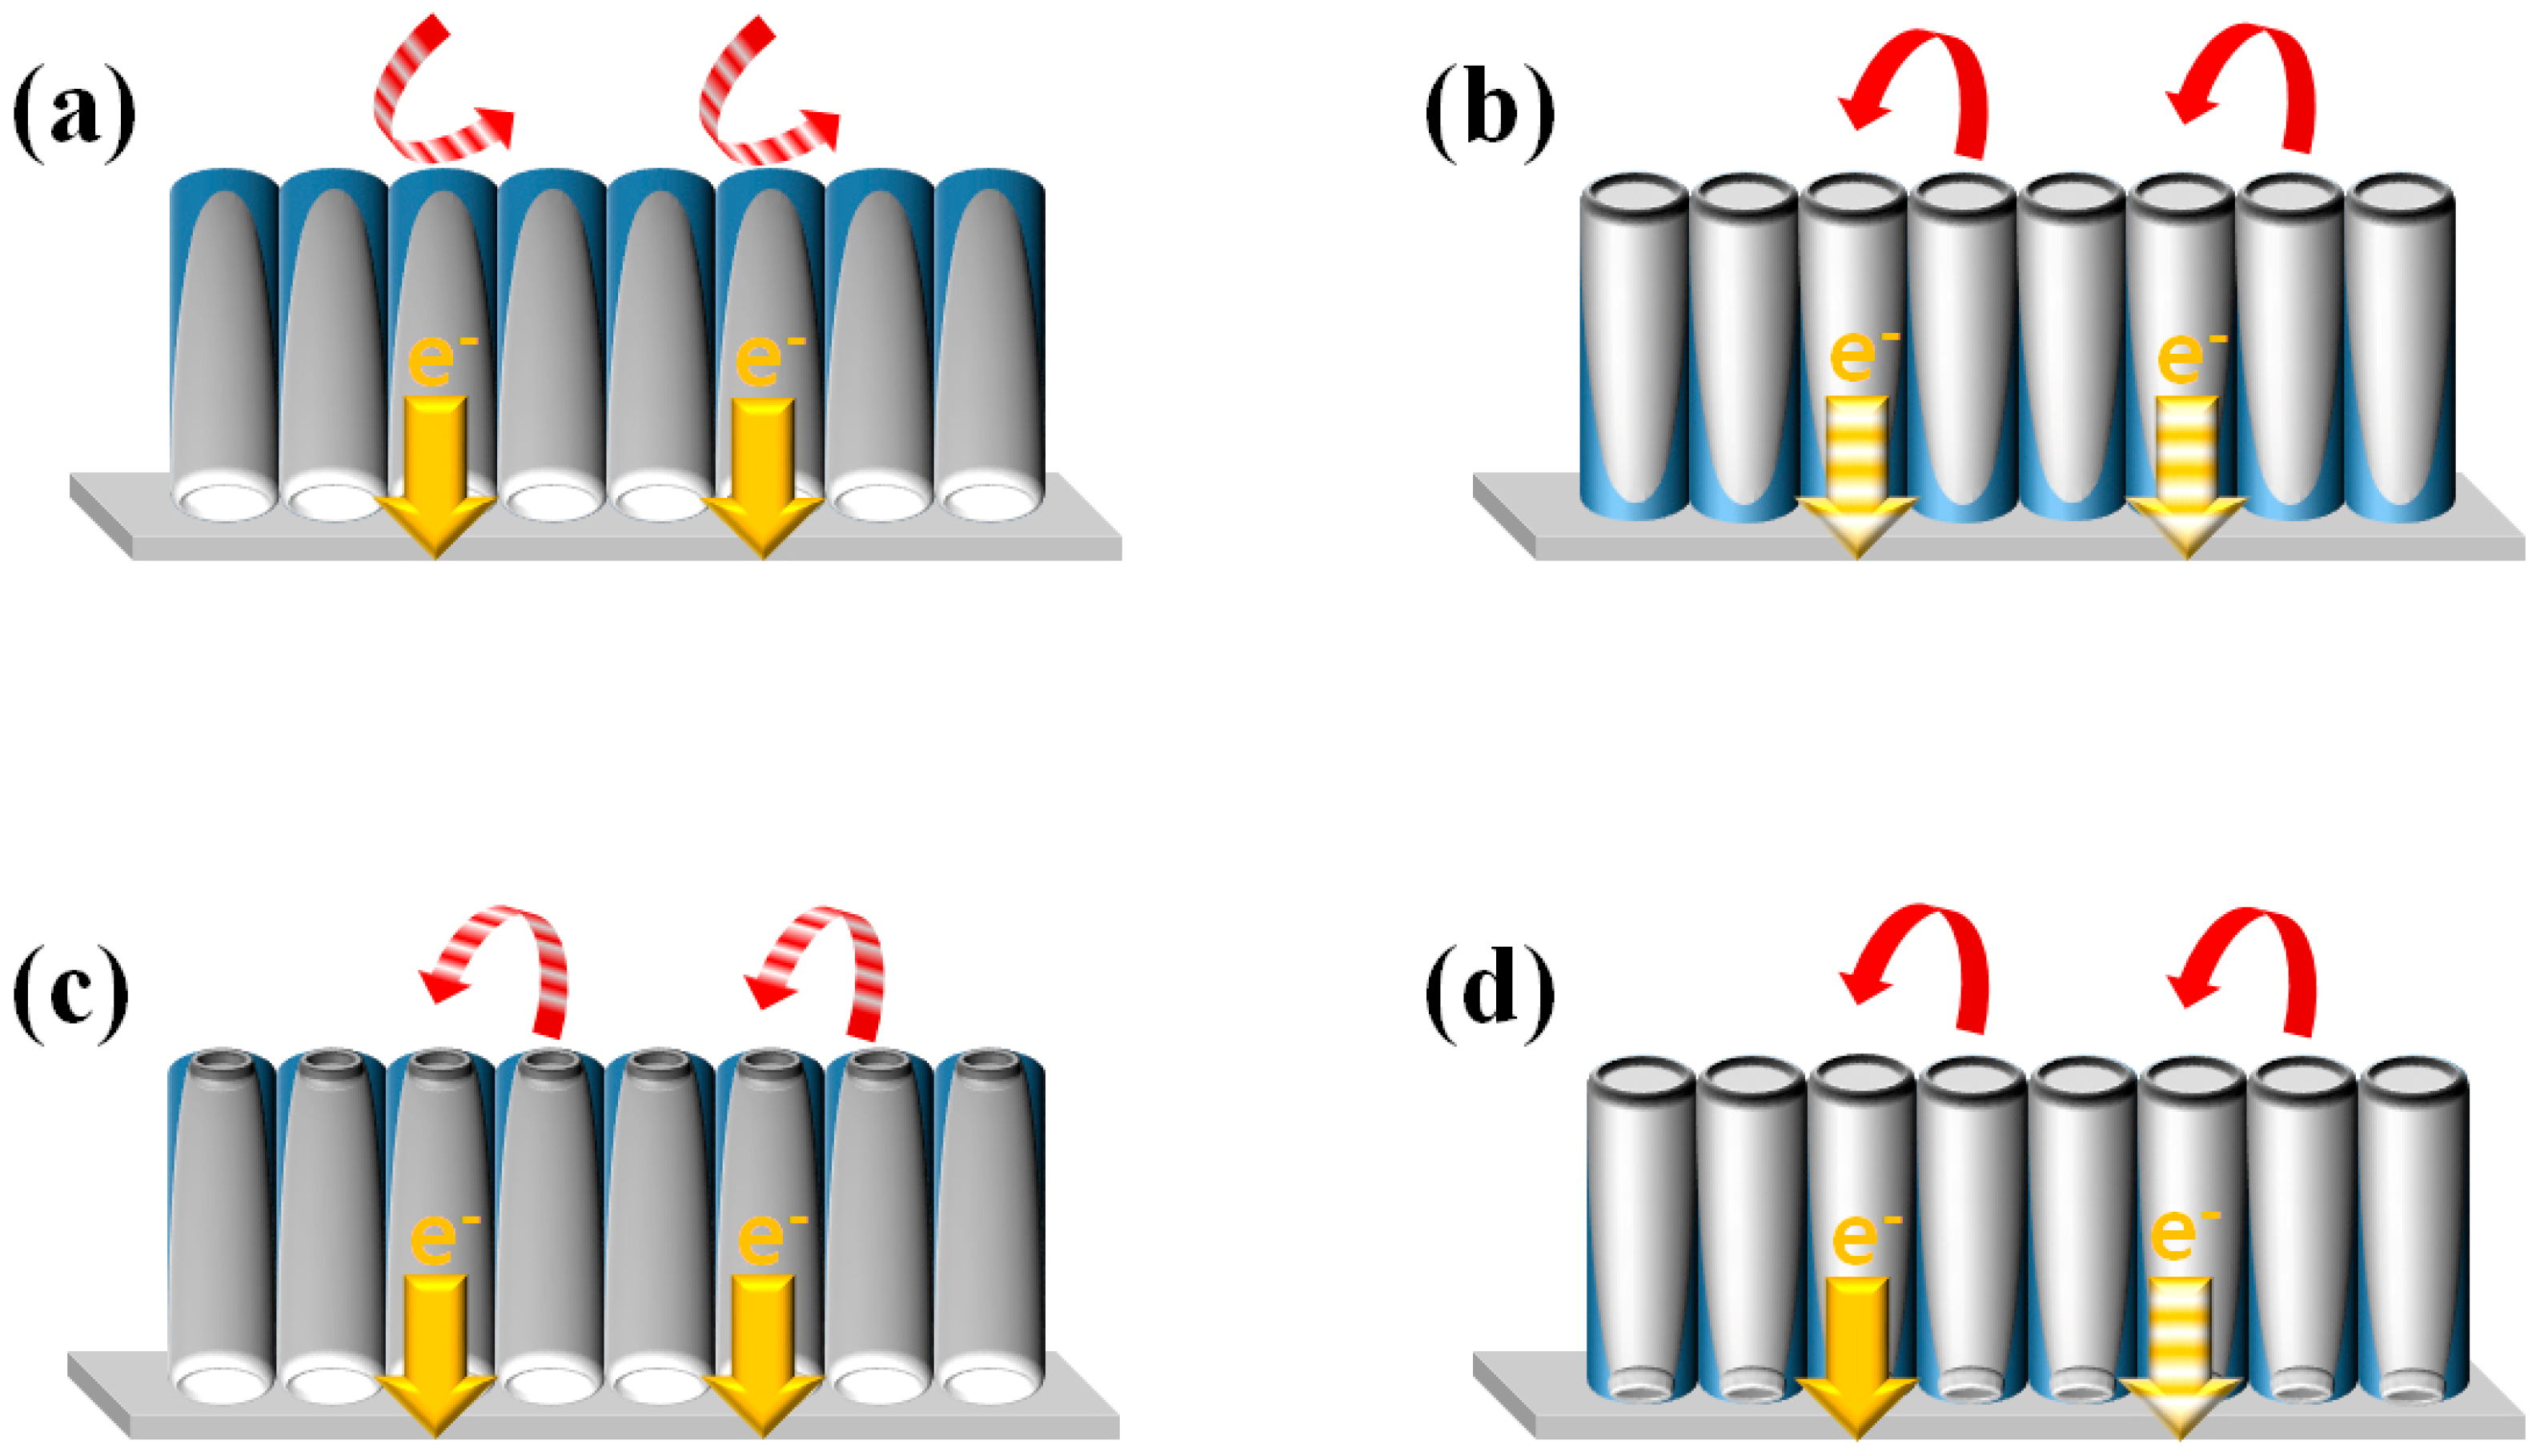
In the closed-up configuration, the bottom of the f-TNAs forms the upper part, while the top constitutes the lower part. This structure significantly impedes dye adsorption and electrolyte diffusion due to the closed bottom, as illustrated in
Figure 7a. Consequently, electron generation is limited to the outer surface of the f-TNAs, where dye molecules are adsorbed. The redox coupling reaction is similarly confined to the outer surface. Despite these limitations, the thin walls of the f-TNAs facilitate efficient electron transfer to the electrode.
3.1.2. Closed-Down f-TNAs
The closed-down configuration presents the top of the f-TNAs as the upper part and the bottom as the lower part. This arrangement, depicted in
Figure 7b, allows for enhanced dye adsorption and electrolyte diffusion through the large top pore. As a result, electron generation occurs on both the inner and outer surfaces of the f-TNAs. The redox coupling reaction also takes place on both surfaces. However, the presence of a barrier layer at the bottom of the f-TNAs restricts electron transfer to the electrode.
3.1.3. Open-Up f-TNAs
In the open-up configuration, the bottom of the f-TNAs forms the upper part, while the top constitutes the lower part. As shown in
Figure 7c, this structure allows for slow penetration of dye molecules and electrolyte through the small bottom pore. Electron generation occurs on both inner and outer surfaces, but only after an extended dye adsorption period. The redox coupling reaction is impeded by the small bottom pore. Nevertheless, the thin walls of the f-TNAs ensure efficient electron transfer to the electrode.
3.1.4. Open-Down f-TNAs
The open-down configuration presents the top of the f-TNAs as the upper part and the bottom as the lower part. As illustrated in
Figure 7d, this structure facilitates easy penetration of dye molecules and electrolyte through the large top pore. Consequently, electron generation and redox coupling reactions occur on both inner and outer surfaces of the f-TNAs. However, the thick walls of the f-TNAs in this configuration constrain electron transfer to the electrode.
These findings elucidate the complex interplay between structural configurations of f-TNAs and their performance characteristics in DSSCs. The study highlights the importance of optimizing the f-TNA structure to balance dye adsorption, electrolyte diffusion, and electron transfer processes for enhanced DSSC efficiency.
