Article

A Non-Contact Phosphor Thermometry Technique for Determining the Optical Absorptivity of Materials

Sensor Systems Group, Semiconductor and Quantum Technologies, School of Electrical & Electronic Engineering, The University of Sheffield, Portobello Centre, Pitt Street, Sheffield S1 4ET, UK
*
Authors to whom correspondence should be addressed.
Materials 2025, 18(20), 4806; https://doi.org/10.3390/ma18204806
Submission received: 18 September 2025 / Revised: 14 October 2025 / Accepted: 15 October 2025 / Published: 21 October 2025

Abstract

This work presents a bespoke, non-contact, and low-cost Phosphor Thermometry (PT) technique for the measurement of material absorptivity. The approach circumvents the challenges associated with traditional and intrusive calorimetric techniques, which require secure contact with the sample substrate. A thermographic phosphor (TP), Manganese-activated Magnesium Fluorogermanate (MFG), was used as a two-colour thermometer utilising the peak intensity ratio technique, enabling an empirical temperature measurement of a given Material Under Test (MUT). The system was calibrated to temperature across a dynamic range of 20 °C to 140 °C and subsequently assessed in terms of noise and relative sensitivity. A mathematical model describing the thermal behaviour of the samples was subsequently developed and used to infer the absorptivity value of the MUTs. Two paints, Black 3.0® and Avian-B500®, with known but contrasting absorptivities, were analysed, resulting in measured absorptivity values of 0.9385 and 0.0651 within a range of 0.0081 and 0.0127 for the two paints, respectively. Subsequent mixtures of both paints, with inherent unknown absorptivities, provided resolvable and incremental steps between the two extremities. Further measurements at specific narrow-band wavelengths of 600 nm and 1550 nm of Black 3.0® were performed, yielding median absorptivity values of 0.9598 and 0.9172 within a range of 0.0168 and 0.0396 , respectively, therefore demonstrating the technique for the measurement of material absorptivity at discrete wavelengths. The potential of a non-contact calorimetric PT technique could provide a scalable, non-intrusive, and low-cost solution for measuring the wavelength-dependent absorptivity values of materials that are used across engineering and research fields.

1. Introduction

The spectral absorptivity of a material can be defined as the proportion of incident Electromagnetic Radiation (EMR) absorbed and subsequently converted into thermal energy by that material as a function of wavelength [1]. Wavelength-dependent absorptivity is a critical thermo-physical property that influences the efficiency of various thermal systems. Accurate knowledge of this absorptivity, even if at only a limited number of discrete points, is fundamental for optimising the design of such systems [2]. For instance, additive manufacturing techniques such as Selective Laser Melting (SLM) require a stable melt pool during the processing of metal powders; this is crucial for ensuring quality within the manufactured parts [3]. The stability of the melt pool is dictated by the wavelength-dependent absorptivity of the material being processed, making it a highly desirable parameter. However, this absorptivity is often unknown or poorly characterised [4]. Therefore, the typical 1064 nm wavelength laser used within SLM systems is not necessarily the optimal wavelength for the material being processed [5]. For example, the optimal absorption wavelength for aluminium occurs at 808 nm [6], while copper absorbs most efficiently within the Ultraviolet (UV) spectral region [7]. Having an incomplete understanding of a specific material’s absorptivity can impact upon part quality, leading to defects, distortions, and excess energy consumption during processing [8]. Similarly, materials used within space exploration applications have inherent wavelength-dependent properties, which, in the vacuum of space, are perpetually bombarded with EMR. The degree of radiation that they absorb directly dictates their temperature, which can compromise the function of sensitive equipment, particularly systems that must remain at cryogenic temperatures [9,10]. Further examples include solar absorbers [11], radiative cooling surfaces [12], thermal coatings [13], and measurement uncertainty within non-contact temperature measurements [14]. Such applications all have unique absorptivity signatures that are ultimately impacted by wavelength-dependent properties.
Two genres of measurement technique exist for measuring the absorptivity of a material: radiometric [15] and calorimetric [9]. Radiometric methods are typically used to measure emitted and/or reflected Infrared (IR) from an object, using IR imagers [16,17]. This measurement technique is limited by the requirement of knowing the target object’s independent emissivity, temperature, and the reflection of ambient radiation, which can be difficult to isolate without significant calibration and corrections [18]. A subset of radiometric techniques includes hyperspectral methods, which have been demonstrated to determine material absorptivity across a wide range of wavelengths [19]. These systems operate within the ranges of UV to Very Long Wave Infrared (VLWIR), becoming increasingly expensive as you move from the visible spectrum into the IR spectrum [20,21]. In general, radiometric systems are bulky, expensive, and time-intensive and require complex calibrations. In contrast, calorimetric methods determine a material’s absorptivity through measuring the thermal energy either lost or gained by a sample over time [9,22]. This approach typically involves the deployment of multiple thermocouples at different positions across the sample surface and is used to measure the mean temperature fluctuation within metal powders and, therefore, enable their absorptivity to be inferred [23]. However, the use of thermocouples is limited by their slow response times and the difficulty in achieving the reliable thermal contact required for accurate measurements [24,25].
Among the various alternative temperature measurement techniques that are emerging, Phosphor Thermometry (PT) is a promising, semi-invasive technique for measuring surface temperatures with high precision and reliability [26,27]. Research outputs investigating novel Photoluminecent (PL) materials and their metrological applications has grown significantly over the last decade, highlighting the growing importance of this technology [28]. PT has been successfully demonstrated in fields such as combustion diagnostics [29], aerospace thermal management [30], and nuclear safety [31]. The emissivity independence and ability to negate changes within the background radiation of PT places it in a position to overcome the aforementioned traditional thermometry techniques [31]. PT involves the use of Thermographic Phosphors (TPs), which have temperature-dependent spectral emission properties [32]. The most common approaches for TP temperature calibration and measurement can be categorised into three main methods: decay rate [33], rise time [34], or the intensity ratio [35]. Numerous studies on TPs have been conducted for the application within PT, many doped with rare earth ions, such as Erbium ( E r 3 + ), or transition metals such as Manganese ( M n ) [36,37,38]. Of all the various TPs available, the most dominant and extensively studied TP within the domain of temperature measurements is Manganese-activated Magnesium Fluorogermanate (MFG) ( M g 4 F G e O 6 : M n ) [39,40]. The MFG used within this work was purchased from Phosphor Technology Inc. (Phosphor Technology Ltd., Stevenage, Hertfordshire, UK) with product code EQD25/F-U1 [41]. MFG operates via down-conversion, which emits visible light when stimulated by an external light source with a shorter wavelength output, such as UV Light Emitting Diodes (LEDs) or lasers [42,43]. MFG has two distinct spectral emission regions, with peaks at 630 nm and 660 nm. These two peaks demonstrate clear but opposing thermal behaviour, with the 630 nm peak intensity increasing and the 660 nm peak decreasing in response to an increase in temperature. The predictable thermal response of MFG allows for precise calibration against temperature by taking the ratio of the spectral emission energy [40]. Changes in the temperature of a surface can be monitored by adhering the TP to the target object and measuring its temperature-dependent light emission using radiometry; the amount of energy absorbed by that object is directly linked to its temperature [27].
Utilisation of PT as a calorimetric technique to measure material absorptivity offers distinct advantages over existing calorimetric methods. Firstly, unlike thermocouples, PT is a semi-invasive method, which allows for measurement of thermal changes without the need for physical contact [44]. Therefore, it is applicable to a wide range of surface finishes, including rough, coated, metallic materials. Secondly, PT provides high sensitivity and spatial resolution to enable real-time measurements within dynamic or harsh environments, including cryogenic conditions [31]. In contrast, thermocouples cannot accurately track rapid temperature changes due to their slow response times, which are governed by the need to reach thermal equilibrium [24]. Furthermore, PT decouples the temperature-dependent luminescent signal from the underlying radiative properties of the Material Under Test (MUT), enabling accurate absorptivity measurements for materials that have complex or unknown emissivity characteristics [45,46,47]. Finally, combining PT with low-cost optical components and Silicon Photodiode-based Radiometers (SiRs) enables the development of affordable and portable absorptivity measurement systems that can alleviate the drawbacks associated with traditional absorptivity characterisation methods. PT, therefore, has the potential to enable extension of absorptivity measurements beyond the traditional confines of specialist laboratories.
This study introduces a novel PT technique, incorporating mathematical modelling, to measure material absorptivity. The technique was validated by measuring the absorptivity of paints with known, but contrasting, absorptivity values. Subsequent mixtures of these paints were curated with unknown, but predictable, absorptivities values, which were measured. The approach involved applying MFG and the MUT to opposing sides of a shared substrate. Each sample was heated using a blackbody (thermal source), and the MUT’s absorptivity was inferred using a combination of direct calorimetry and mathematical modelling (Equation (3)) [48]. The model was fitted to the experimental temperature data within the range temperature of 20 C to 140 C by iteratively adjusting the absorptivity value until the theoretical and measured temperature gradients aligned within 95 % confidence bounds of a linear fit to the experimental data. Our approach effectively circumvents the limitations of traditional calorimetry and radiometry methods, providing a non-contact, practical, and scalable solution with significant promise for a diverse range of thermal efficiency engineering challenges.

2. Materials and Methods

2.1. Instrument Design Overview

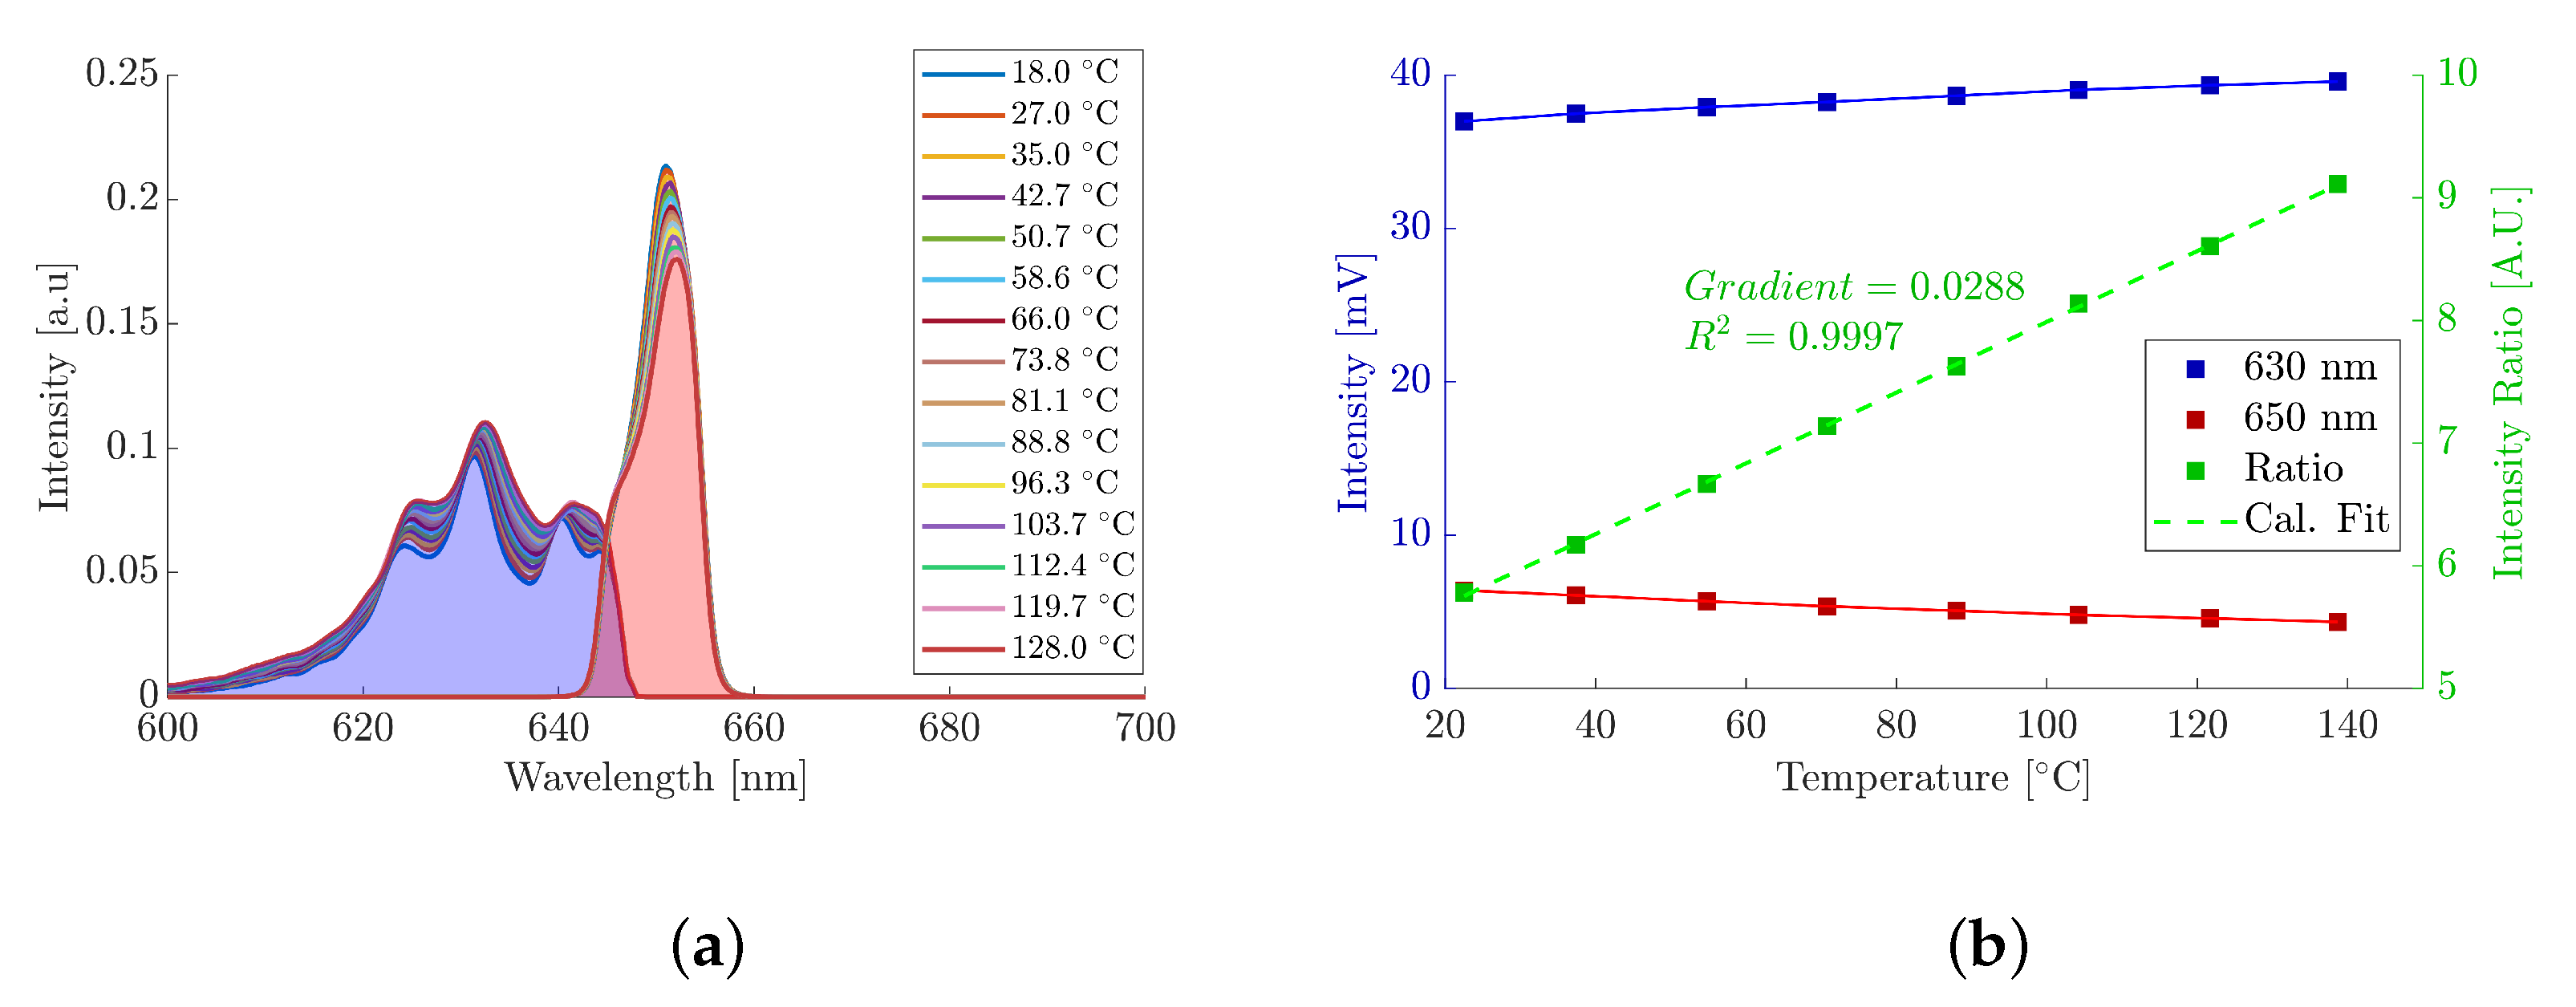
TPs are inorganic materials that consist of a host lattice doped with rare-earth ions [49] or transition metals [50,51,52]. They have an inherent temperature dependence that affects the intensity of their PL emissions; this makes them ideally suited for determining surface temperature [26]. MFG was chosen as the TP in this work for its wide availability, well-understood thermal properties, and distinct dual spectral peaks circa 630 nm and 660 nm. The dual emission peaks exhibited by MFG, as a function of wavelength and temperature, are shown in Figure 1. These emission peaks, and their surrounding spectral regions, increase and decrease as a function of temperature, respectively, and are well defined at an isosbestic point of 645 nm ± 5. Isolating the spectral regions with optical filters and measuring their emission changes with temperature allows for the development of a two-colour ratio thermometer [53,54,55]. Unlike measurement of a single emission peak, the intensity ratio method boasts reduced sensitivity to variations in excitation intensity. This negates fluctuations within the excitation source since the intensity ratio is a relative measurement as opposed to absolute. Furthermore, MFG has a temperature-sensitivity range between room temperature and approximately 700 °C, making it suitable for the temperature ranges investigated within this work [29].
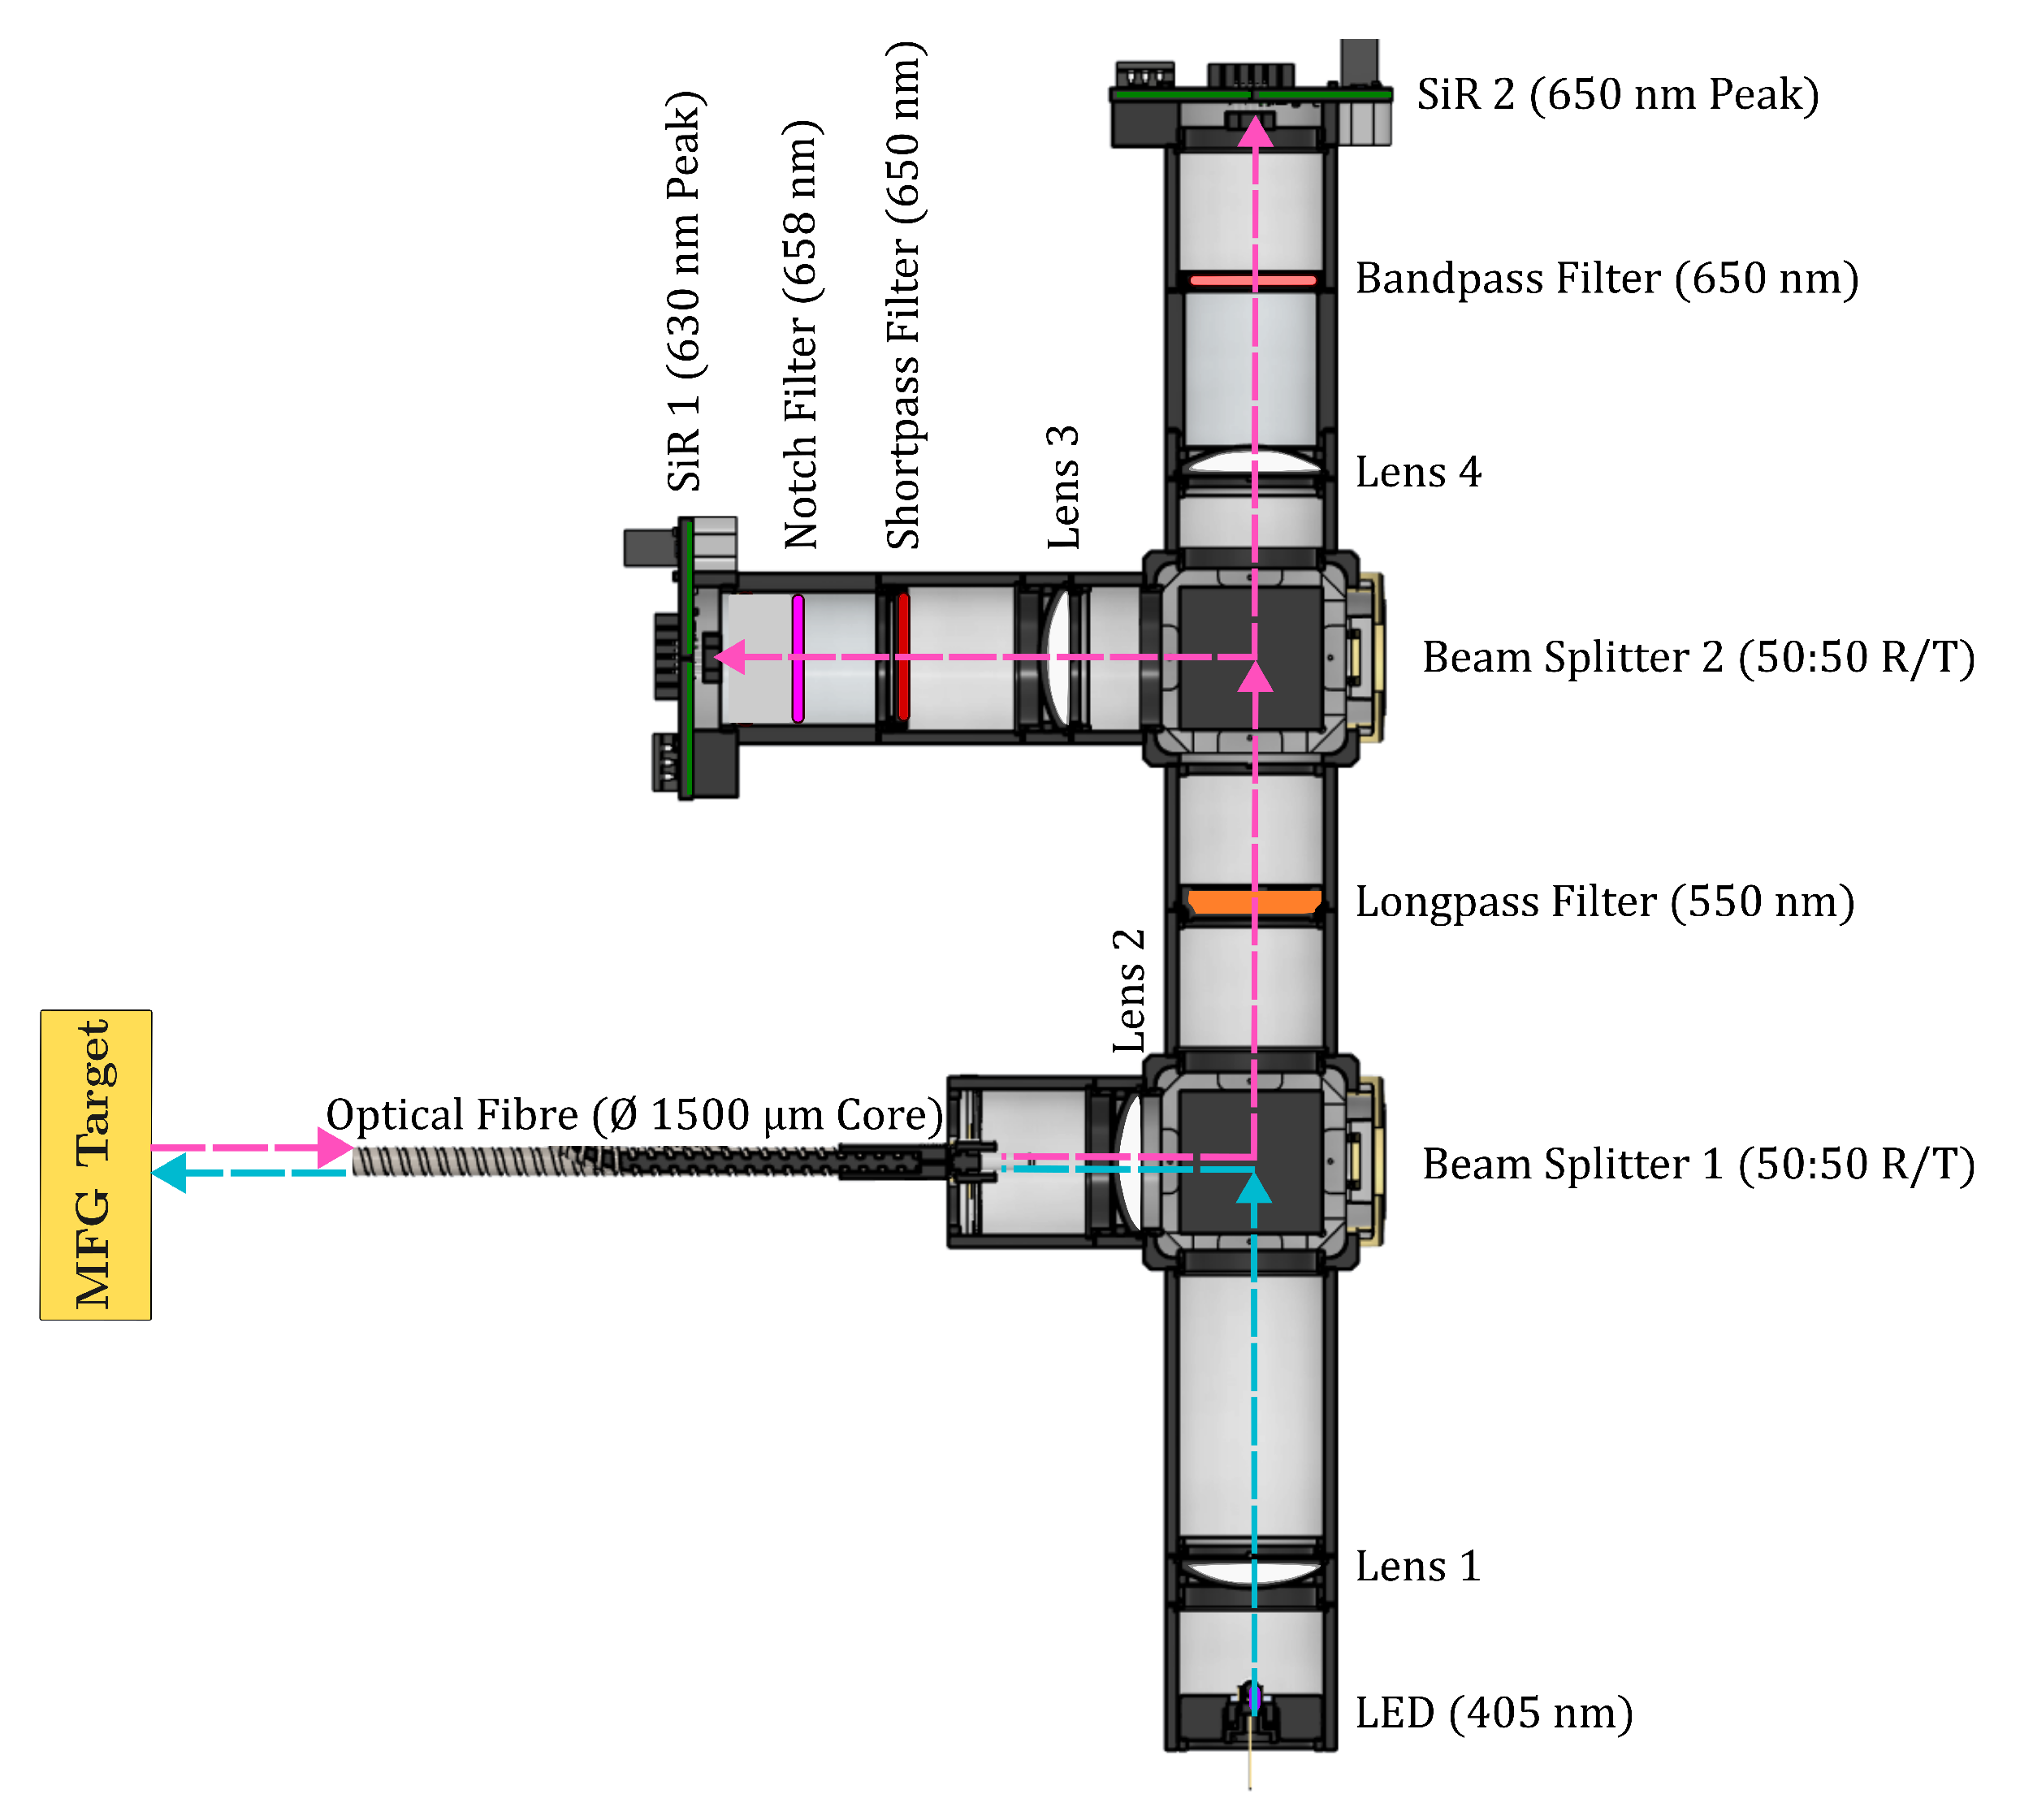
A top-down cross-section of the PT setup is illustrated in Figure 2. The PT design utilised a 405 nm LED (Thorlabs Inc., Newton, NJ, USA) to induce excitation of the MFG. The MFG emissions were coupled and isolated using optical filters, N-BK7 plano-convex lenses (focal length, f = 50 mm) (Thorlabs Inc., Newton, NJ, USA), and beam splitters (50:50 R/T) (Thorlabs Inc., Newton, NJ, USA) to isolate and direct the signal towards two SiRs. A full bill of materials can be found in Table A1.
The light emitted from the LED was first collimated by Lens 1, onto Beam Splitter 1 (50:50 R/T), which directed the emissions towards Lens 2. Lens 2 subsequently focused the LED light through a 1500 µm diameter core Optical Fibre (Thorlabs Inc., Newton, NJ, USA), irradiating the MFG target. The resulting MFG emissions were emitted back through the Optical Fibre, returning to Beam Splitter 1, directing the resultant signal though a 550 nm longpass filter (Thorlabs Inc., Newton, NJ, USA), removing the background emissions coming from the LED. Upon the signal reaching Beam Splitter 2 (50:50 R/T), the isolated MFG signal was directed toward the two SiRs channels with focusing Lenses 2 and 4.
To determine the optical filters needed to optimise the PT calibration and resolution, spectral data of the MFG at various temperatures were measured using a CCS200—Compact Spectrometer (Thorlabs Inc., Newton, NJ, USA), as shown in Figure 1 [56]. The spectrometer was located after the 550 nm long pass filter, via a port for an optical fibre, negating the use of any subsequent materials from and including Beam Splitter 2. Optical filter data was supplied by the manufacturer and applied to the MFG spectral data; this allowed for the development of a calibration model to inform the ideal combination of optical filters needed to optimise the temperature resolution of the PT. Finally, each SiR was coupled with specific optical filters, designed to isolate the two distinct MFG spectral emission regions:
  • SiR 1 ( 630 nm peak): Coupled with a 650 nm shortpass filter (Thorlabs Inc., Newton, NJ, USA) and 658 ± 26 nm notch filter (Thorlabs Inc., Newton, NJ, USA) to isolate region 1, with a peak intensity at 630 nm, which increases proportionally to increased temperature. The 650 nm filter was used to select the correct region, while the 658 nm notch filter provided a sharp rejection of the neighbouring emissions.
  • SiR 2 ( 650 nm peak): Coupled with a 650 ± 10 nm bandpass filter (Thorlabs Inc., Newton, NJ, USA) to isolate region 2, which decreases inversely proportional to increased temperature. The 650 nm bandpass filter was chosen to reject the influence of the spectral broadening; this was observed when using bandpass filters close to a 660 nm peak, causing an increase in the total signal intensity in that region, as opposed to the expected decrease.
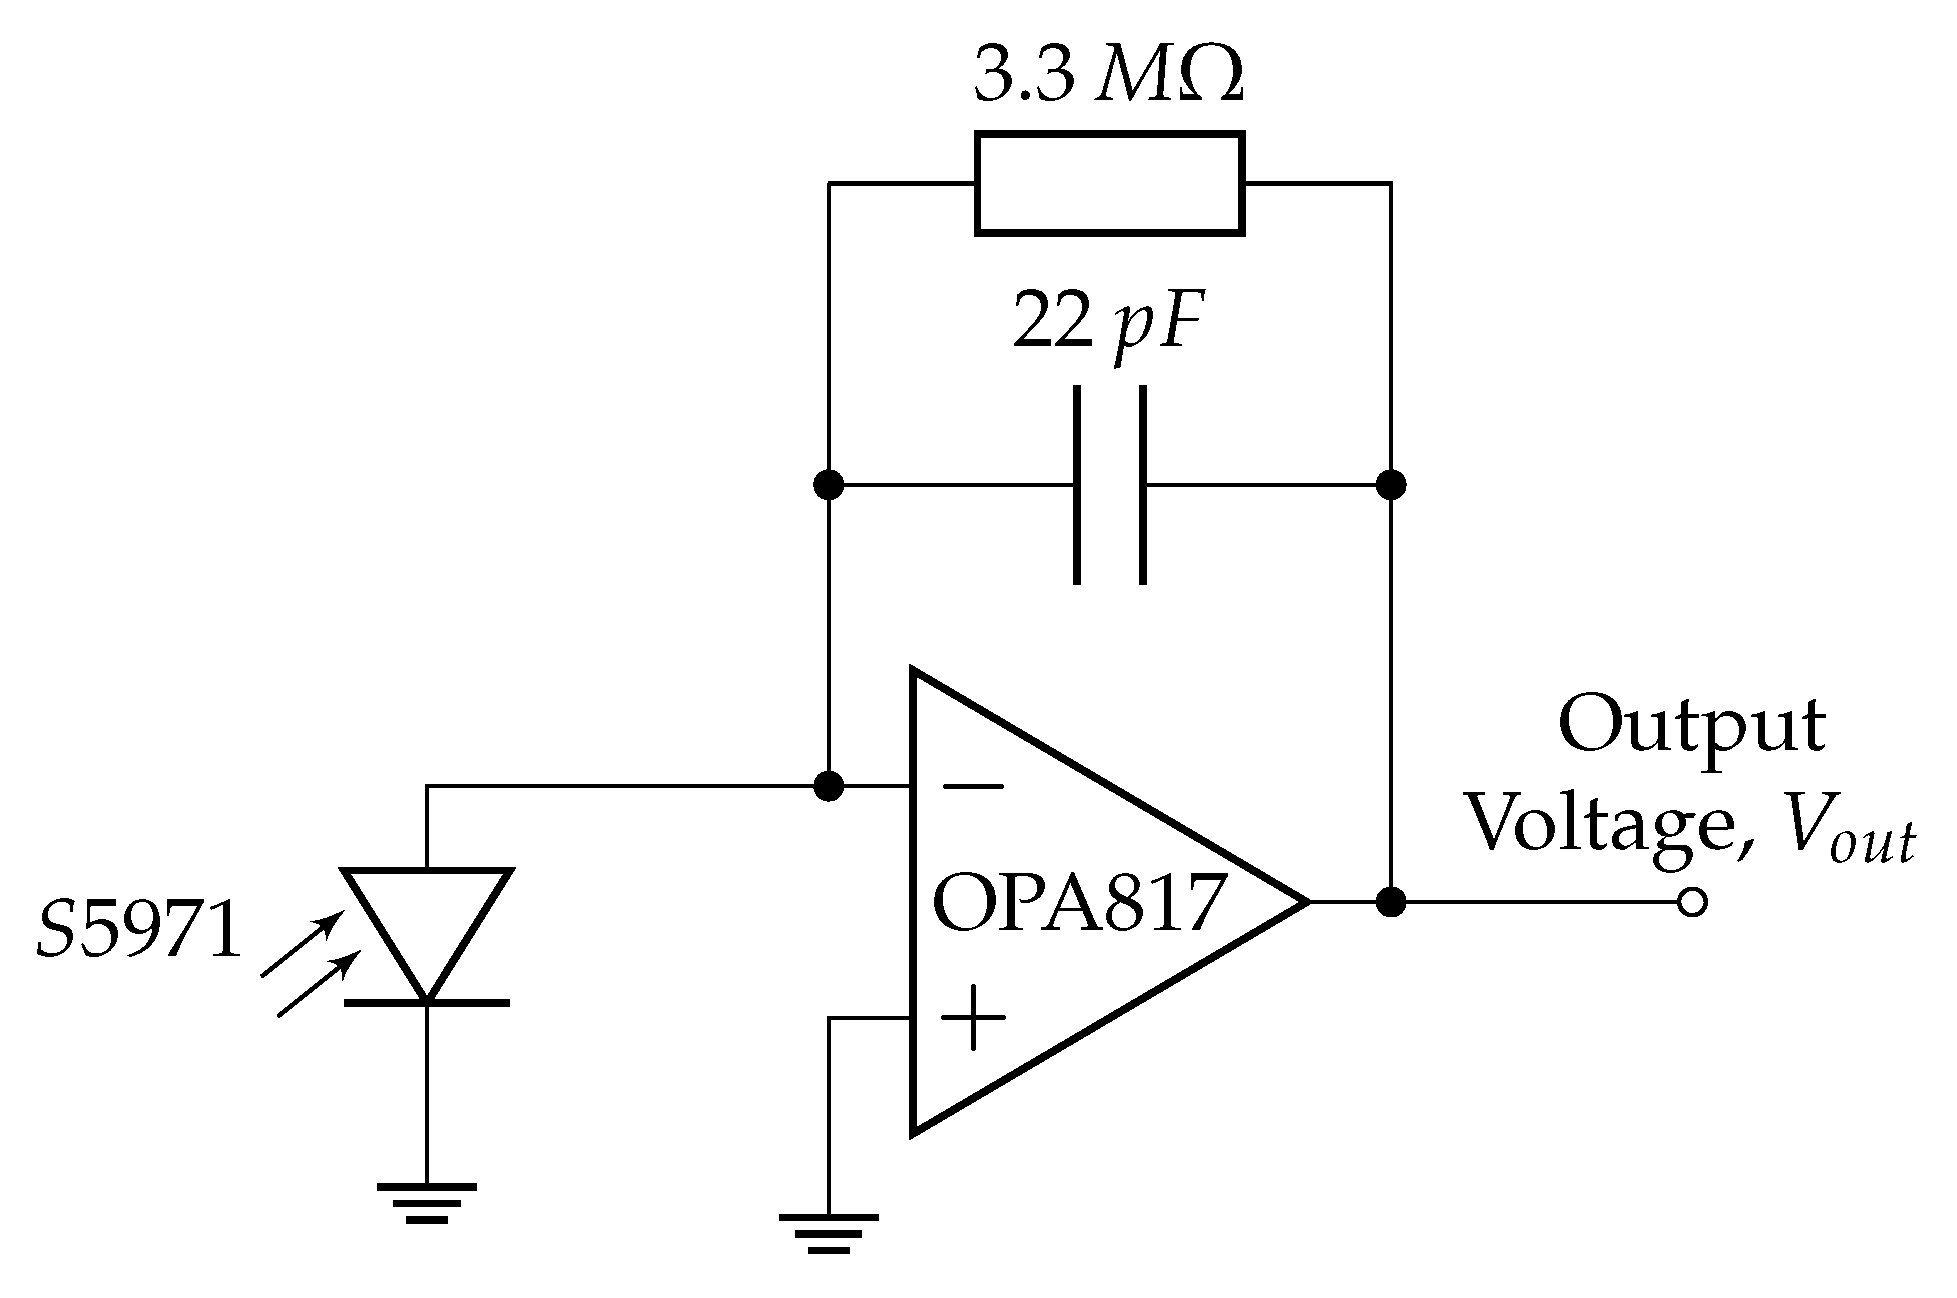
The basic SiR circuit design is shown in Figure 3. The circuit amplifies and converts to a voltage the photocurrent generated by an S5971 Silicon Photodiode (SiPD) (Hamamatsu Photonics K.K., Hamamatsu, Japan) in response to the incident MFG photoluminescent emission [57]. The SiPDs feature a 1.1 mm2 active area and a nominal wavelength range of 320 nm to 1060 nm with a peak sensitivity of 0.64 A / W at 900 nm [57]. The circuit consists of a single-stage Transimpedance Amplifier (TIA) based on the OPA817 operational amplifier (Texas Instruments, Dallas, TX, USA). OPA817s were selected for their low noise performance and high gain bandwidth product, making them suitable for weak signal detection and alleviating some uncertainty in the Signal-to-Noise Ratio (SNR).
The SiRs were connected to a National Instruments FlexLogger DAQ unit (National Instruments, Austin, TX, USA), capable of capturing the analogue output voltages from the SiRs. The SiRs detected the signal changes from the isolated spectral regions of the MFG emissions, allowing the distinct PL intensities, I n ( λ ) , to be measured as a function of temperature. By analysing the output from the two isolated spectral regions at different temperatures, the change in ratio, Δ R ( T ) , between the two signals was used to infer the temperature of the sample’s surface. The calibration gradient, m, is equivalent to the ratio change-per-degree ( d R / d T ) and represents the resolution of the PT, where a larger gradient indicates greater sensitivity, translating small temperature fluctuations into more significant changes in the measured signal ratio. Consequently, larger calibration gradients allow the PT to resolve finer temperature increments, thereby enhancing the overall measurement resolution.
Measurement of the response time of the SiRs was performed using an Agilent Technologies Inc. 33210A waveform generator (Agilent Technologies Inc., Santa Clara, CA, USA), which supplied a 10 kHz square wave to a 405 nm LED. The sample rate was chosen based on the 10–90% rise time, which was found to be 100 µs. For reference, the decay rate of MFG phosphorescence is in the region of 3.5–4 ms at circa room temperature [31]. The changes in the aforementioned decay rate and rise time, as a function of temperature, are common PL temperature calibration techniques and are often used when the intensity ratio is not applicable [33,34].
To calibrate the PT against temperature, the ratio of the two SiR signals was taken, as per Equation (1). The PT optical fibre was positioned at a distance of 50 mm from an MFG-coated calibration disc (outlined in Section 2.2) and placed onto a hot plate with the MFG facing upwards. A thermocouple was mounted inside a 12.7 mm deep blind hole, using a silver-based thermal epoxy [58], and used to provide a valid and well-characterised temperature reference. The PT SiRs outputs were recorded by the DAQ unit with an acquisition time of 100 µs, which was later filtered using a 1 s integration time. For each temperature set point, 60 s of data was taken, starting at room temperature. The hot-plate temperature was increased in increments of 10 °C, dwelling at each set point for 30 min to ensure thermal equilibrium. The process was systematically repeated until a top temperature of 140 °C was reached.
R ( T ) = I ( λ 630 n m ) I ( λ 650 n m )
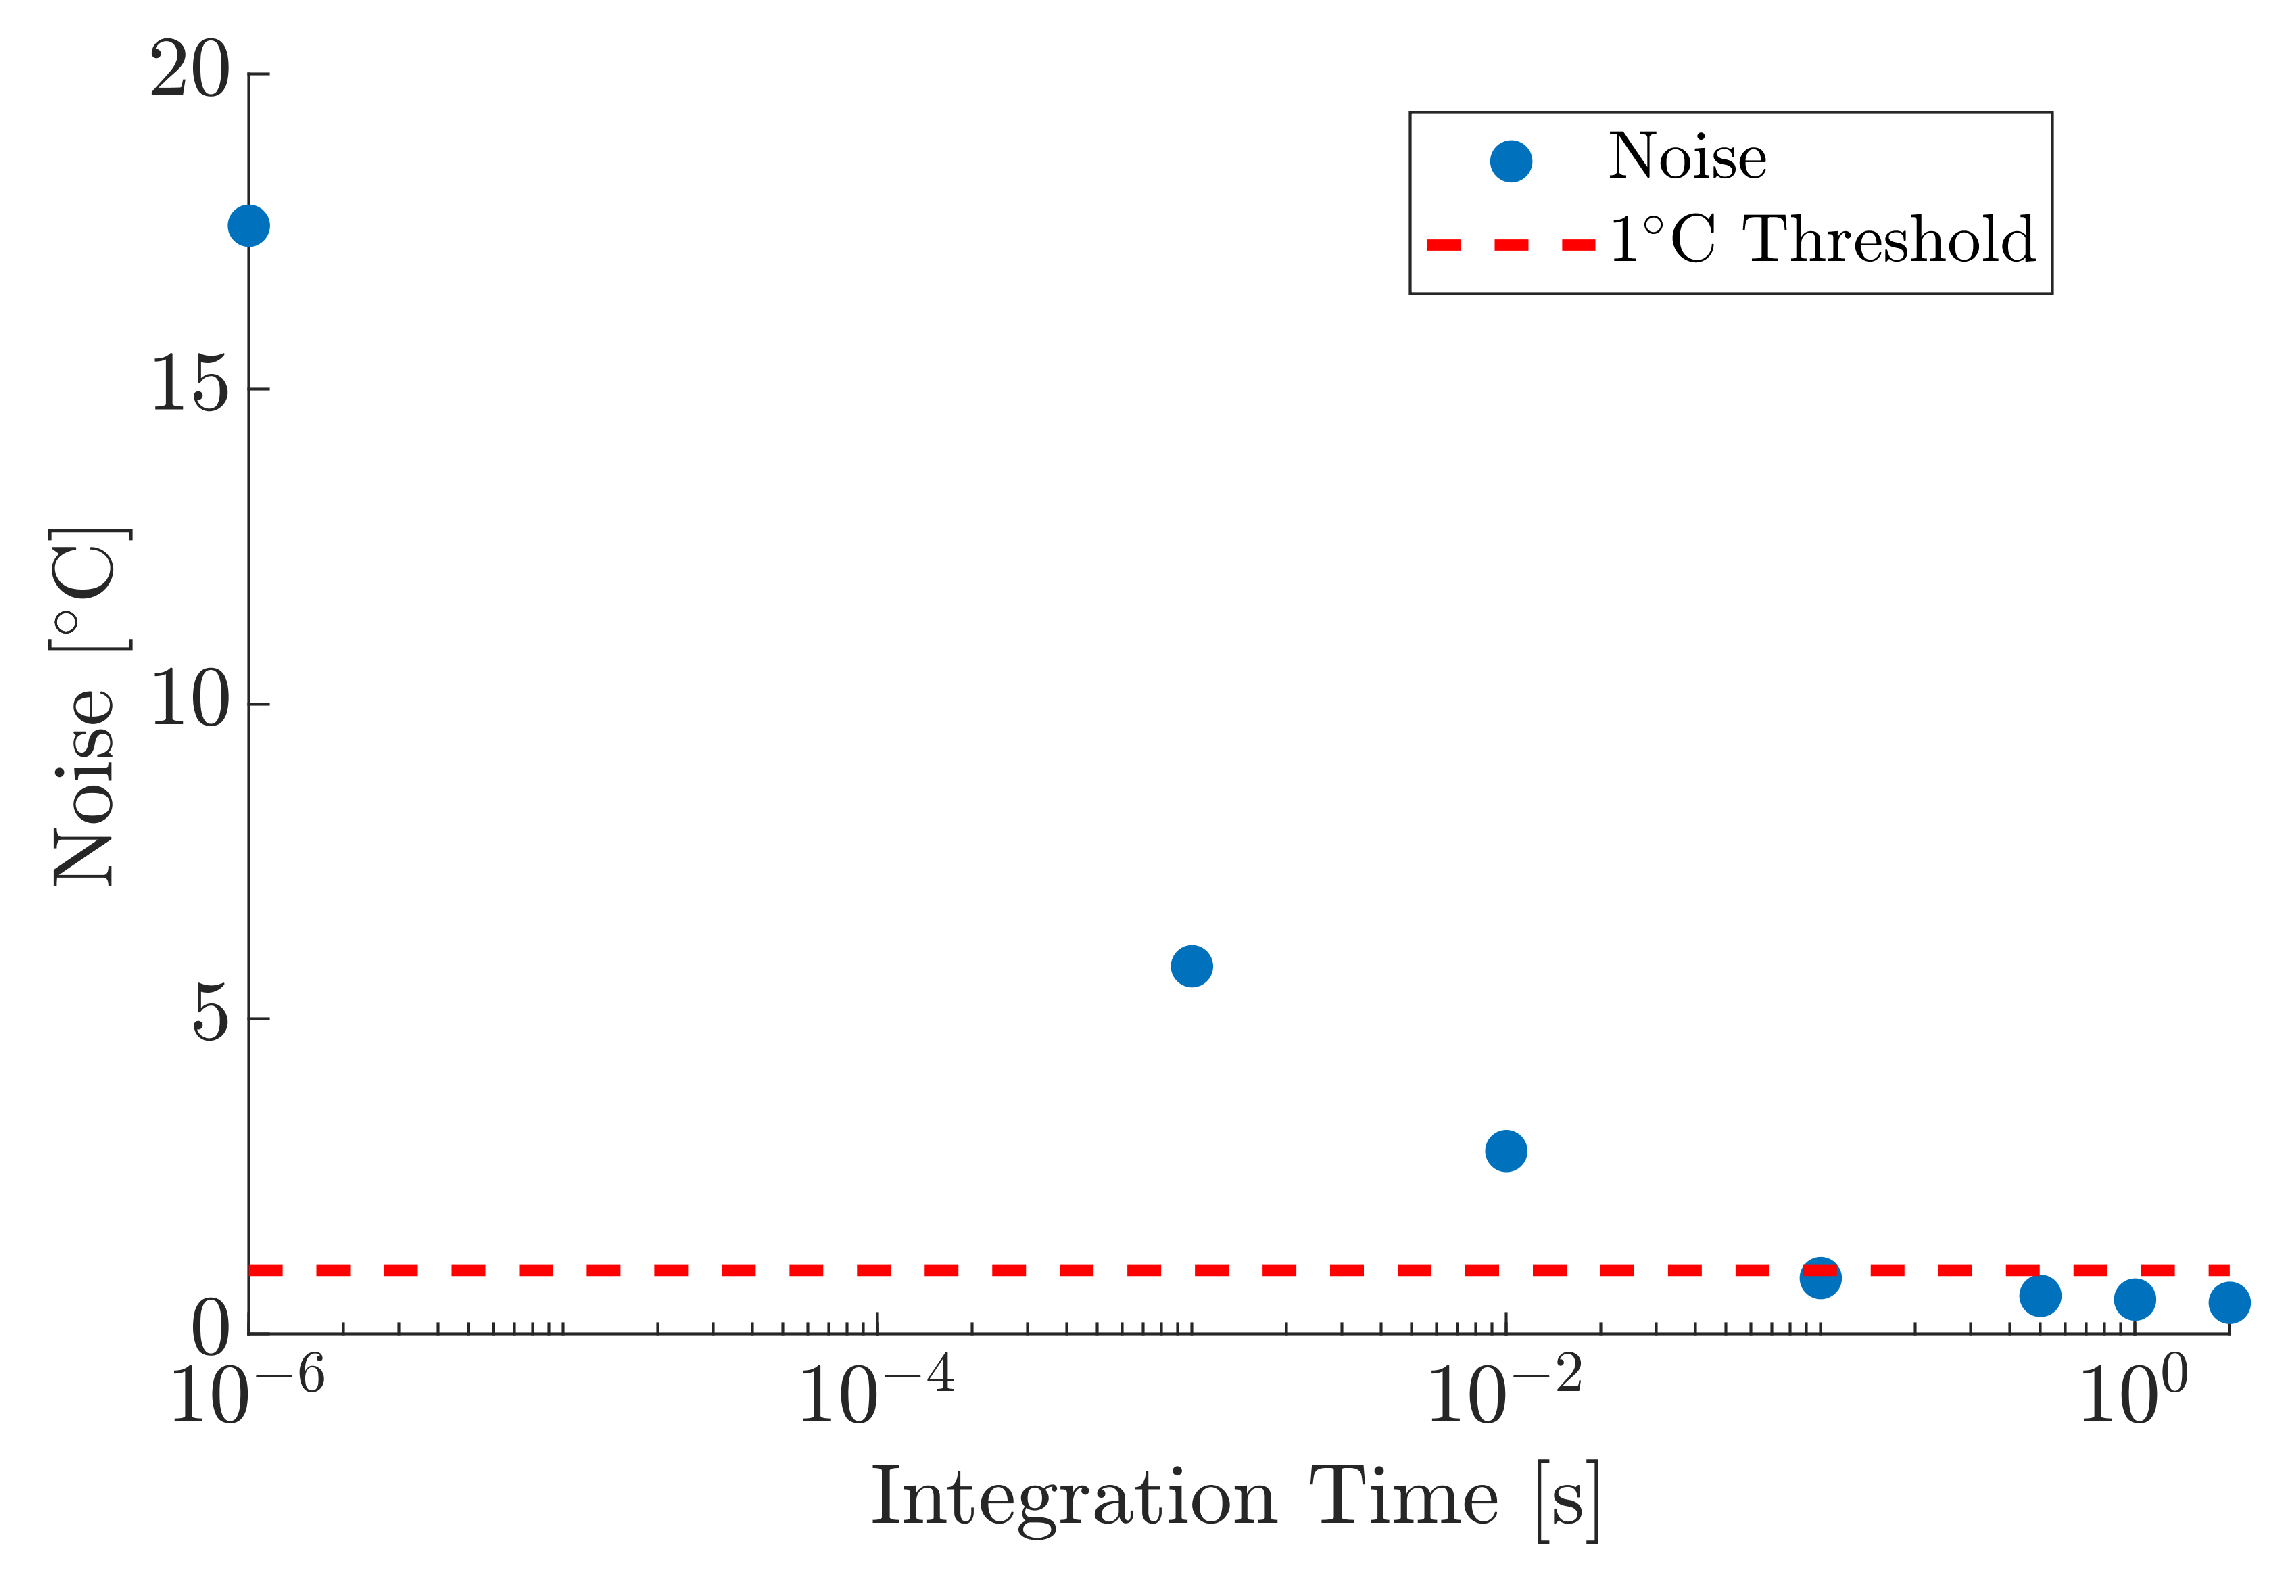
The tolerance within a commercially available K-type thermocouple, as specified in BS EN 60584-2:1993, can often exceed ± 1.5 °C [59]. Therefore, an acceptable Root Mean Square (RMS) noise level for the PT within this work was deemed to be ± 1 °C. The RMS noise for the PT system was determined by measuring the standard deviation of the output voltage from the SiRs at the minimum DAQ unit acquisition time of 100 µs, post-conversion to temperature in °C. Various integration times were applied to the raw data during post-processing, corresponding to response times of 1 ms, 10 ms, 100 ms, 500 ms, 1 s, and 2 s. The mean noise across the dynamic temperature range as a function of integration time was used to inform the PT optimal acquisition time, ensuring noise fluctuations that were comparable to, or better than, the aforementioned thermocouples.

2.2. Absorptivity Measurement Methodology

The absorptivity of a material, α ( λ ) , is a wavelength-dependent measure of the radiant flux that is absorbed and converted into internal energy, usually thermal energy, by that material [60]. It is linked to the principle of energy conservation, which also includes reflectivity, ρ ( λ ) , and transmissivity, τ ( λ ) [61,62]. For opaque materials, such as the ones studied within this work, transmissivity can be considered negligible, meaning that all radiation can be treated as either being absorbed or reflected. Furthermore, the copper substrates, on which the MUTs are deposited, are opaque with a high density of states [63]. This, therefore, simplifies the relationship to Equation (2).
α ( λ ) = 1 ρ ( λ )
This work utilises the temperature-dependent properties of MFG to detect the changes in temperature of two paints, and various mixing ratios of the two, when subject to irradiation from an SLS301 thermal source (Thorlabs Inc., Newton, NJ, USA) [48]. Absorptivity values can subsequently be inferred through empirical data and mathematical modelling. To achieve this, 12.5 mm diameter samples were prepared from 0.1 mm thick copper sheets, with one side coated with MFG and the other side coated with the MUT. For the samples, and the calibration disc, the MFG was mixed with Polyacrylamide (PAM) at a mass ratio of 10:1 (MFG:PAM). The MFG:PAM mixture was suspended in Isopropyl Alcohol (IPA), chosen for its high evaporation rate, at a concentration of 1 mL:1 g. Given that MFG is non-soluble in IPA, the solution was placed into an ultrasonic bath for 20 min to aid with dispersion before being airbrushed onto the sample’s surface. The thickness of the MFG was measured to be approximately 0.01 mm. Previous studies, such as Alden [26], explored various binders; however, PAM was chosen due to its availability and ability to withstand chain scission within the temperature ranges evaluated within this work [64].
Following the MFG coating, two samples were initially prepared for the absorptivity measurements, with one coated with a highly absorptive black paint ( α v i s = 0.97), Black 3.0® [65], and another with a contrasting, low-absorptivity white paint ( α v i s = 0.07 ), Avian-B500® [66]. Three subsequent paints were prepared using different ratios of Black 3.0® and Avian-B500® (75:25, 50:50, 25:75 White–Black) in order to investigate undefined intermediate absorptivities. The MUTs were applied to the copper surface using an airbrush and subsequently measured to have an approximate thickness of 0.01 mm. Copper was chosen as the substrate material for the target samples due to its high thermal conductivity and specific heat capacity [67], helping to ensure a near-uniform temperature distribution throughout the material.
Four 1 mm holes were created at equal distance close to the edge of the copper disc samples using a hole punch; these were used to suspend the disc in a mount using 0.4 mm diameter nylon wire, as shown in Figure 4. In contrast to the copper, nylon was chosen due to its low thermal conductivity in order to maximise the thermal barrier between the mount and the copper disc [68]. If the mount was to be in thermal contact with the disc, energy absorbed from the thermal source would rapidly dissipate into the mount, therefore, introducing added uncertainty into the absorptivity measurements. The diameter of the disc was chosen to closely match that of the heat source’s beam diameter, ensuring the energy was evenly distributed across the disc.
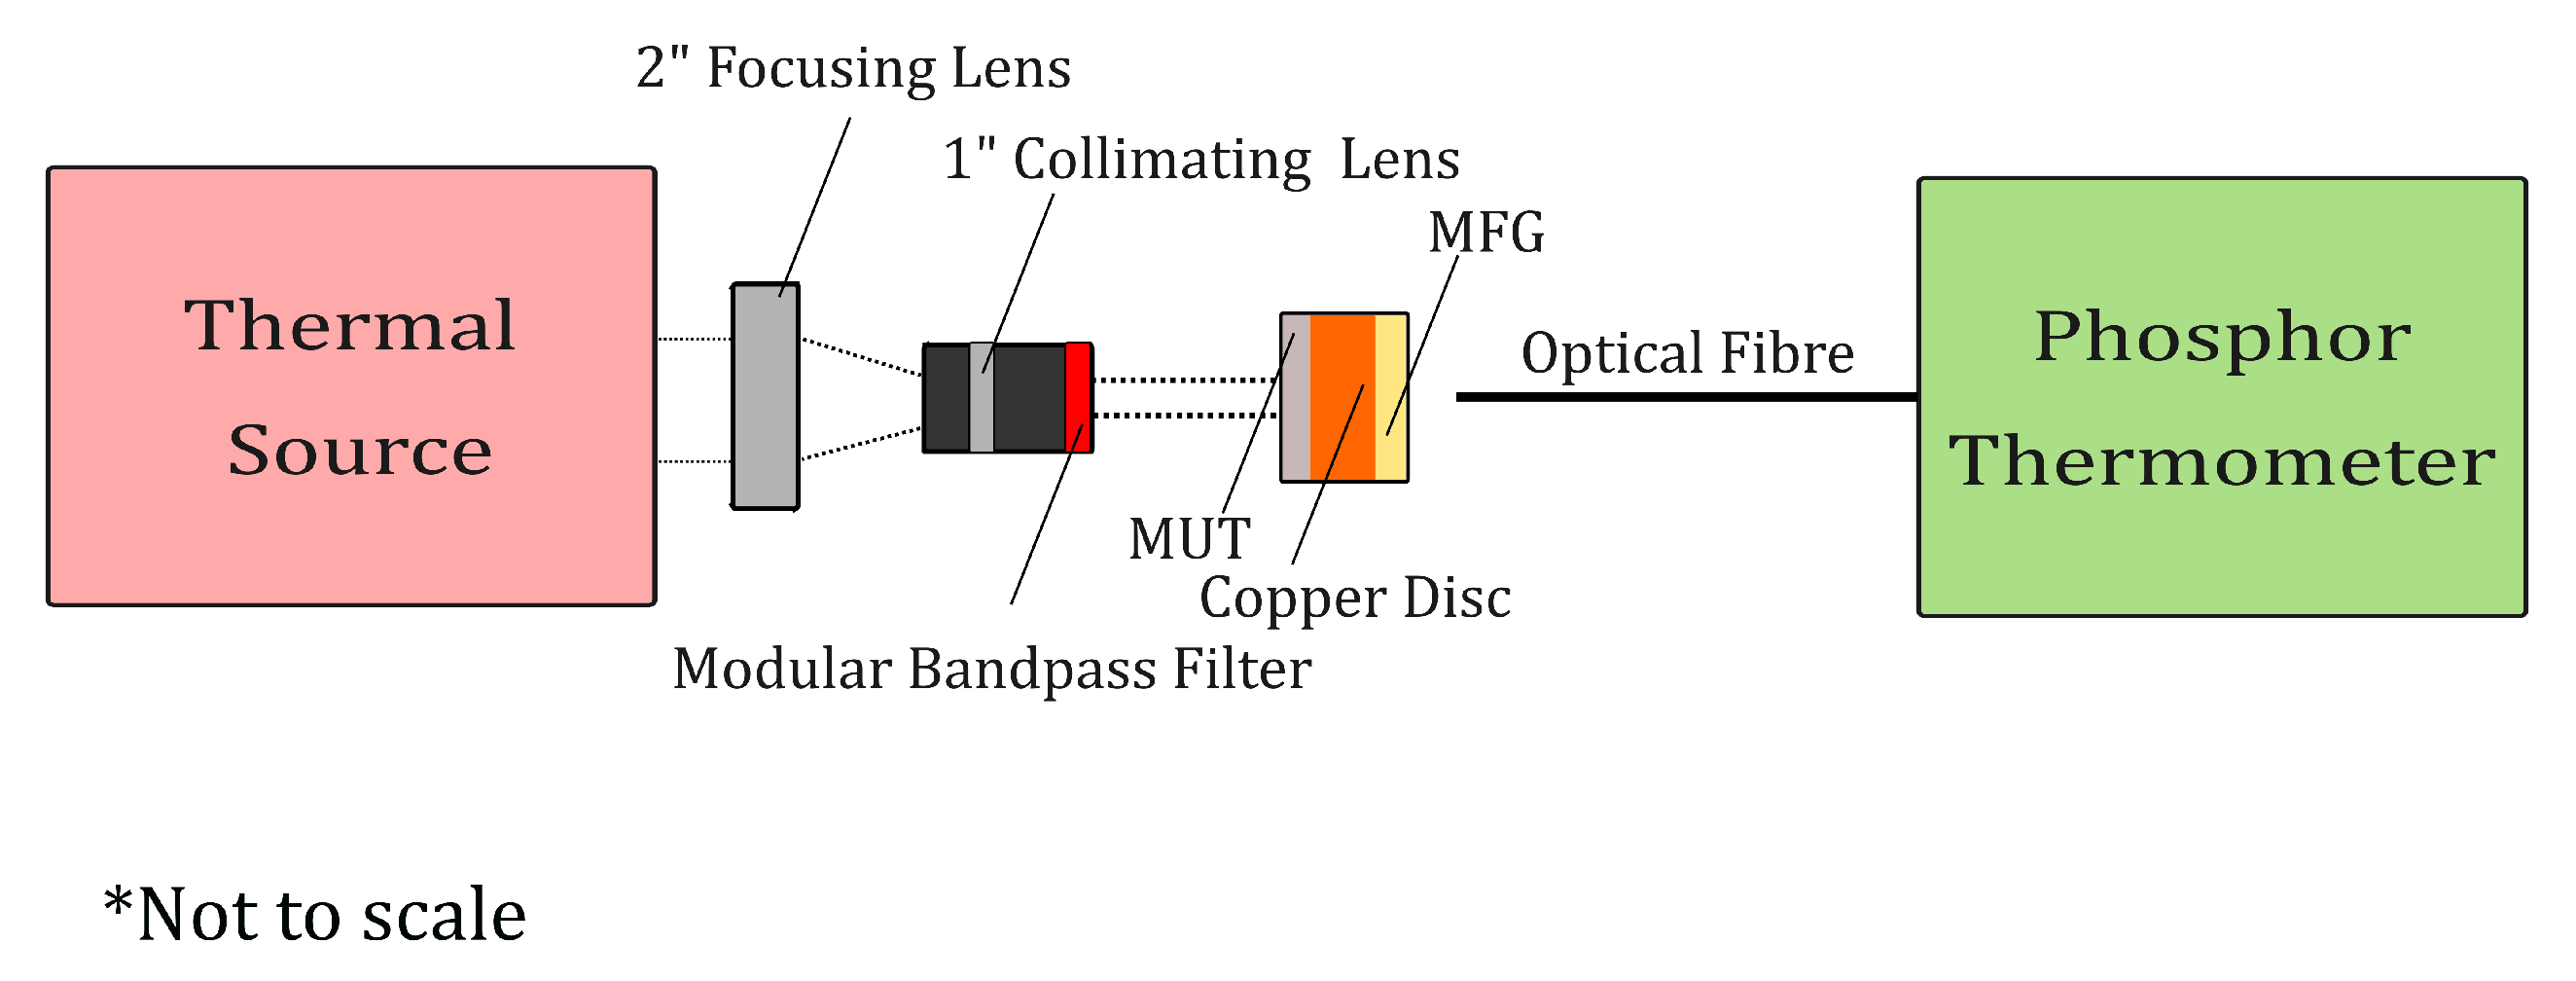
Material absorptivity was evaluated using empirical heating data and mathematical modelling. To obtain the empirical data, the PT was aligned with the centre of the sample’s surface facing the MFG; the painted side (the MUT) was set to face the thermal source, which was optically aligned using N-BK7 plano-convex lenses. A schematic of the measurement setup is shown within Figure 5. The PT was set to capture the SiR output data for 30 s before exposing the MUT side of the sample to the heat source, where 60 s of heating data was subsequently captured; this was repeated three times for each MUT. A modular narrow bandpass filter was placed between the thermal source and the MUT when discrete wavelength absorptivity measurement was desired, as per Section 3.3.
The thermal model presented in Equation (3) describes the heating and cooling behaviour of a copper disc subjected to a steady-state energy source in a room-temperature environment. A key underlying assumption of this model is the lumped thermal capacity model, which simplifies the modelling [69]. The majority of the sample is made up of copper, which has an inherent high specific heat capacity C c , with thin layers of the MUTs and MFG applied to either side. The specific heat capacity of the MUTs and MFG is not well characterised. Therefore, the lumped thermal model treats the entire sample as a single isolated object with a uniform temperature gradient, and the temperature differences within the sample are negligible. A better understanding of the specific heat capacity of the MUTs and MFG could inform a more accurate thermal model. However, characterisation of the specific heat capacity of these materials is beyond the scope of this work.
d T ( T ) d t = P i n m C c k A ( T ( t ) T A )
Each term represents a physical process influencing the disc’s thermal behaviour over time. P i n represents the radiative power from the heat source, expressed as power per unit area, W/m2. The mass of the sample is denoted by m, given in kg. C c is the specific heat capacity of copper, with units J kg−1 K−1. k is the heat transfer coefficient, representing the gradient d T ( t ) / d T , which can be determined analytically or be inferred by fitting a linear regression model to the empirical data. The surface area of the sample is indicated by A, measured in m2. T ( t ) is the temperature of the copper disc, with units of K and T A corresponding to the ambient temperature at t = 0 , also in K. Substituting k 0 for k A and P i n m C c for ρ , and integrating Equation (3), yields Equation (4), which describes the thermal behaviour of the copper samples during heating and cooling. A full derivation can be found within Appendix A.
T ( t ) h e a t = T A + ρ k 0 ( 1 e k 0 t )
The absorptivity, α ( λ ) , can then be introduced as a product of the heating term, which yields Equation (5):
T ( t ) α = T A + α ( λ ) ρ k 0 ( 1 e k 0 t )
Equation (5) describes the heating behaviour of a given sample at a particular point in time, t. This equation was fitted to the empirical heating data and is used to infer the absorptivity of the MUTs. The absorptivity parameter, α ( λ ) , was iteratively adjusted until the model was in agreement with the empirically measured heating data. Determination and analysis of the absorptivity parameter α ( λ ) are described within Section 3.2.
The total power output of the thermal source, after transmission and radiative losses, was found to be approximately 7 W between 0.35 µm and 2.6 µm. The impact of the optical filtering used to isolate discrete bands of Black 3.0® contributed to a reduction in incident power; this reduction was accounted for within the model by utilising thermal and optical data from the manufacturer in conjunction with Equation (6). P i n is the total radiative power and used within Equation (3), P H ( λ ) is the relative power from the heat source, F ( λ ) is the narrow-bandpass filter, and A is the area where the thermal energy is focused.
P i n = P H ( λ ) F ( λ ) A
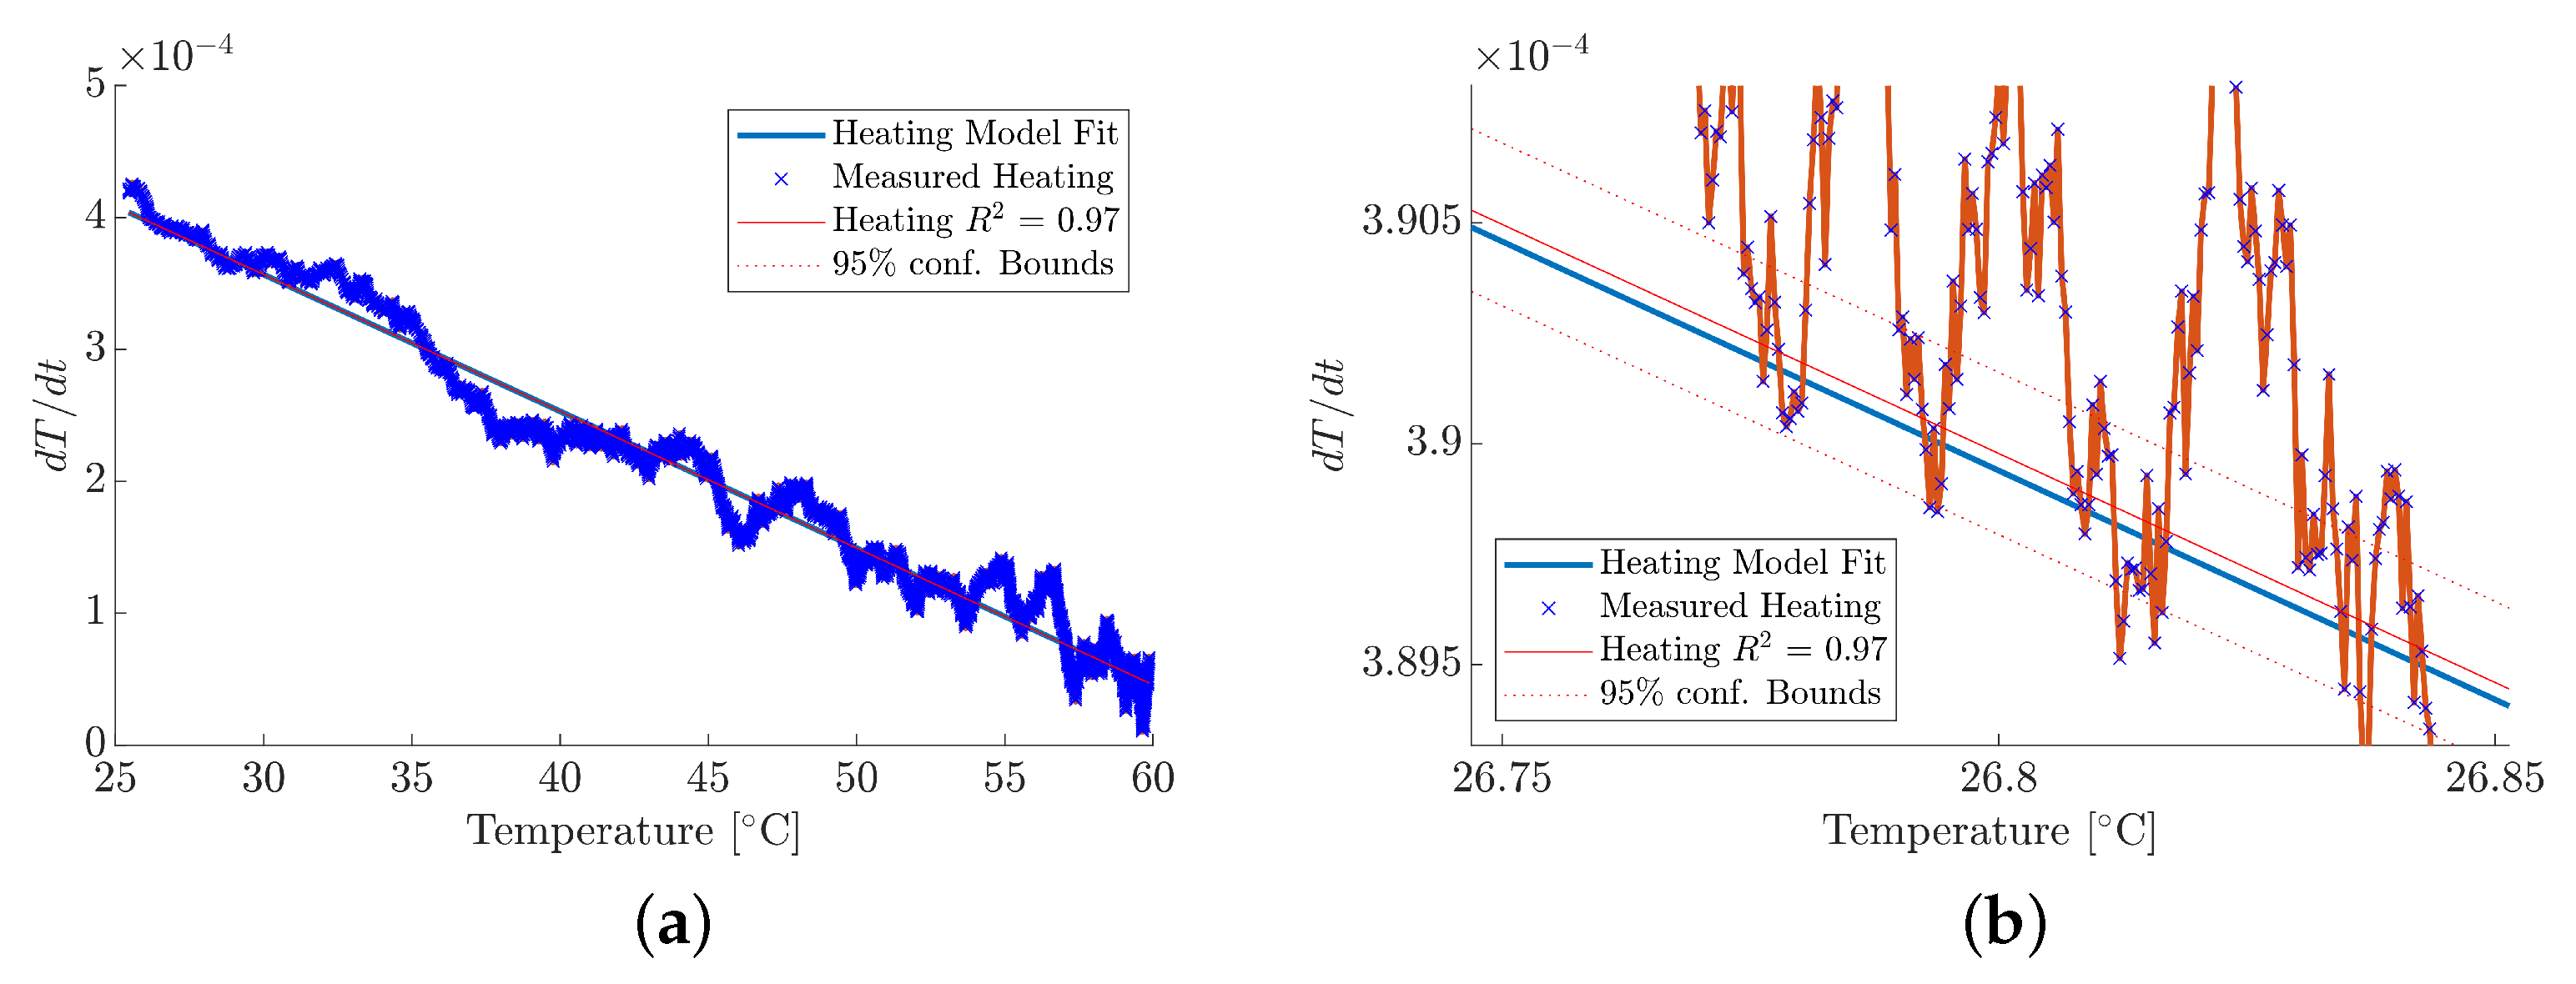
To determine material absorptivity, α ( λ ) , the empirical heating data captured by the PT was analysed through examination of the rate of change in temperature over a 60 s period, defined by the 10–90% rise time. The thermal model described in Equation (5) begins with two unknown coefficients, the heat transfer coefficient, k, and the absorptivity value, α ( λ ) . To determine k, a linear regression model was fitted to the empirical heating data, and the resultant gradient was extracted and substituted into Equation (5). Following this, the absorptivity parameter, α ( λ ) , was systematically adjusted between 0 and 1 until the modelled temperature gradient was within the 95 % confidence bounds of the linear regression fit, as shown in Figure 6. The measured temperature gradient for an MUT within the 10 to 90 % of the maximum temperature is shown in Figure 6a, where a linear regression model is fitted to the empirical data. A magnified view is provided by Figure 6b, showing that the thermal model follows the overall empirical data trend, evaluated within the 95 % confidence bounds. Furthermore, the experimental procedure was repeated three times for each MUT to ensure repeatability, where the quality of the fit is represented by the R 2 value. The median absorptivity of the three experiments was taken, and the minium and maximum measured values were used to inform the error within the measurement.

3. Results and Discussion

3.1. Instrument Characterisation

Before absorptivity measurements could take place, the PT was calibrated using the PT setup and procedure as outlined in Section 2.1. The area under each spectral emission curve, as measured by the spectrometer, is shown in Figure 7a and represents the total spectral power received by each of the SiRs as a function of temperature. The shorter spectral region ( 630 nm peak) increases with an increase in temperature, whilst the longer spectral region ( 650 nm peak) decreases with an increase in temperature. This measurement trend was replicated when the spectrometer was replaced by the SiRs, as shown in Figure 7b. The increase in temperature resulted in an increase in the 630 nm SiR output voltage and a decrease in the 650 nm SiR output voltage; this correlates with the spectral trend observed in Figure 7a. These output voltages changed as a function of temperature at a rate of 0.022 mV C−1 and −0.017 mV C−1 for the 630 nm SiR and 650 nm SiR, respectively. These trends indicate that the optical filters chosen for the use within the PT setup are producing the desired, reciprocal, temperature-dependent behaviours observed within the PT calibration model.
The ratio of the SiR outputs was subsequently taken and plotted together with the individual SiR outputs in Figure 7b. The ratio of the two SiR output voltages across the 20 °C to 140 °C temperature range exhibited a proportional and positive linear trend with increasing temperature in the form y = m x + c . In this configuration, the resolution of the PT is represented by the gradient, m, as shown in Figure 7b. A resolution of 0.0228 °C−1 was observed, which yields superior resolution to the previously mentioned single-channel SiR measurements. The scattering of the calibration points, around the fitted calibration line, is minimal with an R 2 > 0.99 . This observed, strong correlation suggests that temperatures between the calibration points can be reliably interpolated. Furthermore, the linearity across the measured temperature range is comparable to similar calibrations reported using MFG [31]. The strong linear relationship enables straightforward conversion to temperature whilst also ensuring consistent temperature acquisition across the various samples.
The required data for the assessment of noise within the temperature measurement was acquired during the instrument’s calibration process; this data was subsequently assessed as a function of integration time, as shown in Figure 8. The results represent the mean noise taken across the full dynamic range of the calibrated instrument between 20 °C and 140 °C. The noise at the raw integration time of 100 µs was measured to be 17.59 °C, necessitating the need for increased integration. Observations of applying increasingly longer integration times reduced the magnitude of the mean noise across the entire temperature range; integration times of 1 ms, 10 ms, and 100 ms reduced the mean noise to values of 5.83 °C, 2.89 °C, and 0.88 °C, respectively. The mean noise was reduced further to 0.59 °C, 0.54 °C and 0.48 °C when integration time was increased to 500 ms, 1 s, and 2 s, respectively. The 1 s integration time was subsequently used throughout this work to ensure SNR remained high, random noise errors were reduced, and comparable sampling speeds of typical thermocouples were maintained [59].
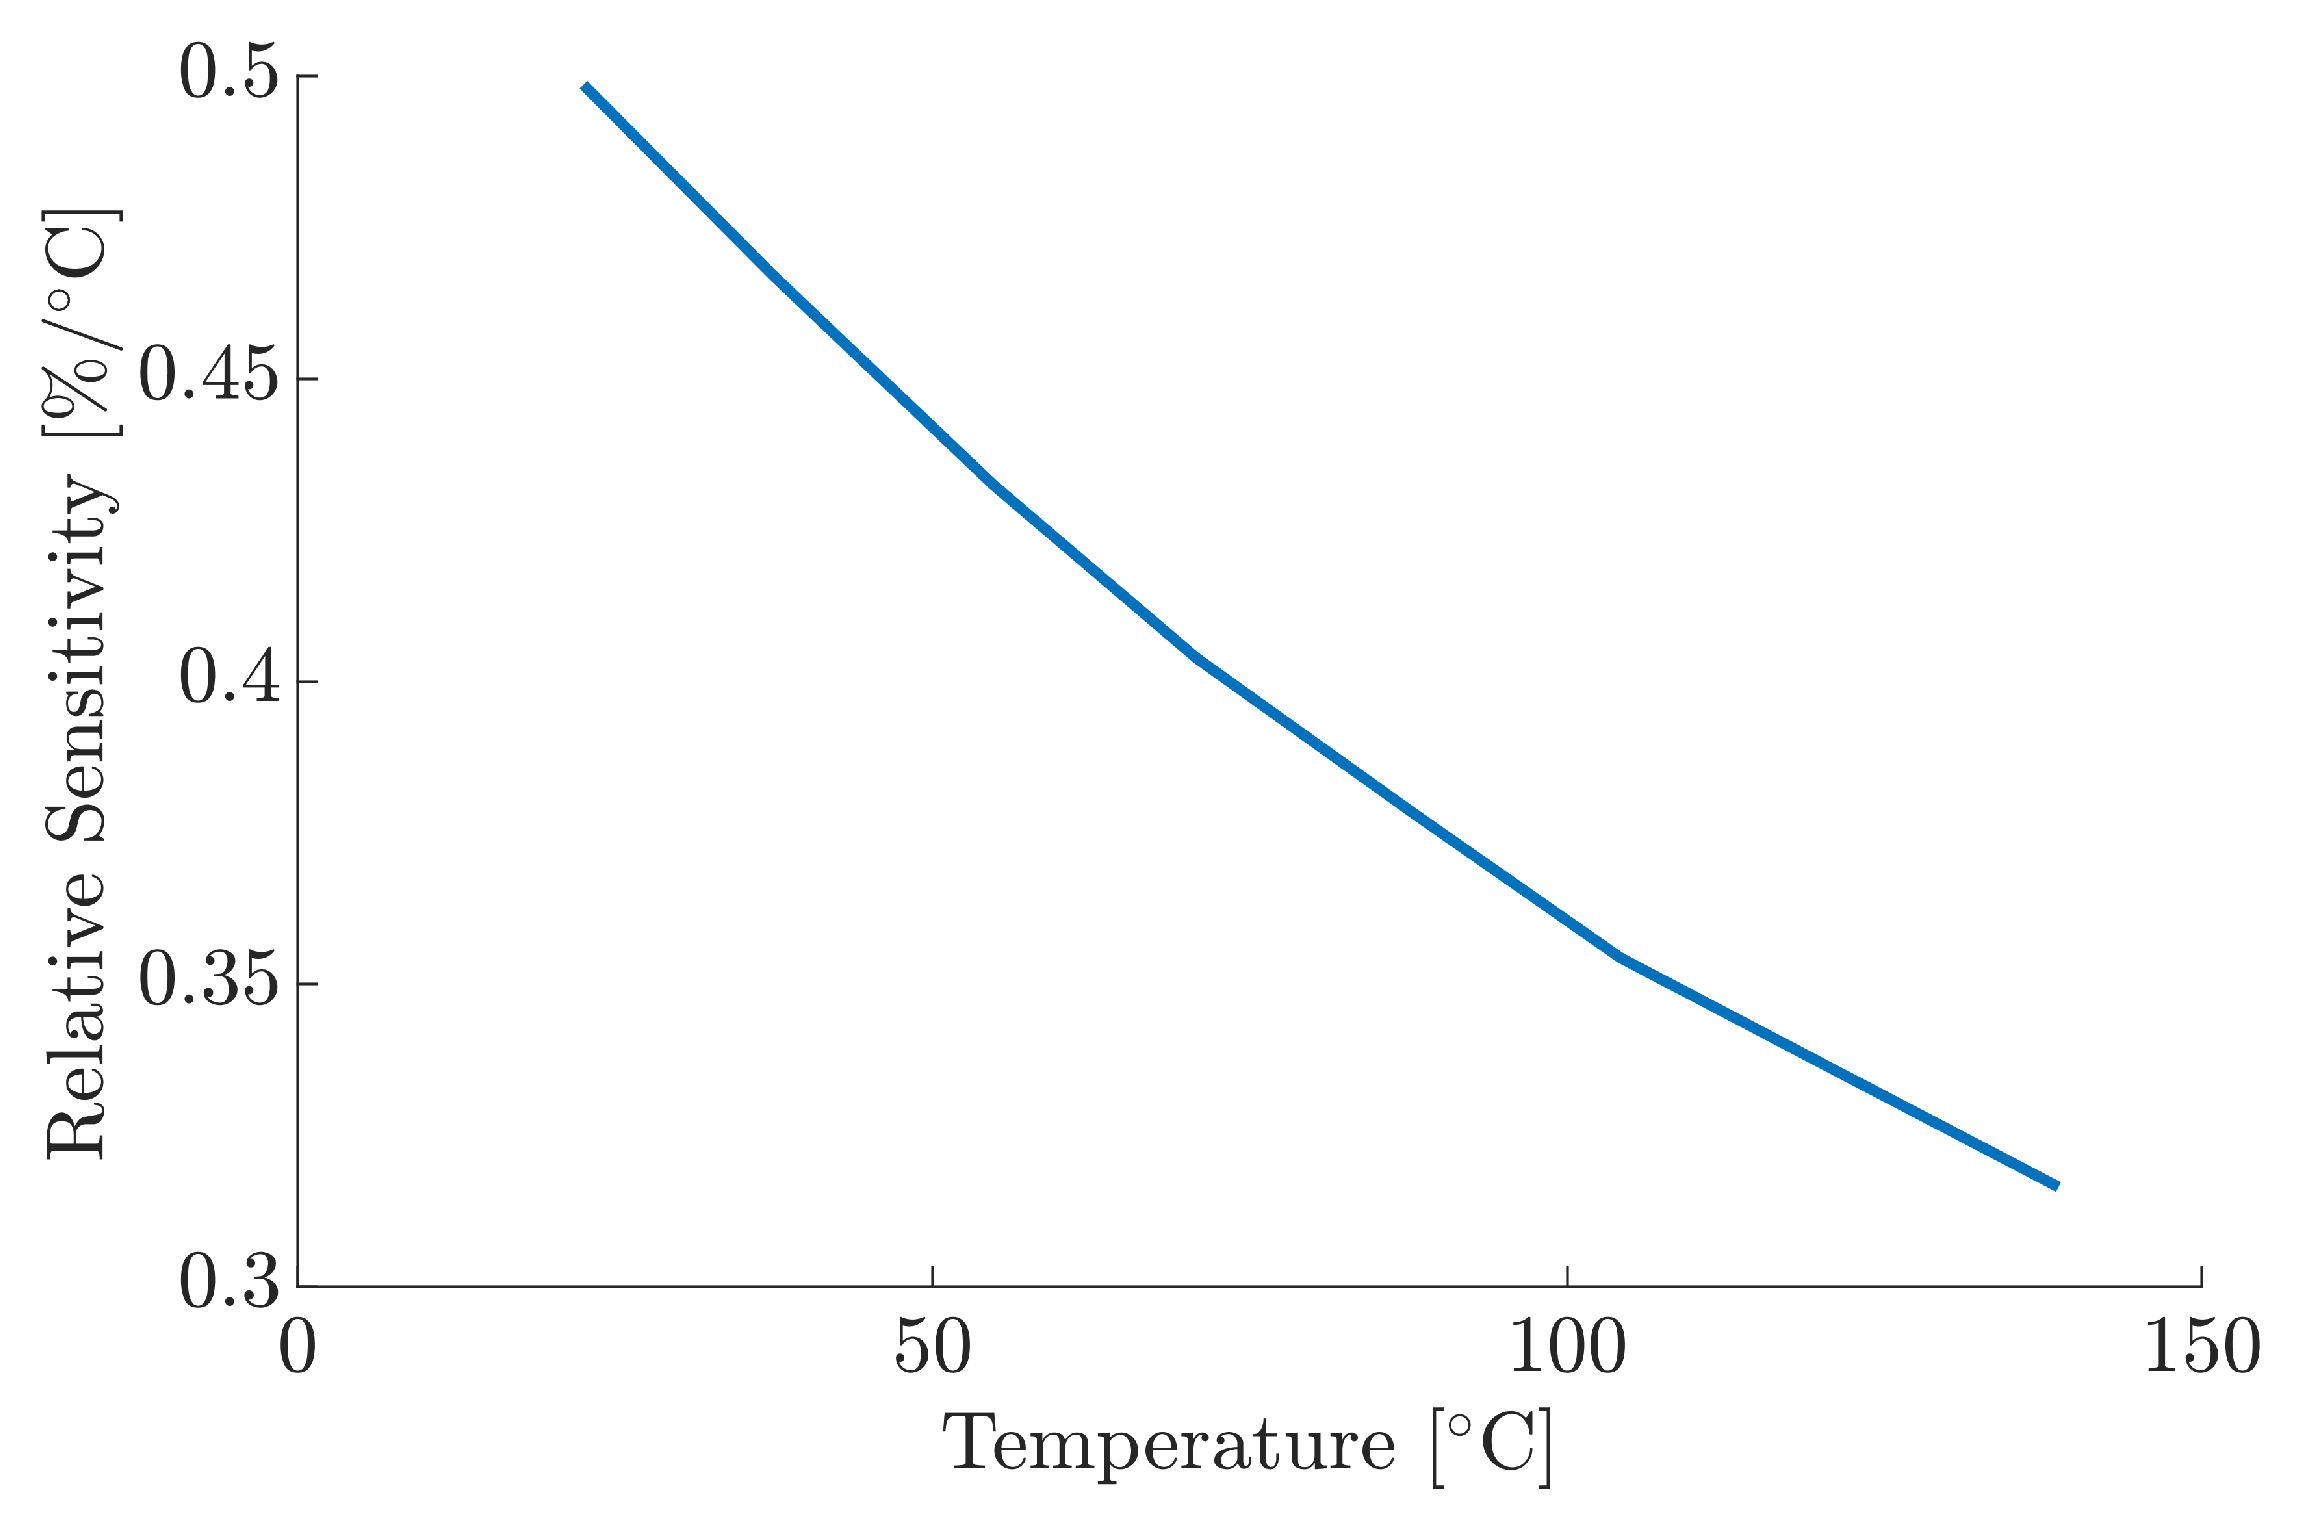
There are several mechanisms that perpetuate higher levels of noise within radiometry, most notably photon noise, which arise from the statistical fluctuations of photons emitted by the MFG. This is an unavoidable constraint, especially at low signal levels, such as the case within this work due to the use of optical filtering and beam splitters. The implementation of higher sensitivity photodetectors could alleviate some of the sensitivity limitations associated with photodiodes. Further potential explanations for the impact of noise relates to the temperature of the hot plate. When the hot plate heats up, the temperature gradient increases due to the ambient temperature of the surrounding air, resulting in additional thermal noise as the hot plate attempts to stabilise itself. The relative sensitivity S r [ 1 / R ( d R / d T ) ] for MFG, as shown in Figure 9, shows a reduction as a function of temperature; although this is not directly related to the noise, the diminishing sensitivity, as a function of increase temperature, influences the signal within the SNR and, therefore, measurement uncertainty.

3.2. Absorptivity Measurements

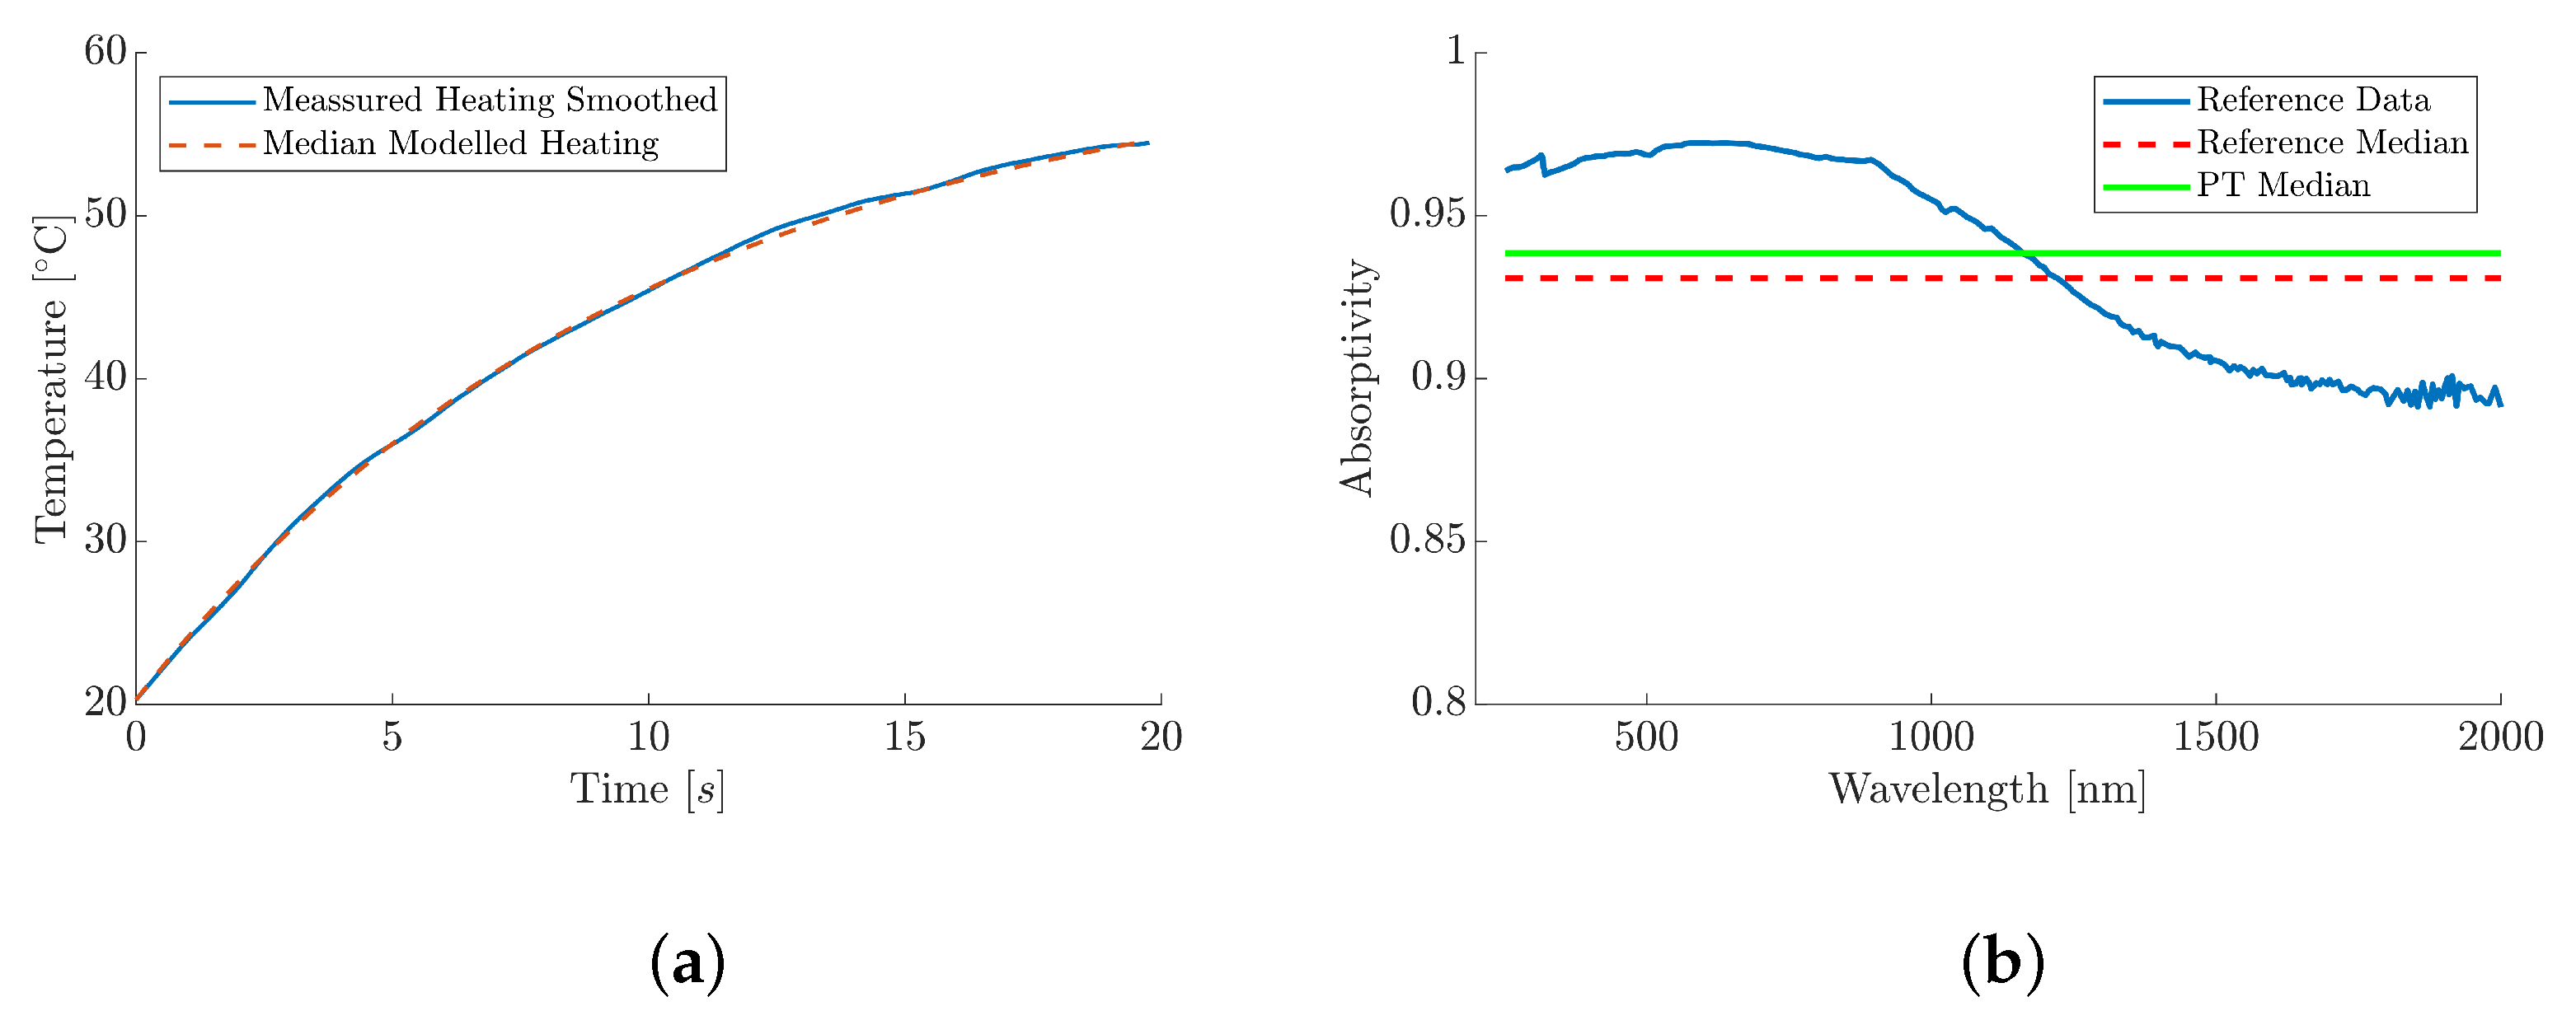
Having characterised and calibrated the PT, it was subsequently used to measure the absorptivity of two contrasting paints, along with various mixtures of the two paints. Firstly, the absorptivity of the MUT, Black 3.0®, was obtained by heating it with an incident radiation between 0.2 µm and 2 µm. The absorptivity was subsequently calculated and compared against a reference extracted from published spectral absorptivity data [19]. The MUTs were heated by the thermal source from room temperature, and the temperature data was analysed within the 10 % to 90 % range of the heating curve; for the black paint, this corresponded to a median time of 19.6 s. The median empirical and modelled temperature curve, as a function of time, is plotted within Figure 10a. Three measurements, as previously described in Section 2.2, were recorded using the PT setup, and the thermal model was subsequently used to obtain a median absorptivity value. The absorptivity values for each measurement were determined, and the results are shown in Table 1.
The median temperature increase for the black paint was found to be 34.1 °C within the 10 % to 90 % range. From this, the median absorptivity was subsequently calculated to be 0.94 , within a range of 0.0081 ; this is plotted alongside the reference data within Figure 10b. The thermal model showed a high fit quality to the empirical heating data, with an R 2 greater than 0.95 ; this high R 2 value confirms a good agreement between the empirical and modelled results, validating the model’s reliability for predicting thermal behaviour.
The reference data, shown in Figure 10b, indicates that Black 3.0® has an absorptivity of approximately 0.97 within the UV to visible spectrum (0.2–0.75 µm), which is the value quoted by the manufacture [65]. The absorptivity reduces to less than 0.9 as the wavelength increases through to the Near-Infrared (NIR) and Short-Wave Infrared (SWIR) spectral regions ( 0.75 to 2 µm). The median absorptivity value from the reference data, across the entire 0.2 µm to 2 µm spectral region, was calculated to be 0.93 ; this value was subsequently used to evaluate the validity of the PT and the mathematical modelling and is shown by the dashed line within Figure 10b. A percentage difference of 0.8 % was observed between the reference data and the PT method; this small relative difference suggests that PT can be a viable method for determining material absorptivity.
To further assess the PT technique for absorptivity measurements, the white paint, Avian-B500®, and the three intermediate mixtures were used to provide contrast to the highly absorptive Black 3.0®. The median and modelled heating curves for each MUT are presented in Figure 11a. The median time taken for a given MUT to go between the 10 % and 90 % of its maximum temperature was reduced as a function of increasing black paint percentage at a decelerating rate of 28.7 s, 23.6 s, 22.5 s, 21.81 s, and 19.6 s, respectively. The median differences in temperature rise, from the white paint to the black paint, were 3.6 °C, 14.9 °C, 24.5 °C, 29.9 °C, and 34.1 °C, respectively.
The absorptivity of each MUT was subsequently calculated from the heating measurements and presented within Figure 11b, where the error bars represent the range between the absorptivities of the repeat experiments. The individual results for each experiment are included within Table 2. The white paint was found to yield a median absorptivity of 0.065 within a range of 0.0127 , which is consistent with the manufacturer’s specification of α ( λ ) < 0.07 over a wavelength range of 250 nm to 1300 nm. Although the exact absorptivity of the three paint ratios was unknown, it was hypothesised that the values would be a function of their respective paint ratio and, therefore, fall between the known values of the pure paints. The 75:25, 50:50, and 25:75 ratios (White–Black) were measured to have median absorptivities of 0.35 , 0.64 , and 0.79 , within a range of 0.0092 , 0.0212 , and 0.0309 , respectively. These results show an expected, but clear, trend: increasing the relative mass content of Black 3.0® leads to an increase in the overall absorptivity of that MUT. A second-order polynomial was subsequently fitted to the absorptivity data, yielding a strong correlation with R 2 > 0.95 . The non-linearity in the absorptivity results, as a function paint mixing ratio, suggests that the absorptive properties of the black paint pigment, and pigment density, dominate the optical characteristics of the MUTs.
A clear relationship between the MUTs absorptivity, its maximum temperature, and the time it takes to reach that temperature is shown within Figure 11. Both the relative temperature increase and corresponding absorptivity value of the MUTs decrease as a function of increasing black paint percentage; this trend is illustrated by the polynomial fit within Figure 11b. The trend reveals a characteristic inverse relationship between heating time and the maximum temperature: materials that exhibit a high α ( λ ) and a low ρ ( λ ) efficiently absorb radiant energy, leading to a rapid rise in internal energy and temperature. Conversely, materials that reflect most incident energy show a minimal temperature increase over a longer duration in time.
Black 3.0® consists of a high-density and proprietary pigment that is naturally very matte [65]. Additionally, its formula includes transparent mattifiers that flatten the surface and reduce stray light at a microscopic level; this could explain the non-linear increase in the temperature rise from room temperature. Therefore, when greater percentages of black paint are added to the mixtures, there is an increase in pigment density, the mixture reaching its maximum temperature at an accelerate rate. It should also be noted that the reduction in temperature rise for the lower absorptivity MUTs is directly related to the magnitude of the signal measured by the PT over time, therefore, resulting in a reduction in the SNR. Despite this, the consistency of the results demonstrates good repeatability of the PT measurements across the absorptivity range and acts as a good indication that it can predictably measure known and unknown absorptivity values.

3.3. Narrow-Band Absorptivity Measurement

To enable an assessment of the performance of the PT absorptivity measurement technique at discrete wavelengths, the wavelength-dependent absorptivity of the Black 3.0® sample used within Section 3.2 was investigated. To achieve this, two narrow bandpass optical filters, each with full width half maximums (FWHMs) of 40 nm, were positioned between the thermal source and the MUT for their respective tests. One filter was within the visible wavelength spectral range at 600 nm, and the other was within the SWIR spectral range at 1500 nm. These specific narrow spectral regions were chosen to enable a clear demonstration of the PT technique for the measurement of material absorptivity as a function of wavelength. The results were compared to the reference data obtained from previously established work [19].
The PT captured three sets of heating data for each of the narrow bandpass optical filters. The median absorptivity values were found to be 0.9598 and 0.9172 , within a range of 0.0168 and 0.0396 at 600 nm and 1500 nm, respectively. These values are plotted in Figure 12 alongside the experimental absorptivity data extracted from [19]. The error bars represent the minimum and maximum measured range for both of the wavelength-dependant tests. The reference data, represented by the blue data within Figure 12, clearly pass through the both sets of error bars associated with each of the PT measurements. The percentage difference in the median absorptivity measurement relative to the reference data at specific wavelength was calculated to be 1.3 % and 1.6 % for the 600 nm and 1500 nm, respectively. This result provides evidence for the PTs capability of resolving specific, narrow-band absorptivity. However, a significant reduction in temperature rise over the heating period was observed at 1550 nm, with the median measurement changing by just 1.1 °C compared to 10.3 °C at 600 nm. The reduced temperature rise within these measurements can be attributed to the optical filters, which significantly lowered the proportion of incident radiation upon the MUT. Consequently, this reduction in the temperature rise resulted in a lower SNR, which is represented by the noticeably larger error bars at 1550 nm compared to those at 600 nm. With a lower noise system, these error bars could be reduced and the median absorptivity converge towards the established data. Uncertainties, such as variations within the layer thickness of the composite sample, could also contribute to an overall reduction in SNR. The samples comprise of composite layers, which are independently effected by the incident radiation. The incident radiation could pass through two or more sufficiently thin layers; this requires consideration for the discrepancy within the negative and positive shifting at the different measured wavelengths.
The decrease in spectral intensity at 1550 nm is defined by Planck’s law of EMR, with the thermal source manufacturer quoting a steady-state temperature of 3400 K. Whilst perfect blackbody emitters are not physically possible, the thermal source loosely follows the analytical solution to Planck’s law; this is supported with empirical spectral data provided by the manufacturer [48]. At this temperature, there is a reduction in the spectral intensity emitted within the NIR and SWIR spectral regions. It is, therefore, hypothesised that the differences in temperature rise caused by optical filtering, Δ T F , may not be directly proportional to the decrease in incident power P i n . This non-linearity between power and temperature is typically governed by the combined laws of convection and radiation heat transfer [70]. The consequence of this is that the difference in Δ T F between any two discrete power values becomes more pronounced at the lower end of the power scale. Hence, the temperature rise for the 600 nm region is significantly higher than the 1550 nm region despite the marginal reduction in spectral power. The reduction in the spectral power, caused the by optical filtering, was compensated for within the model using the optical filter data, F ( λ ) , within Equation (6), and the resulting power values are presented within Table 3.
To overcome the inherent challenges associated with the thermal source’s relatively low incident power, alternative heating methods could be considered. Higher power monochromatic light sources, such as lasers, could be used to heat the MUTs. Such systems would provide a higher, concentrated power density at distinct wavelengths, improving the SNR, and enable precise mapping of a material’s absorptivity at critical application-specific wavelengths. Furthermore, a better understanding of the specific heat capacity of each of the MUTs and MFG could improve the accuracy of the thermal model. The PT method would be particularly valuable for industrial applications, such as SLM, where wavelength-dependent material absorptivity at a specific wavelength directly impacts both energy efficiency and the quality of production.

4. Conclusions

This study introduced a low-cost, non-contact, PT calorimetric technique for determining the optical absorptivity of materials. By combining PT with mathematical modelling, the system demonstrated the ability to resolve absorptivity values of both known and unknown materials, including for measurement scenarios that were signal limited. The technique was validated by measuring the absorptivity of Black 3.0®, resulting in a 0.8 % discrepancy from reference data. Further experiments with a low-absorptivity paint, Avian-B500®, and various intermediate mixtures of the two paints confirmed the system’s capabilities across a contrasting range of absorptivity values. The system was then shown to be capable of measuring absorptivity for narrow-band wavelengths, with results at 600 nm and 1500 nm aligning closely with established data. The technique circumvents the limitations of traditional radiometric and calorimetric methods, which are subject to emissivity uncertainty or the need for optimal thermal contact, respectively. This PT technique could enable low-cost, non-contact, and portable absorptivity measurement systems, removing the need for complex and expensive test setups. This technique has the potential to be utilised across various engineering fields that benefit from an understanding of wavelength-specific material absorptivity.

Author Contributions

Conceptualization, T.M.F.H., M.D. and M.J.H.; methodology T.M.F.H., M.D., H.Z. and M.J.H.; software T.M.F.H. and M.D.; formal analysis, T.M.F.H., M.D. and H.Z.; investigation, T.M.F.H. and M.D.; resources C.F. and J.R.W.; data curation T.M.F.H. and M.D.; writing—original draft, T.M.F.H.; writing—review and editing, T.M.F.H., M.D., C.F., H.Z., J.R.W. and M.J.H.; visualization T.M.F.H.; supervision, J.R.W., M.J.H.; project administration, T.M.F.H. and M.J.H. All authors have read and agreed to the published version of the manuscript.

Funding

This research was funded by the Engineering and Physical Sciences Research Council (EPSRC) grant number EP/W524360/1.

Data Availability Statement

The original contributions presented in this study are included in the article. Further inquiries can be directed to the corresponding authors.

Conflicts of Interest

The authors declare no conflicts of interest.

Abbreviations

The following abbreviations are used in this manuscript:
EMRElectromagnetic Radiation
FWHMFull-Width Half-Maximum
IRInfrared
IPAIsopropyl Alcohol
IRTInfrared Radiation Thermometer
LEDLight-Emitting Diode
LWIRLong-Wave Infrared
MFGManganese-activated Magnesium Fluorogermanate
MUTMaterial Under Test
MRIMagnetic Resonance Imaging
NIRNear-Infrared
PDPhotodiode
PLPhotoluminecent
PTPhosphor Thermometry
RMSRoot Mean Square
SiPDSilicon Photodiode
SiRSilicon Photodiode-based Radiometer
SLMSelective Laser Melting
SNRSignal-to-Noise Ratio
SWIRShort-Wave Infrared
TPThermographic Phosphor
TIATransimpedance Amplifier
UVUltraviolet
VISVisible
VLWIR   Very-Long-Wave Infrared

Appendix A. Derivation of Heating and Cooling Terms for Mathematical Analysis

The thermal model shown within Equation (A1) allows for descriptions of both the heating and cooling behaviour of the samples to be obtained. Only the heating term was used within this work; however, both derivations are shown here for completeness.
d T ( T ) d t = P i n m C c k A ( T ( t ) T A )
where
P i n = Radiative power from the thermal source Power Area [ W / m 2 ] . m = Mass of the copper disc [ kg ] . C c = Specific heat capacity of copper [ J kg 1 K 1 ] . k = Heat transfer coefficient ( Gradient ) . A = Surface area of the copper disc [ m 2 ] . T ( t ) = Temperature of the disc at time t [ K ] . T A = Ambient temperature [ K ] .
Integrating Equation (A1) gives
1 ρ k 0 ( T ( t ) T A ) d T = d t
1 k 0 ln ( ρ k 0 ( T ( t ) T A ) ) = t + c
where the constant ρ = P i n m C c , and k 0 = k A . Rearranging for, T ( t ) , yields
T ( t ) = T A + ρ ϵ e k 0 t k 0
The unknown constant, ϵ , has two unique solutions, both of which are dependent on the current phase, heating, ϵ H , and cooling, ϵ C . First, the heating constant, ϵ H , was determined at t = 0 . Equation (A4) during the heating phase becomes
T ( 0 ) = T A + ρ ϵ H k 0
At t = 0 , T ( 0 ) = T A . Therefore, rearranging Equation (A5) for ϵ H yields
ϵ H = ρ
Substituting, ϵ H , into Equation (A4) yields Equation (A7), which is the heat equation used within this work:
T ( t ) h e a t = T A + ρ k 0 ( 1 e k 0 t )
Finally, the cooling constant, ϵ C , was evaluated at the end of the heating phase when the thermal source is switched off, with T ( t ) starting at the peak of the heating curve. Therefore, during the cooling phase, T ( 0 ) = T m a x . Setting the input power, P i n = 0 , subsequently results in ρ = 0 . Substituting these conditions into Equation (A4) gives
T m a x = T A ϵ C k 0
Rearranging Equation (A8) for ϵ C yields
ϵ C = k 0 ( T A T m a x )
Substituting ϵ C into Equation (A4) yields
T ( t ) c o o l = T A ( T A T m a x ) e k 0 t
The gradient, k, for both heating and cooling terms can be derived from these equations and yields a good approximation. However, applying a linear fit to the empirical heating data, d T ( t ) d t , resulted in a more robust and applicable approach to this work.

Appendix B. Bill of Optical Materials Used in PT Design Setup

Table A1. Bill of materials for the key components used in the instrument design.
ComponentPart NumberManufacturer
405 nm LEDLED405LThorlabs Inc.
Glass Lens ( f = 50 mm)LA1131-MLThorlabs Inc.
50:50 Beam SpillterCCM1-BS013/MThorlabs Inc.
Optical Fibre ( 1500 µm Core)M93L01Thorlabs Inc.
550 nm Longpass FilterFELH0550Thorlabs Inc.
650 nm Shortpass FilterFESH0650Thorlabs Inc.
658 nm Notch filterNF658-26Thorlabs Inc.
650 nm Bandpass FilterFBH650-40Thorlabs Inc.
Silicon PhotodiodeS5971Hamamatsu Inc.
M g 3.5 F G e O 5 : M n ( M F G ) EQD25/F-U1Phosphor Technology Inc.

References

  1. Puthiyaveettil, N.; Rajagopal, P.; Balasubramaniam, K. Influence of Absorptivity of the Material Surface in Crack Detection Using Laser Spot Thermography; Elsevier: Amsterdam, The Netherlands, 2021; Volume 120. [Google Scholar] [CrossRef]
  2. Brewster, M.Q. Thermal Radiative Transfer and Properties; John Wiley & Sons: Hoboken, NJ, USA, 1992. [Google Scholar]
  3. Cook, P.S.; Ritchie, D.J. Determining the laser absorptivity of Ti-6Al-4V during laser powder bed fusion by calibrated melt pool simulation. Opt. Laser Technol. 2023, 162, 109247. [Google Scholar] [CrossRef]
  4. Wallace, N.J.; Jones, M.R.; Crane, N.B. Spectral absorption coefficient of additive manufacturing materials. J. Therm. Sci. Eng. Appl. 2021, 13, 041012. [Google Scholar] [CrossRef]
  5. Spears, T.G.; Gold, S.A. In-process sensing in selective laser melting (SLM) additive manufacturing. Integr. Mater. Manuf. Innov. 2016, 5, 16–40. [Google Scholar] [CrossRef]
  6. Zavala-Arredondo, M.; Boone, N.; Willmott, J.; Childs, D.T.; Ivanov, P.; Groom, K.M.; Mumtaz, K. Laser diode area melting for high speed additive manufacturing of metallic components. Mater. Des. 2017, 117, 305–315. [Google Scholar] [CrossRef]
  7. Siva Prasad, H.; Brueckner, F.; Volpp, J.; Kaplan, A.F. Laser metal deposition of copper on diverse metals using green laser sources. Int. J. Adv. Manuf. Technol. 2020, 107, 1559–1568. [Google Scholar] [CrossRef]
  8. Trapp, J.; Rubenchik, A.M.; Guss, G.; Matthews, M.J. In situ absorptivity measurements of metallic powders during laser powder-bed fusion additive manufacturing. Appl. Mater. Today 2017, 9, 341–349. [Google Scholar] [CrossRef]
  9. Rev, T.; Katsir, D.; Králík, T.; Frolec, J. Emissivity of Black Coatings from Ambient to Cryogenic Temperatures: How Spectrally Flat Black Coatings Can Enhance Performance of Space Systems. 2023. Available online: https://tfaws.nasa.gov/wp-content/uploads/TFAWS23-CR-1-Paper.pdf (accessed on 15 February 2025).
  10. NPL. Accurate Temperature Measurement in Challenging Environments. Available online: https://www.npl.co.uk/products-services/temperature/phosphor-thermometry (accessed on 27 May 2024).
  11. Santbergen, R.; van Zolingen, R.J.C. The absorption factor of crystalline silicon PV cells: A numerical and experimental study. Sol. Energy Mater. Sol. Cells 2008, 92, 432–444. [Google Scholar] [CrossRef]
  12. Lee, M.; Kim, G.; Jung, Y.; Pyun, K.R.; Lee, J.; Kim, B.W.; Ko, S.H. Photonic structures in radiative cooling. Light Sci. Appl. 2023, 12, 134. [Google Scholar] [CrossRef]
  13. Henninger, J.H. Solar Absorptance and Thermal Emittance of Some Common Spacecraft Thermal-Control Coatings; National Aeronautics and Space Adminitration, Scientific and Technical Information Branch: Hampton, VA, USA, 1984. [Google Scholar]
  14. Zhu, C.; Hobbs, M.J.; Masters, R.C.; Rodenburg, C.; Willmott, J.R. An Accurate Device for Apparent Emissivity Characterization in Controlled Atmospheric Conditions up to 1423 K. IEEE Trans. Instrum. Meas. 2020, 69, 4210–4221. [Google Scholar] [CrossRef]
  15. Králík, T.; Musilová, V.; Hanzelka, P.; Frolec, J. Method for measurement of emissivity and absorptivity of highly reflective surfaces from 20 K to room temperatures. Metrologia 2016, 53, 743–753. [Google Scholar] [CrossRef]
  16. Aouali, A.; Chevalier, S.; Sommier, A.; Abisset-Chavanne, E.; Batsale, J.C.; Pradere, C. 3D infrared thermospectroscopic imaging. Sci. Rep. 2020, 10, 22310. [Google Scholar] [CrossRef]
  17. Jones, H.G.; Serraj, R.; Loveys, B.R.; Xiong, L.; Wheaton, A.; Price, A.H. Thermal infrared imaging of crop canopies for the remote diagnosis and quantification of plant responses to water stress in the field. Funct. Plant Biol. 2009, 36, 978–989. [Google Scholar] [CrossRef] [PubMed]
  18. Zhu, C.; Hobbs, M.J.; Willmott, J.R. An accurate instrument for emissivity measurements by direct and indirect methods. Meas. Sci. Technol. 2020, 31, 044007. [Google Scholar] [CrossRef]
  19. Huynh, M. Analyzing Reflectance Data for Various Black Paints and Coatings. In STO-Meeting Proceedings Paper; Science and technology Organisation: Brussels, Belgium, 2019; Available online: https://www.sto.nato.int/document/analyzing-reflectance-data-for-various-black-paints-and-coatings (accessed on 12 April 2024).
  20. PerkinElmer. LAMBDA 1050+ UV/Vis/NIR Spectrophotometer. Available online: https://www.perkinelmer.com/uk/product/lambda-1050-2d-base-inst-no-sw-l6020055 (accessed on 11 October 2024).
  21. Corporation, S.O. SOC-100 Hemispherical Directional Reflectometer. Available online: https://surfaceoptics.com/wp-content/uploads/2024/09/SOC-100-HDR-Datasheet.pdf (accessed on 11 October 2024).
  22. Indhu, R.; Vivek, V.; Loganathan, S.; Bharatish, A.; Soundarapandian, S. Overview of Laser Absorptivity Measurement Techniques for Material Processing. Lasers Manuf. Mater. Process. 2018, 5, 458–481. [Google Scholar] [CrossRef]
  23. Rubenchik, A.; Wu, S.; Mitchell, S.; Golosker, I.; LeBlanc, M.; Peterson, N. Direct measurements of temperature-dependent laser absorptivity of metal powders. Appl. Opt. 2015, 54, 7230. [Google Scholar] [CrossRef]
  24. Leonidas, E.; Ayvar-Soberanis, S.; Laalej, H.; Fitzpatrick, S.; Willmott, J.R. A Comparative Review of Thermocouple and Infrared Radiation Temperature Measurement Methods during the Machining of Metals. Sensors 2022, 22, 4693. [Google Scholar] [CrossRef]
  25. Leonidas, E.; Hobbs, M.J.; Ayvar-Soberanis, S.; Laalej, H.; Fisk, C.; Fitzpatrick, S.; Willmott, J.R. InAsSb Photodiode Fibre Optic Thermometry for High-Speed, near-Ambient Temperature Measurements. Sensors 2023, 23, 9514. [Google Scholar] [CrossRef]
  26. Aldén, M.; Omrane, A.; Richter, M.; Särner, G. Thermographic phosphors for thermometry: A survey of combustion applications. Prog. Energy Combust. Sci. 2011, 37, 422–461. [Google Scholar] [CrossRef]
  27. Rosso, L.; Tabandeh, S.; Beltramino, G.; Fernicola, V. Validation of phosphor thermometry for industrial surface temperature measurements. Meas. Sci. Technol. 2019, 31, 034002. [Google Scholar] [CrossRef]
  28. Heyes, A.L.; Beyrau, F. Recent developments in phosphor thermometry. Meas. Sci. Technol. 2020, 31, 020102. [Google Scholar] [CrossRef]
  29. Fuhrmann, N.; Kissel, T.; Dreizler, A.; Brübach, J. Gd3Ga5O12:Cr—A phosphor for two-dimensional thermometry in internal combustion engines. Meas. Sci. Technol. 2011, 22, 045301. [Google Scholar] [CrossRef]
  30. Allison, S.W. A brief history of phosphor thermometry. Meas. Sci. Technol. 2019, 30, 072001. [Google Scholar] [CrossRef]
  31. Sposito, A.; Heaps, E.; Sutton, G.; Machin, G.; Bernard, R.; Clarke, S. Phosphor thermometry for nuclear decommissioning and waste storage. Nucl. Eng. Des. 2021, 375, 111091. [Google Scholar] [CrossRef]
  32. Jenkins, T.P.; Hess, C.F.; Allison, S.W.; Eldridge, J.I. Measurements of turbine blade temperature in an operating aero engine using thermographic phosphors. Meas. Sci. Technol. 2020, 31, 044003. [Google Scholar] [CrossRef]
  33. Vitasek, J.; Jargus, J.; Hejduk, S.; Stratil, T.; Latal, J.; Vasinek, V. Phosphor decay measurement and its influence on communication properties. In Proceedings of the 2017 19th International Conference on Transparent Optical Networks (ICTON), Girona, Spain, 2–6 July 2017. [Google Scholar] [CrossRef]
  34. Cai, T.; Park, Y.; Mohammadshahi, S.; Kim, K.C. Rise time-based phosphor thermometry using Mg4FGeO6:Mn4+. Meas. Sci. Technol. 2021, 32, 015201. [Google Scholar] [CrossRef]
  35. Liu, Q.; Wu, M.; Chen, B.; Huang, X.; Liu, M.; Liu, Y.; Su, K.; Min, X.; Mi, R.; Huang, Z. Optical thermometry based on fluorescence intensity ratio of Dy3+-Doped oxysilicate apatite warm white phosphor. Ceram. Int. 2023, 49, 4971–4978. [Google Scholar] [CrossRef]
  36. Pradhan, S.; Kaur, H.; Jayasimhadri, M. Photoluminescence and thermal sensing properties of Er3+ doped silicate based phosphors for multifunctional optoelectronic device applications. Ceram. Int. 2021, 47, 27694–27701. [Google Scholar] [CrossRef]
  37. Vu, T.; Bondzior, B.; Stefańska, D.; Dereń, P. An Er3+ doped Ba2 MgWO6 double perovskite: A phosphor for low-temperature thermometry. Dalton Trans. 2022, 51, 8056–8065. [Google Scholar] [CrossRef]
  38. Balhara, A.; Gupta, S.K.; Patra, G.; Naidu, B.S.; Sudarshan, K. Abnormal anti-thermal quenching of Mn2+ and reverse thermal response of Mn2+/Mn4+ luminescence in garnet phosphor for wide-range temperature sensing. J. Mater. Chem. C 2024, 12, 19671–19680. [Google Scholar] [CrossRef]
  39. Abou Nada, F.; Knappe, C.; Aldén, M.; Richter, M. Improved measurement precision in decay time-based phosphor thermometry. Appl. Phys. B 2016, 122, 170. [Google Scholar] [CrossRef]
  40. Fuhrmann, N.; Brübach, J.; Dreizler, A. Phosphor thermometry: A comparison of the luminescence lifetime and the intensity ratio approach. Proc. Combust. Inst. 2013, 34, 3611–3618. [Google Scholar] [CrossRef]
  41. Technology Phosphor. Thermographic Phosphors. Available online: https://www.phosphor-technology.com/thermographic-phosphors (accessed on 7 August 2023).
  42. Brites, C.D.; Marin, R.; Suta, M.; Neto, A.N.C.; Ximendes, E.; Jaque, D.; Carlos, L.D. Spotlight on Luminescence Thermometry: Basics, Challenges, and Cutting-Edge Applications. Adv. Mater. 2023, 35, 2302749. [Google Scholar] [CrossRef] [PubMed]
  43. Yadav, R.; Monika; Rai, S.; Dhoble, S. Recent advances on morphological changes in chemically engineered rare earth doped phosphor materials. Prog. Solid State Chem. 2020, 57, 100267. [Google Scholar] [CrossRef]
  44. Dramićanin, M.D. Trends in luminescence thermometry. J. Appl. Phys. 2020, 128, 040902. [Google Scholar] [CrossRef]
  45. Sutton, G.; Greenen, A.; Roebuck, B.; MacHin, G. Imaging phosphor thermometry from T = 20 °C to 450 °C using the time-domain intensity ratio technique. Meas. Sci. Technol. 2019, 30, 044002. [Google Scholar] [CrossRef]
  46. Liu, S.; Huang, Y.; He, Y.; Zhu, Y.; Wang, Z. Review of Development and Comparison of Surface Thermometry Methods in Combustion Environments: Principles, Current State of the Art, and Applications. Processes 2022, 10, 2528. [Google Scholar] [CrossRef]
  47. Yáñez-González, Á.; Ruiz-Trejo, E.; Wachem, B.V.; Skinner, S.; Beyrau, F.; Heyes, A. A detailed characterization of BaMgAl10O17:Eu phosphor as a thermal history sensor for harsh environments. Sens. Actuators A Phys. 2015, 234, 339–345. [Google Scholar] [CrossRef]
  48. ThorLabs. SLS301 Stabilized Tungsten-Halogen Light Source. Available online: https://www.thorlabs.com/drawings/e43549750848f77e-6BB009BF-99DA-1ABC-D6D5E2277313E217/SLS301-Manual.pdf (accessed on 20 September 2024).
  49. Ronda, C.R.; Justel, T.; Nikol, H. Rare earth phosphors: Fundamentals and applications. J. Alloys Compd. 1998, 275, 669–676. [Google Scholar] [CrossRef]
  50. Chi, Y.; Chou, P.T. Transition-metal phosphors with cyclometalating ligands: Fundamentals and applications. Chem. Soc. Rev. 2010, 39, 638–655. [Google Scholar] [CrossRef]
  51. Zhuang, Y.; Katayama, Y.; Ueda, J.; Tanabe, S. A brief review on red to near-infrared persistent luminescence in transition-metal-activated phosphors. Opt. Mater. 2014, 36, 1907–1912. [Google Scholar] [CrossRef]
  52. Marciniak, L.; Kniec, K.; Elżbieciak-Piecka, K.; Trejgis, K.; Stefanska, J.; Dramićanin, M. Luminescence thermometry with transition metal ions. A review. Coord. Chem. Rev. 2022, 469, 214671. [Google Scholar] [CrossRef]
  53. Särner, G.; Richter, M.; Aldén, M. Investigations of blue emitting phosphors for thermometry. Meas. Sci. Technol. 2008, 19, 125304. [Google Scholar] [CrossRef]
  54. Brites, C.D.; Balabhadra, S.; Carlos, L.D. Lanthanide-Based Thermometers: At the Cutting-Edge of Luminescence Thermometry. Adv. Opt. Mater. 2019, 7, 1801239. [Google Scholar] [CrossRef]
  55. Heyes, A. On the design of phosphors for high-temperature thermometry. J. Lumin. 2009, 129, 2004–2009. [Google Scholar] [CrossRef]
  56. ThorLabs. Compact Spectrometer—ccs200, Extended Range: 200–1000 nm. Available online: https://www.thorlabs.com/thorproduct.cfm?partnumber=CCS200#ad-image-0 (accessed on 10 July 2023).
  57. Hamamatsu. Si Photodiode: S5971. Available online: https://www.hamamatsu.com/eu/en/product/optical-sensors/photodiodes/si-photodiodes/S5971.html (accessed on 11 October 2023).
  58. Components, R. RS PRO Liquid Adhesive. Available online: https://uk.rs-online.com/web/p/adhesives/1863616 (accessed on 15 May 2023).
  59. BS EN 60584-2:1993; Thermocouples—Tolerances; Technical Report. British Standards Institution: London, UK, 1991.
  60. Coates, P.; Lowe, D. The Fundamentals of Radiation Thermometers; CRC Press: Boca Raton, FL, USA, 2016. [Google Scholar]
  61. Palmer, J.M. The measurement of transmission, absorption, emission, and reflection. Handb. Opt. 1995, 2, 25.1–25.12. [Google Scholar]
  62. Li, E.; Gao, L.; Jiang, X.; Duan, J.; Pu, S.; Wang, J. Analysis of dynamic compression property and energy dissipation of salt rock under three-dimensional pressure. Environ. Earth Sci. 2019, 78, 388. [Google Scholar] [CrossRef]
  63. Hüfner, S.; Wertheim, G.; Smith, N.; Traum, M. XPS density of states of copper, silver, and nickel. Solid State Commun. 1972, 11, 323–326. [Google Scholar] [CrossRef]
  64. Xiong, B.; Loss, R.D.; Shields, D.; Pawlik, T.; Hochreiter, R.; Zydney, A.L.; Kumar, M. Polyacrylamide degradation and its implications in environmental systems. NPJ Clean Water 2018, 1, 17. [Google Scholar] [CrossRef]
  65. CultureHustle. Black 3.0. Available online: https://culturehustle.com/products/black-3-0-the-worlds-blackest-black-acrylic-paint-150ml?_pos=1&_sid=db644fb5f&_ss=r (accessed on 2 December 2024).
  66. Avian Technologies. Avian-B White Reflectance Coating. Available online: https://aviantechnologies.com/product/avian-b-white-reflectance-coating/ (accessed on 25 January 2025).
  67. Gchem. Heat Capacities for Some Select Substances. Available online: https://gchem.cm.utexas.edu/data/section2.php?target=heat-capacities.php (accessed on 13 August 2024).
  68. Yu, S.; Kim, D.K.; Park, C.; Hong, S.M.; Koo, C.M. Thermal conductivity behavior of SiC-Nylon 6,6 and hBN-Nylon 6,6 composites. Res. Chem. Intermed. 2014, 40, 33–40. [Google Scholar] [CrossRef]
  69. Wojtkowiak, J. Lumped Thermal Capacity Model. In Encyclopedia of Thermal Stresses; Hetnarski, R.B., Ed.; Springer: Dordrecht, The Netherlands, 2014; pp. 2808–2817. [Google Scholar] [CrossRef]
  70. Çengel, Y.A.; Ghajar, A.J. Heat and Mass Transfer: Fundamentals & Applications, 6th ed.; McGraw Hill: New York, NY, USA, 2020. [Google Scholar]
Figure 1. Emission spectra of MFG at different temperatures within the spectral wavelength range of 600 nm to 700 nm.
Materials 18 04806 g001
Figure 2. Instrument design. Top-down, cross-section. The MFG emissions are isolated by the optical filters. SiR 1 receives a peak wavelength of 630 nm, and SiR 2 receives a peak wavelength of 650 nm. The blue arrows indicate the path of the incident UV LED. The pink arrows indicate the path of the MFG emission after UV excitation.
Materials 18 04806 g002
Figure 3. Single-stage amplifier circuit diagram for radiometers.
Materials 18 04806 g003
Figure 4. Sample schematic and mounting. The paint layer is represented in grey, the copper disc in orange and the MFG layer in yellow. The arrow is shown to indicate how the sample is subsequently mounted. * The figure is not to scale.
Materials 18 04806 g004
Figure 5. Absorptivity measurement setup schematic. The dashed lines represent the path of the incident thermal radiation. * The figure is not to scale.
Materials 18 04806 g005
Figure 6. Representation of the methodology for obtaining absorptivity, α ( λ ) , values. (a) MUT temperature gradient. (b) Magnified MUT temperature gradient.
Materials 18 04806 g006
Figure 7. PT calibration results. (a) Isolated spectral emission intensity of MFG at different temperatures. (b) Calibration of the MFG phosphor emission as a function of temperature.
Materials 18 04806 g007
Figure 8. Mean temperature noise as a function of integration time.
Materials 18 04806 g008
Figure 9. Relative sensitivity, S r , of the MFG ratio signal as a function of temperature.
Materials 18 04806 g009
Figure 10. Absorptivity results for the median absorptivity of Black 3.0®. (a) Median empirical and modelled temperature curve for Black 3.0®. (b) Absorptivity data for Black 3.0® extracted from [19].
Materials 18 04806 g010
Figure 11. Median absorptivity and heating results for MUTs across the 0.2 µm to 2 µm spectral region. (a) Median empirical and modelled heating curves for all MUTs. (b) Absorptivity as a function of paint mixing ratios White–Black.
Materials 18 04806 g011
Figure 12. PT absorptivity measurements at discrete wavelengths. Reference data extracted from [19].
Materials 18 04806 g012
Table 1. Results for unfiltered Black 3.0® absorptivity across a wavelength range of 0.2 µm to 2 µm.
Power [W]Test #Absorptivity α ( λ ) Median α ( λ )
10.9385
720.93120.9385
30.9393
Table 2. Absorptivity results for various paint ratios across a wavelength range of 0.2 µm to 2 µm.
MUTPower [ W ] Test #Absorptivity α ( λ ) Median α ( λ )
10.0620
White720.06510.0651
30.0747
10.3609
25:75720.35170.3528
30.3528
10.6509
50:50720.62970.6401
30.6401
10.7662
75:25720.79710.7868
30.7868
10.9385
Black720.93120.9385
30.9393
Table 3. Absorptivity results for Black 3.0® using narrow bandpass filters with a FWHM = 40 nm.
Filter Wavelength [nm]Power [W]Test #Absorptivity α ( λ ) Median α ( λ )
10.9755
600–400.17820.95980.9598
30.9587
10.9318
1550–400.10620.91720.9172
30.8922
Disclaimer/Publisher’s Note: The statements, opinions and data contained in all publications are solely those of the individual author(s) and contributor(s) and not of MDPI and/or the editor(s). MDPI and/or the editor(s) disclaim responsibility for any injury to people or property resulting from any ideas, methods, instructions or products referred to in the content.