
Study of the Influence of Desert Sand-Mineral Admixture on the Abrasion Resistance of Concrete


Highlights
- Fly ash and basalt fibers can significantly enhance the abrasion resistance of concrete.
- Desert sand adversely impacts the abrasion resistance of concrete.
- The influence of integrating desert sand with mineral admixtures on the abrasion resistance of concrete was examined.
Abstract

1. Introduction
2. Materials and Methods
2.1. Materials
- (1)
- Cement: The cement utilized was P·O 42.5 ordinary Portland cement manufactured by China Xinjiang Tianneng Cement Co., Ltd. (Shihezi, China). The chemical composition and specific surface area of the cement may be found in Table 1.
- (2)
- Fine aggregate: medium sand, fineness modulus 2.7.
- (3)
- Coarse aggregate: The coarse aggregate consists of stones sourced from Shihezi City, Xinjiang Province, China, and has a consistent size grading of 5–20 mm.
- (4)
- Gurbantunggut Desert sand: Located in the Xinjiang region of China (Xinjiang Province, China), the Gurbantunggut Desert is characterized by an average grain size of 0.183 mm and a fineness modulus of 0.334. The chemical composition of the sand is provided in Table 2.
- (5)
- Fly ash: The study utilized the processed class Ⅰ fly ash from China Xinjiang Yue Longda Building Materials Co., Ltd. (Shihezi, China), with its specifications outlined in Table 3.
- (6)
- Silica fume: The study utilized the silica fume manufactured by China Henan Platinum Run Casting Materials Co., Ltd. (Gongyi, China), with the particular characteristics indicated in Table 4.
- (7)
- Basalt fiber: The study utilized short-cut basalt fiber from China Zhengzhou Dengdian Basalt Co., Ltd. (Zhengzhou, China), which had a length of 18 mm. The performance characteristics of the fiber may be found in Table 5.
- (8)
- Water-reducing agent: The study utilized a polycarboxylic acid water-reducing agent manufactured by China Xinjiang Changhong Admixture Co., Ltd. (Shihezi, China), which has a water-reducing efficiency of 20%.
- (9)
- Water: The water utilized in the test was tap water sourced exclusively from the China Shihezi region (Shihezi City, Xinjiang Province, China). The water hardness measured 276 mg/L, while the pH level was 7.4.
2.2. Mix Proportion
2.3. Measurement Method
2.3.1. Mechanical Properties
2.3.2. Abrasion Resistance Test of Concrete
2.3.3. Microstructure Analyses
3. Results and Analysis of Single Doping Test
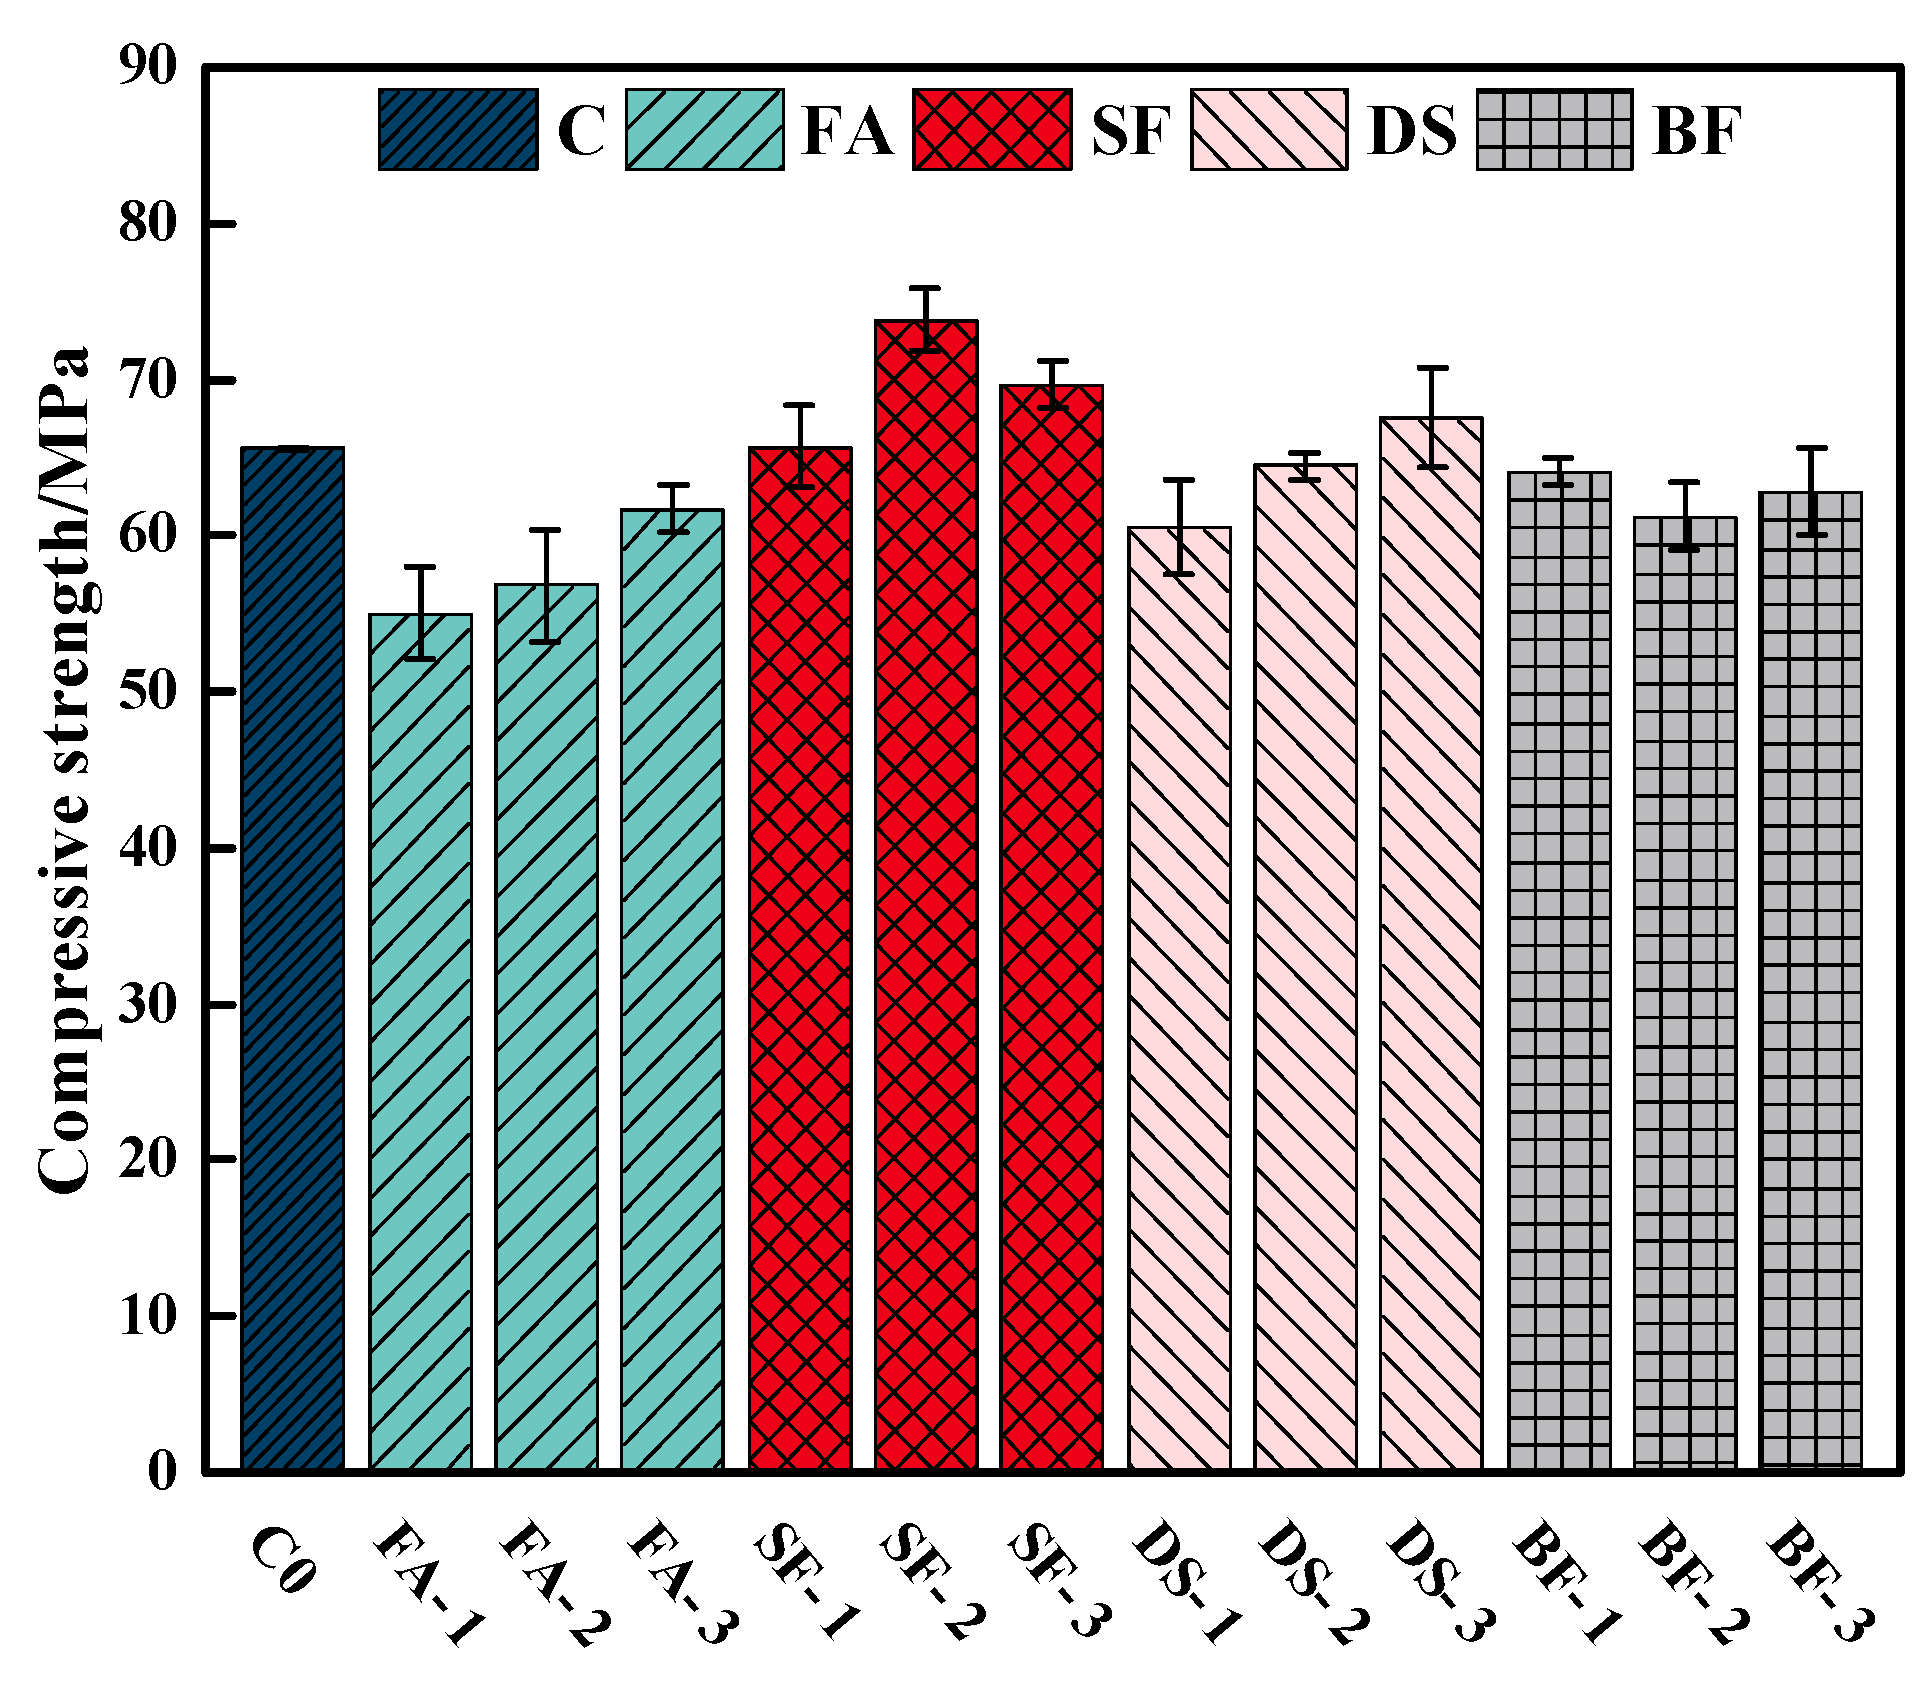
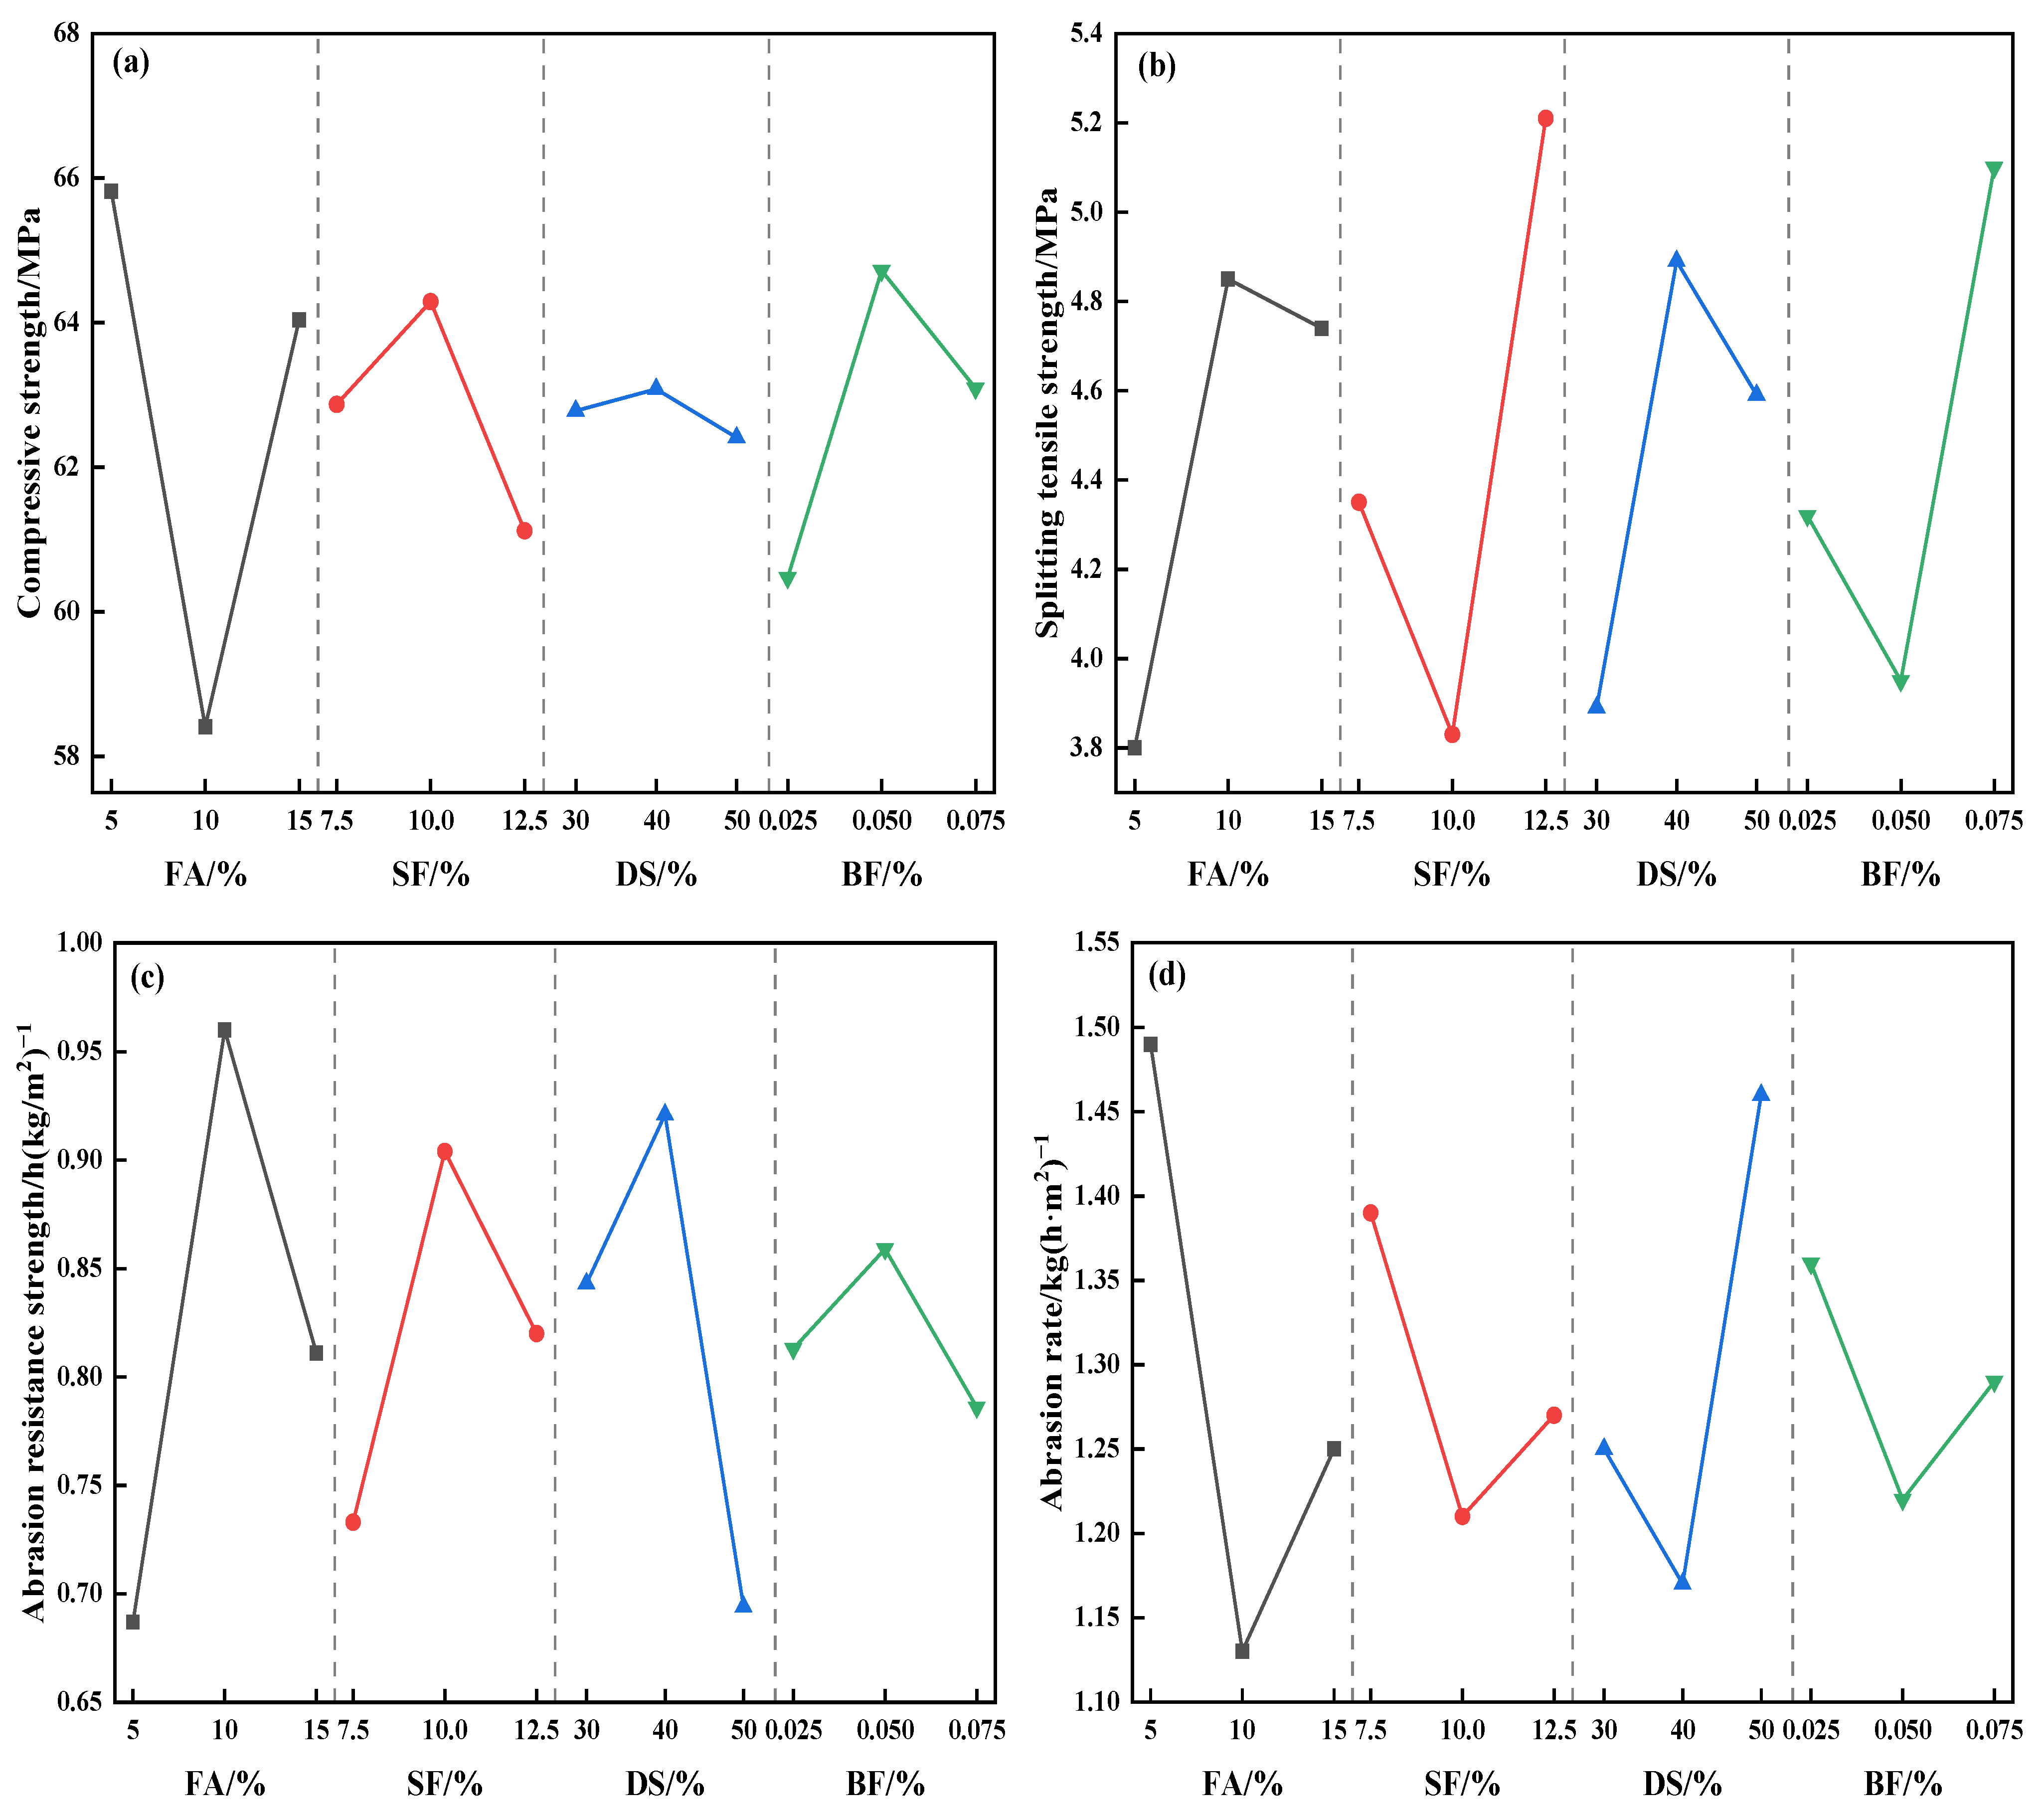
3.1. Compressive Strength Analysis
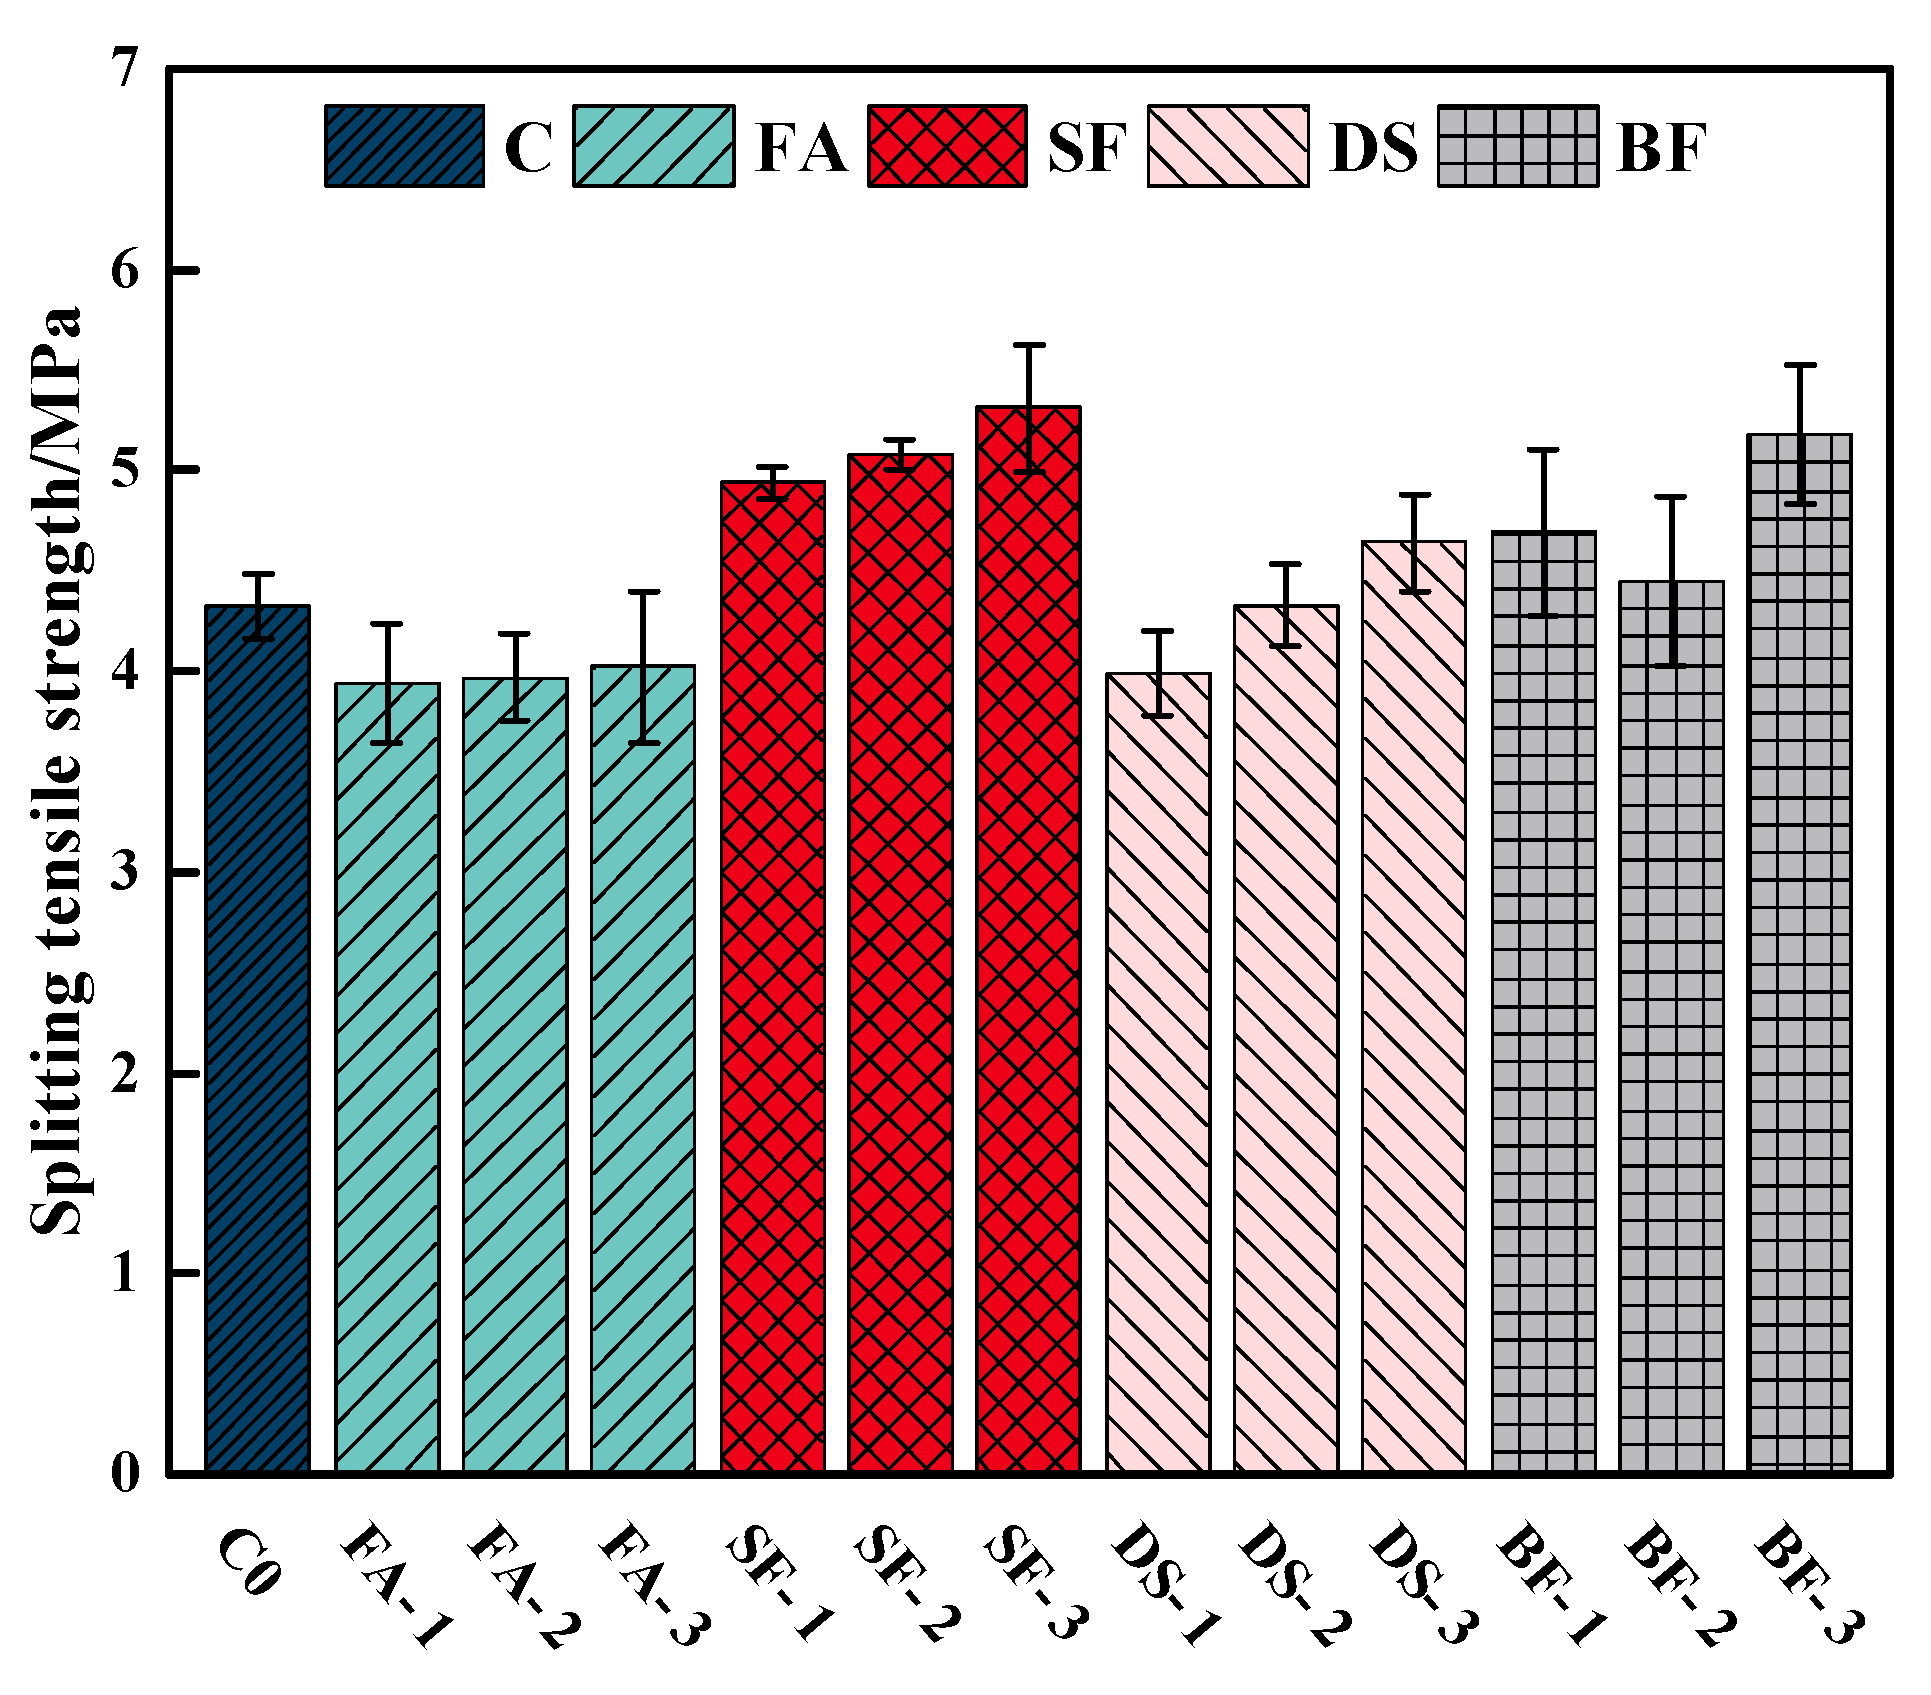
3.2. Splitting Tensile Strength Analysis
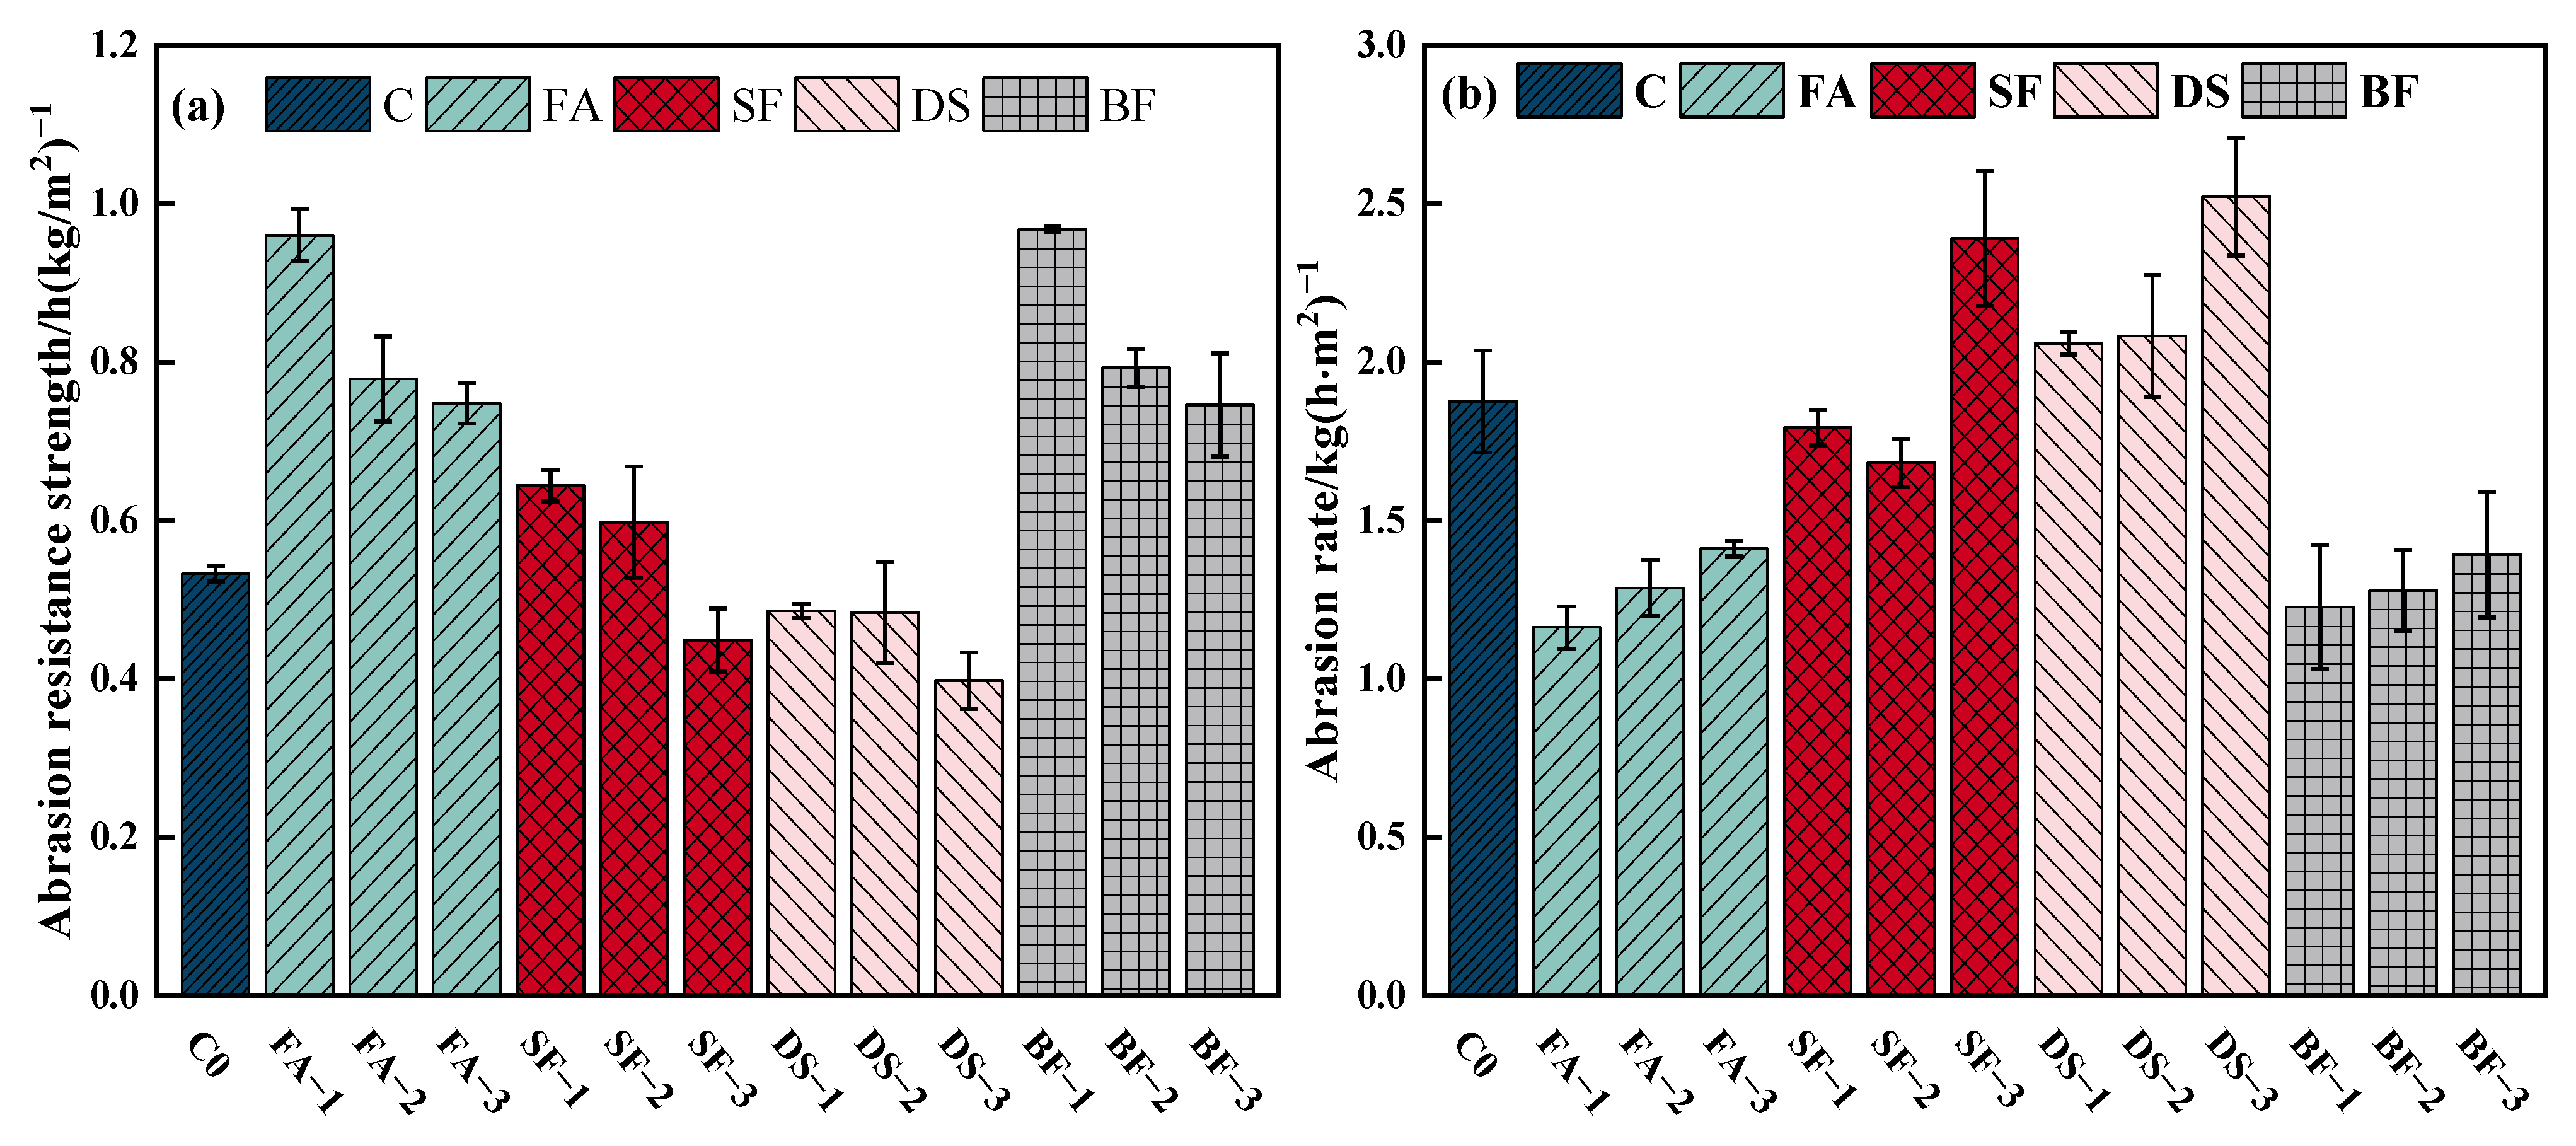
3.3. Abrasion Resistance Test Analysis
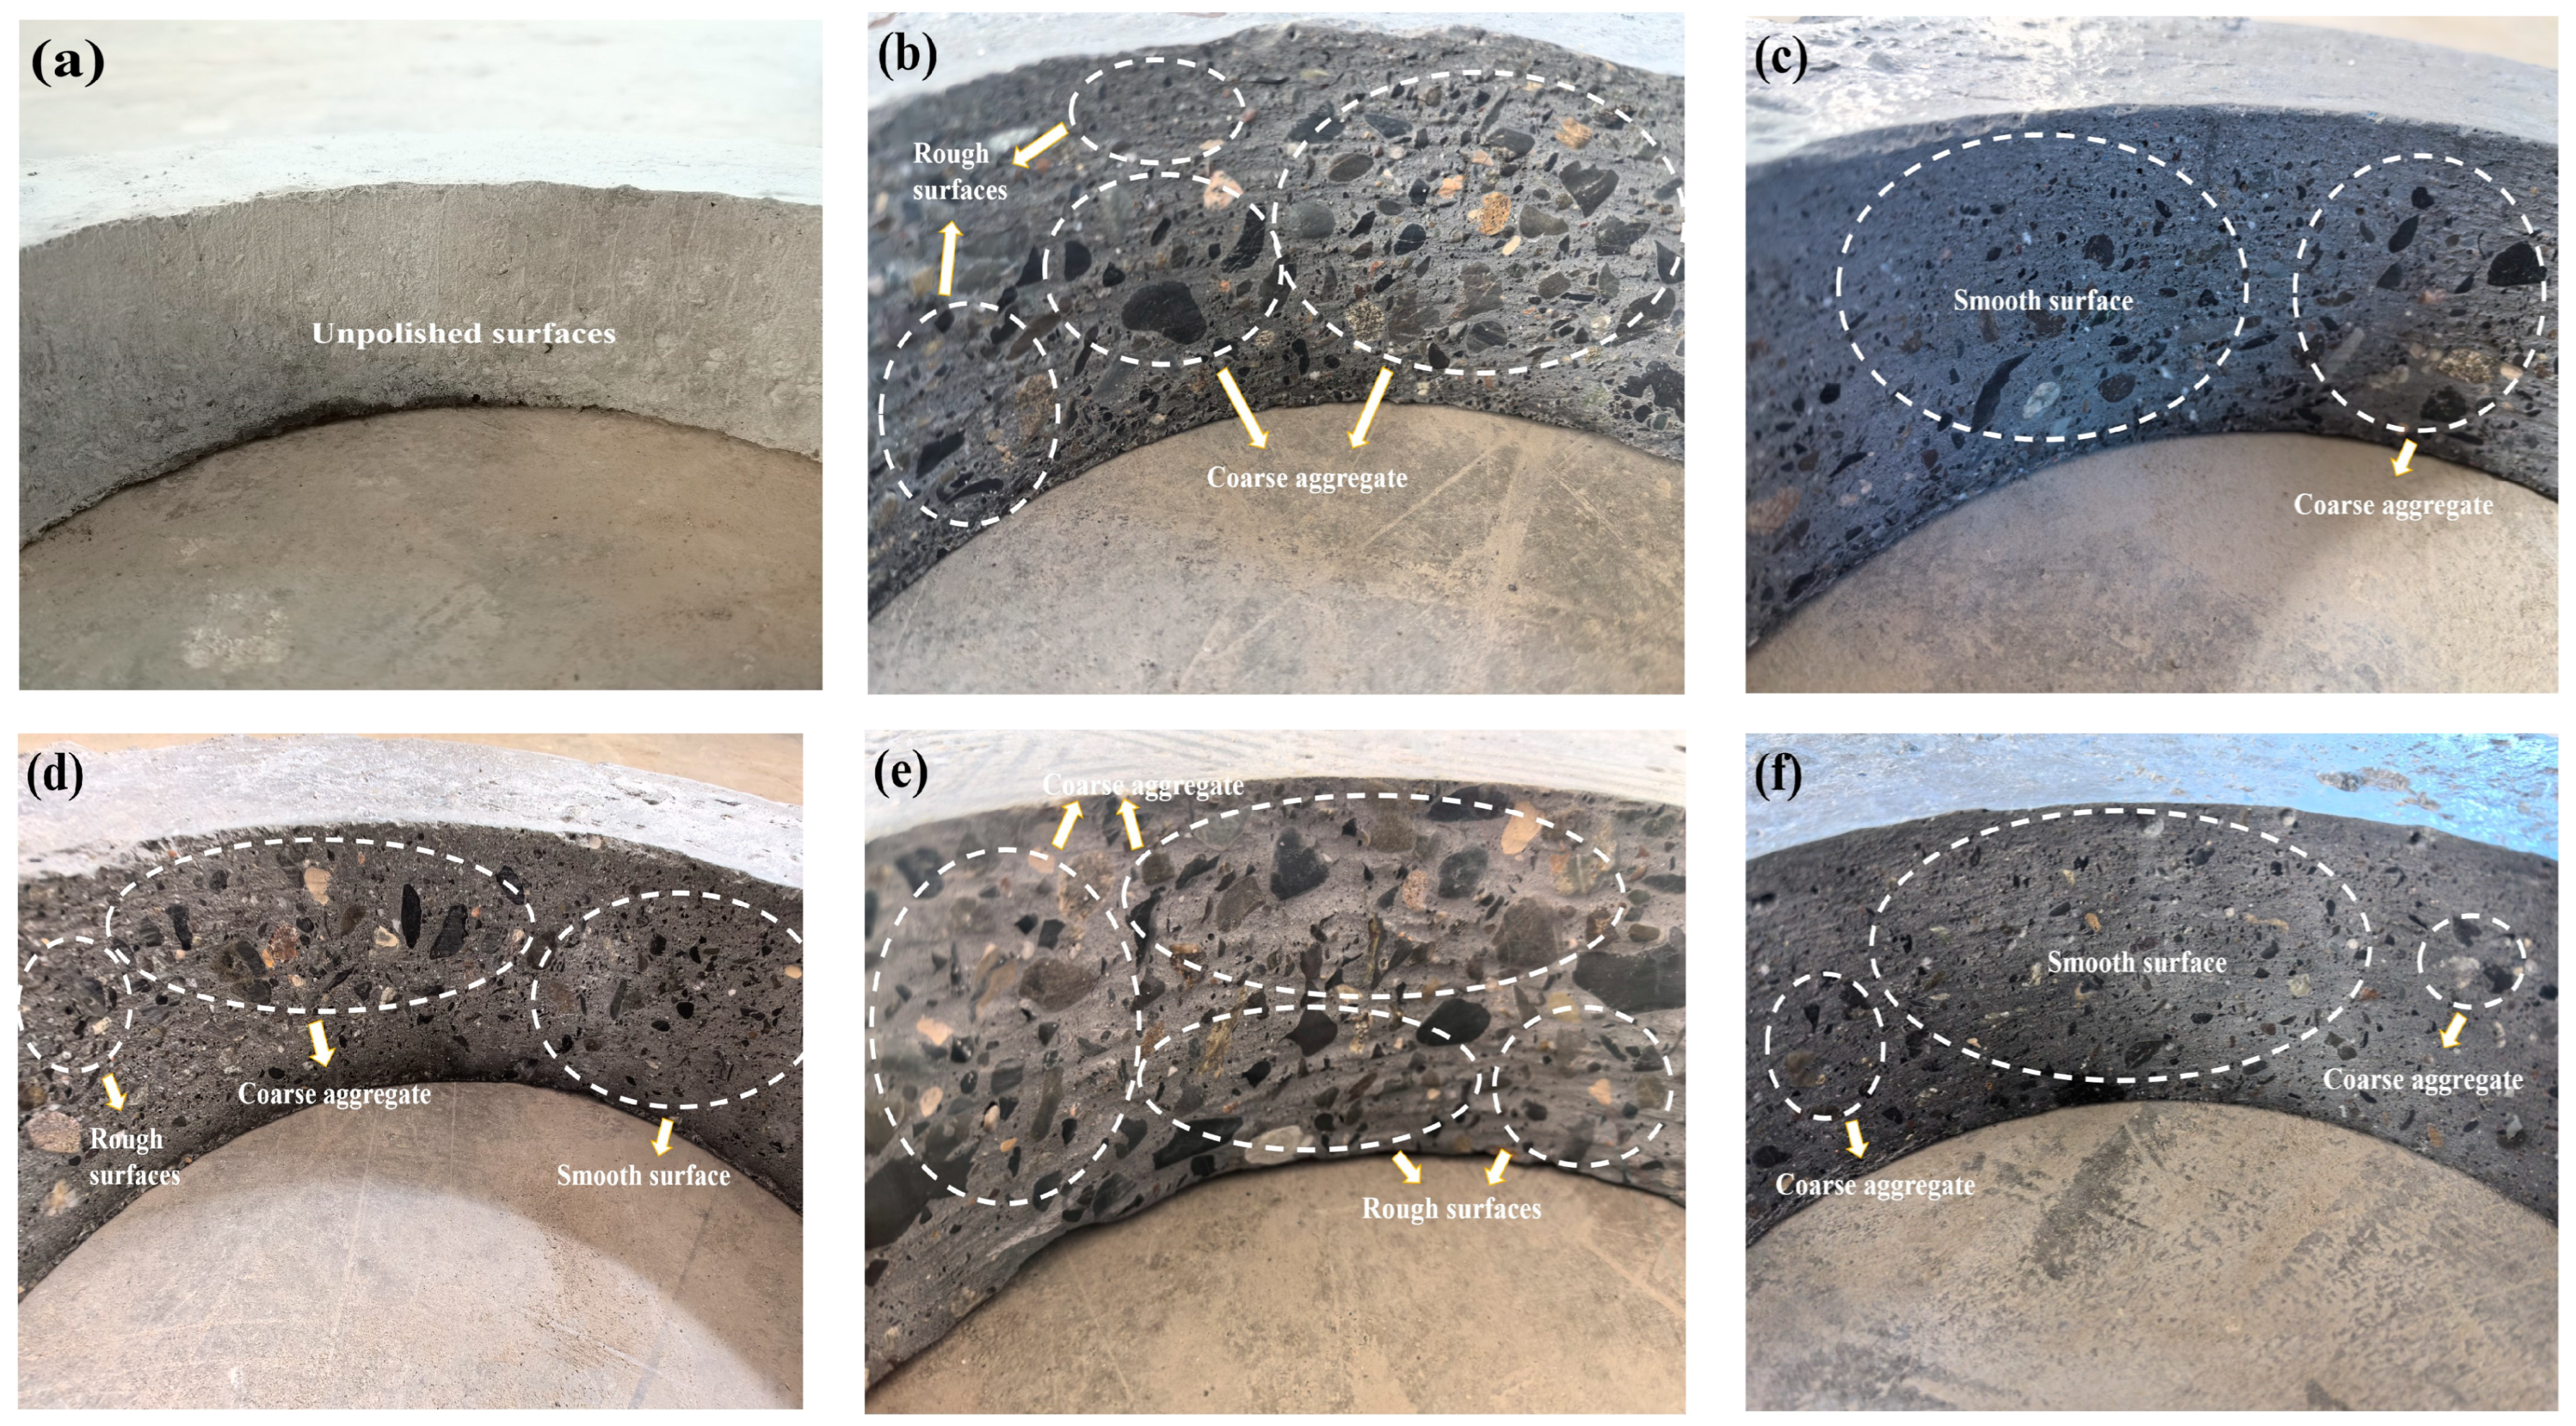
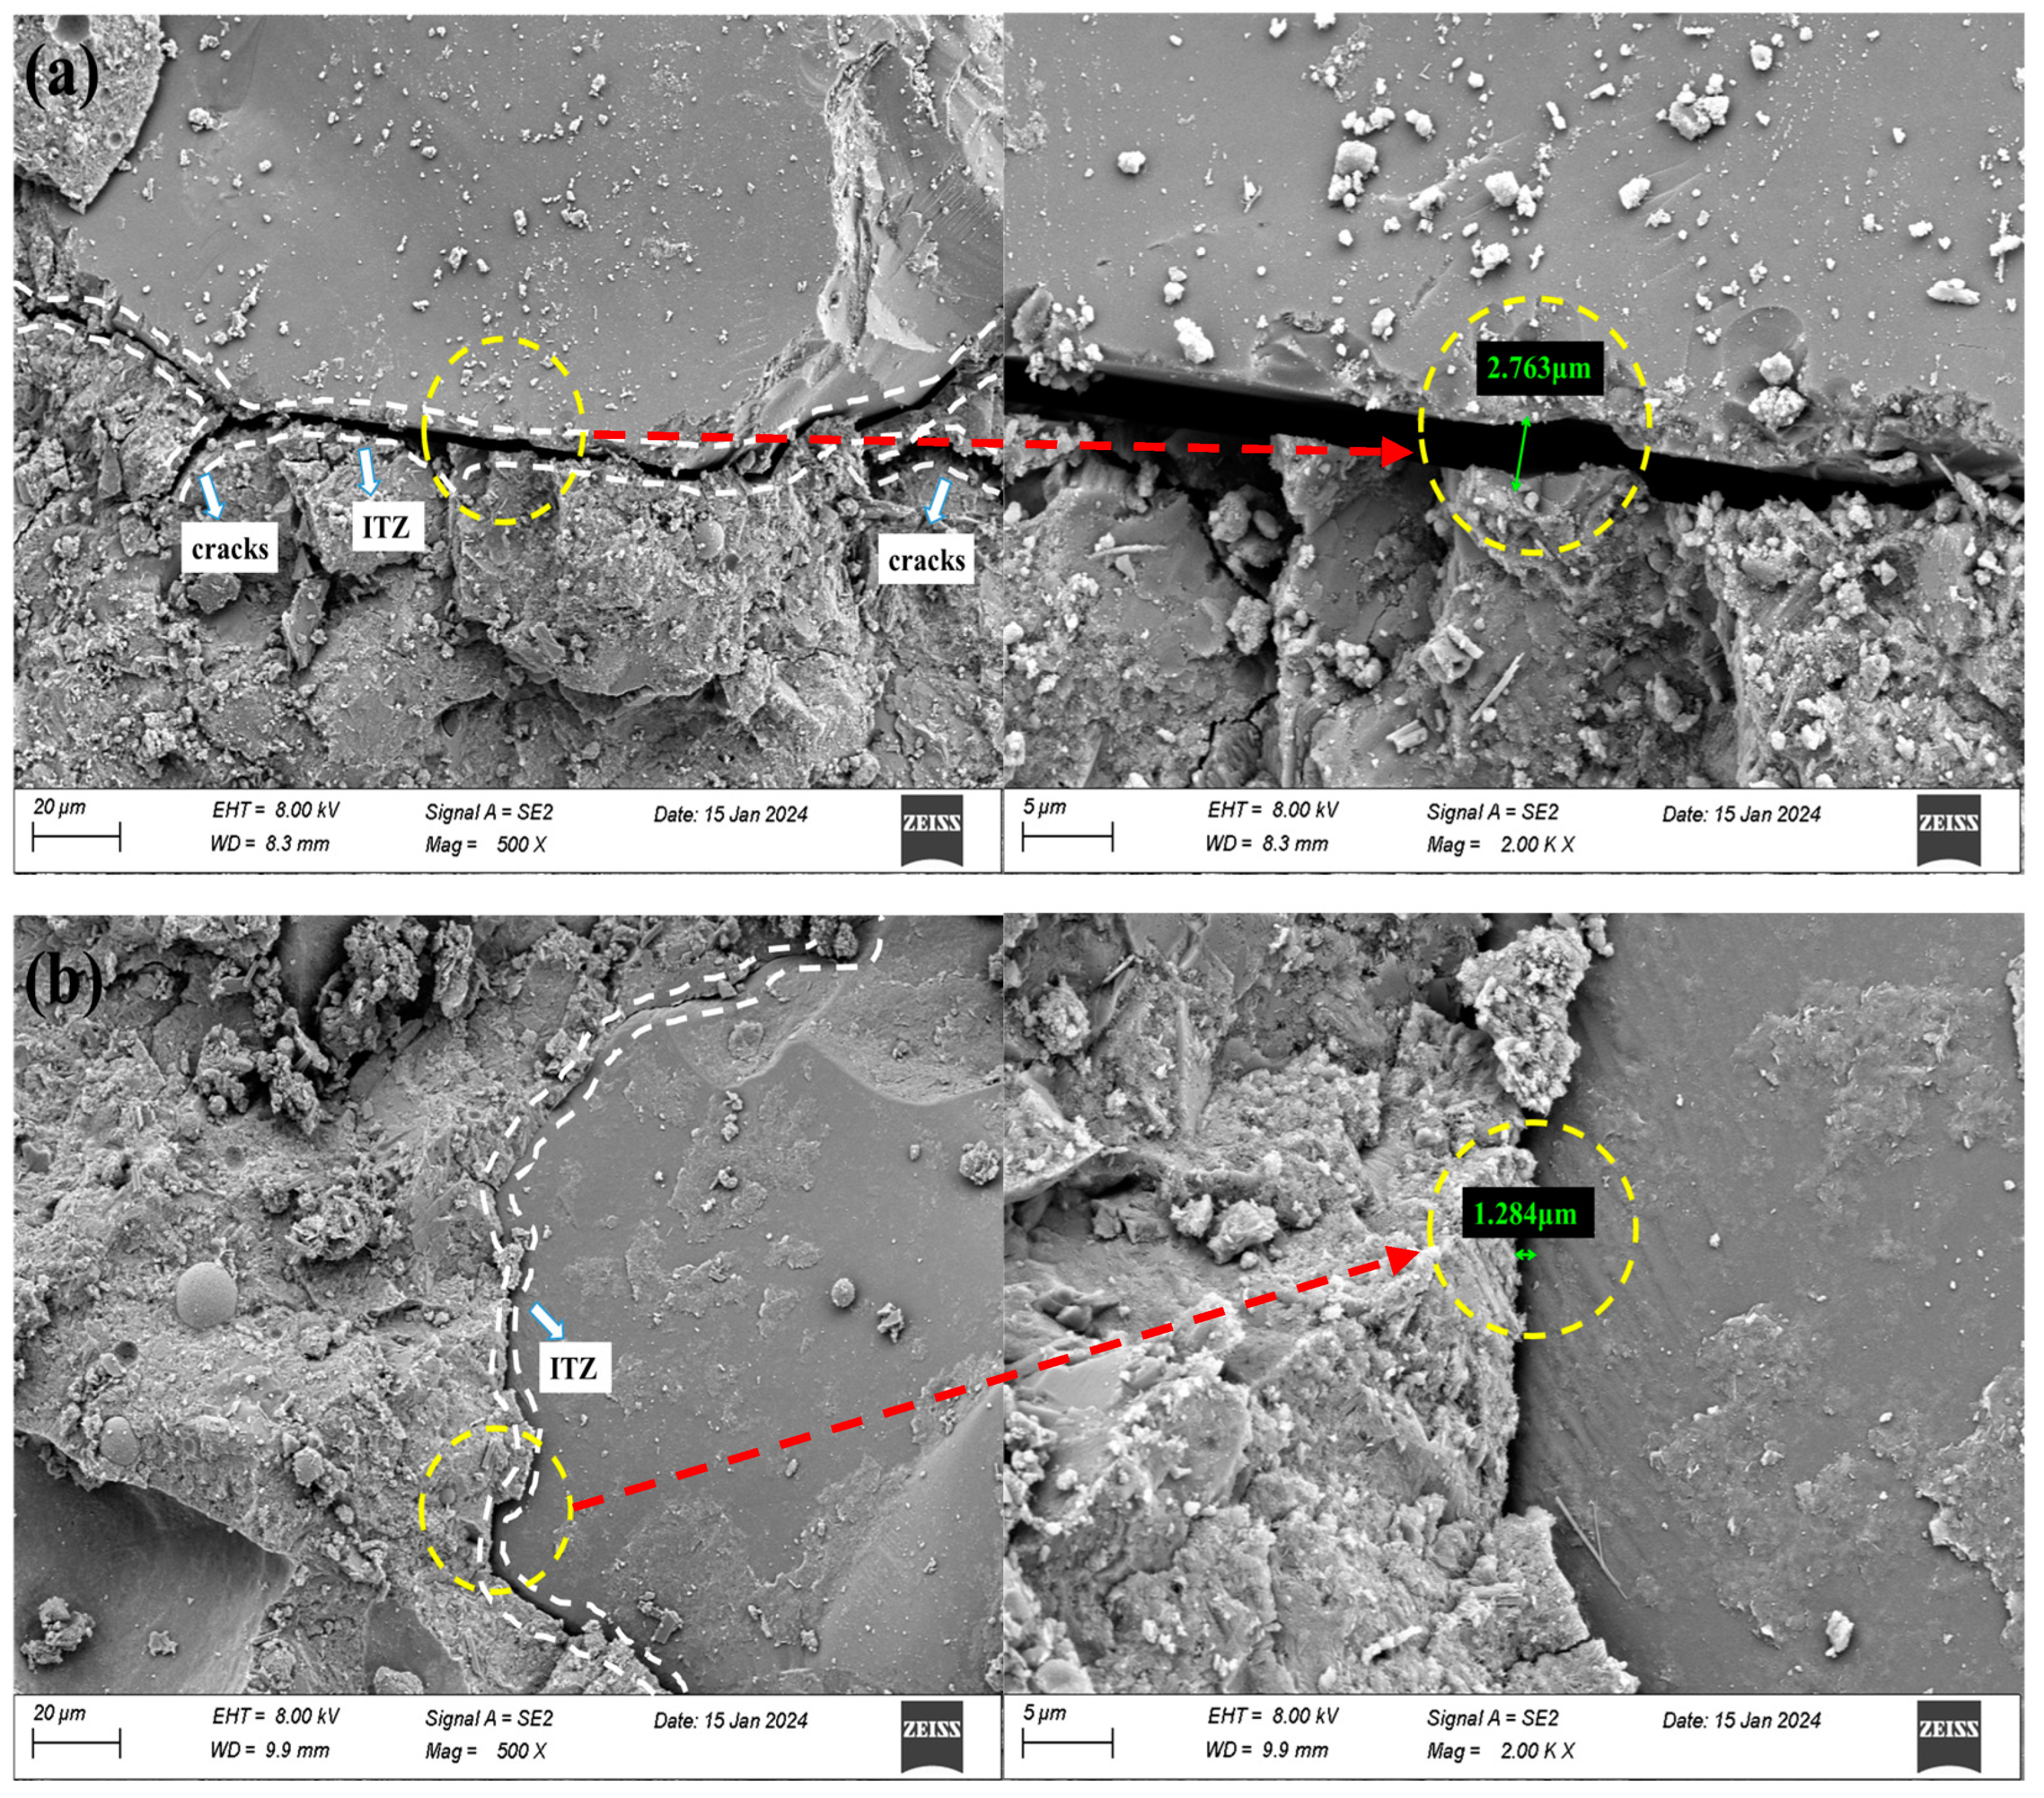
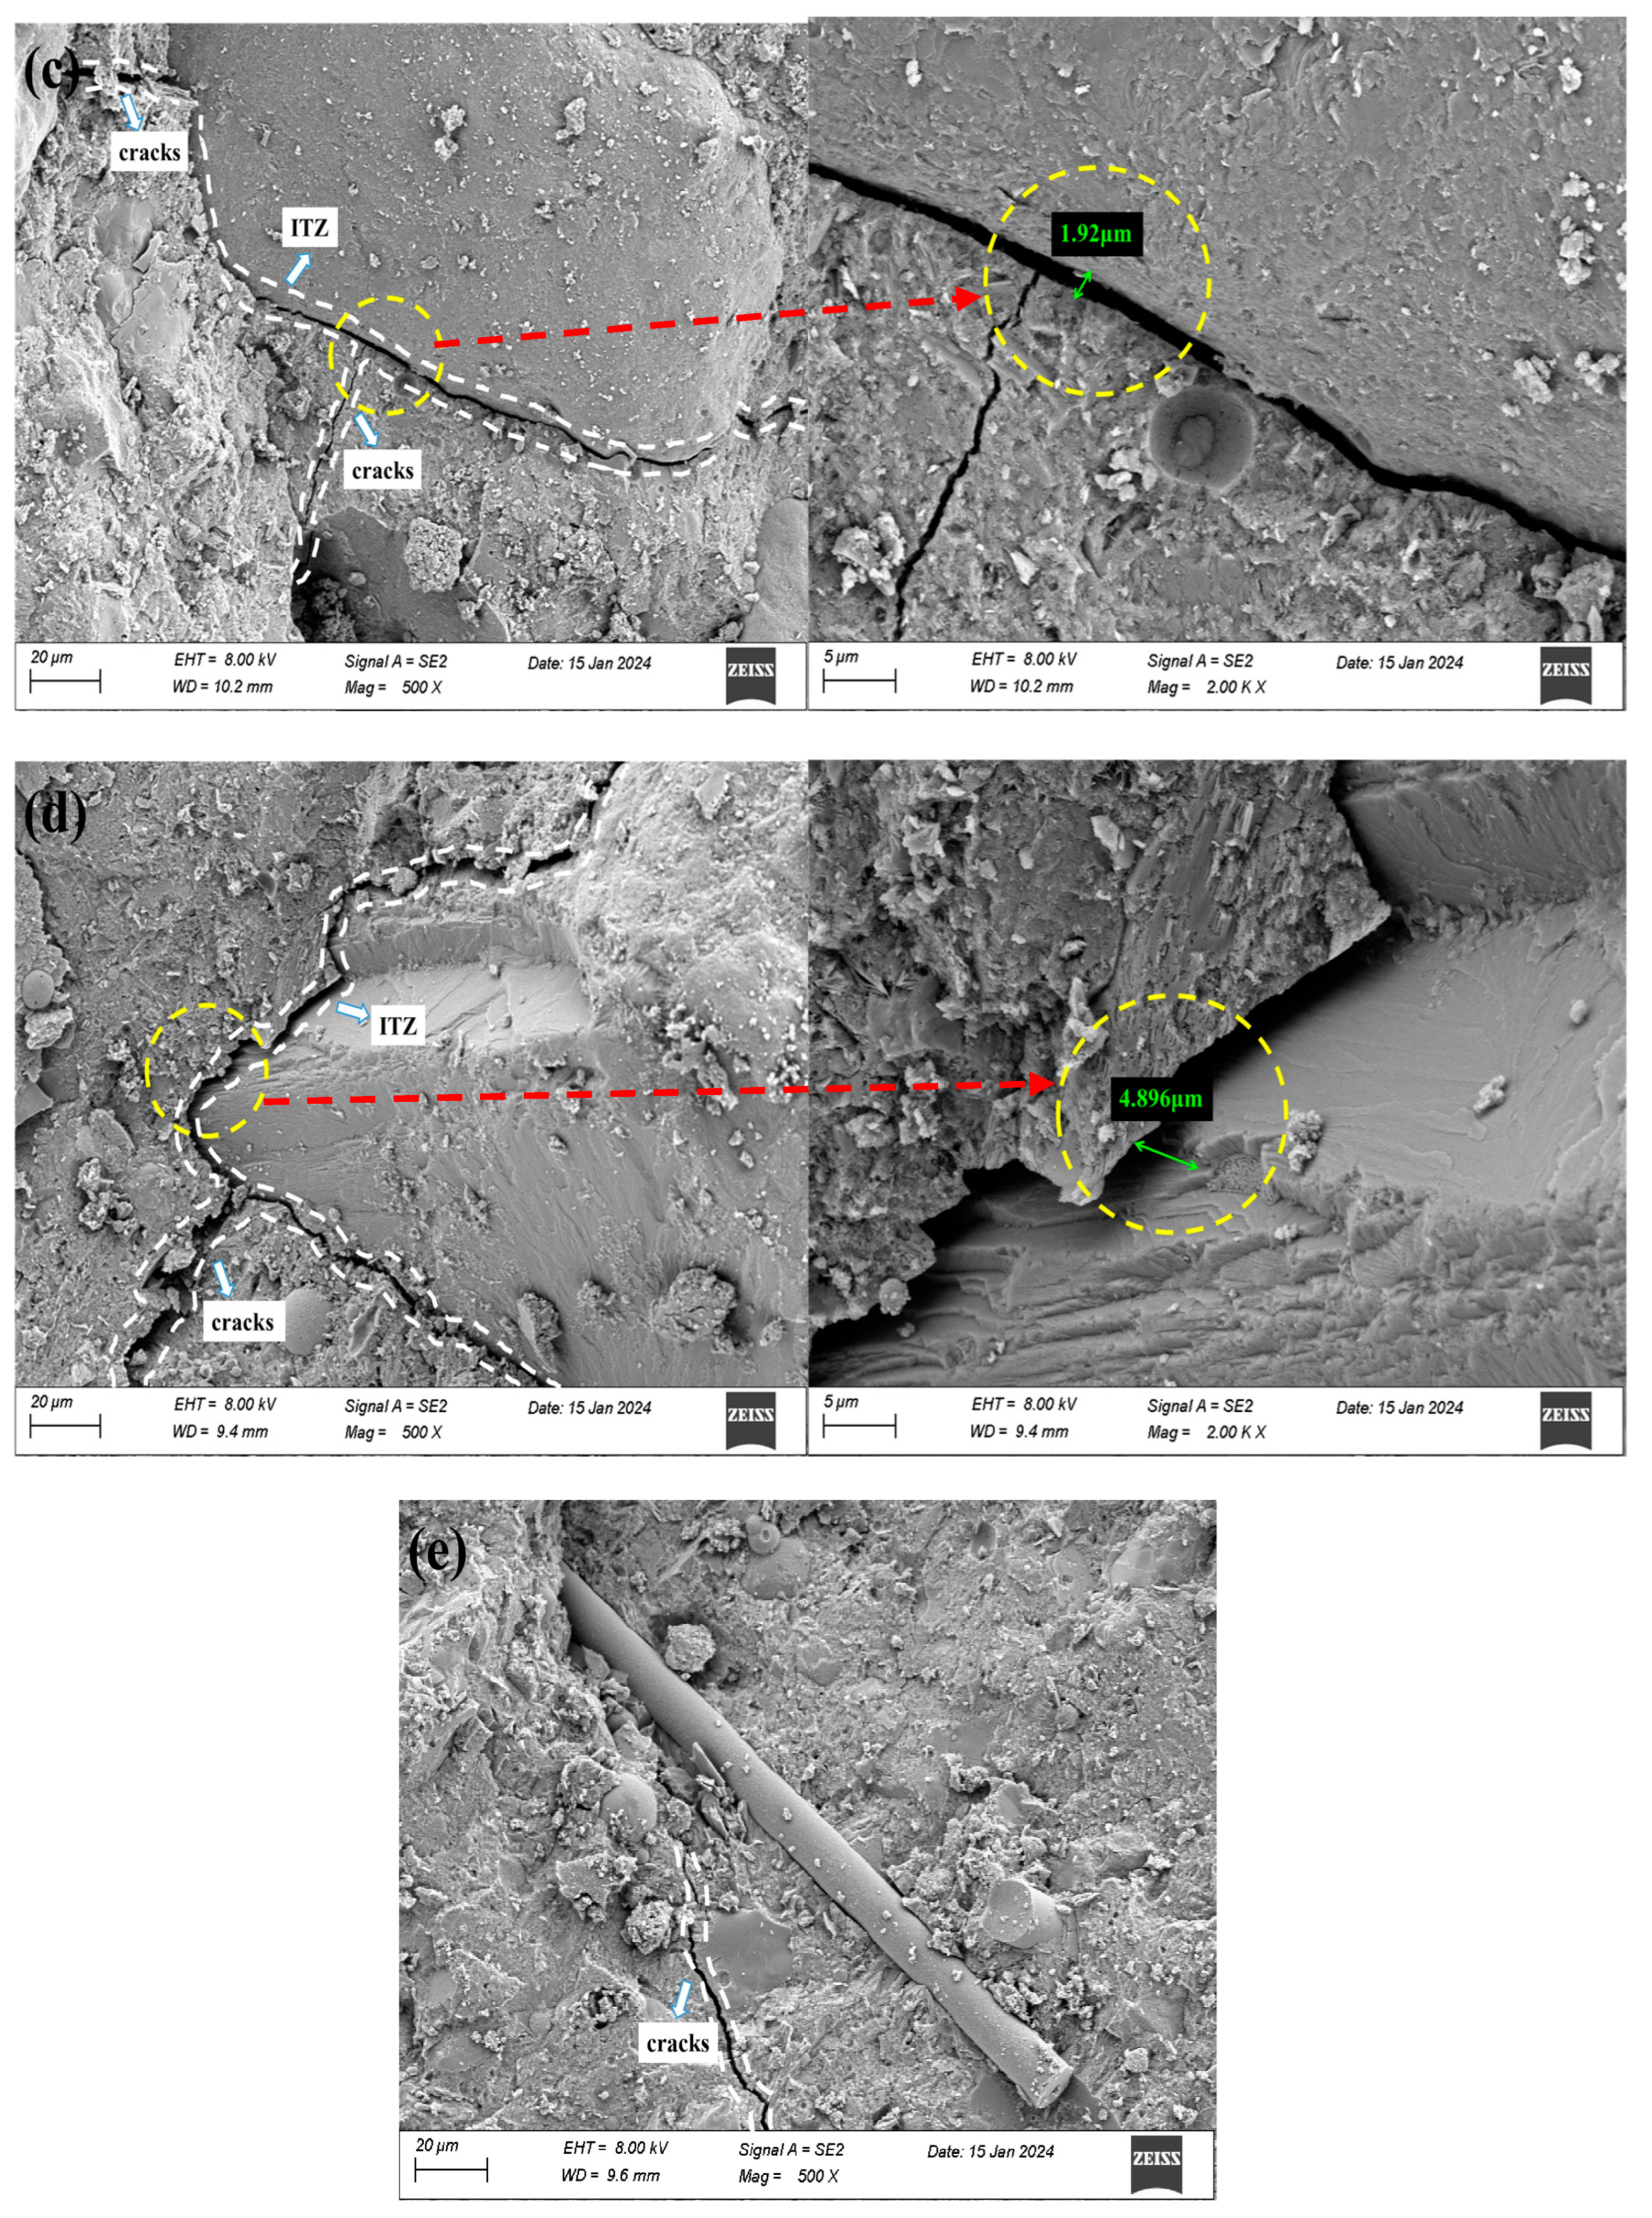
3.4. Microanalysis
3.4.1. SEM Analysis
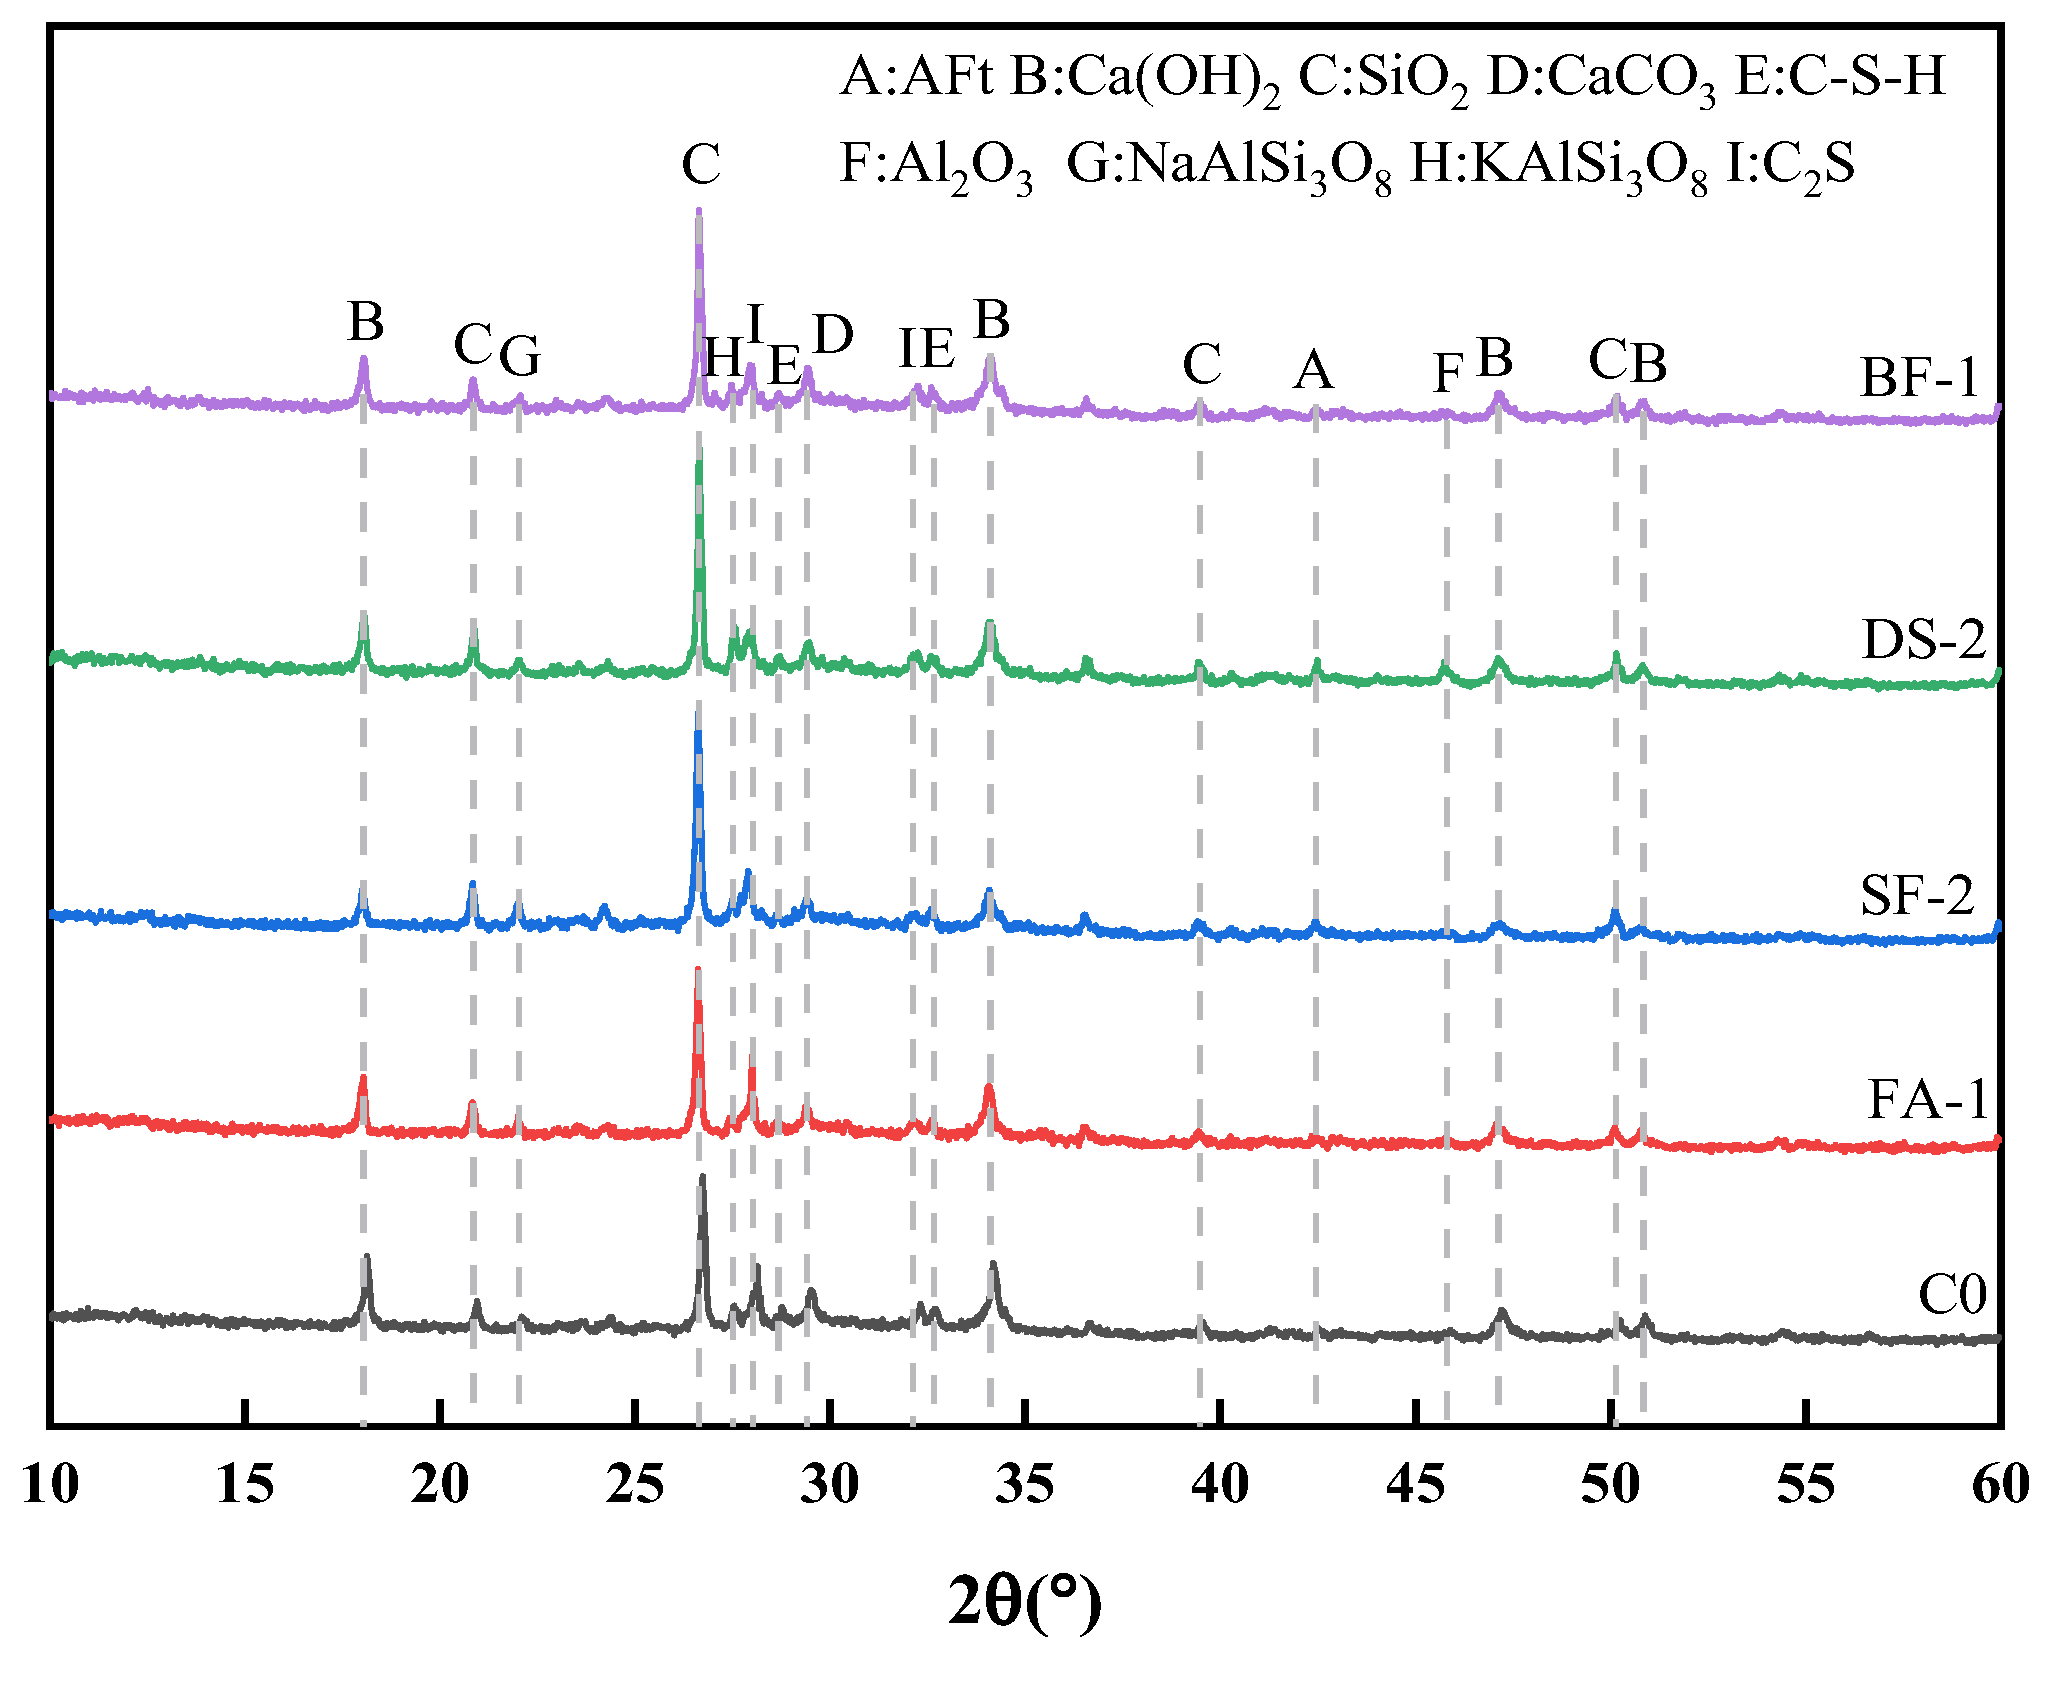
3.4.2. XRD Analysis
4. Orthogonal Experiment
4.1. Design of Experiments
4.2. Results and Analyses of the Tests
4.2.1. Experiment Outcomes
4.2.2. Range Analysis
4.2.3. Variance Analysis
4.2.4. Analysis of Factor Indicators
4.3. Determination of Concrete Mixture Proportions
5. Discussion
6. Conclusions
- (1)
- The incorporation of FA and BF into concrete significantly enhances its abrasion resistance, with fewer admixture levels of FA and BF yielding superior performance in both aspects. When the SF dosage is below 10%, it enhances the abrasion resistance of concrete; however, the DS adversely influences the abrasion resistance of concrete.
- (2)
- Orthogonal experiment findings indicated that the four admixtures collectively enhance the abrasion resistance of concrete. Variance analysis revealed that FA, SF, and DS significantly affect the abrasion resistance strength of concrete, but SF and BF significantly influence the abrasion rate of concrete.
- (3)
- The analysis reveals that the ideal mix proportion for the DSC-1 group is A2B2C2D2, comprising 10% FA content, 10% SF content, 40% DSRR, and 0.05% BF content. Its compressive strength is comparable to that of OC; however, the splitting tensile strength and abrasion resistance strength of the DSC-1 group increased by 39.12% and 112.95%, respectively, compared to OC, while the abrasion rate decreased by 48.83%. This indicates that DS can be effectively utilized, hence diminishing reliance on river sand.
- (4)
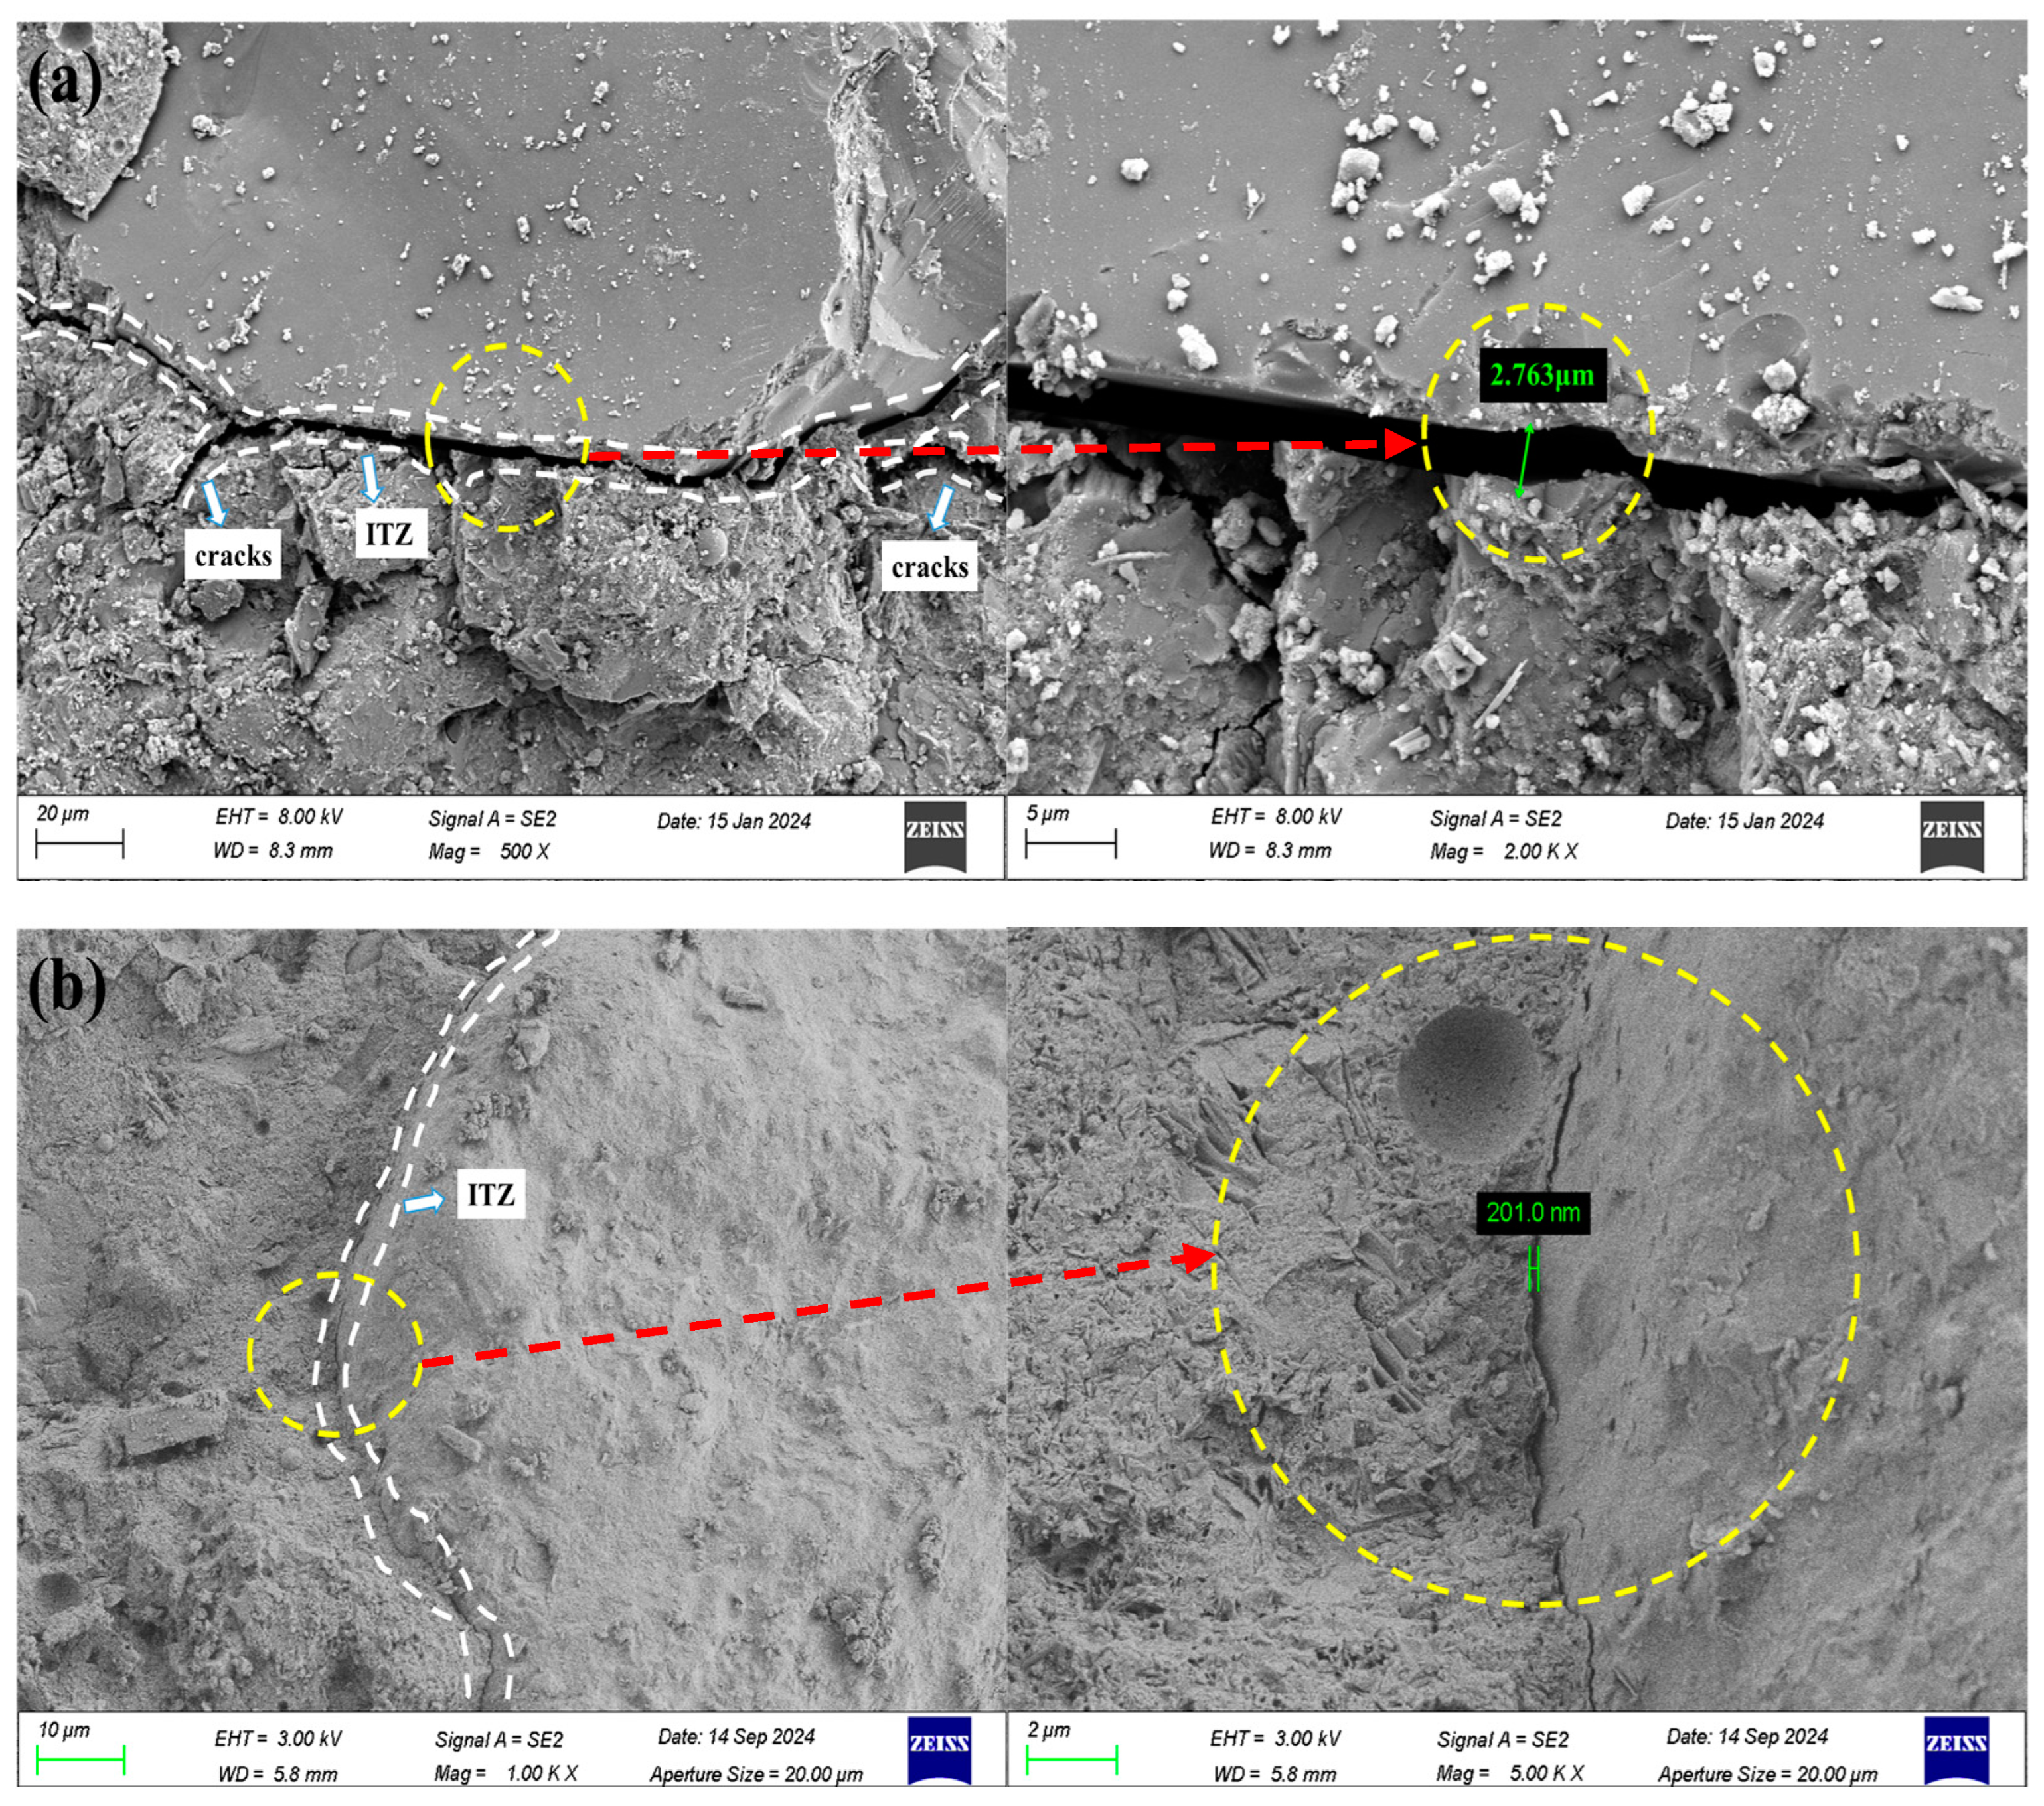
- Through the microscopic analysis, it is found that the width of the ITZ is an important factor in determining the abrasion resistance of concrete, and a narrower ITZ enhances the concrete’s abrasion resistance. The findings of this study may serve as a reference for the utilization of DSC in assembled concrete channels.
Author Contributions
Funding
Institutional Review Board Statement
Informed Consent Statement
Data Availability Statement
Conflicts of Interest
References
- Zhao, B.; Yao, J.; Tu, Z.; Wang, Y.; Liu, X. Tentative ideas on application of prefabricated environmentally-friendly canals in canal system of farmland irrigation district. IOP Conf. Ser. Earth Environ. Sci. 2020, 568, 012031. [Google Scholar] [CrossRef]
- Jiang, W.; Hua, Y.C.; Yuan, M.; Martek, I.; Jiang, W.L. Pricing models under three-echelon prefabricated construction supply chains with consumer preferences. Sustainability 2024, 16, 727. [Google Scholar] [CrossRef]
- Shi, F.Y.; Li, T.Y.; Wang, W.K.; Liu, R.D.; Liu, X.Y.; Tian, H.W.; Liu, N.Z. Research on the effect of desert sand on pore structure of fiber reinforced mortar based on x-ct technology. Materials 2021, 14, 5572. [Google Scholar] [CrossRef] [PubMed]
- Yu, X.; Lei, J.Q.; Gao, X. An over review of desertification in xinjiang, northwest china. J. Arid. Land 2022, 14, 1181–1195. [Google Scholar] [CrossRef]
- Li, S.X.; Tang, L.; Shi, W.Y.; Zhong, C.C. Experimental investigation on hydroabrasive erosion of steel fiber uhpc and rubber uhpc. Adv. Mater. Sci. Eng. 2020, 2020, 10. [Google Scholar] [CrossRef]
- Liao, T.C.; Huang, X.; Yuan, J.; Ren, S.Q.; Cai, H.; Chen, X. Effects of desert sand substitution on concrete properties using desert sand—Doped artificial sand as the fine aggregate. Ceram.-Silik. 2022, 66, 540–554. [Google Scholar] [CrossRef]
- Qiao, L.; Miao, P.; Xing, G.; Luo, X.; Ma, J.; Farooq, M.A. Interpretable machine learning model for predicting freeze-thaw damage of dune sand and fiber reinforced concrete. Case Stud. Constr. Mater. 2023, 19, e02453. [Google Scholar] [CrossRef]
- Li, Z.Q.; Ma, R.; Li, G. Experimental study on the shear strength of dune sand concrete beams. Adv. Civ. Eng. 2020, 2020, 8062691. [Google Scholar] [CrossRef]
- Shen, Y.; Peng, C.; Hao, J.; Bai, Z.; Li, Y.; Yang, B. High temperature resistance of desert sand concrete: Strength change and intrinsic mechanism. Constr Build Mater. 2022, 327, 126948. [Google Scholar] [CrossRef]
- Liu, Y.J.; Yang, W.W.; Chen, X.L.; Liu, H.F.; Yan, N.N. Effect of desert sand on the mechanical properties of desert sand concrete (dsc) after elevated temperature. Adv. Civ. Eng. 2021, 2021, 3617552. [Google Scholar] [CrossRef]
- Kaufmann, J. Evaluation of the combination of desert sand and calcium sulfoaluminate cement for the production of concrete. Constr. Build. Mater. 2020, 243, 118281. [Google Scholar] [CrossRef]
- Liu, H.J.; Liu, R.T.; Yang, H.L.; Ma, C.Y.; Zhou, H. Iop, Experimental study on the performance of pervious concrete. IOP Conf. Ser. Earth Environ. Sci. 2017, 51, 1099–1104. [Google Scholar]
- Liu, Y.W.; Lin, Y.Y.; Cho, S.W. Abrasion behavior of steel-fiber-reinforced concrete in hydraulic structures. Appl. Sci. 2020, 10, 5562. [Google Scholar] [CrossRef]
- Lekshmi, S.; Sudhakumar, J. An assessment on the durability performance of fly ash-clay based geopolymer mortar containing clay enhanced with lime and ggbs. Clean. Mater. 2022, 5, 100129. [Google Scholar] [CrossRef]
- Huang, J.Q.; Liu, K.M.; Song, X.L.; Zheng, G.C.; Chen, Q.; Sun, J.D.; Jin, H.Z.; Jiang, L.L.; Jiang, Y.S.; Zhang, Y.; et al. Incorporation of al2o3, go, and al2o3@go nanoparticles into water-borne epoxy coatings: Abrasion and corrosion resistance. RSC Adv. 2022, 12, 24804–24820. [Google Scholar] [CrossRef]
- Czarnecki, S.; Chajec, A.; Malazdrewicz, S.; Sadowski, L. The prediction of abrasion resistance of mortars modified with granite powder and fly ash using artificial neural networks. Appl. Sci. 2023, 13, 4011. [Google Scholar] [CrossRef]
- Omoding, N.; Cunningham, L.S.; Lane-Serff, G.F. Influence of coarse aggregate parameters and mechanical properties on the abrasion resistance of concrete in hydraulic structures. J. Mater. Civ. Eng. 2021, 33, 04021244. [Google Scholar] [CrossRef]
- Suhaini, N.A.M.; Ali, N.; Hamid, N.A.A.; Salleh, N.; Abdullah, S.R.; Othman, N.H.; Shahidan, S. Performance of modified epoxy mortar using composite cement containing ground granulated blast furnace slag (ggbs). IOP Conf. Ser. Mater. Sci. Eng. 2020, 991, 012135. [Google Scholar] [CrossRef]
- Esteban-Arranz, A.; de la Osa, A.R.; Garcia-Lorefice, W.E.; Sacristan, J.; Sanchez-Silva, L. Long-term performance of nanomodified coated concrete structures under hostile marine climate conditions. J. Nanomater. 2021, 11, 869. [Google Scholar] [CrossRef] [PubMed]
- Fonseca, N.; de Brito, J.; Evangelista, L. The influence of curing conditions on the mechanical performance of concrete made with recycled concrete waste. Cem. Concr. Compos. 2011, 33, 637–643. [Google Scholar] [CrossRef]
- Wang, Q.H.; Liu, R.X.; Liu, P.Y.; Liu, C.Y.; Sun, L.Y.; Zhang, H. Effects of silica fume on the abrasion resistance of low-heat Portland cement concrete. Constr. Build. Mater. 2022, 329, 127165. [Google Scholar] [CrossRef]
- Chu, T.X.H.; Zheng, J.H.; Chen, D.; Nguyen, T.T.H.; Elbashiry, E.; Tang, V.T. Utilization of industrial waste in cement in a marine environment with a tropical climate. J. Mar. Sci. Eng. 2019, 7, 245. [Google Scholar] [CrossRef]
- Ma, X.D.; He, T.S.; Xu, Y.D.; Yang, R.H.; Sun, Y.H. Hydration reaction and compressive strength of small amount of silica fume on cement-fly ash matrix. Case Stud. Constr. Mater. 2022, 16, e00989. [Google Scholar] [CrossRef]
- Wang, L.; Jin, M.M.; Guo, F.X.; Wang, Y.; Tang, S.W. Pore structural and fractal analysis of the influence of fly ash and silica fume on the mechanical property and abrasion resistance of concrete. Fractals-Complex Geom. Patterns Scaling Nat. Soc. 2021, 29, 2140003. [Google Scholar] [CrossRef]
- Ahmad, S.; Al-Amoudi, O.S.B.; Khan, S.M.S.; Maslehuddin, M. Effect of silica fume inclusion on the strength, shrinkage and durability characteristics of natural pozzolan-based cement concrete. Case Stud. Constr. Mater. 2022, 17, e01255. [Google Scholar] [CrossRef]
- Nguyen, H.A.; Chang, T.P.; Chen, C.T.; Wun, J.L.; Shih, J.Y. Polypropylene fiber reinforced concrete improved by using silica fume and acrylic emulsion polymer. Mater. Constr. 2022, 72, e269. [Google Scholar] [CrossRef]
- Yao, Q.; Qi, S.C.; Wu, F.M.; Yang, X.G.; Li, H.T. Abrasion-resistant and temperature control of lining concrete for large-sized spillway tunnels. Appl. Sci. 2020, 10, 7614. [Google Scholar] [CrossRef]
- Wu, F.; Yu, Q.L.; Chen, X.Q. Effects of steel fibre type and dosage on abrasion resistance of concrete against debris flow. Cem. Concr. Compos. 2022, 134, 104776. [Google Scholar] [CrossRef]
- Omoding, N.; Cunningham, L.S.; Lane-Serff, G.F. Influence of basalt micro-fibres on the abrasion resistance of concrete in hydraulic structures. Mater. Struct. 2021, 54, 65. [Google Scholar] [CrossRef]
- GB/T 50081-2019; Standard for Test Method of Mechanical Properties on Ordinary Concrete. AQSIQ: Beijing, China, 2019; p. 69.
- SL/T 352-2020; Test Code for Hydraulic Concrete. Industry Standard-Water Conservancy: Beijing, China, 2020; p. 383.
- Wang, L.; Guo, F.X.; Lin, Y.Q.; Yang, H.M.; Tang, S.W. Comparison between the effects of phosphorous slag and fly ash on the c-s-h structure, long-term hydration heat and volume deformation of cement-based materials. Constr. Build. Mater. 2020, 250, 118807. [Google Scholar] [CrossRef]
- Pyo, S.; Abate, S.Y.; Kim, H.K. Abrasion resistance of ultra high performance concrete incorporating coarser aggregate. Constr. Build. Mater. 2018, 165, 11–16. [Google Scholar] [CrossRef]
- Moghaddam, F.; Sirivivatnanon, V.; Vessalas, K. The effect of fly ash fineness on heat of hydration, microstructure, flow and compressive strength of blended cement pastes. Case Stud. Constr. Mater. 2019, 10, e00218. [Google Scholar] [CrossRef]
- Hatungimana, D.; Taşköprü, C.; İçhedef, M.; Saç, M.M.; Yazıcı, Ş. Compressive strength, water absorption, water sorptivity and surface radon exhalation rate of silica fume and fly ash based mortar. J. Build. Eng. 2019, 23, 369–376. [Google Scholar] [CrossRef]
- Luo, T.; Hua, C.; Sun, Q.; Tang, L.Y.; Yi, Y.; Pan, X.F. Early-age hydration reaction and strength formation mechanism of solid waste silica fume modified concrete. Molecules 2021, 26, 5663. [Google Scholar] [CrossRef] [PubMed]
- Rennani, F.Z.; Makani, A.; Agha, N.; Tafraoui, A.; Benmerioul, F.; Zaoiai, S. Mechanical properties of high-performance concrete made incorporating dune sand as fine aggregate. Rev. Romana Ing. Civila 2020, 11, 37–46. [Google Scholar]
- Tumwiine, H.; Aziz, M.; Ali, U.; Al-Amoudi, O.S.B.; Ahmad, S.; Abdulraheem, A. Microstructural and strength variations in natural sands exposed to diverse environmental conditions. Case Stud. Constr. Mater. 2023, 19, e02403. [Google Scholar] [CrossRef]
- Bawab, J.; El-Hassan, H.; El-Dieb, A.; Khatib, J. Effect of Mix design parameters on the properties of cementitious composites incorporating volcanic ash and dune sand. Dev. Built Environ. 2023, 16, 100258. [Google Scholar] [CrossRef]
- Qu, C.W.; Qin, Y.J.; Luo, L.; Zhang, L.L. Mechanical properties and acoustic emission analysis of desert sand concrete reinforced with steel fiber. Sci. Rep. 2022, 12, 20488. [Google Scholar] [CrossRef] [PubMed]
- Wang, D.; Che, J.L.; Liu, H.F.; Chin, S.C. Enhanced ductility and toughness of desert sand engineered cementitious composites. Buildings 2023, 13, 1538. [Google Scholar] [CrossRef]
- Algin, Z.; Ozen, M. The properties of chopped basalt fibre reinforced self-compacting concrete. Constr. Build. Mater. 2018, 186, 678–685. [Google Scholar] [CrossRef]
- Shoaib, S.; El-Hassan, H.; El-Maaddawy, T. Properties and tensile softening laws of hybrid basalt fiber reinforced recycled aggregate concrete. Buildings 2023, 13, 975. [Google Scholar] [CrossRef]
- Zhou, H.; Jia, B.; Huang, H.; Mou, Y.L. Experimental study on basic mechanical properties of basalt fiber reinforced concrete. Materials 2020, 13, 1362. [Google Scholar] [CrossRef] [PubMed]
- Wang, L.; Yang, H.Q.; Zhou, S.H.; Chen, E.; Tang, S.W. Mechanical properties, long-term hydration heat, shinkage behavior and crack resistance of dam concrete designed with low heat portland (lhp) cement and fly ash. Constr. Build. Mater. 2018, 187, 1073–1091. [Google Scholar] [CrossRef]
- Nguyen, L.K.; Nguyen, T.T.T.; Nguyen, S.T.; Ngo, T.Q.; Le, T.-H.; Dang, V.Q.; Ho, L.S. Mechanical properties and service life analysis of high strength concrete using different silica fume contents in marine environment in vietnam. J. Eng. Res. 2023, 12, 44–53. [Google Scholar] [CrossRef]
- Wang, S.N.; Chen, F.Y.; Xue, Q.P.; Zhang, P. Splitting tensile strength of cement soil reinforced with basalt fibers. Materials 2020, 13, 3110. [Google Scholar] [CrossRef] [PubMed]
- Mizan, M.H.; Ueda, T.; Matsumoto, K. Enhancement of the concrete-pcm interfacial bonding strength using silica fume. Constr. Build. Mater. 2020, 259, 119774. [Google Scholar] [CrossRef]
- Wan, Z.M.; He, T.S.; Chang, N.; Yang, R.H.; Qiu, H.P. Effect of silica fume on shrinkage of cement-based materials mixed with alkali accelerator and alkali-free accelerator. J. Mater. Res. Technol. 2023, 22, 825–837. [Google Scholar] [CrossRef]
- Zhang, D.S.; Han, P.F.; Yang, Q.N.; Mao, M.J. Shrinkage effects of using fly ash instead of fine aggregate in concrete mixtures. Adv. Mater. Sci. Eng. 2020, 2020, 11. [Google Scholar] [CrossRef]
- Wang, D.X.; Wang, H.W.; Larsson, S.; Benzerzour, M.; Maherzi, W.; Amar, M. Effect of basalt fiber inclusion on the mechanical properties and microstructure of cement-solidified kaolinite. Constr. Build. Mater. 2020, 241, 118085. [Google Scholar] [CrossRef]
- Kim, S.; Lee, Y.; Plank, J.; Moon, J. Fundamental discrepancy of chemical reactivity of tricalcium oxy silicate (alite), dicalcium silicate (belite), and their polymorphs: A density functional theory study. Int. J. Concr. Struct. Mater. 2022, 16, 46. [Google Scholar] [CrossRef]
- Zhu, Z.W.; Liu, C.Q.; Mao, L.; Han, Z.X.; Chen, L.W.; Zou, H.J.; Li, L.H.; Yu, P.F.; Dong, J.L.; Zhang, Y.G. Study on the effect of activated coal gangue on the mechanical and hydration properties of cement. Front. Mater. 2023, 10, 1186055. [Google Scholar] [CrossRef]
- Weise, K.; Endell, L.M.; Ukrainczyk, N.; Koenders, E. Pozzolanic metakaolin reactivity: Time-dependent influence of calcium hydroxide, alkali hydroxides, and sulfates. Constr. Build. Mater. 2024, 431, 136534. [Google Scholar] [CrossRef]
- Jiang, T.; Jin, Y. Phase analysis of alkali-activated slag hybridized with low-calcium and high-calcium fly ash. Sustainability 2022, 14, 3767. [Google Scholar] [CrossRef]
- Chen, H.M.; Xie, C.Y.; Fu, C.; Liu, J.; Wei, X.L.; Wu, D.K. Orthogonal analysis on mechanical properties of basalt–polypropylene fiber mortar. Materials 2020, 13, 2937. [Google Scholar] [CrossRef]
- Guo, J.L.; Yuan, K.; Xu, J.J.; Wang, Y.; Gan, D.; He, M.S. The workability and mechanical performance of fly ash cenosphere–desert sand ceramsite concrete: An experimental study and analysis. Materials 2023, 16, 1298. [Google Scholar] [CrossRef] [PubMed]
- Li, Y.; Zhang, H.; Liu, G.; Hu, D.; Ma, X. Multi-scale study on mechanical property and strength prediction of aeolian sand concrete. Constr. Build. Mater. 2020, 247, 118538. [Google Scholar] [CrossRef]
- Zou, Y.X.; Shen, X.D.; Zuo, X.B.; Xue, H.J.; Li, G.F. Experimental study on microstructure evolution of aeolian sand concrete under the coupling freeze-thaw cycles and carbonation. Eur. J. Environ. Civ. Eng. 2022, 26, 1267–1282. [Google Scholar] [CrossRef]
- Shen, X.; Zou, Y.; Xue, H.; Li, G. Effect of aeolian sand content on durability of concrete under freezing-thawing-carbonization coupling. Trans. Chin. Soc. Agric. Eng. 2019, 35, 161–167. [Google Scholar]

| Chemical Composition/% | Specific Surface Area/(m2/kg) | ||||||||
|---|---|---|---|---|---|---|---|---|---|
| SiO2 | CaO | Al2O3 | MgO | SO3 | Na2O | K2O | Fe2O3 | Others | |
| 19.94 | 62.40 | 5.26 | 3.78 | 3.00 | 0.13 | 1.00 | 2.98 | 1.51 | 348 |
| SiO2 | Al2O3 | Fe2O3 | Na2O | CaO | K2O | MnO | FeO | TiO2 | P2O5 | MnO |
|---|---|---|---|---|---|---|---|---|---|---|
| 67.1% | 17.9% | 1.35% | 4.94% | 4.22% | 3.48% | 0.84% | 0.06% | 0.02% | 0.05% | 0.04% |
| Hierarchy | Fineness (%) | Ignition Loss (%) | Water Demand Ratio (%) | Moisture Content (%) | Specific Surface Area/(m2/kg) |
|---|---|---|---|---|---|
| Ⅰ class | 7.7 | 2.1 | 94 | 0.3 | 384 |
| SiO2(%) | Scorch Reduction (%) | Specific Surface Area (m2/g) | Chloride Ion (%) |
|---|---|---|---|
| 96.2 | 3.92 | 19.1 | 0.07 |
| Fiber Type | Length (mm) | Diameter (μm) | Density (g/cm3) | Breaking Elongation (%) | Drawing Strength (MPa) | Elasticity Modulus (GPa) |
|---|---|---|---|---|---|---|
| Basalt fiber | 18 | 15 | 2.65 | 2.8 | 4000 | 105 |
| Test Number | Cement | Water | Fine Aggregate | Coarse Aggregate | Water Reducing Agent | FA | SF | DS | BF |
|---|---|---|---|---|---|---|---|---|---|
| C0 | 451.29 | 176 | 621.38 | 1201.34 | 4.52 | 0 | 0 | 0 | 0 |
| FA-1 | 406.16 | 176 | 621.38 | 1201.34 | 4.52 | 45.13 | 0 | 0 | 0 |
| FA-2 | 361.03 | 176 | 621.38 | 1201.34 | 4.52 | 90.26 | 0 | 0 | 0 |
| FA-3 | 315.90 | 176 | 621.38 | 1201.34 | 4.52 | 135.39 | 0 | 0 | 0 |
| SF-1 | 428.73 | 176 | 621.38 | 1201.34 | 4.52 | 0 | 22.56 | 0 | 0 |
| SF-2 | 406.16 | 176 | 621.38 | 1201.34 | 4.52 | 0 | 45.13 | 0 | 0 |
| SF-3 | 383.60 | 176 | 621.38 | 1201.34 | 4.52 | 0 | 67.69 | 0 | 0 |
| DS-1 | 451.29 | 176 | 497.10 | 1201.34 | 4.52 | 0 | 0 | 124.28 | 0 |
| DS-2 | 451.29 | 176 | 372.83 | 1201.34 | 4.52 | 0 | 0 | 248.55 | 0 |
| DS-3 | 451.29 | 176 | 248.55 | 1201.34 | 4.52 | 0 | 0 | 372.83 | 0 |
| BF-1 | 451.29 | 176 | 621.38 | 1201.34 | 4.52 | 0 | 0 | 0 | 1.33 |
| BF-2 | 451.29 | 176 | 621.38 | 1201.34 | 4.52 | 0 | 0 | 0 | 2.65 |
| BF-3 | 451.29 | 176 | 621.38 | 1201.34 | 4.52 | 0 | 0 | 0 | 3.98 |
| Level | Factor | |||
|---|---|---|---|---|
| FA Content A/wt% | SF Content B/wt% | DSRR C/wt% | BF Content D/vol% | |
| 1 | 5 | 7.5 | 30 | 0.025 |
| 2 | 10 | 10 | 40 | 0.05 |
| 3 | 15 | 12.5 | 50 | 0.075 |
| Test Number | Cement | Water | Fine Aggregate | Coarse Aggregate | Water-Reducing Agent | FA | SF | DS | BF |
|---|---|---|---|---|---|---|---|---|---|
| 1# | 394.88 | 176 | 434.96 | 1201.34 | 10.38 | 22.56 | 33.85 | 186.41 | 0.66 |
| 2# | 383.60 | 176 | 310.69 | 1201.34 | 10.38 | 22.56 | 45.13 | 310.69 | 1.33 |
| 3# | 372.31 | 176 | 372.83 | 1201.34 | 10.38 | 22.56 | 56.41 | 248.55 | 1.99 |
| 4# | 372.31 | 176 | 310.69 | 1201.34 | 10.38 | 45.13 | 33.85 | 310.69 | 1.99 |
| 5# | 361.03 | 176 | 372.83 | 1201.34 | 10.38 | 45.13 | 45.13 | 248.55 | 0.66 |
| 6# | 349.75 | 176 | 434.96 | 1201.34 | 10.38 | 45.13 | 56.41 | 186.41 | 1.33 |
| 7# | 349.75 | 176 | 372.83 | 1201.34 | 10.38 | 67.69 | 33.85 | 248.55 | 1.33 |
| 8# | 338.47 | 176 | 434.96 | 1201.34 | 10.38 | 67.69 | 45.13 | 186.41 | 1.99 |
| 9# | 327.19 | 176 | 310.69 | 1201.34 | 10.38 | 67.69 | 56.41 | 310.69 | 0.66 |
| Test Number | Compressive Strength/MPa | Splitting Tensile Strength/MPa | Abrasion Resistance Strength/h (kg/m2)−1 | Abrasion Rate/kg (h·m2)−1 |
|---|---|---|---|---|
| 1# | 63.67 | 2.98 | 0.618 | 1.62 |
| 2# | 68.97 | 2.79 | 0.686 | 1.50 |
| 3# | 64.83 | 5.62 | 0.756 | 1.34 |
| 4# | 58.50 | 5.51 | 0.715 | 1.40 |
| 5# | 57.97 | 4.51 | 1.140 | 1.00 |
| 6# | 58.75 | 4.52 | 1.024 | 0.99 |
| 7# | 66.43 | 4.55 | 0.866 | 1.16 |
| 8# | 65.93 | 4.18 | 0.887 | 1.13 |
| 9# | 59.77 | 5.48 | 0.680 | 1.47 |
| Test | Index | Level | Factor | |||
|---|---|---|---|---|---|---|
| A | B | C | D | |||
| Compressive Strength/MPa | Kjm | 1 | 197.47 | 188.6 | 188.35 | 181.41 |
| 2 | 175.22 | 192.87 | 189.23 | 194.15 | ||
| 3 | 192.13 | 183.35 | 187.24 | 189.26 | ||
| kjm | 1 | 65.82 | 62.87 | 62.78 | 60.47 | |
| 2 | 58.41 | 64.29 | 63.08 | 64.72 | ||
| 3 | 64.04 | 61.12 | 62.41 | 63.09 | ||
| Optimal Level | 1 | 2 | 2 | 2 | ||
| Rj | 7.42 | 3.17 | 0.66 | 4.25 | ||
| Splitting Tensile Strength/MPa | Kjm | 1 | 11.39 | 13.04 | 11.68 | 12.97 |
| 2 | 14.54 | 11.48 | 14.68 | 11.86 | ||
| 3 | 14.21 | 15.62 | 13.78 | 15.31 | ||
| kjm | 1 | 3.80 | 4.35 | 3.89 | 4.32 | |
| 2 | 4.85 | 3.83 | 4.89 | 3.95 | ||
| 3 | 4.74 | 5.21 | 4.59 | 5.10 | ||
| Optimal Level | 2 | 3 | 2 | 3 | ||
| Rj | 1.05 | 1.38 | 1 | 1.15 | ||
| Abrasion Resistance Strength /h(kg/m2)−1 | Kjm | 1 | 2.060 | 2.199 | 2.529 | 2.438 |
| 2 | 2.879 | 2.713 | 2.762 | 2.576 | ||
| 3 | 2.433 | 2.460 | 2.081 | 2.358 | ||
| kjm | 1 | 0.687 | 0.733 | 0.843 | 0.813 | |
| 2 | 0.960 | 0.904 | 0.921 | 0.859 | ||
| 3 | 0.811 | 0.820 | 0.694 | 0.786 | ||
| Optimal Level | 2 | 2 | 2 | 2 | ||
| Rj | 0.273 | 0.171 | 0.227 | 0.073 | ||
| Abrasion Rate /kg(h·m2)−1 | Kjm | 1 | 4.46 | 4.18 | 3.74 | 4.09 |
| 2 | 3.39 | 3.63 | 3.50 | 3.65 | ||
| 3 | 3.76 | 3.80 | 4.37 | 3.87 | ||
| kjm | 1 | 1.49 | 1.39 | 1.25 | 1.36 | |
| 2 | 1.13 | 1.21 | 1.17 | 1.22 | ||
| 3 | 1.25 | 1.27 | 1.46 | 1.29 | ||
| Optimal Level | 2 | 2 | 2 | 2 | ||
| Rj | −0.36 | −0.18 | −0.29 | −0.14 | ||
| Test | Factor | Quadratic Sum | Degree of Freedom | Mean Square | F | p |
|---|---|---|---|---|---|---|
| Compressive Strength /MPa | A | 267.294 | 2 | 133.647 | 122.480 | 0.000 ** |
| B | 52.817 | 2 | 26.409 | 24.202 | 0.000 ** | |
| C | 4.984 | 2 | 2.492 | 2.284 | 0.131 | |
| D | 70.745 | 2 | 35.373 | 32.417 | 0.000 ** | |
| Splitting Tensile Strength /MPa | A | 5.497 | 2 | 2.748 | 23.257 | 0.000 ** |
| B | 8.210 | 2 | 4.105 | 34.739 | 0.000 ** | |
| C | 5.376 | 2 | 2.688 | 22.748 | 0.000 ** | |
| D | 6.182 | 2 | 3.091 | 26.158 | 0.000 ** | |
| Abrasion Resistance Strength /h(kg/m2)−1 | A | 3.290 | 2 | 1.645 | 0.757 | 0.0004 ** |
| B | 1.365 | 2 | 0.682 | 0.314 | 0.0068 ** | |
| C | 2.464 | 2 | 1.232 | 0.567 | 0.0012 ** | |
| D | 0.262 | 2 | 0.131 | 0.060 | 0.0558 | |
| Abrasion Rate /kg(h·m2)−1 | A | 0.01 | 2 | 0.00 | 19.80 | 1.67 |
| B | 0.04 | 2 | 0.02 | 77.27 | 0.04 * | |
| C | 0.02 | 2 | 0.01 | 30.18 | 0.74 | |
| D | 0.06 | 2 | 0.03 | 121.28 | 0.00 ** |
| Test Number | Compressive Strength/MPa | Splitting Tensile Strength/MPa | Abrasion Resistance Strength/h(kg/m2)−1 | Abrasion Rate/kg(h·m2)−1 |
|---|---|---|---|---|
| C0 | 65.6 | 4.32 | 0.533 | 1.876 |
| DSC-1 | 65.93 | 6.01 | 1.135 | 0.96 |
Disclaimer/Publisher’s Note: The statements, opinions and data contained in all publications are solely those of the individual author(s) and contributor(s) and not of MDPI and/or the editor(s). MDPI and/or the editor(s) disclaim responsibility for any injury to people or property resulting from any ideas, methods, instructions or products referred to in the content. |
© 2025 by the authors. Licensee MDPI, Basel, Switzerland. This article is an open access article distributed under the terms and conditions of the Creative Commons Attribution (CC BY) license (https://creativecommons.org/licenses/by/4.0/).
Share and Cite
Cao, A.; Ma, Y.; Li, Z.; Du, X.; Li, G.; Wang, A. Study of the Influence of Desert Sand-Mineral Admixture on the Abrasion Resistance of Concrete. Materials 2025, 18, 446. https://doi.org/10.3390/ma18020446
Cao A, Ma Y, Li Z, Du X, Li G, Wang A. Study of the Influence of Desert Sand-Mineral Admixture on the Abrasion Resistance of Concrete. Materials. 2025; 18(2):446. https://doi.org/10.3390/ma18020446
Chicago/Turabian StyleCao, Aoli, Yuwei Ma, Zhiqiang Li, Xixian Du, Gang Li, and Aiqin Wang. 2025. "Study of the Influence of Desert Sand-Mineral Admixture on the Abrasion Resistance of Concrete" Materials 18, no. 2: 446. https://doi.org/10.3390/ma18020446
APA StyleCao, A., Ma, Y., Li, Z., Du, X., Li, G., & Wang, A. (2025). Study of the Influence of Desert Sand-Mineral Admixture on the Abrasion Resistance of Concrete. Materials, 18(2), 446. https://doi.org/10.3390/ma18020446