
Microstructure and Mechanical Properties of Mg-8Li-3Al-0.3Si Alloy Deformed Through a Combination of Back-Extrusion and Spinning Process


Highlights
- The combined deformation of backward extrusion and spin forming facilitates the formation of α/β laminated microstructures.
- The α/β lamellar structure alleviates stress concentration and reduces work hardening.
- The α/β lamellar structure with diffuse second phase improves softening behavior.
Abstract
1. Introduction
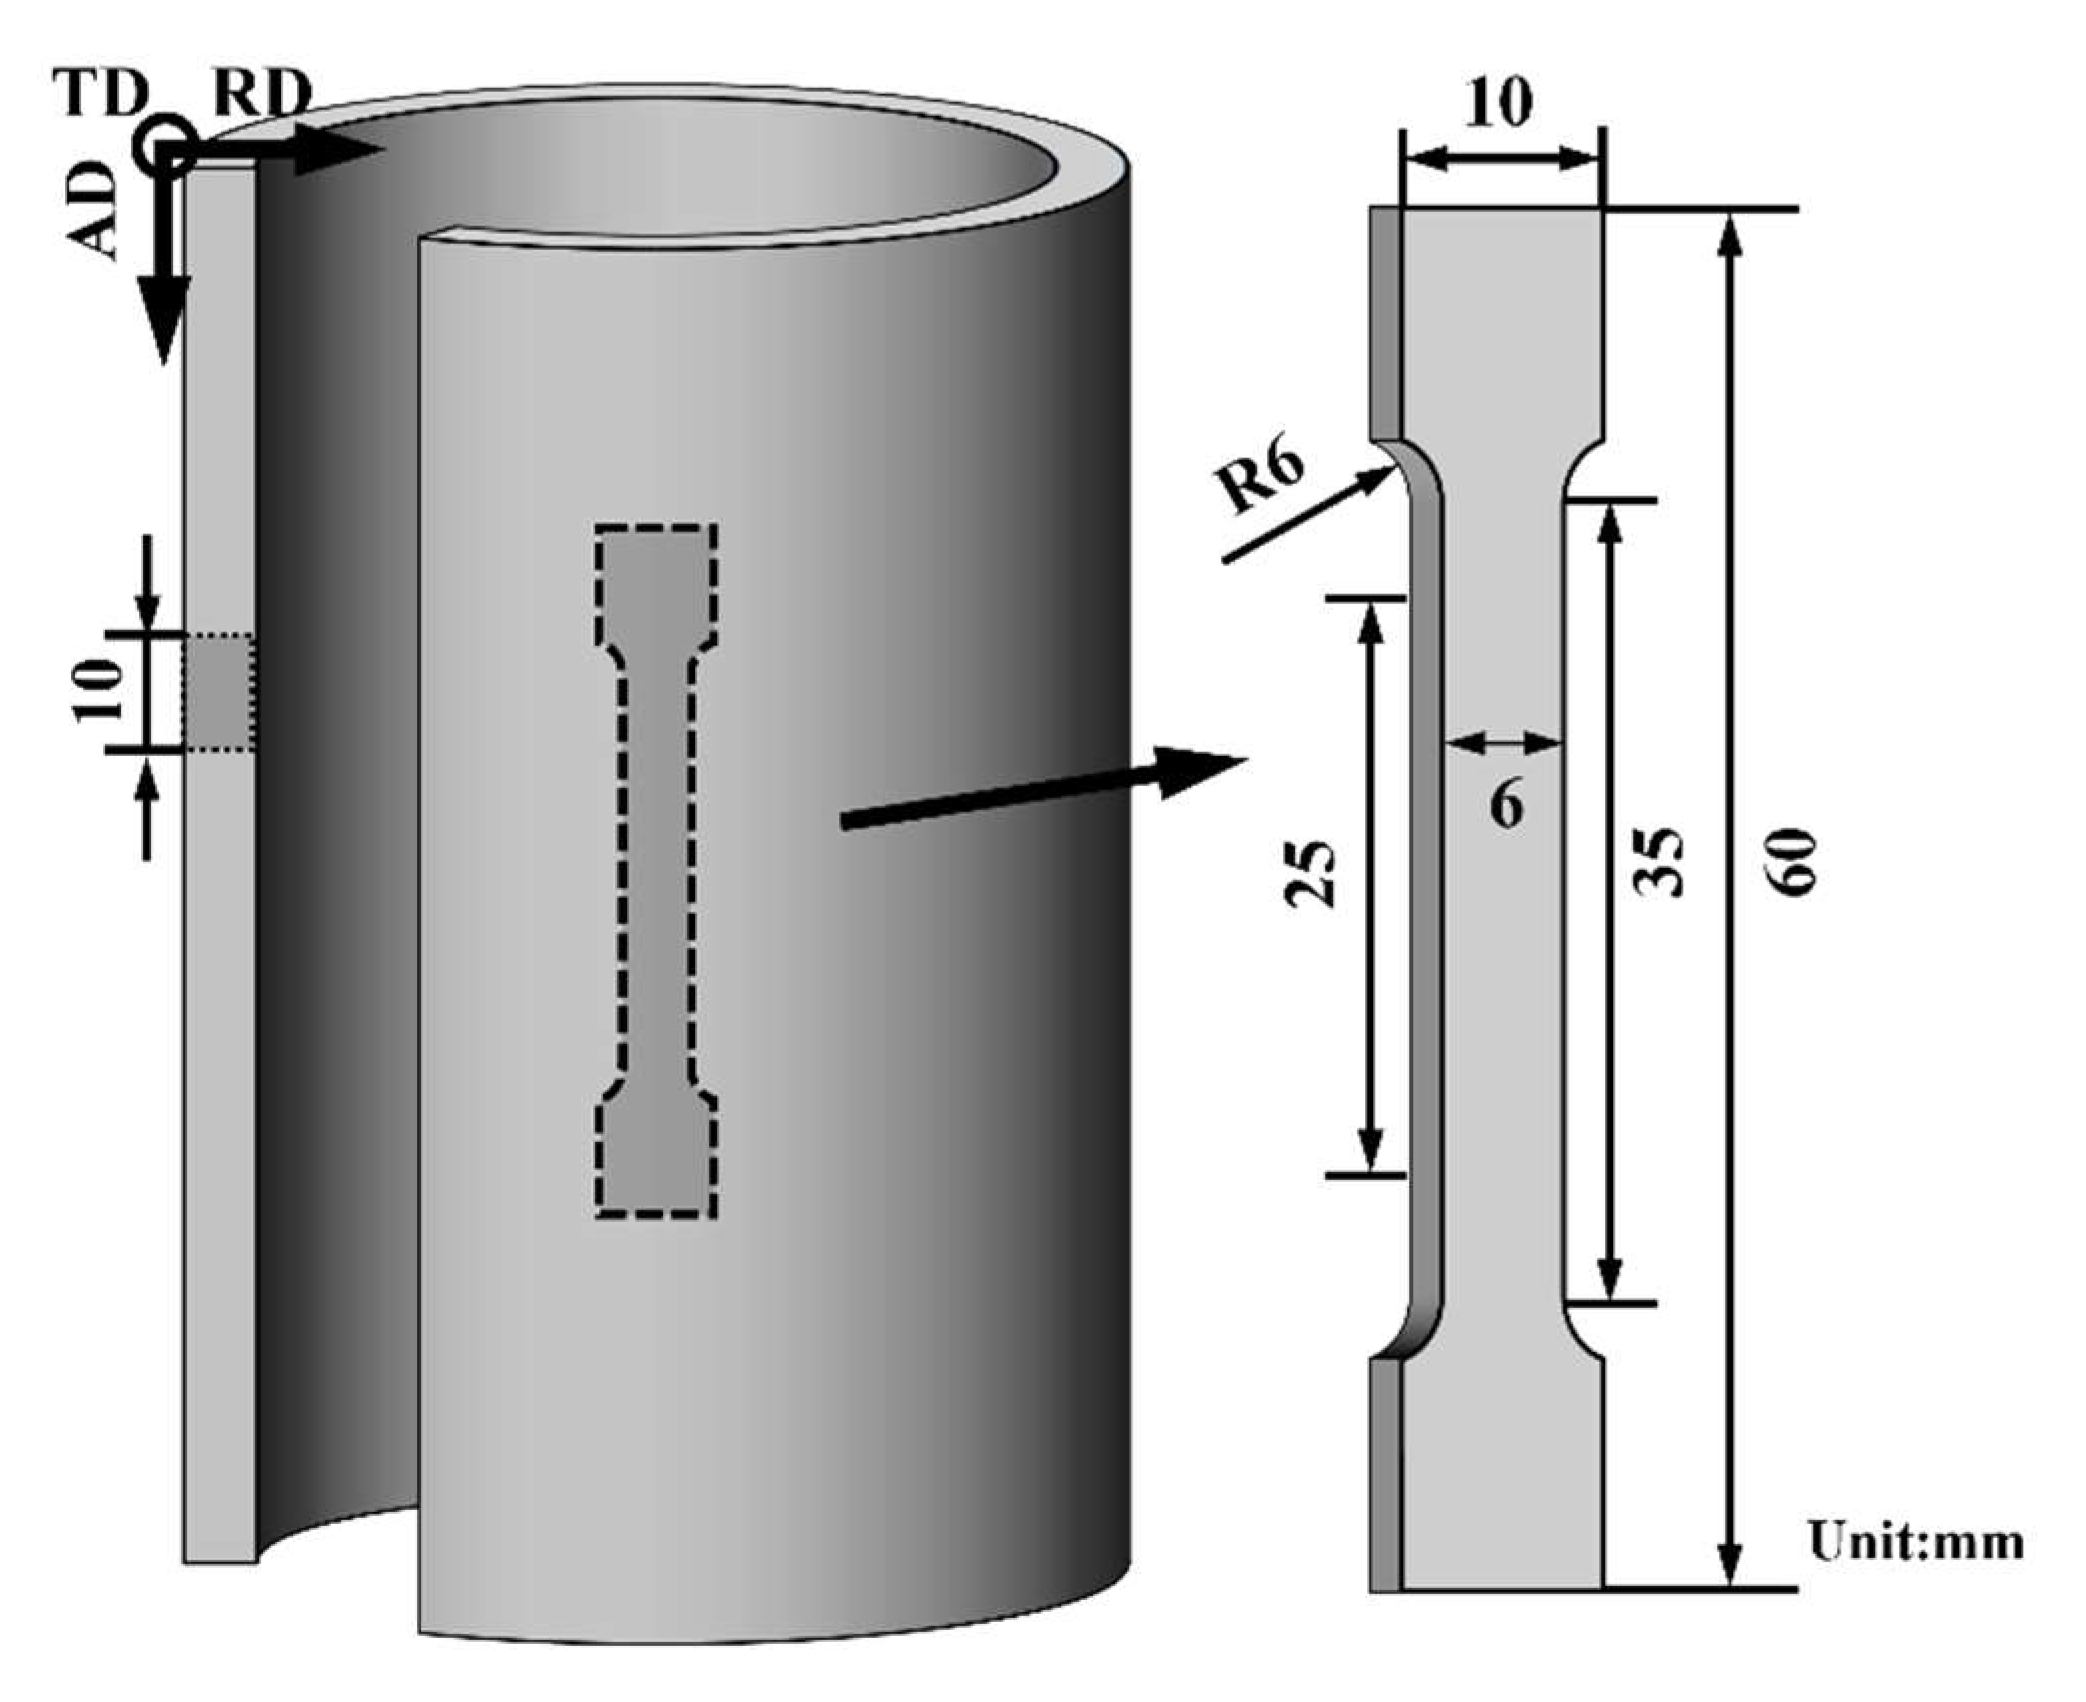
2. Experimental Procedures
3. Result
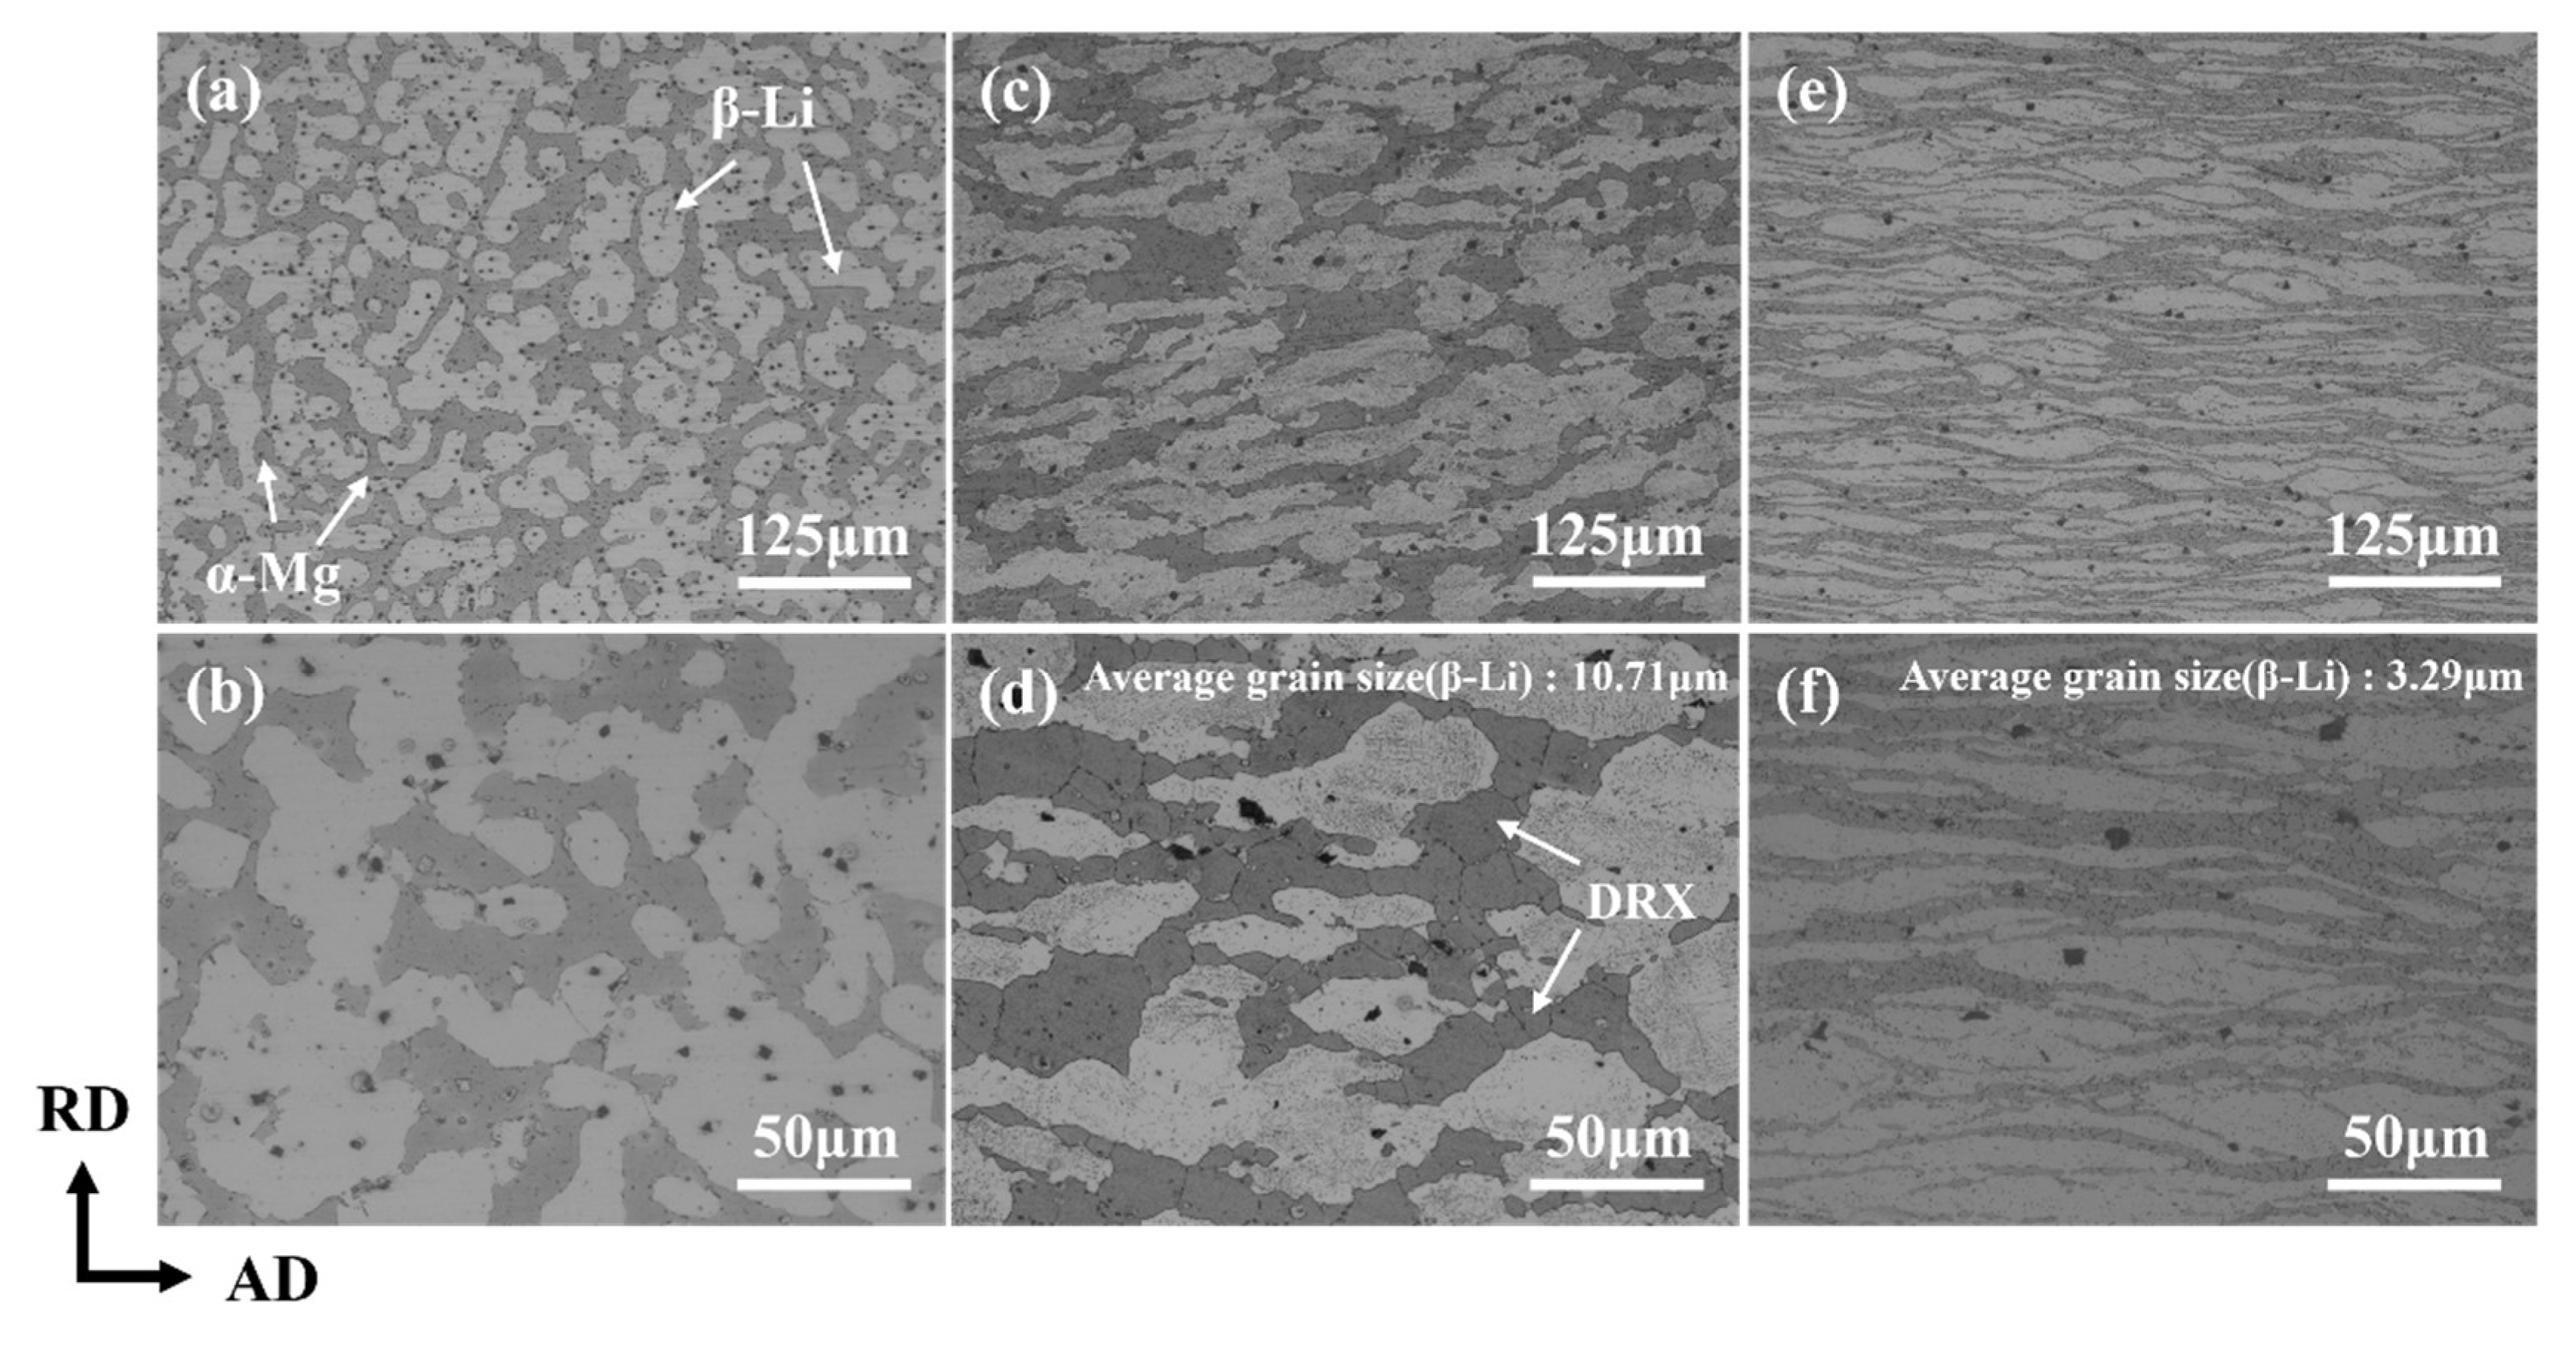
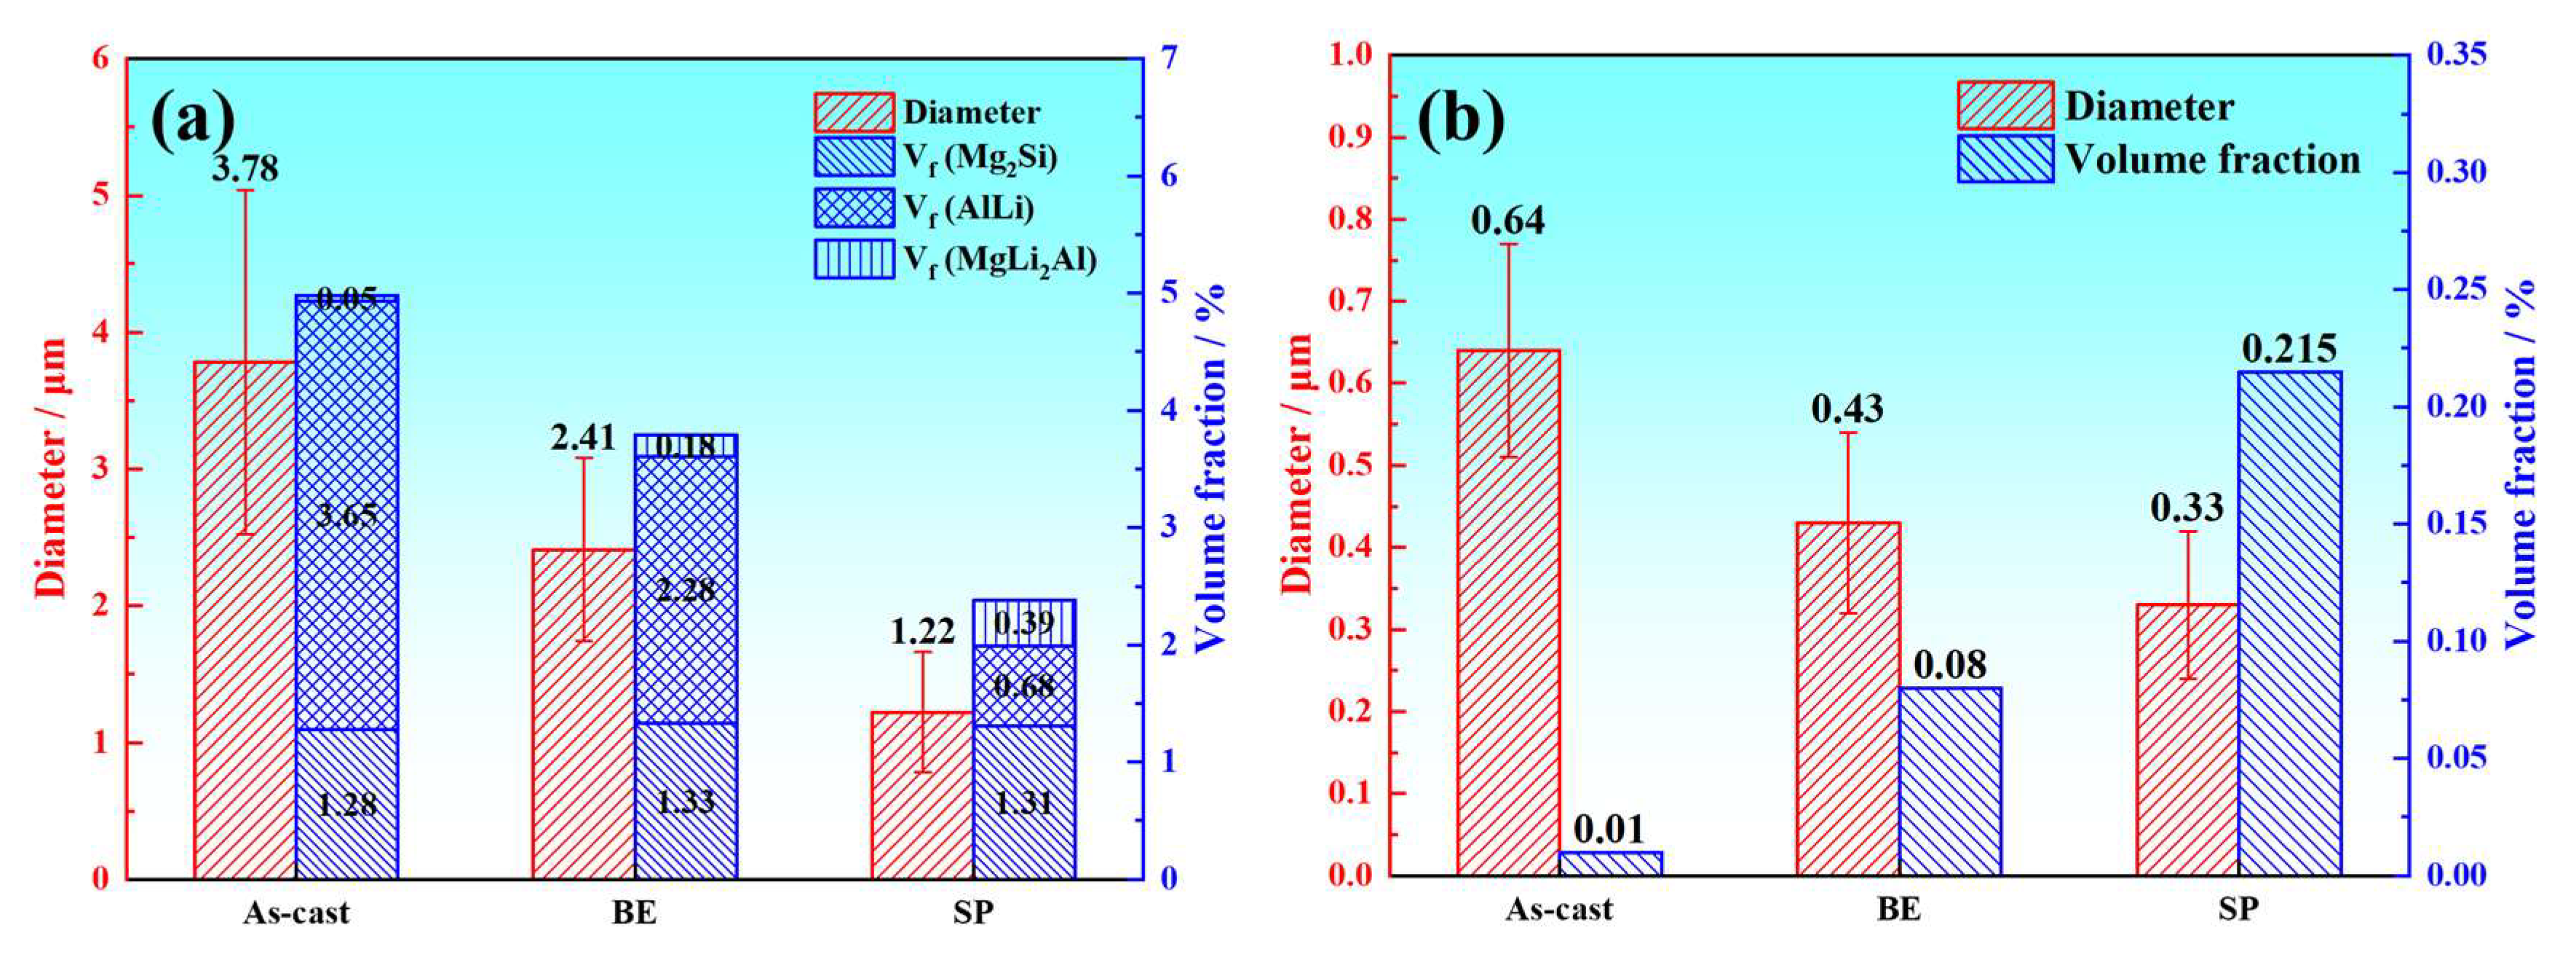
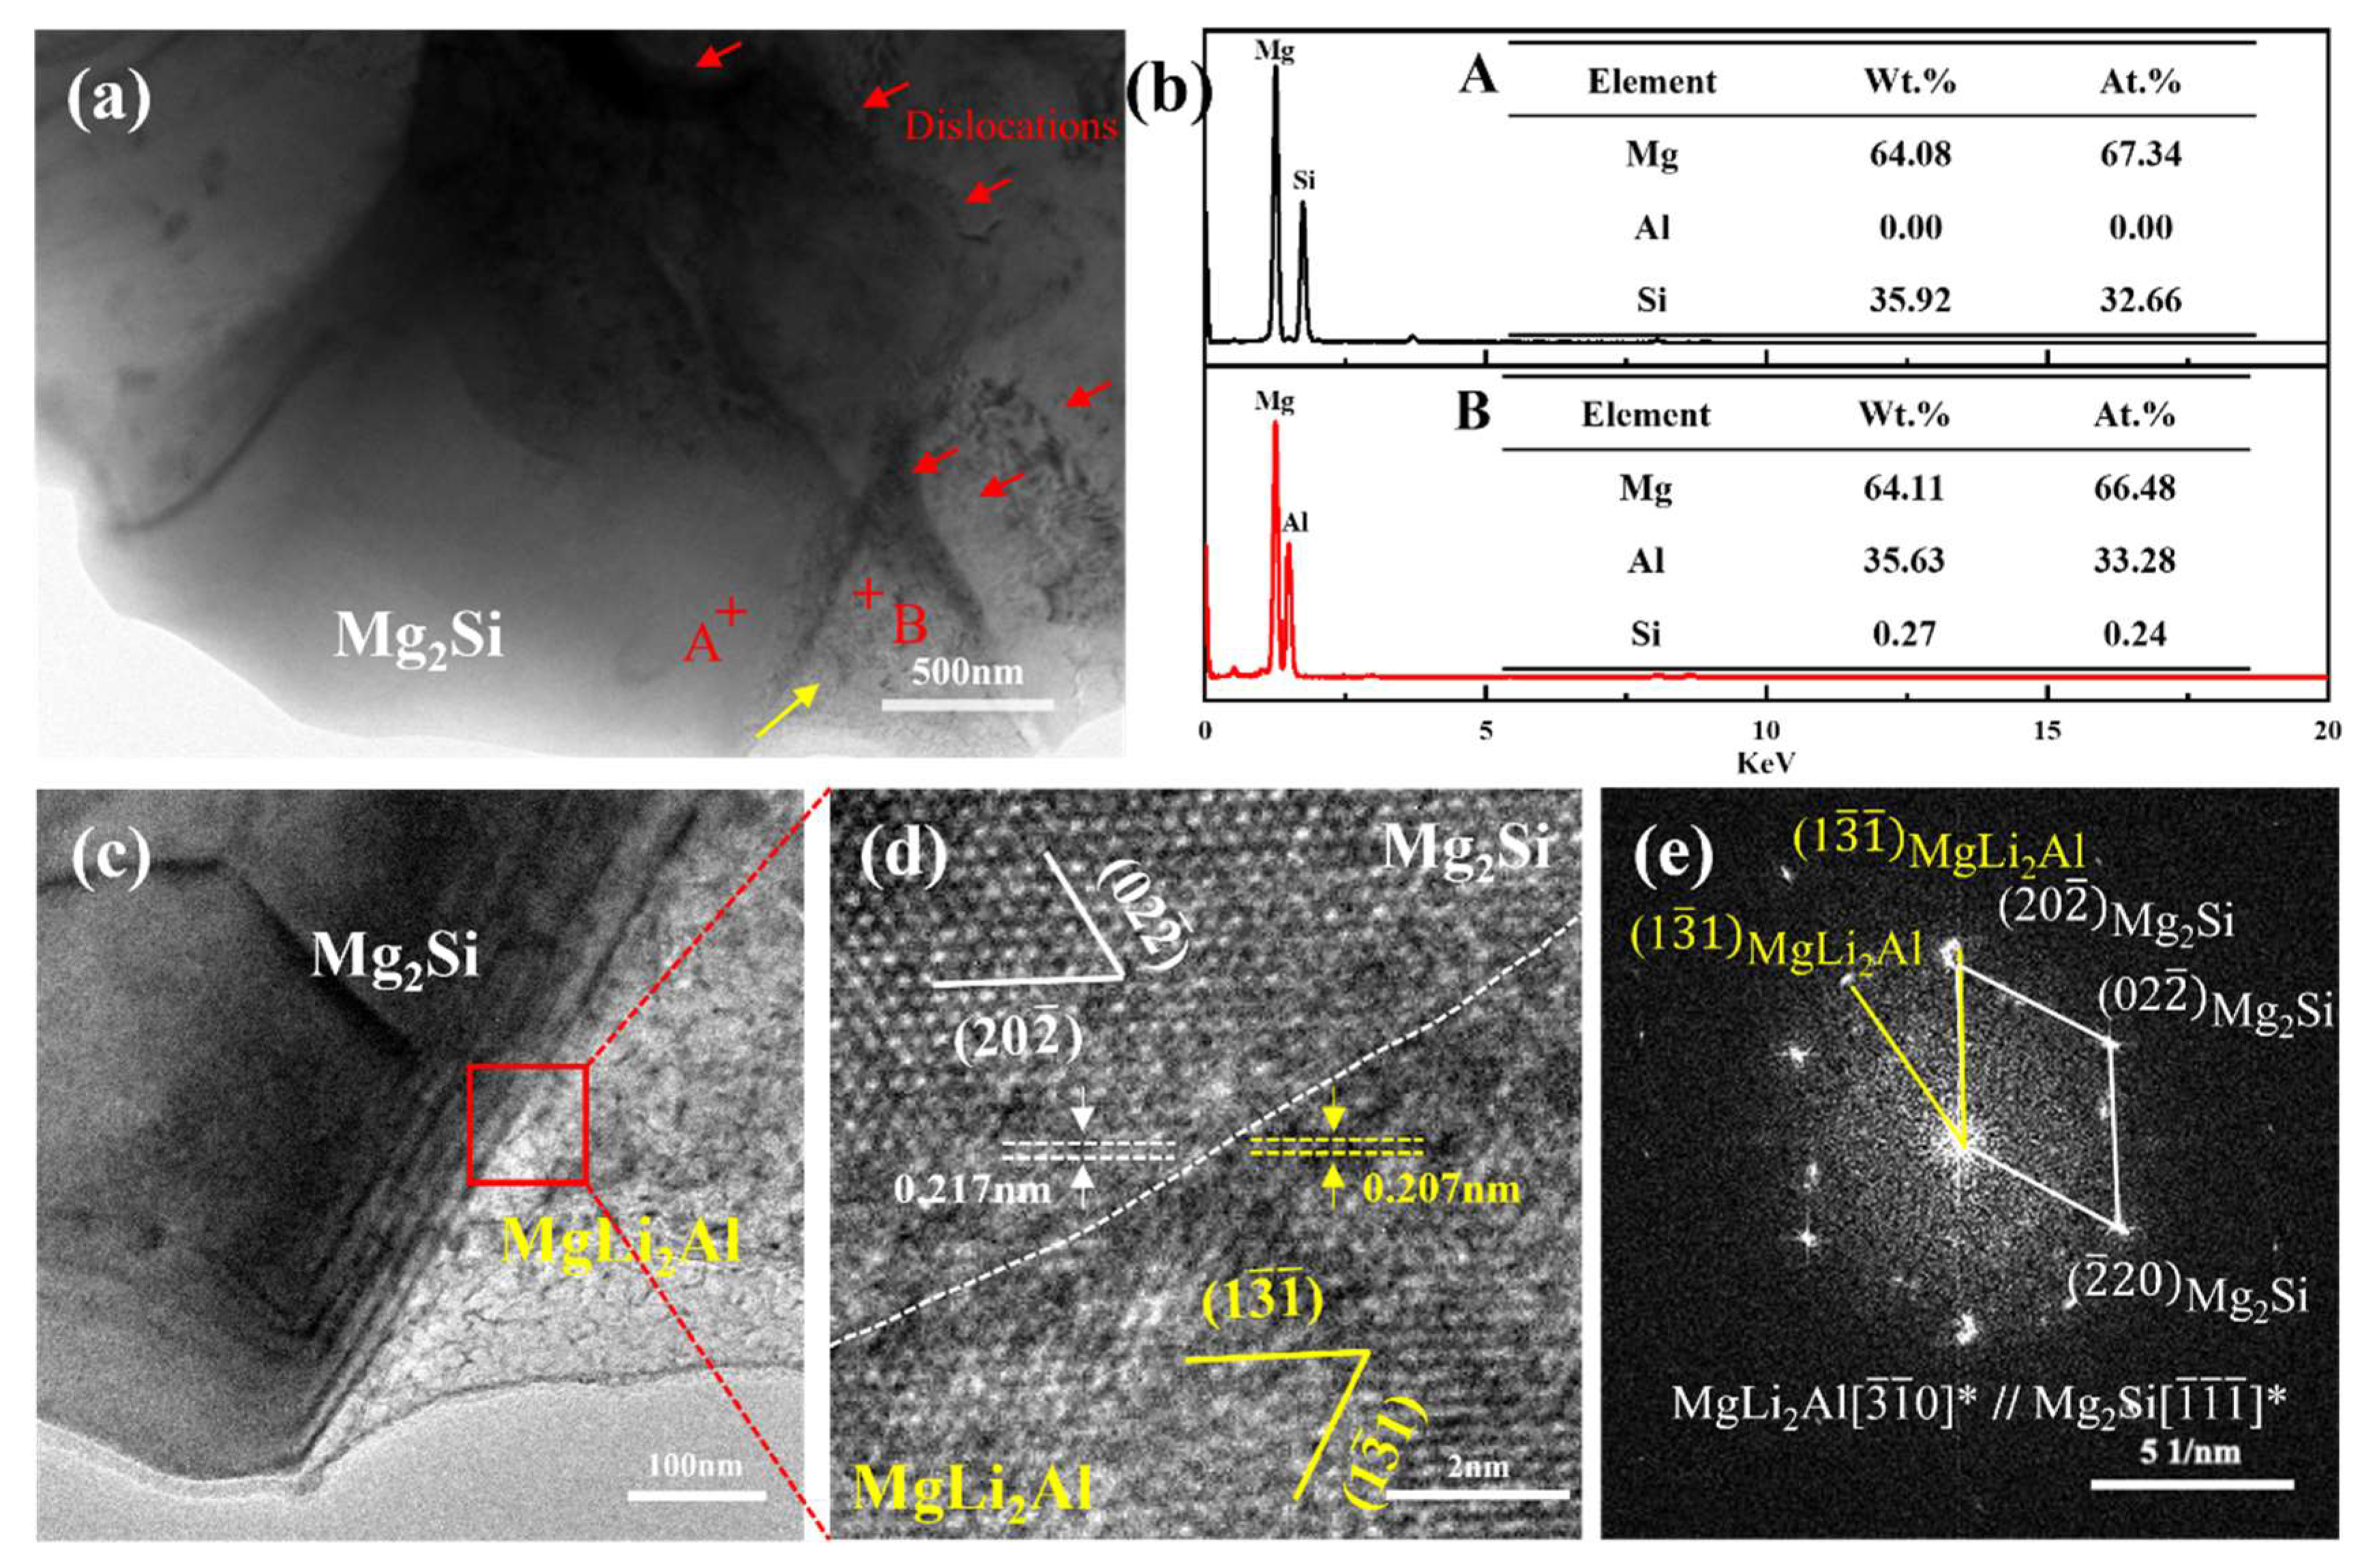
3.1. Microstructure
3.2. Mechanical Properties
3.3. Fracture Behavior
4. Discussion
4.1. Work Hardening Behavior
4.2. Work Softening Behavior
5. Conclusions
- (1)
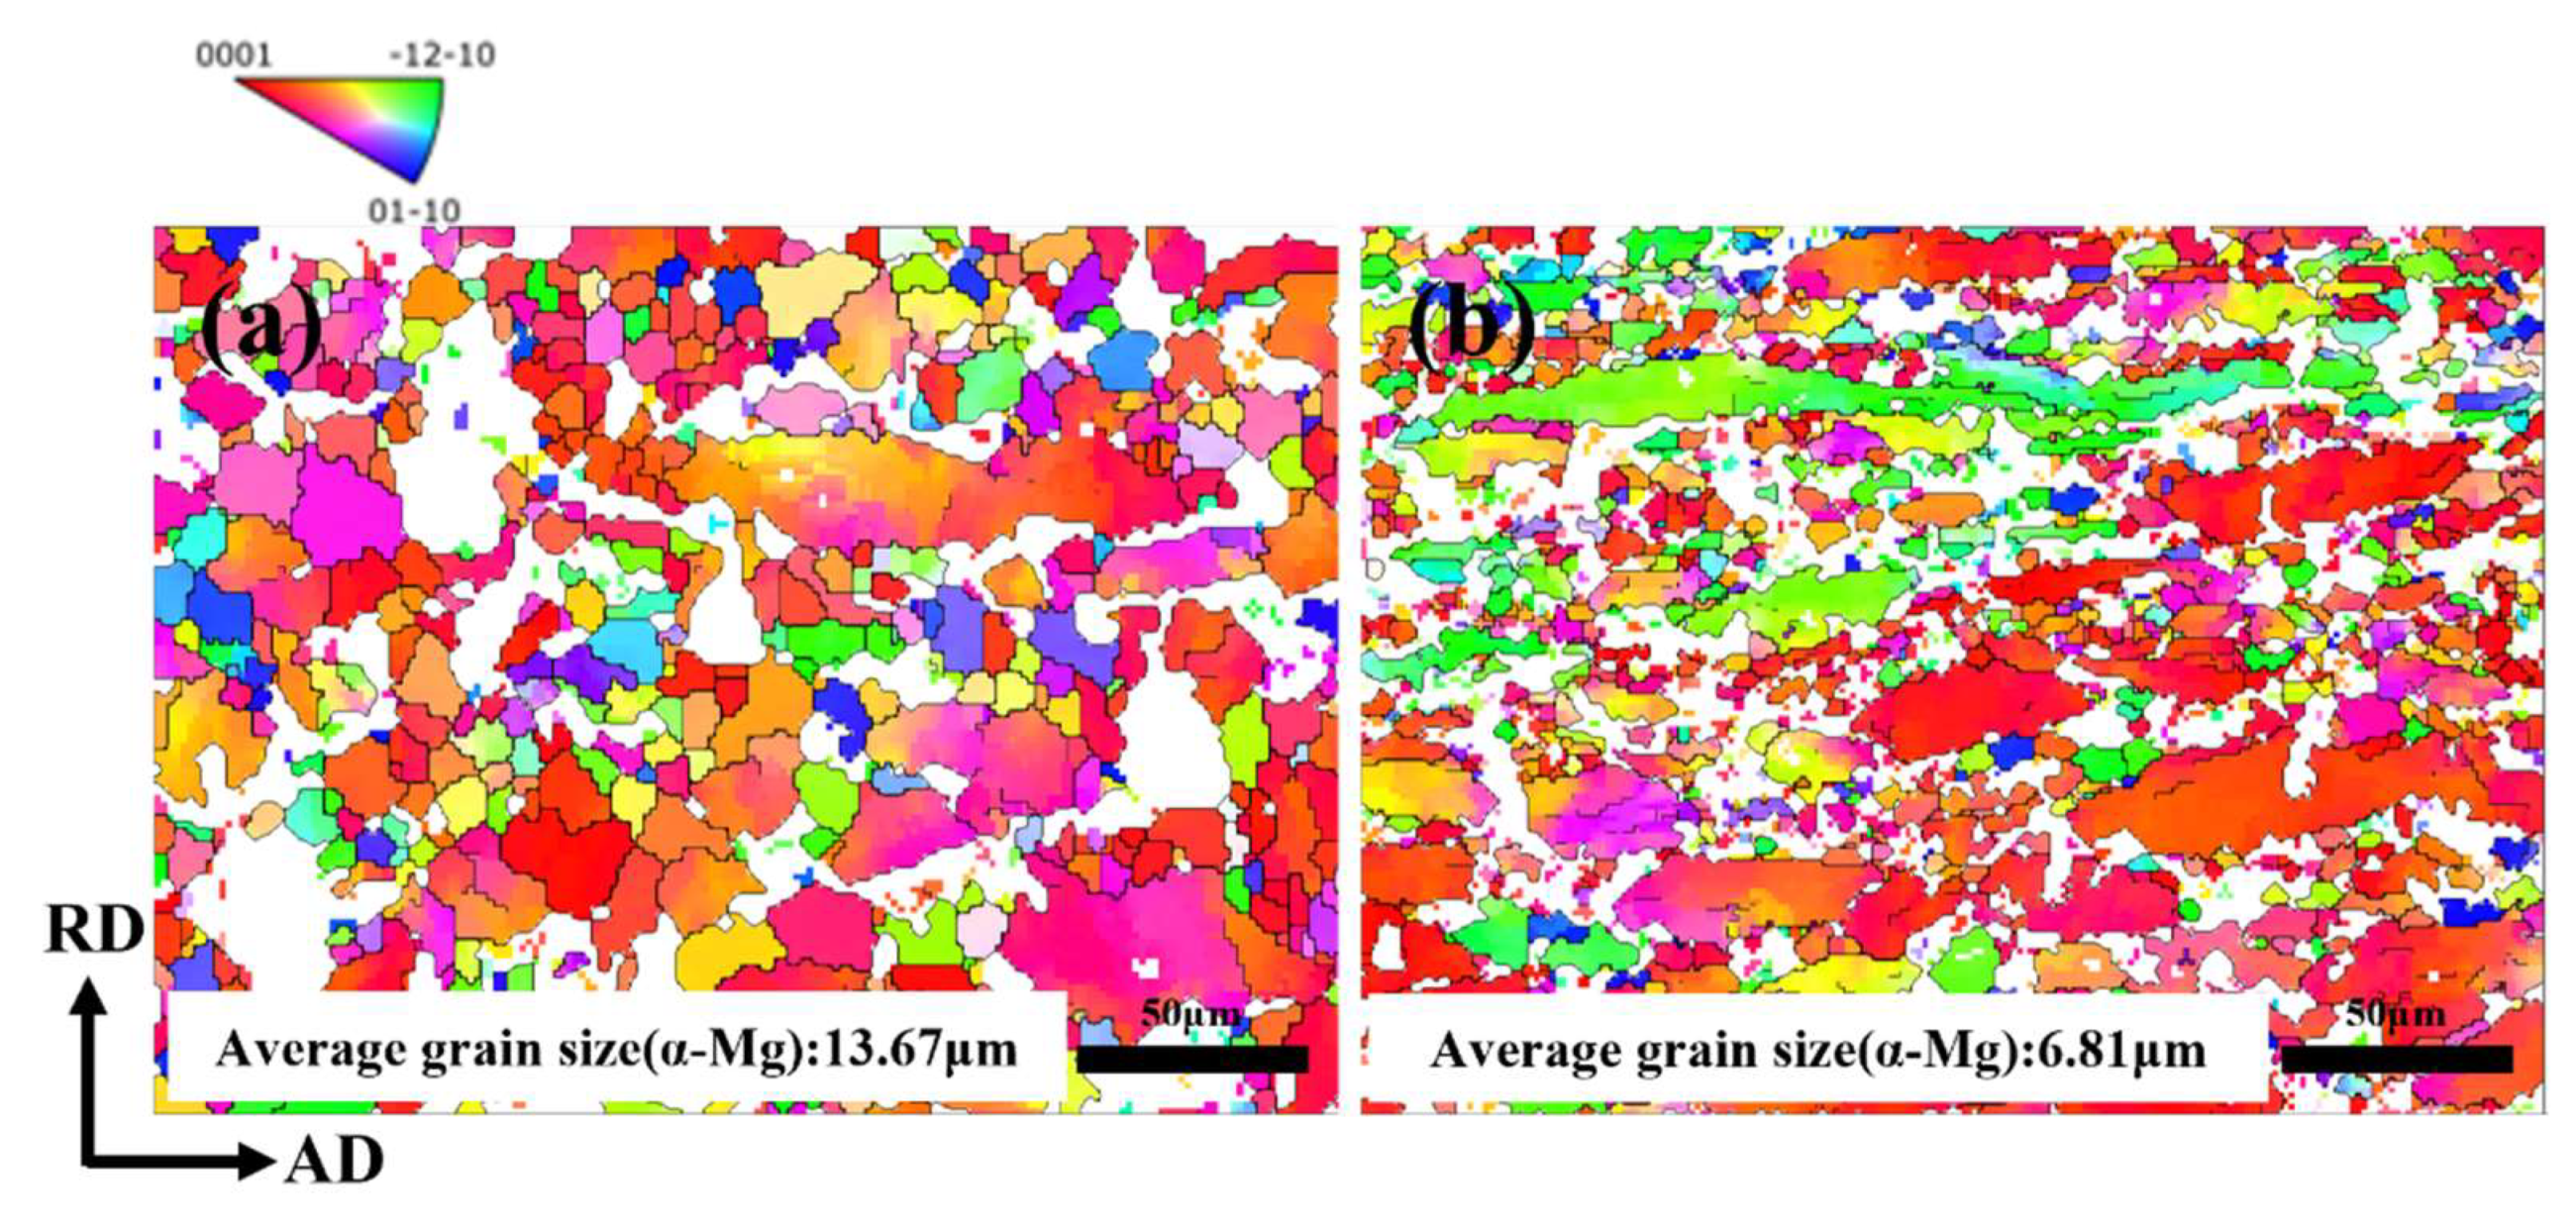
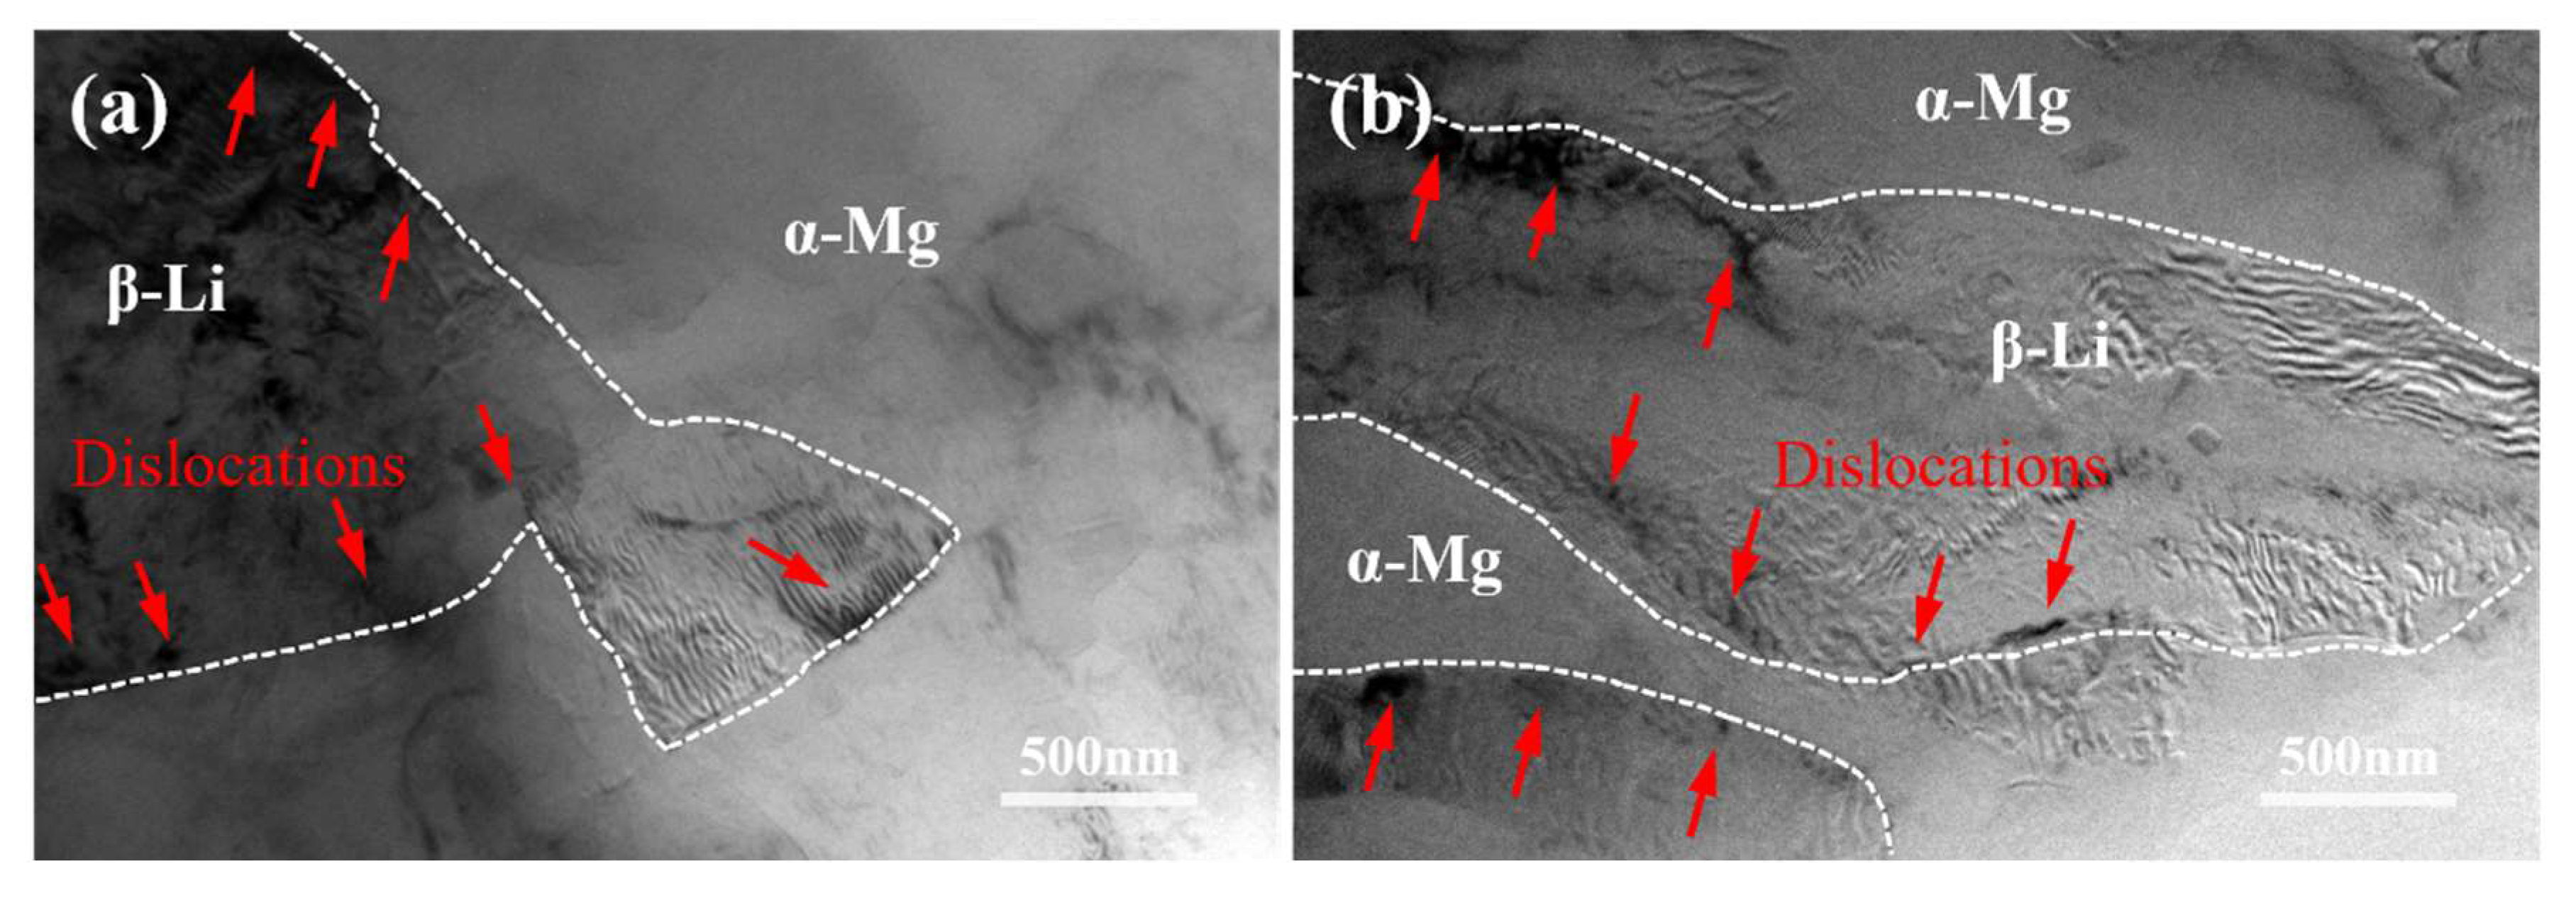
- The deformation from backward extrusion enables the LAS830 alloy to exhibit a reduction in grain size; refinement, with a decreased volume percent of the AlLi phase; and the precipitation of the MgLi2Al phase within the β-Li phase. After spinning, the α/β phases are distributed in layers, with further grain refinement and increased precipitation of the MgLi2Al phase.
- (2)
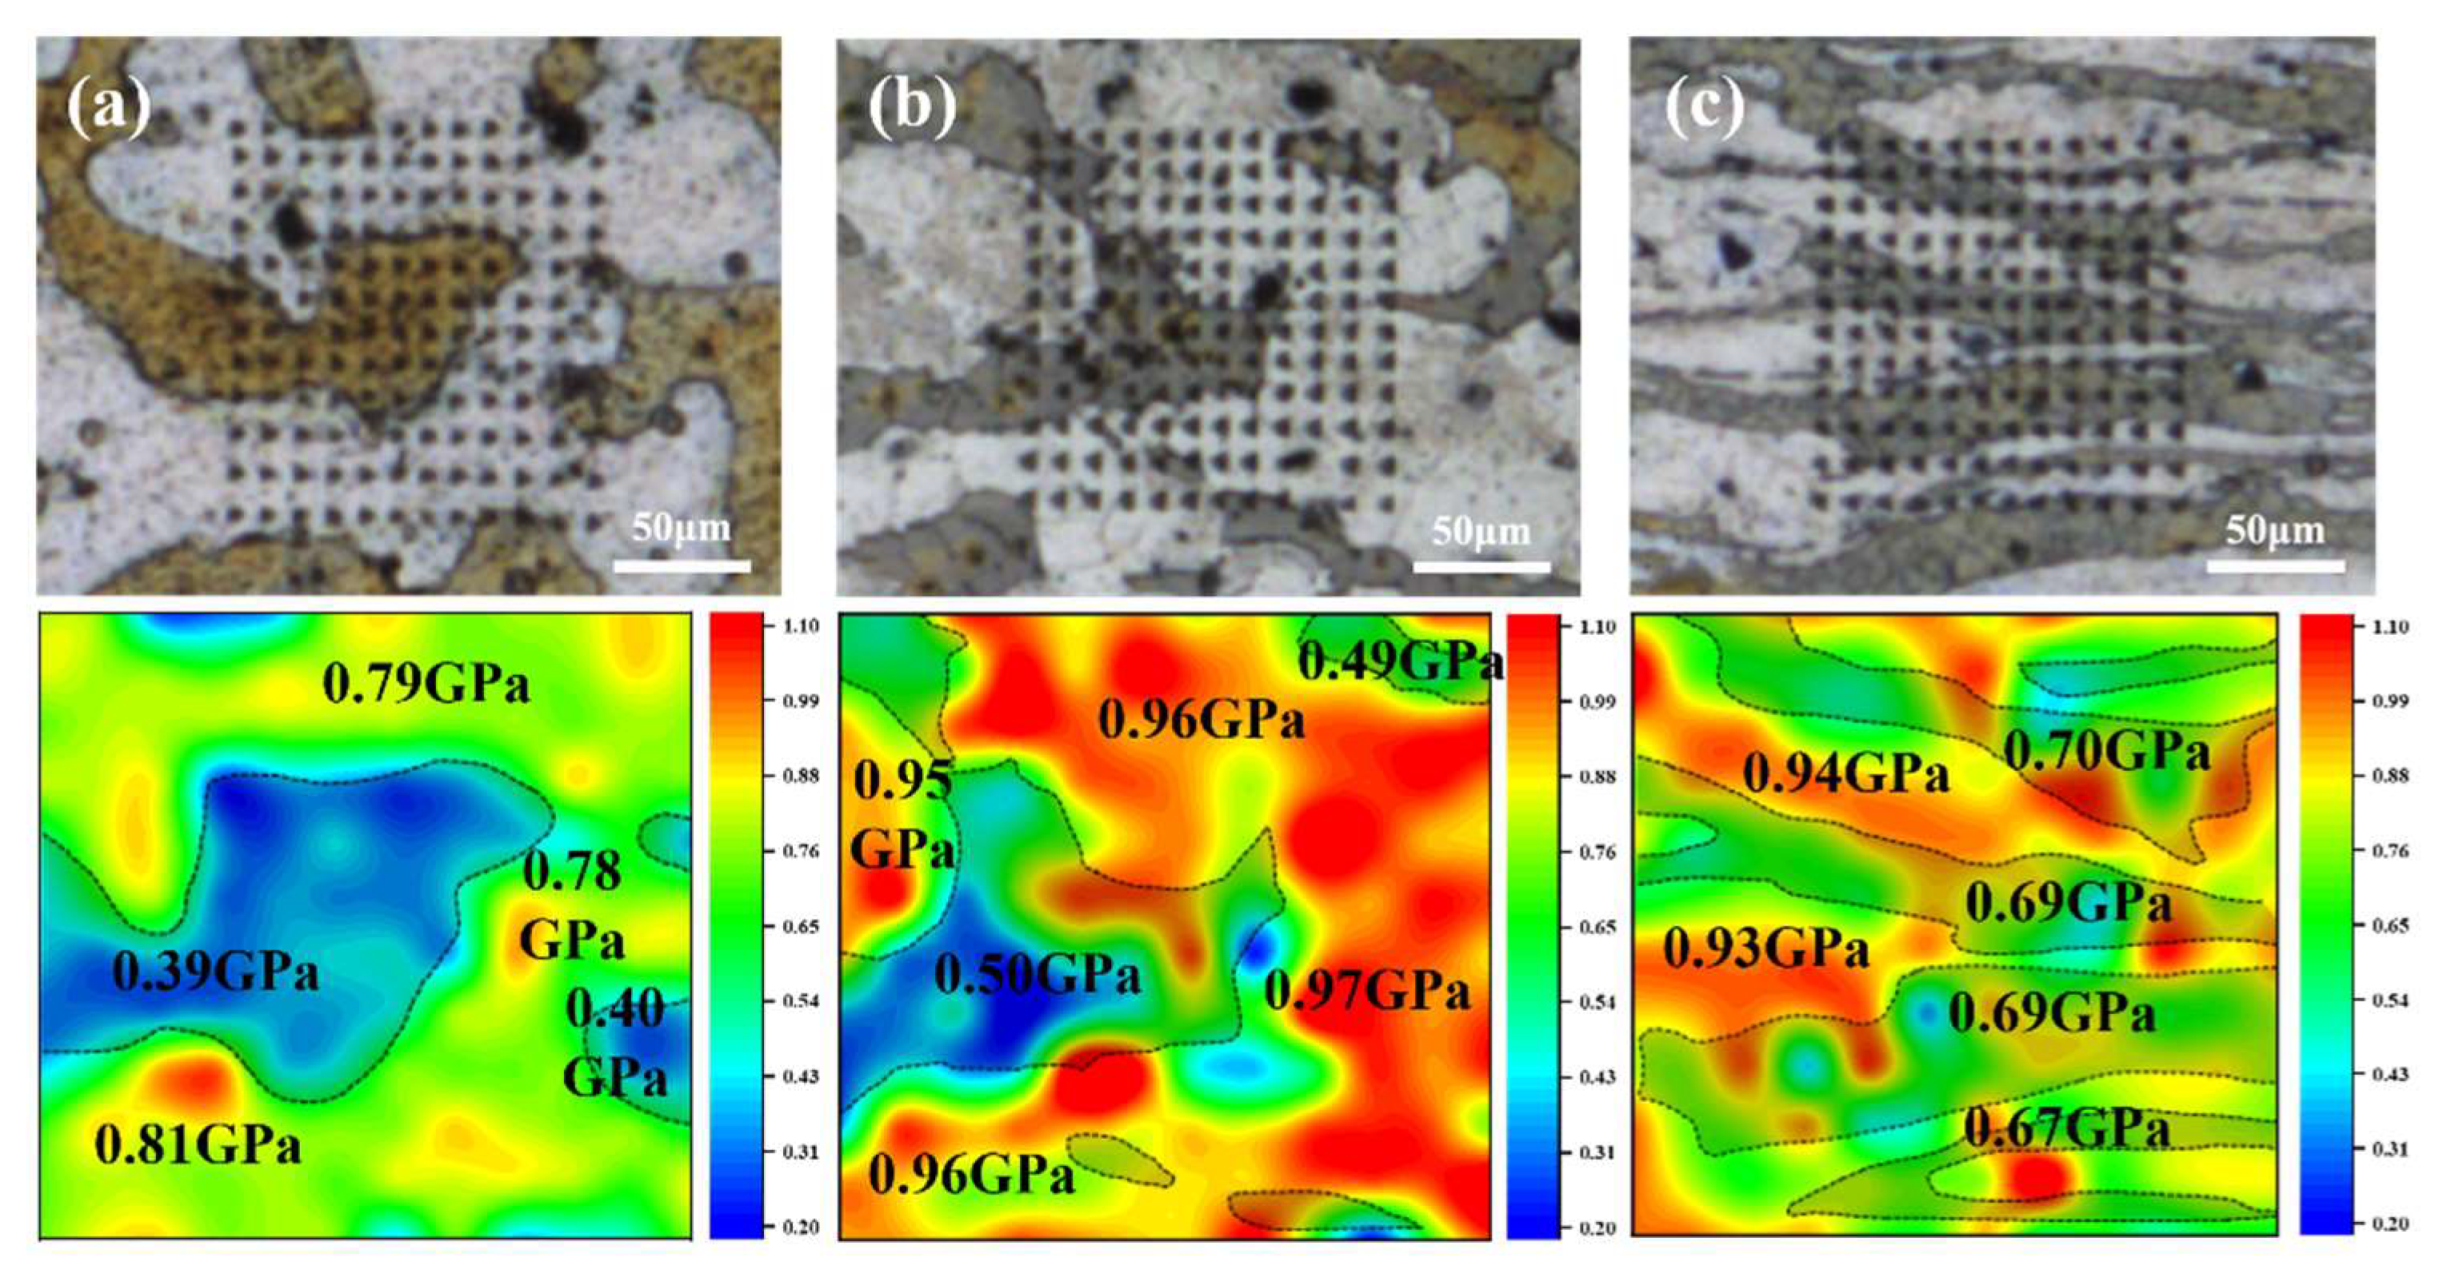
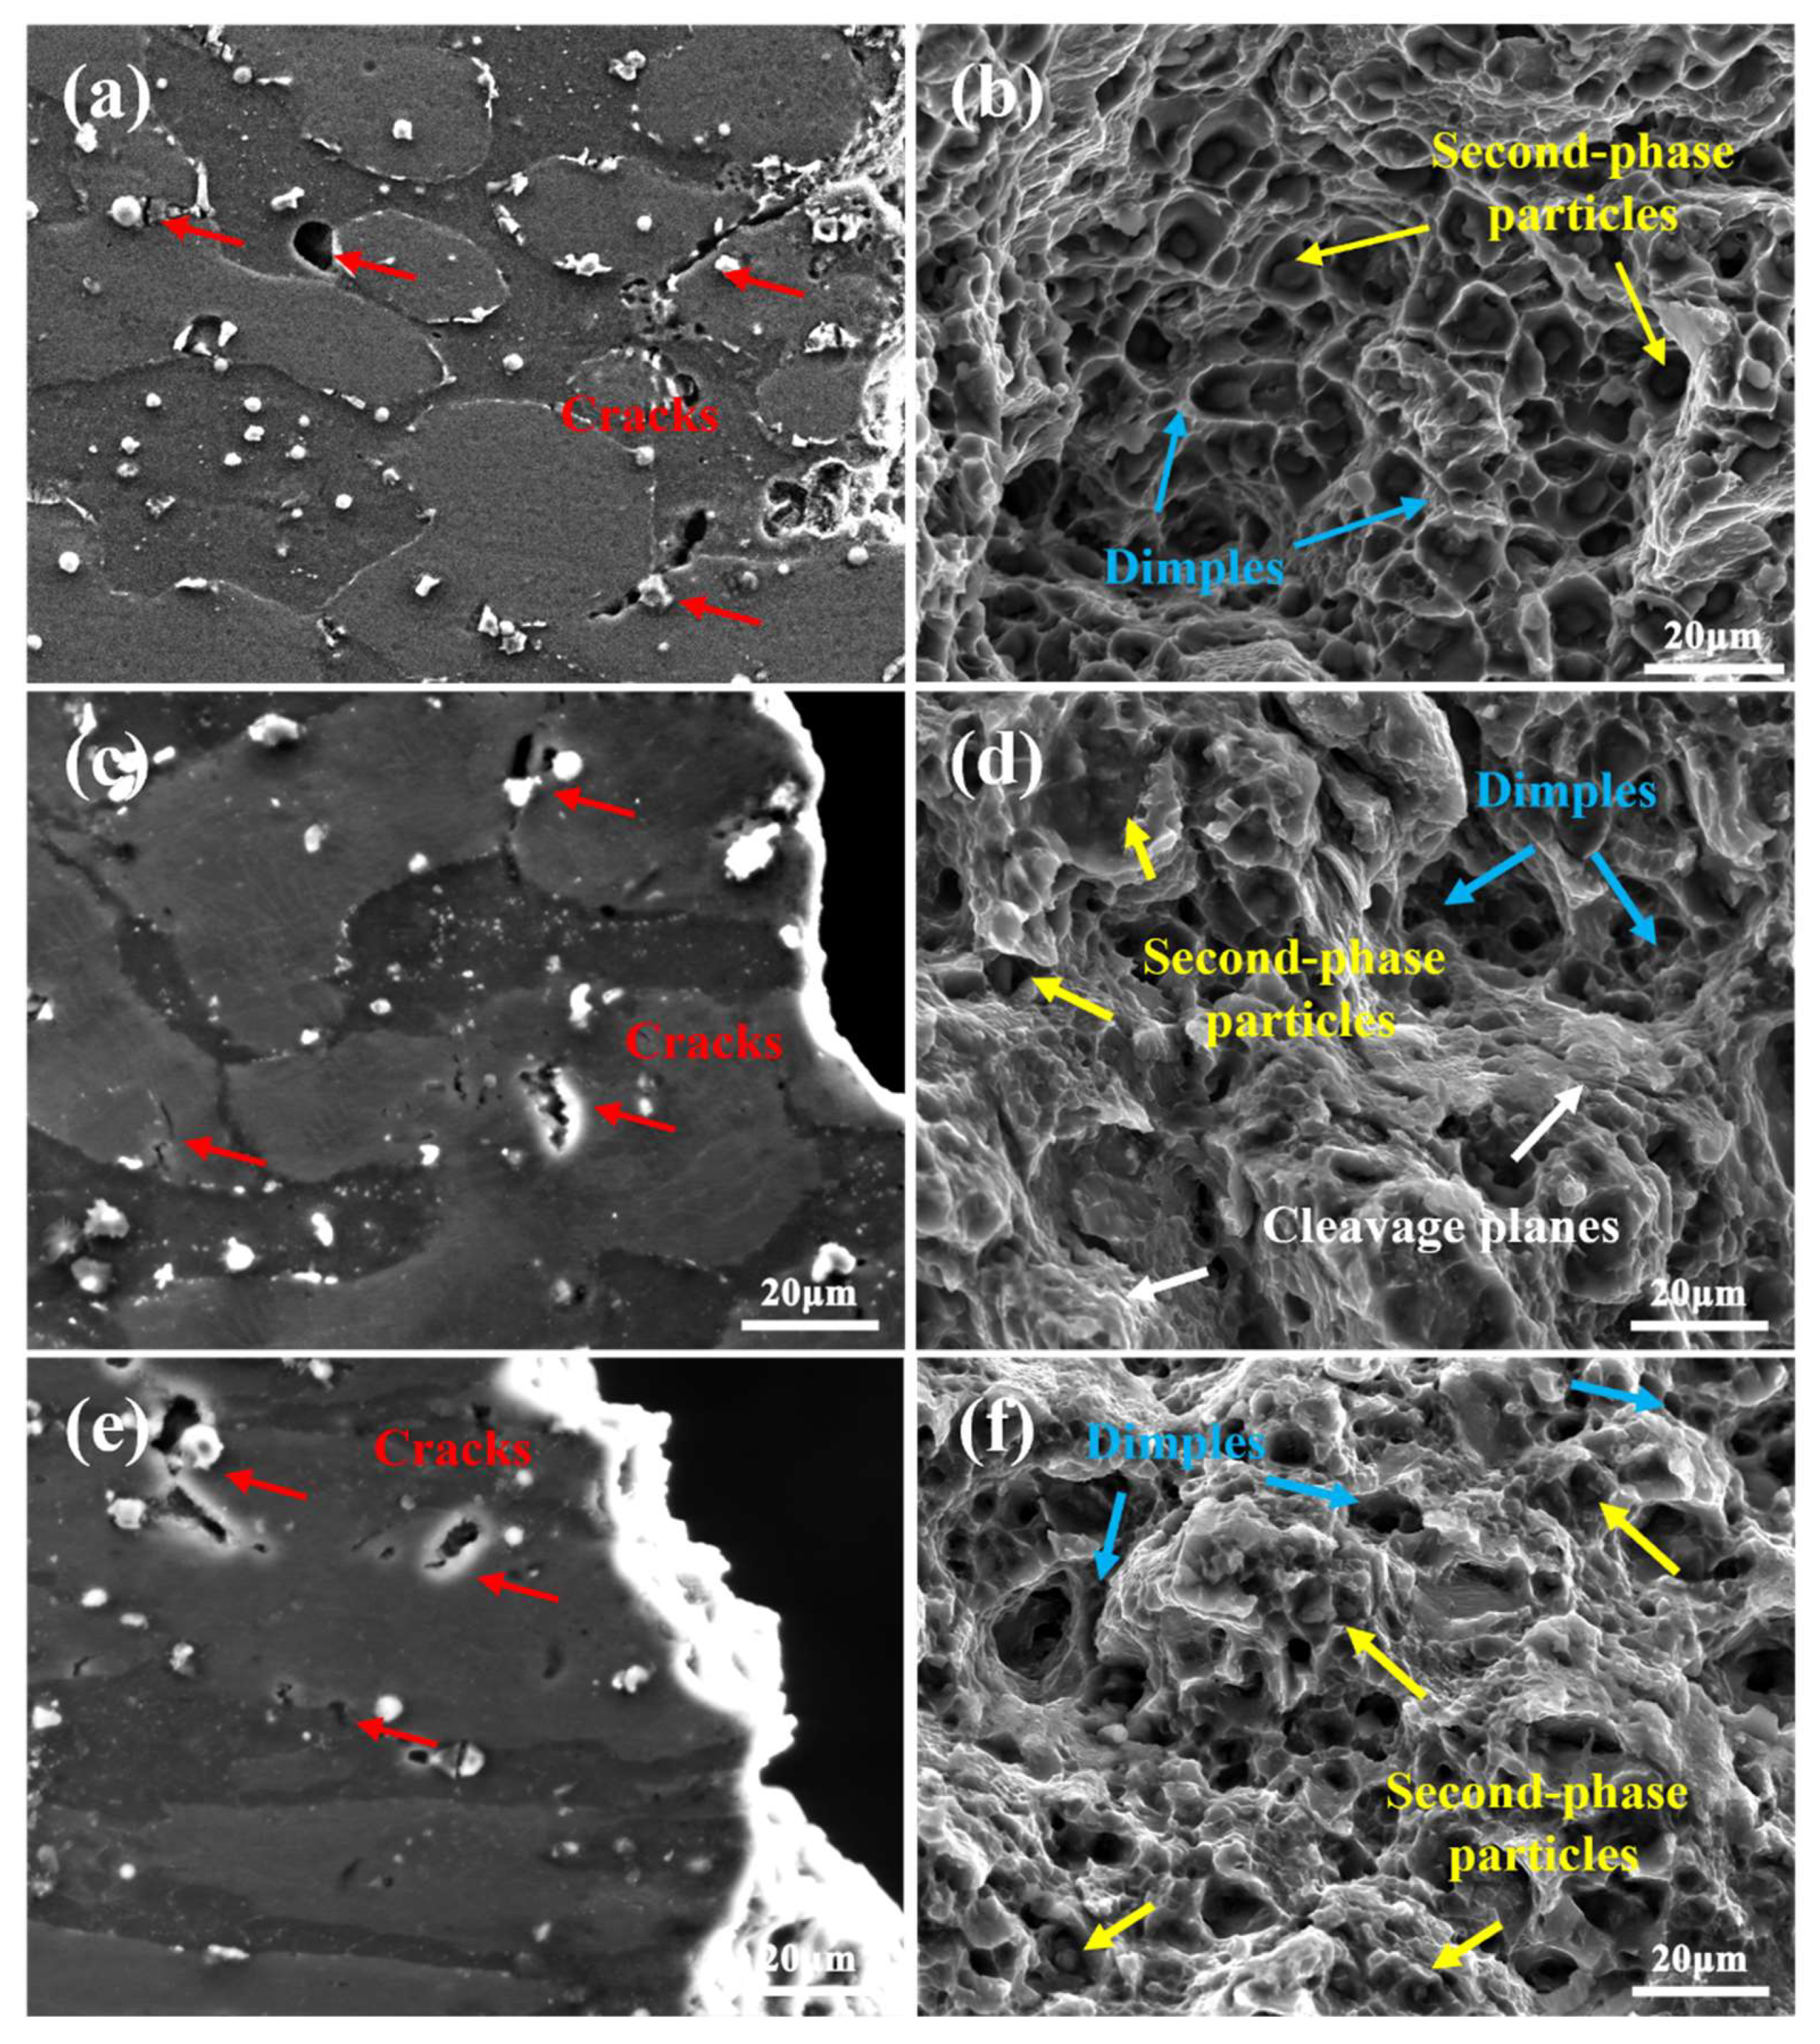
- The YS, UTS, and EL of the LAS830 alloy increased with the progress of combination deformation, reaching the ultimate values of 200.8 MPa, 235.4 MPa, and 15.74%, respectively. The higher hardness difference between the α/β phases after backward extrusion is beneficial for alleviating stress concentration. The lamellar distribution of the α/β phases and the reduction in hardness difference induced by spinning lead to crack initiation primarily within the α-Mg phase.
- (3)
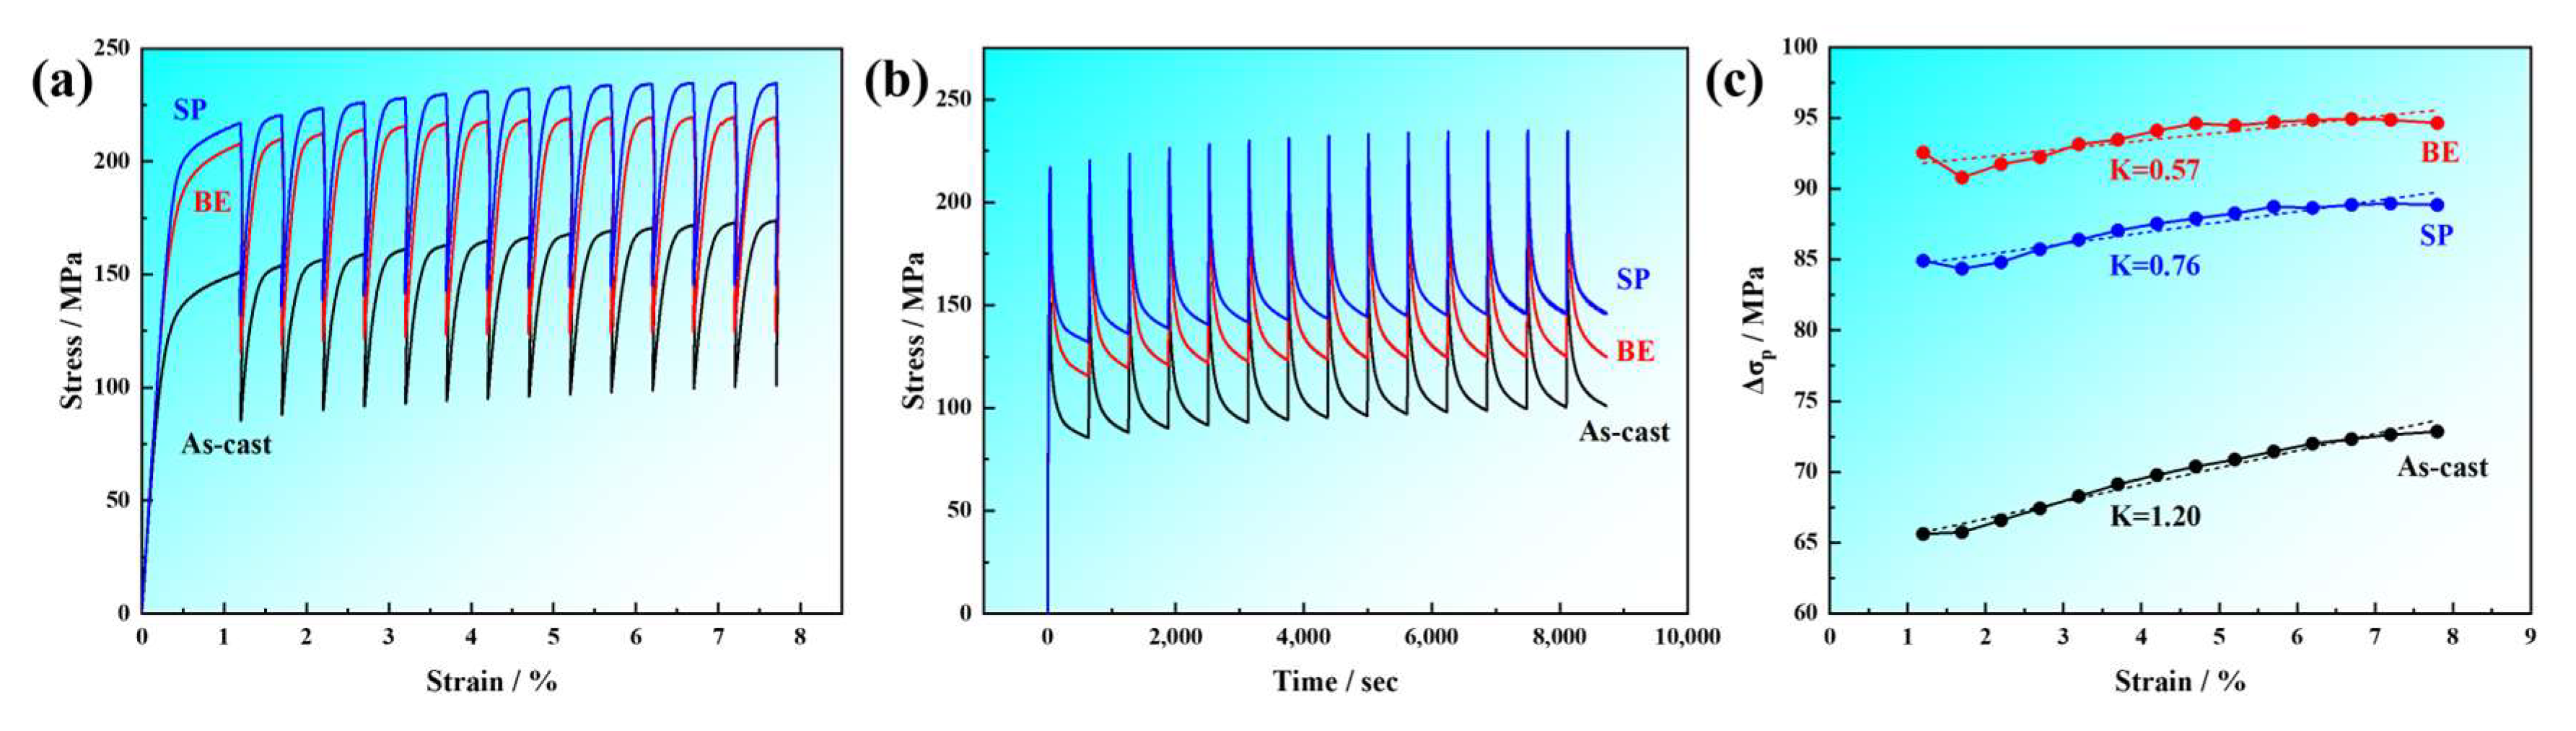
- The work hardening rate of the deformed LAS830 alloys was reduced. The spinning process decreases the work hardening rate during the dynamic recovery stage compared with the alloy after backward extrusion, due to the α/β lamellar structure, while the increased number of nanoscale precipitates enhanced the work hardening rate during the large strain hardening stage.
- (4)
- The degree of softening during stress relaxation in the combination deformation alloy increased. Spinning, due to the α/β lamellar structure and finer grains, resulted in a lower softening rate compared to the backward extruded alloy, but the softening growth rate was greater than that observed in the backward extruded alloy, influenced by higher work hardening rate and α/β lamellar distribution.
Author Contributions
Funding
Institutional Review Board Statement
Informed Consent Statement
Data Availability Statement
Acknowledgments
Conflicts of Interest
References
- Tian, G.; Wang, J.; Wang, S.; Xue, C.; Yang, X.; Su, H.; Yang, Z.; Yan, C.; Liu, X.; Dou, R. Achieving Ultra-High Stiffness by Solidifying and Precipitating Micro-Compounds in HCP/BCC Dual Matrix of a New Mg-Li Alloy. J. Alloys Compd. 2023, 964, 171324. [Google Scholar] [CrossRef]
- Wang, B.; Zhang, Y.; Deng, L.; Wang, C.; Chen, J.; Zhang, Y. An Investigation on Annealing Process and Strengthening Mechanism of Cold Rolled Mg-10Li-3Al-2.8Zn Alloy. J. Alloys Compd. 2023, 961, 171087. [Google Scholar] [CrossRef]
- Wang, B.-J.; Luan, J.-Y.; Xu, D.-K.; Sun, J.; Li, C.-Q.; Han, E.-H. Research Progress on the Corrosion Behavior of Magnesium–Lithium-Based Alloys: A Review. Acta Metall. Sin. Engl. Lett. 2019, 32, 1–9. [Google Scholar] [CrossRef]
- Peng, X.; Liu, W.; Wu, G.; Ji, H.; Ding, W. Plastic Deformation and Heat Treatment of Mg-Li Alloys: A Review. J. Mater. Sci. Technol. 2022, 99, 193–206. [Google Scholar] [CrossRef]
- Cain, T.W.; Labukas, J.P. The Development of β Phase Mg–Li Alloys for Ultralight Corrosion Resistant Applications. NPJ Mater. Degrad. 2020, 4, 17. [Google Scholar] [CrossRef]
- Chen, X.; Zhang, Y.; Cong, M.; Lu, Y.; Li, X. Effect of Sn Content on Microstructure and Tensile Properties of As-Cast and as-Extruded Mg−8Li−3Al−(1,2,3)Sn Alloys. Trans. Nonferrous Met. Soc. China 2020, 30, 2079–2089. [Google Scholar] [CrossRef]
- Tang, Y.; Jia, W.; Liu, X.; Le, Q.; Cui, J. Precipitation Evolution during Annealing of Mg-Li Alloys. Mater. Sci. Eng. A 2017, 689, 332–344. [Google Scholar] [CrossRef]
- Zhou, G.; Yang, Y.; Zhang, H.; Hu, F.; Zhang, X.; Wen, C.; Xie, W.; Jiang, B.; Peng, X.; Pan, F. Microstructure and Strengthening Mechanism of Hot-Extruded Ultralight Mg-Li-Al-Sn Alloys with High Strength. J. Mater. Sci. Technol. 2022, 103, 186–196. [Google Scholar] [CrossRef]
- Tang, Y.; Jia, W.; Liu, X.; Le, Q.; Zhang, Y. Fabrication of High Strength α, A+β, β Phase Containing Mg-Li Alloys with 0.2%Y by Extruding and Annealing Process. Mater. Sci. Eng. A 2016, 675, 55–64. [Google Scholar] [CrossRef]
- Maurya, R.; Mittal, D.; Balani, K. Effect of Heat-Treatment on Microstructure, Mechanical and Tribological Properties of Mg-Li-Al Based Alloy. J. Mater. Res. Technol. 2020, 9, 4749–4762. [Google Scholar] [CrossRef]
- Zhang, Y.; Sun, S.; Chen, X. Effect of Y Content on Microstructure Evolution and Tensile Properties of Mg-8Li-3Al-2Sn-xY Alloys. Mater. Res. Express 2024, 11, 096519. [Google Scholar] [CrossRef]
- Chen, H.; Zhang, M.; Kong, F.; Li, B.; Cui, X.; Huang, Y.; Hort, N.; Willumeit-Römer, R.; Xie, W.; Wei, G. Effect of Extrusion and Rotary Swaging on the Microstructural Evolution and Properties of Mg-5Li-5.3Al-0.7Si Alloy. Mater. Sci. Eng. A 2023, 885, 145627. [Google Scholar] [CrossRef]
- Liu, J.; Li, C.; Lu, H.; He, Y.; Wang, Y.; Wei, G. Deformation Behavior and Phase Transformation of a Dual-Phase Mg−8.9Li−2.7Al-0.85Si Alloy under Compression Test at Elevated Temperatures. J. Alloys Compd. 2022, 927, 167034. [Google Scholar] [CrossRef]
- Shi, Q.; Bian, L.; Liang, W.; Chen, Z.; Yang, F.; Wang, Y. Effects of Adding Al–Si Eutectic Alloy and Hot Rolling on Microstructures and Mechanical Behavior of Mg–8Li Alloys. J. Alloys Compd. 2015, 631, 129–132. [Google Scholar] [CrossRef]
- Chen, Z.; Zheng, J.; Zhang, Z.; Xue, Y. Effects of Die Motion Parameters on the Microstructures and Mechanical Properties of Rotary Backward Extruded AZ80 Alloys. J. Mater. Process. Technol. 2023, 319, 118081. [Google Scholar] [CrossRef]
- Jamali, S.S.; Faraji, G.; Abrinia, K. Evaluation of Mechanical and Metallurgical Properties of AZ91 Seamless Tubes Produced by Radial-Forward Extrusion Method. Mater. Sci. Eng. A 2016, 666, 176–183. [Google Scholar] [CrossRef]
- Zhao, X.; Li, S.; Zhang, Z.; Gao, P.; Kan, S.; Yan, F. Comparisons of Microstructure Homogeneity, Texture and Mechanical Properties of AZ80 Magnesium Alloy Fabricated by Annular Channel Angular Extrusion and Backward Extrusion. J. Magnes. Alloys 2020, 8, 624–639. [Google Scholar] [CrossRef]
- Zhan, M.; Yang, H.; Guo, J.; Wang, X. Review on Hot Spinning for Difficult-to-Deform Lightweight Metals. Trans. Nonferrous Met. Soc. China 2015, 25, 1732–1743. [Google Scholar] [CrossRef]
- Jin, X.; Xu, W.; Yang, G.; Shan, D.; Guo, B. Microstructure Evolution and Strengthening Mechanisms of Mg-6Gd-4Y-0.5Zn-0.5Zr Alloy during Hot Spinning and Aging Treatment. Mater. Sci. Eng. A 2021, 827, 142035. [Google Scholar] [CrossRef]
- Cao, Z.; Wang, F.; Wan, Q.; Zhang, Z.; Jin, L.; Dong, J. Microstructure and Mechanical Properties of AZ80 Magnesium Alloy Tube Fabricated by Hot Flow Forming. Mater. Des. 2015, 67, 64–71. [Google Scholar] [CrossRef]
- Wu, K.; Deng, K.; Nie, K.; Wu, Y.; Wang, X.; Hu, X.; Zheng, M. Microstructure and Mechanical Properties of SiCp/AZ91 Composite Deformed through a Combination of Forging and Extrusion Process. Mater. Des. 2010, 31, 3929–3932. [Google Scholar] [CrossRef]
- Huang, Z.; Deng, K.; Wang, C.; Nie, K.; Shi, Q.; Liu, H.; Jia, C. Influence of Spinning on the Microstructure and Mechanical Properties of AZ91 Alloy Tubes. Mater. Sci. Eng. A 2025, 921, 147581. [Google Scholar] [CrossRef]
- Yang, Y.; Xiong, X.; Su, J.; Peng, X.; Wen, H.; Wei, G.; Pan, F.; Lavernia, E.J. Influence of Extrusion Temperature on Microstructure and Mechanical Behavior of Duplex Mg-Li-Al-Sr Alloy. J. Alloys Compd. 2018, 750, 696–705. [Google Scholar] [CrossRef]
- Xiong, X.M.; Yang, Y.; Ma, L.N.; Li, M.L.; Ren, F.J.; Hu, J.W.; Wei, G.B.; Peng, X.D. Microstructure and Mechanical Properties of Mg–8Li–xAl–0.5Ca Alloys. Mater. Sci. Technol. 2019, 35, 26–36. [Google Scholar] [CrossRef]
- Zhang, M.-X.; Kelly, P.M.; Easton, M.A.; Taylor, J.A. Crystallographic Study of Grain Refinement in Aluminum Alloys Using the Edge-to-Edge Matching Model. Acta Mater. 2005, 53, 1427–1438. [Google Scholar] [CrossRef]
- Liu, G.; Xie, W.; Hadadzadeh, A.; Wei, G.; Ma, Z.; Liu, J.; Yang, Y.; Xie, W.; Peng, X.; Wells, M. Hot Deformation Behavior and Processing Map of a Superlight Dual-Phase Mg–Li Alloy. J. Alloys Compd. 2018, 766, 460–469. [Google Scholar] [CrossRef]
- Tang, Y.; Le, Q.; Jia, W.; Fu, L.; Liu, X.; Cui, J. Microstructure Evolution and Strengthening Mechanism Study of Mg-Li Alloys during Deformation and Heat Treatment. Mater. Sci. Eng. A 2017, 704, 344–359. [Google Scholar] [CrossRef]
- Ma, C.; Ma, X.; Pei, X.; Xu, Y.; Peng, P.; Wang, N. Effect of Rolling Reduction on the Microstructure and Mechanical Properties of Hot-Rolled Mg-Li-Al-Ca Alloys. Mater. Today Commun. 2023, 37, 107469. [Google Scholar] [CrossRef]
- Shi, Q.; Wang, C.; Deng, K.; Nie, K.; Liang, W. Influence of Particle Deformation Zone (PDZ) Size on Dynamic Recrystallization and Precipitation Behavior of SiCp/Mg-5Zn Material during Hot Compression. Mater. Today Commun. 2024, 41, 110569. [Google Scholar] [CrossRef]
- Zhu, Y.; Wu, X. Perspective on Hetero-Deformation Induced (HDI) Hardening and Back Stress. Mater. Res. Lett. 2019, 7, 393–398. [Google Scholar] [CrossRef]
- Klu, E.E.; Song, D.; Li, C.; Wang, G.; Gao, B.; Ma, A.; Jiang, J. Achieving Ultra-Fine Grains and High Strength of Mg–9Li Alloy via Room-Temperature ECAP and Post Rolling. Mater. Sci. Eng. A 2022, 833, 142371. [Google Scholar] [CrossRef]
- Yang, Y.; Su, K.; Zhao, K.; Li, H.; Guo, E.; Chen, Z.; Xin, T.; Kang, H.; Wang, T. Strengthening of Duplex Mg–9Li–3Al–2Zn–1Sn Alloy by Solid Solution and Mixed Rolling-Induced Second Phase Transition. Mater. Sci. Eng. A 2024, 900, 146491. [Google Scholar] [CrossRef]
- Zhao, Z.; Xing, X.; Ma, J.; Bian, L.; Liang, W.; Wang, Y. Effect of Addition of Al-Si Eutectic Alloy on Microstructure and Mechanical Properties of Mg-12wt%Li Alloy. J. Mater. Sci. Technol. 2018, 34, 1564–1569. [Google Scholar] [CrossRef]
- Lee, C. Dependence of Defect Susceptibility on Microporosity Variation in Mg-xLi-3Al-1Zn Casting Alloys. J. Alloys Compd. 2025, 1010, 177213. [Google Scholar] [CrossRef]
- Huang, M.; Xu, C.; Fan, G.; Maawad, E.; Gan, W.; Geng, L.; Lin, F.; Tang, G.; Wu, H.; Du, Y.; et al. Role of Layered Structure in Ductility Improvement of Layered Ti-Al Metal Composite. Acta Mater. 2018, 153, 235–249. [Google Scholar] [CrossRef]
- Li, J.; Jin, L.; Wang, F.; Dong, S.; Dong, J. Effect of Phase Morphology on Microscopic Deformation Behavior of Mg–Li–Gd Dual-Phase Alloys. Mater. Sci. Eng. A 2021, 809, 140871. [Google Scholar] [CrossRef]
- Hou, M.; Deng, K.; Wang, C.; Nie, K.; Shi, Q. The Work Hardening and Softening Behaviors of Mg–6Zn-1Gd-0.12Y Alloy Influenced by the VR/VD Ratio. Mater. Sci. Eng. A 2022, 856, 143970. [Google Scholar] [CrossRef]
- Hou, M.; Deng, K.; Wang, C.; Nie, K.; Shi, Q. The Balance between Work Hardening and Softening Behaviors of Mg-xZn-1Gd-0.2Ca-0.1Zr Alloys Influenced by Trace Zn Addition. J. Alloys Compd. 2023, 969, 172379. [Google Scholar] [CrossRef]
- Lukáč, P.; Balík, J. Kinetics of Plastic Deformation. Key Eng. Mater. 1994, 97–98, 307–322. [Google Scholar] [CrossRef]
- Dai, R.J.; Deng, K.K.; Wang, C.J.; Nie, K.B.; Zhang, G.W.; Liang, W. Effects of Precipitates and Solute Atoms on the Work Hardening and Softening Behavior of Zn-Rich Aluminum Alloy. Mater. Sci. Eng. A 2022, 848, 143388. [Google Scholar] [CrossRef]
- Liu, X.Q.; Qiao, X.G.; Xie, W.C.; Pei, R.S.; Yuan, L.; Zheng, M.Y. Influence of Grain Size on Microstructure, Mechanical Properties and Strain Hardening Behavior of Mg-0.3Ca (Wt.%) Alloy. Mater. Sci. Eng. A 2022, 839, 142847. [Google Scholar] [CrossRef]
- Cao, F.; Deng, K.; Wang, C.; Nie, K.; Shi, Q.; Jia, C.; Zhang, W. The Influence of Tip Aspect Ratio on the Microstructure, Mechanical Properties, and Work Hardening Behavior of the Tip/Mg-Gd-Y-Zn Composites. Mater. Sci. Eng. A 2024, 891, 145981. [Google Scholar] [CrossRef]
- Li, Y.; Deng, K.; Wang, C.; Nie, K.; Shi, Q.; Tian, P.; Zhang, G.-W. Effect of Final Rolling Deformation on Microstructure, Work Hardening and Softening Behavior of Mg-8Li-3Al-0.3Si Alloys. J. Alloys Compd. 2024, 990, 174427. [Google Scholar] [CrossRef]
- Li, C.C.; Qiao, X.G.; Sun, W.T.; Golovin, I.S.; Kim, H.S.; Sakai, T.; Zheng, M.Y. Effect of Grain Size on Mechanical Characteristics and Work-Hardening Behavior of Fine-Grained Mg-0.8Mn Alloy via Adjusting Extrusion Temperature. J. Alloys Compd. 2025, 1010, 177322. [Google Scholar] [CrossRef]
- Shi, Q.; Wang, C.; Deng, K.; Nie, K.; Wu, Y.; Gan, W.; Liang, W. Microstructure and Mechanical Behavior of Mg-5Zn Matrix Influenced by Particle Deformation Zone. J. Mater. Sci. Technol. 2021, 60, 8–20. [Google Scholar] [CrossRef]
- Yu, H.; Fan, S.; Meng, S.; Choi, J.O.; Li, Z.; Go, Y.; Kim, Y.M.; Zhao, W.; You, B.S.; Shin, K.S. Microstructural Evolution and Mechanical Properties of Binary Mg–xBi (X = 2, 5, and 8 Wt%) Alloys. J. Magnes. Alloys 2021, 9, 983–994. [Google Scholar] [CrossRef]
- Wang, C.; Li, H.; Guo, E.; Wang, X.; Kang, H.; Chen, Z.; Wang, T. The Effect of Gd on the Microstructure Evolution and Mechanical Properties of Mg-4Zn-0.6Ca Alloy. Mater. Sci. Eng. A 2023, 868, 144756. [Google Scholar] [CrossRef]
- Afrin, N.; Chen, D.L.; Cao, X.; Jahazi, M. Strain Hardening Behavior of a Friction Stir Welded Magnesium Alloy. Scr. Mater. 2007, 57, 1004–1007. [Google Scholar] [CrossRef]
- Uijl, N.J.D.; Carless, L.J. 3—Advanced Metal-Forming Technologies for Automotive Applications. In Advanced Materials in Automotive Engineering; Rowe, J., Ed.; Woodhead Publishing: Sawston, UK, 2012; pp. 28–56. ISBN 978-1-84569-561-3. [Google Scholar]
- Cao, F.; Deng, K.; Wang, C.; Nie, K.; Shi, Q. Microstructure and Mechanical Properties of Tip/GWZ723 Composites Adjusted by Tip/Mg Laminate Structure. Mater. Sci. Eng. A 2024, 908, 146723. [Google Scholar] [CrossRef]
- Geng, J.; Nie, J.F. Unloading Yield Effect in a Twin-Roll-Cast Mg–3Al–1Zn Alloy. Scr. Mater. 2015, 100, 78–81. [Google Scholar] [CrossRef]
- Liu, Y.; Deng, K.; Zhang, X.; Wang, C.; Nie, K.; Gan, W.; Shi, Q. Investigations of PMMCs Laminates with Regulatable Thickness Ratio: Microstructure, Mechanical Behavior and Fractural Mechanism. Mater. Sci. Eng. A 2022, 856, 143997. [Google Scholar] [CrossRef]
- Chen, K.; Tang, J.; Jiang, F.; Teng, J.; Fu, D.; Zhang, H. The Role of Various Zr Additions in Static Softening Behavior of Al-Zn-Mg-Cu Alloys during Interval Holding of Double-Stage Hot Deformation. J. Alloys Compd. 2019, 792, 1112–1121. [Google Scholar] [CrossRef]
- Zhang, J.-K.; Wang, C.-J.; Fan, Y.-D.; Xu, C.; Nie, K.-B.; Deng, K.-K. Effect of Tip Content on the Work Hardening and Softening Behavior of Mg–Zn–Ca Alloy. Acta Metall. Sin. Engl. Lett. 2024, 37, 551–560. [Google Scholar] [CrossRef]


| Positions | Mg (at. %) | Al (at. %) | Si (at. %) |
|---|---|---|---|
| A | 55.8 | 44.1 | 0.1 |
| B | 69.0 | 0.8 | 30.2 |
| C | 60.7 | 39.8 | 0.5 |
| D | 89.1 | 10.7 | 0.2 |
| E | 57.9 | 42.1 | 0.0 |
| F | 74.3 | 25.6 | 0.0 |
| G | 62.6 | 25.0 | 12.4 |
| H | 48.2 | 27.2 | 24.5 |
| I | 90.2 | 9.8 | 0.0 |
| States | k | k1 | k2 | R2 |
|---|---|---|---|---|
| As-cast | 100 ± 32 | 6289 ± 13 | 234 ± 0.7 | 0.999 |
| BE | 280 ± 45 | 4552 ± 07 | 203 ± 0.5 | 0.999 |
| SP | 350 ± 42 | 3022 ± 12 | 129 ± 0.7 | 0.998 |
Disclaimer/Publisher’s Note: The statements, opinions and data contained in all publications are solely those of the individual author(s) and contributor(s) and not of MDPI and/or the editor(s). MDPI and/or the editor(s) disclaim responsibility for any injury to people or property resulting from any ideas, methods, instructions or products referred to in the content. |
© 2025 by the authors. Licensee MDPI, Basel, Switzerland. This article is an open access article distributed under the terms and conditions of the Creative Commons Attribution (CC BY) license (https://creativecommons.org/licenses/by/4.0/).
Share and Cite
Jia, C.; Deng, K.; Wang, C.; Nie, K.; Shi, Q.; Li, Y.; Tian, P. Microstructure and Mechanical Properties of Mg-8Li-3Al-0.3Si Alloy Deformed Through a Combination of Back-Extrusion and Spinning Process. Materials 2025, 18, 417. https://doi.org/10.3390/ma18020417
Jia C, Deng K, Wang C, Nie K, Shi Q, Li Y, Tian P. Microstructure and Mechanical Properties of Mg-8Li-3Al-0.3Si Alloy Deformed Through a Combination of Back-Extrusion and Spinning Process. Materials. 2025; 18(2):417. https://doi.org/10.3390/ma18020417
Chicago/Turabian StyleJia, Changzhen, Kunkun Deng, Cuiju Wang, Kaibo Nie, Quanxin Shi, Yijia Li, and Pengcheng Tian. 2025. "Microstructure and Mechanical Properties of Mg-8Li-3Al-0.3Si Alloy Deformed Through a Combination of Back-Extrusion and Spinning Process" Materials 18, no. 2: 417. https://doi.org/10.3390/ma18020417
APA StyleJia, C., Deng, K., Wang, C., Nie, K., Shi, Q., Li, Y., & Tian, P. (2025). Microstructure and Mechanical Properties of Mg-8Li-3Al-0.3Si Alloy Deformed Through a Combination of Back-Extrusion and Spinning Process. Materials, 18(2), 417. https://doi.org/10.3390/ma18020417