


Modeling, Design, and Laboratory Testing of a Passive Friction Seismic Metamaterial Base Isolator (PFSMBI)


Abstract
1. Introduction
2. Dynamic Model
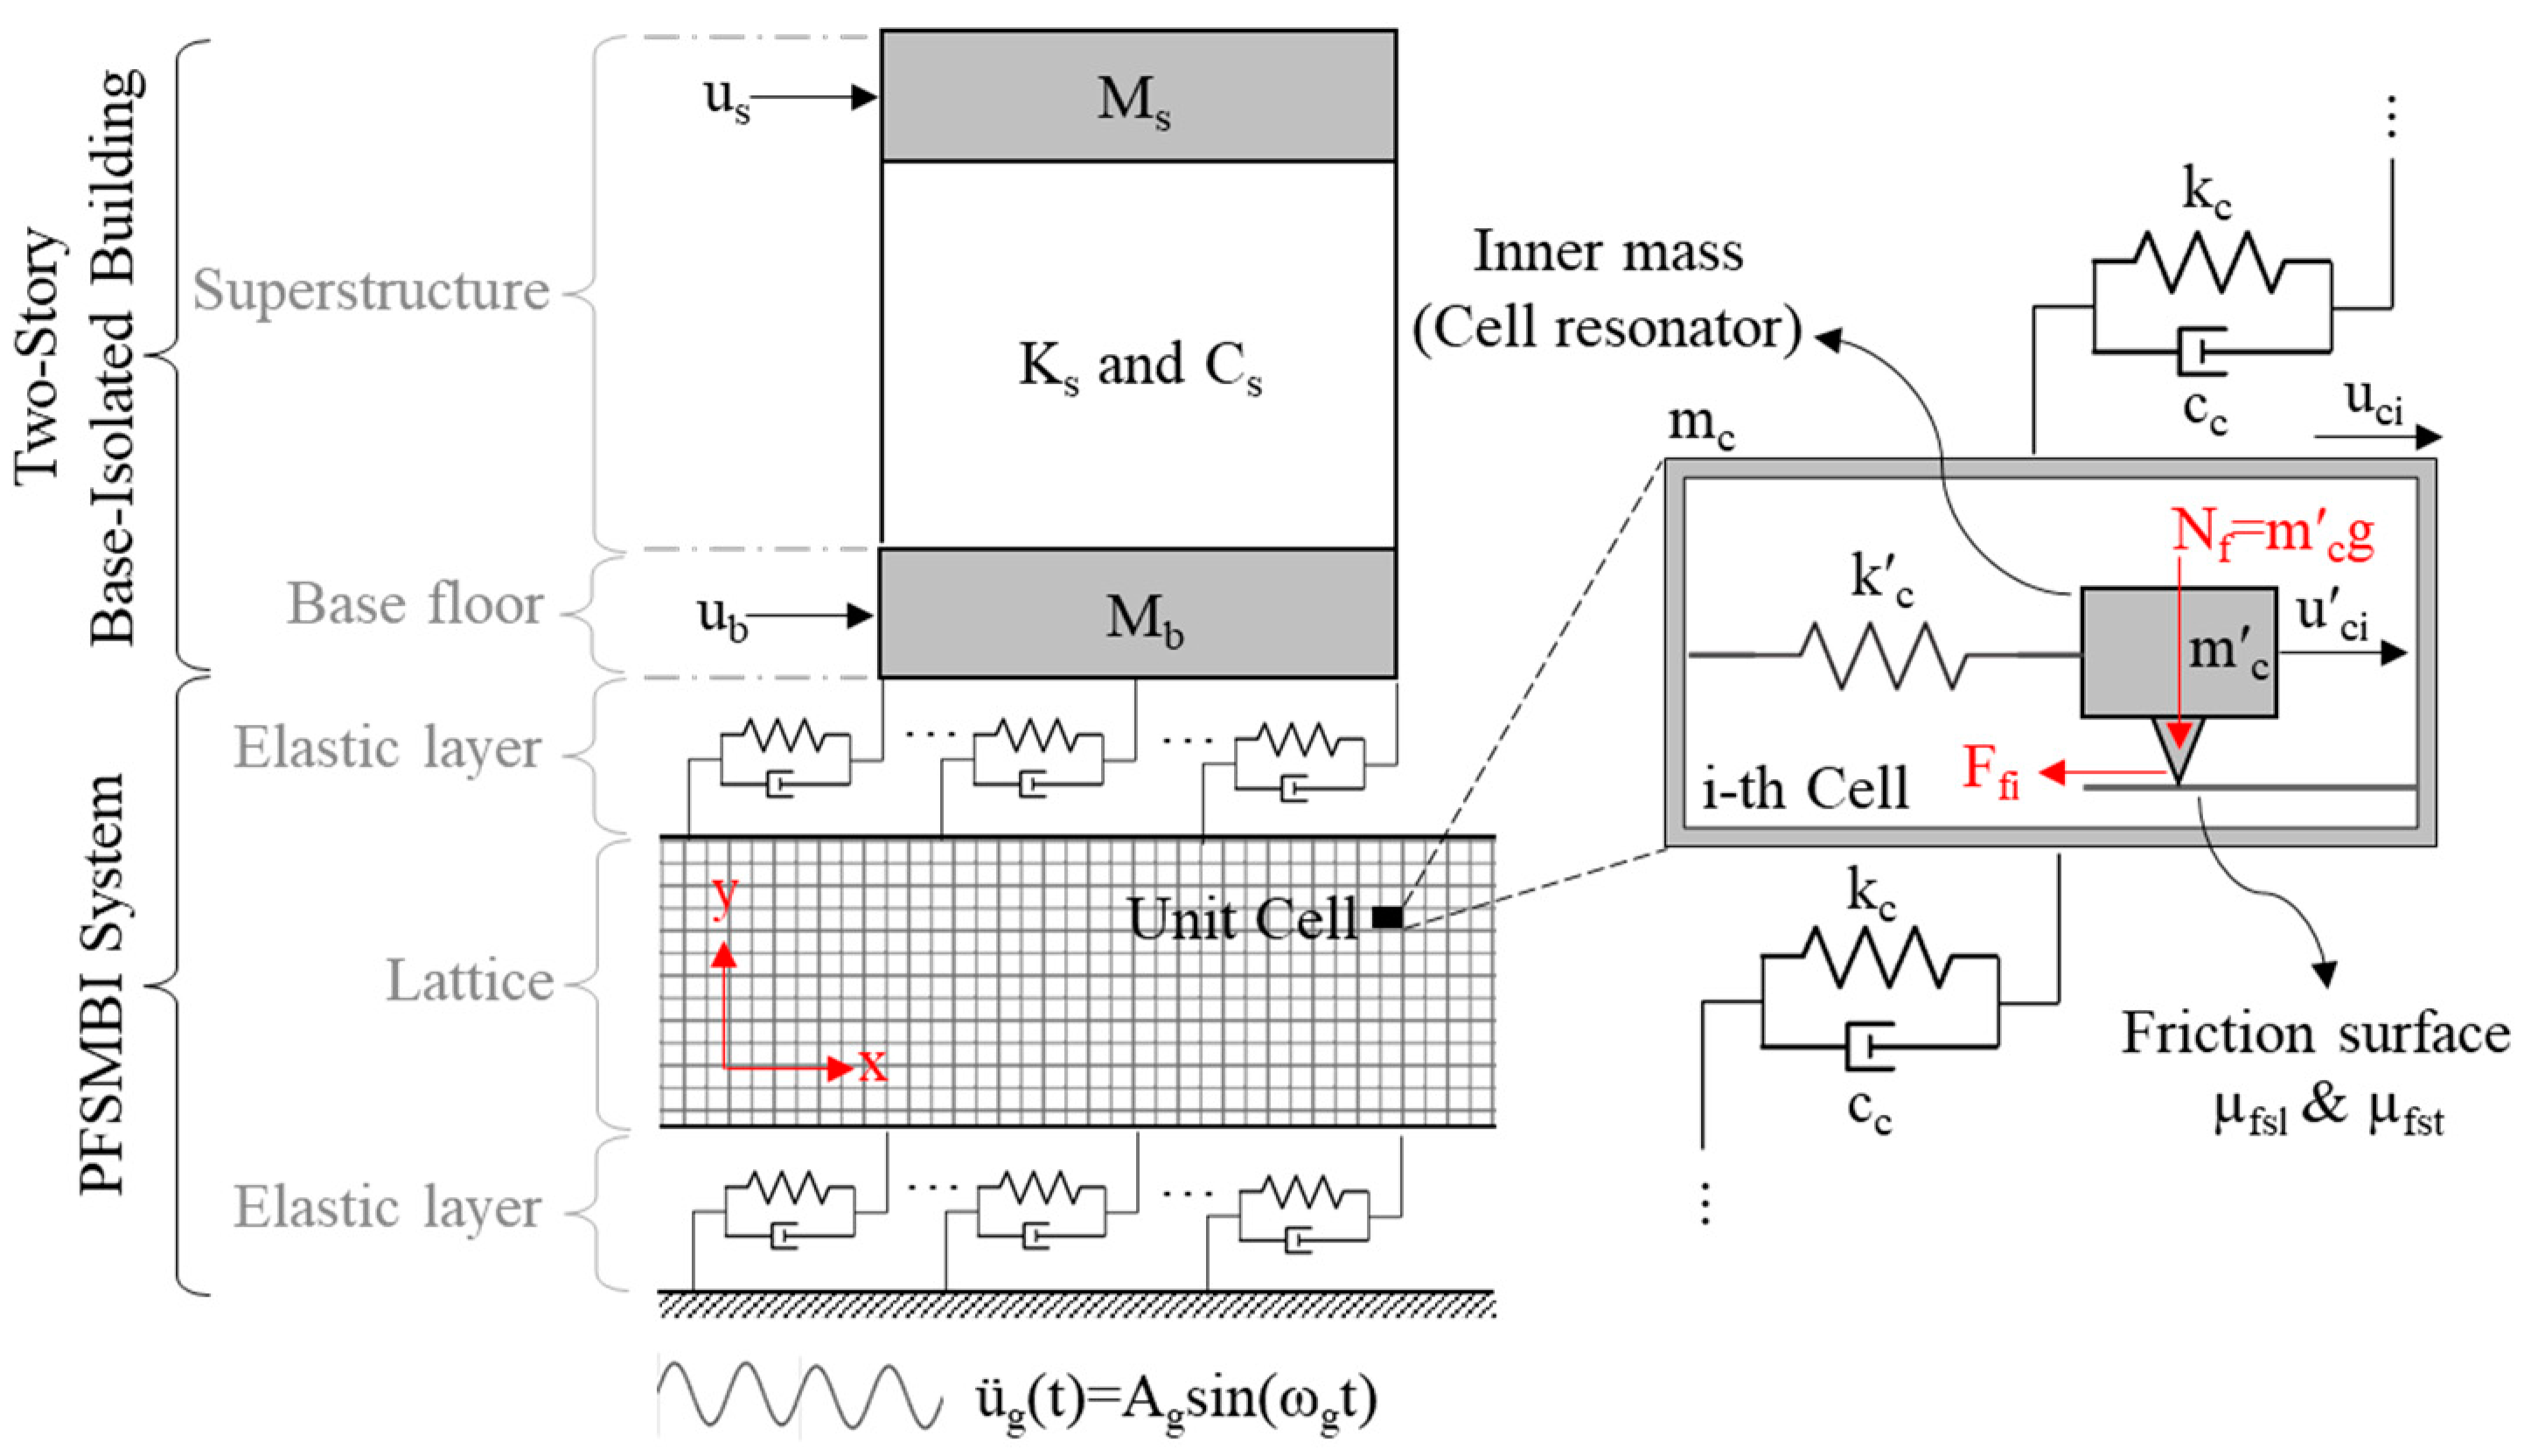
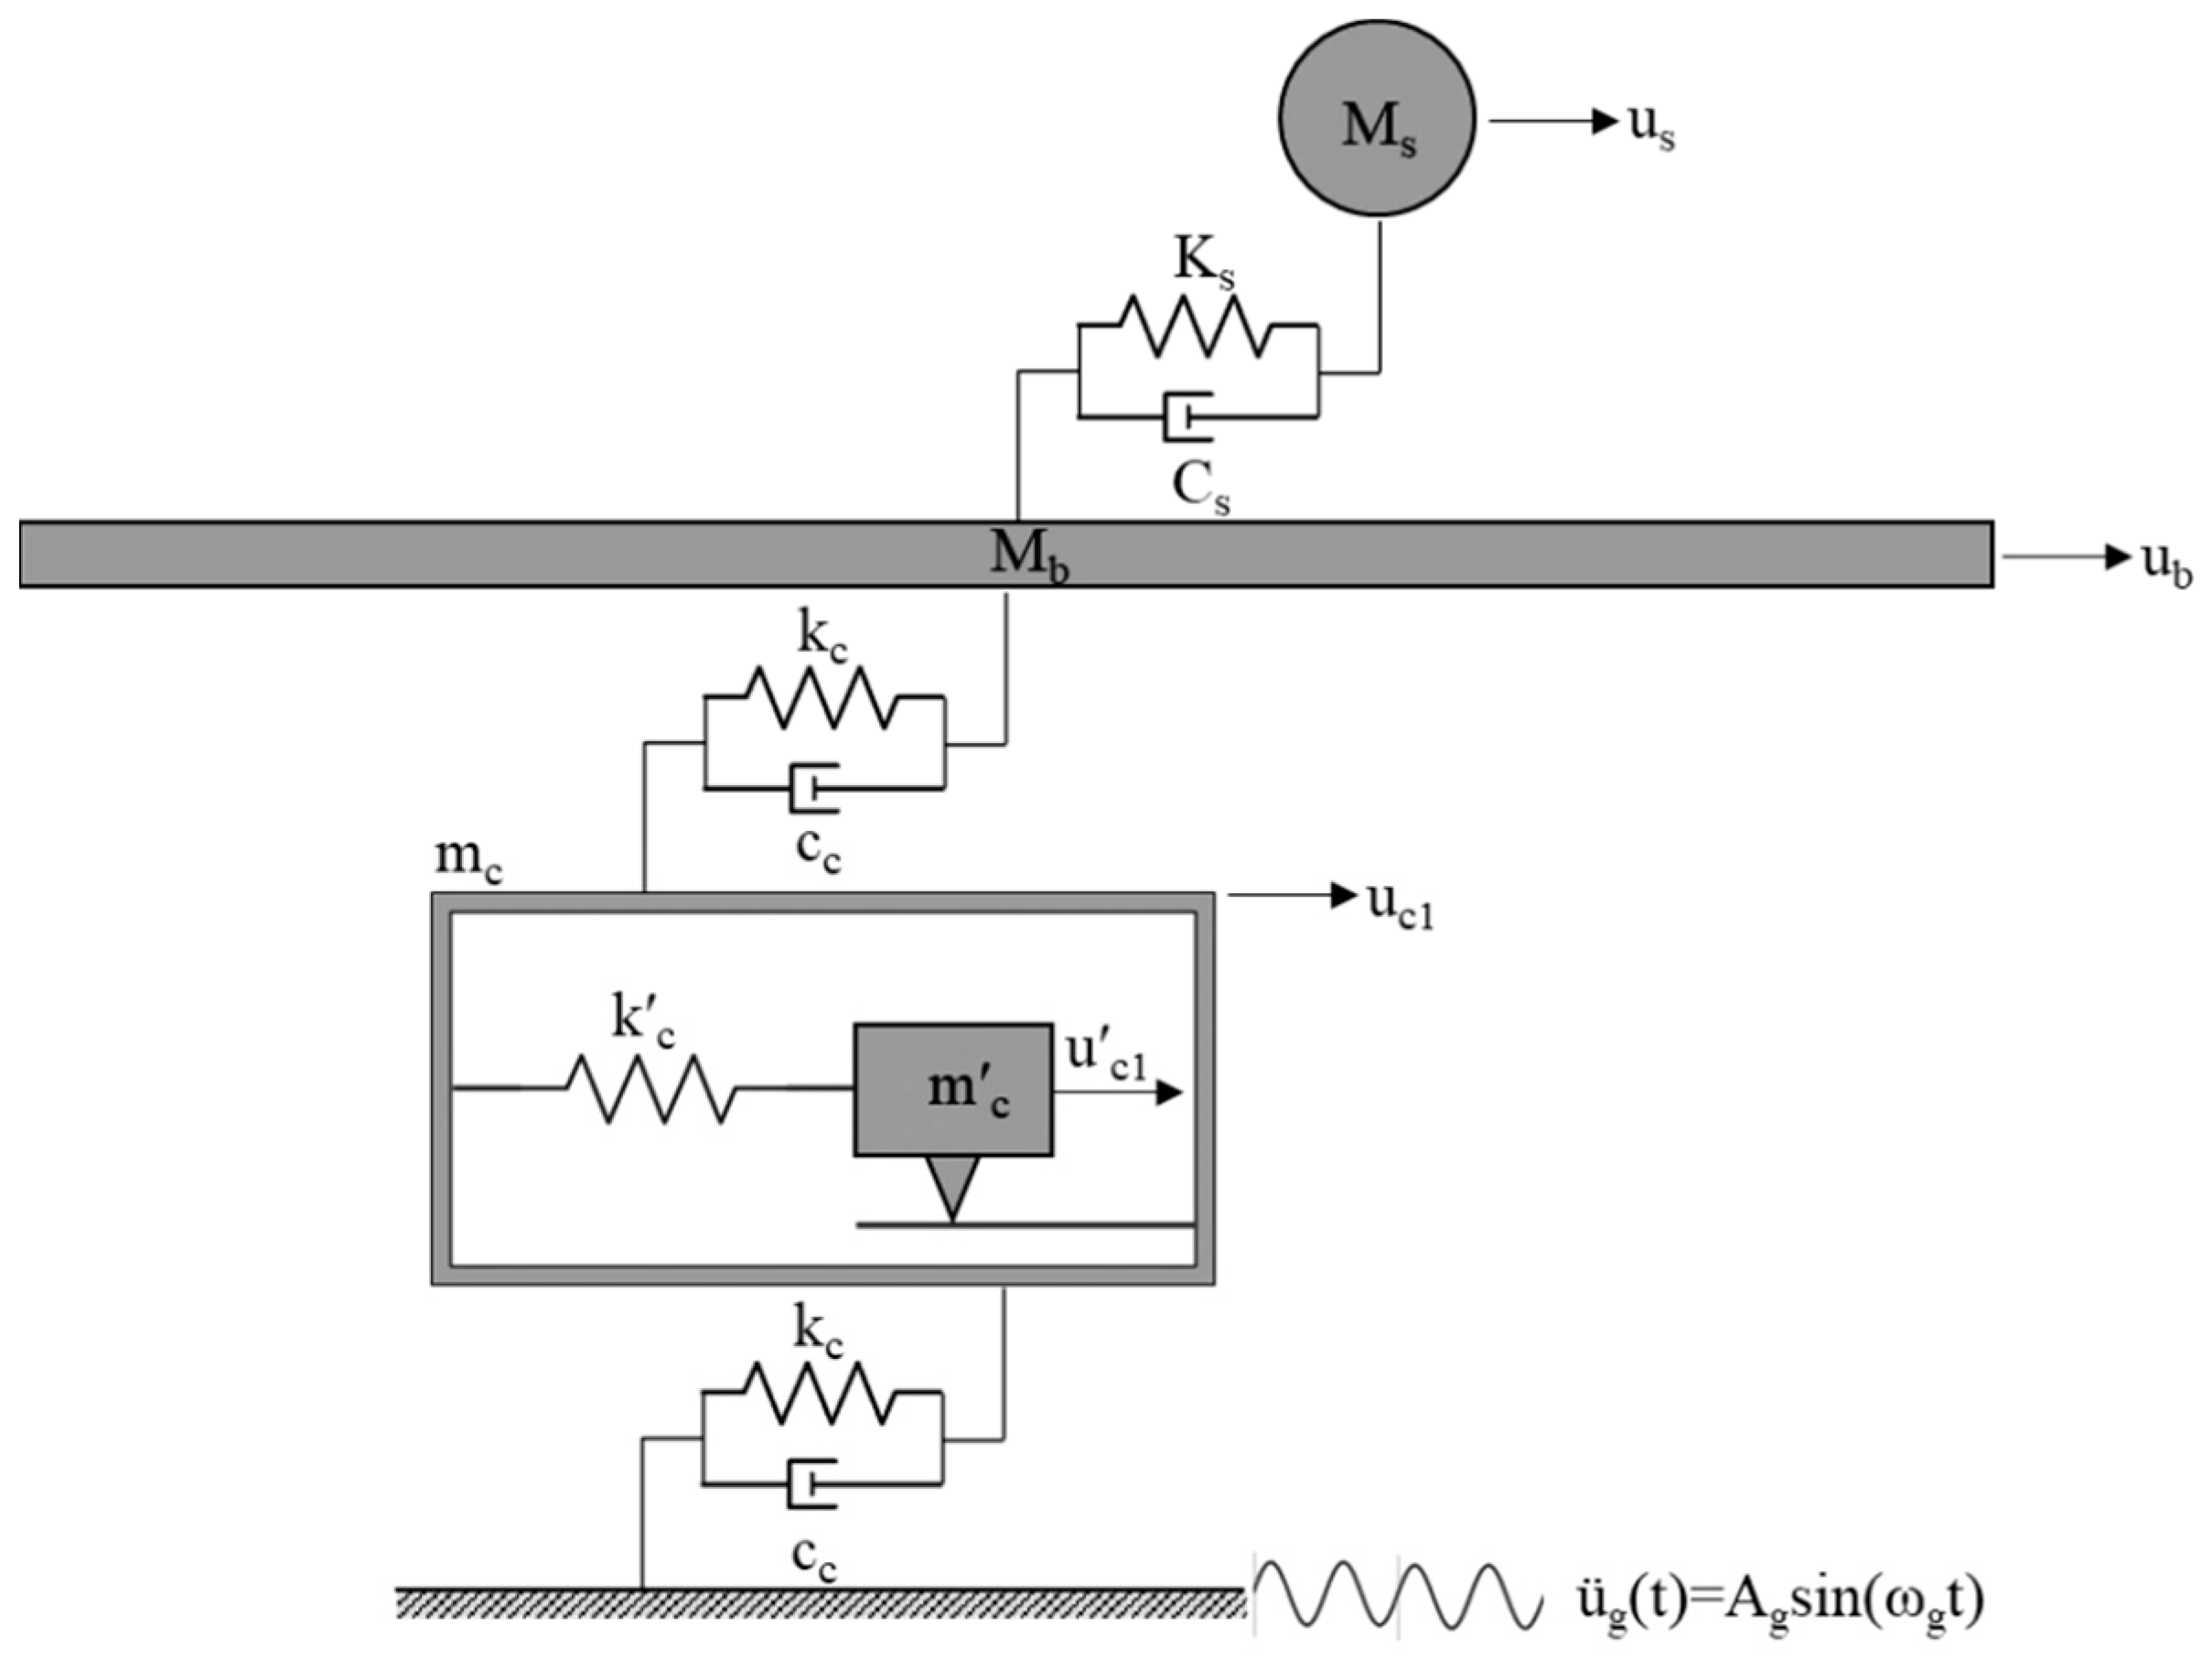
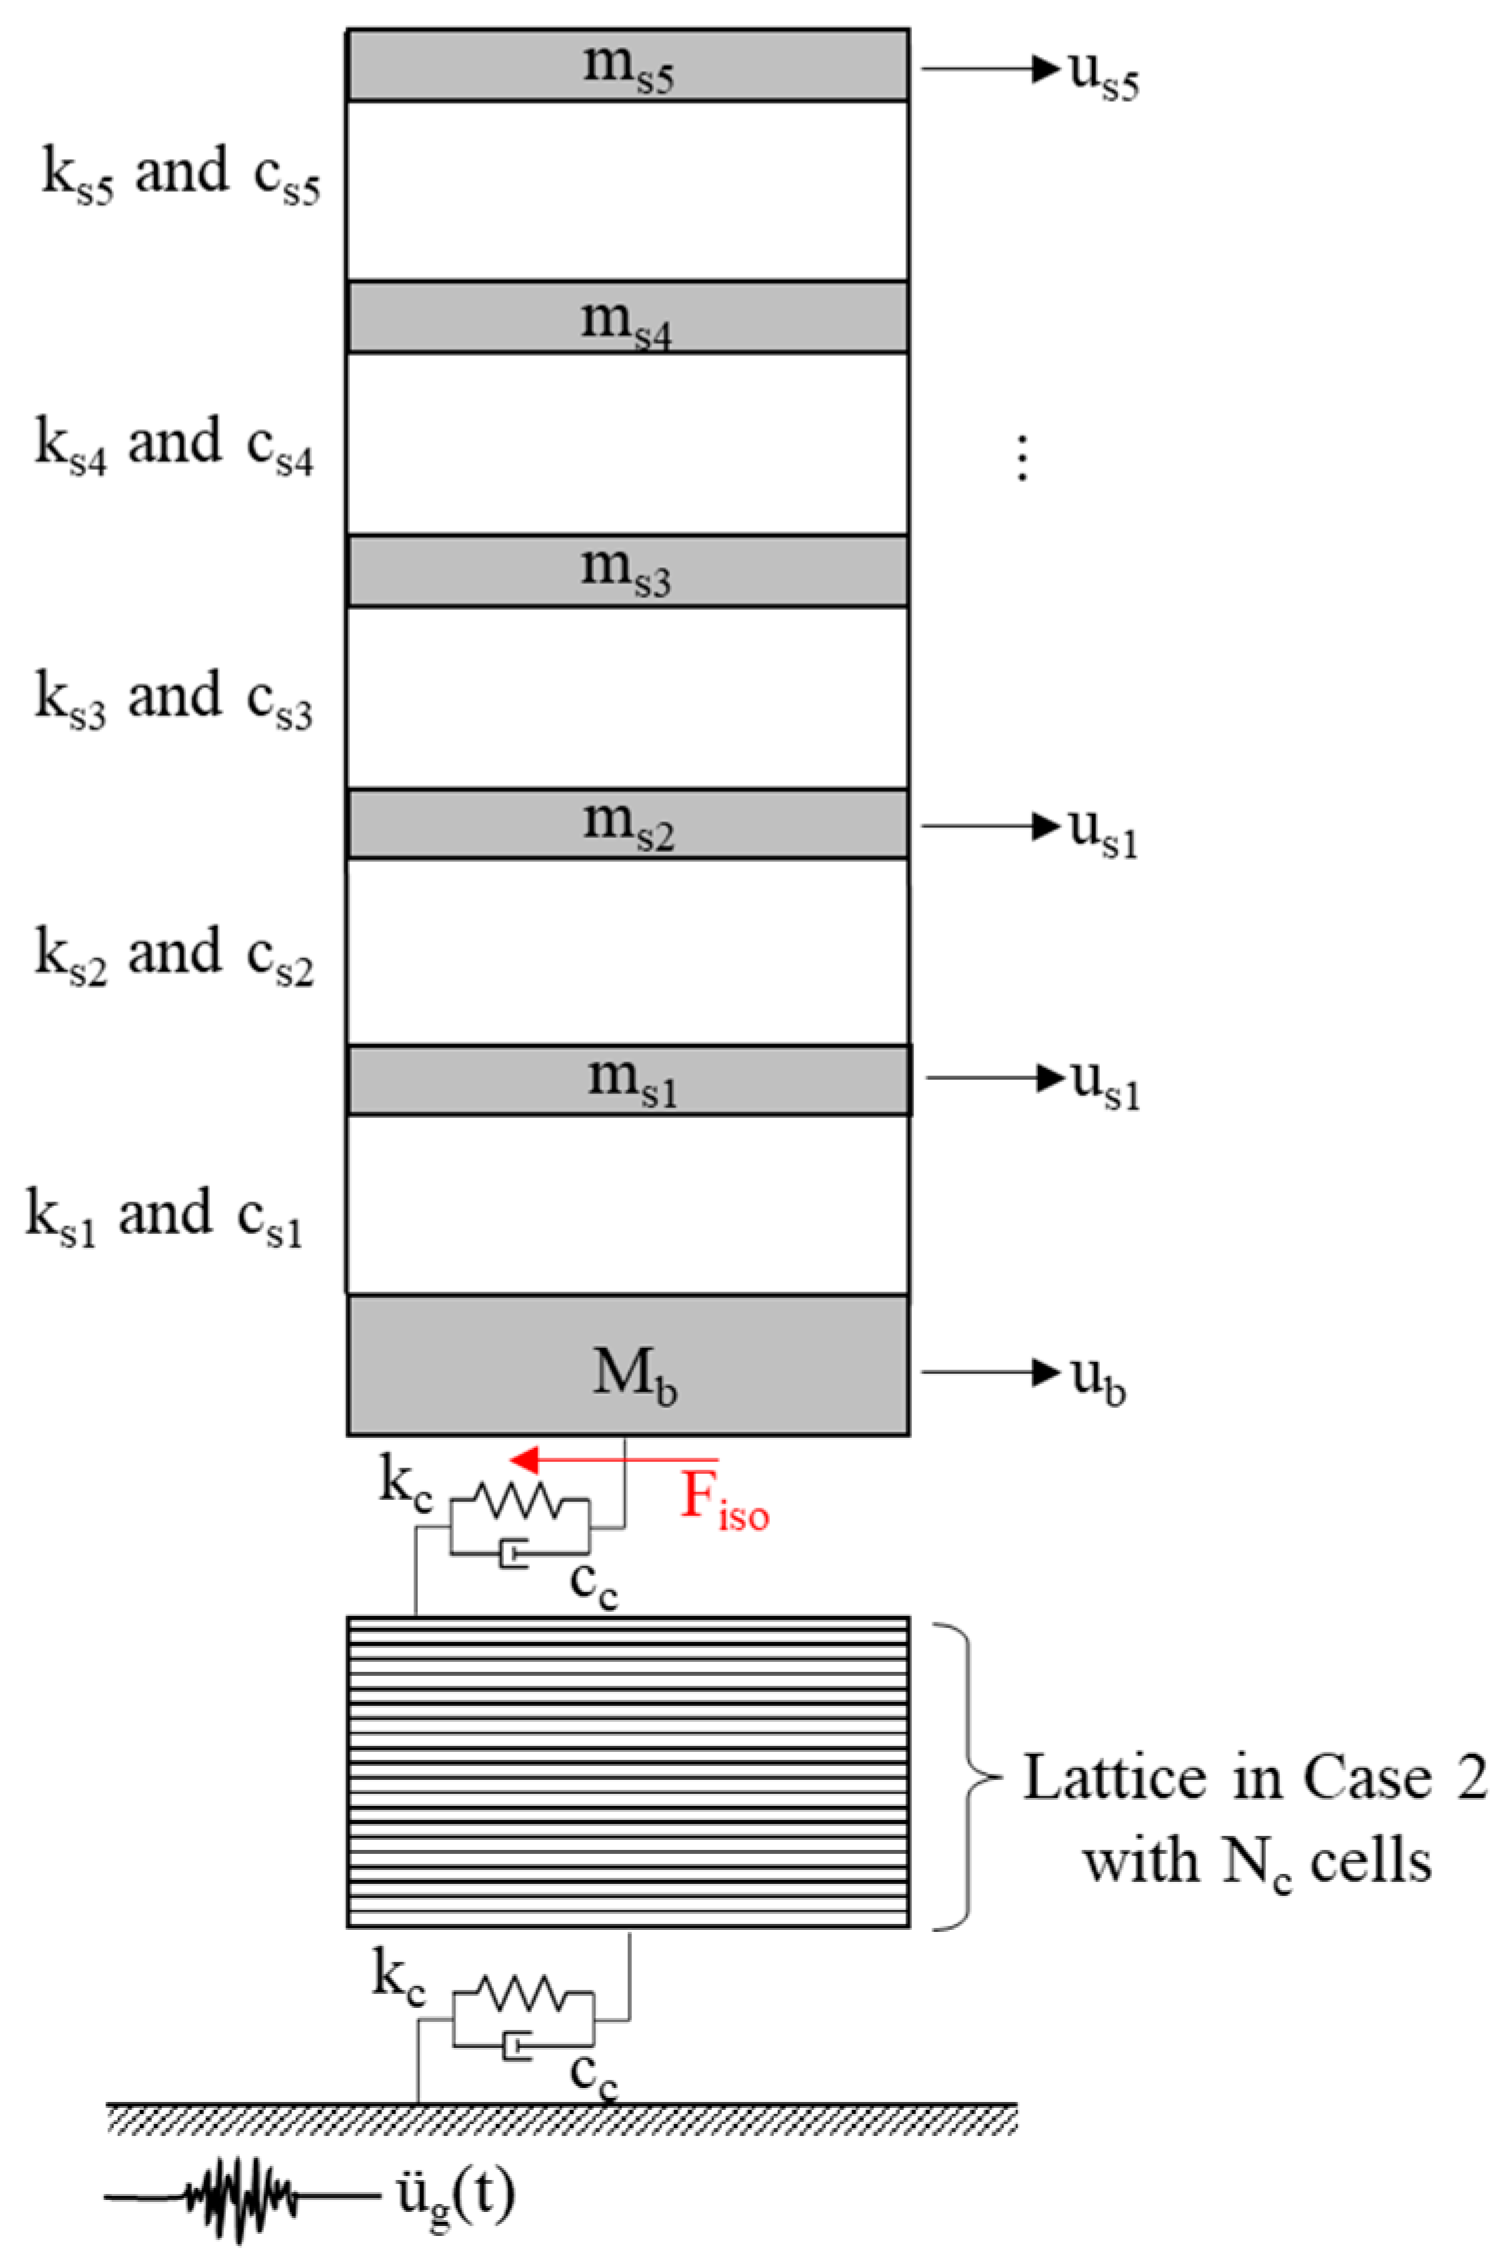
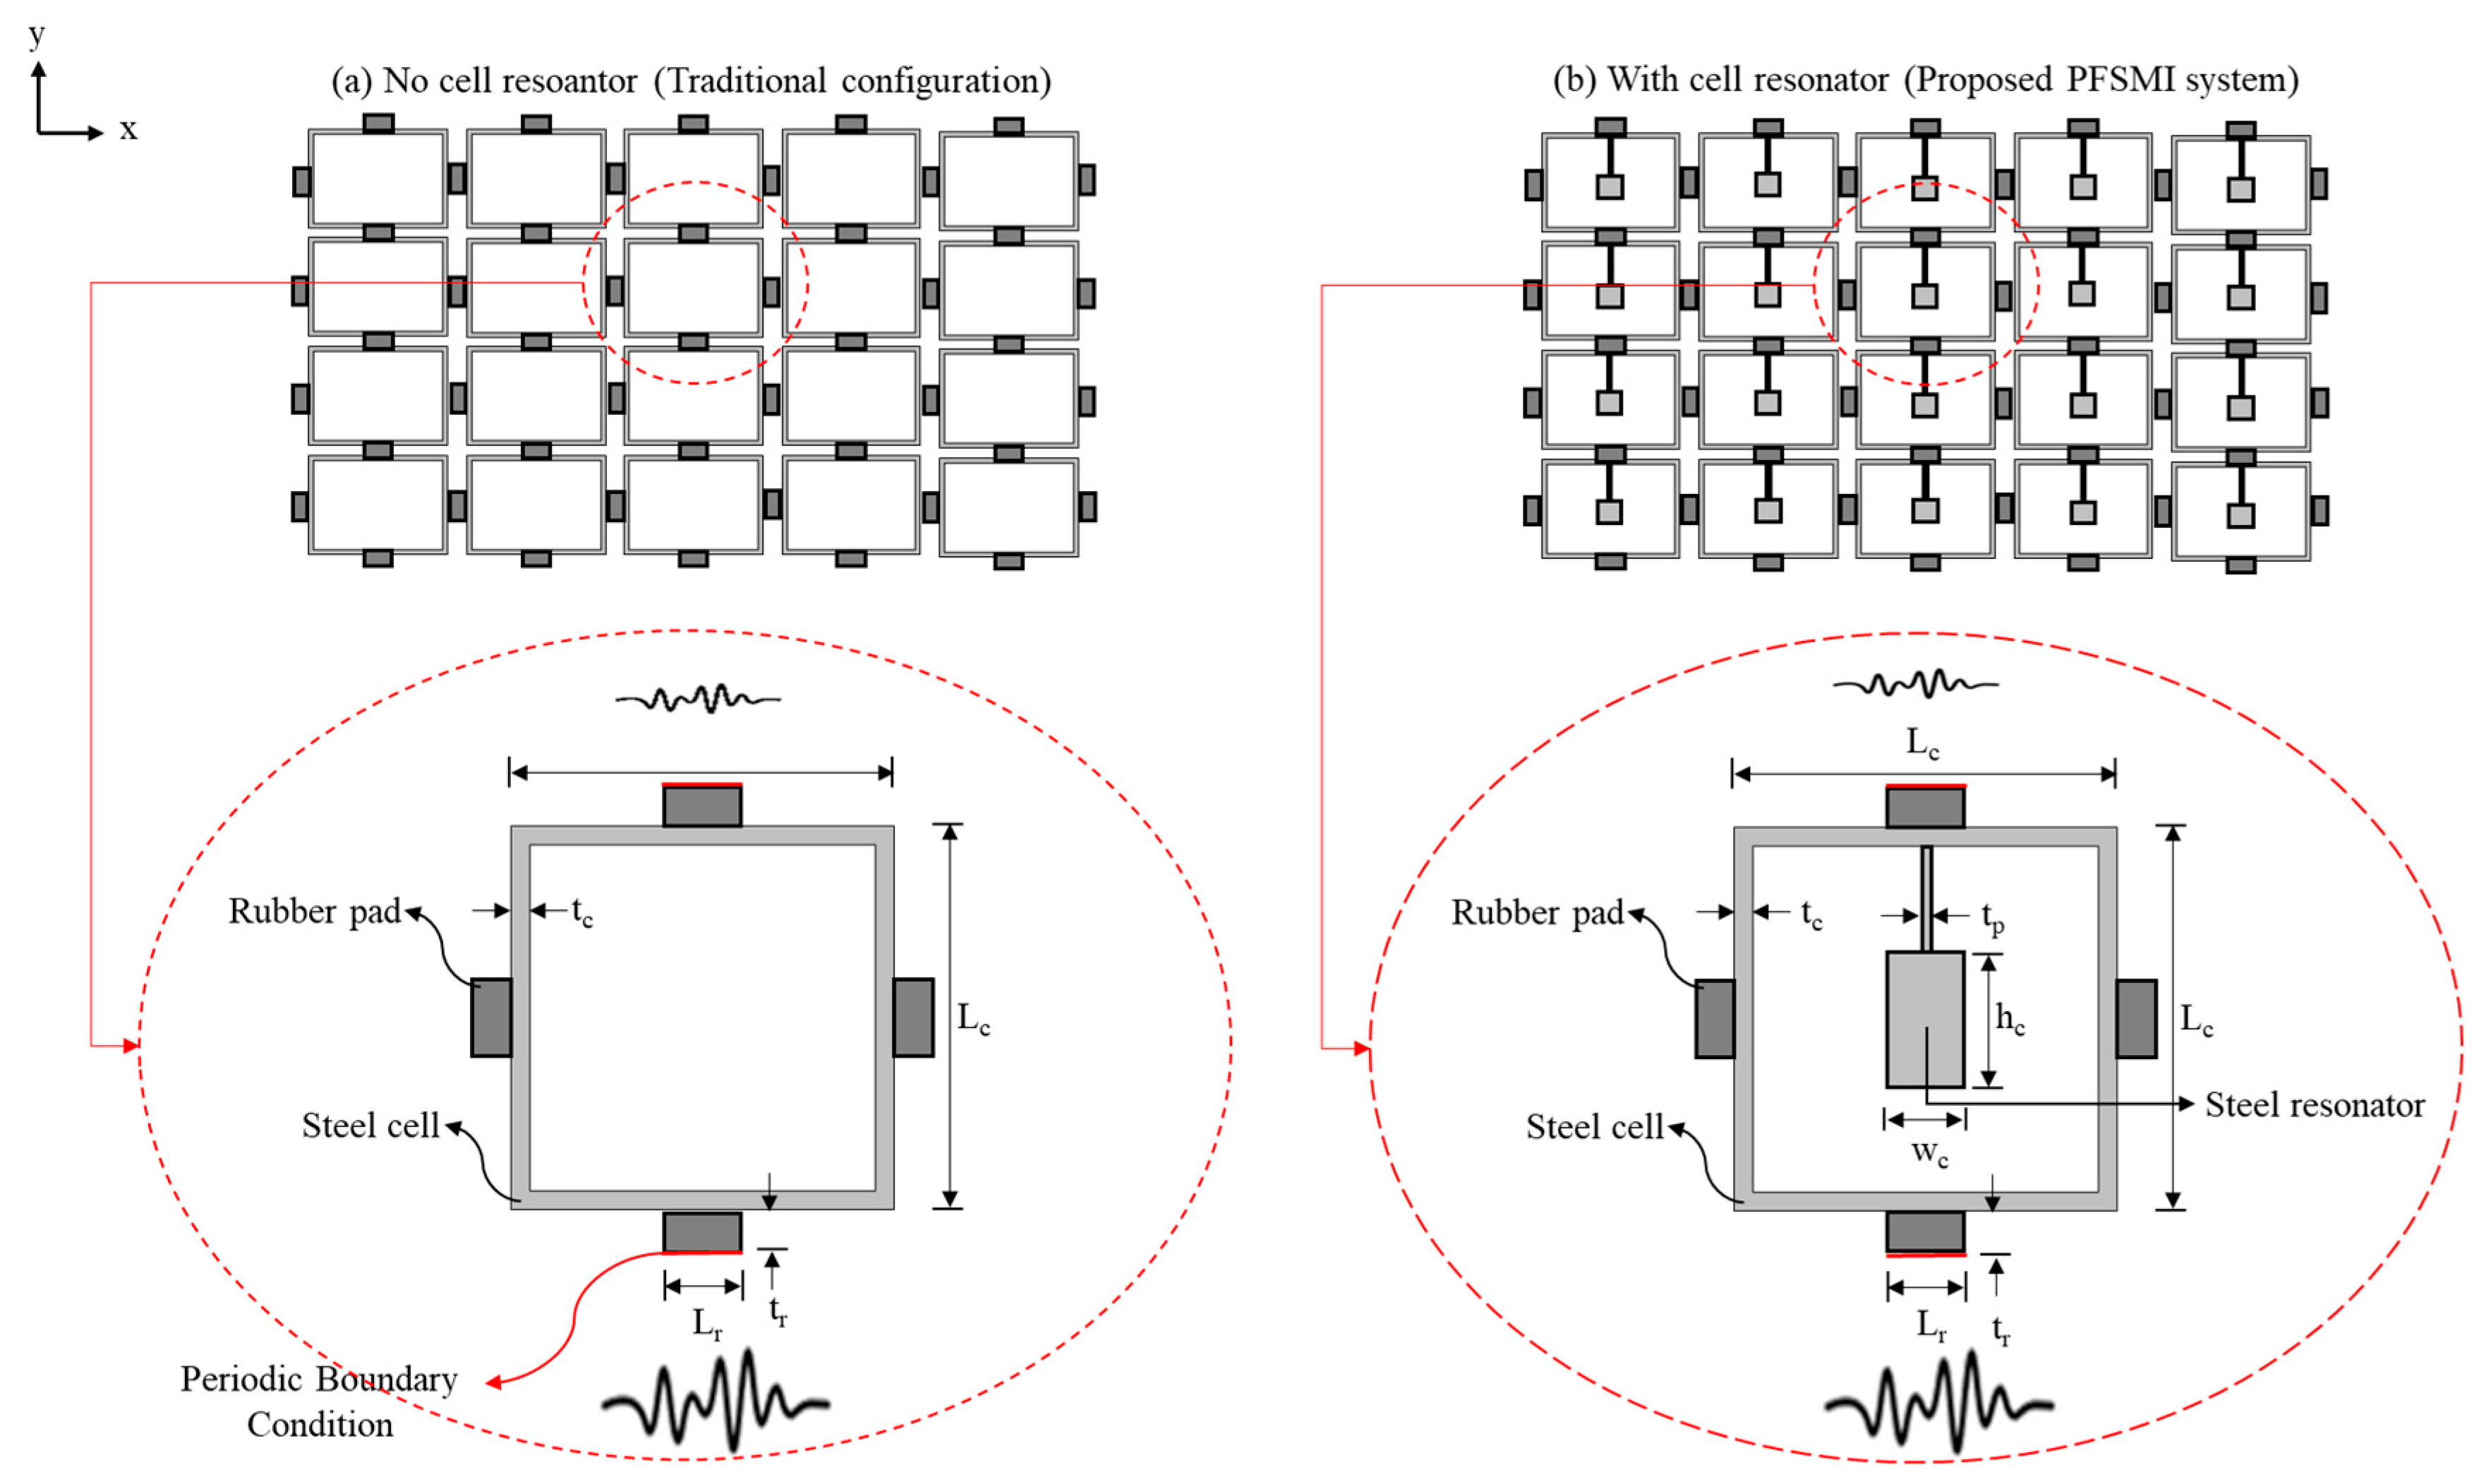
2.1. Configuration of the PFSMBI System
2.2. Equation of Motion
2.3. Model Parameters
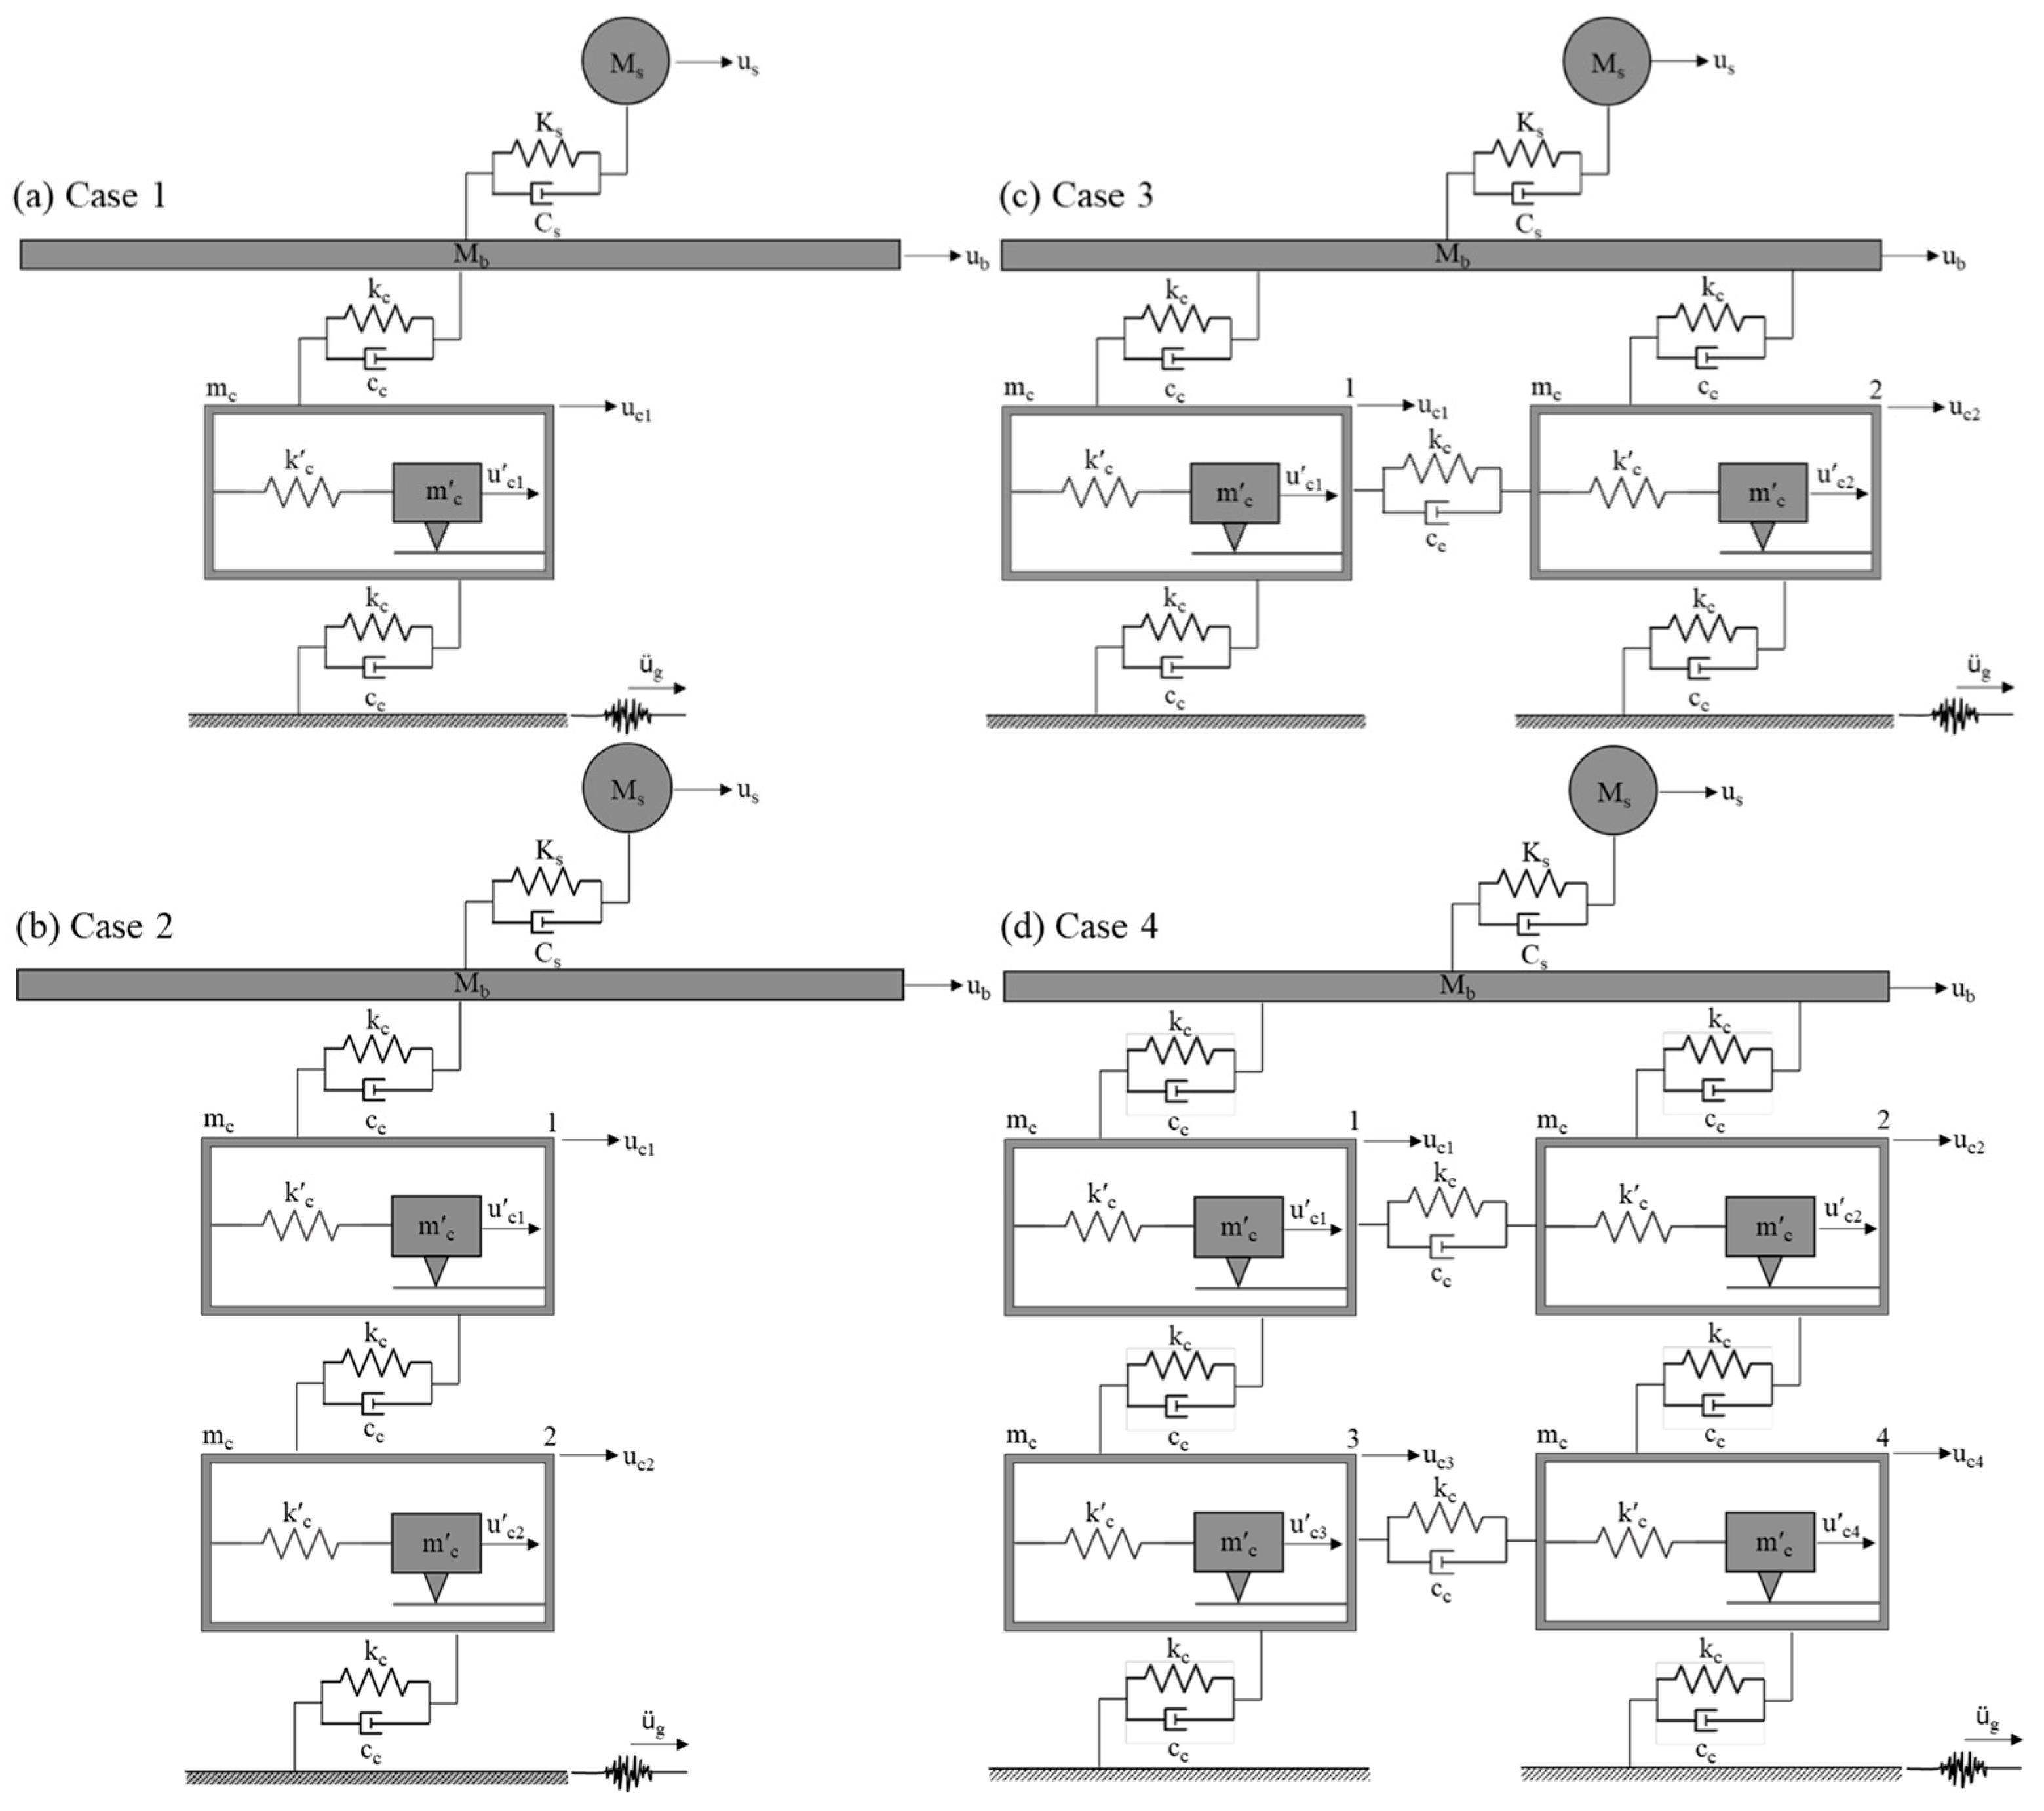
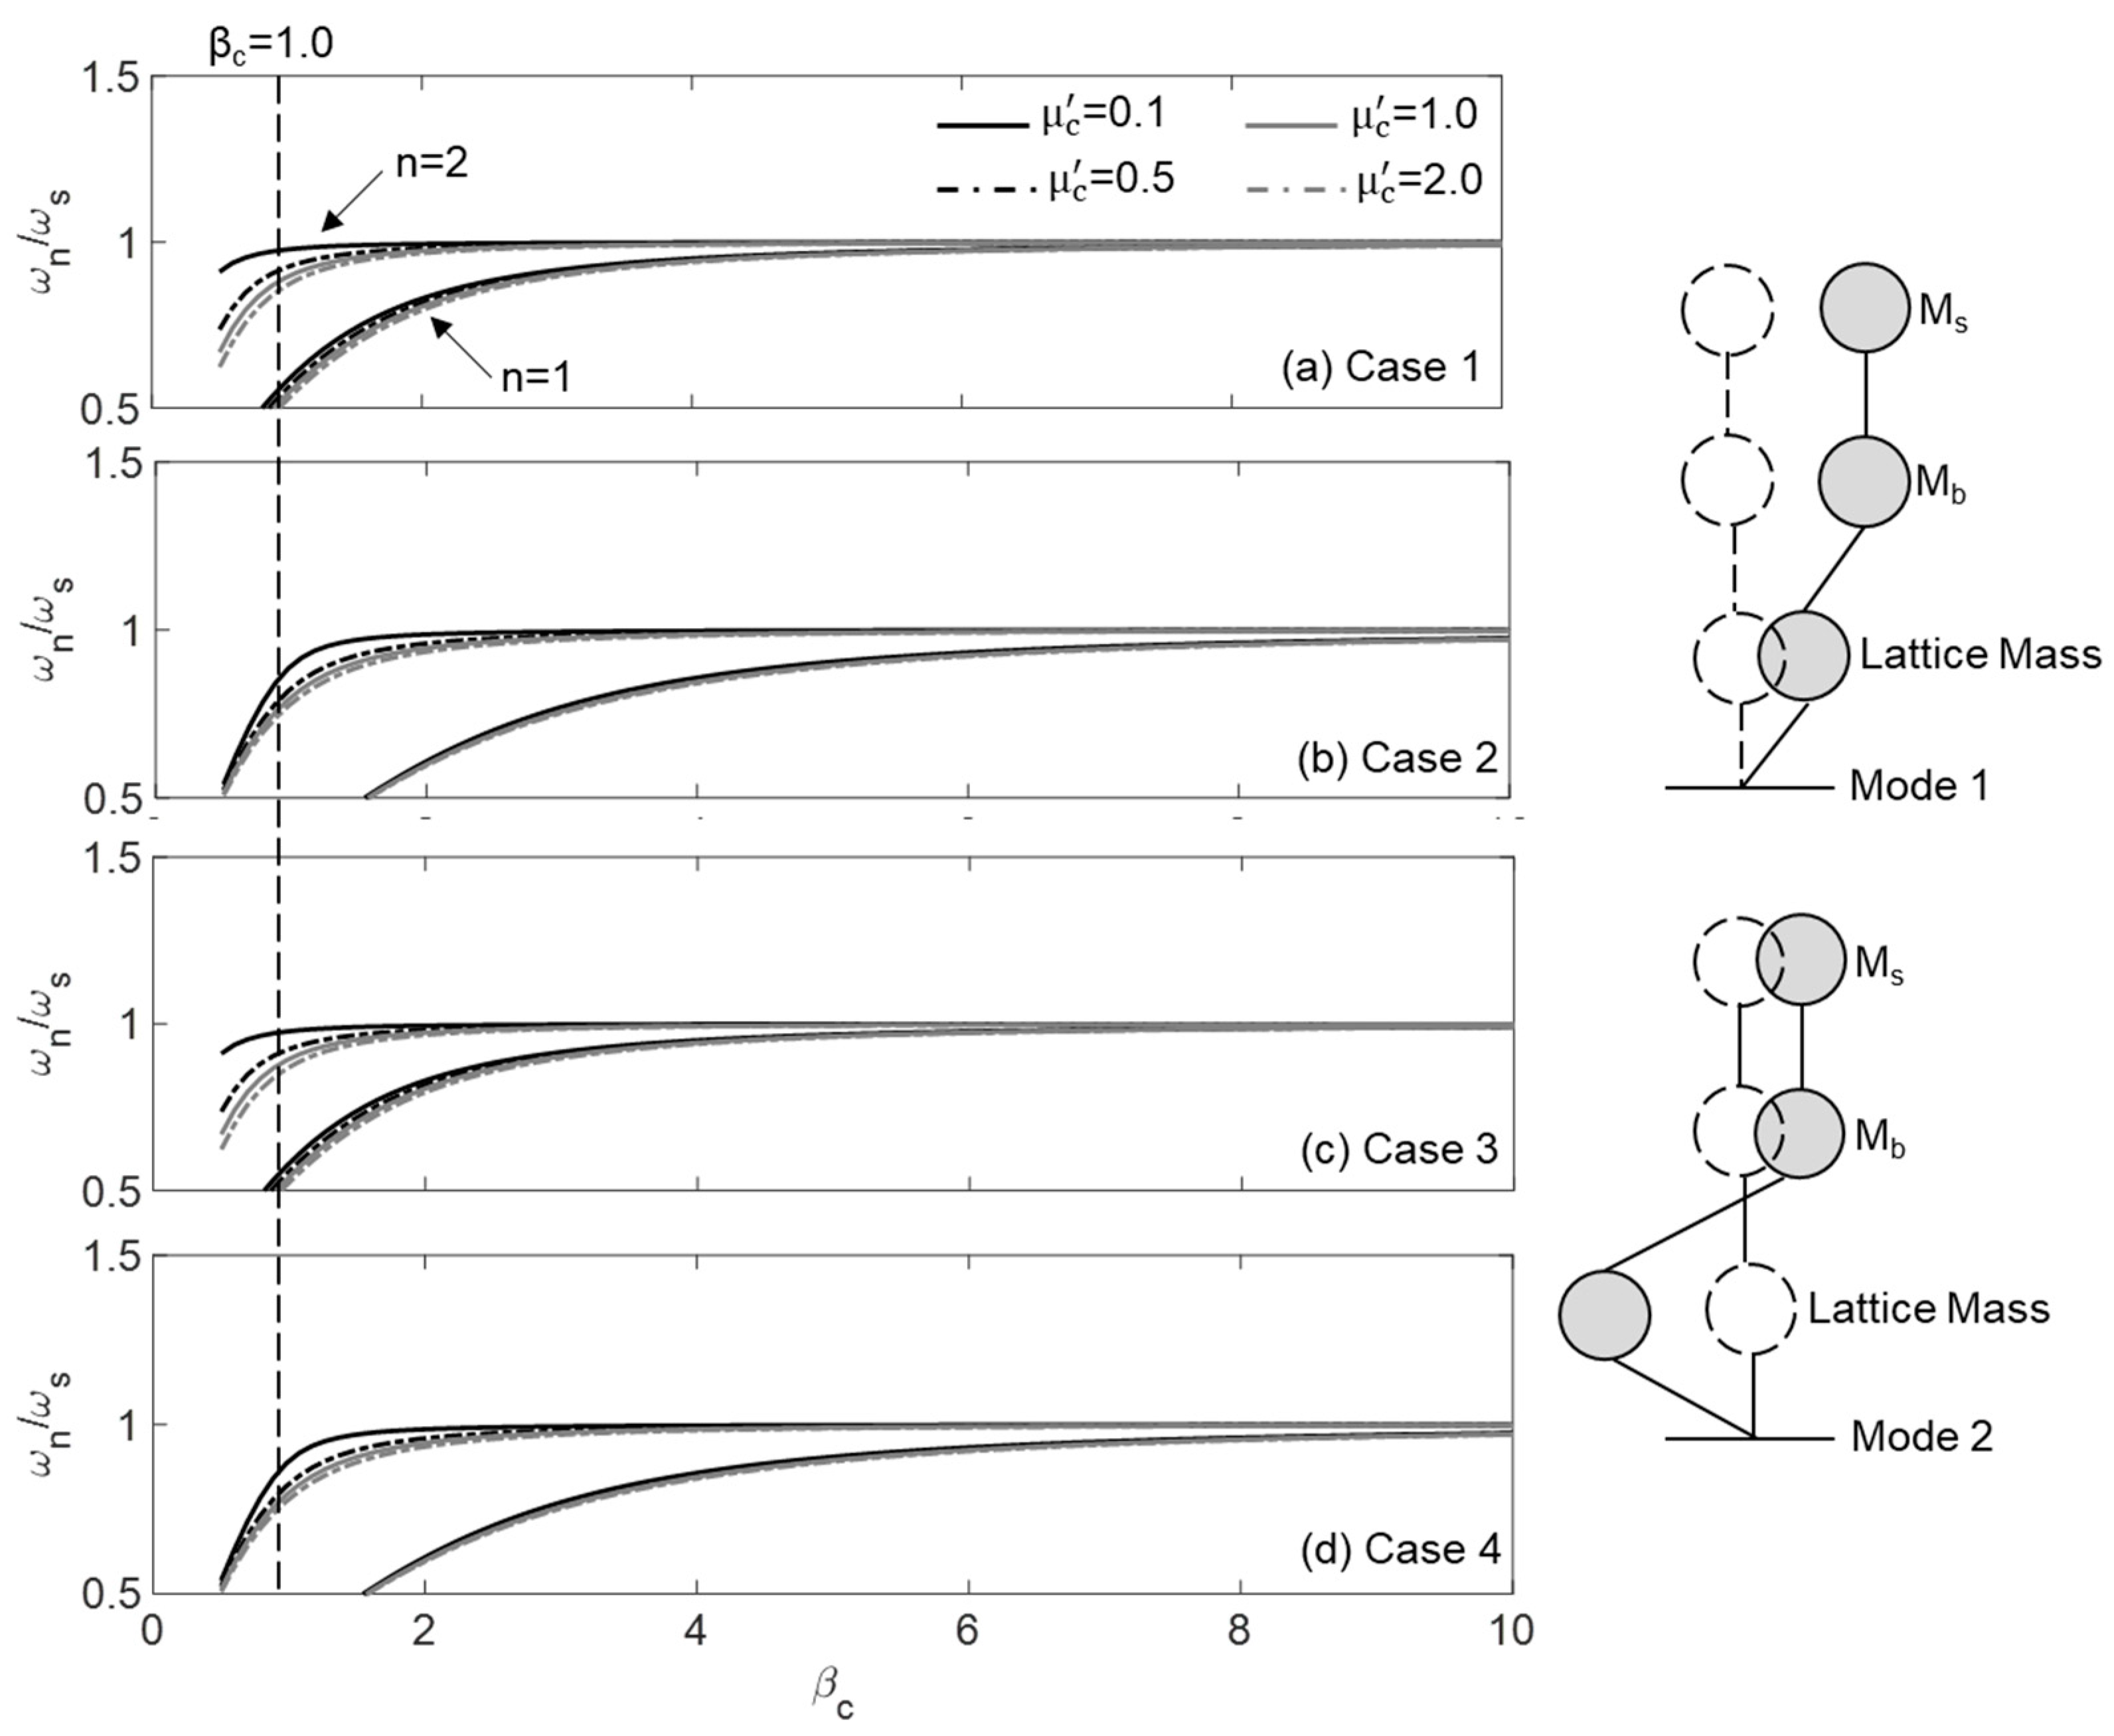
2.4. Lattice with Four Cell Configurations
- (i)
- Case 1 with Nc = 1: In this case, a single cell is positioned between the base floor of the building and the ground. This case represents the most basic form of the proposed PFMSBI system, which includes only a single cell with a resonator.
- (ii)
- Case 2 with Nc = 2: This case includes two vertically aligned cells connecting the base floor to the ground. This case shows the influence of the vertical extension of cells in which the cells are acting in parallel. The cells have a layered configuration, which is like the soil layers beneath a building.
- (iii)
- Case 3 with Nc = 2: In this case, two horizontally aligned cells are used to connect the base floor to the ground. This case shows the influence of the horizontal extension of cells in which the cells are acting in series.
- (iv)
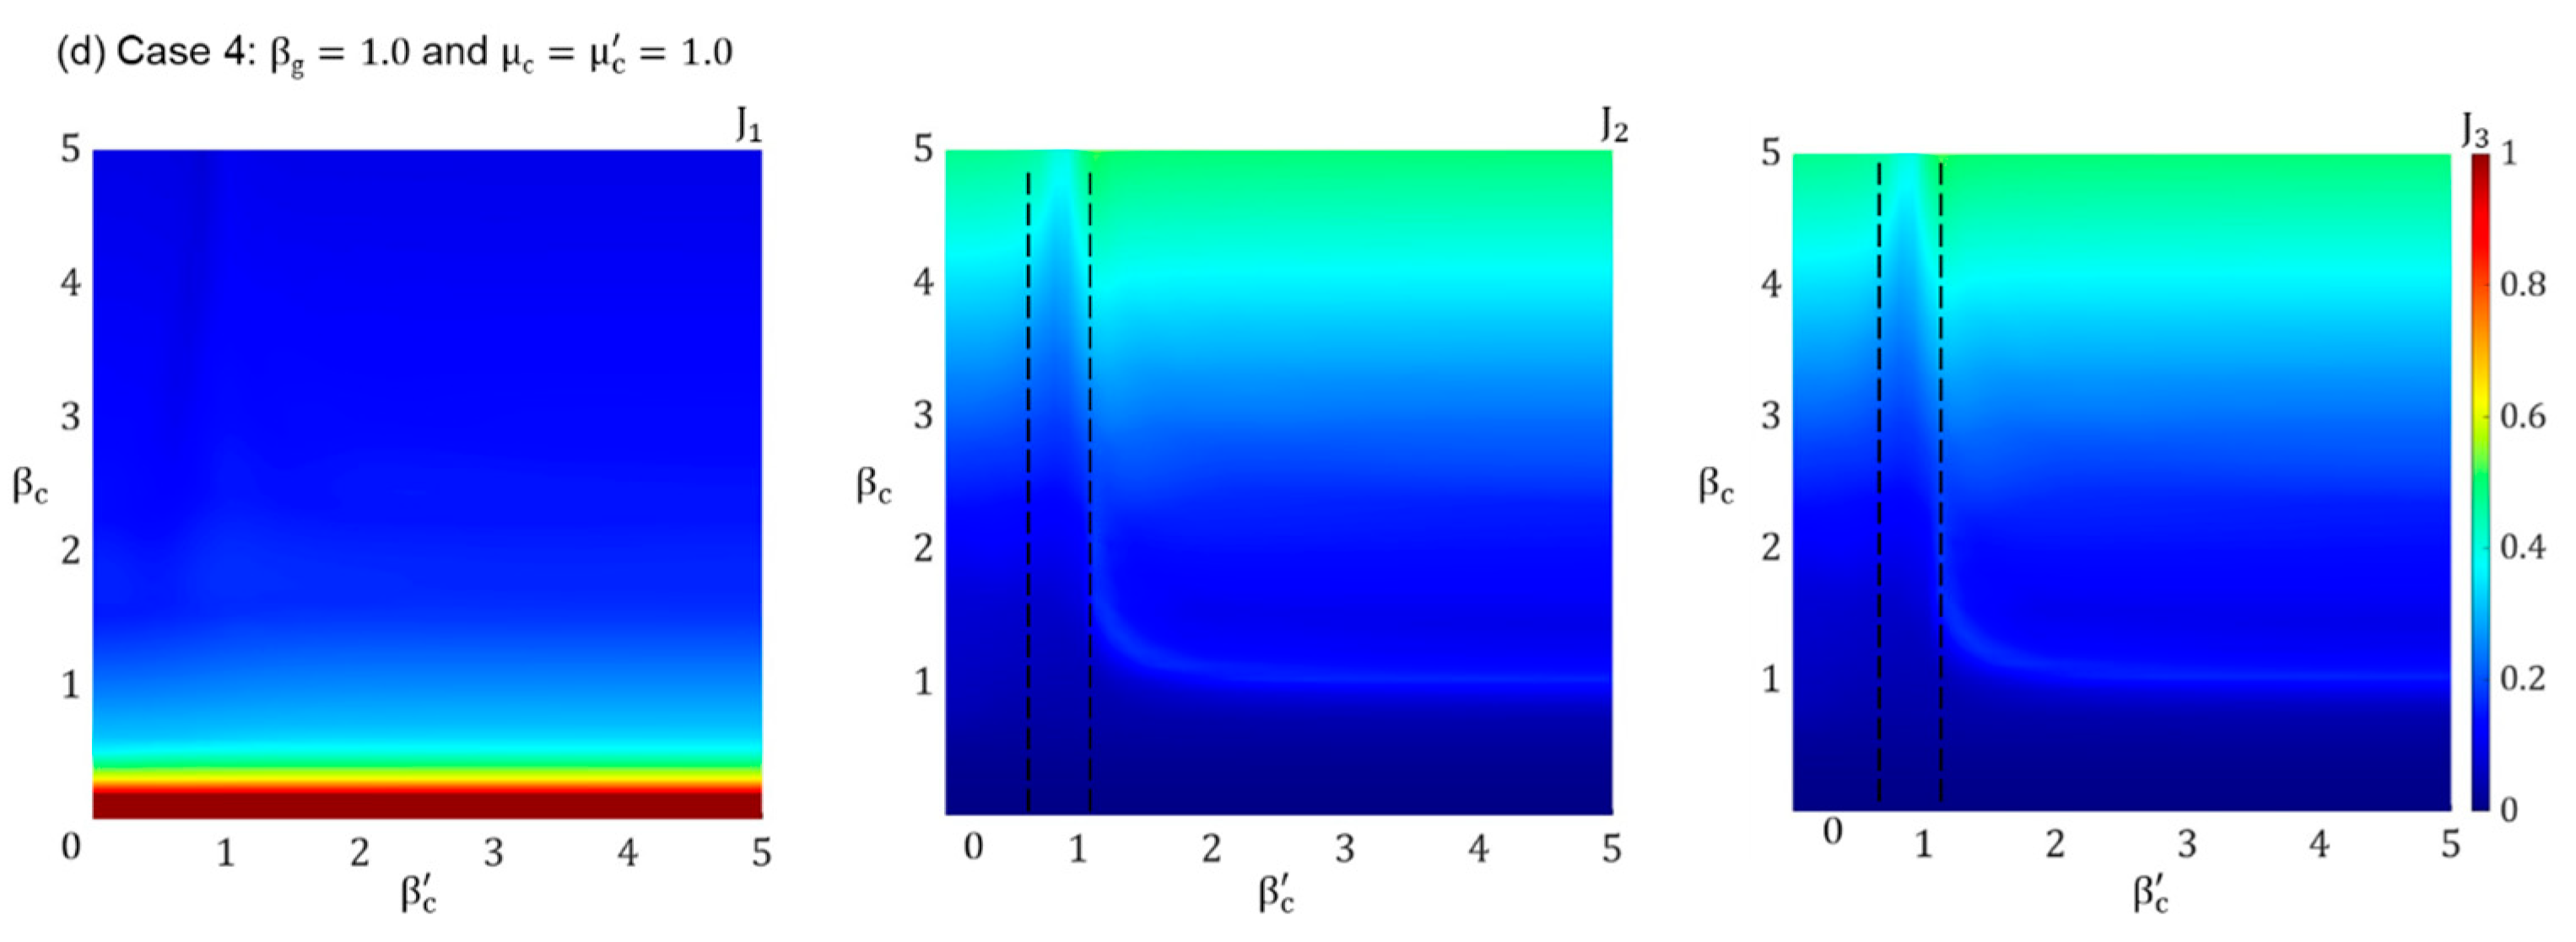
- Case 4 with Nc = 4: This case consists of four cells arranged in a 2 × 2 configuration, which is a combination of Case 2 and Case 3. This case is a combination of Cases 2 and 3 showing the influence of the extension of cells in both the vertical and horizontal directions.
3. Response to Harmonic Excitations
3.1. Two-Story Base-Isolated Building
3.2. Natural Frequencies and Modes
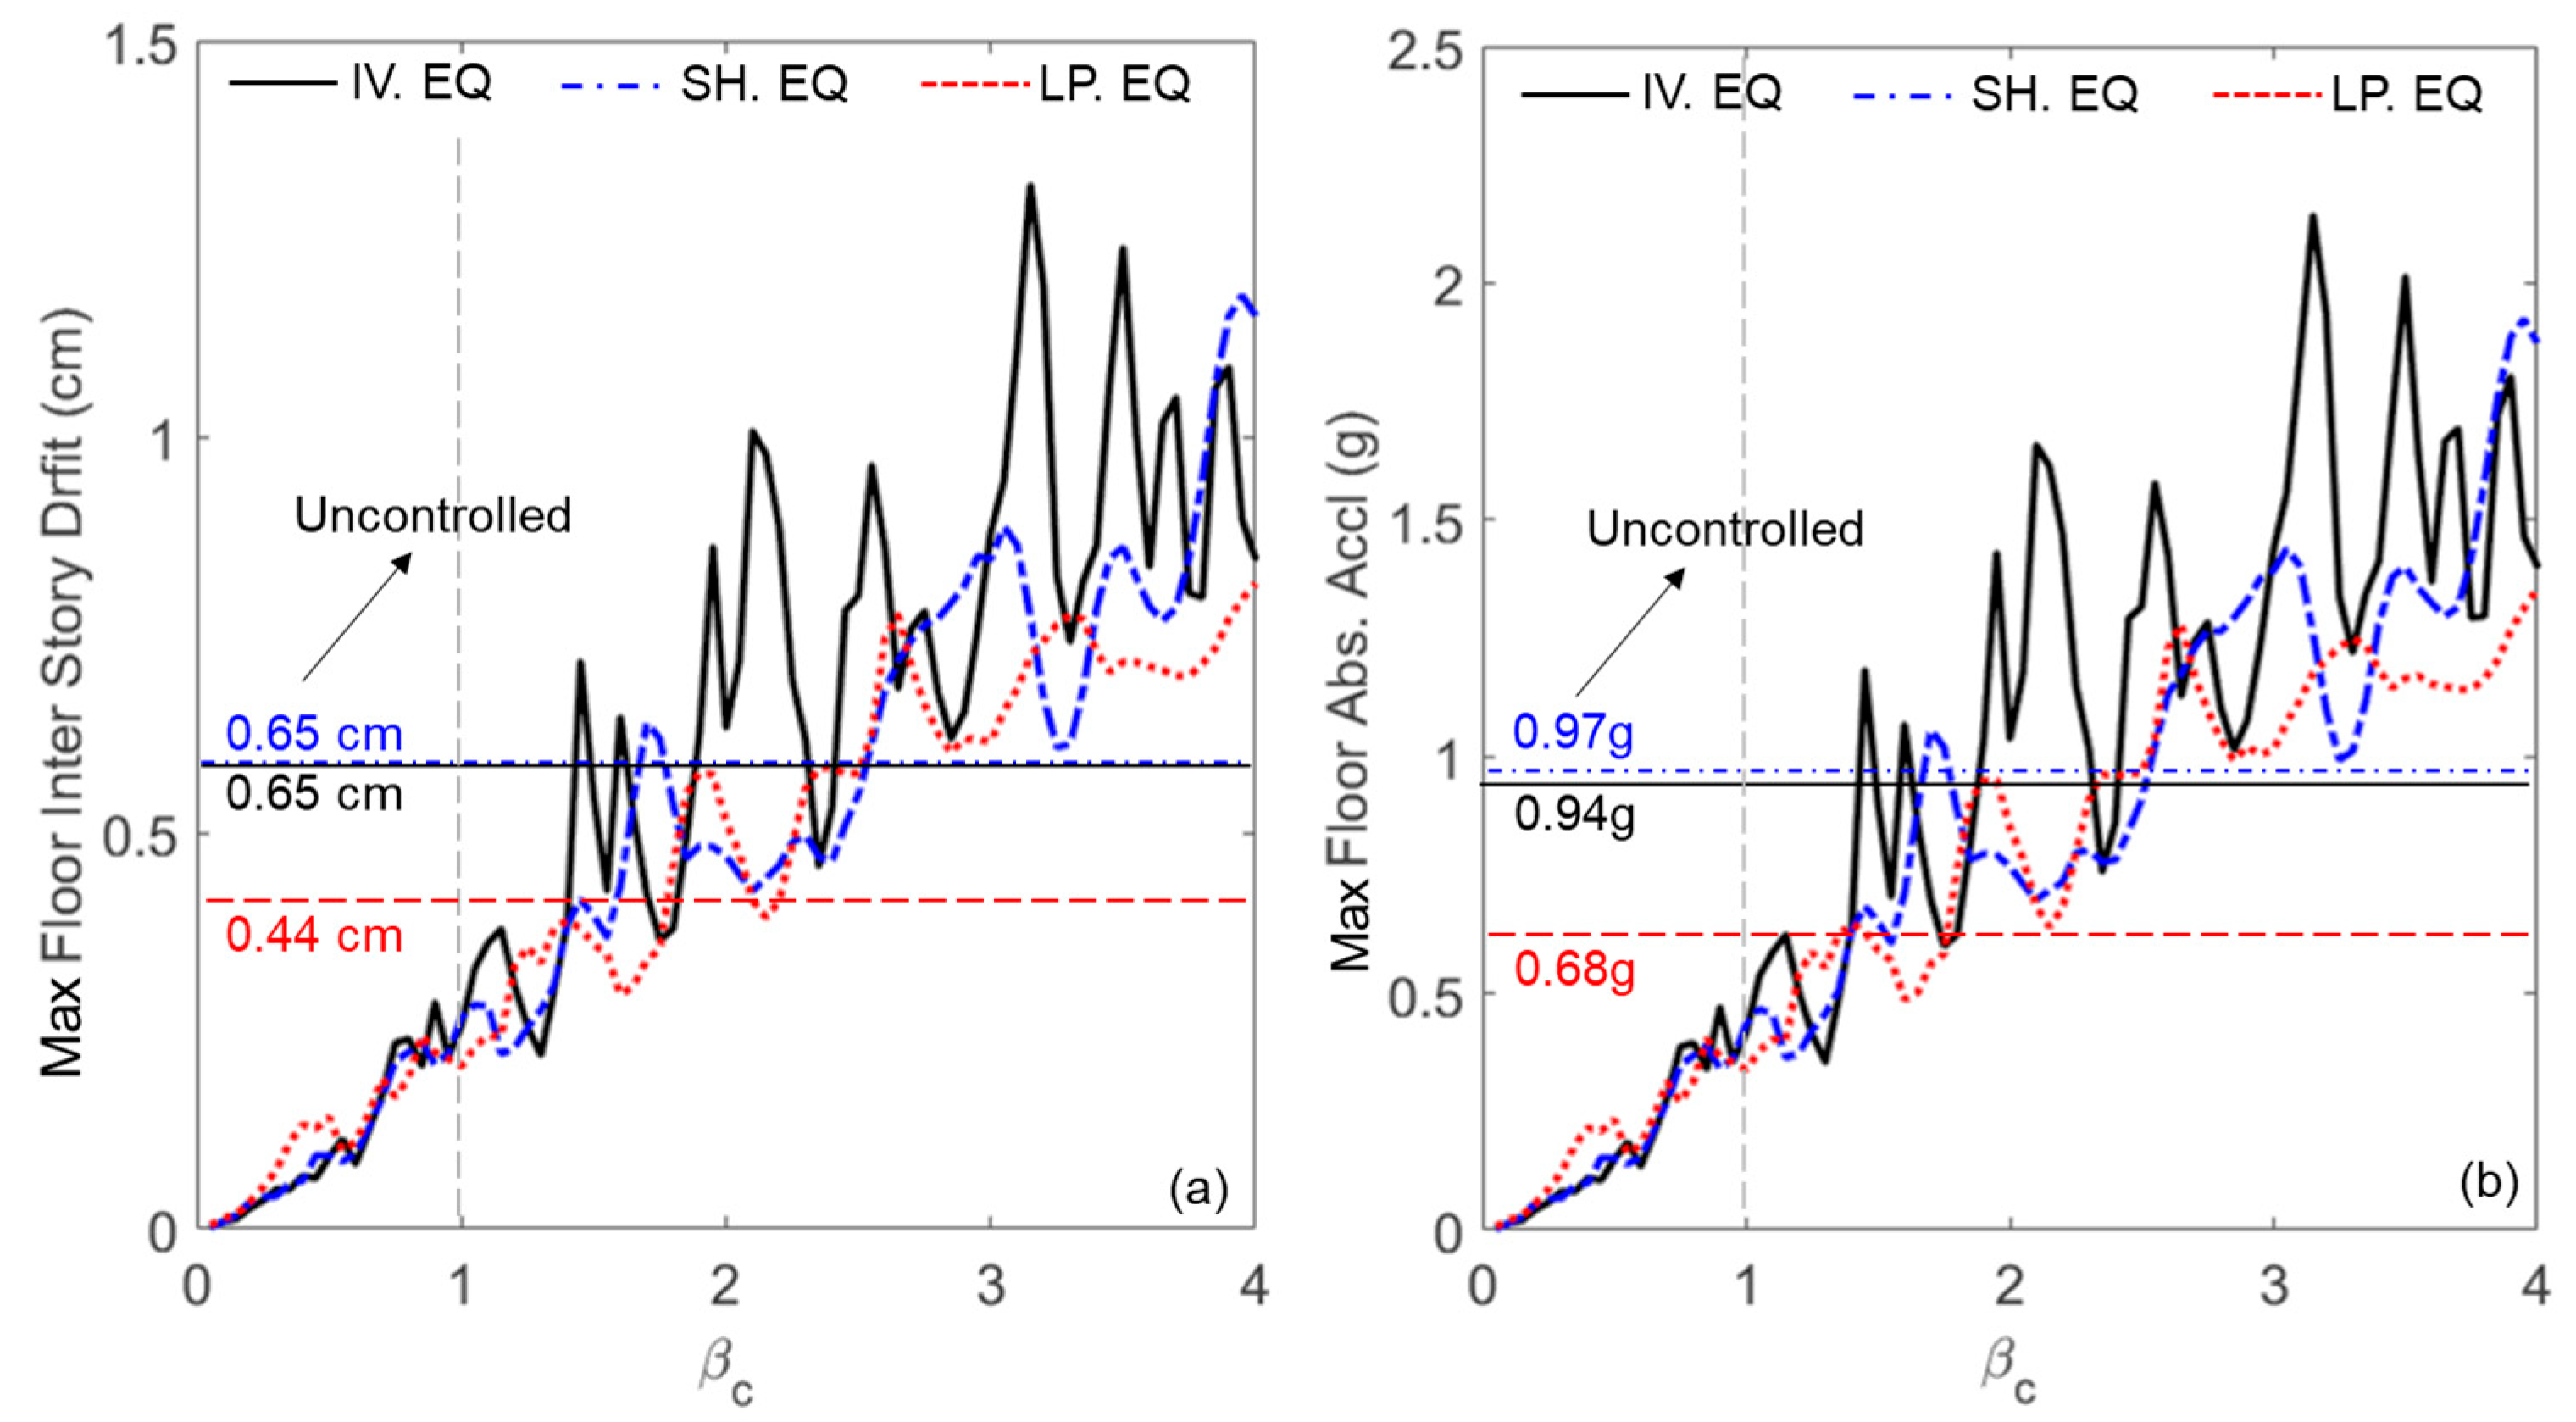
3.3. Parametric Study
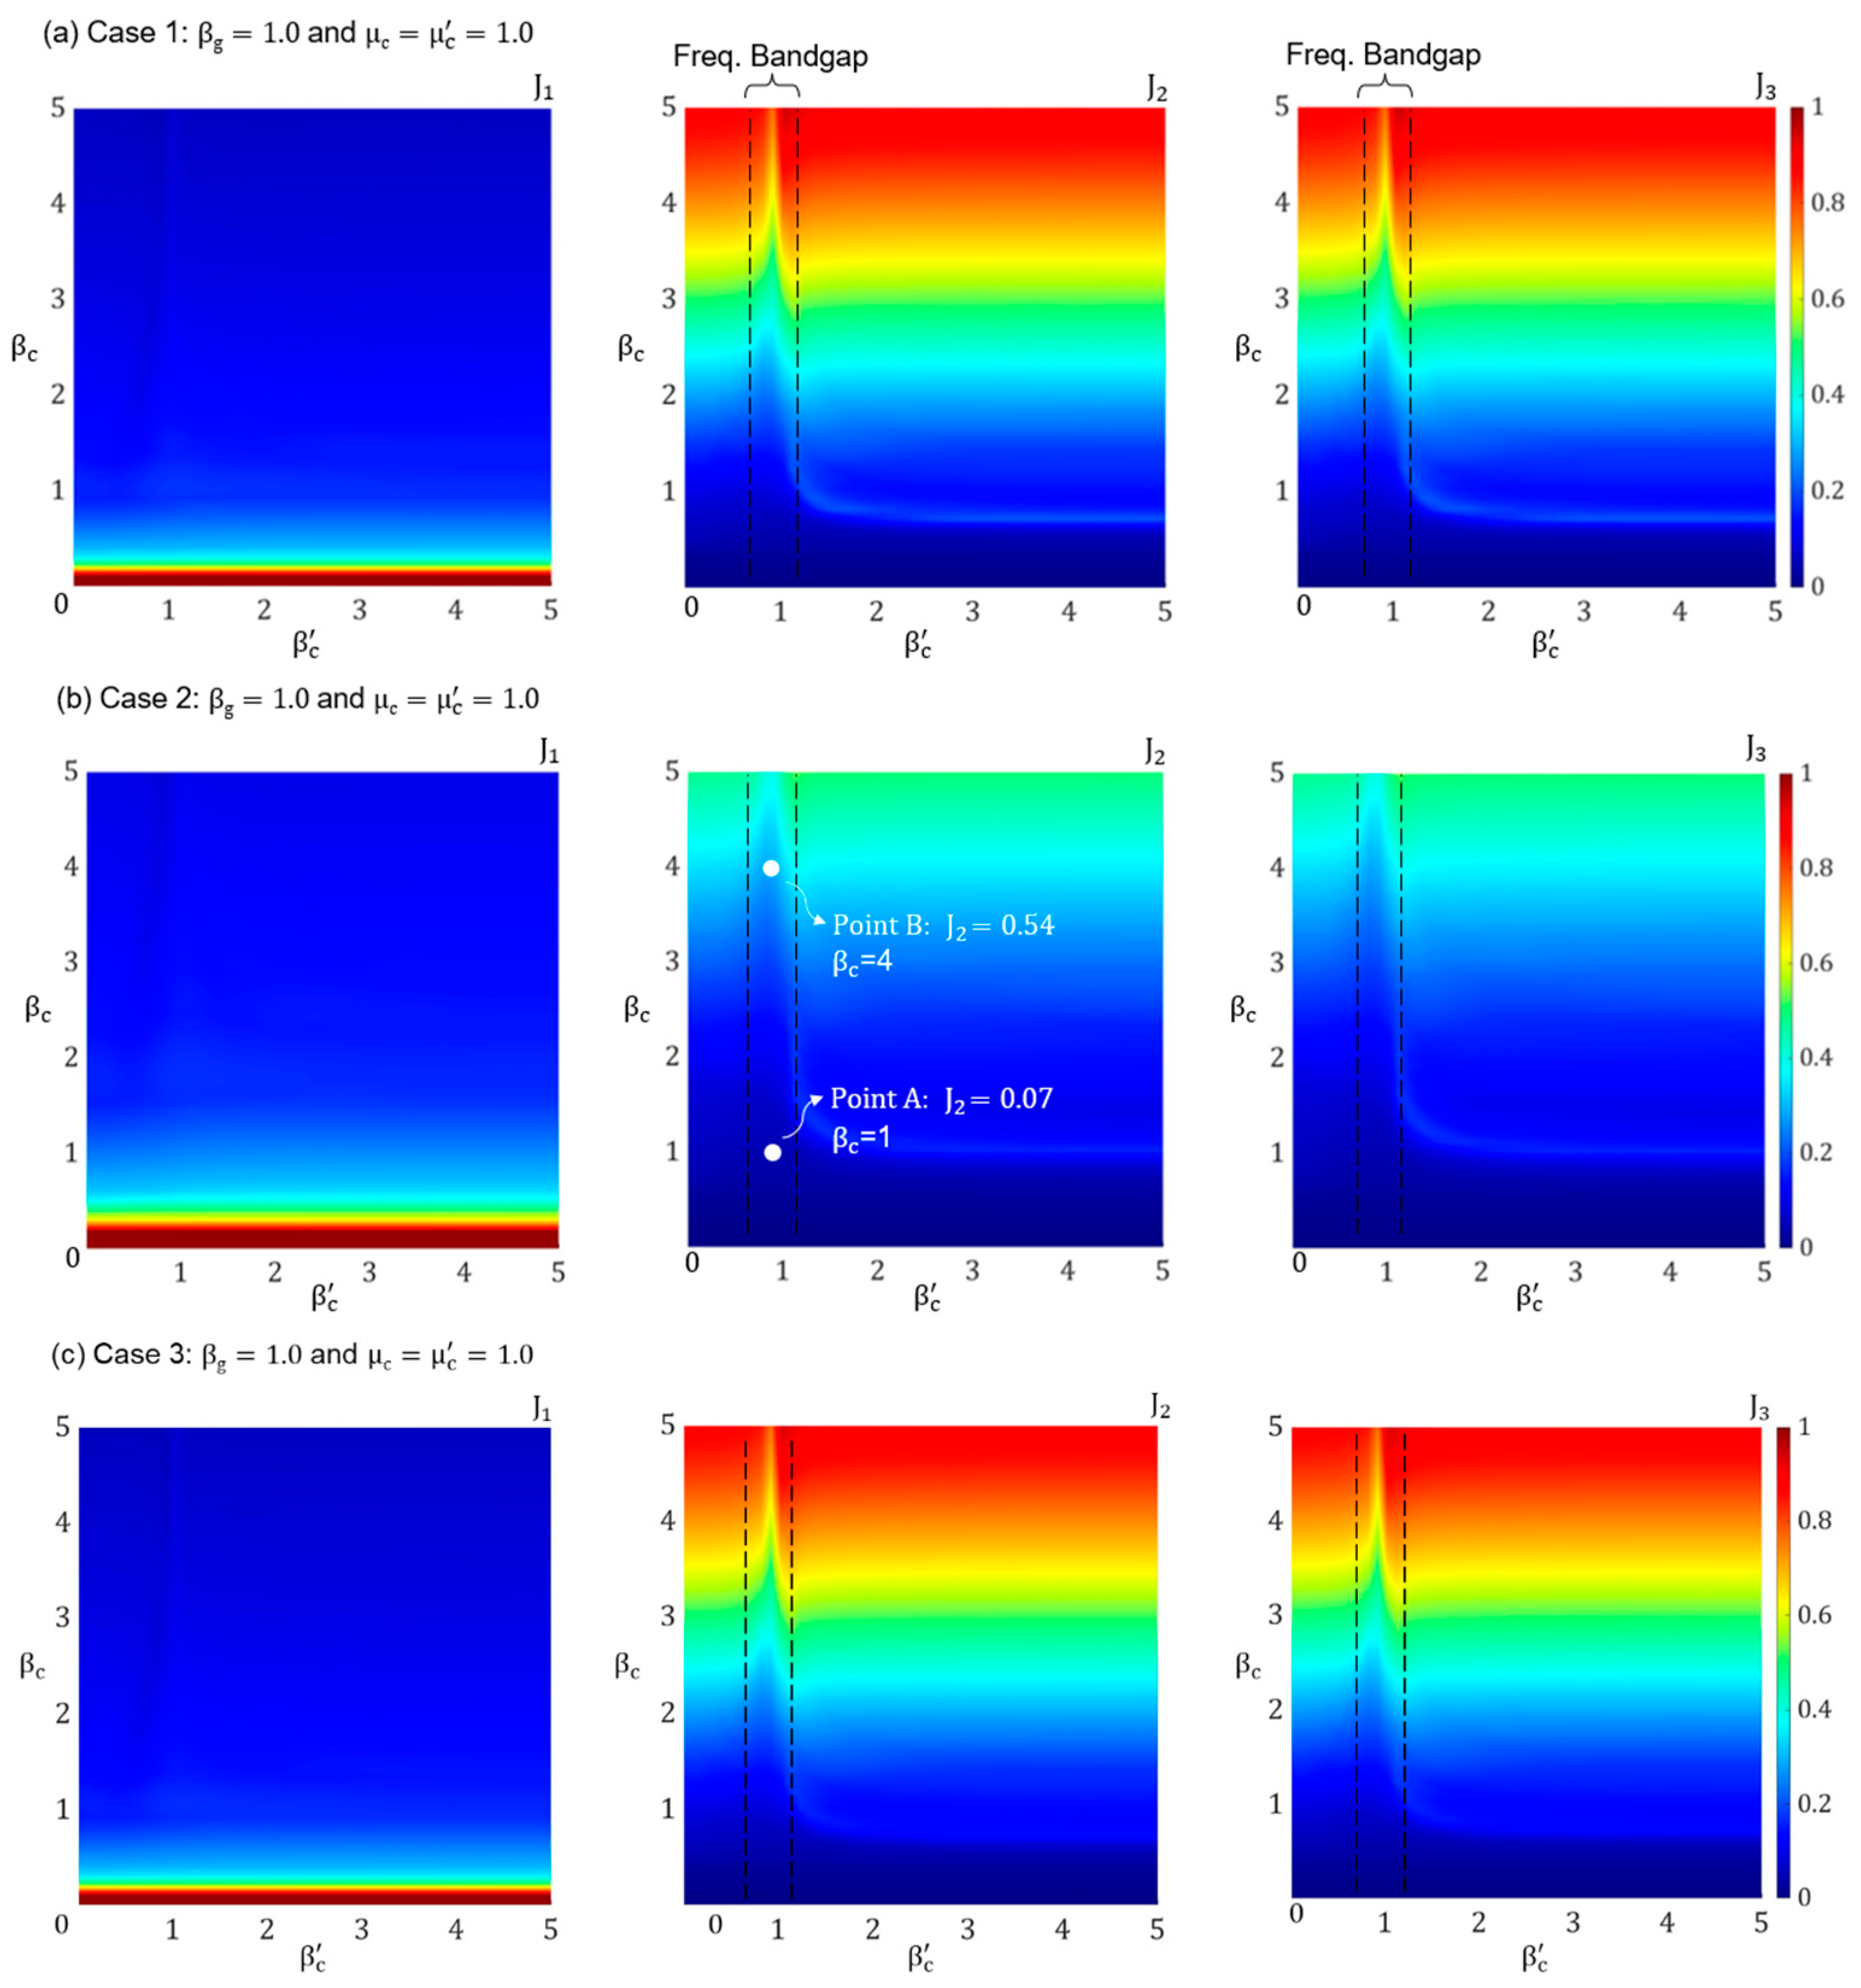
- The peak displacement of the base floor normalized to the peak displacement of the superstructure without the PFSMBI system (Nc = 0).
- The peak inter-story drift of the superstructure normalized to the peak displacement of the superstructure without the PFSMBI system.
- The peak absolute acceleration of the superstructure normalized to the same response of the building without the PFSMBI system.
3.3.1. Influence of Tuning Frequency Ratios: and
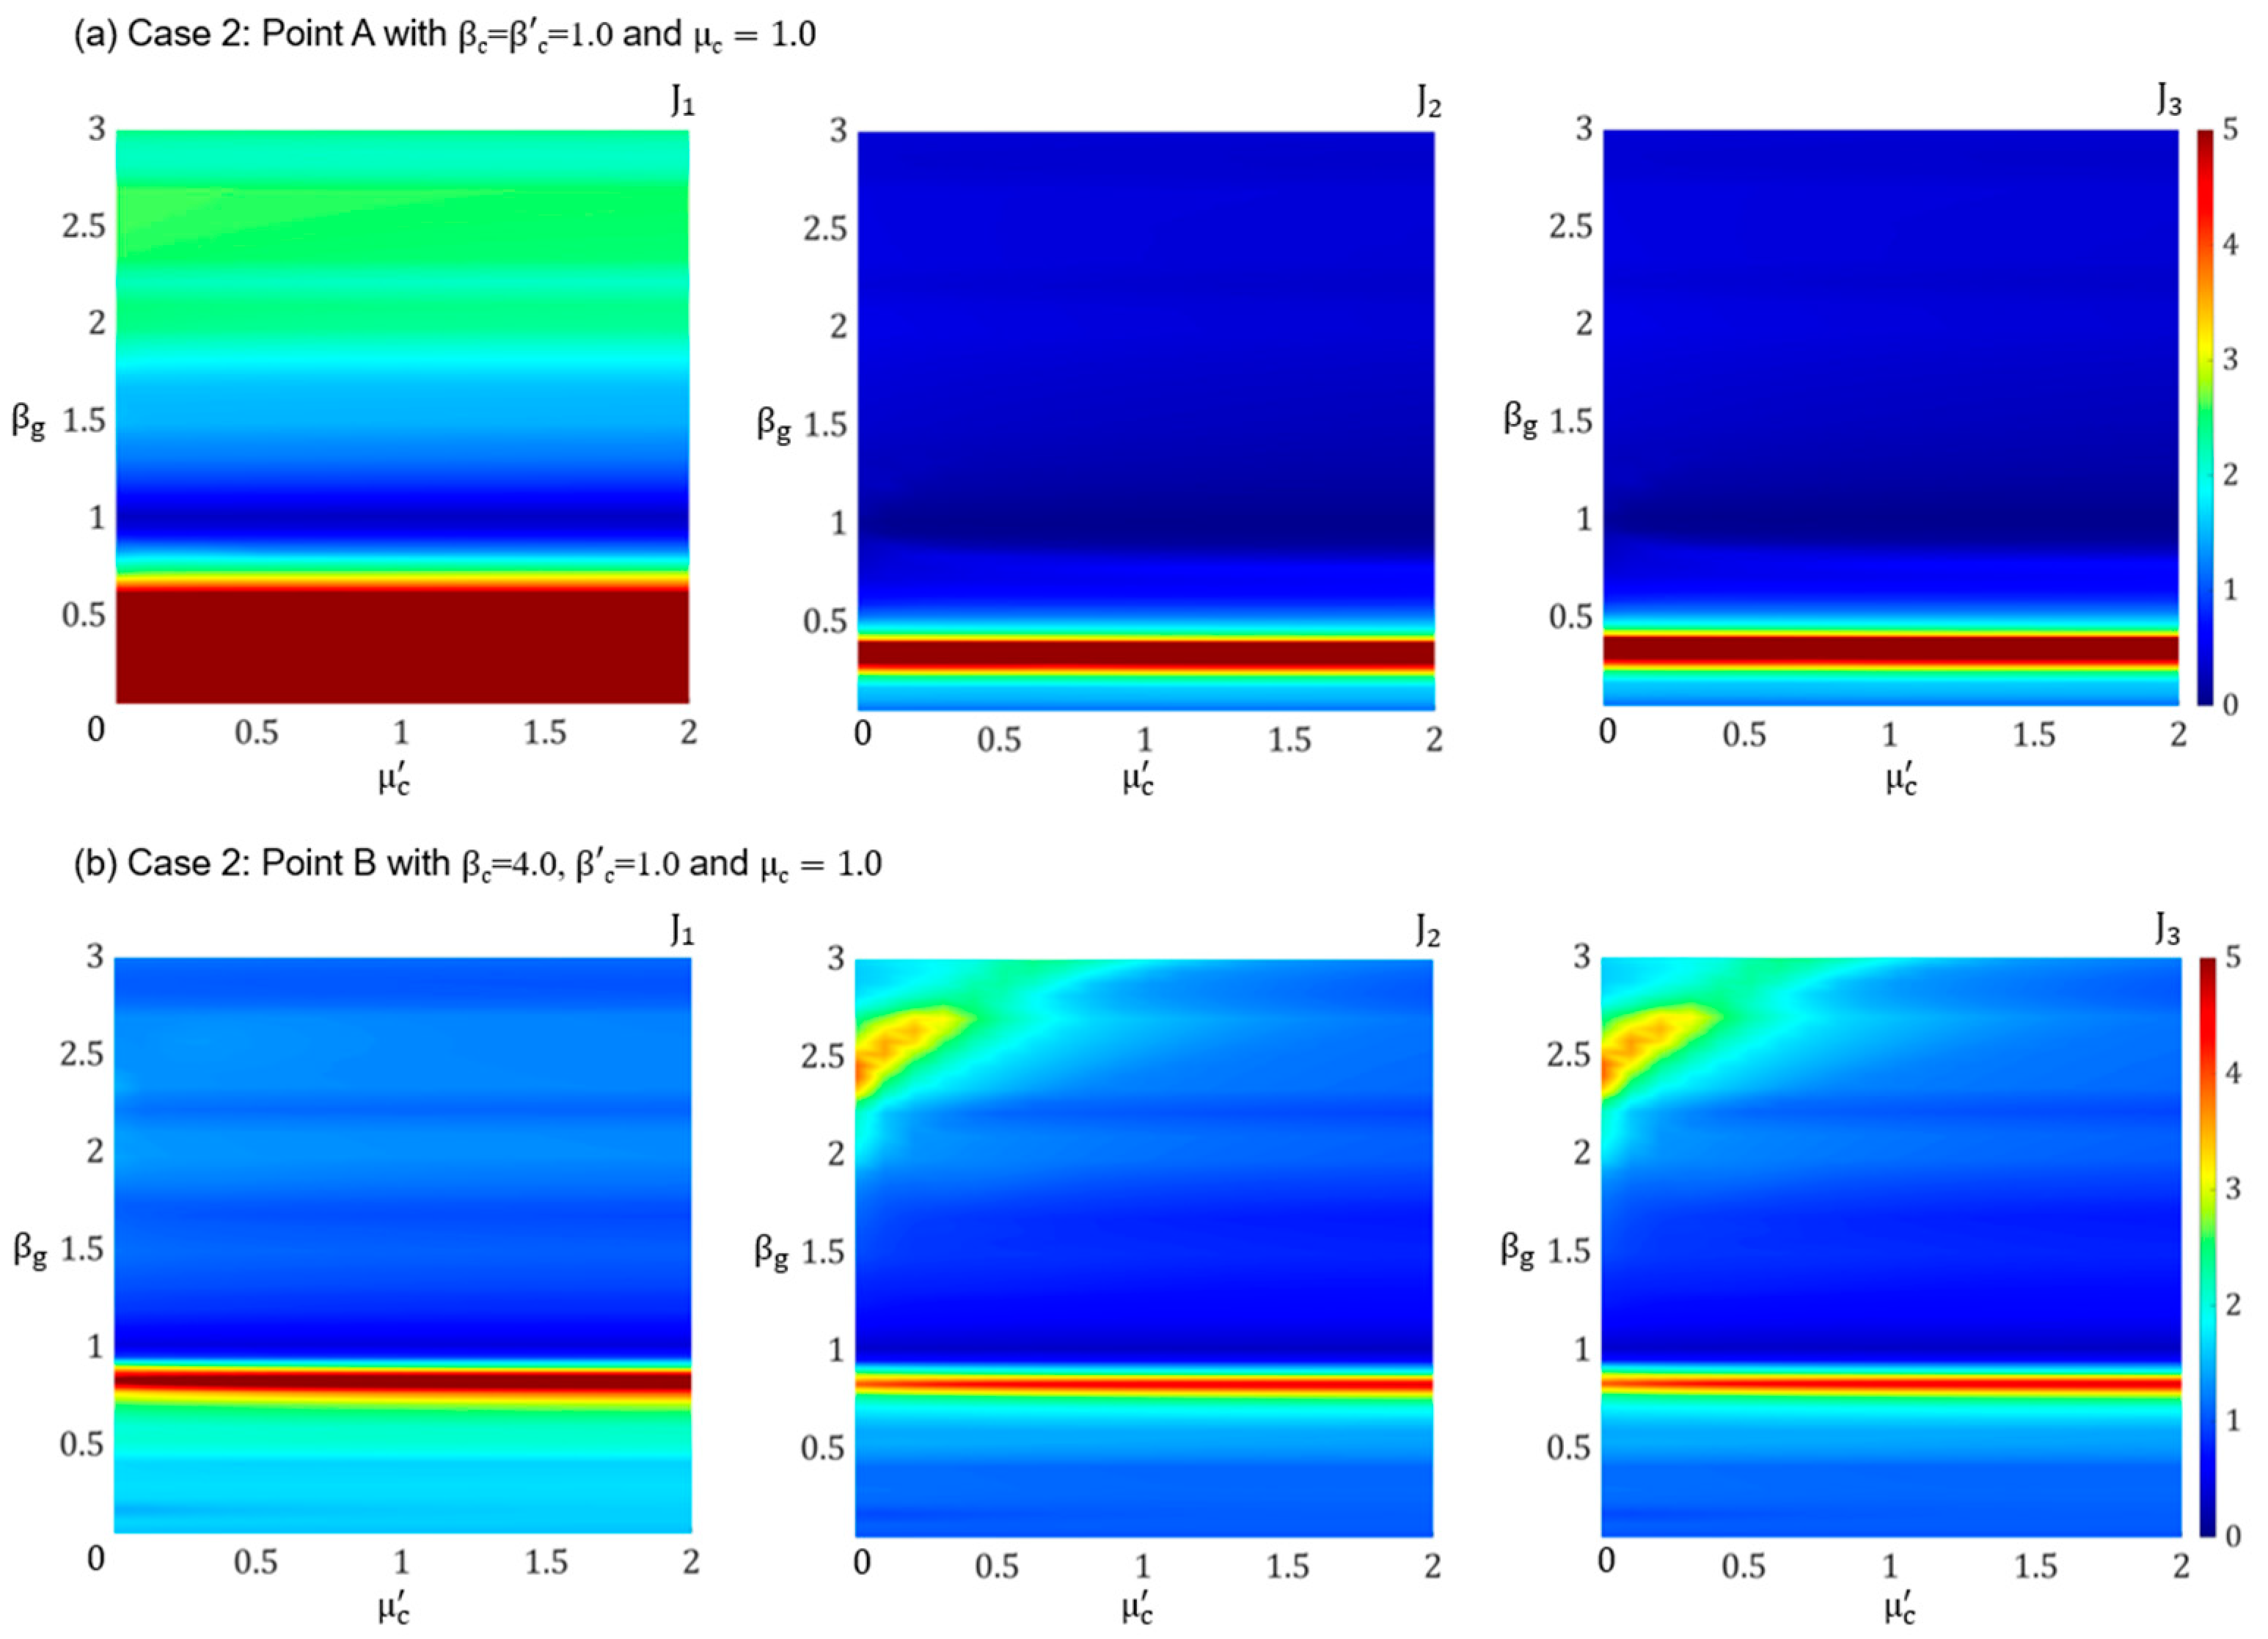
3.3.2. Influence of Mass Ratios: ,
3.3.3. Influence of Input Frequency Ratio:
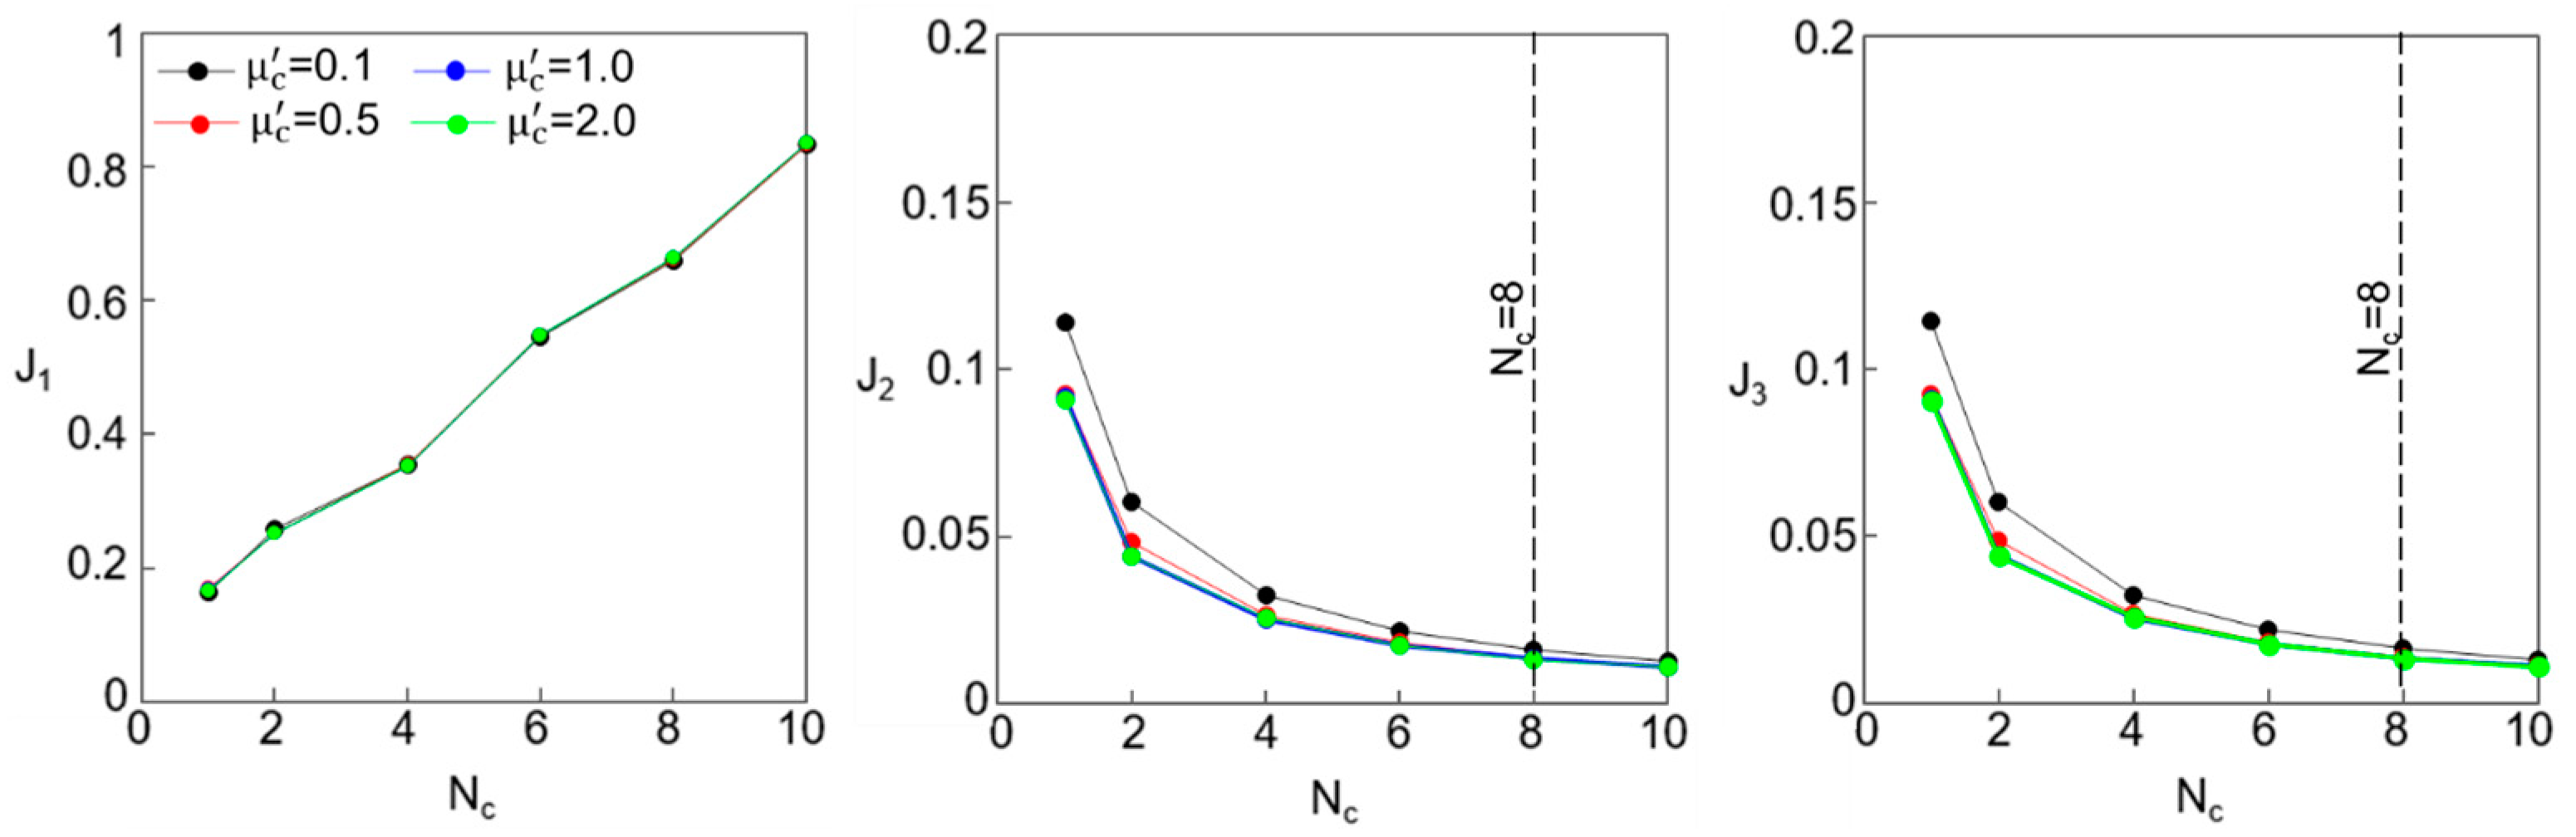
3.3.4. Influence of the Number of Cells: Nc
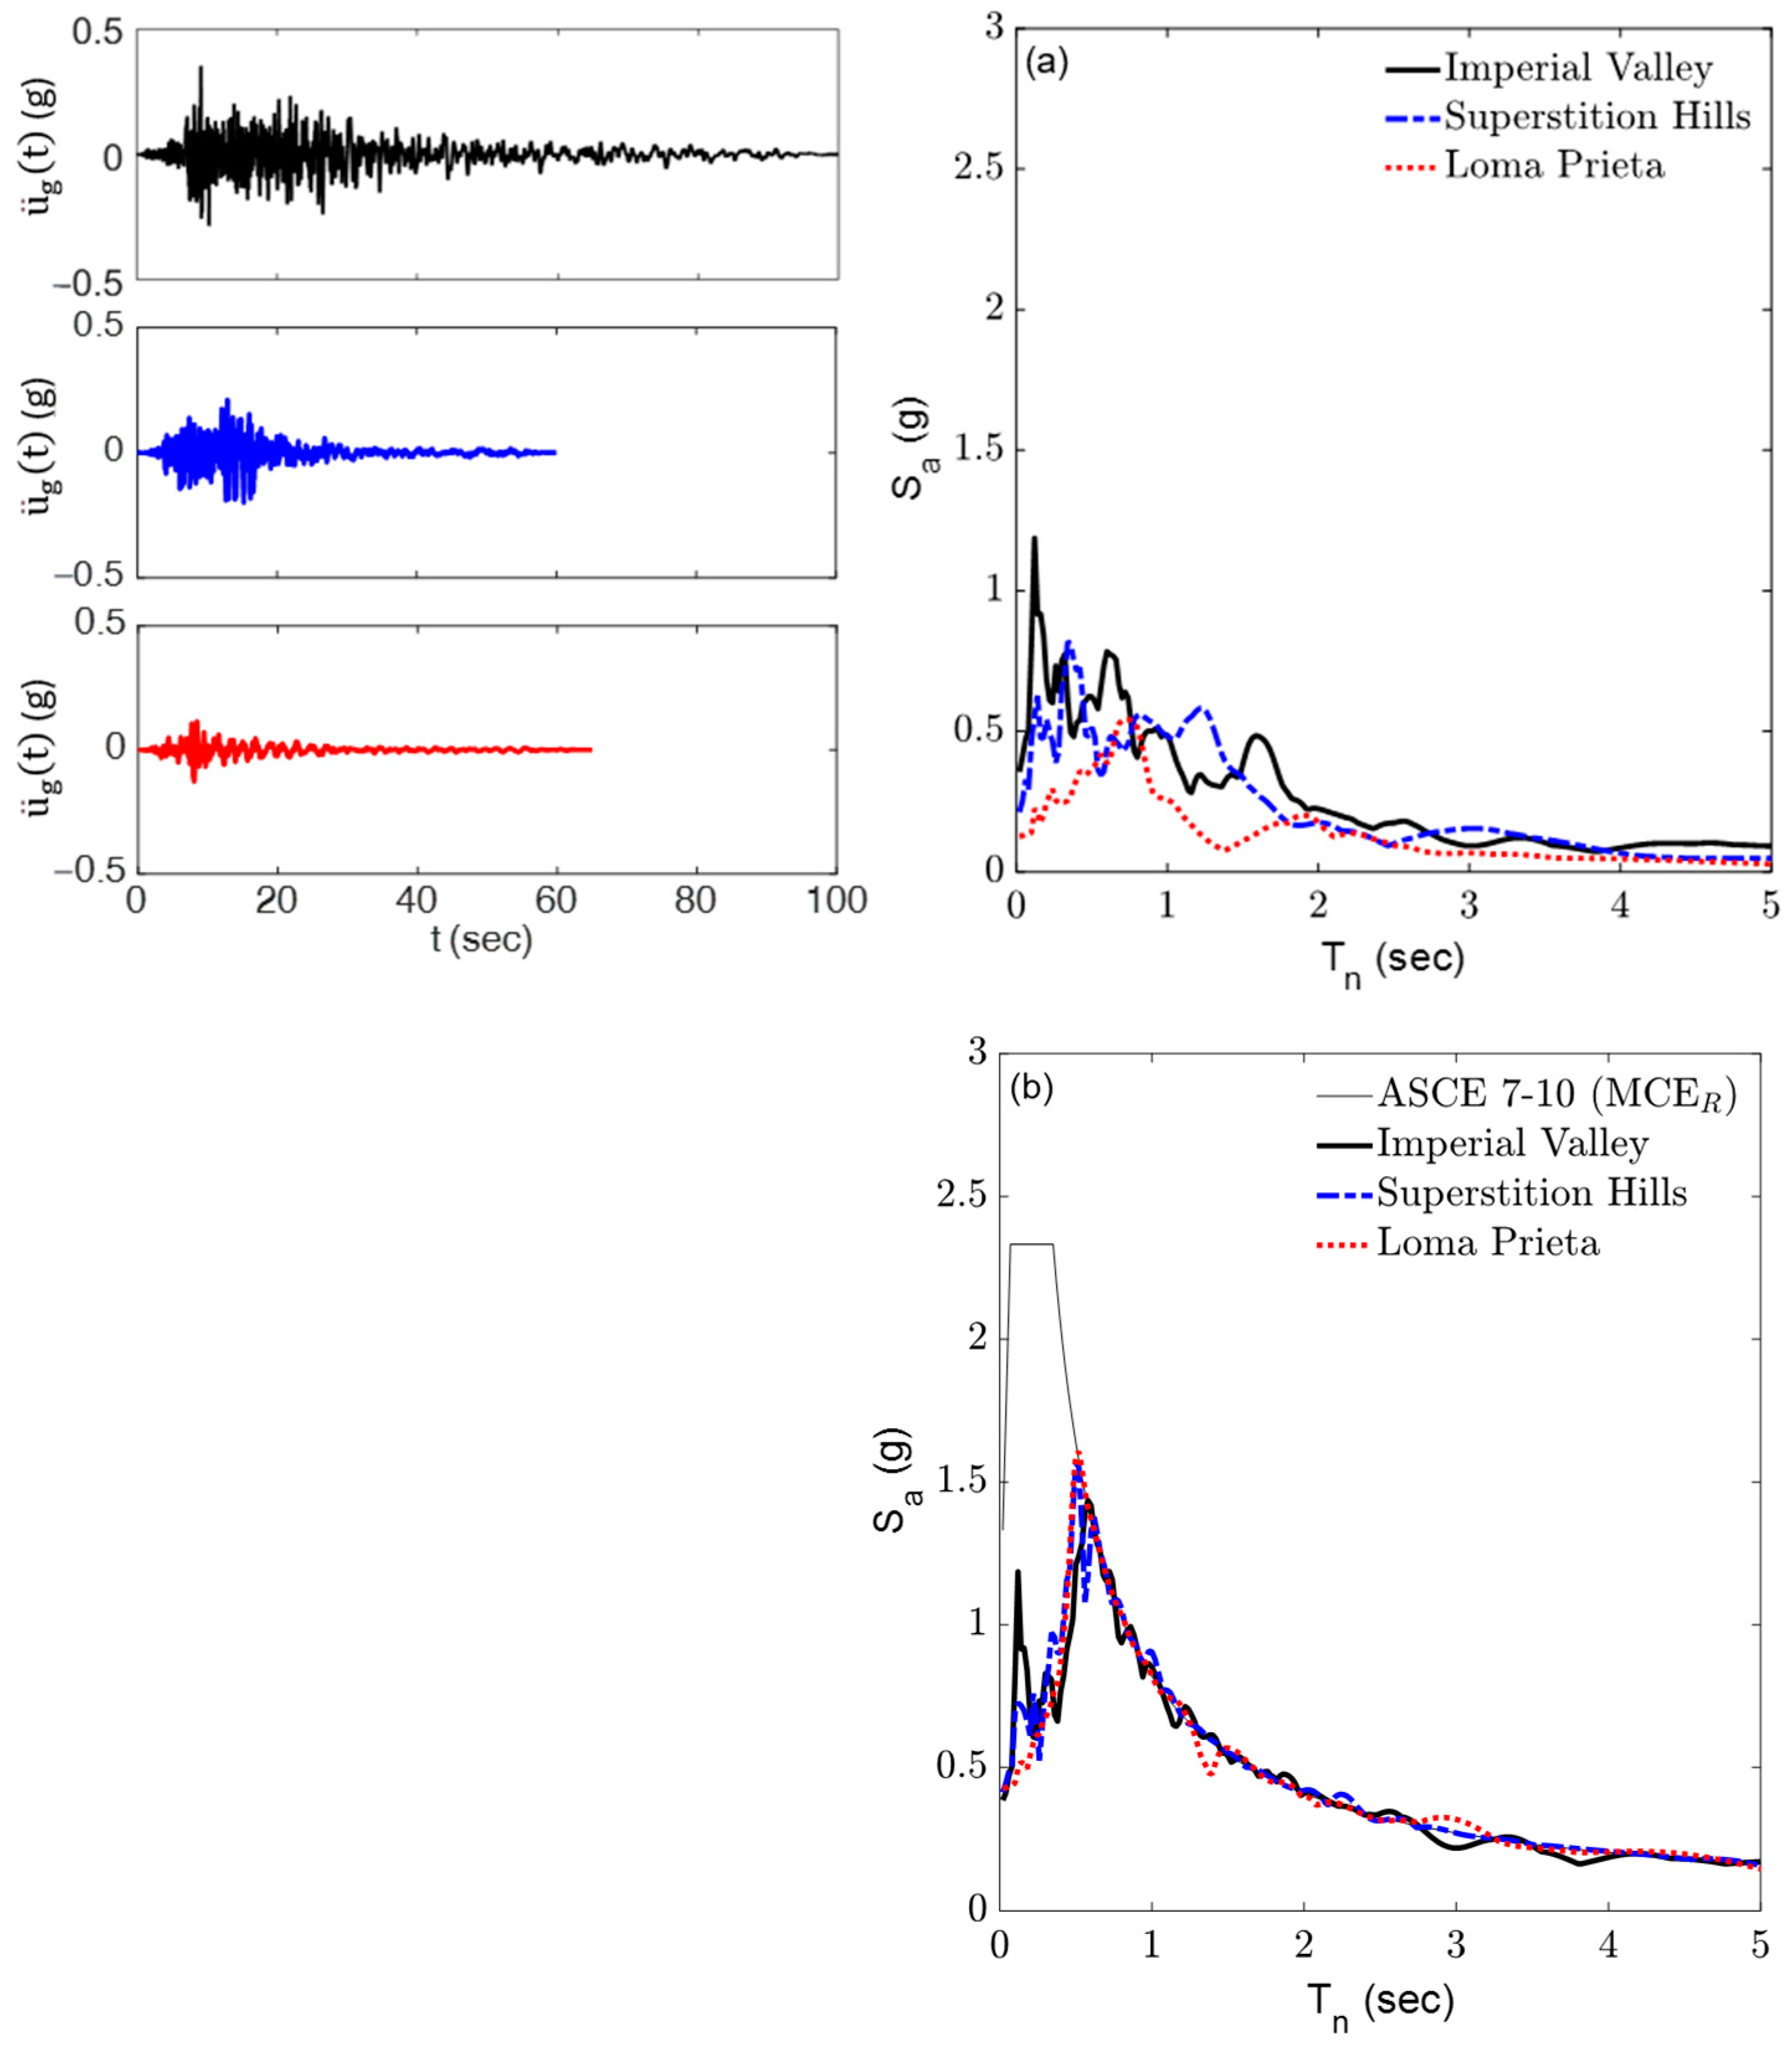
4. Response to Earthquake Excitations
4.1. Six-Story Base-Isolated Building Model
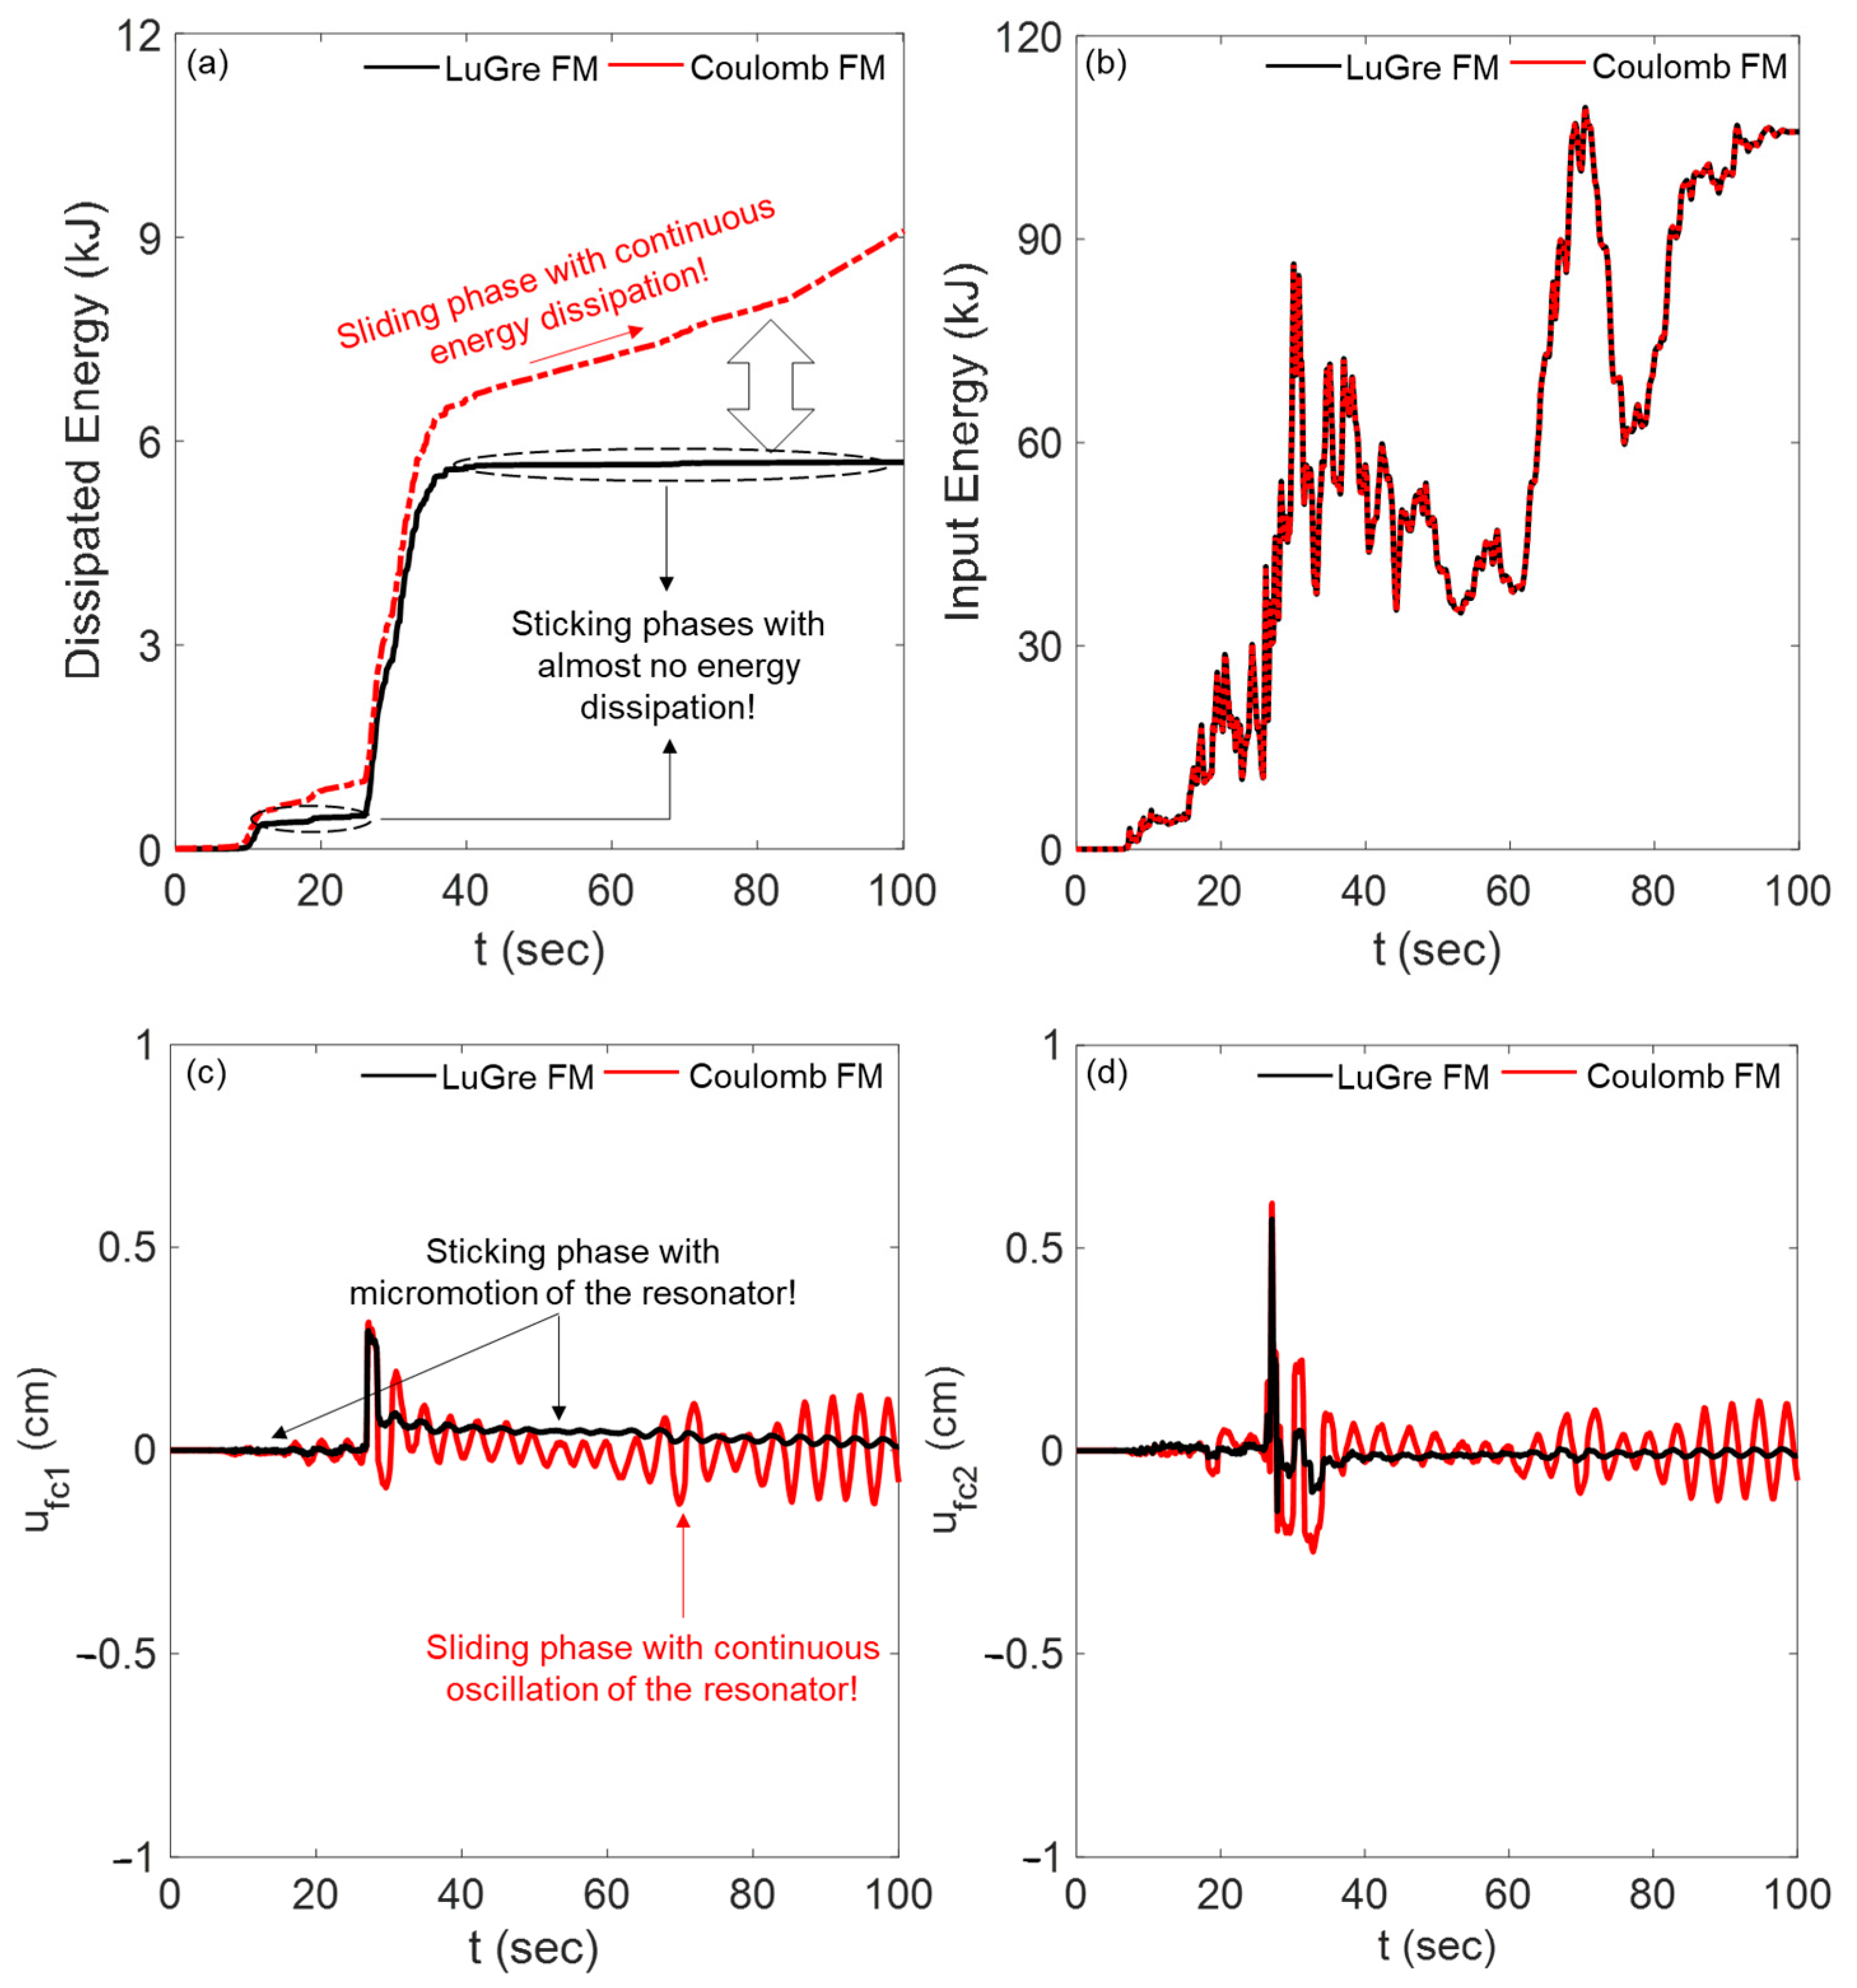
4.2. LuGre Friction Model (LFM)
4.3. Energy Dissipation Performance
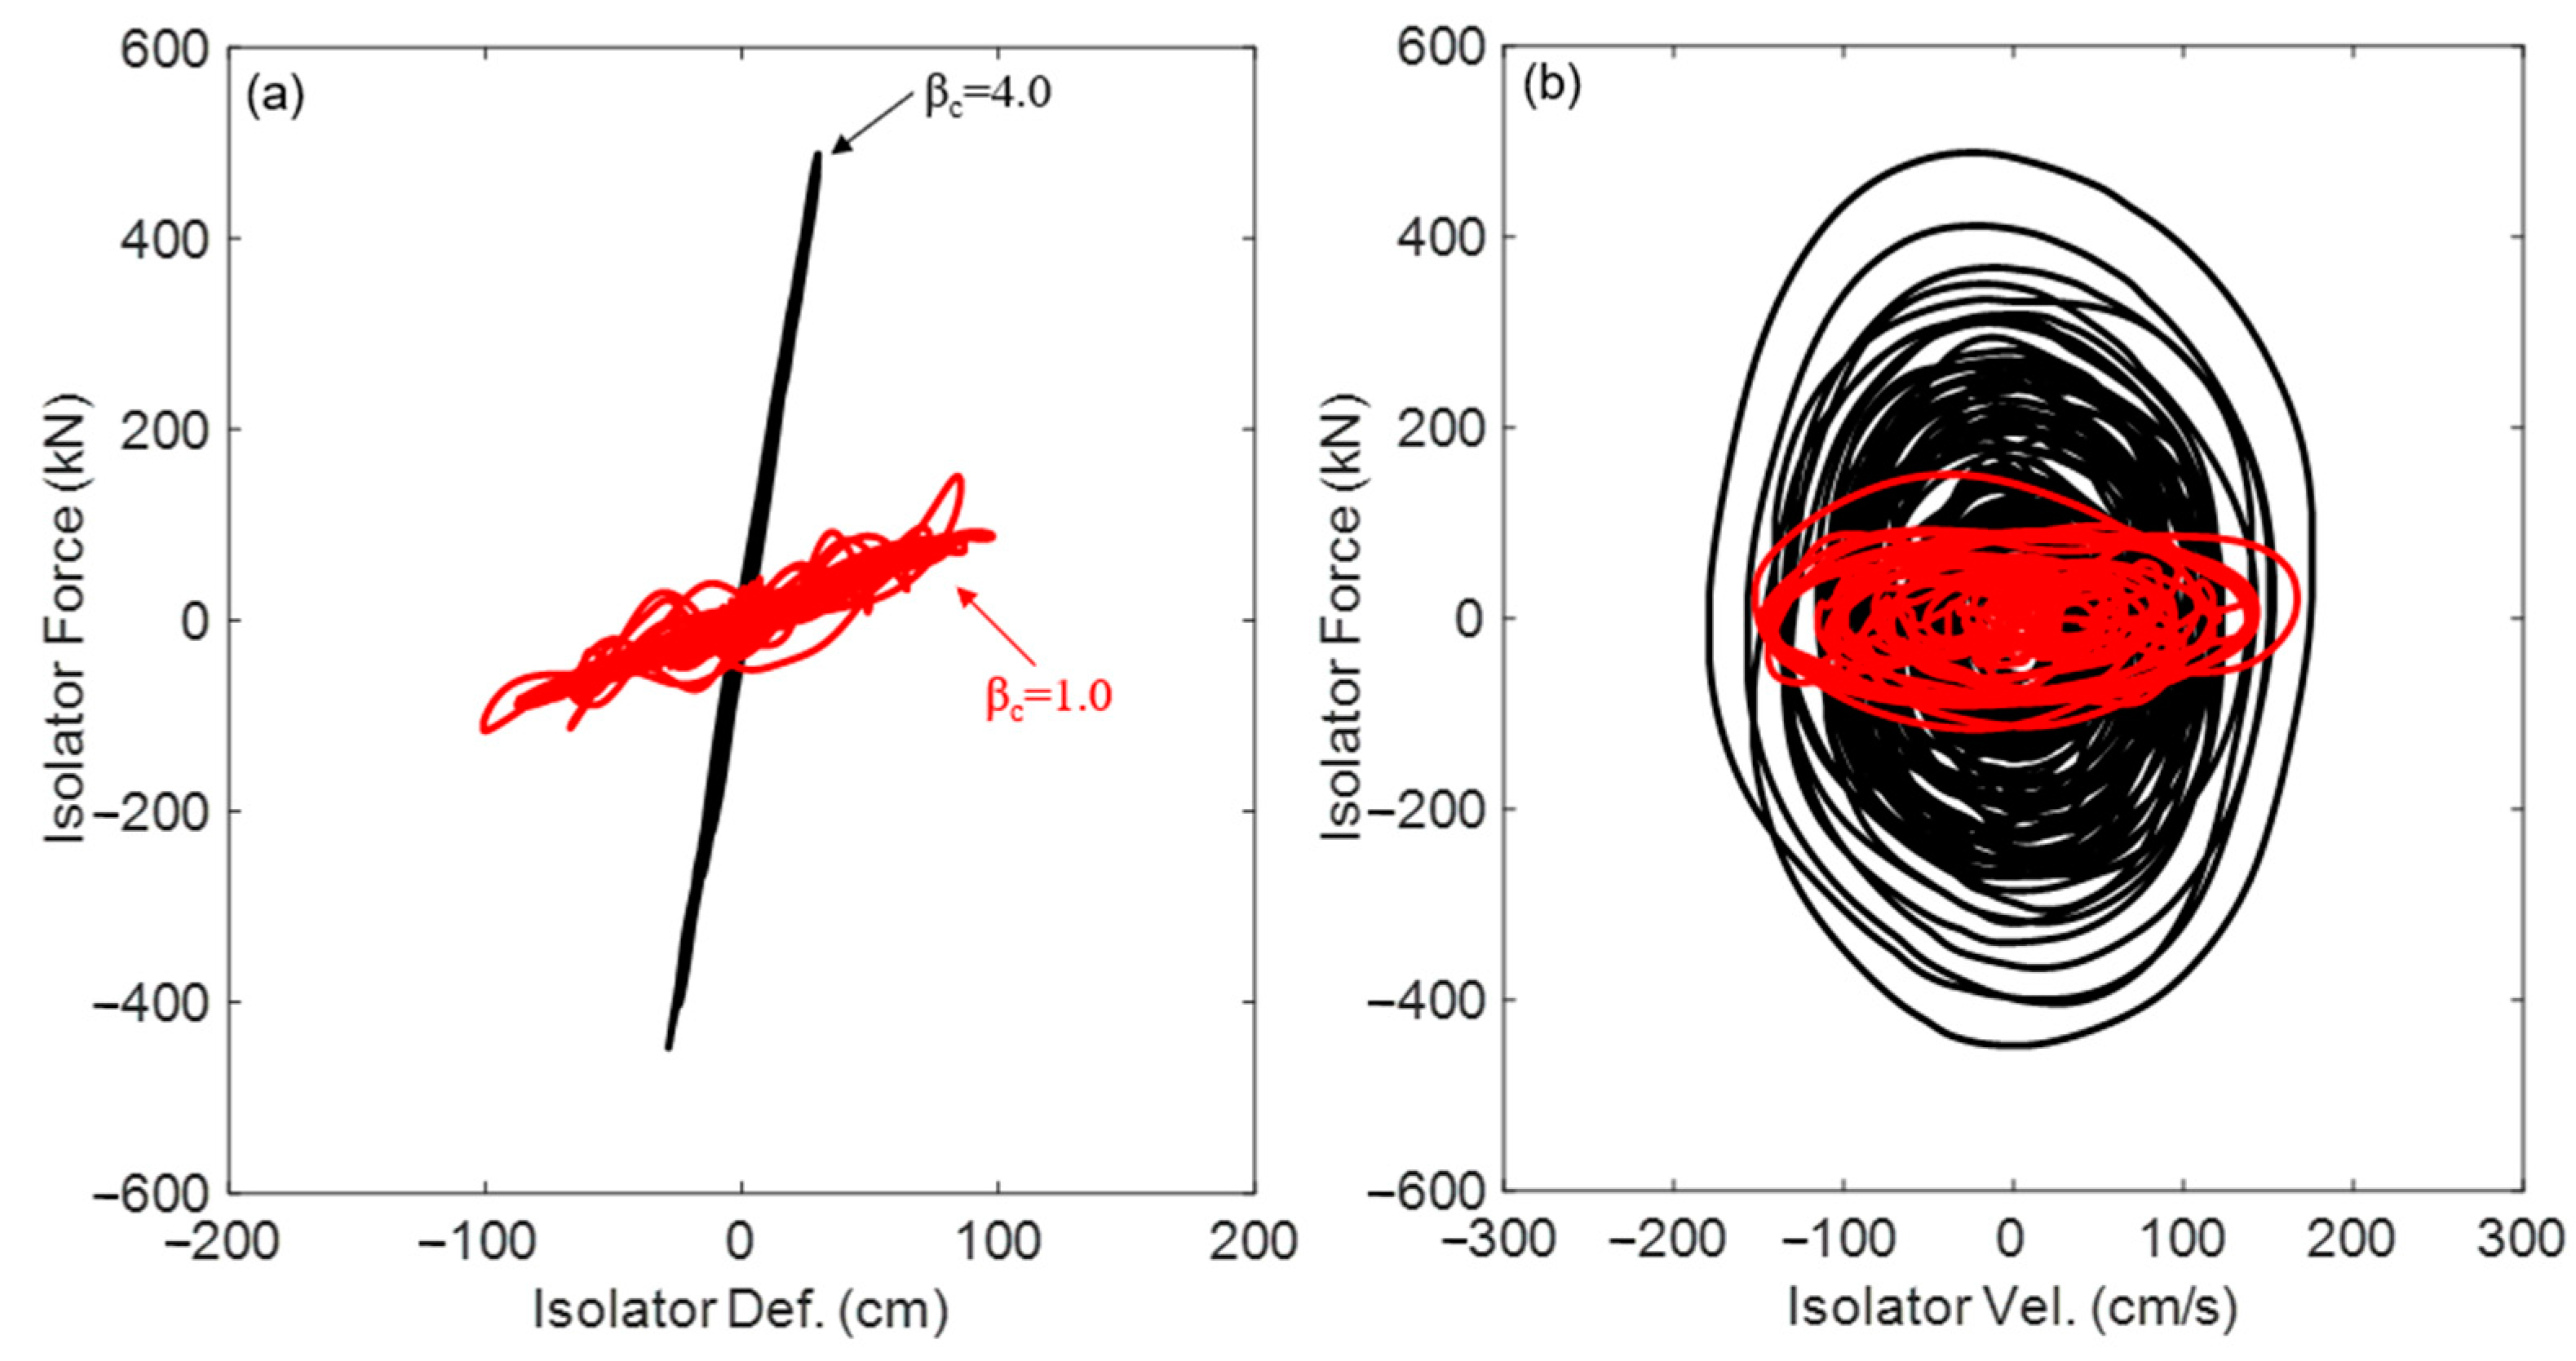
4.4. Hysteretic Behavior
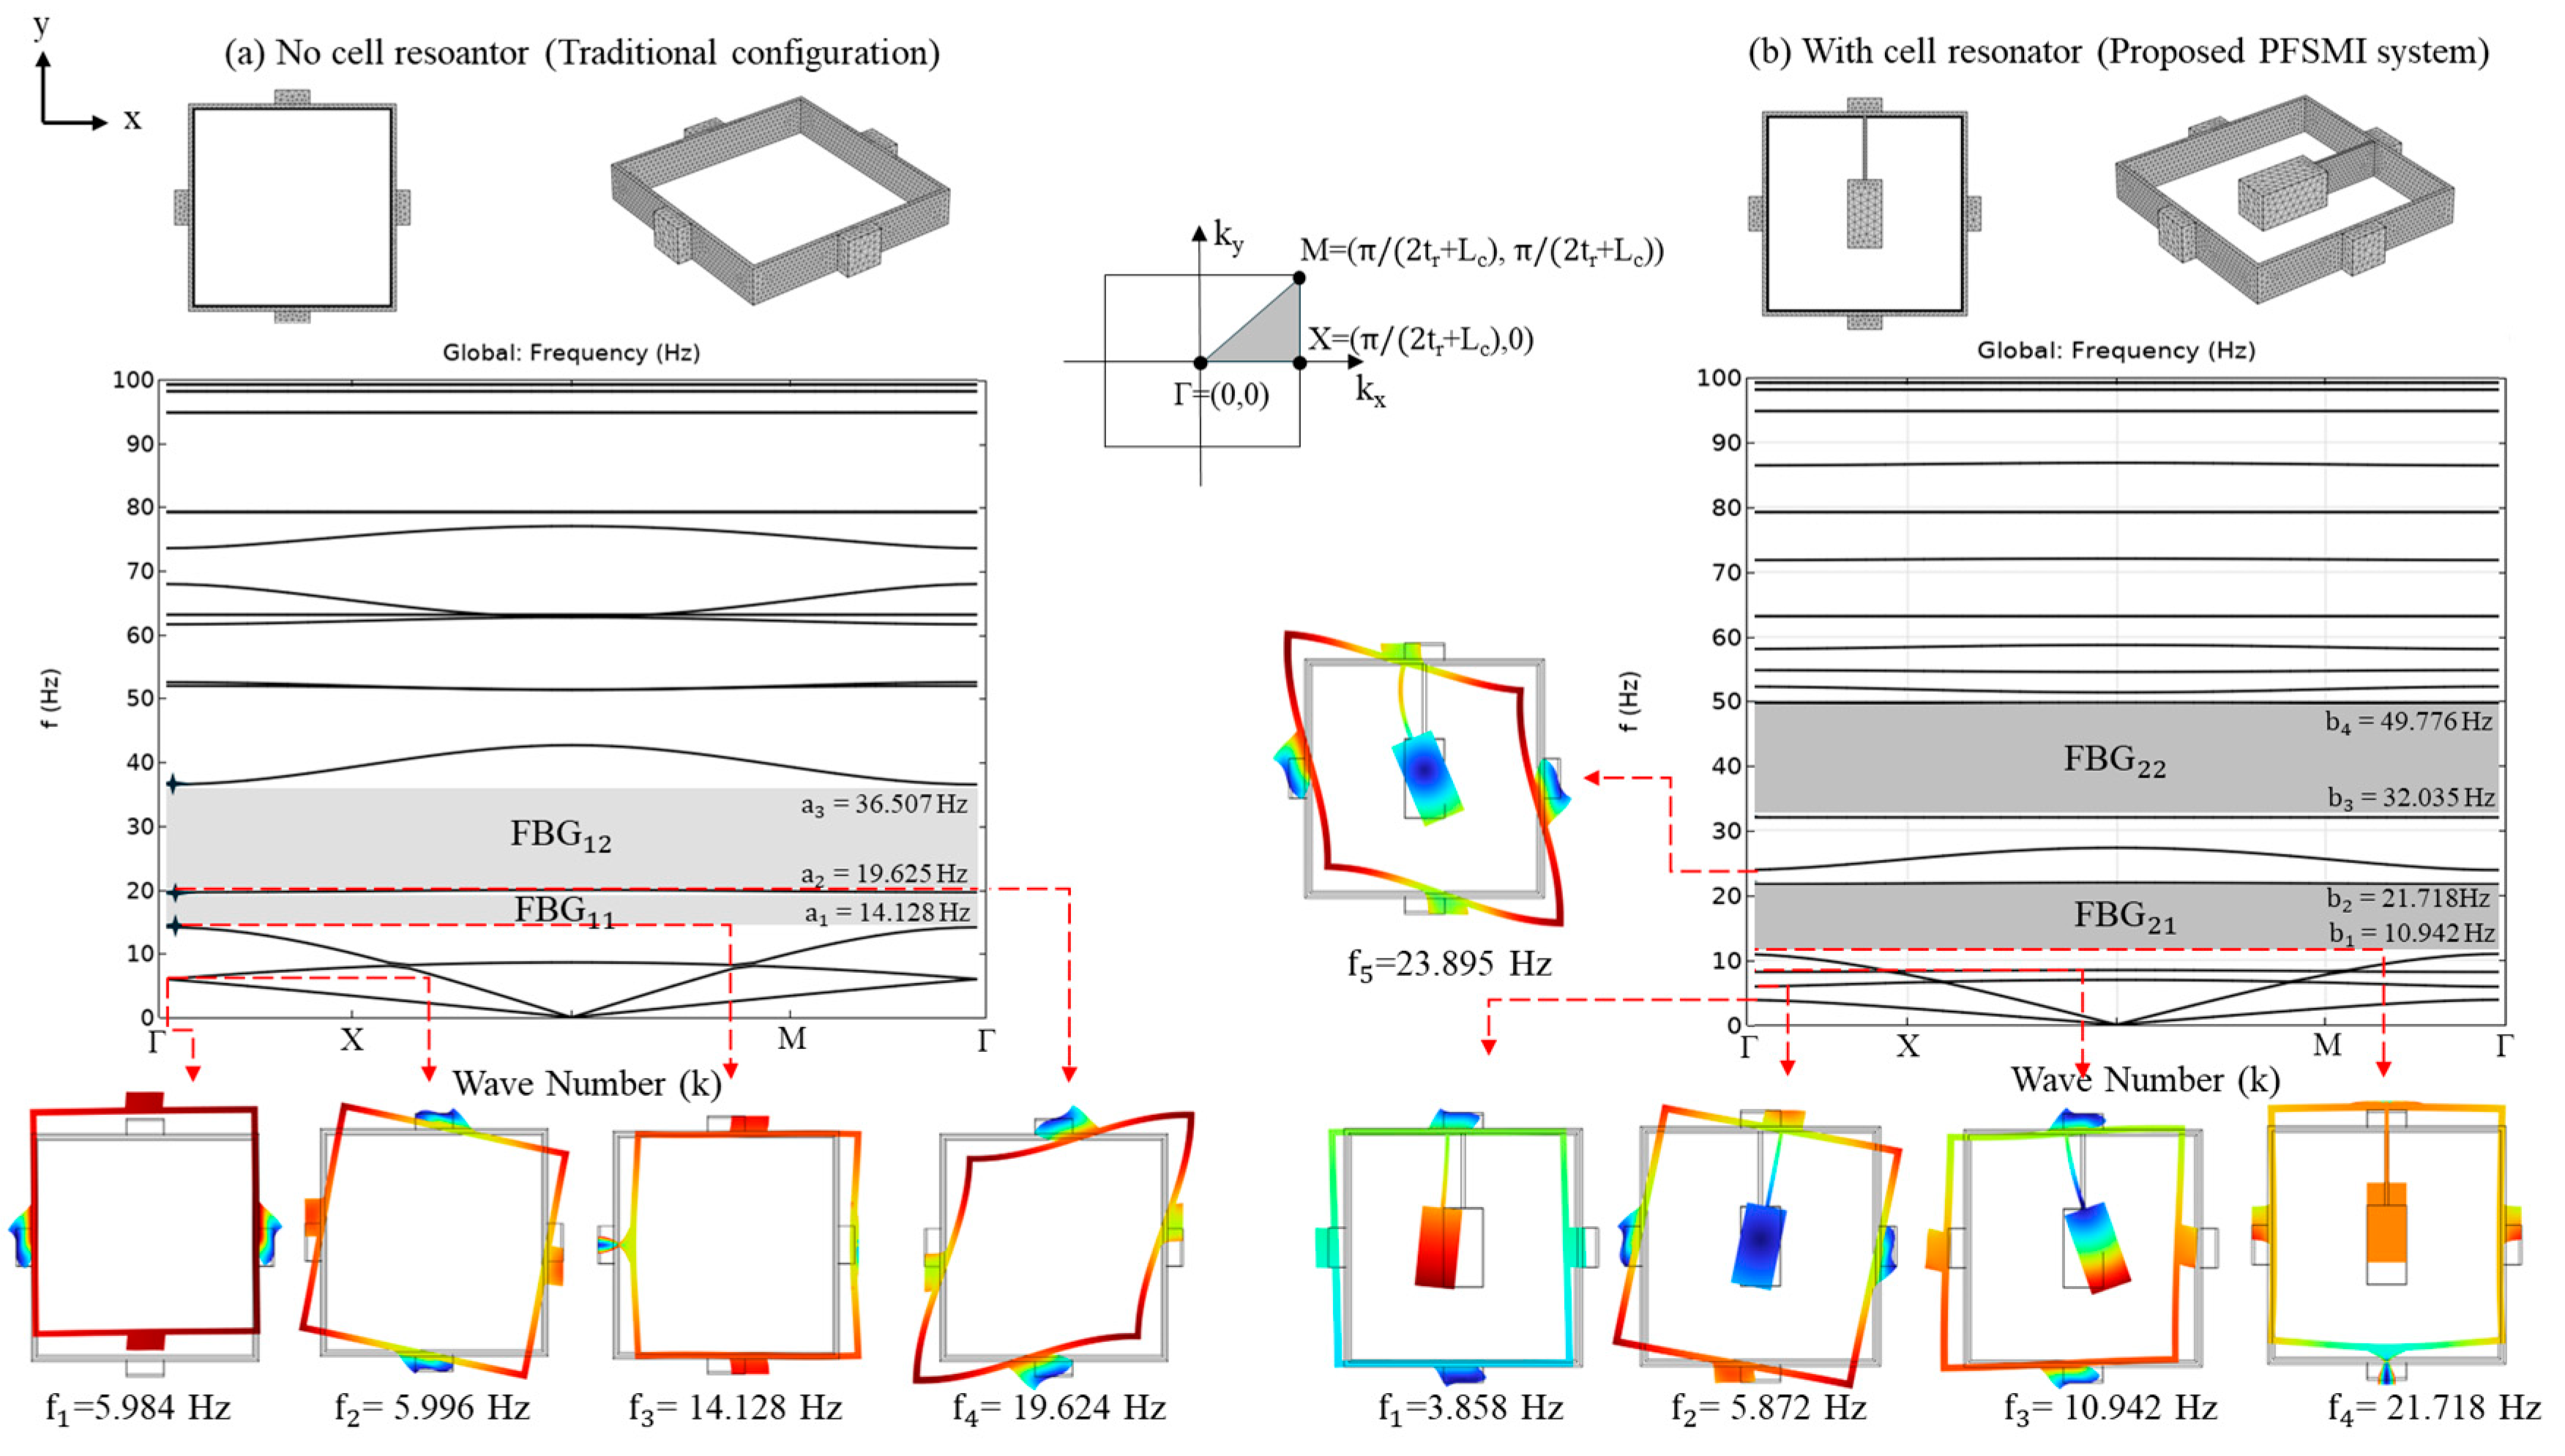
5. Frequency Bandgap Analysis
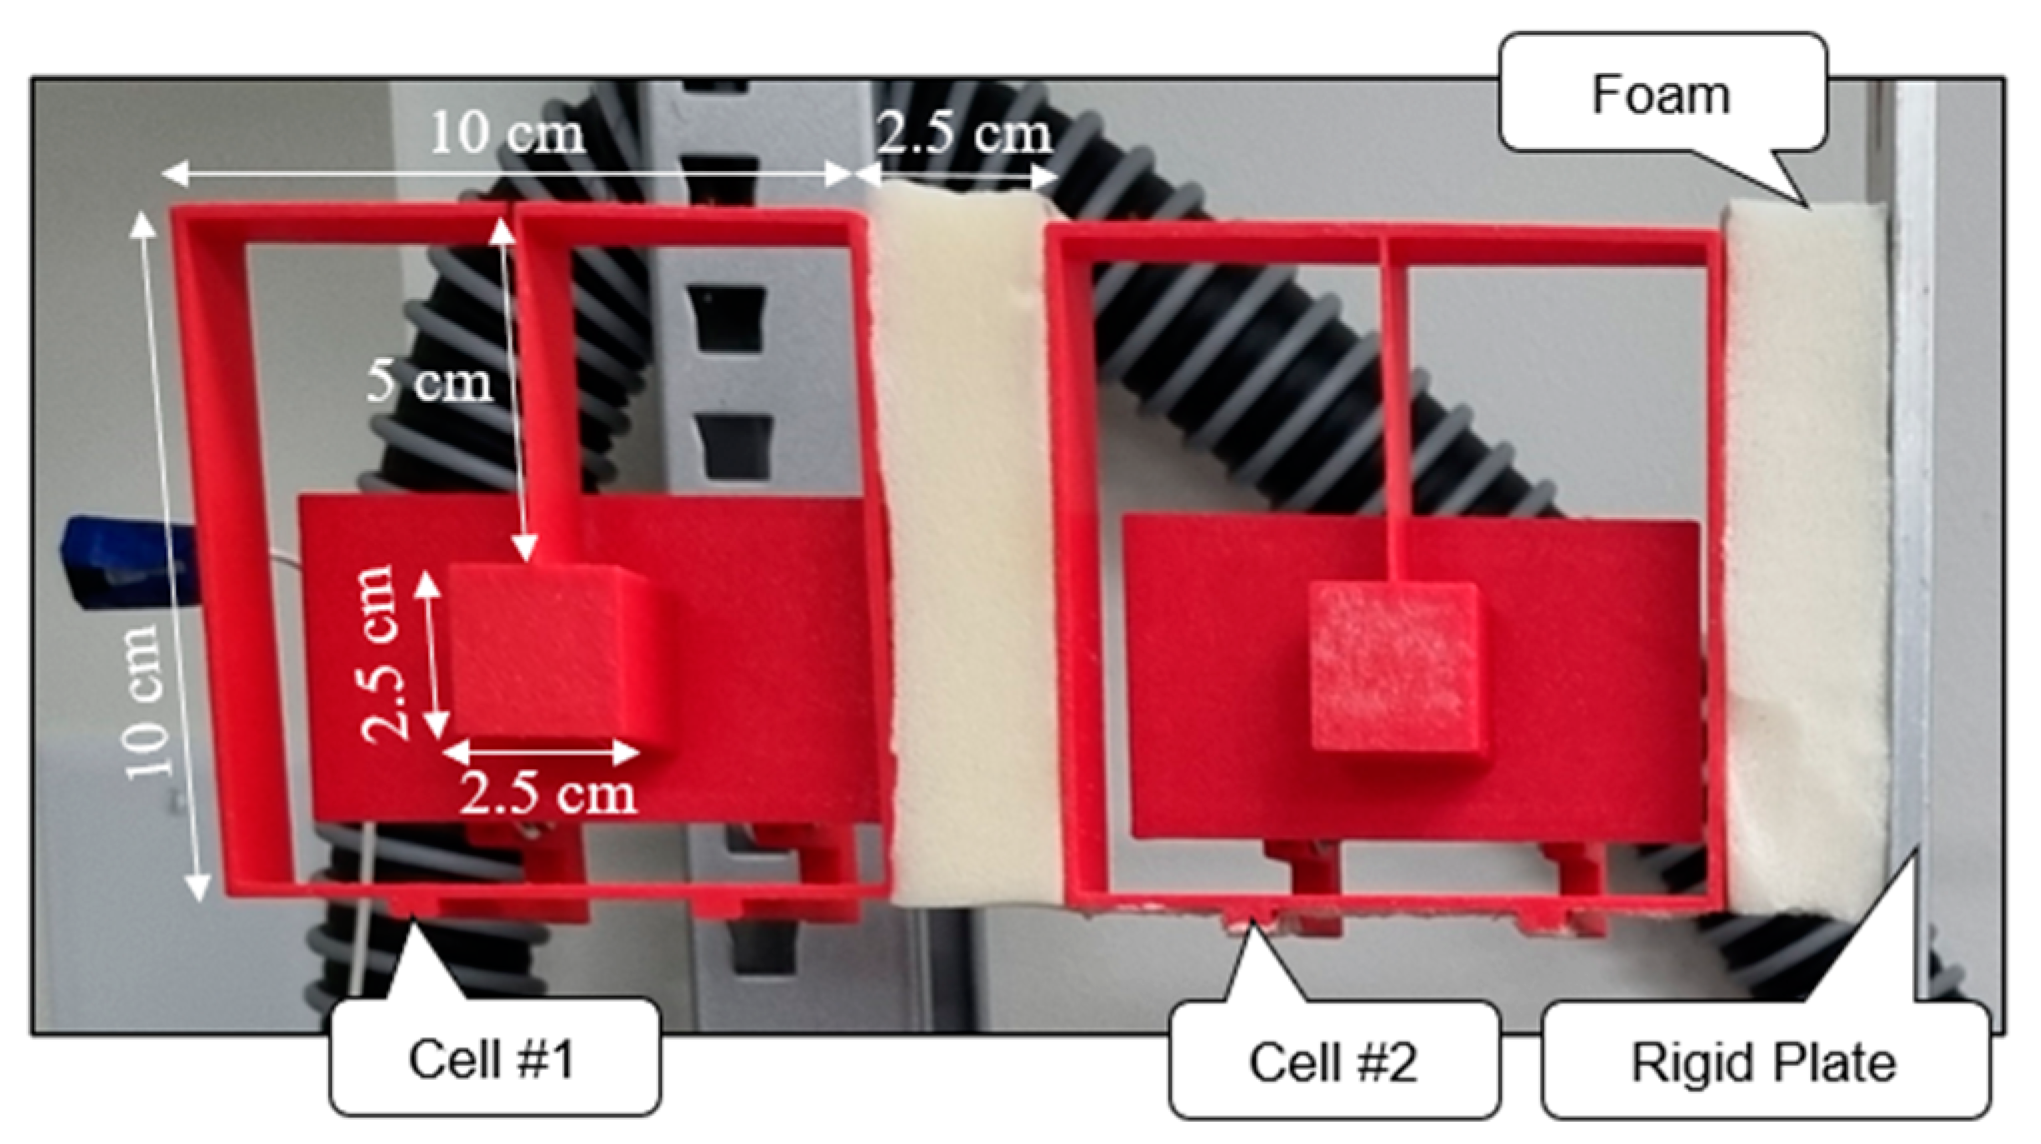
6. Experimental Study
7. Conclusions
Author Contributions
Funding
Institutional Review Board Statement
Informed Consent Statement
Data Availability Statement
Acknowledgments
Conflicts of Interest
Appendix A
References
- Naeim, F.; Bhatia, H.; Lobo, R.M. Performance Based Seismic Engineering. In The Seismic Design Handbook; Naeim, F., Ed.; Springer US: Boston, MA, USA, 2001; pp. 757–792. [Google Scholar] [CrossRef]
- Naeim, F.; Kelly, J.M. Design of Seismic Isolated Structures: From Theory to Practice; John Wiley & Sons: Hoboken, NJ, USA, 1999. [Google Scholar]
- Amjadian, M.; Agrawal, A.K. A Passive Electromagnetic Eddy Current Friction Damper (PEMECFD): Theoretical and Analytical Modeling. Struct. Control Health Monit. 2017, 24, e1978. [Google Scholar] [CrossRef]
- Kelly, J.M.; Konstantinidis, D.A. Mechanics of Rubber Bearings for Seismic and Vibration Isolation; John Wiley & Sons: Hoboken, NJ, USA, 2011. [Google Scholar] [CrossRef]
- Alhan, C.; Gavin, H. A parametric study of linear and non-linear passively damped seismic isolation systems for buildings. Eng. Struct. 2004, 26, 485–497. [Google Scholar] [CrossRef]
- Weber, F.; Distl, J.; Meier, L.; Braun, C. Curved surface sliders with friction damping, linear viscous damping, bow tie friction damping, and semiactively controlled properties. Struct. Control Health Monit. 2018, 25, e2257. [Google Scholar] [CrossRef]
- Bucher, C. Probability-based optimal design of friction-based seismic isolation devices. Struct. Saf. 2009, 31, 500–507. [Google Scholar] [CrossRef]
- Polycarpou, P.C.; Komodromos, P. Earthquake-induced poundings of a seismically isolated building with adjacent structures. Eng. Struct. 2010, 32, 1937–1951. [Google Scholar] [CrossRef]
- Hwang, J.S.; Ku, S.W. Analytical Modeling of High Damping Rubber Bearings. J. Struct. Eng. 1997, 123, 1029–1036. [Google Scholar] [CrossRef]
- Robinson, W.H. Lead-rubber hysteretic bearings suitable for protecting structures during earthquakes. Earthq. Eng. Struct. Dyn. 1982, 10, 593–604. [Google Scholar] [CrossRef]
- Wolff, E.D.; Ipek, C.; Constantinou, M.C.; Tapan, M. Effect of viscous damping devices on the response of seismically isolated structures. Earthq. Eng. Struct. Dyn. 2015, 44, 185–198. [Google Scholar] [CrossRef]
- Correa, D.M.; Klatt, T.; Cortes, S.; Haberman, M.; Kovar, D.; Seepersad, C. Negative stiffness honeycombs for recoverable shock isolation. Rapid Prototyp. J. 2015, 21, 193–200. [Google Scholar] [CrossRef]
- Mei, C.; Li, L.; Jiang, Y.; Ye, Y.; Li, X.; Han, X.; Tang, H.; Wang, X.; Hu, Y. On band gap and damping of metamaterials involving negative-stiffness elements. Int. J. Mech. Sci. 2023, 239, 107877. [Google Scholar] [CrossRef]
- Lin, S.; Zhang, Y.; Liang, Y.; Liu, Y.; Liu, C.; Yang, Z. Bandgap characteristics and wave attenuation of metamaterials based on negative-stiffness dynamic vibration absorbers. J. Sound Vib. 2021, 502, 116088. [Google Scholar] [CrossRef]
- Paradeisiotis, A.; Kalderon, M.; Antoniadis, I. Advanced negative stiffness absorber for low-frequency noise insulation of panels. AIP Adv. 2021, 11, 065003. [Google Scholar] [CrossRef]
- Chen, Y.; Hu, G.; Huang, G. A hybrid elastic metamaterial with negative mass density and tunable bending stiffness. J. Mech. Phys. Solids 2017, 105, 179–198. [Google Scholar] [CrossRef]
- Annessi, A.; Zega, V.; Chiariotti, P.; Martarelli, M.; Castellini, P. An innovative wide and low-frequency bandgap metastructure for vibration isolation. J. Appl. Phys. 2022, 132, 084903. [Google Scholar] [CrossRef]
- Shrestha, P.; Joshi, B.; Li, X.; Ramaswamy, N.; Wang, J.; Shan, X.; Mo, Y.L. Development of MRE-based metamaterial with adjustable frequency bandgap for seismic vibration isolation. J. Build. Eng. 2024, 91, 109575. [Google Scholar] [CrossRef]
- Reynolds, M.; Daley, S. An active viscoelastic metamaterial for isolation applications. Smart Mater. Struct. 2014, 23, 045030. [Google Scholar] [CrossRef]
- Sun, H.; Du, X.; Pai, P.F. Theory of Metamaterial Beams for Broadband Vibration Absorption. J. Intell. Mater. Syst. Struct. 2010, 21, 1085–1101. [Google Scholar] [CrossRef]
- Kim, Y.Y. Elastic Waves and Metamaterials: The Fundamentals; Springer Nature: Singapore, 2023. [Google Scholar] [CrossRef]
- Yan, Y.; Cheng, Z.; Menq, F.; Mo, Y.L.; Tang, Y.; Shi, Z. Three dimensional periodic foundations for base seismic isolation. Smart Mater. Struct. 2015, 24, 075006. [Google Scholar] [CrossRef]
- Nauman Masoom, M.; Ul Ain Karim, Q.; Badar, I.; Khushnood, R.A.; Ahmed Najam, F.; Naseer, A. Development of a new base isolation system using the concept of metamaterials. Eng. Struct. 2023, 286, 116151. [Google Scholar] [CrossRef]
- Bao, J.; Shi, Z.; Xiang, H. Dynamic Responses of a Structure with Periodic Foundations. J. Eng. Mech. 2012, 138, 761–769. [Google Scholar] [CrossRef]
- Jia, G.; Shi, Z. A new seismic isolation system and its feasibility study. Earthq. Engin. Engin. Vib. 2010, 9, 75–82. [Google Scholar] [CrossRef]
- Huang, J.; Shi, Z.; Huang, W.; Chen, X.; Zhang, Z. A periodic foundation with rotational oscillators for extremely low-frequency seismic isolation: Analysis and experimental verification. Smart Mater. Struct. 2017, 26, 035061. [Google Scholar] [CrossRef]
- Casablanca, O.; Ventura, G.; Garescì, F.; Azzerboni, B.; Chiaia, B.; Chiappini, M.; Finocchio, G. Seismic isolation of buildings using composite foundations based on metamaterials. J. Appl. Phys. 2018, 123, 174903. [Google Scholar] [CrossRef]
- Witarto, W.; Wang, S.J.; Yang, C.Y.; Nie, X.; Mo, Y.L.; Chang, K.C.; Tang, Y.; Kassawara, R. Seismic isolation of small modular reactors using metamaterials. AIP Adv. 2018, 8, 045307. [Google Scholar] [CrossRef]
- Yan, Y.; Laskar, A.; Cheng, Z.; Menq, F.; Tang, Y.; Mo, Y.L.; Shi, Z. Seismic isolation of two dimensional periodic foundations. J. Appl. Phys. 2014, 116, 044908. [Google Scholar] [CrossRef]
- Xiang, H.J.; Shi, Z.F.; Wang, S.J.; Mo, Y.L. Periodic materials-based vibration attenuation in layered foundations: Experimental validation. Smart Mater. Struct. 2012, 21, 112003. [Google Scholar] [CrossRef]
- Sadek, F.; Mohraz, B.; Taylor, A.W.; Chung, R.M. Passive Energy Dissipation Devices for Seismic Applications; NISTIR 5923; National Institute of Standards and Technology: Gaithersburg, MD, USA, 1996; p. 59. [Google Scholar]
- Amjadian, M.; Agrawal, A.K. Semi-active Response Control of Multi-Story Base-Isolated Buildings Using a Smart Electromagnetic Friction Damper Considering Stick-Slip Effects. Eng. Struct. 2018, 130, 409–432. [Google Scholar]
- Garland, A.P.; Adstedt, K.M.; Casias, Z.J.; White, B.C.; Mook, W.M.; Kaehr, B.; Jared, B.H.; Lester, B.T.; Leathe, N.S.; Schwaller, E.; et al. Coulombic friction in metamaterials to dissipate mechanical energy. Extreme Mech. Lett. 2020, 40, 100847. [Google Scholar] [CrossRef]
- Banerjee, A.; Sethi, M.; Manna, B. Vibration transmission through the frictional mass-in-mass metamaterial: An analytical investigation. Int. J. Non-Linear Mech. 2022, 144, 104035. [Google Scholar] [CrossRef]
- McCrary, A.; Hashemi, M.S.; Sheidaei, A. Programmable Bidirectional Mechanical Metamaterial with Tunable Stiffness and Frictional Energy Dissipation. Adv. Theory Simul. 2022, 5, 2200135. [Google Scholar] [CrossRef]
- Khosravi, S.; Amjadian, M. A parametric study on the energy dissipation capability of frictional mechanical metamaterials engineered for vibration isolation. In Proceedings of the Active and Passive Smart Structures and Integrated Systems XVIII, Long Beach, CA, USA, 25–29 March 2024; Tol, S., Nouh, M.A., Shahab, S., Yang, J., Huang, G., Li, X., Eds.; SPIE: Long Beach, CA, USA, 2024; p. 42. [Google Scholar] [CrossRef]
- Bengisu, M.T.; Akay, A. Stick–slip oscillations: Dynamics of friction and surface roughness. J. Acoust. Soc. Am. 1999, 105, 194–205. [Google Scholar] [CrossRef]
- Olsson, H.; Åström, K.J.; Canudas De Wit, C.; Gäfvert, M.; Lischinsky, P. Friction Models and Friction Compensation. Eur. J. Control 1998, 4, 176–195. [Google Scholar] [CrossRef]
- Luo, Y.M.; Huang, T.T.; Zhang, Y.; Xu, H.H.; Xie, Y.M.; Ren, X. Novel meter-scale seismic metamaterial with low-frequency wide bandgap for Lamb waves. Eng. Struct. 2023, 275, 115321. [Google Scholar] [CrossRef]
- Zhao, C.; Chen, Q.; Wang, Y. Low-Frequency Band Gap Seismic Metamaterials for Lamb Wave Based On Vibration-Sensitive Scatterers. J. Vib. Eng. Technol. 2024, 12, 7903–7915. [Google Scholar] [CrossRef]
- Ramallo, J.C.; Johnson, E.A.; Spencer, B.F. “Smart” Base Isolation Systems. J. Eng. Mech. 2002, 128, 1088–1099. [Google Scholar] [CrossRef]
- Sorace, S.; Terenzi, G. Analysis and Demonstrative Application of a Base Isolation/Supplemental Damping Technology. Earthq. Spectra 2008, 24, 775–793. [Google Scholar] [CrossRef]
- Amjadian, M. A study on the use of an energy-regenerative tuned mass damper for vibration control and monitoring of base-isolated buildings. In Proceedings of the Active and Passive Smart Structures and Integrated Systems XVI, Long Beach, CA, USA, 6 March–11 April 2022; SPIE: Long Beach, CA, USA, 2022; Volume 12043, pp. 252–261. [Google Scholar] [CrossRef]
- Taniguchi, T.; Der Kiureghian, A.; Melkumyan, M. Effect of tuned mass damper on displacement demand of base-isolated structures. Eng. Struct. 2008, 30, 3478–3488. [Google Scholar] [CrossRef]
- Hashimoto, T.; Fujita, K.; Tsuji, M.; Takewaki, I. Innovative base-isolated building with large mass-ratio TMD at basement for greater earthquake resilience. Fut. Cit. Environ. 2015, 1, 9. [Google Scholar] [CrossRef]
- Mostaghel, N.; Davis, T. Representations of Coulomb Friction for Dynamic Analysis. Earthq. Eng. Struct. Dyn. 1997, 26, 541–548. [Google Scholar] [CrossRef]
- Rathee, R. Numerical modeling and simulation of friction models for mechanical systems: A brief review. Mater. Today Proc. 2023, S2214785322075460, in press. [Google Scholar] [CrossRef]
- Shahhosseini, A.; Tien, M.-H.; D’Souza, K. Efficient Hybrid Symbolic-Numeric Computational Method for Piecewise Linear Systems With Coulomb Friction. J. Comput. Nonlinear Dyn. 2023, 18, 071004. [Google Scholar] [CrossRef]
- Ruderman, M.; Fridman, L. Analysis of relay-based feedback compensation of Coulomb friction. In Proceedings of the 2022 16th International Workshop on Variable Structure Systems (VSS), Rio de Janeiro, Brazil, 11–14 September 2022; IEEE: Rio de Janeiro, Brazil, 2022; pp. 95–100. [Google Scholar]
- The MathWorks, Inc. MATLAB (R2023a); The MathWorks, Inc.: Natick, MA, USA, 2023; Available online: https://www.mathworks.com (accessed on 1 September 2024).
- Hassani, B.; Yong, A.; Atkinson, G.M.; Feng, T.; Meng, L. Comparison of Site Dominant Frequency from Earthquake and Microseismic Data in California. Bull. Seismol. Soc. Am. 2019, 109, 1034–1040. [Google Scholar] [CrossRef]
- Kelly, J.M.; Leitmann, G.; Soldatos, A.G. Robust control of base-isolated structures under earthquake excitation. J. Optim. Theory Appl. 1987, 53, 159–180. [Google Scholar] [CrossRef]
- PEER Ground Motion Database. Shallow Crustal Earthquakes in Active Tectonic Regimes, NGA-West2. 2013. Available online: http://ngawest2.berkeley.edu/ (accessed on 1 September 2024).
- Amjadian, M. Vibration Control Using Frictional Tuned Mass Dampers with Stick-Slip Motion. In Dynamics of Civil Structures; Noh, H.Y., Whelan, M., Harvey, P.S., Eds.; Springer Nature Switzerland: Cham, Switzerland, 2024; Volume 2, pp. 221–228. [Google Scholar] [CrossRef]
- Do, N.B.; Ferri, A.A.; Bauchau, O.A. Efficient Simulation of a Dynamic System with LuGre Friction. J. Comput. Nonlinear Dyn. 2007, 2, 281–289. [Google Scholar] [CrossRef]
- Freidovich, L.; Robertsson, A.; Shiriaev, A.; Johansson, R. LuGre-Model-Based Friction Compensation. IEEE Trans. Contr. Syst. Technol. 2010, 18, 194–200. [Google Scholar] [CrossRef]
- Yanada, H.; Sekikawa, Y. Modeling of dynamic behaviors of friction. Mechatronics 2008, 18, 330–339. [Google Scholar] [CrossRef]
- COMSOL Multiphysics® Modeling Software, v.6.2; COMSOL: Göttingen, Germany, 2023.


| Floor Number | Mb (kg) | ωc (rad/s) | ξc (%) |
|---|---|---|---|
| Base | 6800.0 | It depends on βc, defined by Equation (9b). | 5.0 |
| Floor Number | ms (kg) | ωs (rad/s) | ξs (%) |
| 1st | 29,485.0 | 20.1 | 2.0 |
| Floor Number | Mb (kg) | |||||
|---|---|---|---|---|---|---|
| Base | 6800 | 1.0 | Var. | Var. | 1.0 | 0.25 |
| Floor Number | ms (kg) | cs (kN.s/m) | ks (kN/m) | |||
| 1st | 5897.0 | 67.0 | 33,732.0 | |||
| 2nd | 5897.0 | 58.0 | 29,093.0 | |||
| 3rd | 5897.0 | 57.0 | 28,621.0 | |||
| 4th | 5897.0 | 50.0 | 24,954.0 | |||
| 5th | 5897.0 | 38.0 | 19,059.0 |
| SN a | Name | Year | Magnitude (M) | Station | Component | PGA (g) | |
|---|---|---|---|---|---|---|---|
| Unscaled | Scaled | ||||||
| 0169 | Imperial Valley (IV. EQ) | 1979 | 6.5 | Delta | DLT352 | 0.350 | 0.384 |
| 0728 | Superstition Hills (SH. EQ) | 1987 | 6.5 | Westmorland Fire Station | WSM180 | 0.211 | 0.408 |
| 0757 | Loma Prieta (LP. EQ) | 1989 | 6.9 | Dumbarton Bridge West End | DUMB267 | 0.127 | 0.427 |
| βc = 1.0 (Soft Lattice) | ||||||||
| Friction Model | with SSM (LuGre) | w/o SSM (Coulomb) | ||||||
| 0.1 | 0.5 | 1 | 2 | 0.1 | 0.5 | 1 | 2 | |
| Imperial Valley | 0.0293 | 0.0657 | 0.0756 | 0.0827 | 0.0342 | 0.0785 | 0.1014 | 0.1128 |
| Superstition Hills | 0.0321 | 0.0731 | 0.0863 | 0.0943 | 0.0335 | 0.0834 | 0.1073 | 0.1144 |
| Loma Prieta | 0.0157 | 0.0342 | 0.0408 | 0.0444 | 0.0170 | 0.0433 | 0.0555 | 0.0575 |
| βc = 4.0 (Stiff Lattice) | ||||||||
| Friction Model | with SSM (LuGre) | w/o SSM (Coulomb) | ||||||
| 0.1 | 0.5 | 1 | 2 | 0.1 | 0.5 | 1 | 2 | |
| Imperial Valley | 0.1005 | 0.2886 | 0.3691 | 0.4269 | 0.0992 | 0.2890 | 0.3740 | 0.4361 |
| Superstition Hills | 0.0572 | 0.1944 | 0.2688 | 0.3285 | 0.0563 | 0.1928 | 0.2679 | 0.3301 |
| Loma Prieta | 0.0768 | 0.2425 | 0.3215 | 0.3792 | 0.0731 | 0.2386 | 0.3221 | 0.3867 |
| Lc (cm) | Lr (cm) | Wc (cm) | hc (cm) | tc (cm) | tr (cm) | tp (cm) |
|---|---|---|---|---|---|---|
| 150 | 25 | 12.5 | 25 | 3 | 10 | 1.25 |
| Material | Density (kg/m3) | Young Modulus (Pa) | Poisson’s Ratio |
|---|---|---|---|
| Steel Rubber | 7850 | 2.01 × 10¹¹ | 0.30 |
| 1400 | 1.08 × 10⁵ | 0.45 |
Disclaimer/Publisher’s Note: The statements, opinions and data contained in all publications are solely those of the individual author(s) and contributor(s) and not of MDPI and/or the editor(s). MDPI and/or the editor(s) disclaim responsibility for any injury to people or property resulting from any ideas, methods, instructions or products referred to in the content. |
© 2025 by the authors. Licensee MDPI, Basel, Switzerland. This article is an open access article distributed under the terms and conditions of the Creative Commons Attribution (CC BY) license (https://creativecommons.org/licenses/by/4.0/).
Share and Cite
Khosravi, S.; Amjadian, M. Modeling, Design, and Laboratory Testing of a Passive Friction Seismic Metamaterial Base Isolator (PFSMBI). Materials 2025, 18, 363. https://doi.org/10.3390/ma18020363
Khosravi S, Amjadian M. Modeling, Design, and Laboratory Testing of a Passive Friction Seismic Metamaterial Base Isolator (PFSMBI). Materials. 2025; 18(2):363. https://doi.org/10.3390/ma18020363
Chicago/Turabian StyleKhosravi, Shayan, and Mohsen Amjadian. 2025. "Modeling, Design, and Laboratory Testing of a Passive Friction Seismic Metamaterial Base Isolator (PFSMBI)" Materials 18, no. 2: 363. https://doi.org/10.3390/ma18020363
APA StyleKhosravi, S., & Amjadian, M. (2025). Modeling, Design, and Laboratory Testing of a Passive Friction Seismic Metamaterial Base Isolator (PFSMBI). Materials, 18(2), 363. https://doi.org/10.3390/ma18020363