
Bending Performance of Diamond Lattice Cylindrical Shells

Highlights
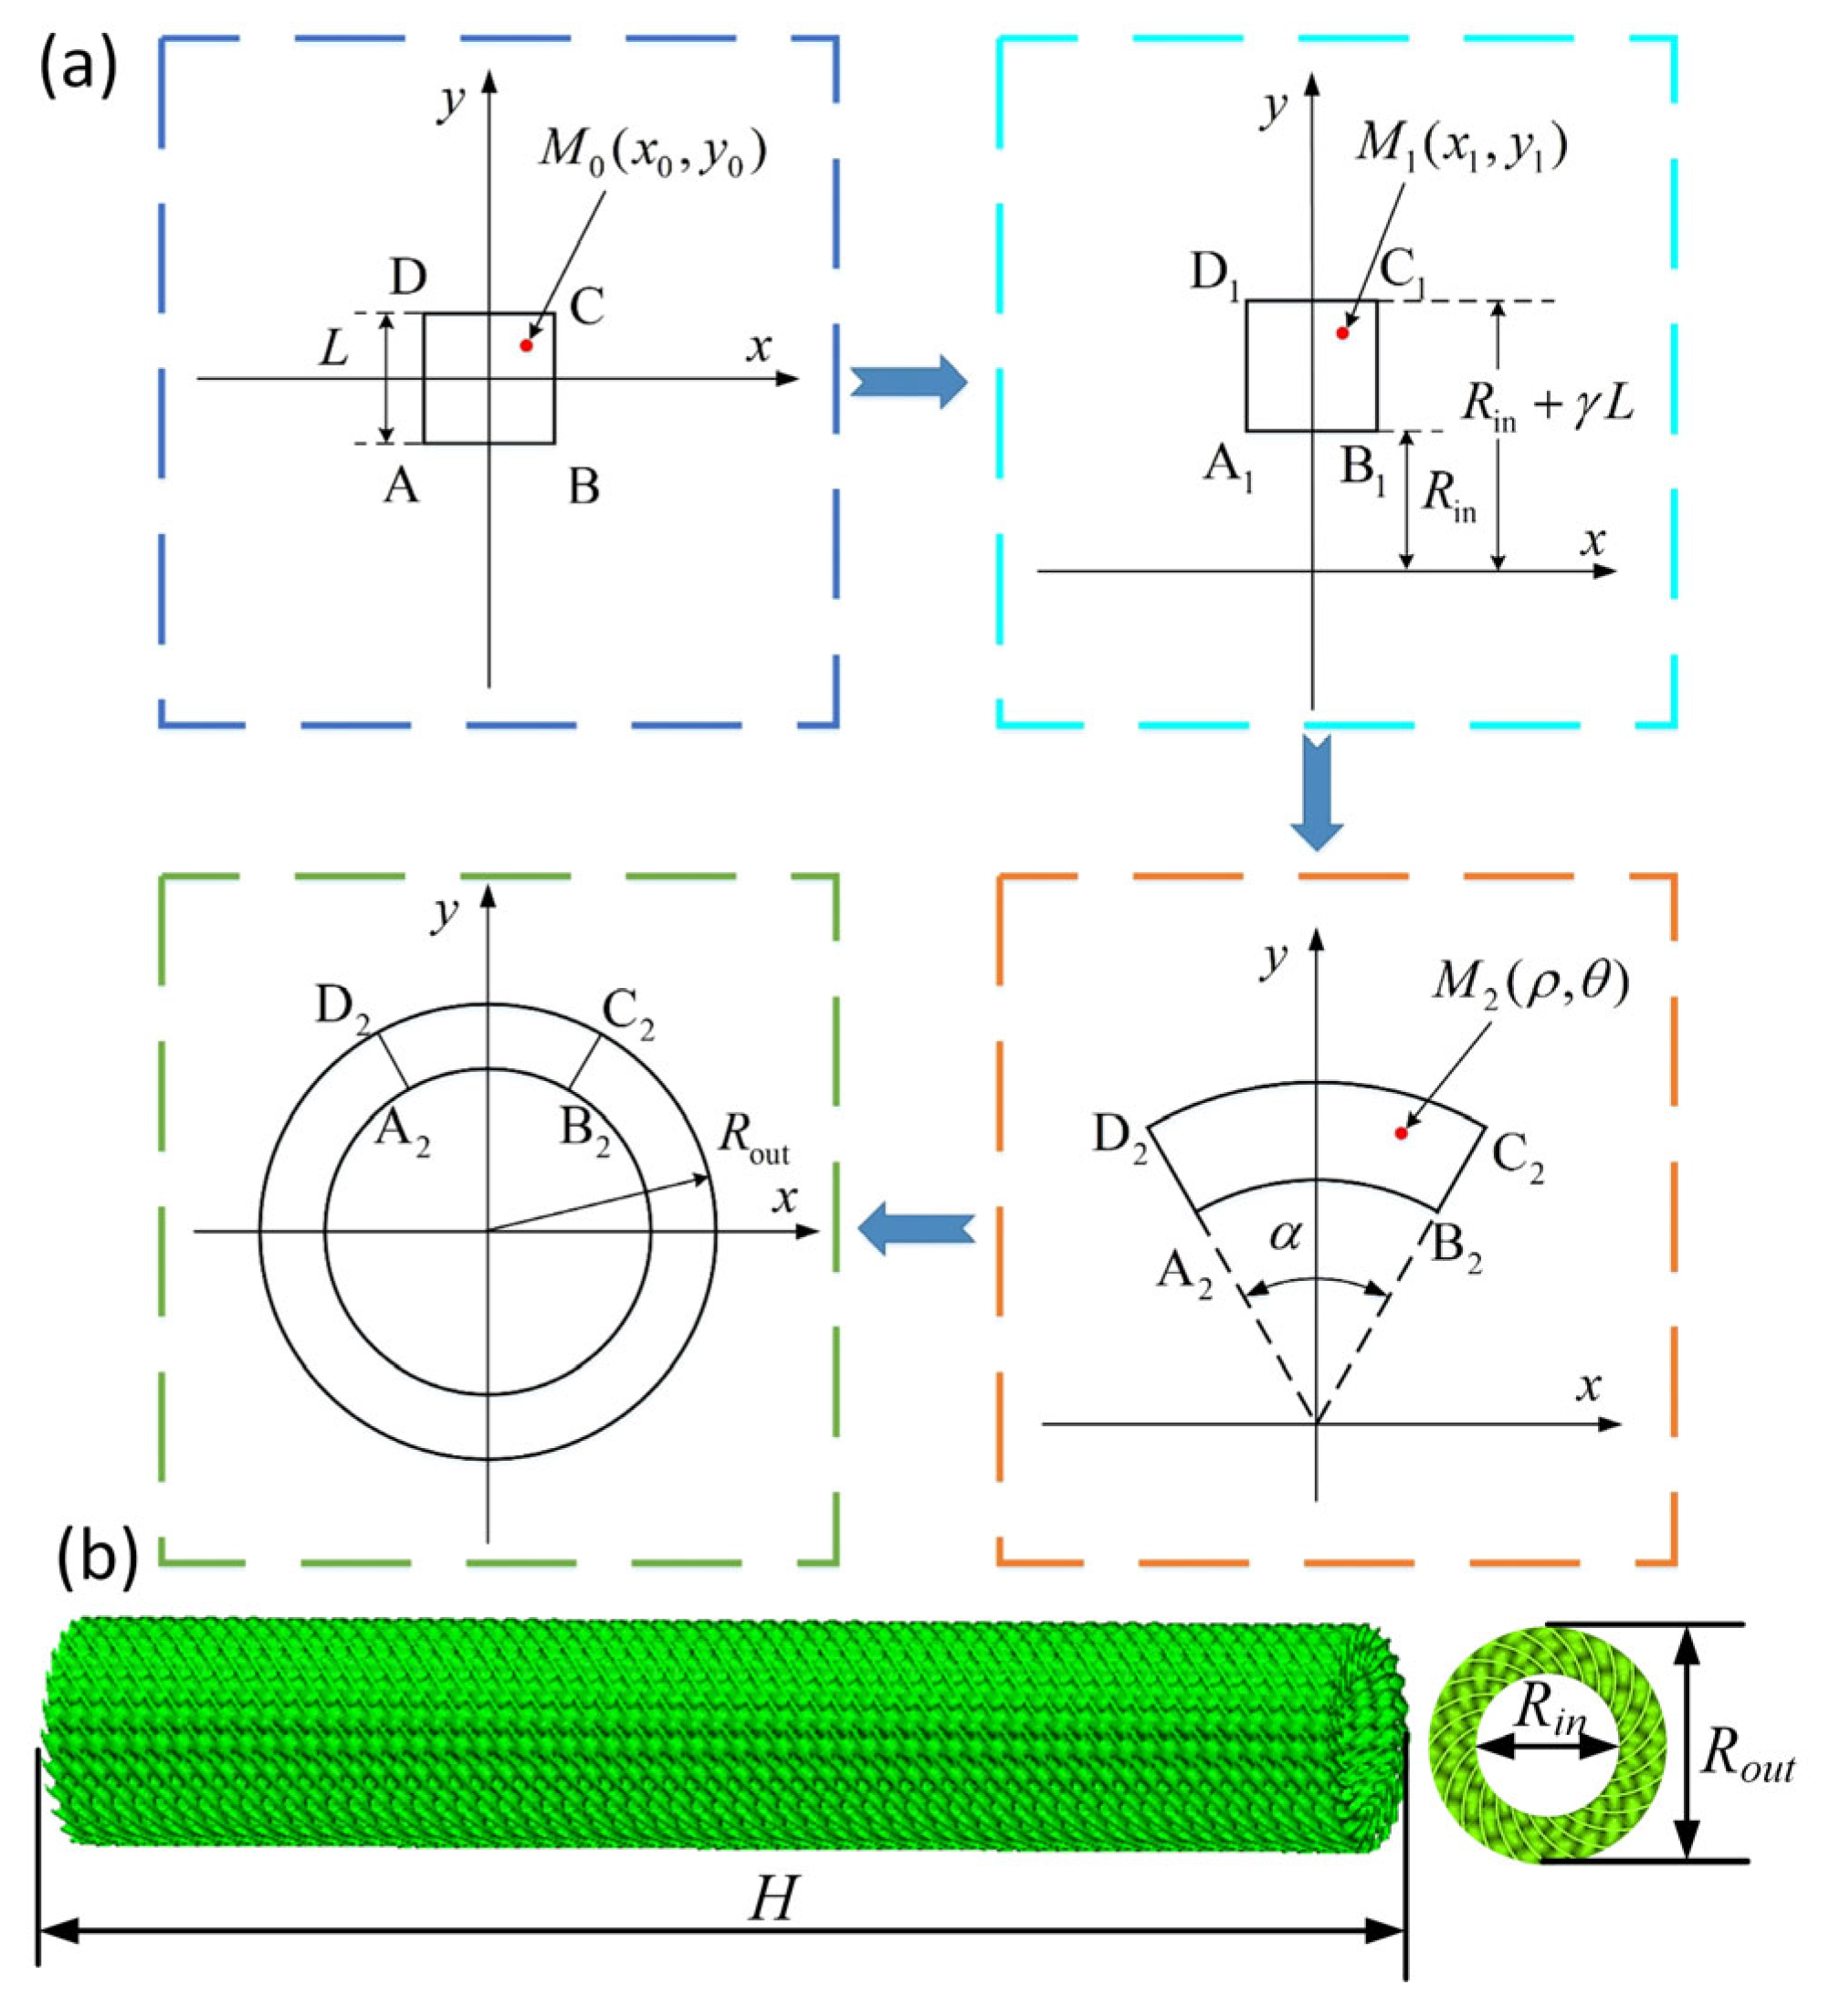
- The diamond lattice cylindrical shell (diamond LCS) is proposed by a mapping method;
- Bending and energy absorption performances are studied using numerical models;
- Parametric studies are carried out to investigate the effects of design parameters on the bending performances.
Abstract
1. Introduction
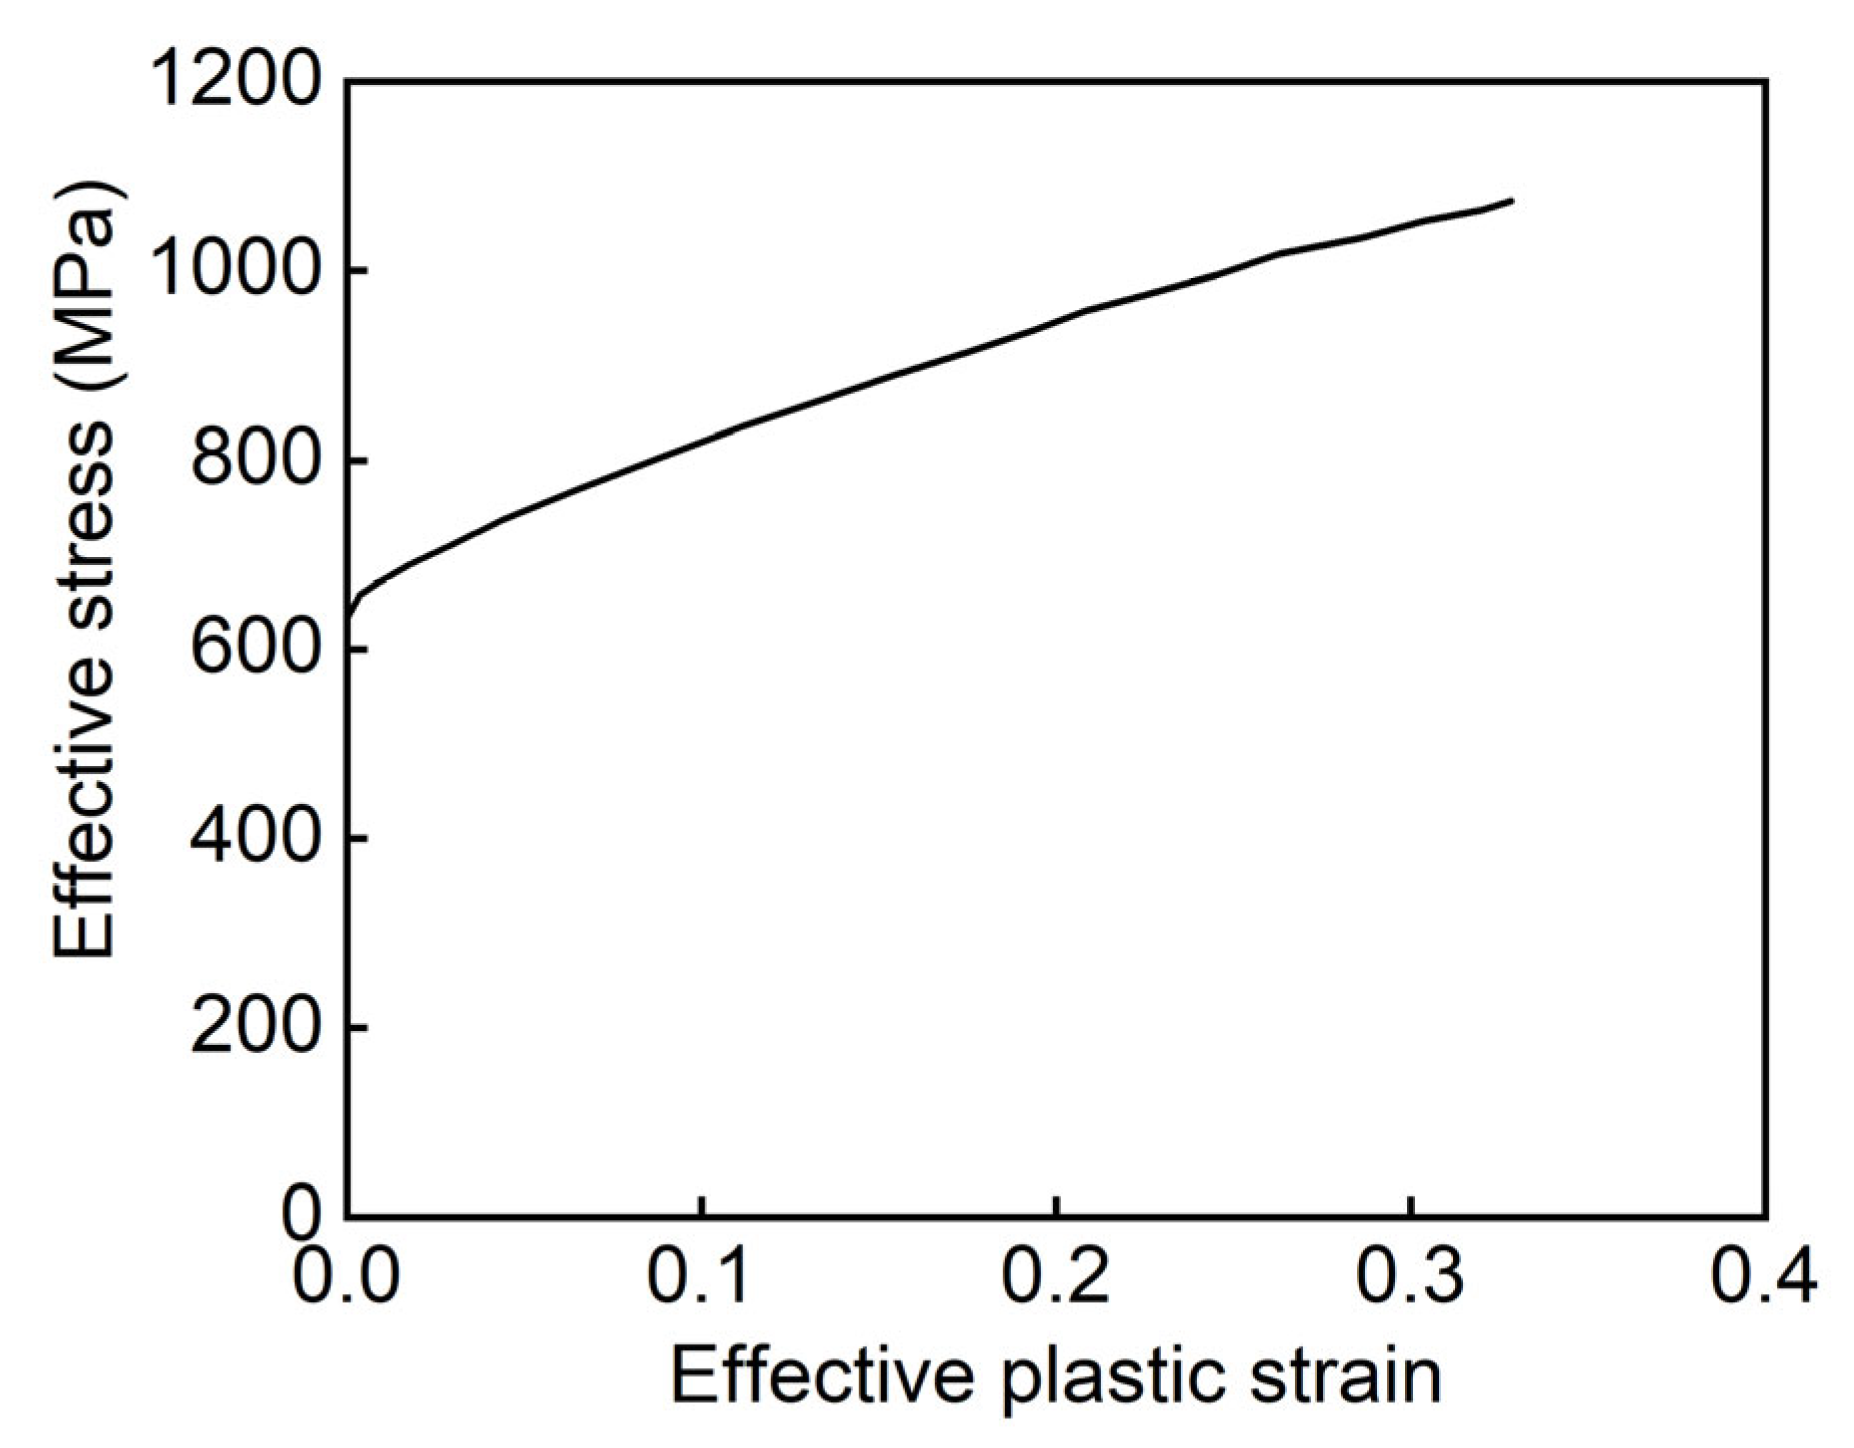
2. Materials and Methods
2.1. Structural Design of TPMS Lattice Cylindrical Shell
2.2. Finite Element Model
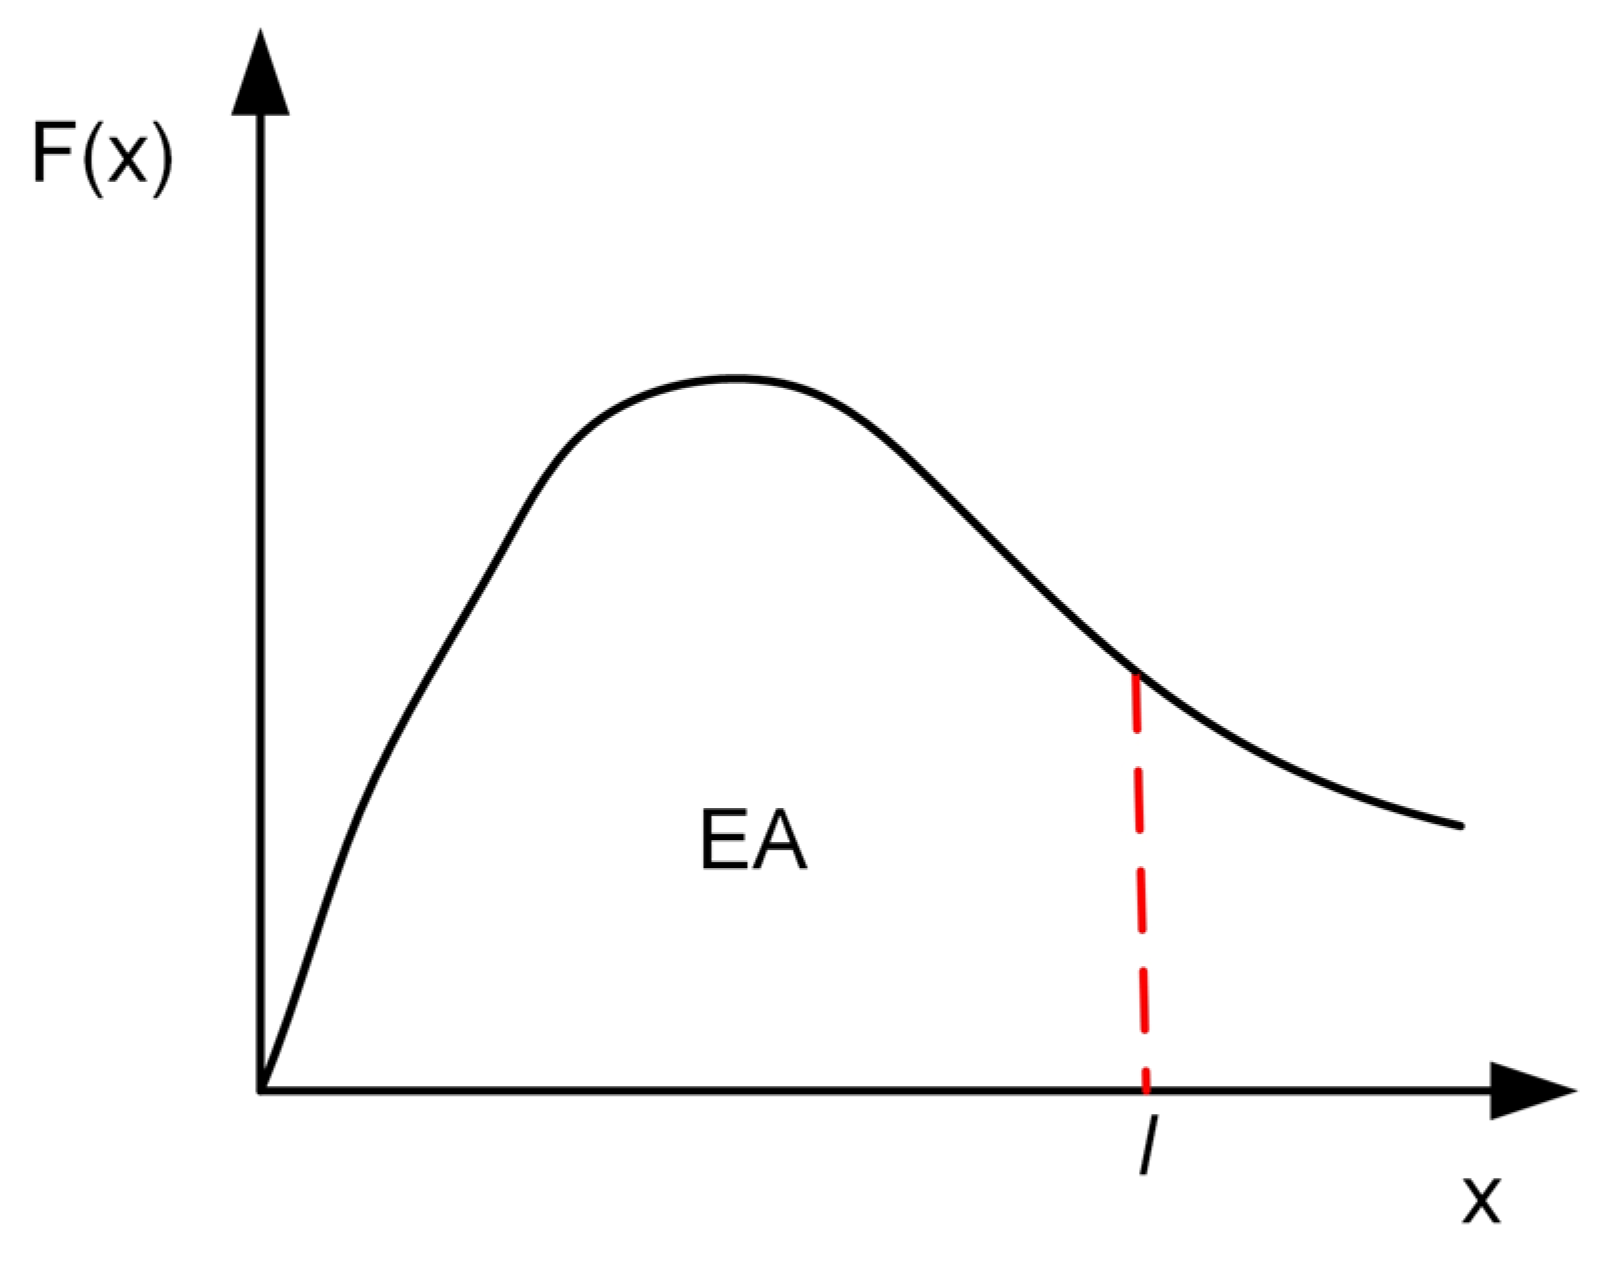
2.3. Crashworthiness Evaluation Index
3. Results and Discussions
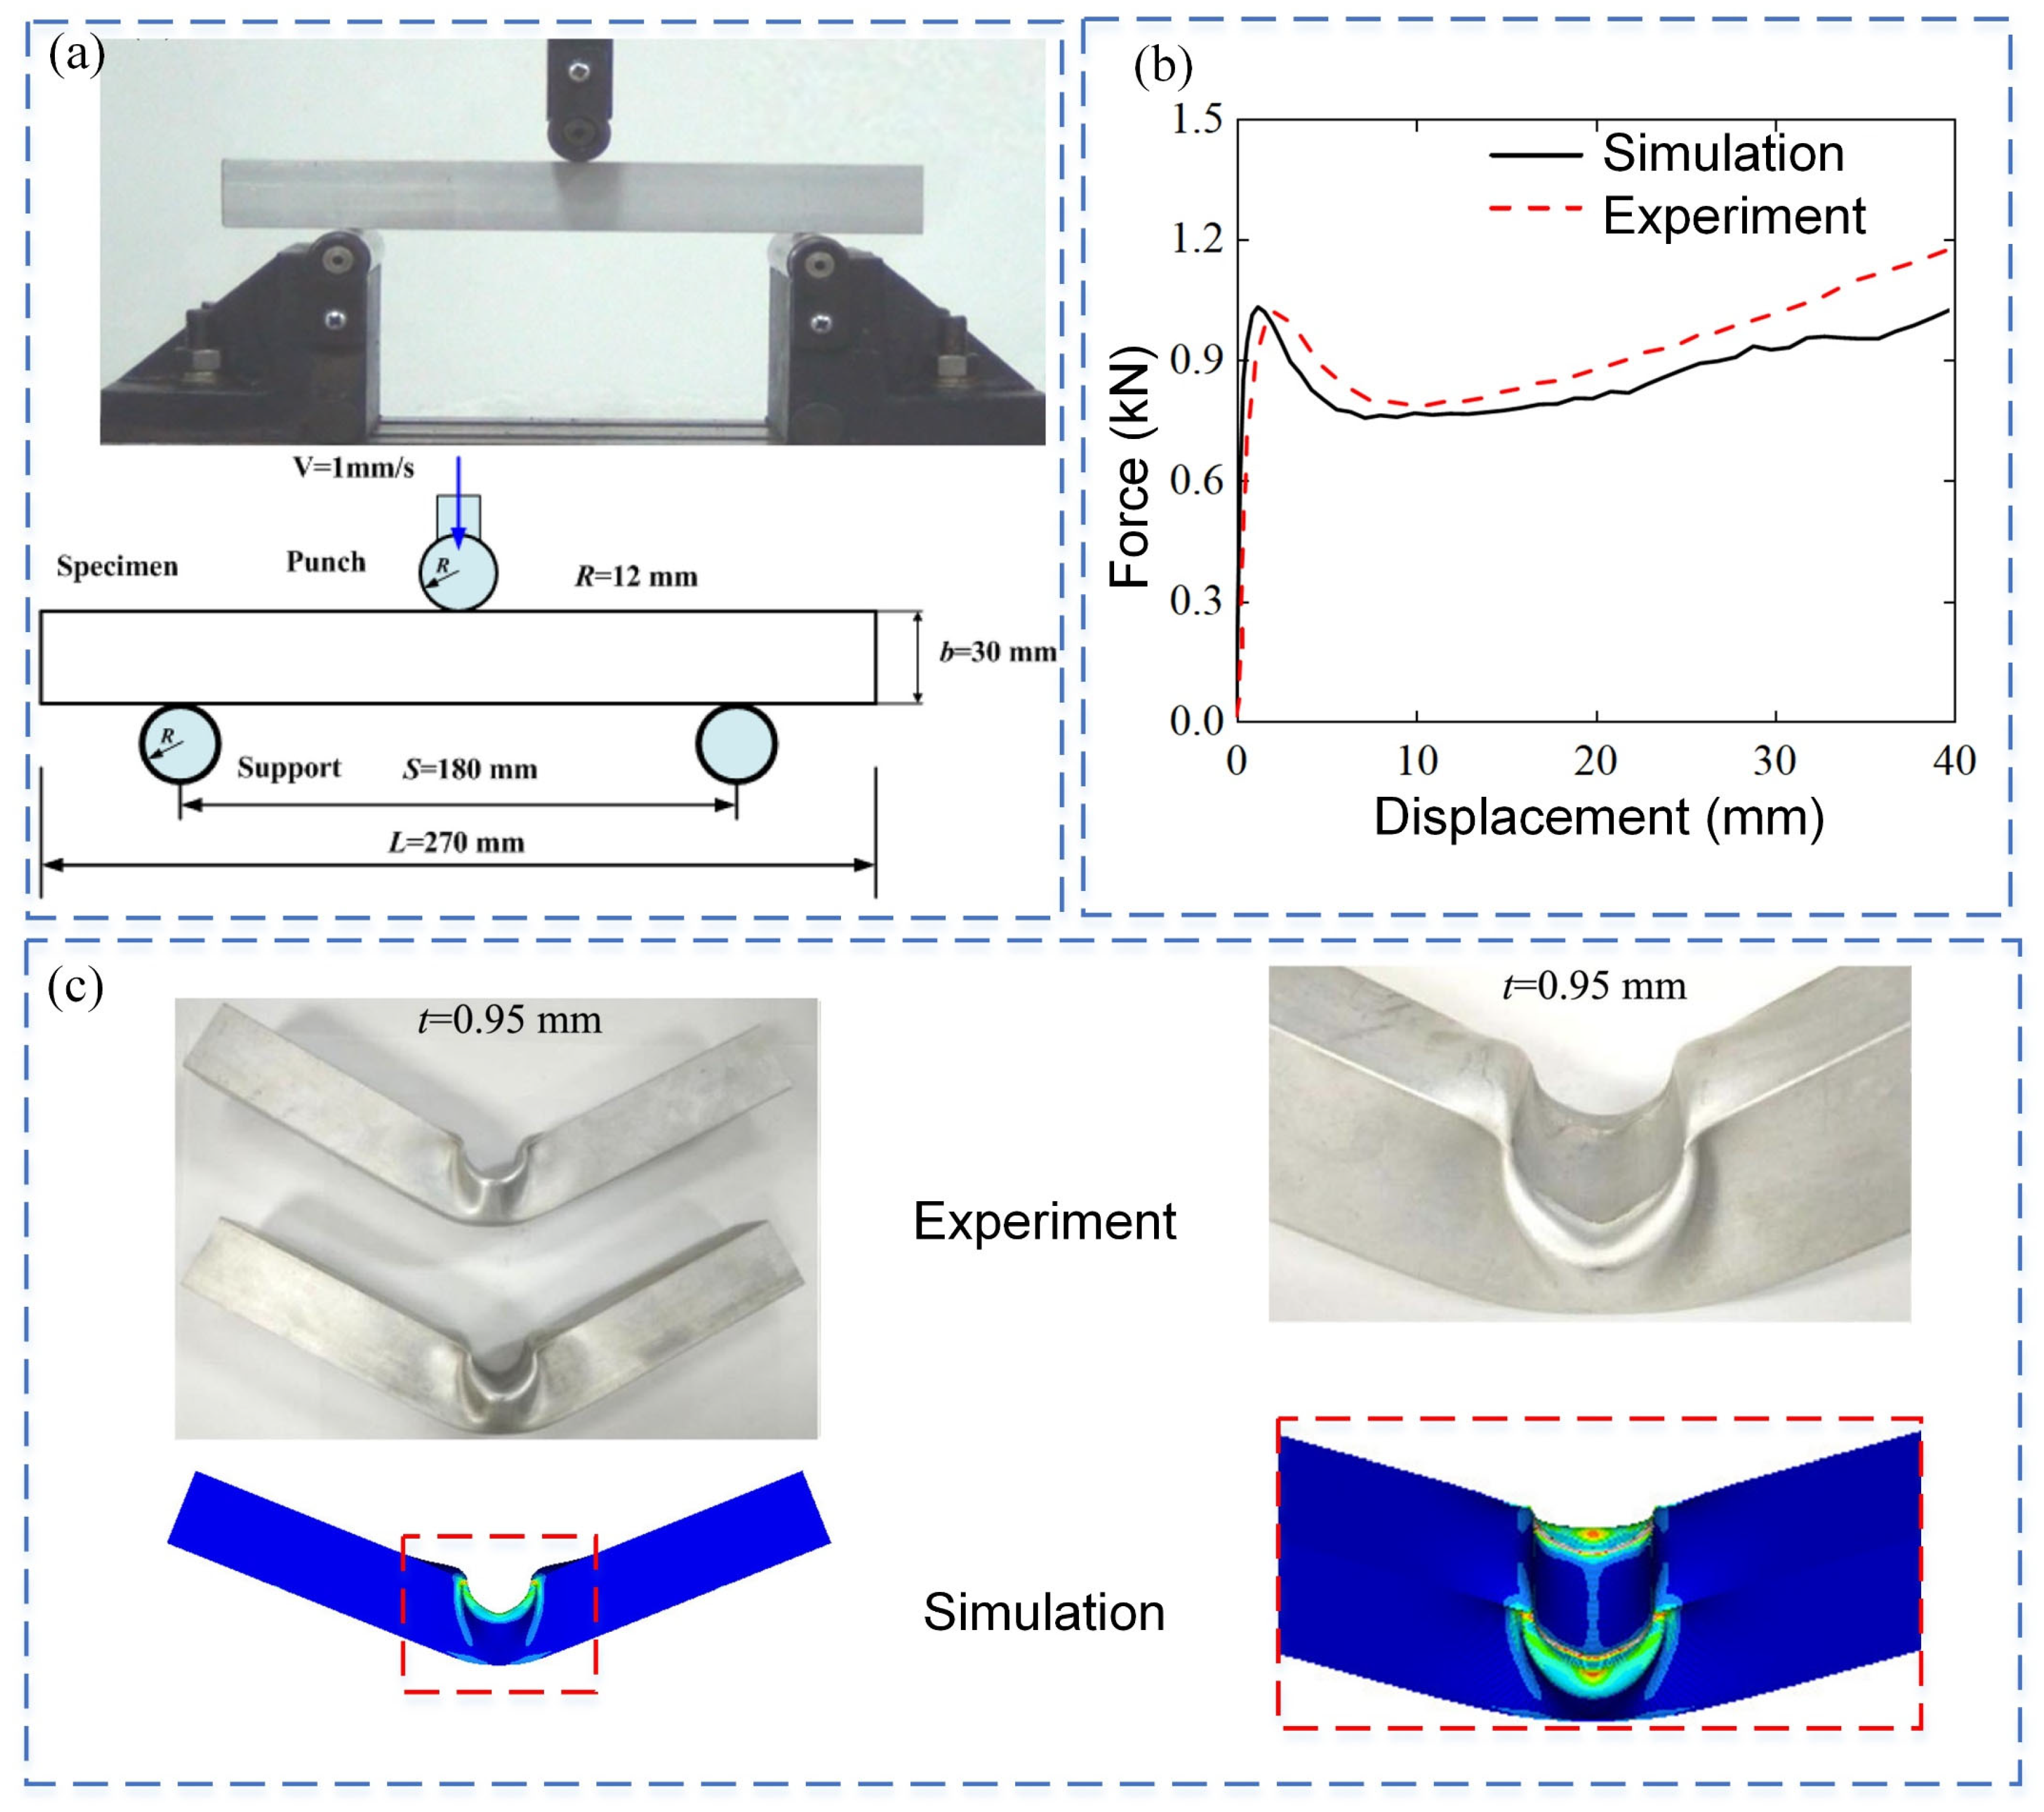
3.1. Verification of Finite Element Model
3.2. Parameter Study
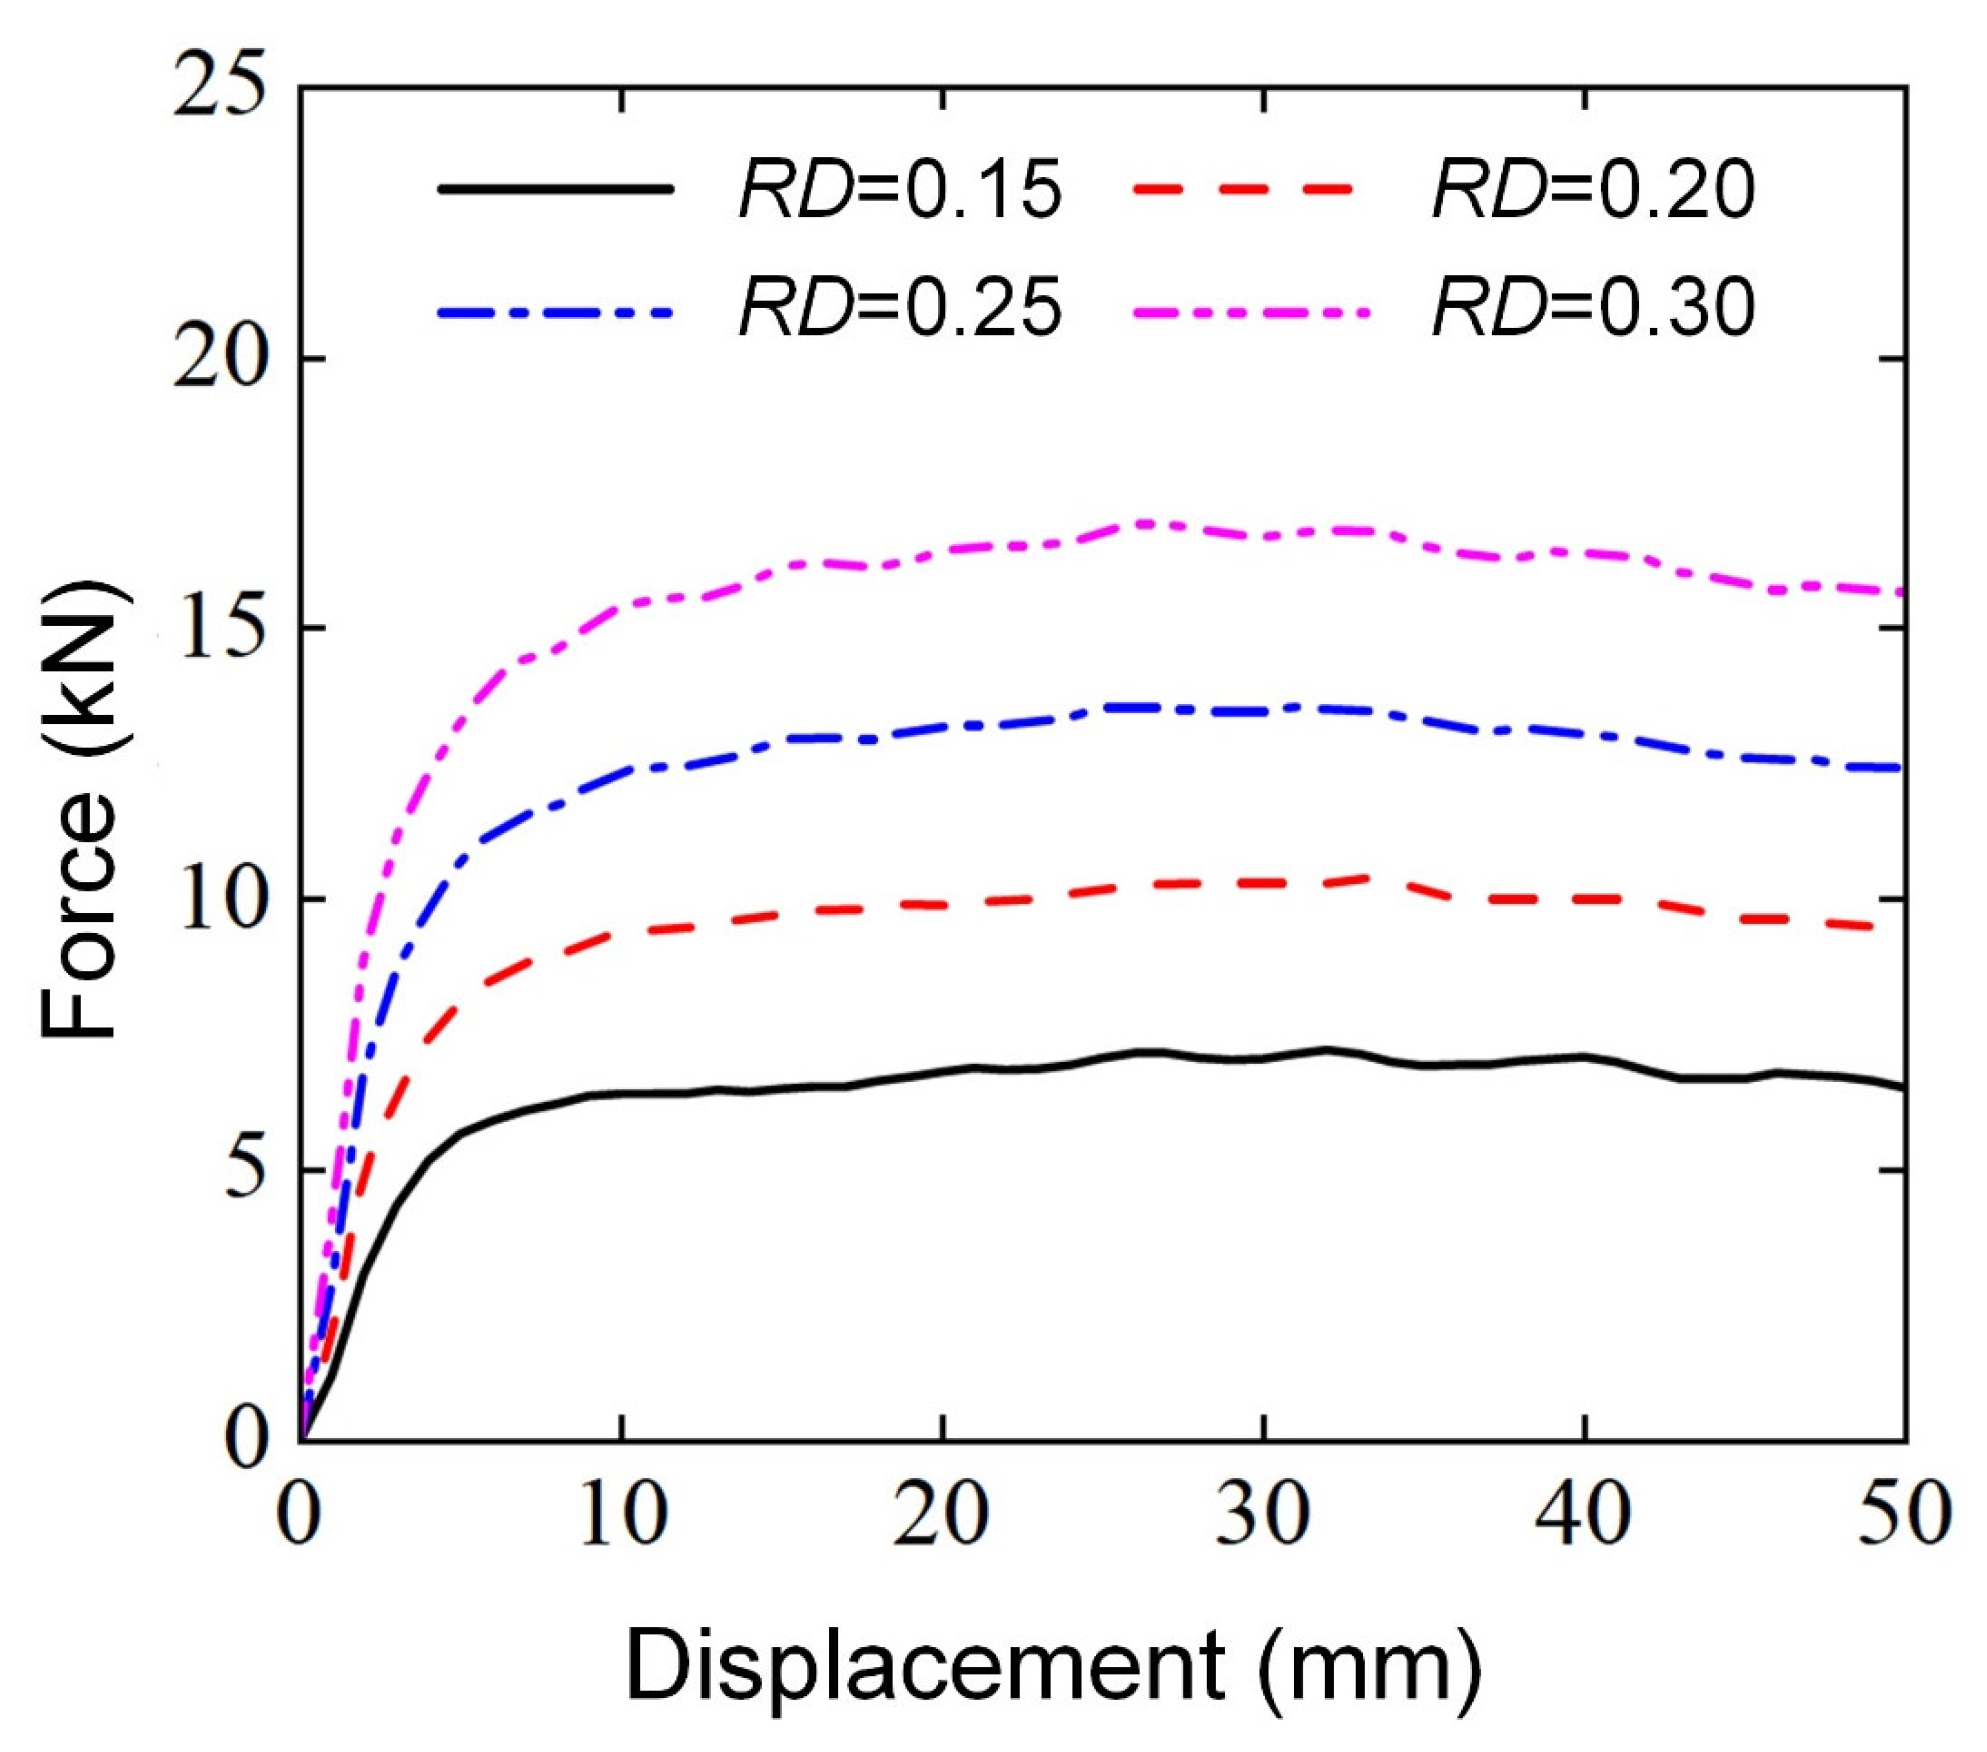
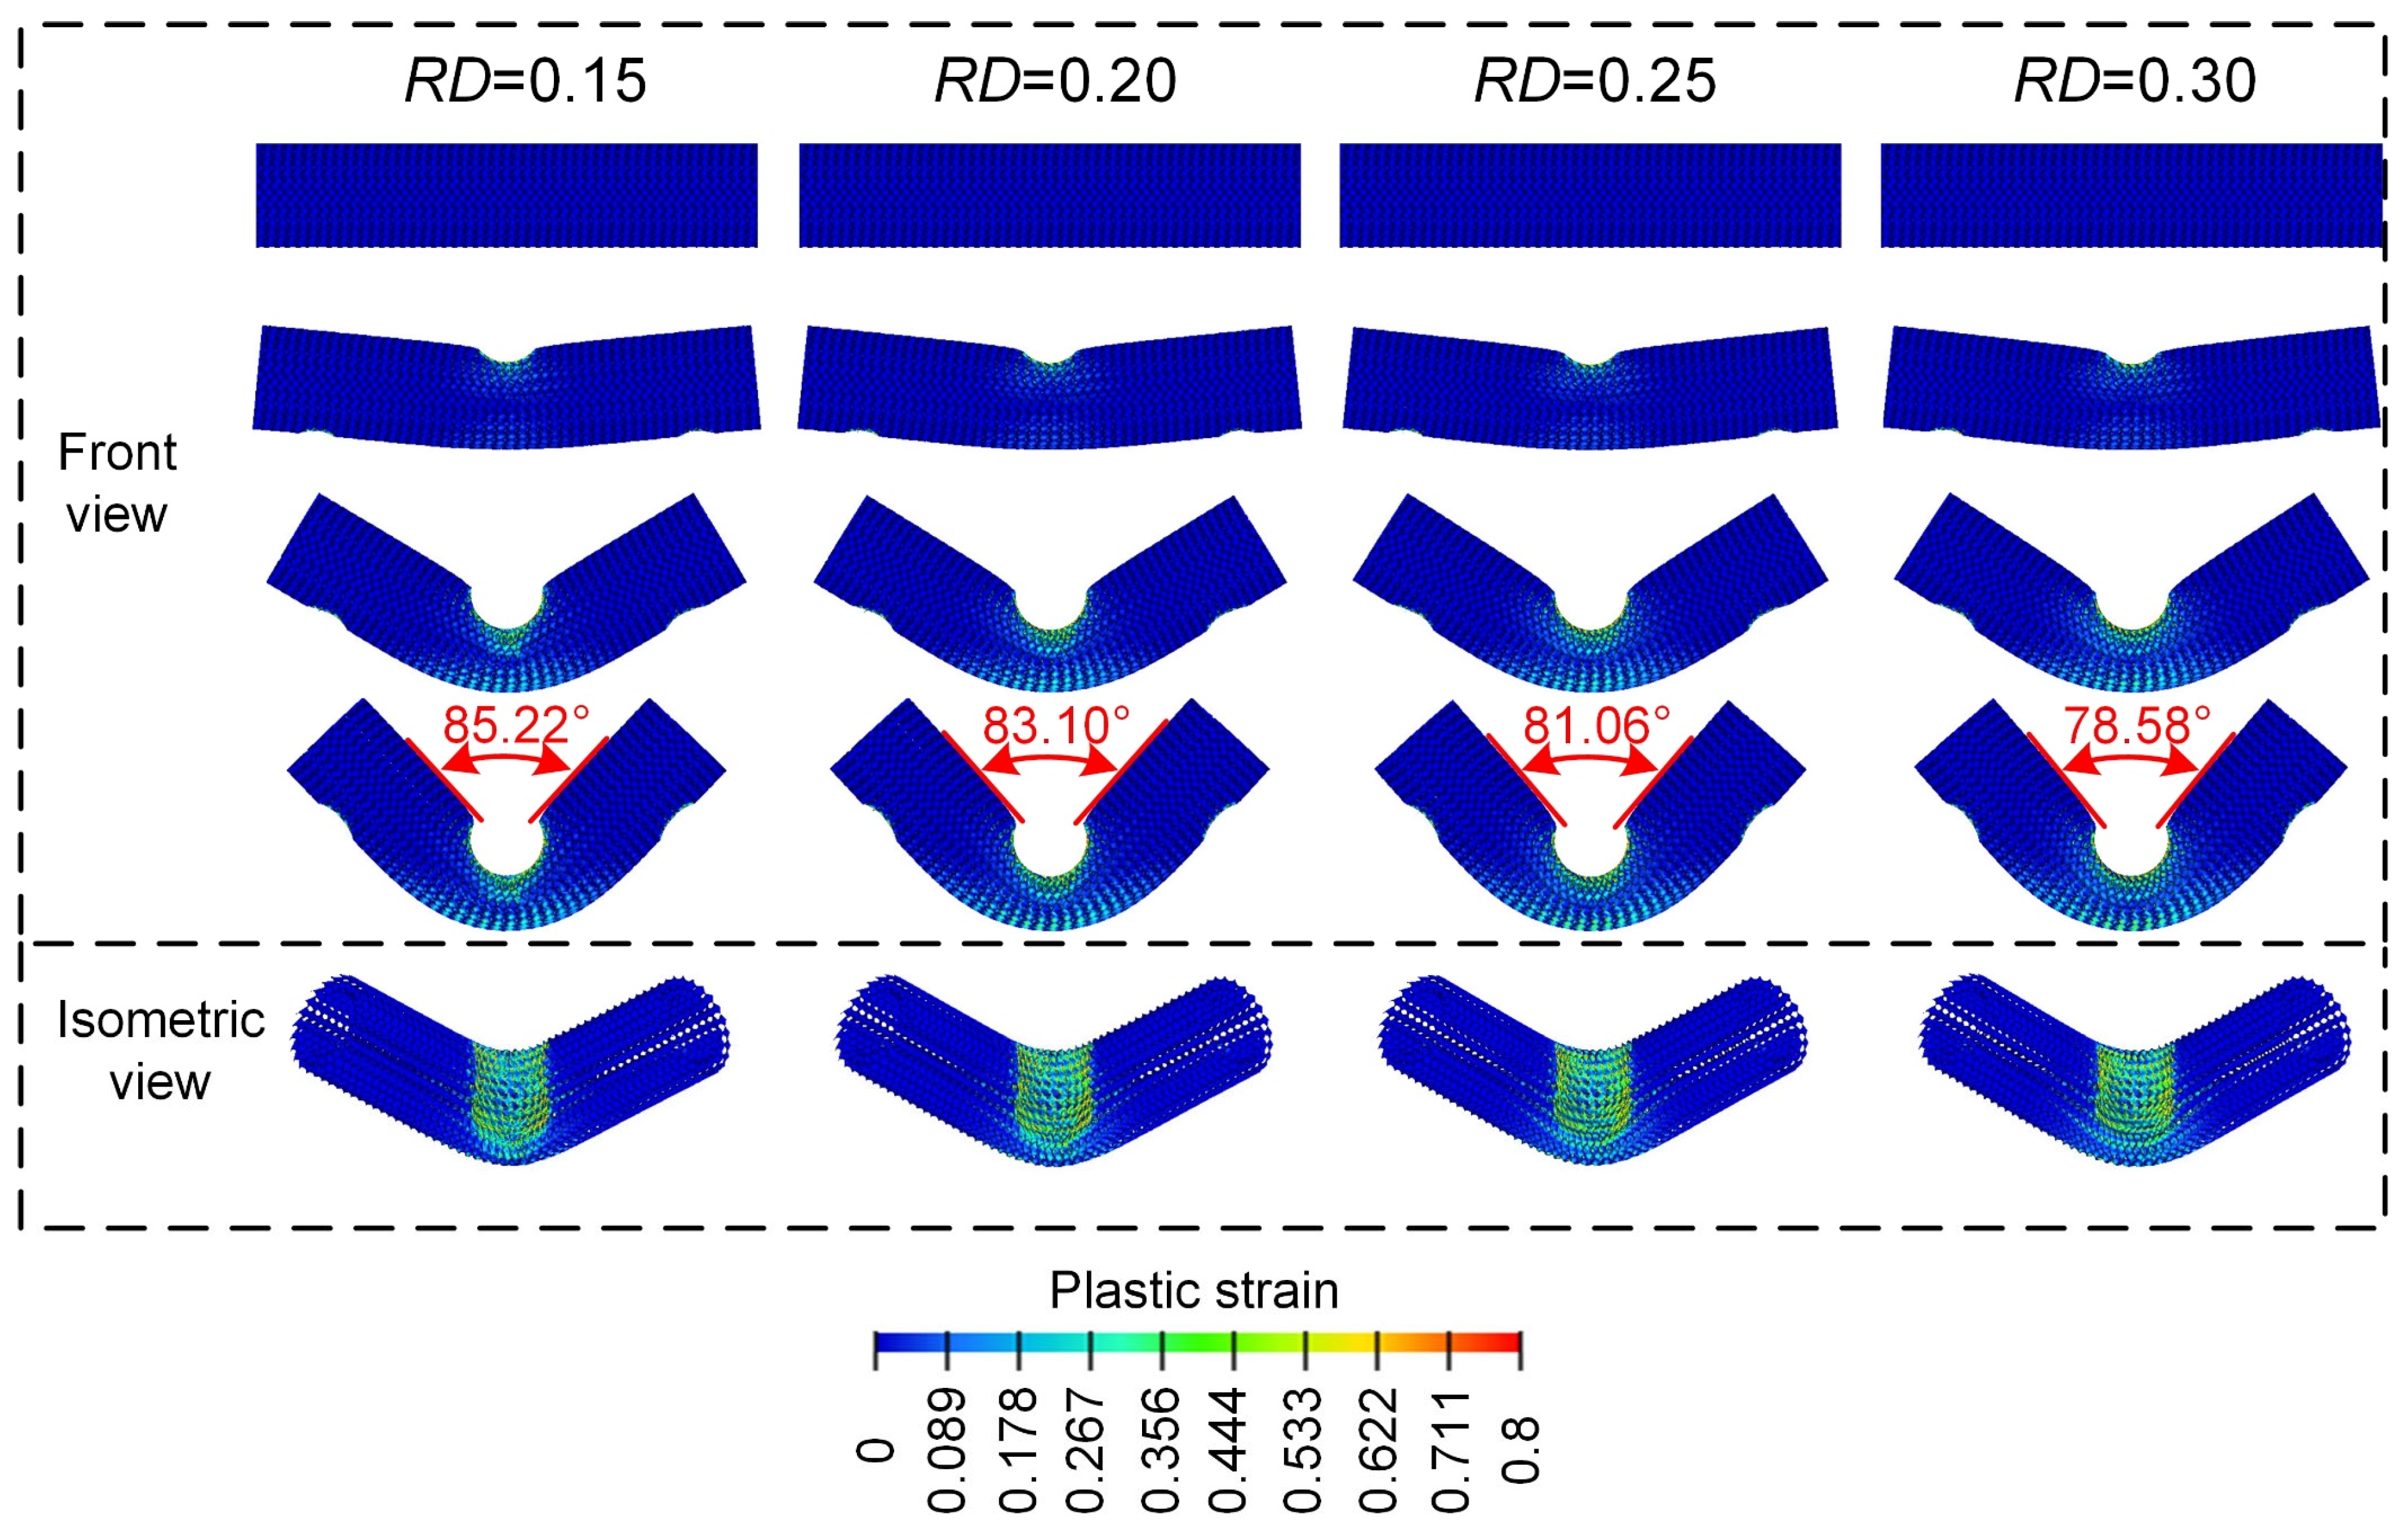
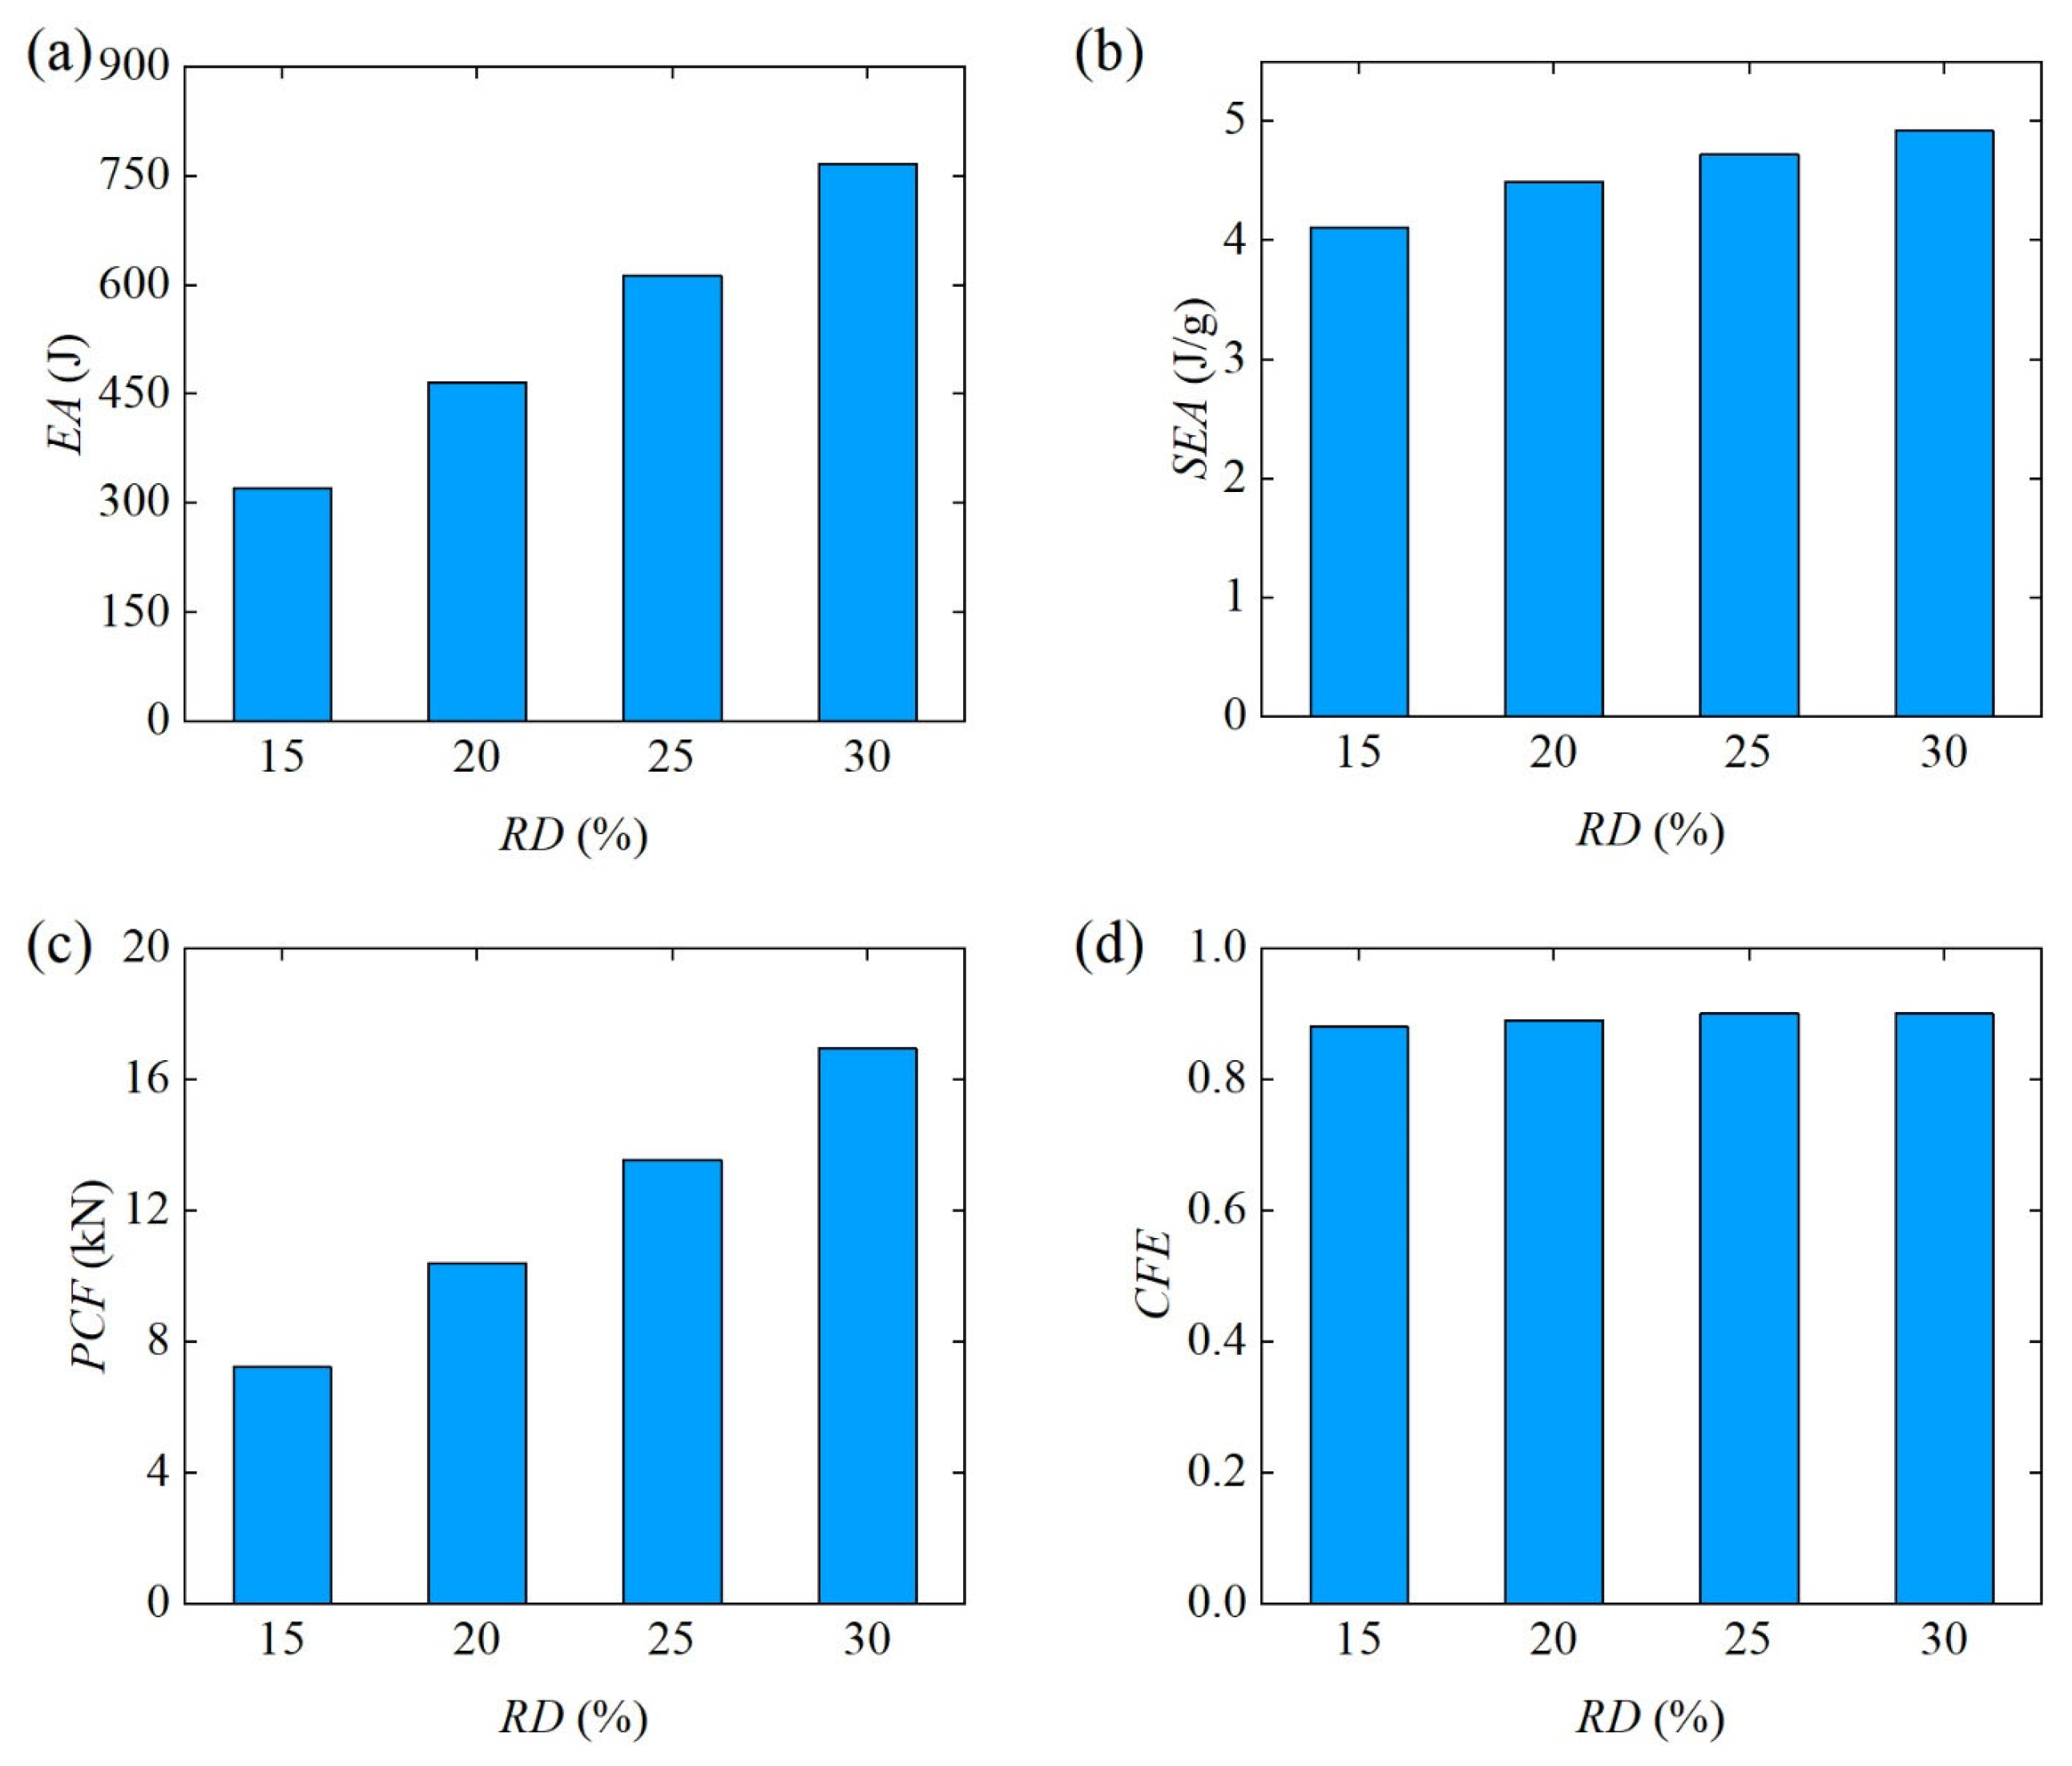
3.2.1. Effect of Relative Density
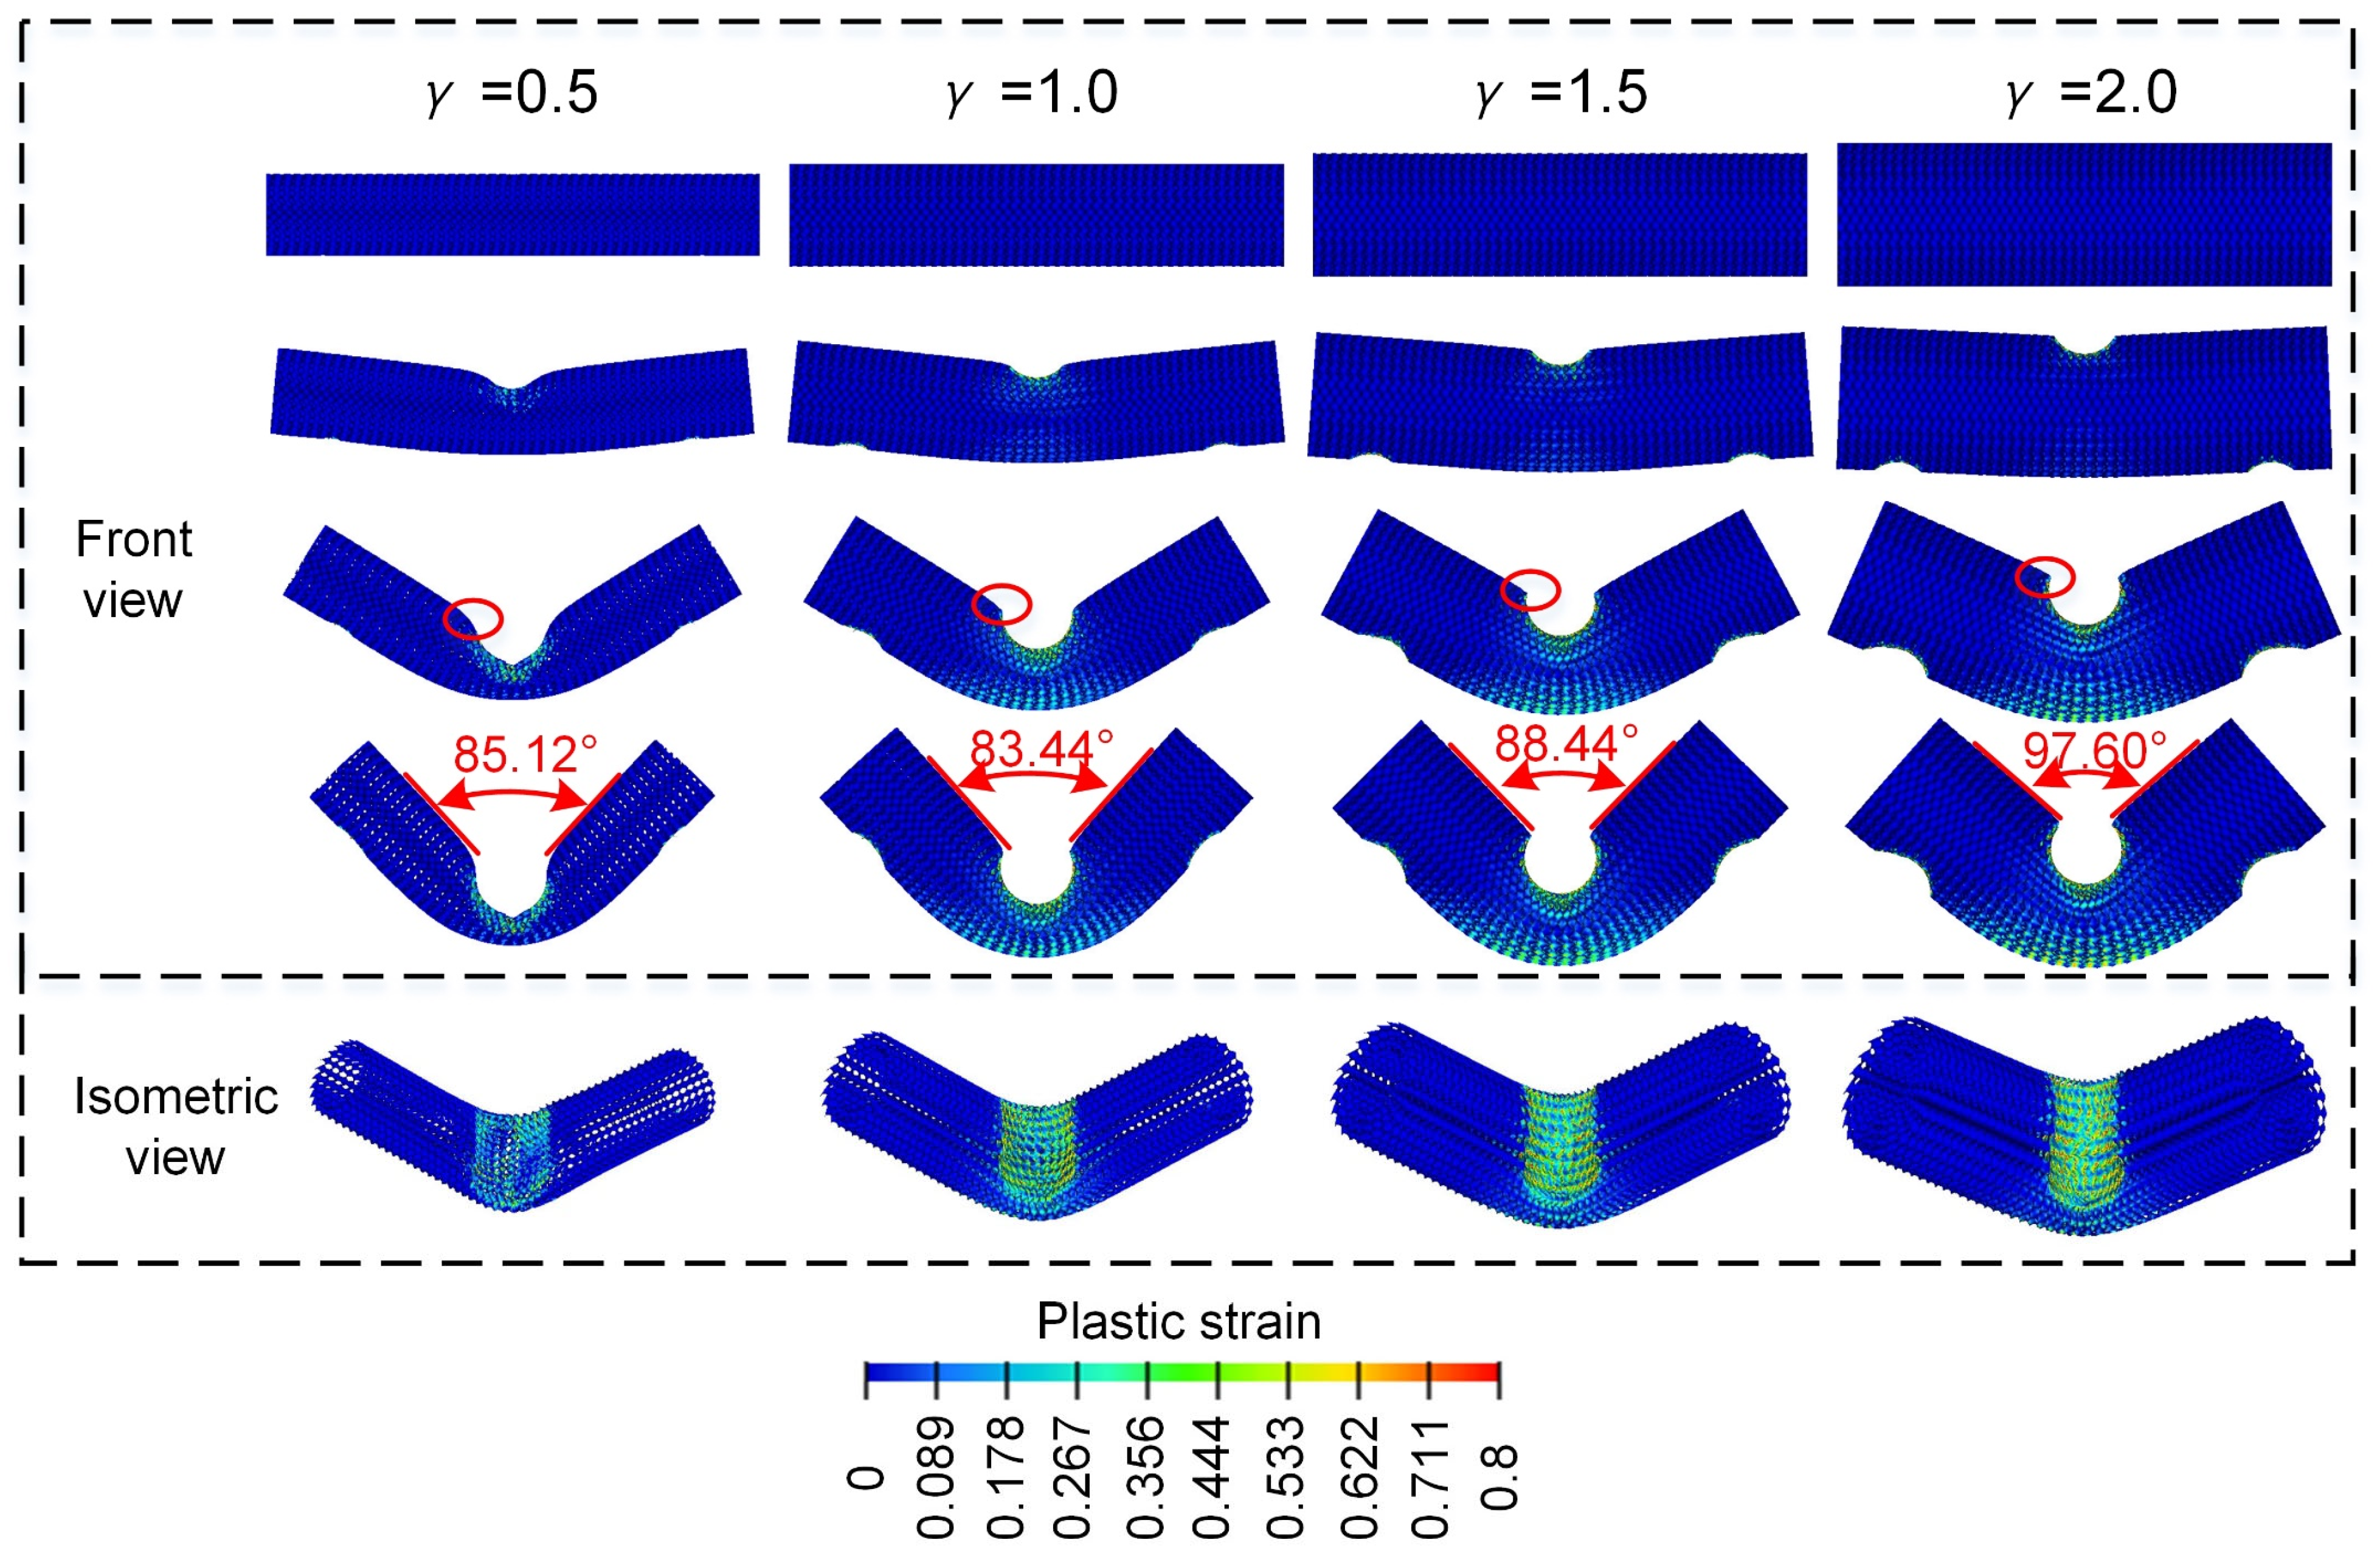
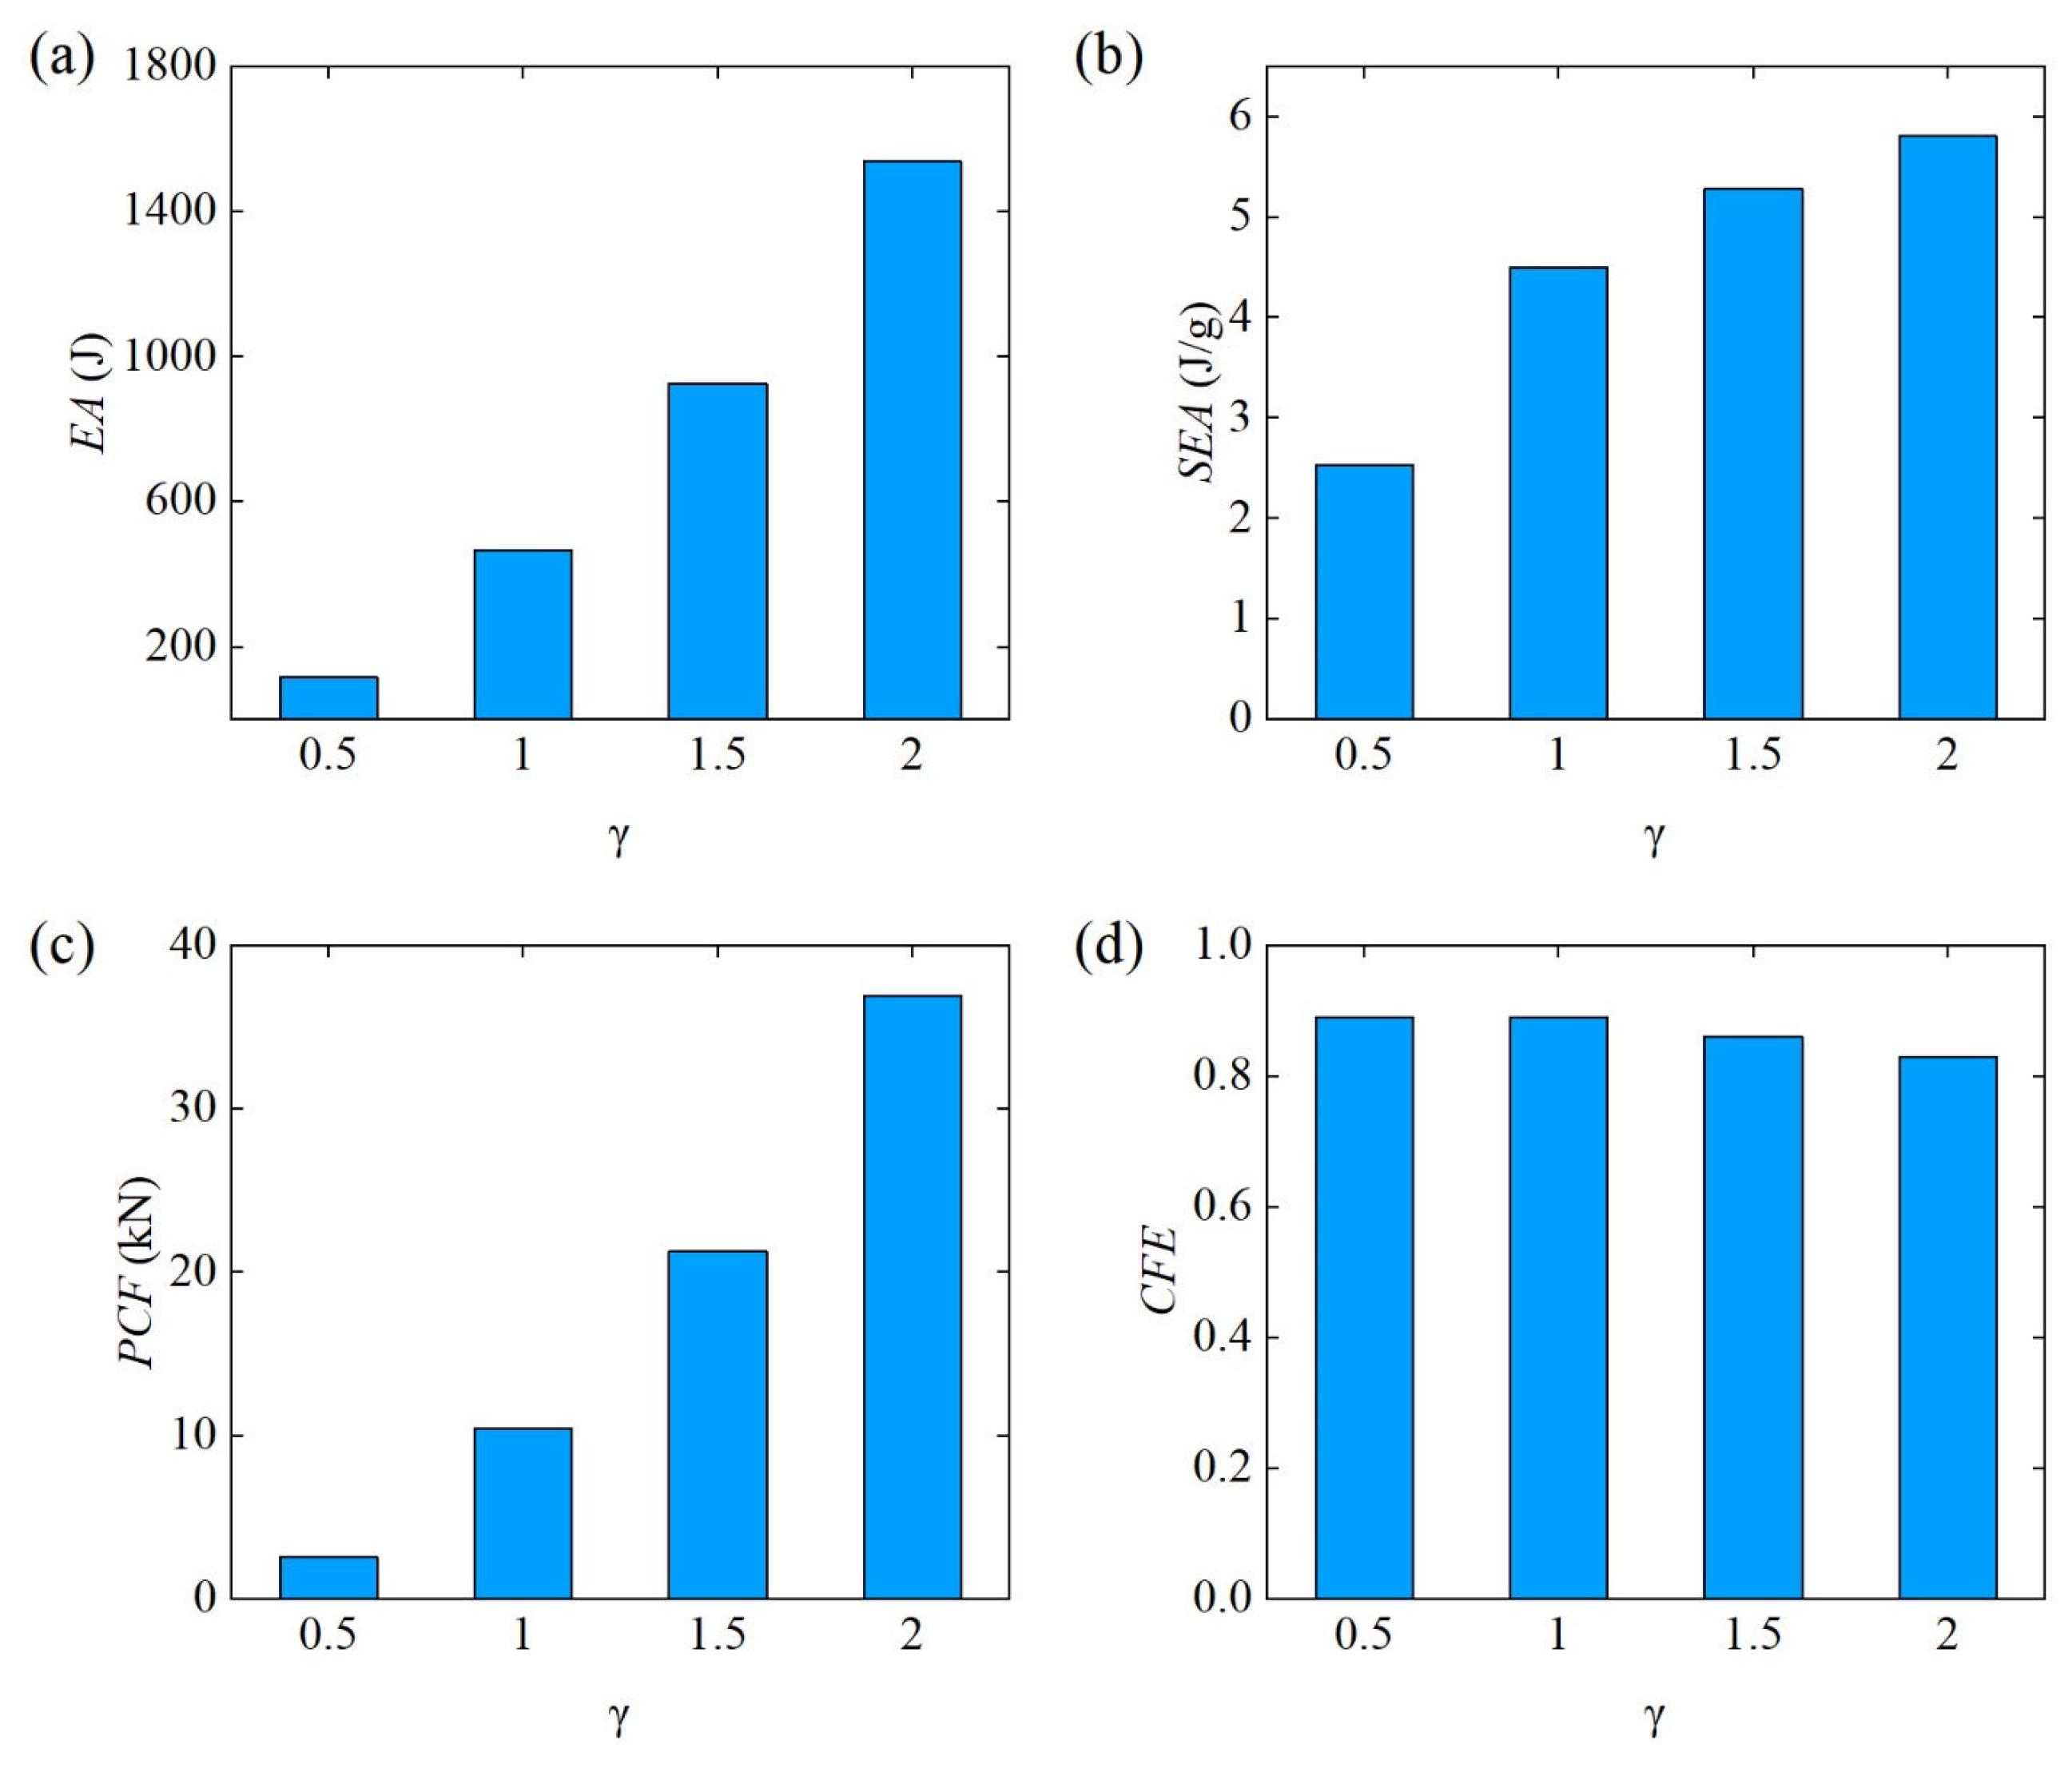
3.2.2. Effect of Radial Variation Coefficient ()
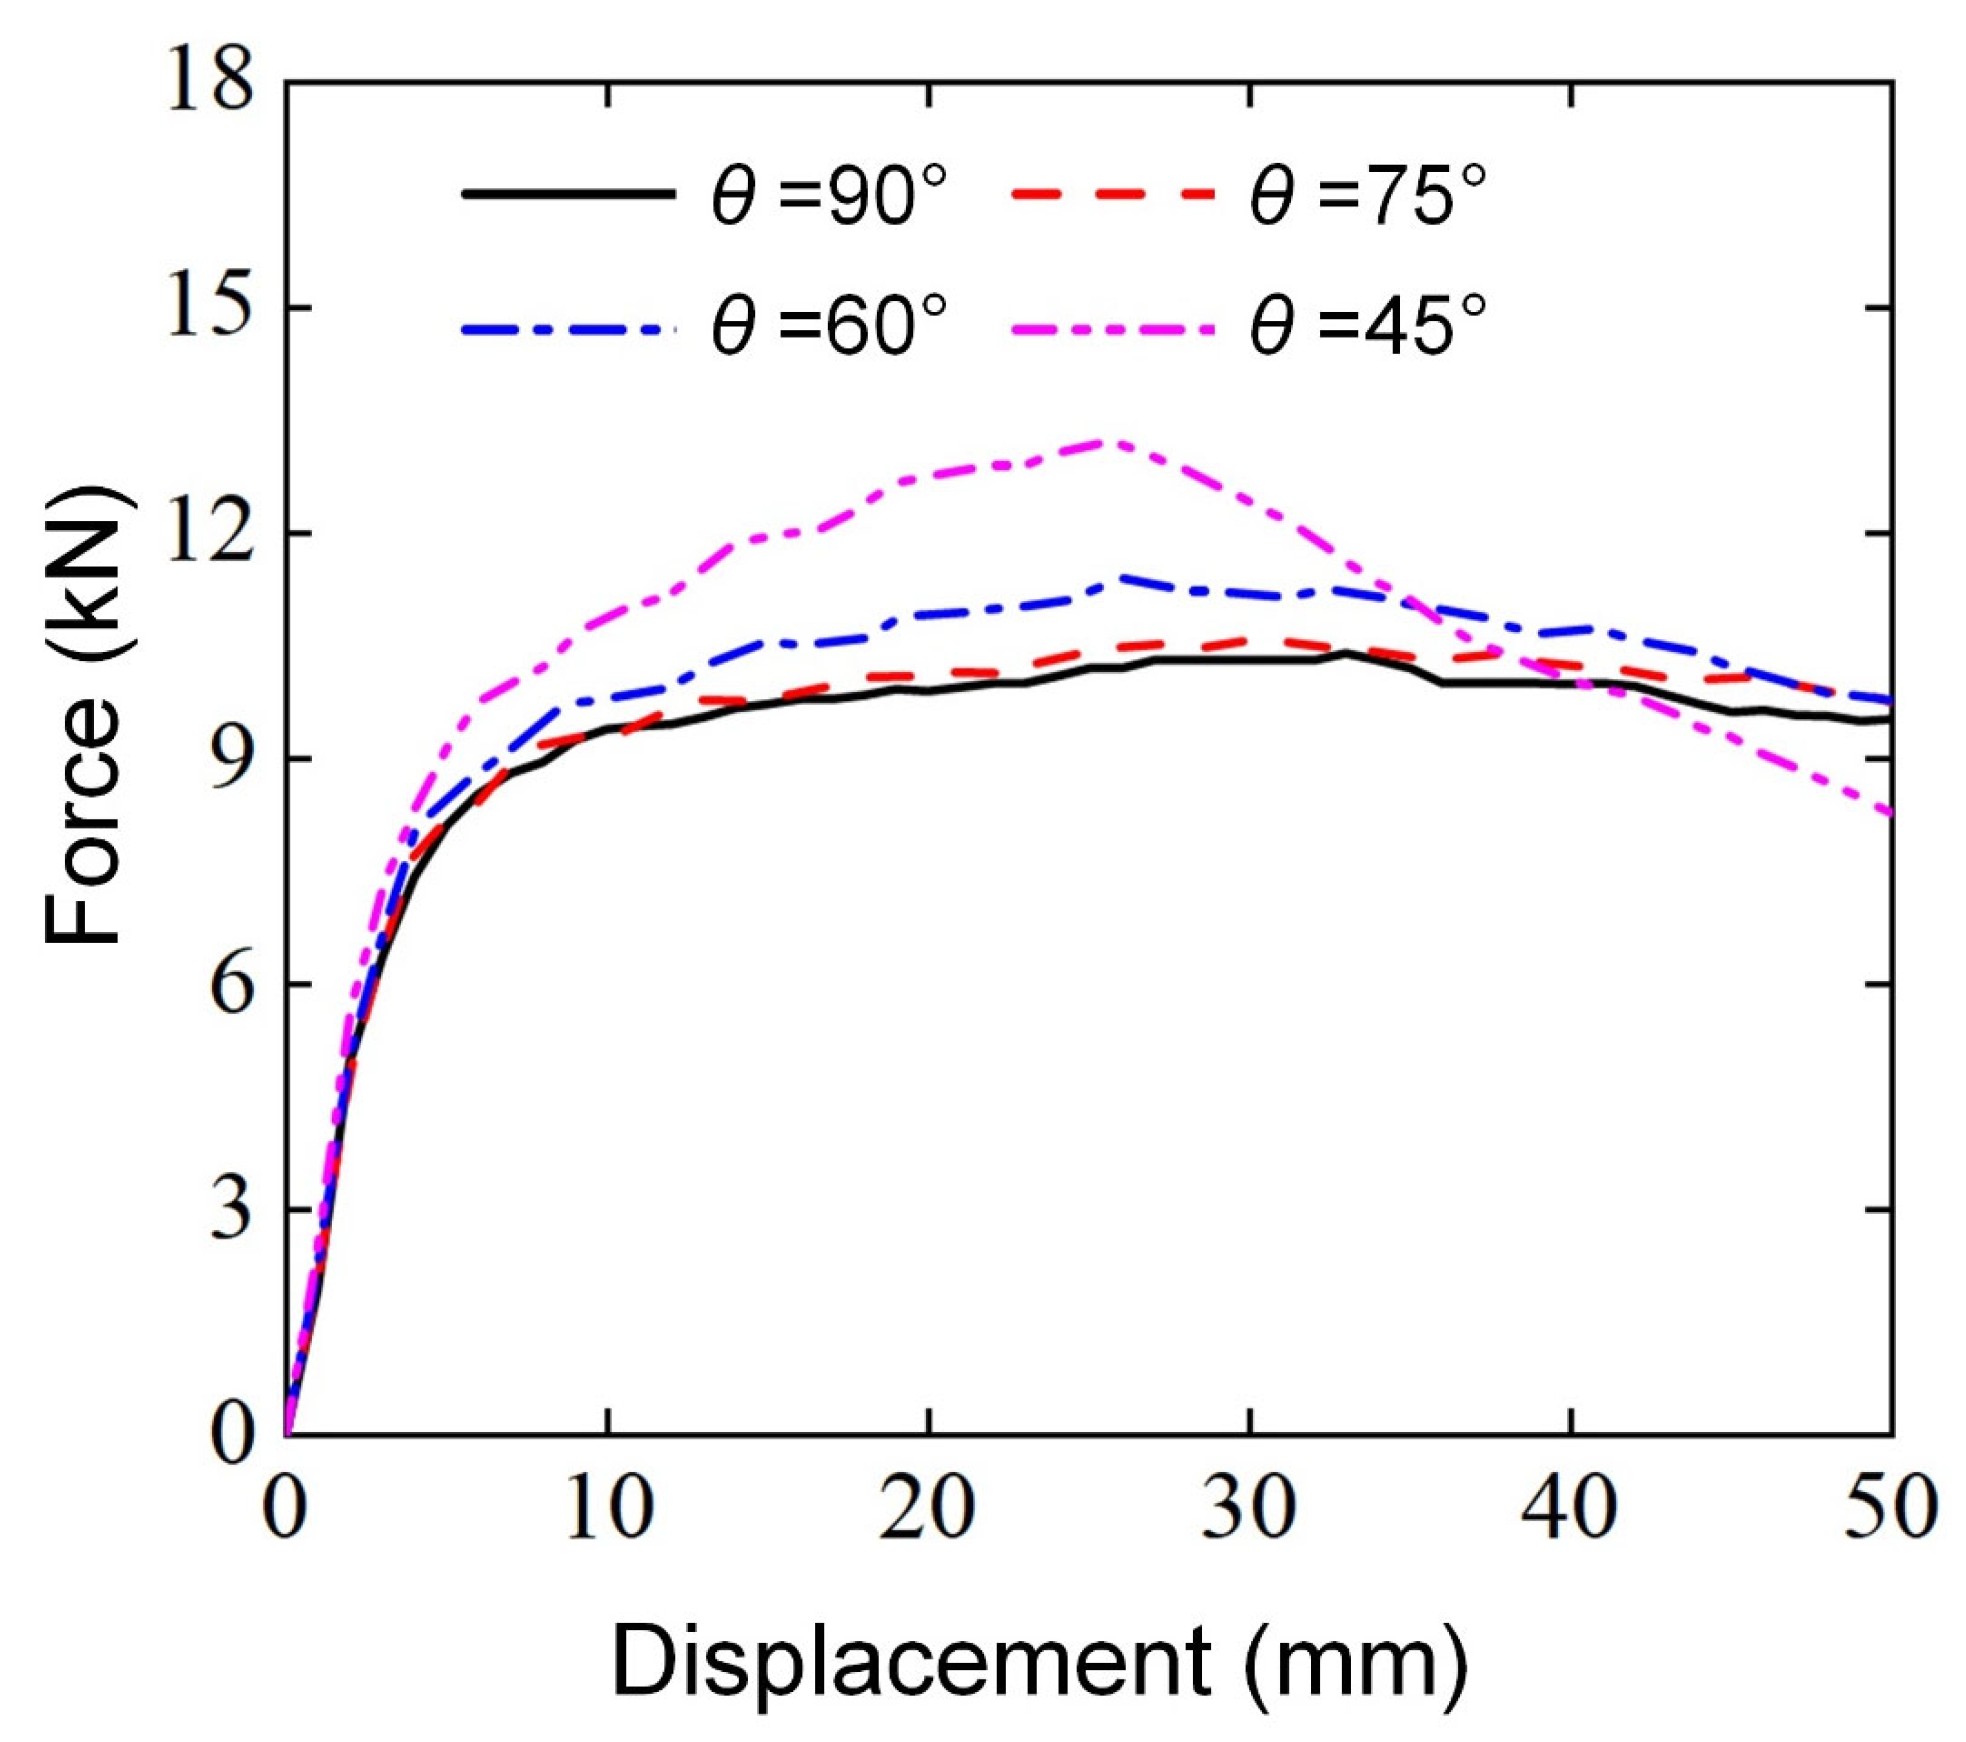
3.2.3. Effect of Mapping Angle ()
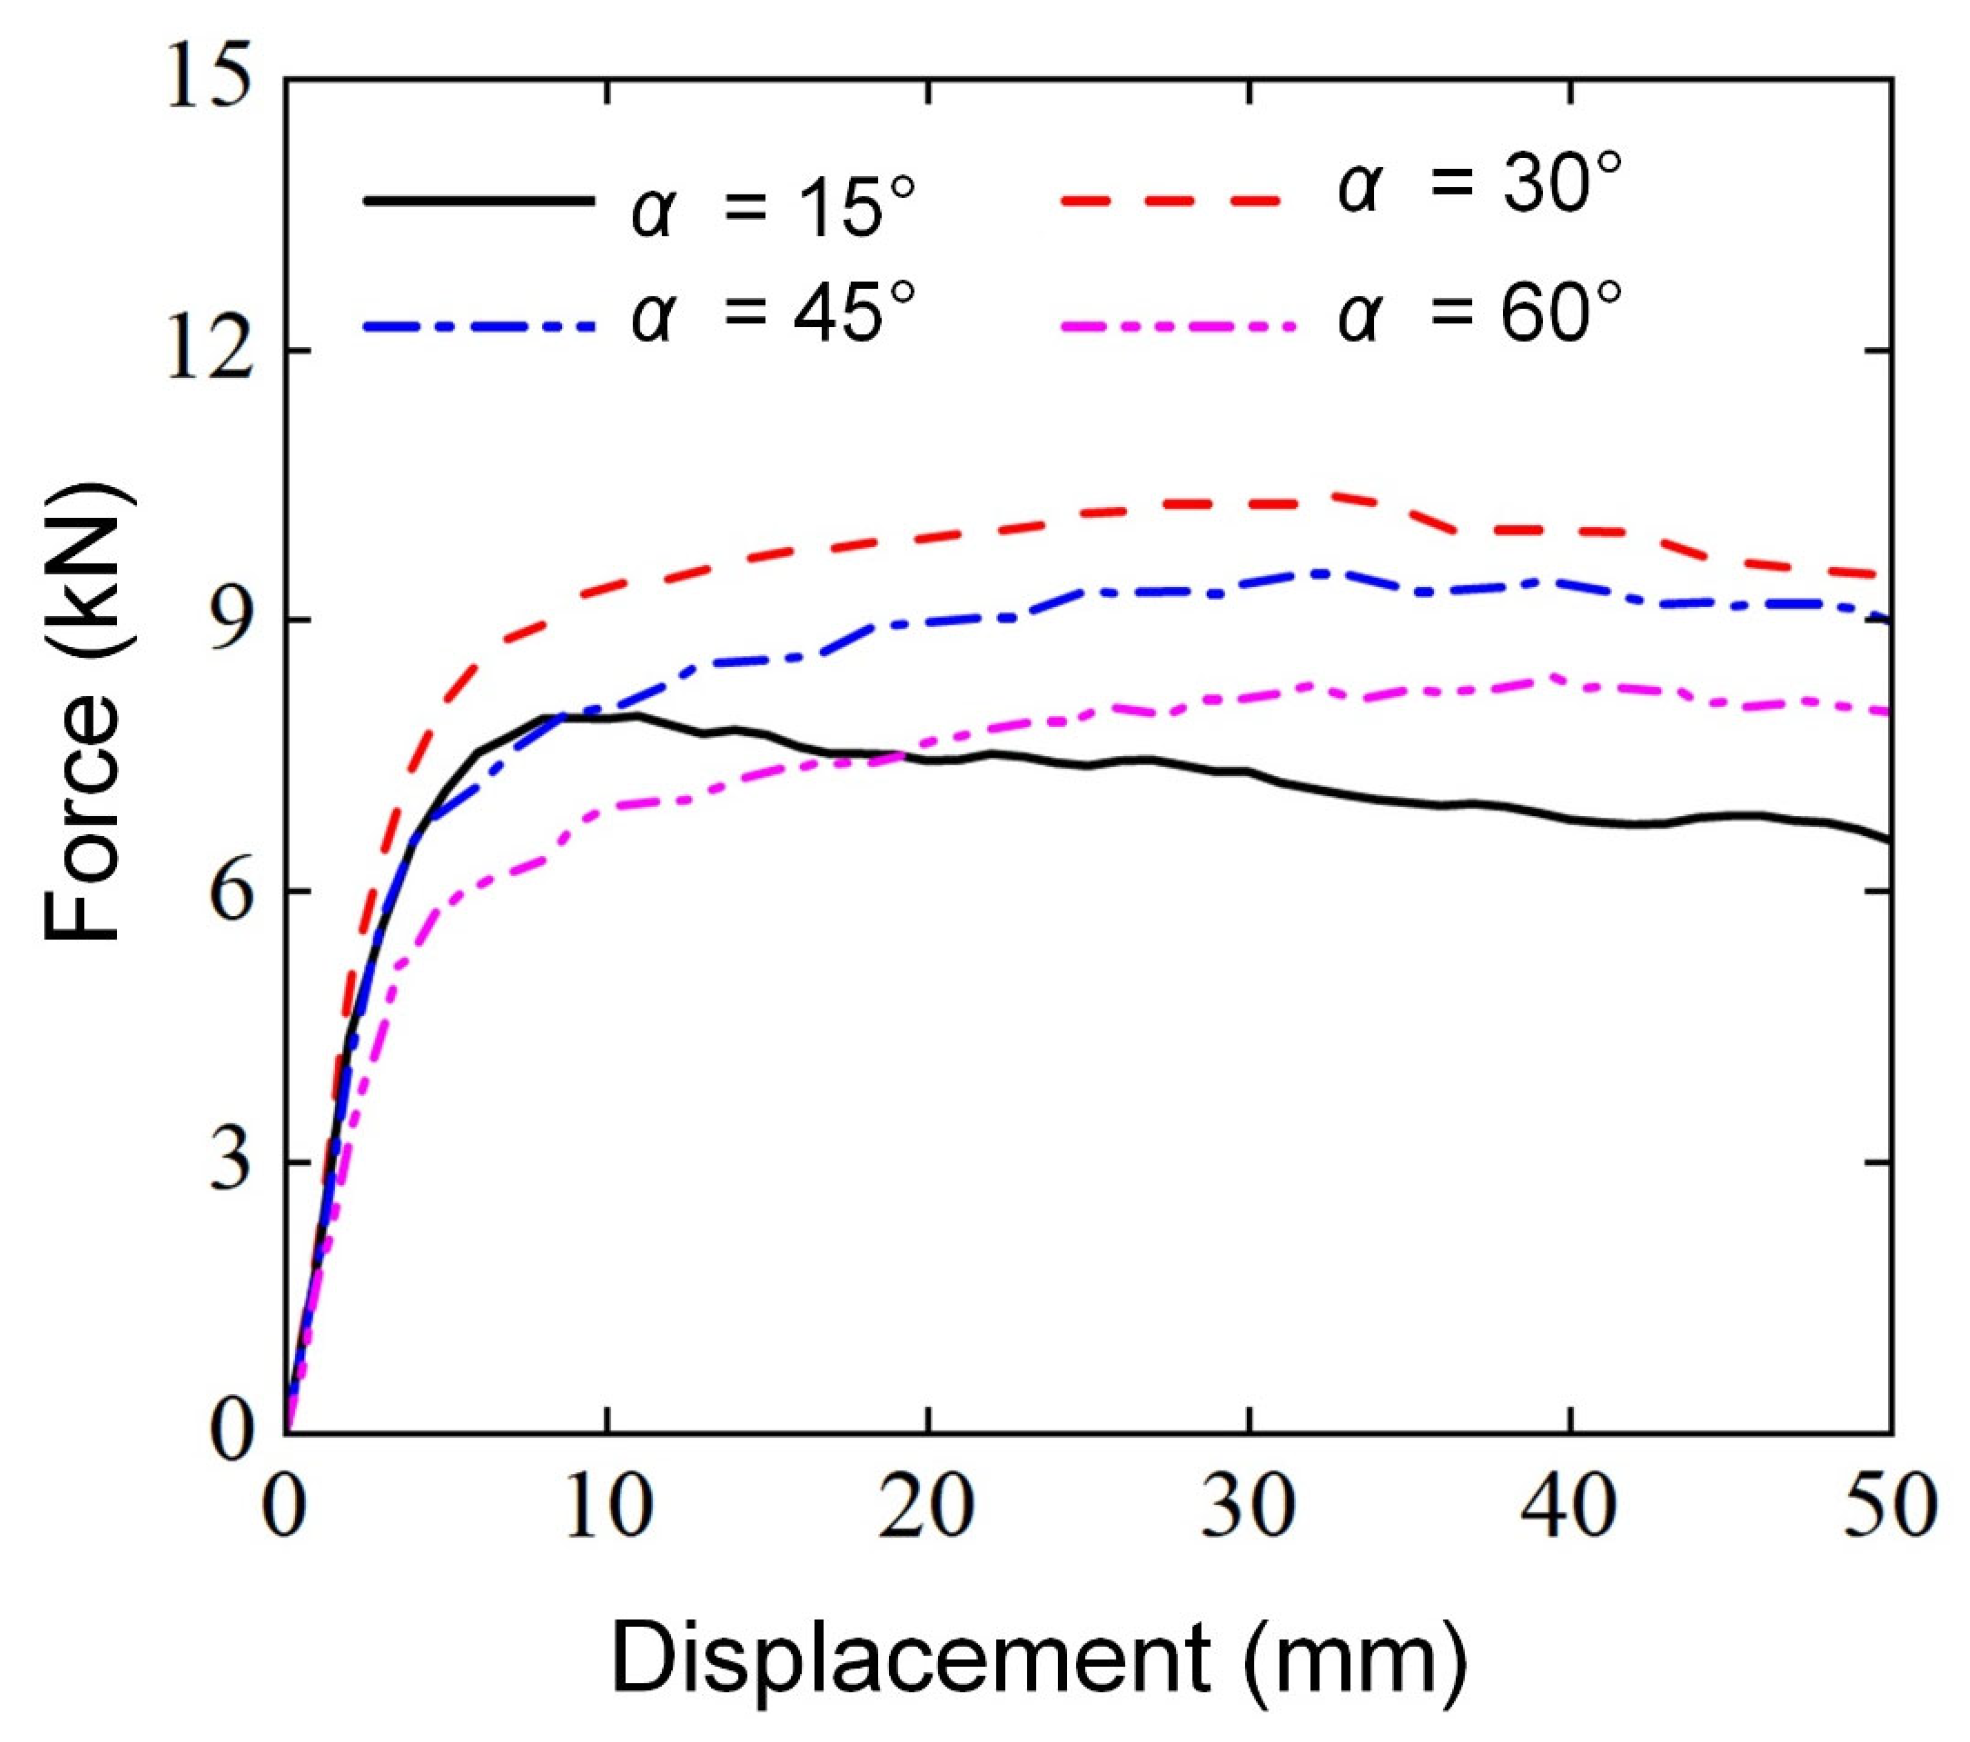
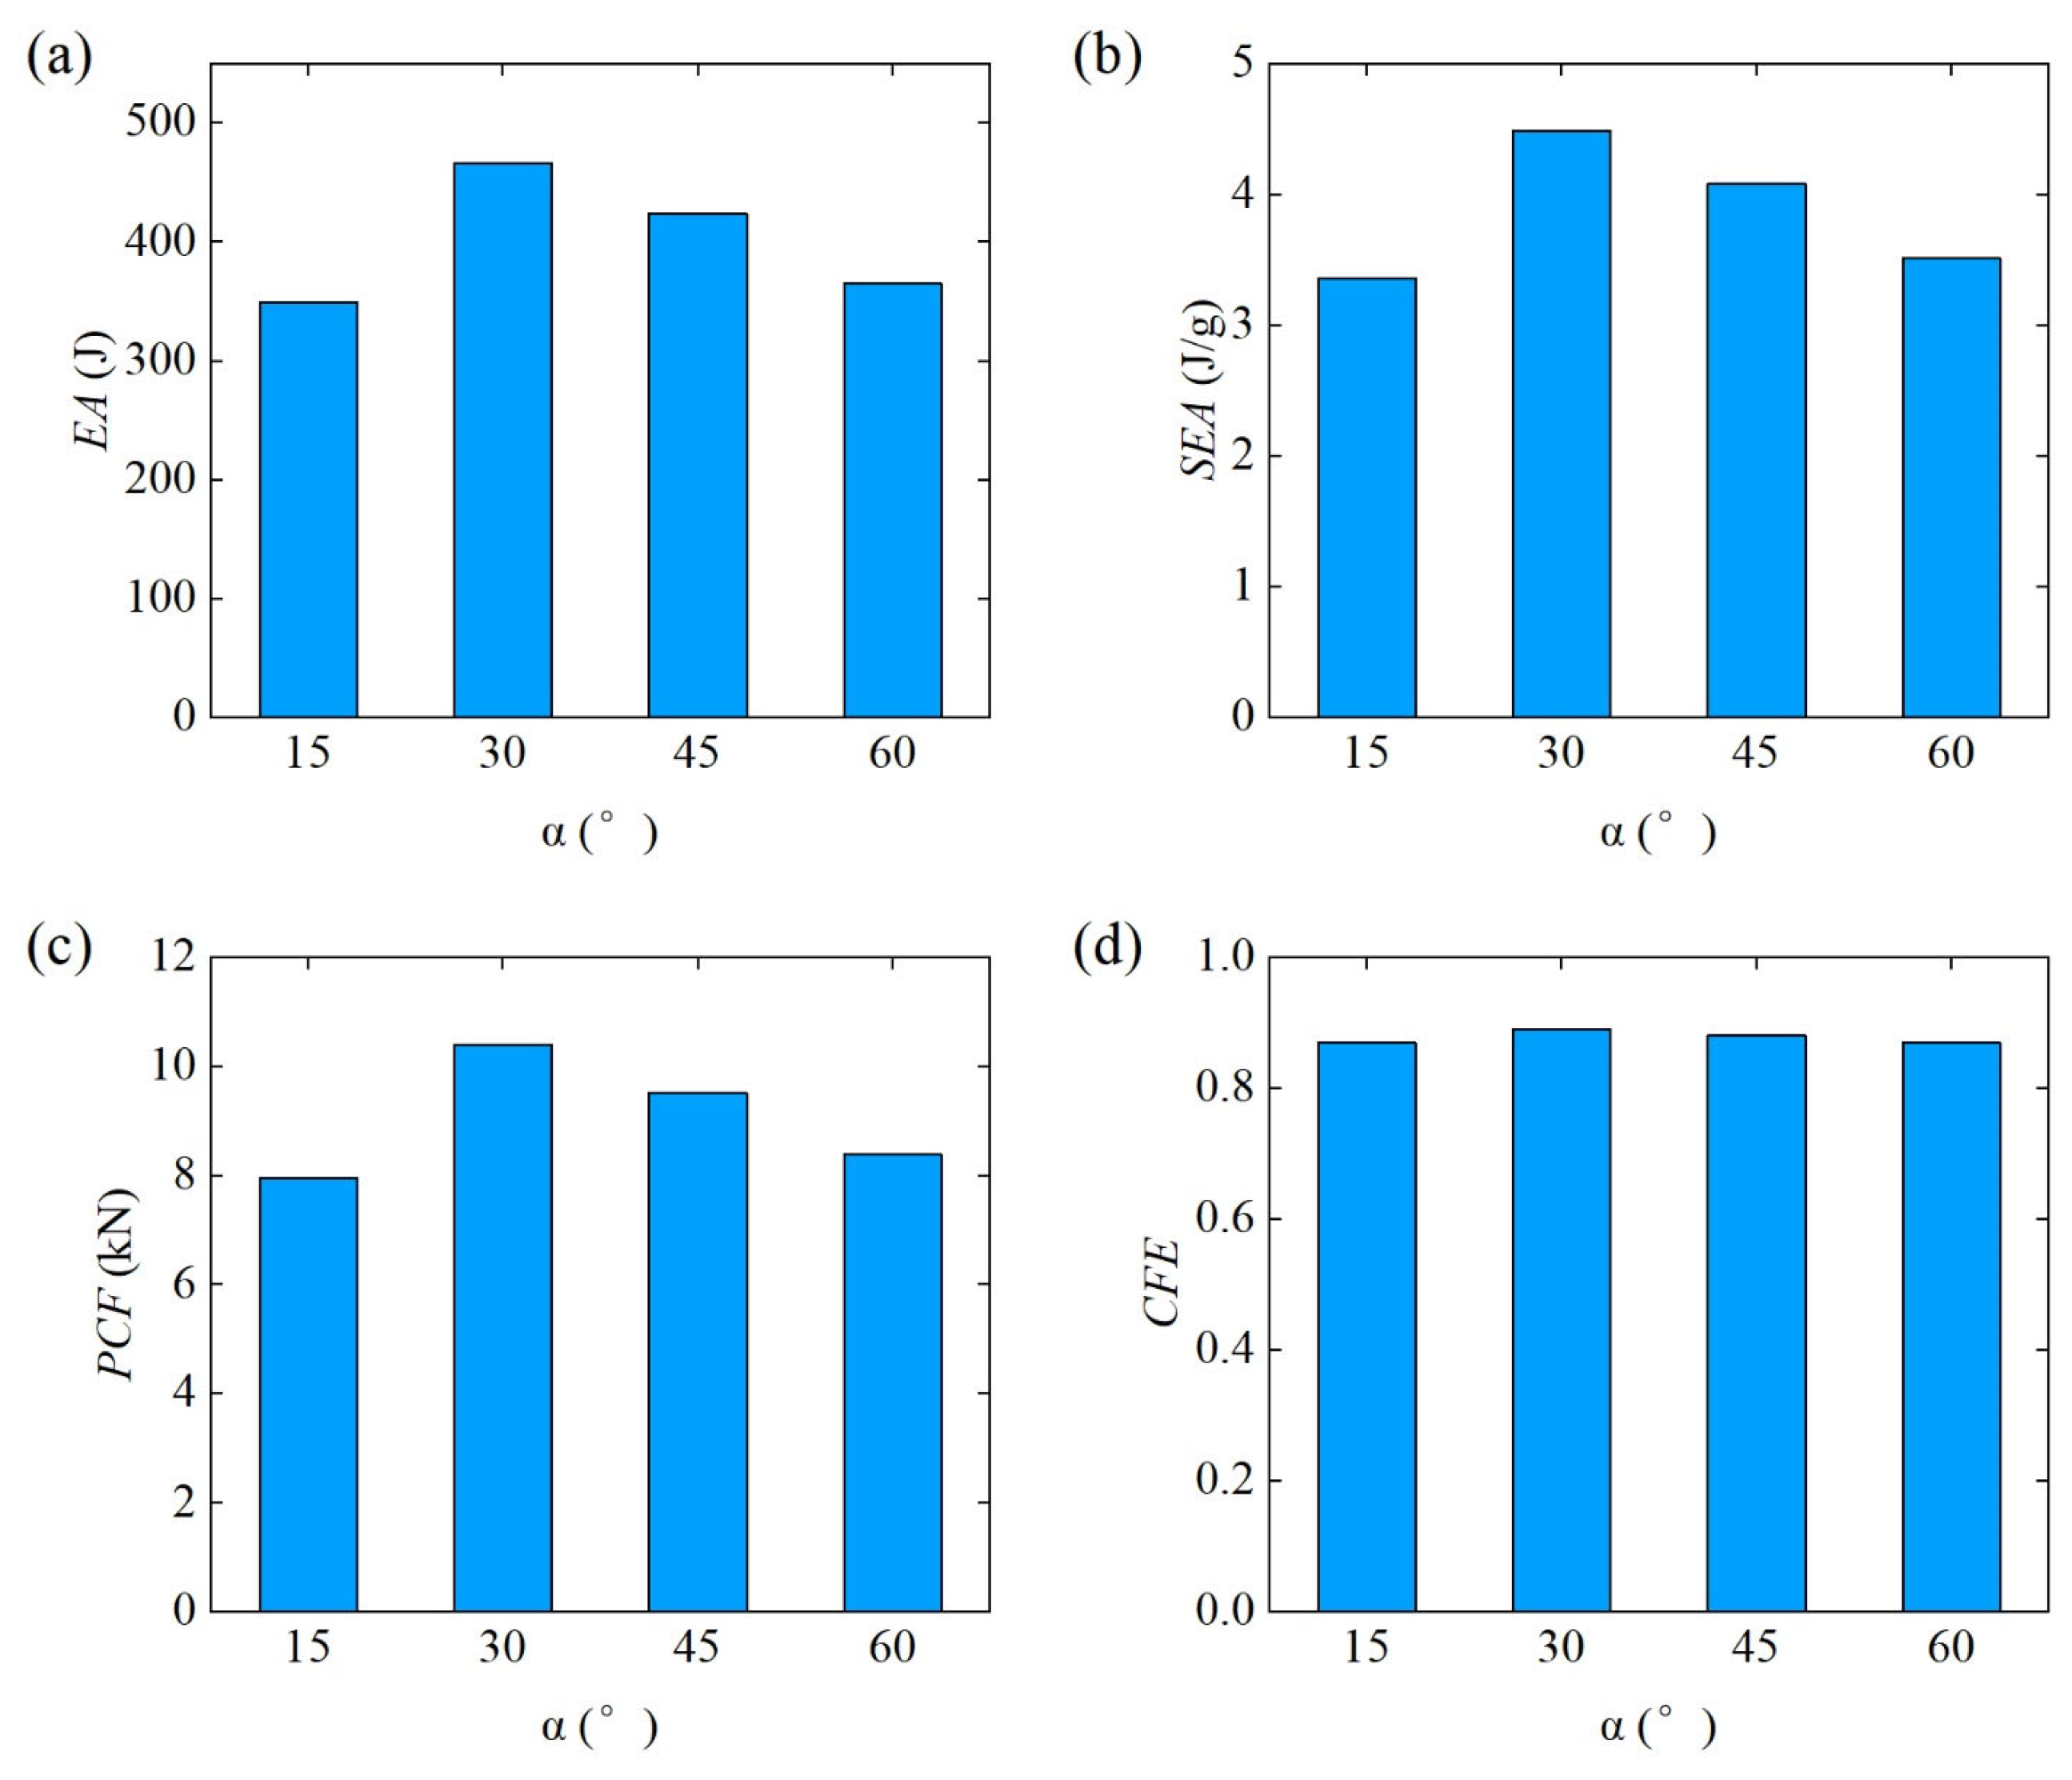
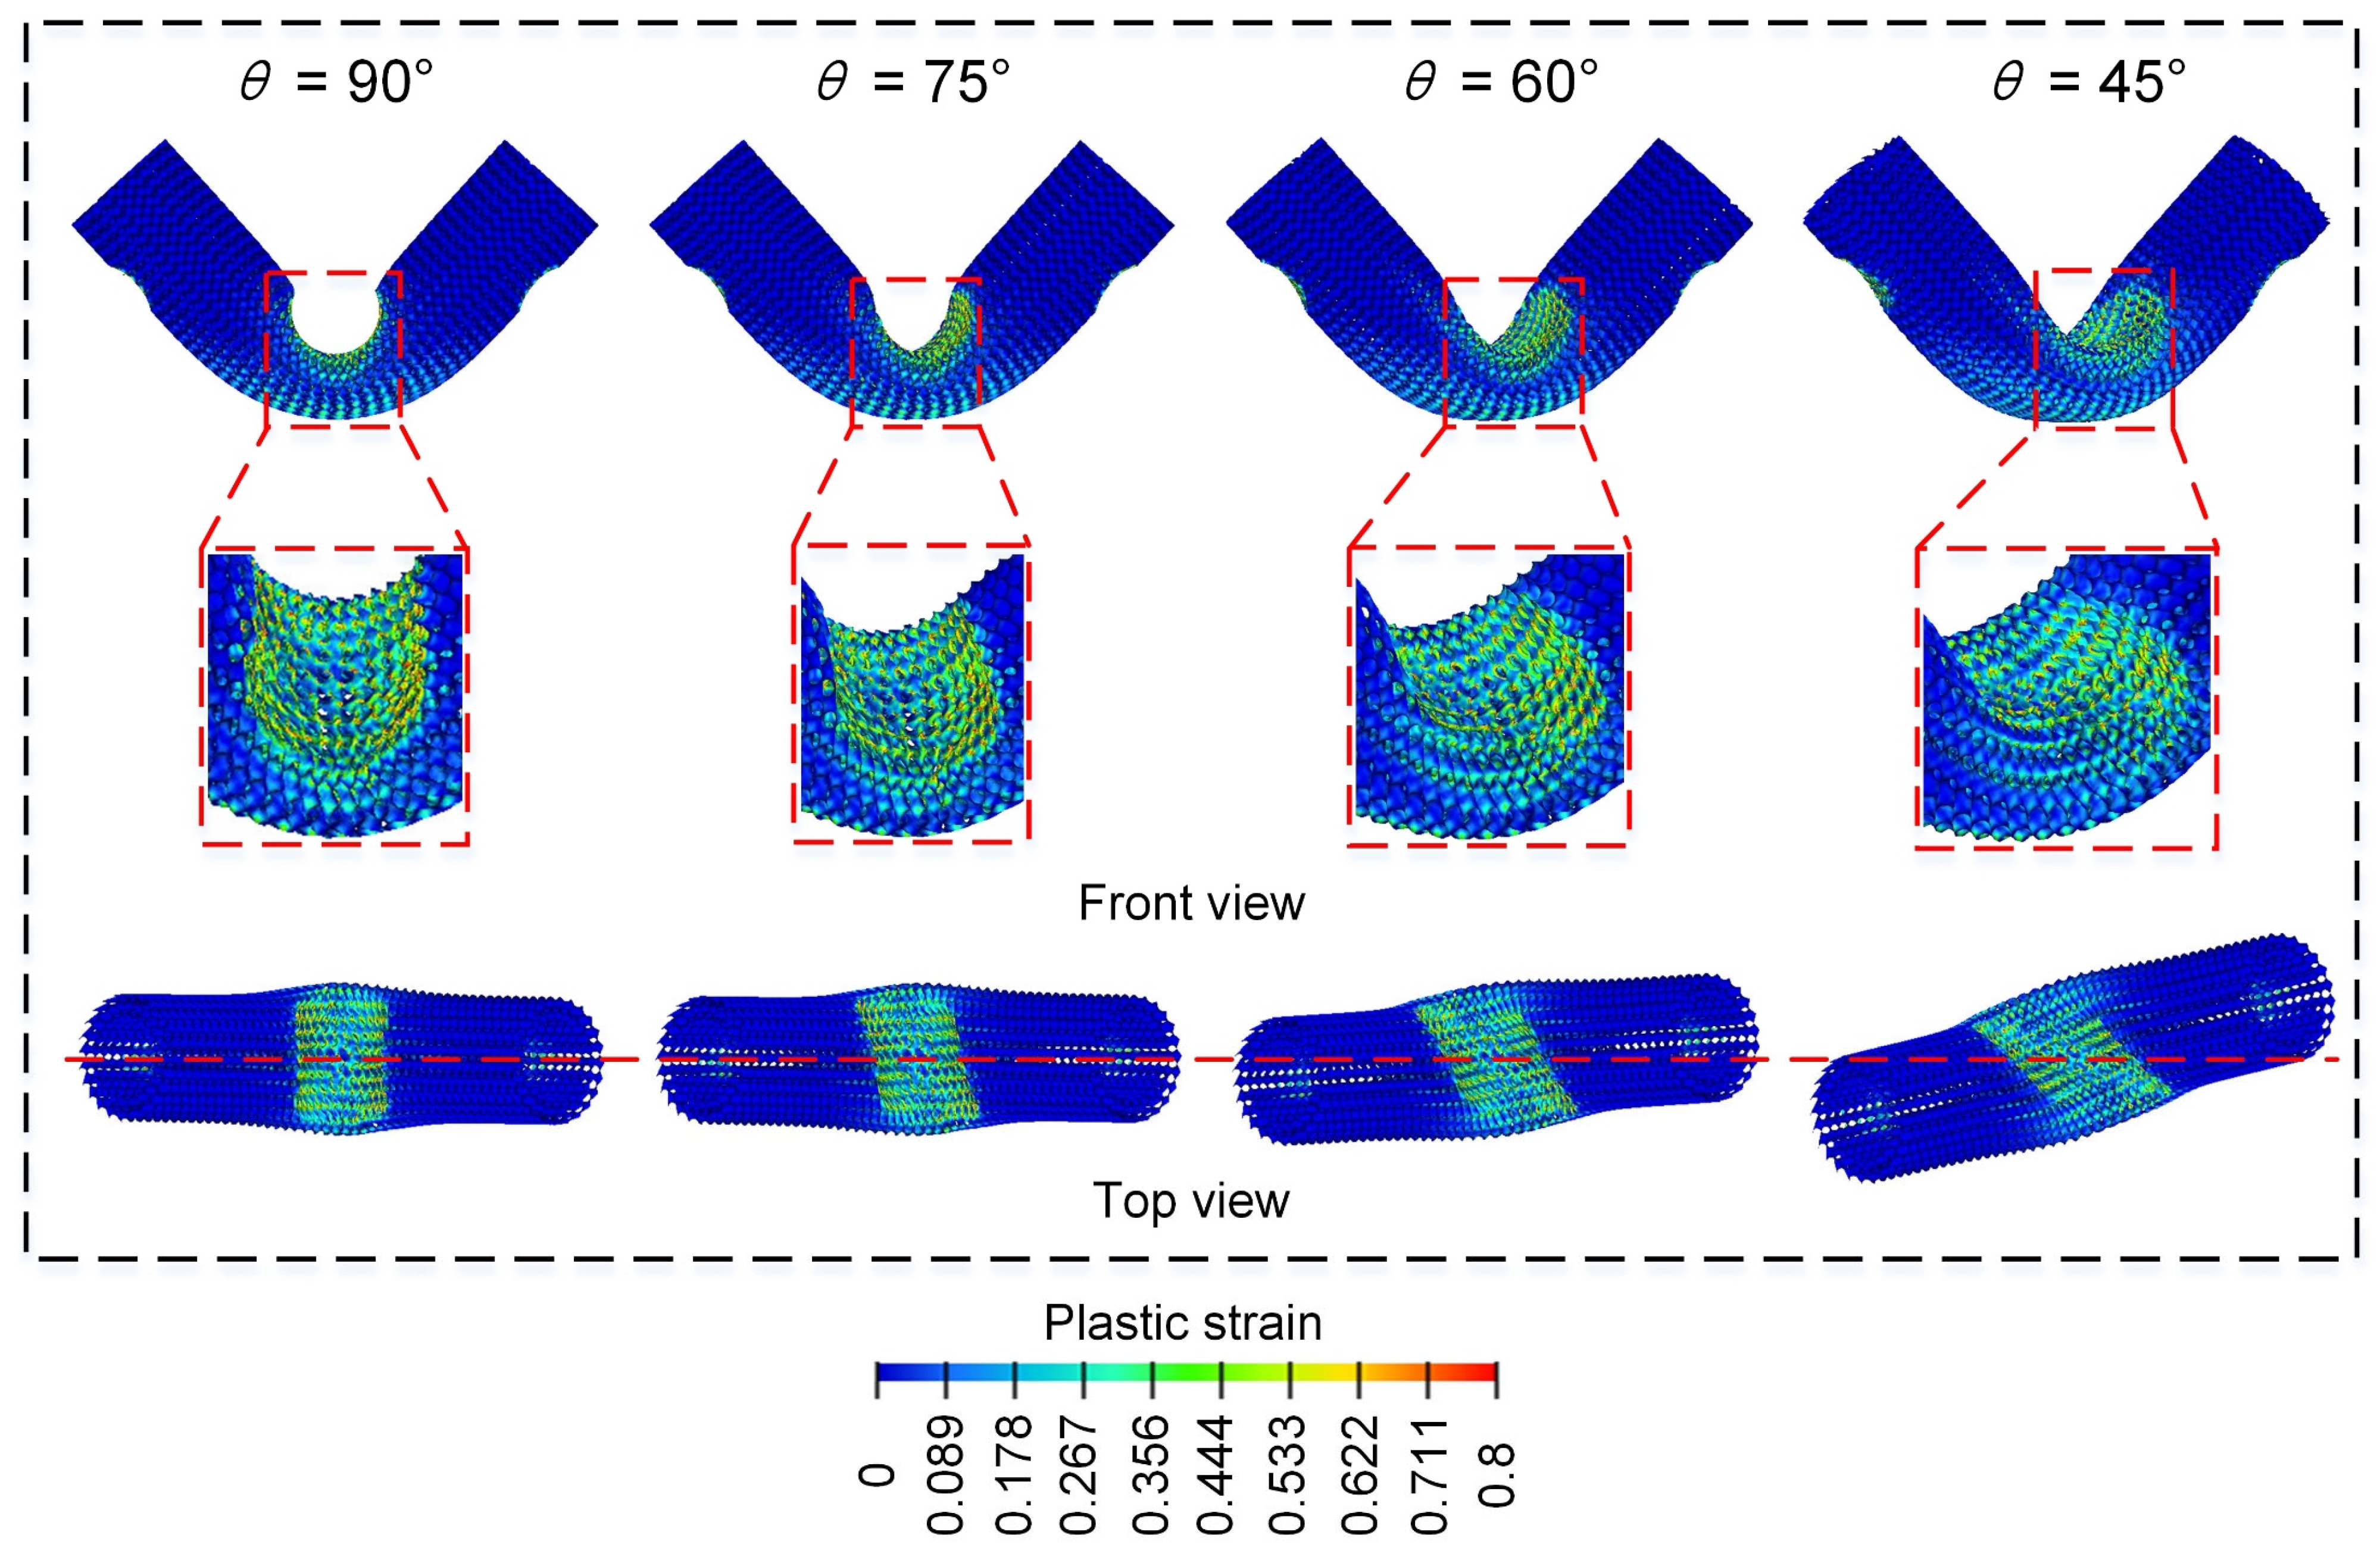
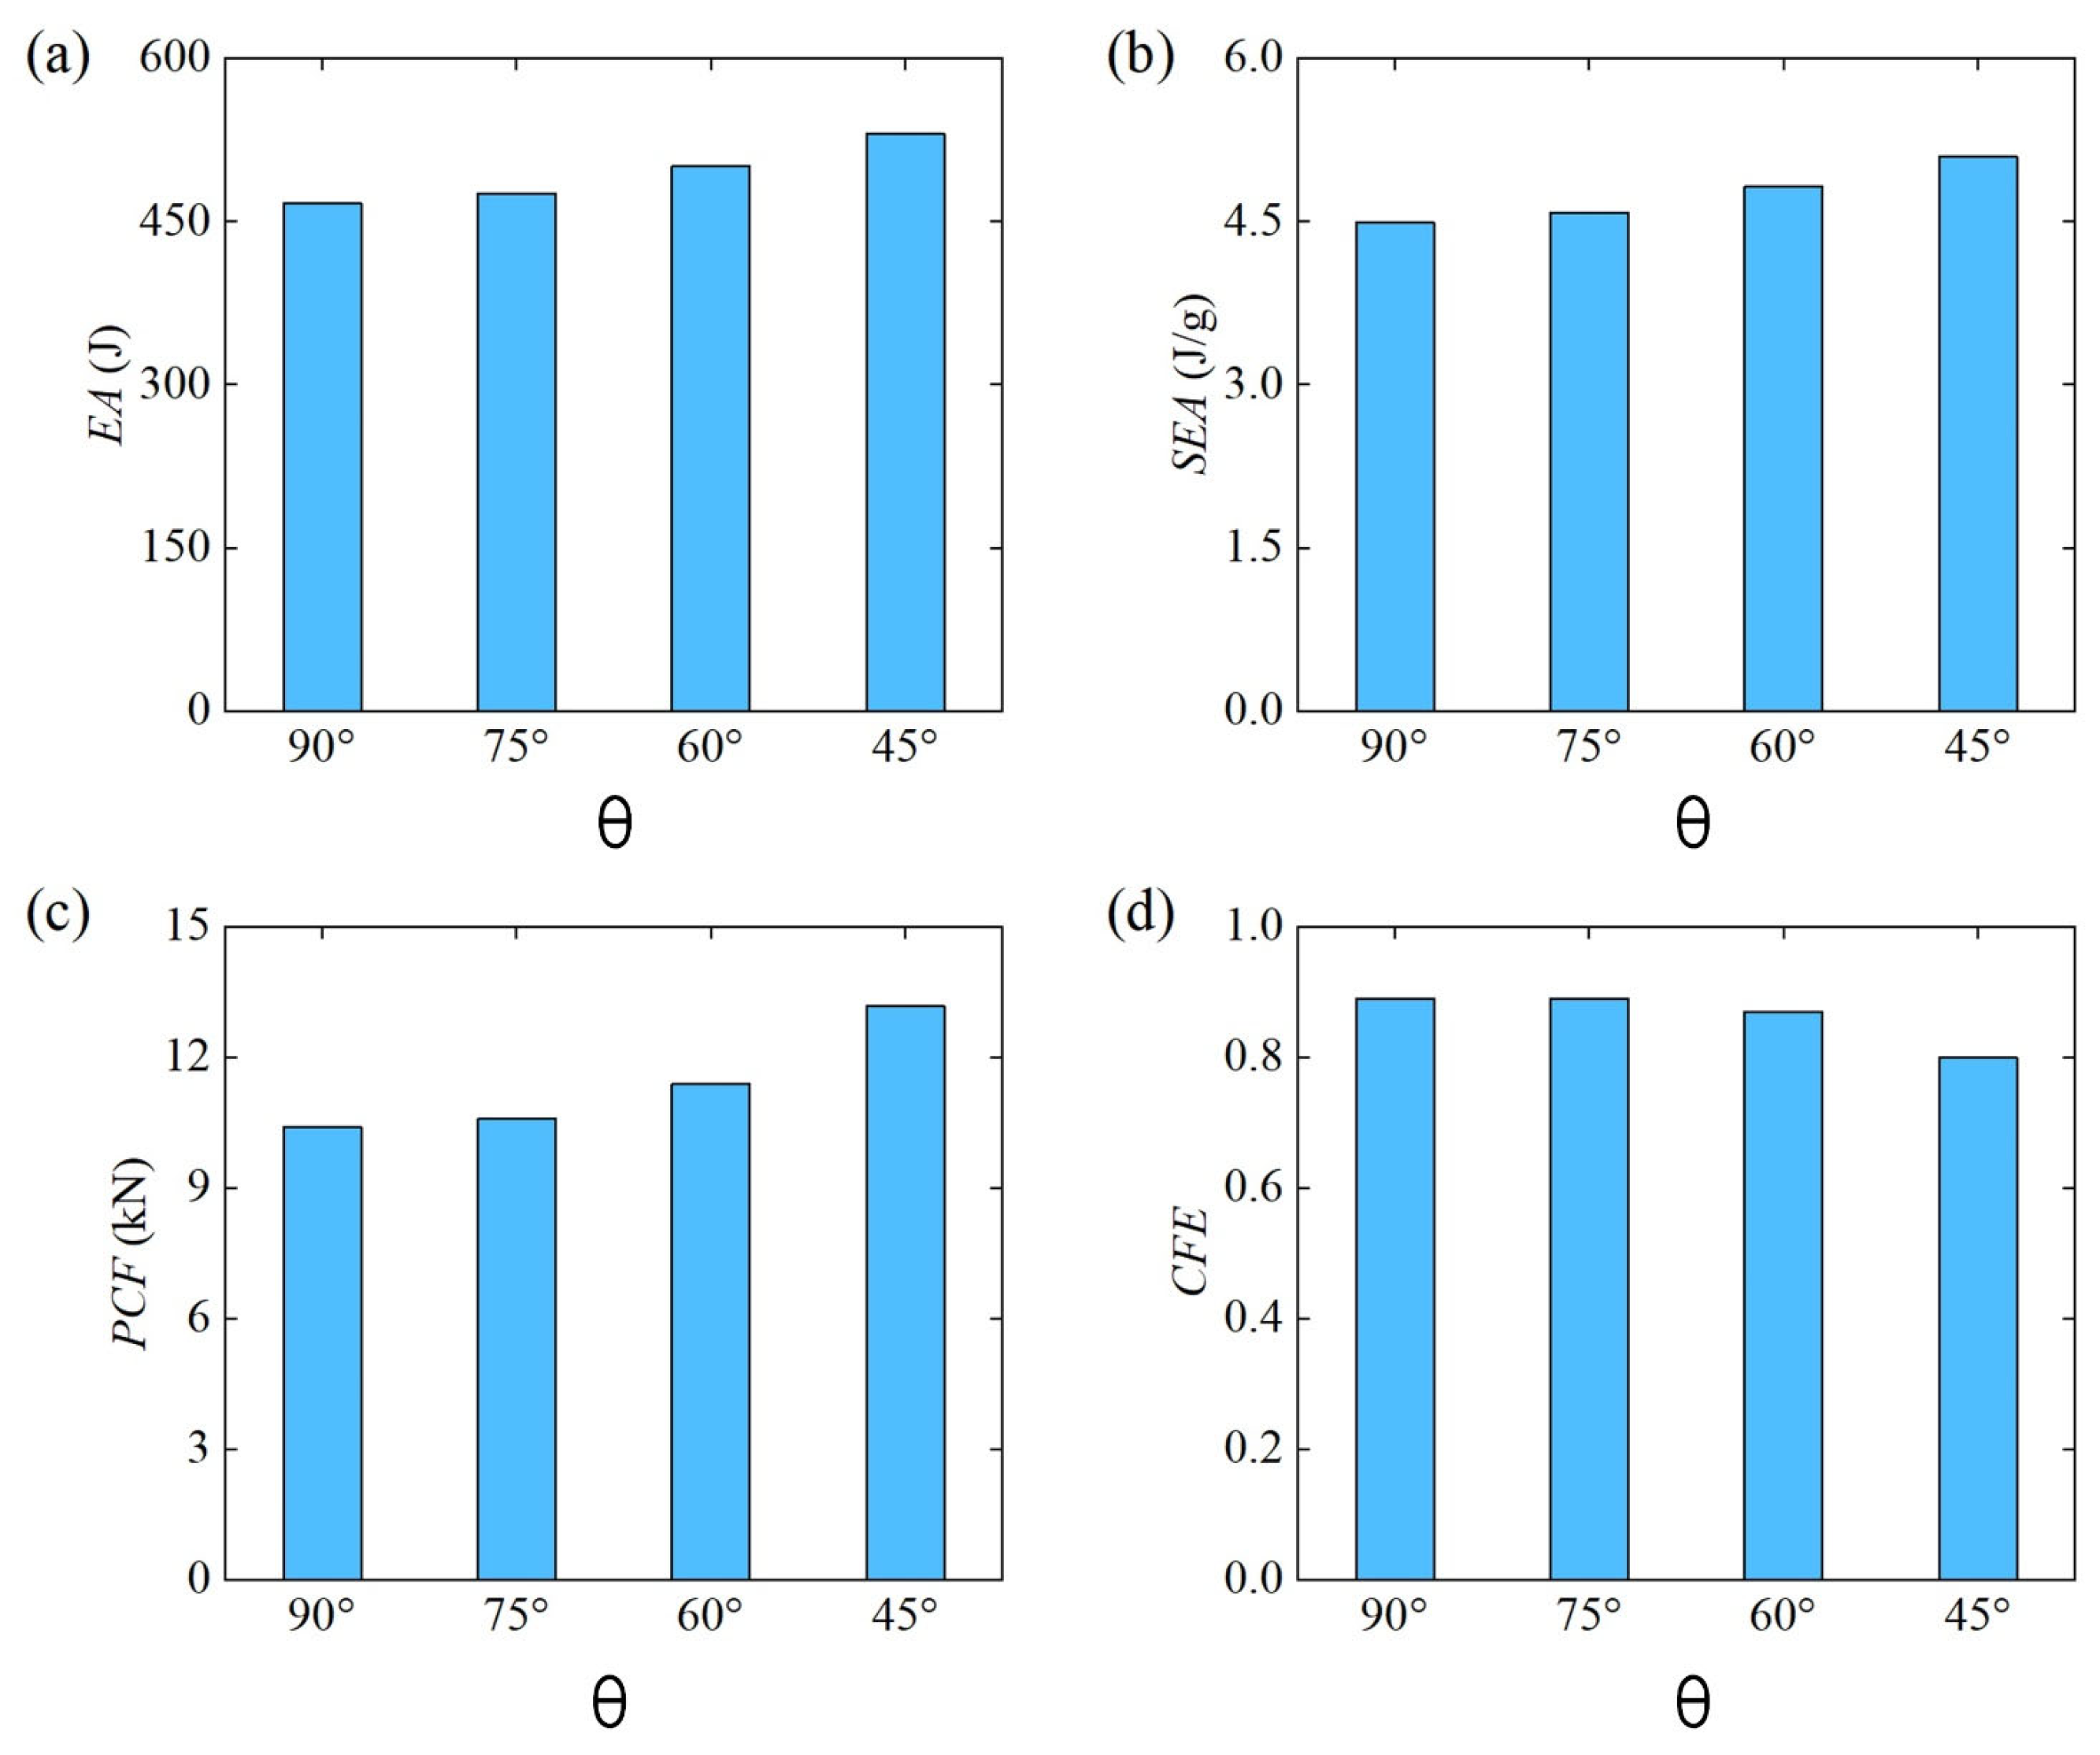
3.2.4. Effect of Loading Angle ()
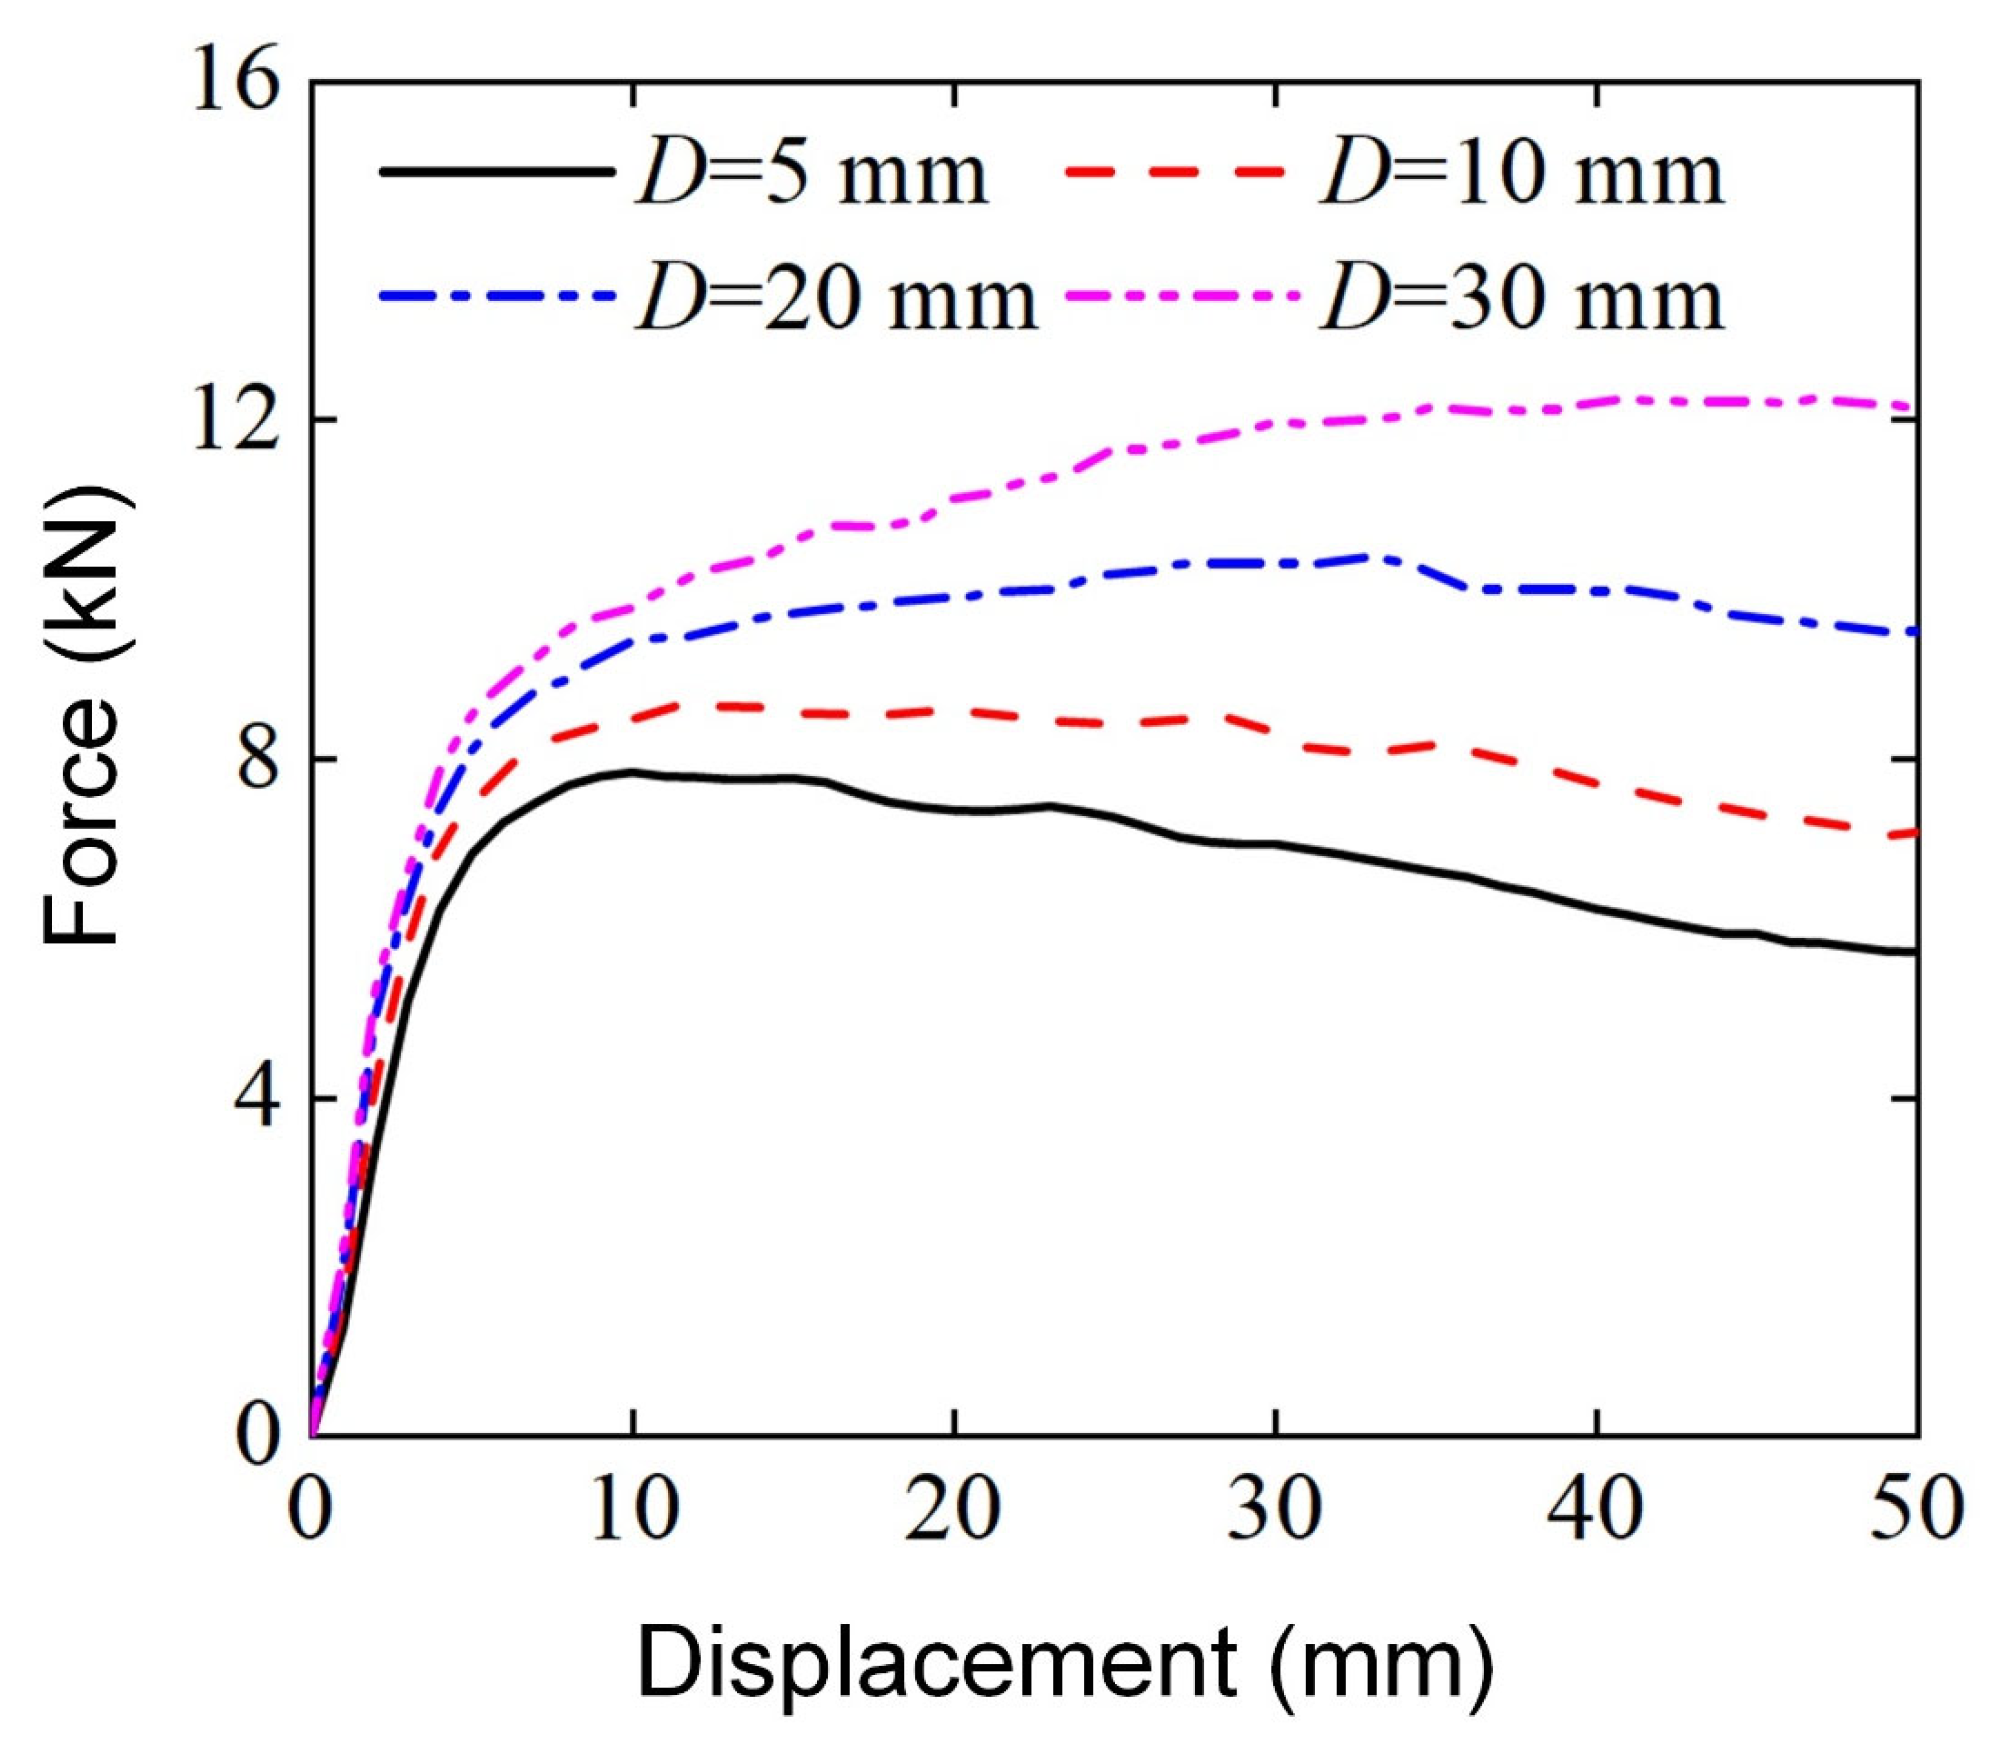
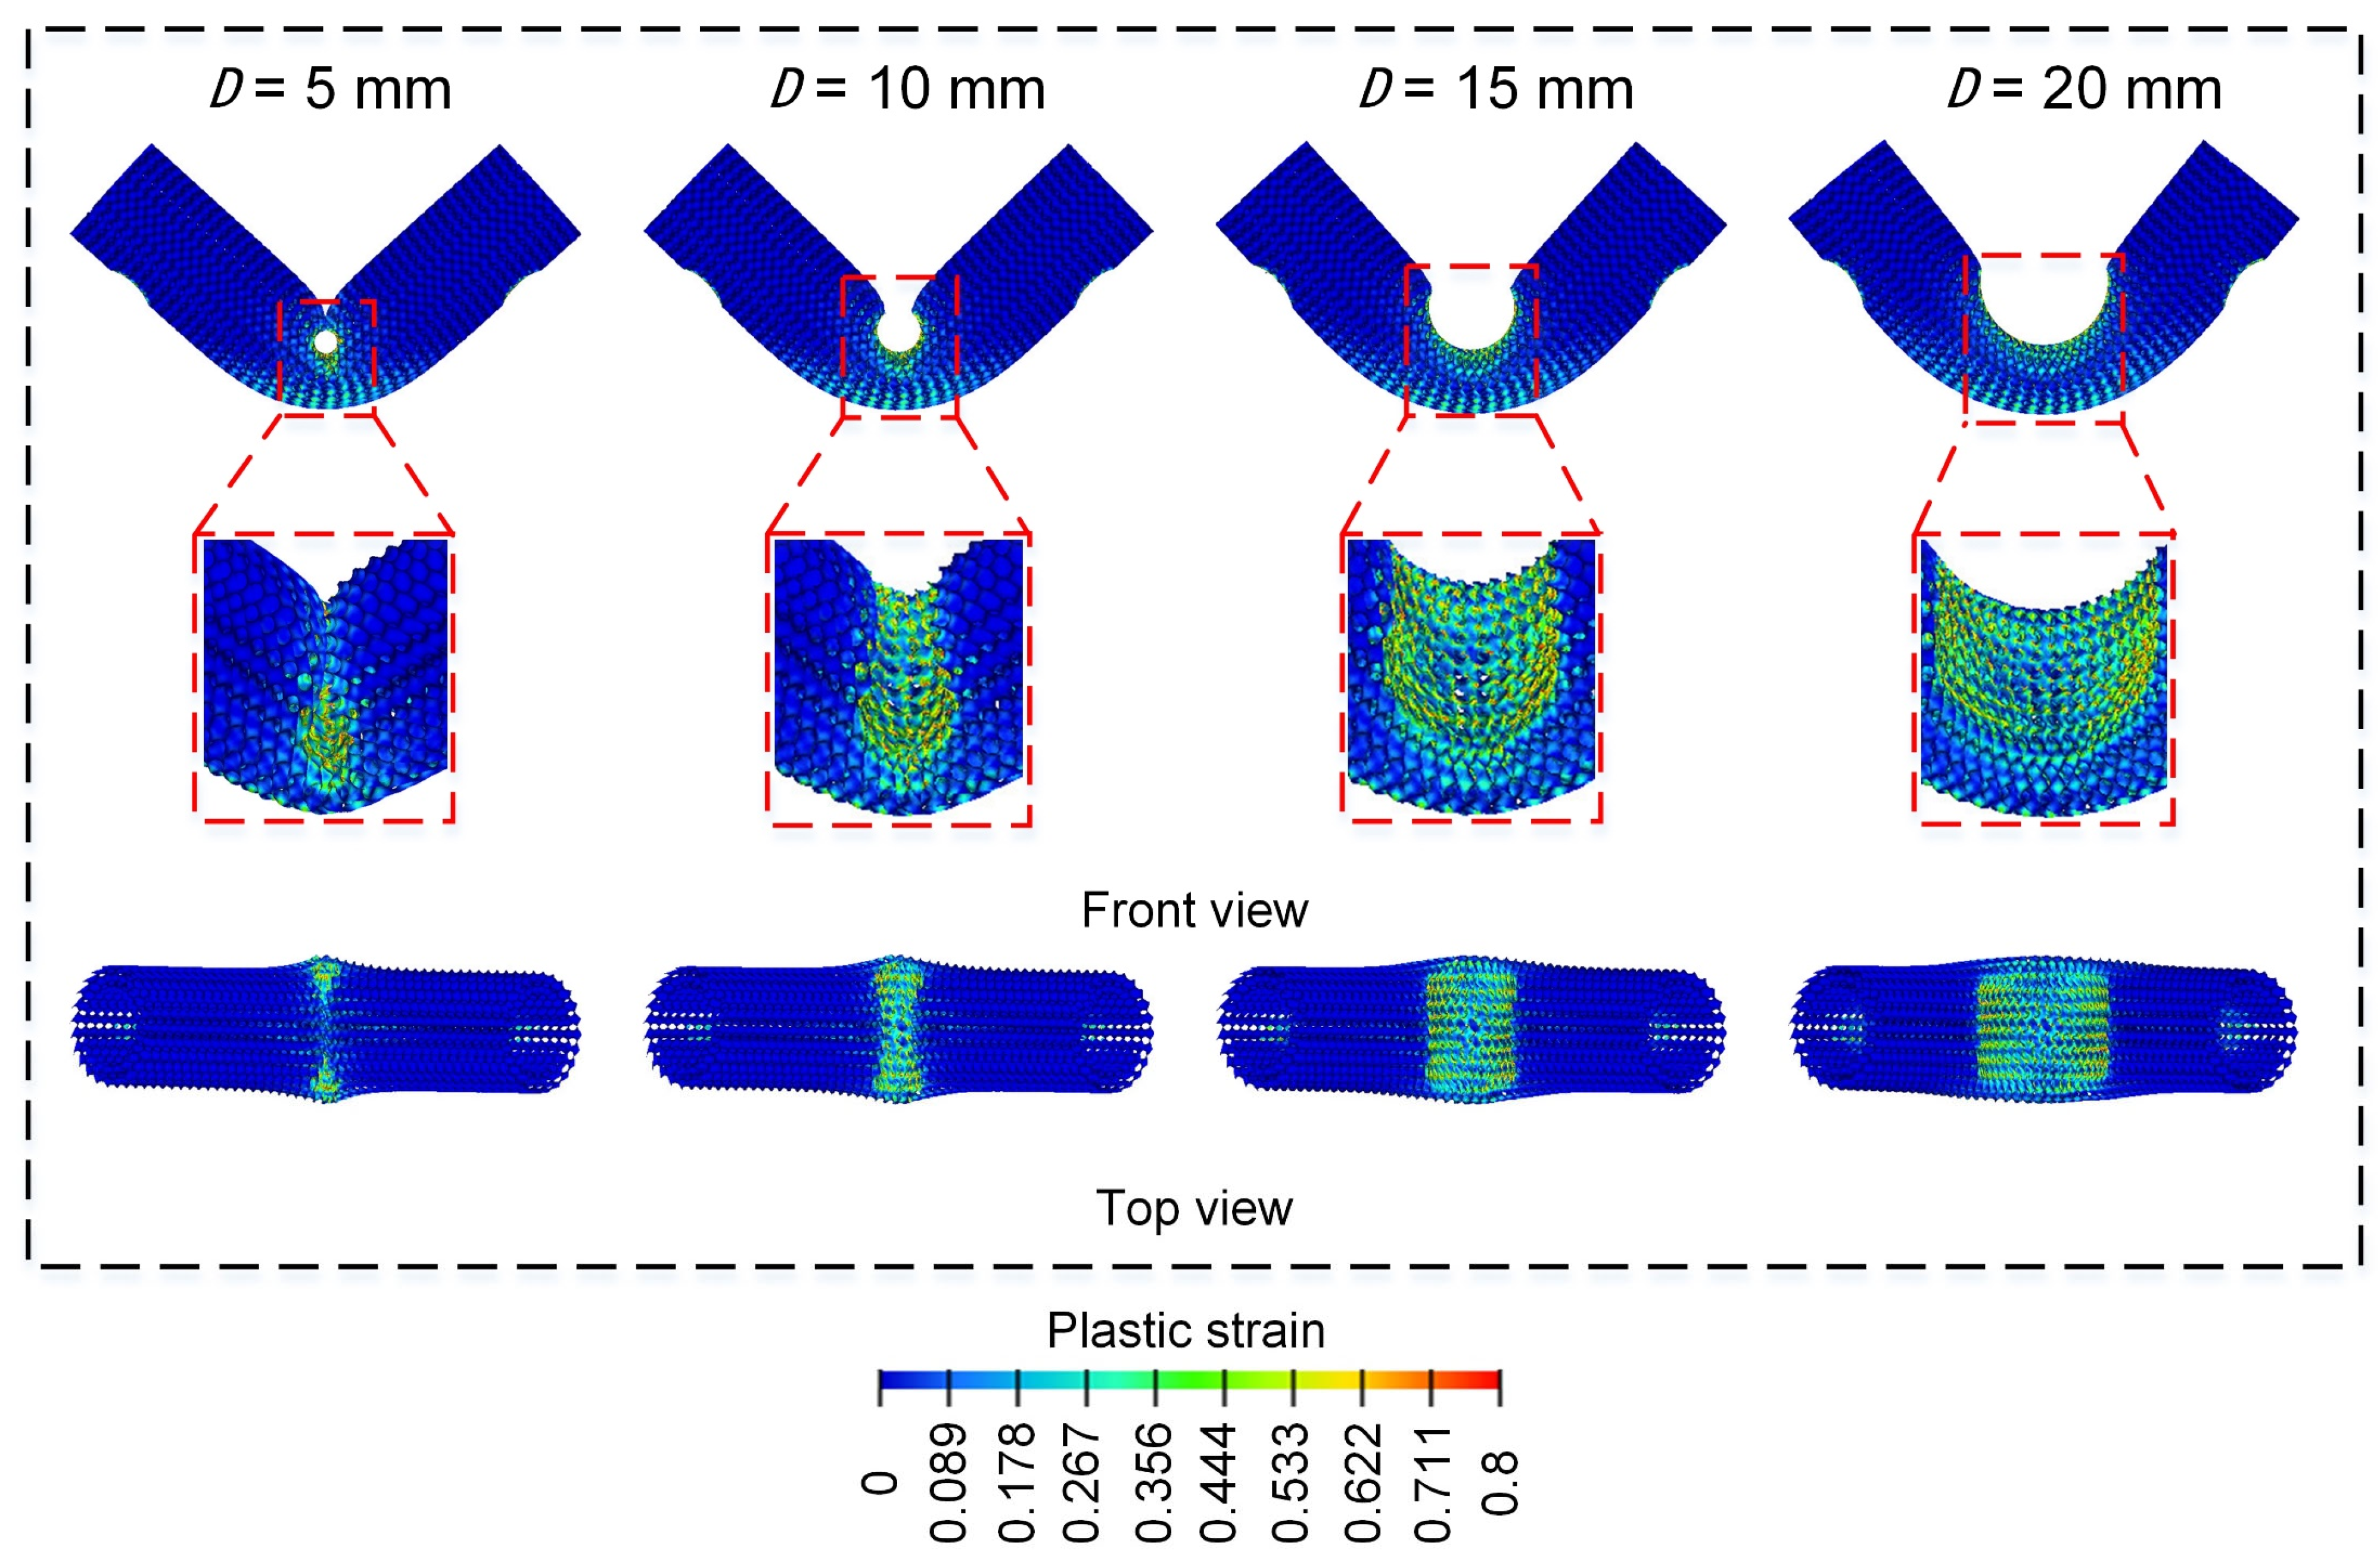
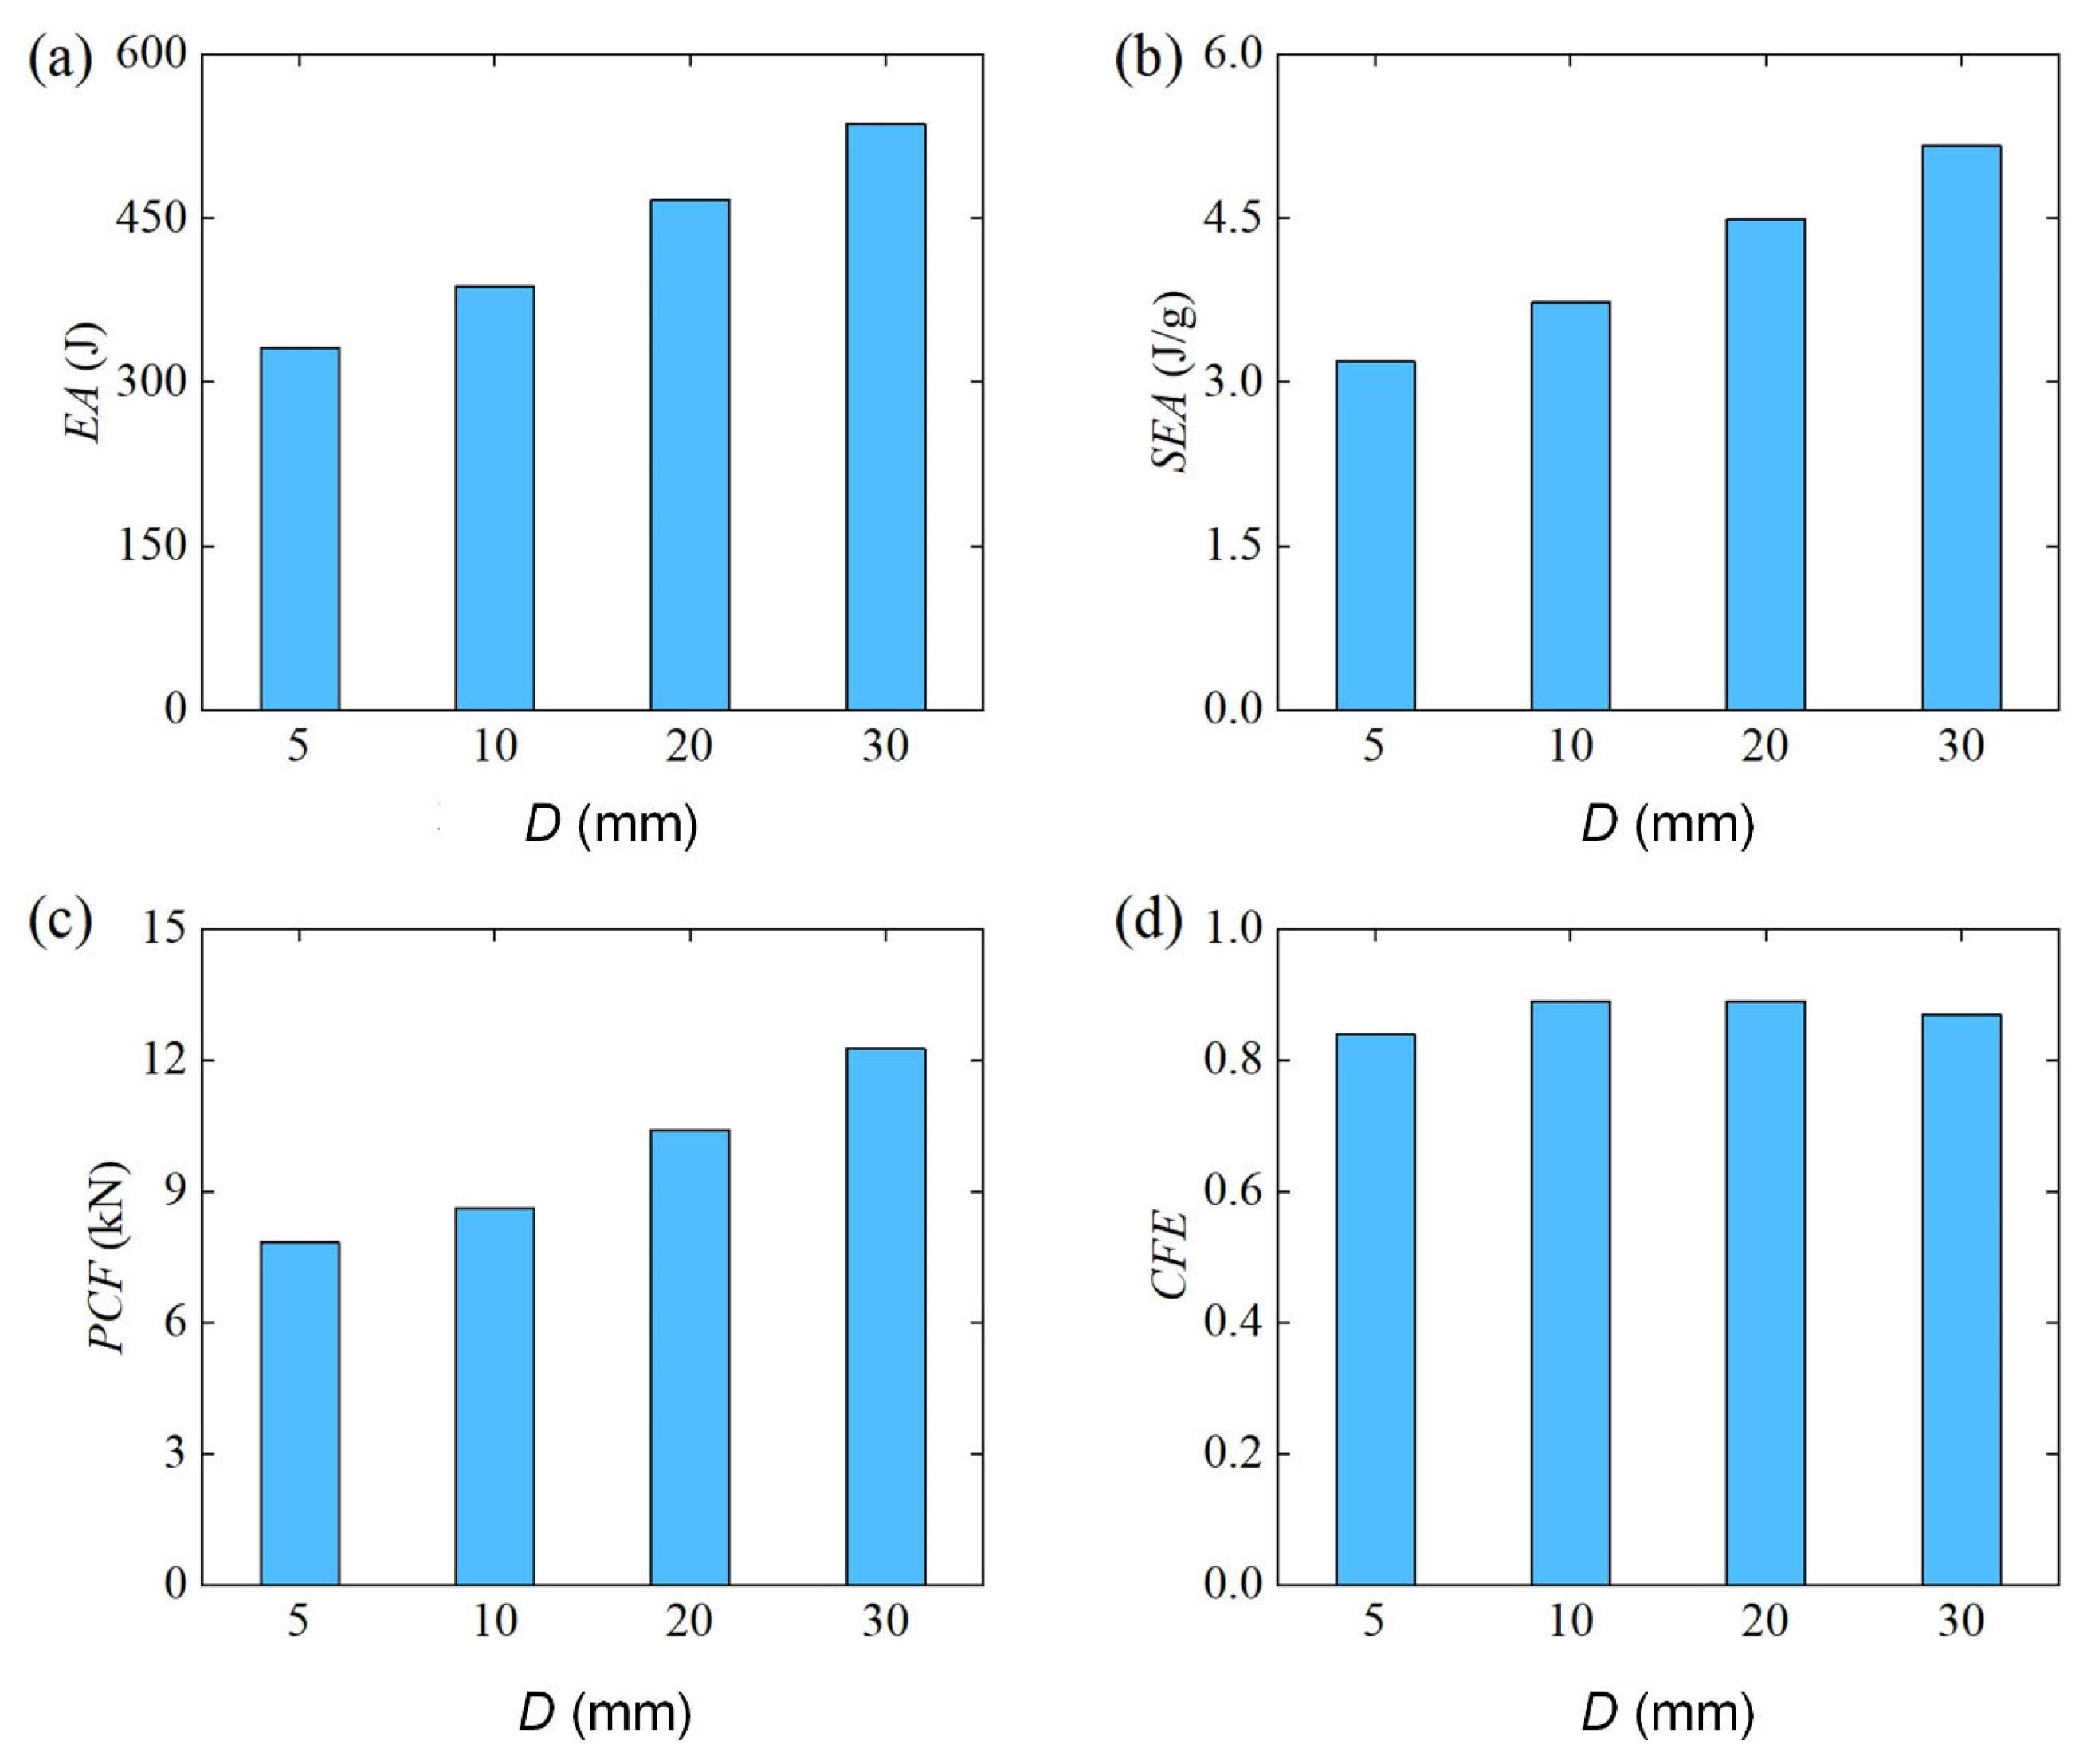
3.2.5. Effect of Punch Diameter ()
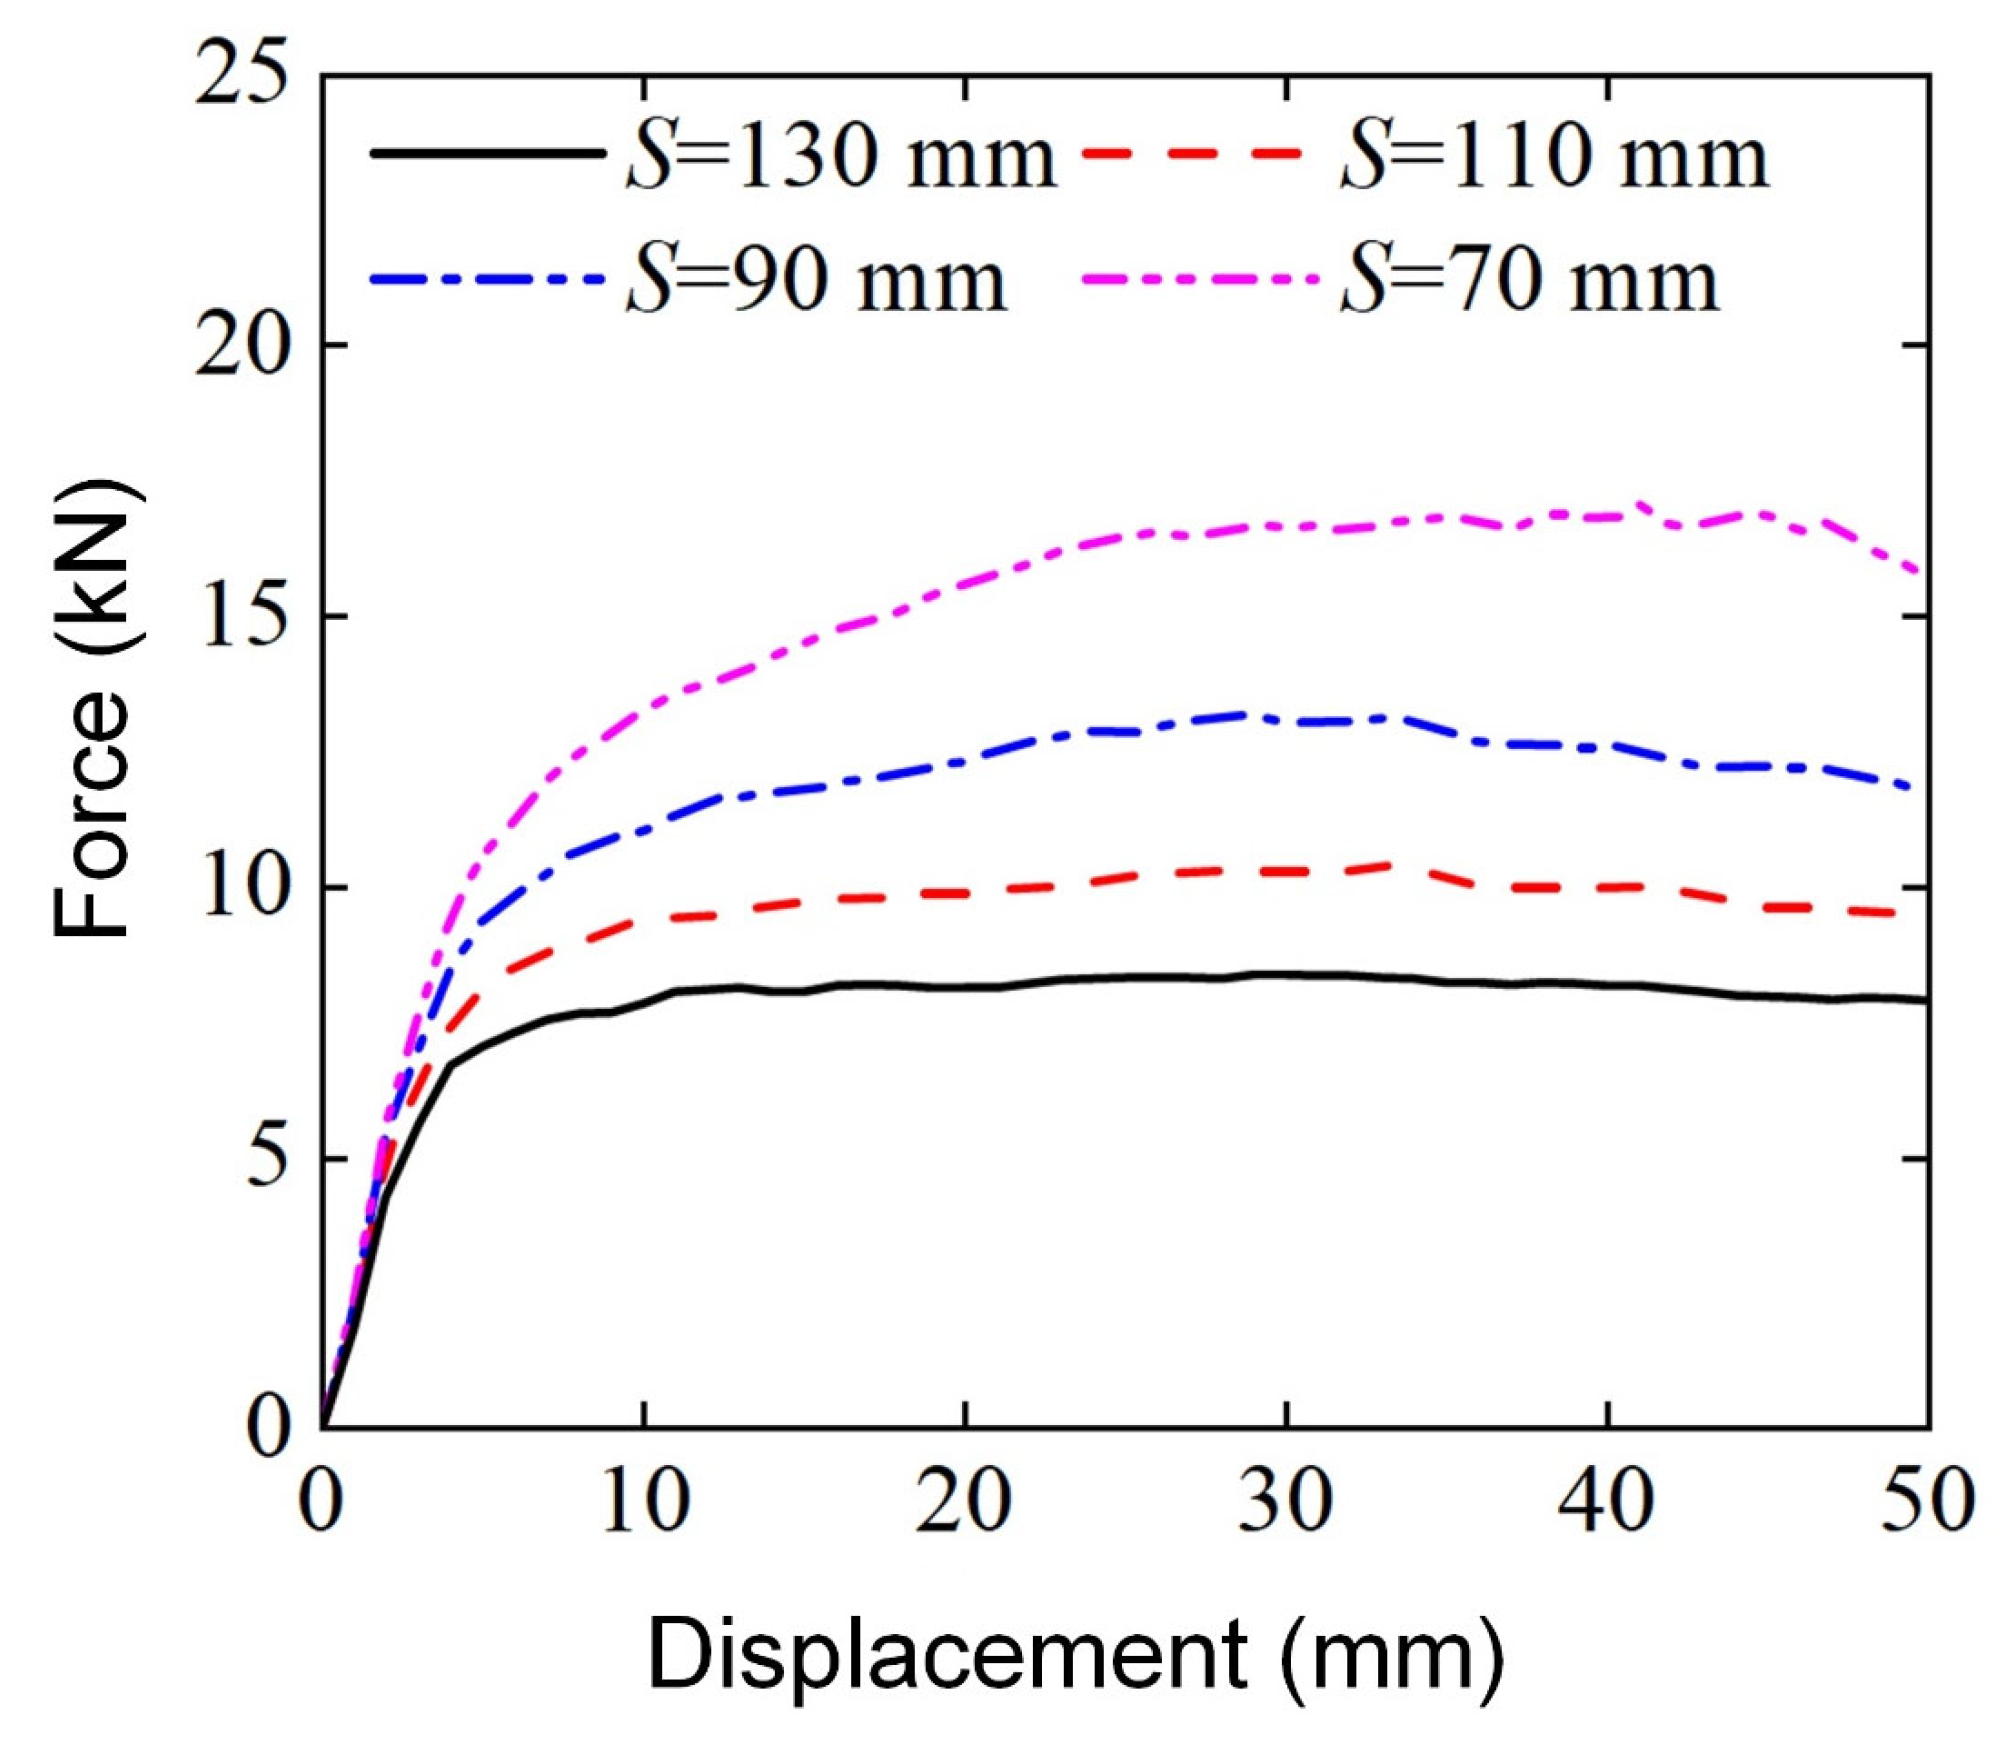
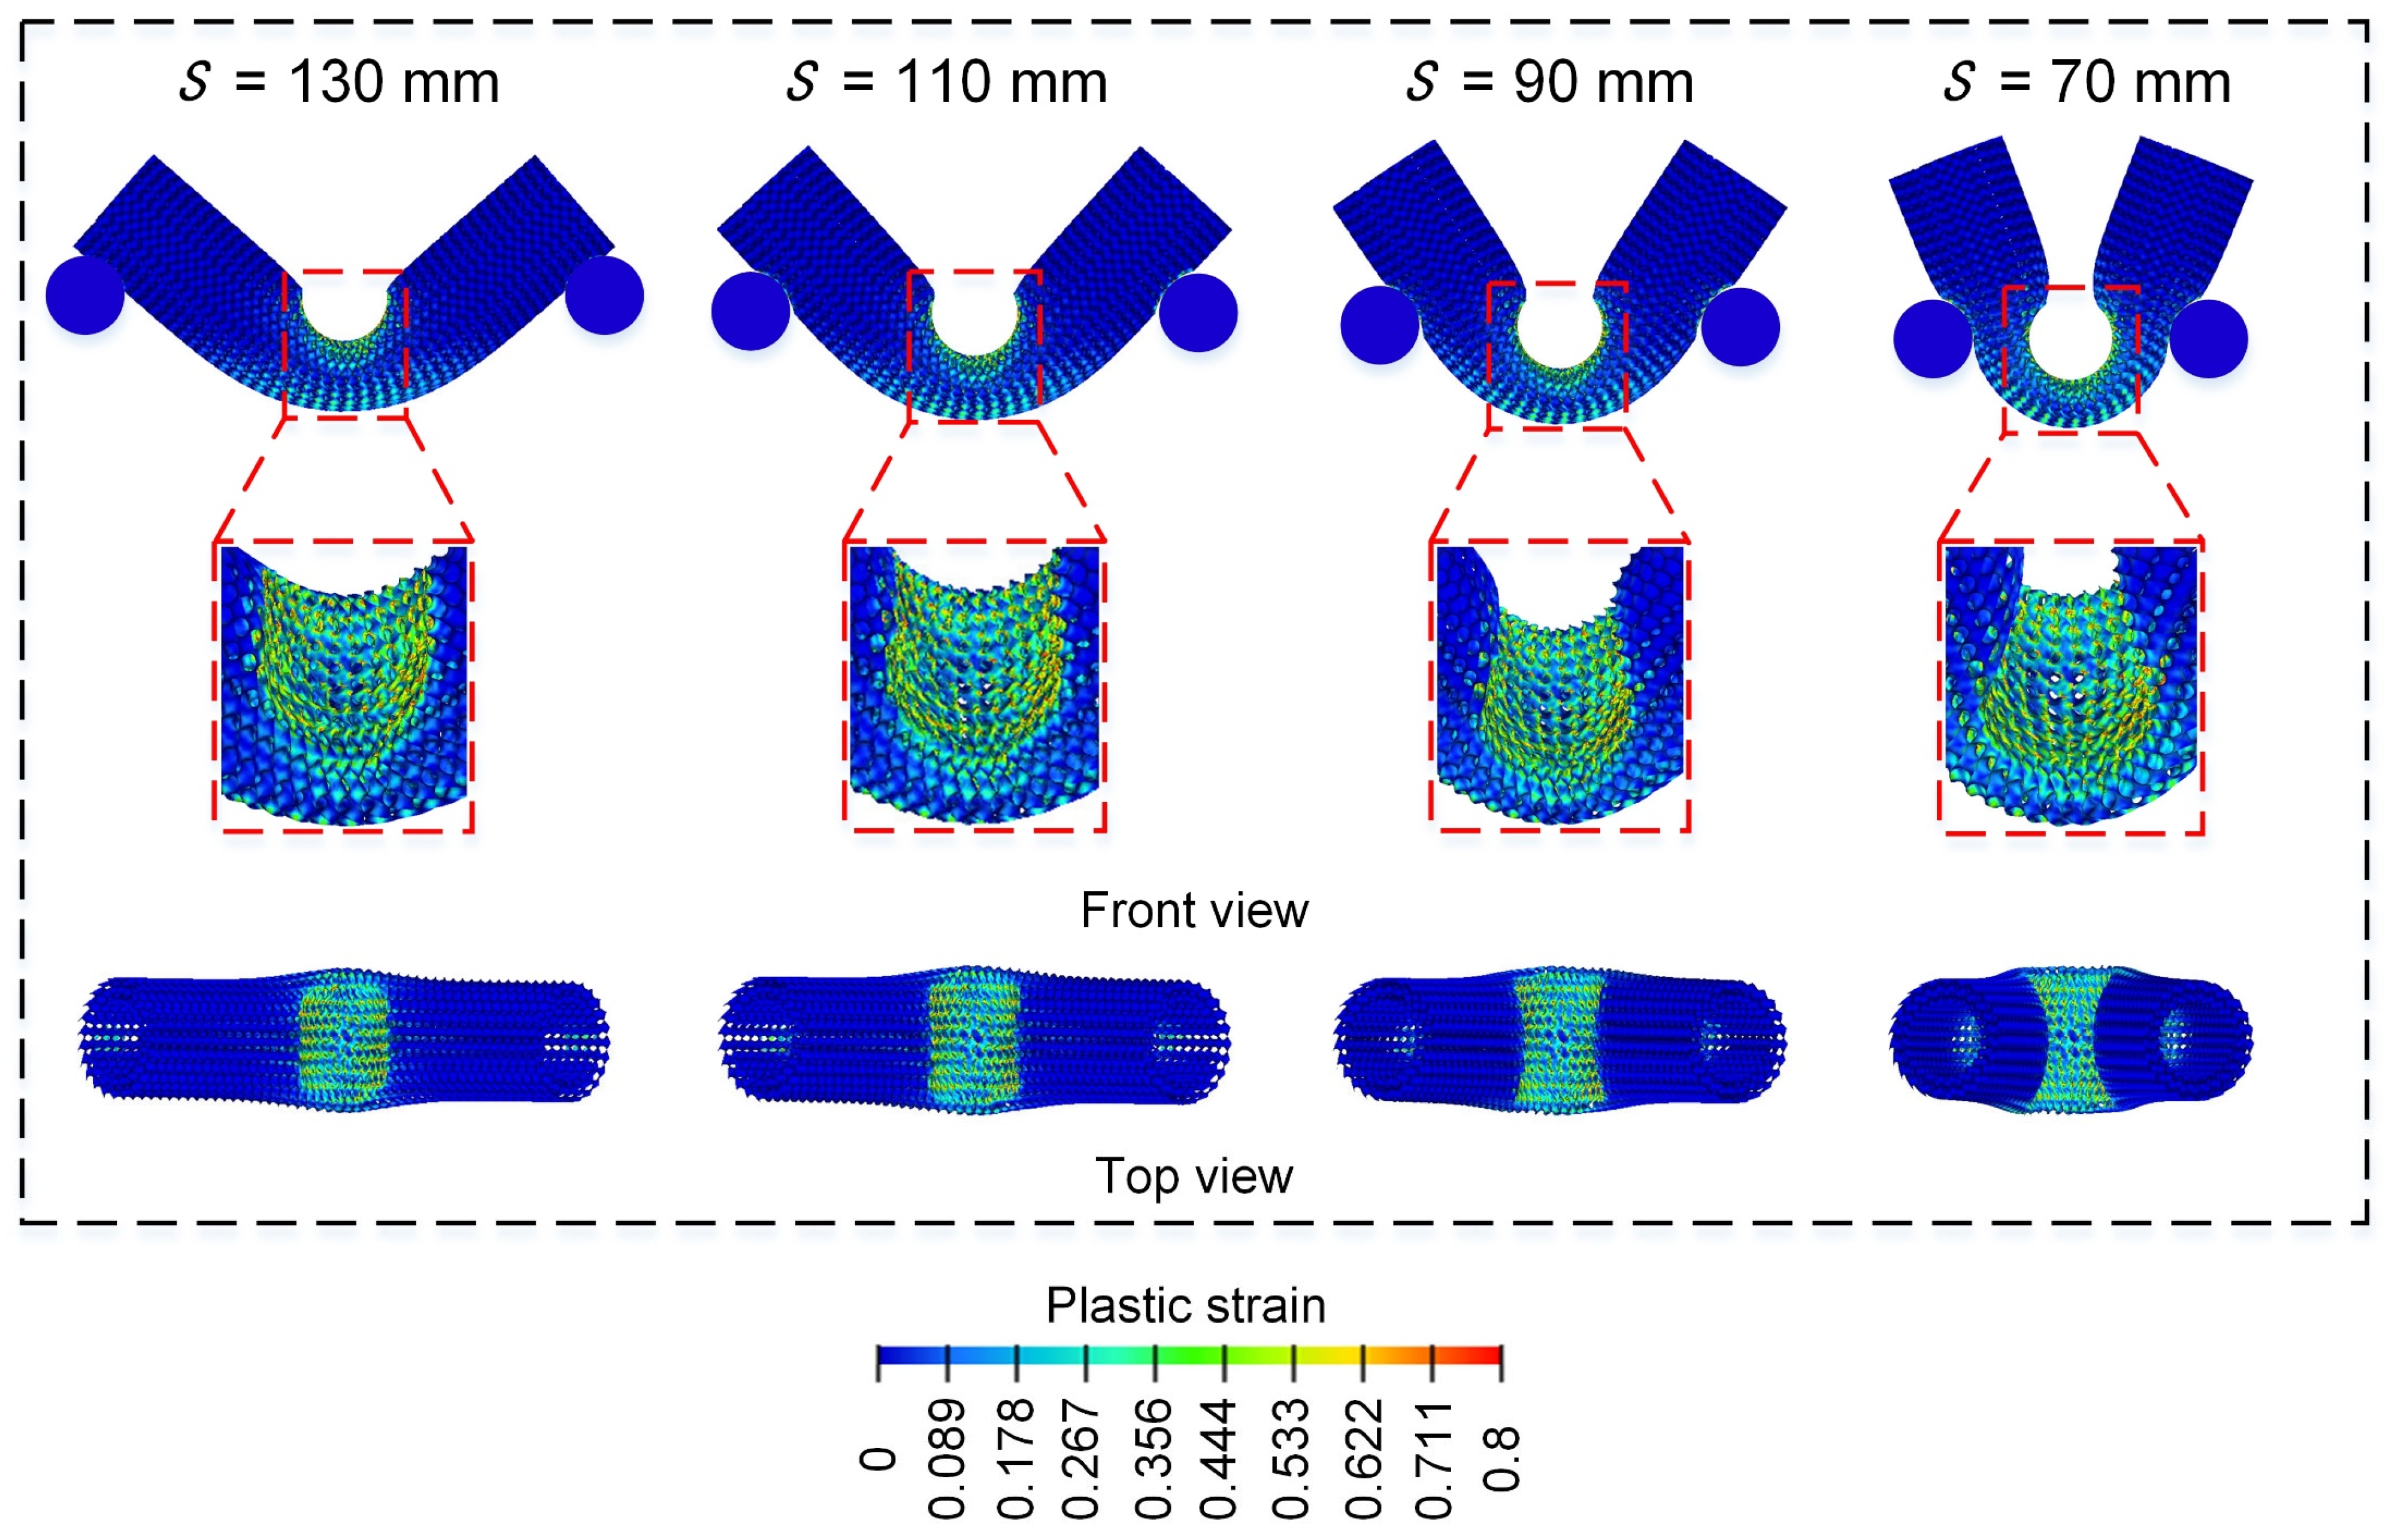
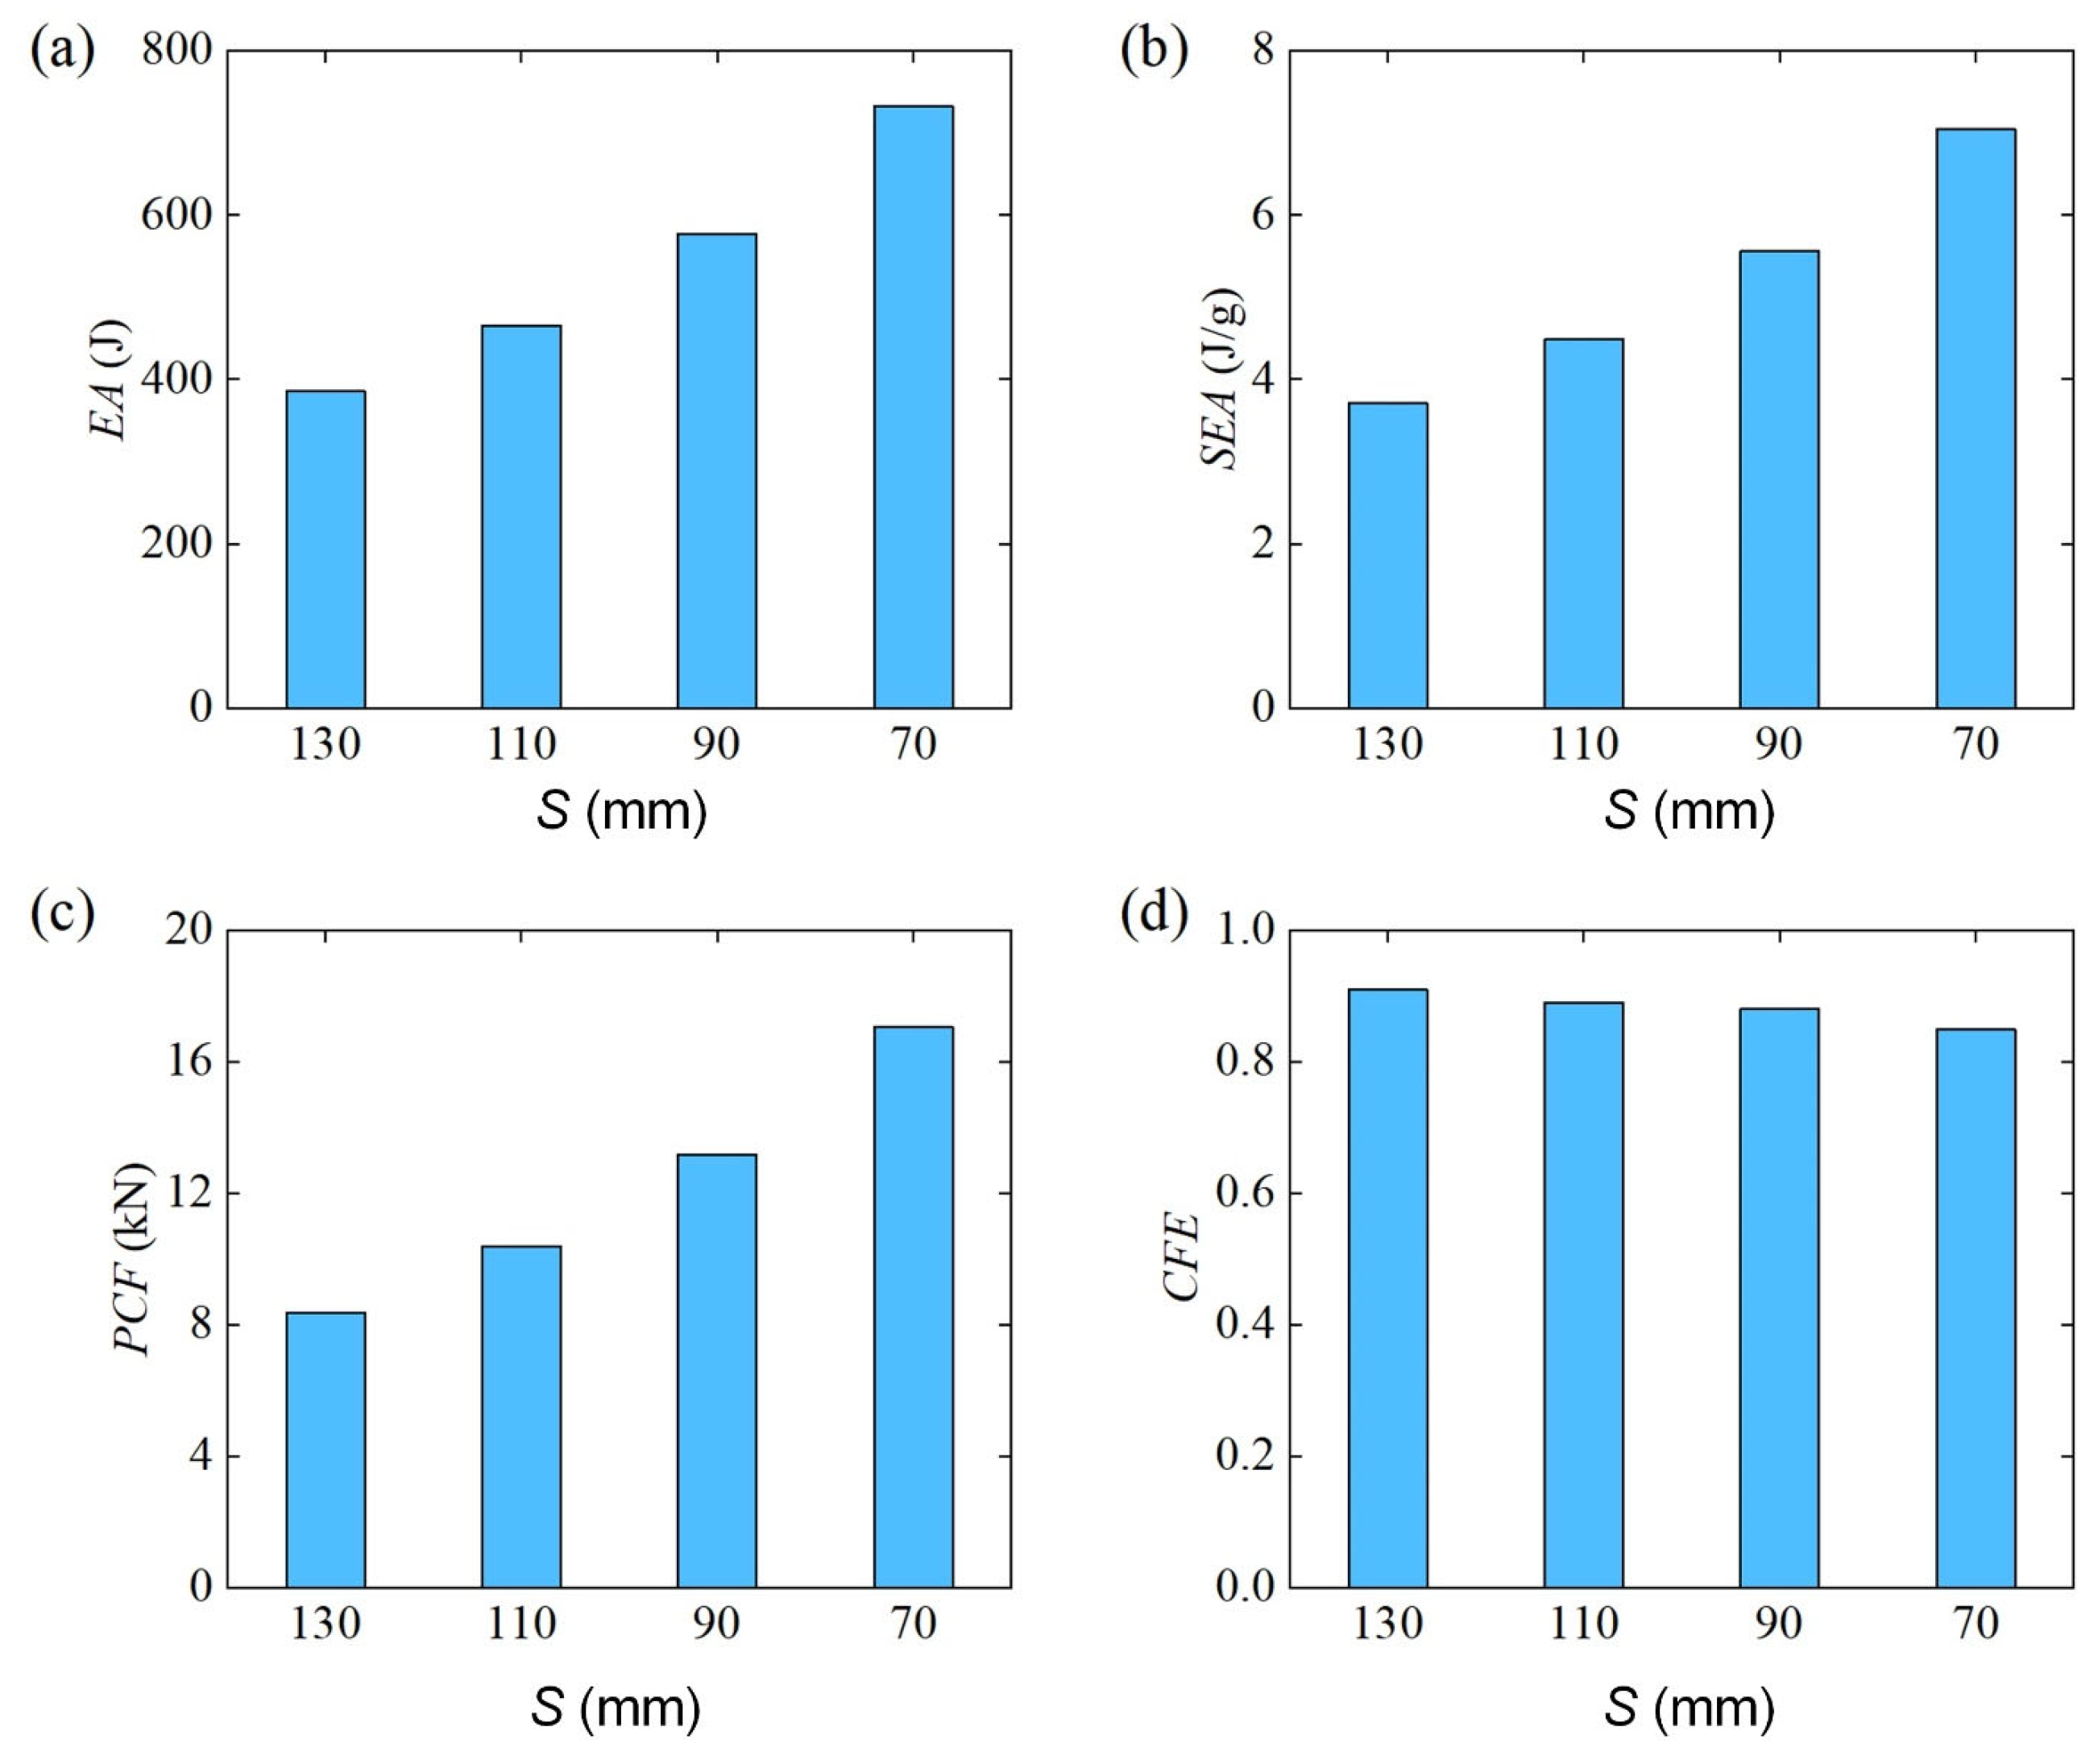
3.2.6. Effect of Span ()
4. Conclusions
- (1)
- All the Diamond LCS structures exhibit a stable “V” deformation mode under a three-point bending load.
- (2)
- In the range of RD = 15–30%, the larger the , the better the lateral flexural performance of the Diamond LCS structure. In the range of , the larger the radial variation coefficient, the better the lateral bearing capacity of the structure.
- (3)
- The smaller the punch loading angle, the better the lateral bending performance of the Diamond LCS structure. However, if the loading angle is too small, the structure is prone to large torsional deformation, and the deformation tends to be unstable.
- (4)
- The bending energy absorption characteristics of Diamond LCS structures are effectively improved with the increase in punch diameter. The smaller the span, the better the bending energy absorption characteristics of the structure.
Author Contributions
Funding
Institutional Review Board Statement
Informed Consent Statement
Data Availability Statement
Acknowledgments
Conflicts of Interest
References
- Mou, H.; Xie, J.; Feng, Z. Research status and future development of crashworthiness of civil aircraft fuselage structures: An overview. Prog. Aerosp. Sci. 2020, 119, 100644. [Google Scholar] [CrossRef]
- Liang, W.; Liu, T.; Li, C.; Wang, Q. Three-Dimensional Vibration Model of Cylindrical Shells via Carrera Unified Formulation. Materials 2023, 16, 3345. [Google Scholar] [CrossRef] [PubMed]
- Wu, Y.; Fang, J.; Wu, C.; Li, C.; Sun, G.; Li, Q. Additively manufactured materials and structures: A state-of-the-art review on their mechanical characteristics and energy absorption. Int. J. Mech. Sci. 2023, 246, 108102. [Google Scholar] [CrossRef]
- Kumar, R.; Mishra, B.; Jain, S. Static and dynamic analysis of smart cylindrical shell. Finite Elem. Anal. Des. 2008, 45, 13–24. [Google Scholar] [CrossRef]
- Morozov, E.; Lopatin, A.; Nesterov, V. Finite-element modelling and buckling analysis of anisogrid composite lattice cylindrical shells. Compos Struct. 2011, 93, 308–323. [Google Scholar] [CrossRef]
- Du, B.; Chen, L.; Wu, W.; Liu, H.; Zhao, Y.; Peng, S.; Guo, Y.; Zhou, H.; Chen, L.; Li, W. A novel hierarchical thermoplastic composite honeycomb cylindrical structure: Fabrication and axial compressive properties. Compos. Sci. Technol. 2018, 164, 136–145. [Google Scholar] [CrossRef]
- Zhang, Y.; Xue, Z.; Chen, L.; Fang, D. Deformation and failure mechanisms of lattice cylindrical shells under axial loading. Int. J. Mech. Sci. 2009, 51, 213–221. [Google Scholar] [CrossRef]
- Chen, L.; Zhang, J.; Du, B.; Zhou, H.; Liu, H.; Guo, Y.; Li, W.; Fang, D. Dynamic crushing behavior and energy absorption of graded lattice cylindrical structure under axial impact load. Thin Wall Struct. 2018, 127, 333–343. [Google Scholar] [CrossRef]
- Belardi, V.G.; Fanelli, P.; Vivio, F. Structural analysis and optimization of anisogrid composite lattice cylindrical shells. Compos. Part. B Eng. 2018, 139, 203–215. [Google Scholar] [CrossRef]
- Wang, Z.-W.; Tang, J.; Li, S.-C.; He, X.-H.; Zhou, C.-Y. Research on Elastic and Elastic-Plastic Buckling Load of Cylindrical Shell with an Inclined through Crack under Axial Compressive Load. Materials 2023, 16, 6123. [Google Scholar] [CrossRef] [PubMed]
- An, X.; Yuan, X.; Sun, G.; Hou, X.; Fan, H. Design of lattice cylindrical shell meta-structures for broadband vibration reduction and high load-bearing capacity. Thin Wall Struct. 2024, 197, 111647. [Google Scholar] [CrossRef]
- Zhou, H.; Zhang, Y.; Fu, F.; Wu, J. Collapse mechanism of single-layer cylindrical latticed shell under severe earthquake. Materials 2020, 13, 2519. [Google Scholar] [CrossRef]
- Al-Ketan, O.; Abu Al-Rub, R.K. Multifunctional Mechanical Metamaterials Based on Triply Periodic Minimal Surface Lattices. Adv. Eng. Mater. 2019, 21, 1900524. [Google Scholar] [CrossRef]
- Wu, Y.; Qi, X.; Sun, L.; Wang, B.; Hu, L.; Wang, P.; Li, W. Sound transmission loss and bending properties of sandwich structures based on triply periodic minimal surfaces. Thin Wall Struct. 2024, 204, 112324. [Google Scholar] [CrossRef]
- Ráž, K.; Chval, Z.; Pereira, M. Lattice Structures—Mechanical Description with Respect to Additive Manufacturing. Materials 2024, 17, 5298. [Google Scholar] [CrossRef] [PubMed]
- Zhang, L.; Feih, S.; Daynes, S.; Chang, S.; Wang, M.Y.; Wei, J.; Lu, W.F. Energy absorption characteristics of metallic triply periodic minimal surface sheet structures under compressive loading. Addit. Manuf. 2018, 23, 505–515. [Google Scholar] [CrossRef]
- Sokollu, B. Mechanical Properties Comparison of Strut-Based and TPMS Lattice Structures Produced by EBM. Master’s Thesis, Middle East Technical University, Ankara, Turkey, 2022. [Google Scholar]
- Wang, Y.; Ren, X.; Chen, Z.; Jiang, Y.; Cao, X.; Fang, S.; Zhao, T.; Li, Y.; Fang, D. Numerical and experimental studies on compressive behavior of Gyroid lattice cylindrical shells. Mater. Des. 2020, 186, 108340. [Google Scholar] [CrossRef]
- Cao, X.; Huang, Z.; He, C.; Wu, W.; Xi, L.; Li, Y.; Fang, D. In-situ synchrotron X-ray tomography investigation of the imperfect smooth-shell cylinder structure. Compos. Struct. 2021, 267, 113926. [Google Scholar] [CrossRef]
- Cao, X.; Yang, H.; Ren, X.; Wu, W.; Xi, L.; Li, Y.; Fang, D. Mechanical performance and defect analysis of the imperfect micro smooth gyroid cylinder shell structure. Compos. Struct. 2021, 273, 114320. [Google Scholar] [CrossRef]
- Szatkiewicz, T.; Laskowska, D.; Bałasz, B.; Mitura, K. The influence of the structure parameters on the mechanical properties of cylindrically mapped gyroid TPMS fabricated by selective laser melting with 316L stainless steel powder. Materials 2022, 15, 4352. [Google Scholar] [CrossRef]
- Zhu, H.; Wang, P.; Wei, D.; Si, J.; Wu, Y. Energy absorption of diamond lattice cylindrical shells under axial compression loading. Thin Wall Struct. 2022, 181, 110131. [Google Scholar] [CrossRef]
- Liang, L.; Zhu, H.; Wei, D.; Wu, Y.; Li, W. Energy absorption and multi-objective optimization of TPMS filled cylinder shell structures. Electron. Res. Arch. 2023, 31, 2834–2854. [Google Scholar] [CrossRef]
- Wu, Y.; Sun, L.; Yang, P.; Fang, J.; Li, W. Energy absorption of additively manufactured functionally bi-graded thickness honeycombs subjected to axial loads. Thin Wall Struct. 2021, 164, 107810. [Google Scholar] [CrossRef]
- Wu, Y.; Fang, J.; Cheng, Z.; He, Y.; Li, W. Crashworthiness of tailored-property multi-cell tubular structures under axial crushing and lateral bending. Thin Wall Struct. 2020, 149, 106640. [Google Scholar] [CrossRef]
- Fang, J.; Sun, G.; Qiu, N.; Kim, N.-H.; Li, Q. On design optimization for structural crashworthiness and its state of the art. Struct. Multidiscip. Optim. 2017, 55, 1091–1119. [Google Scholar] [CrossRef]
- Qiu, N.; Zhang, J.; Li, C.; Shen, Y.; Fang, J. Mechanical properties of three-dimensional functionally graded triply periodic minimum surface structures. Int. J. Mech. Sci. 2023, 246, 108118. [Google Scholar] [CrossRef]
- Huang, Z.; Zhang, X. Three-point bending of thin-walled rectangular section tubes with indentation mode. Thin Wall Struct. 2019, 137, 231–250. [Google Scholar] [CrossRef]
- Huang, Z.; Zhang, X.; Fu, X. On the bending force response of thin-walled beams under transverse loading. Thin Wall Struct. 2020, 154, 106807. [Google Scholar] [CrossRef]


| Parameter | Value |
|---|---|
| Density (g/cm3) | 7.98 |
| Young’s modulus (GPa) | 190 ± 3 |
| Yield stress (MPa) | 633 ± 9 |
| Ultimate stress (MPa) | 1074 ± 38 |
| Poisson’s ratio | 0.3 |
Disclaimer/Publisher’s Note: The statements, opinions and data contained in all publications are solely those of the individual author(s) and contributor(s) and not of MDPI and/or the editor(s). MDPI and/or the editor(s) disclaim responsibility for any injury to people or property resulting from any ideas, methods, instructions or products referred to in the content. |
© 2025 by the authors. Licensee MDPI, Basel, Switzerland. This article is an open access article distributed under the terms and conditions of the Creative Commons Attribution (CC BY) license (https://creativecommons.org/licenses/by/4.0/).
Share and Cite
Li, S.; Liang, L.; Yang, P.; Li, S.; Wu, Y. Bending Performance of Diamond Lattice Cylindrical Shells. Materials 2025, 18, 272. https://doi.org/10.3390/ma18020272
Li S, Liang L, Yang P, Li S, Wu Y. Bending Performance of Diamond Lattice Cylindrical Shells. Materials. 2025; 18(2):272. https://doi.org/10.3390/ma18020272
Chicago/Turabian StyleLi, Sheng, Laiyu Liang, Ping Yang, Shaoan Li, and Yaozhong Wu. 2025. "Bending Performance of Diamond Lattice Cylindrical Shells" Materials 18, no. 2: 272. https://doi.org/10.3390/ma18020272
APA StyleLi, S., Liang, L., Yang, P., Li, S., & Wu, Y. (2025). Bending Performance of Diamond Lattice Cylindrical Shells. Materials, 18(2), 272. https://doi.org/10.3390/ma18020272