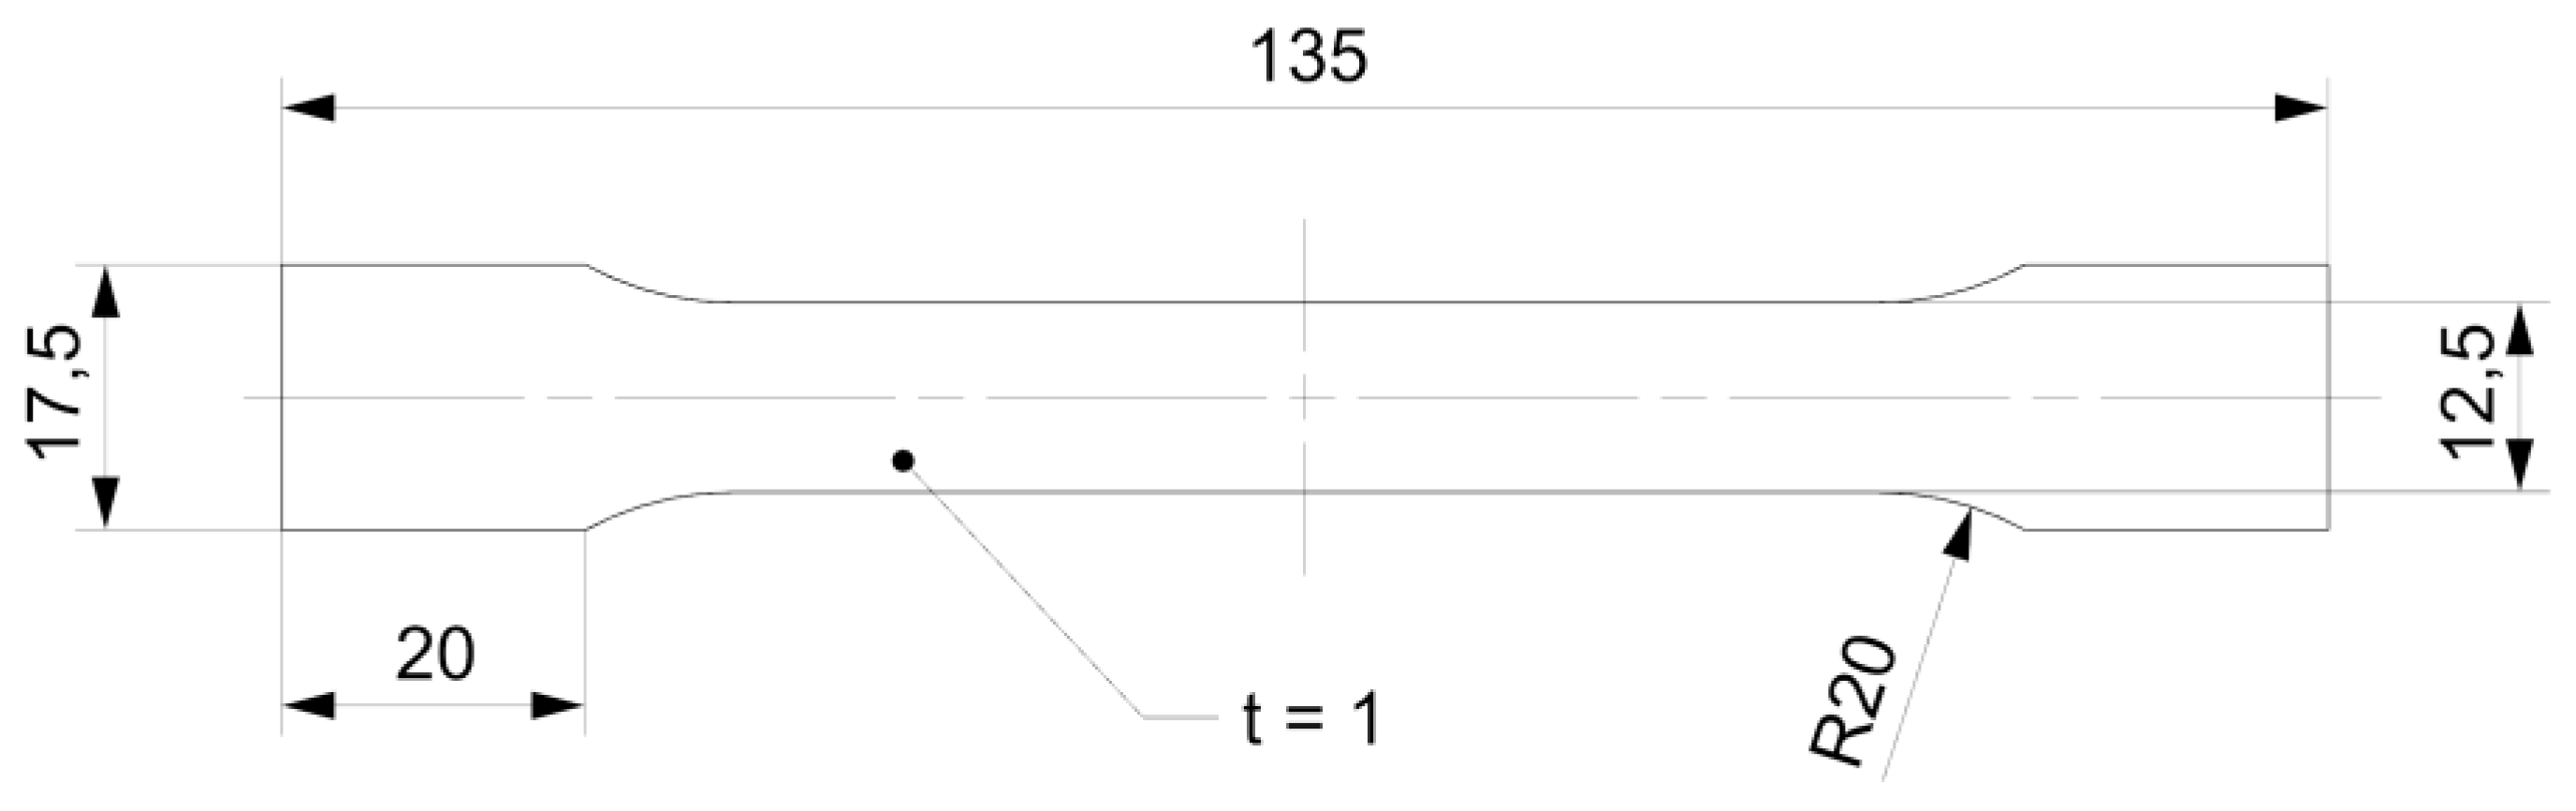
Figure 1.
Dimensions of type A galvanized steel sheet specimens according to EN ISO 6892-1.
Figure 1.
Dimensions of type A galvanized steel sheet specimens according to EN ISO 6892-1.
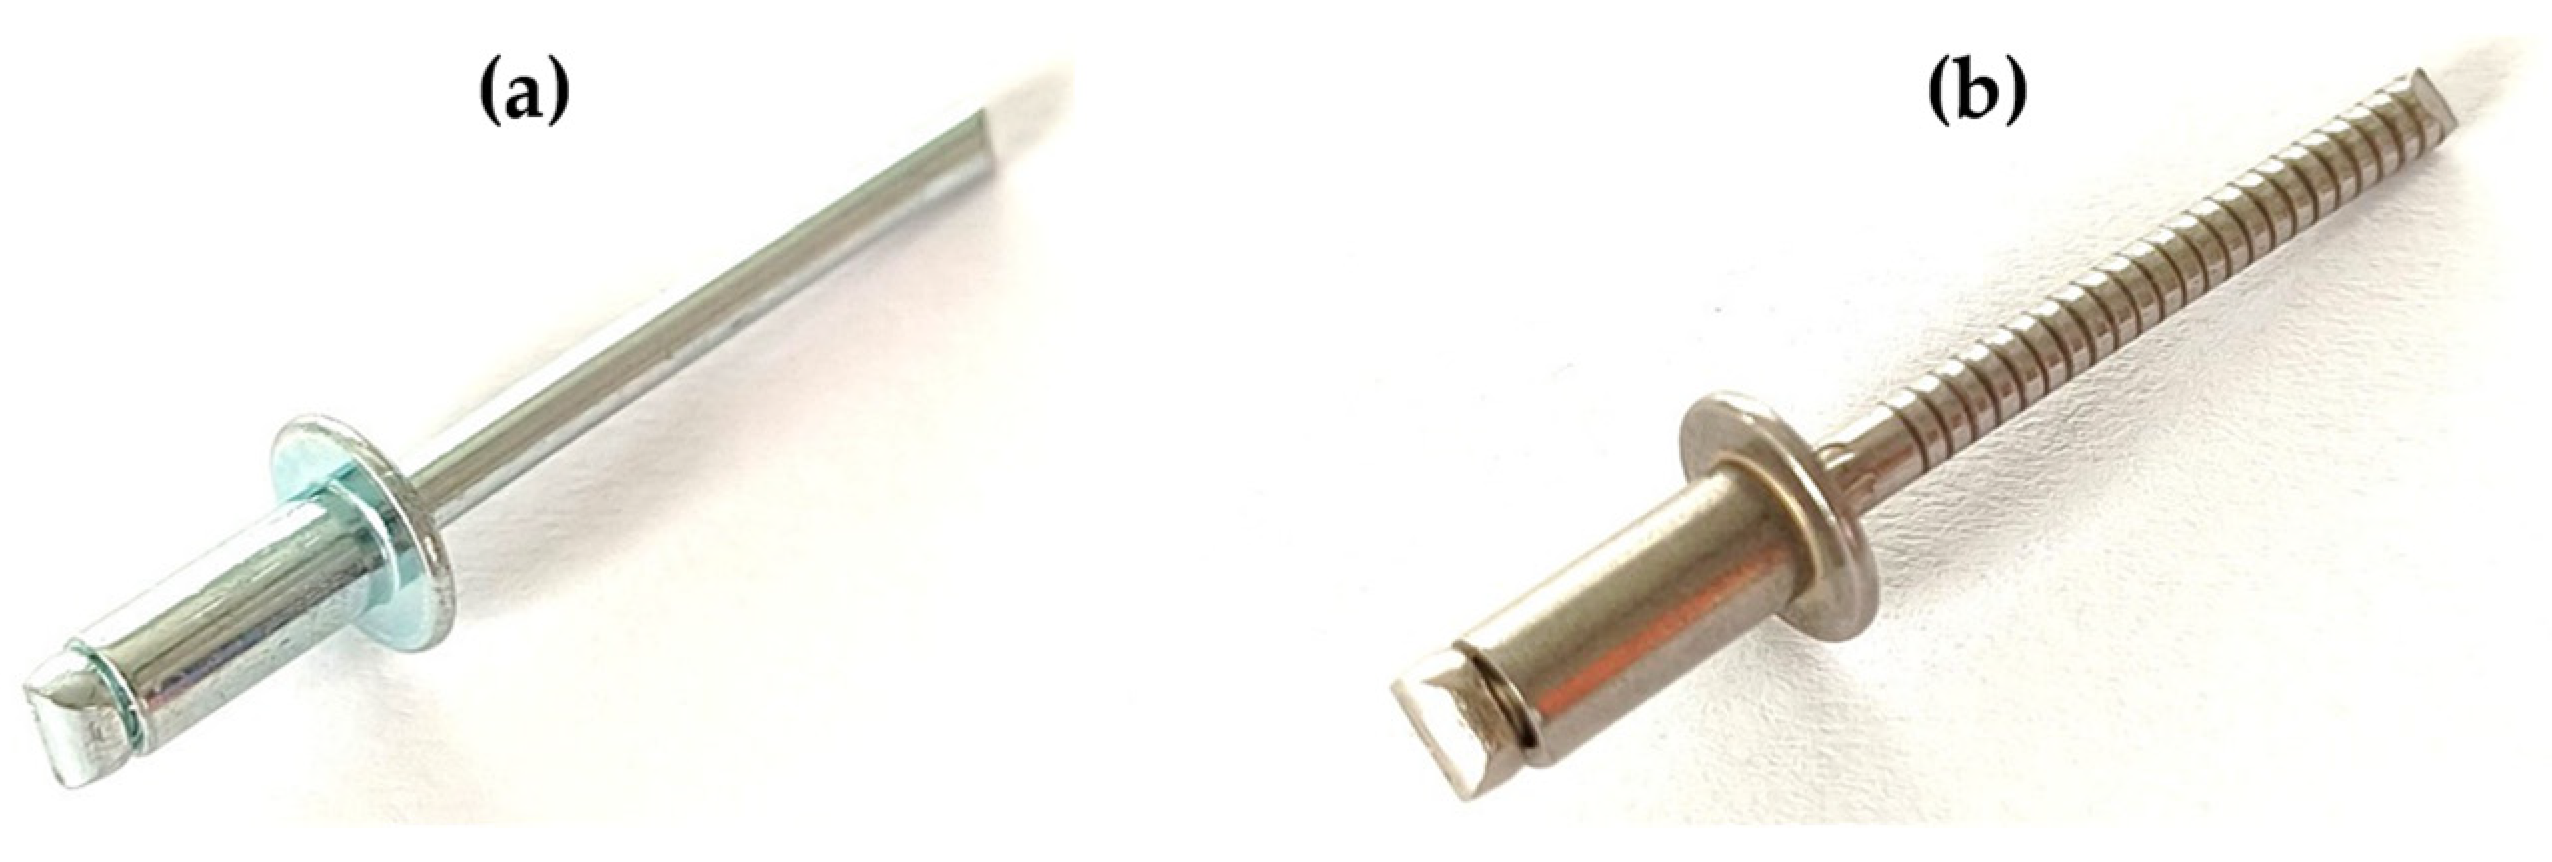
Figure 2.
Blind rivets: (a) DIN 7337—4.8 × 8 St/St; (b) DIN 7337—4.8 × 8 A2/A2.
Figure 2.
Blind rivets: (a) DIN 7337—4.8 × 8 St/St; (b) DIN 7337—4.8 × 8 A2/A2.
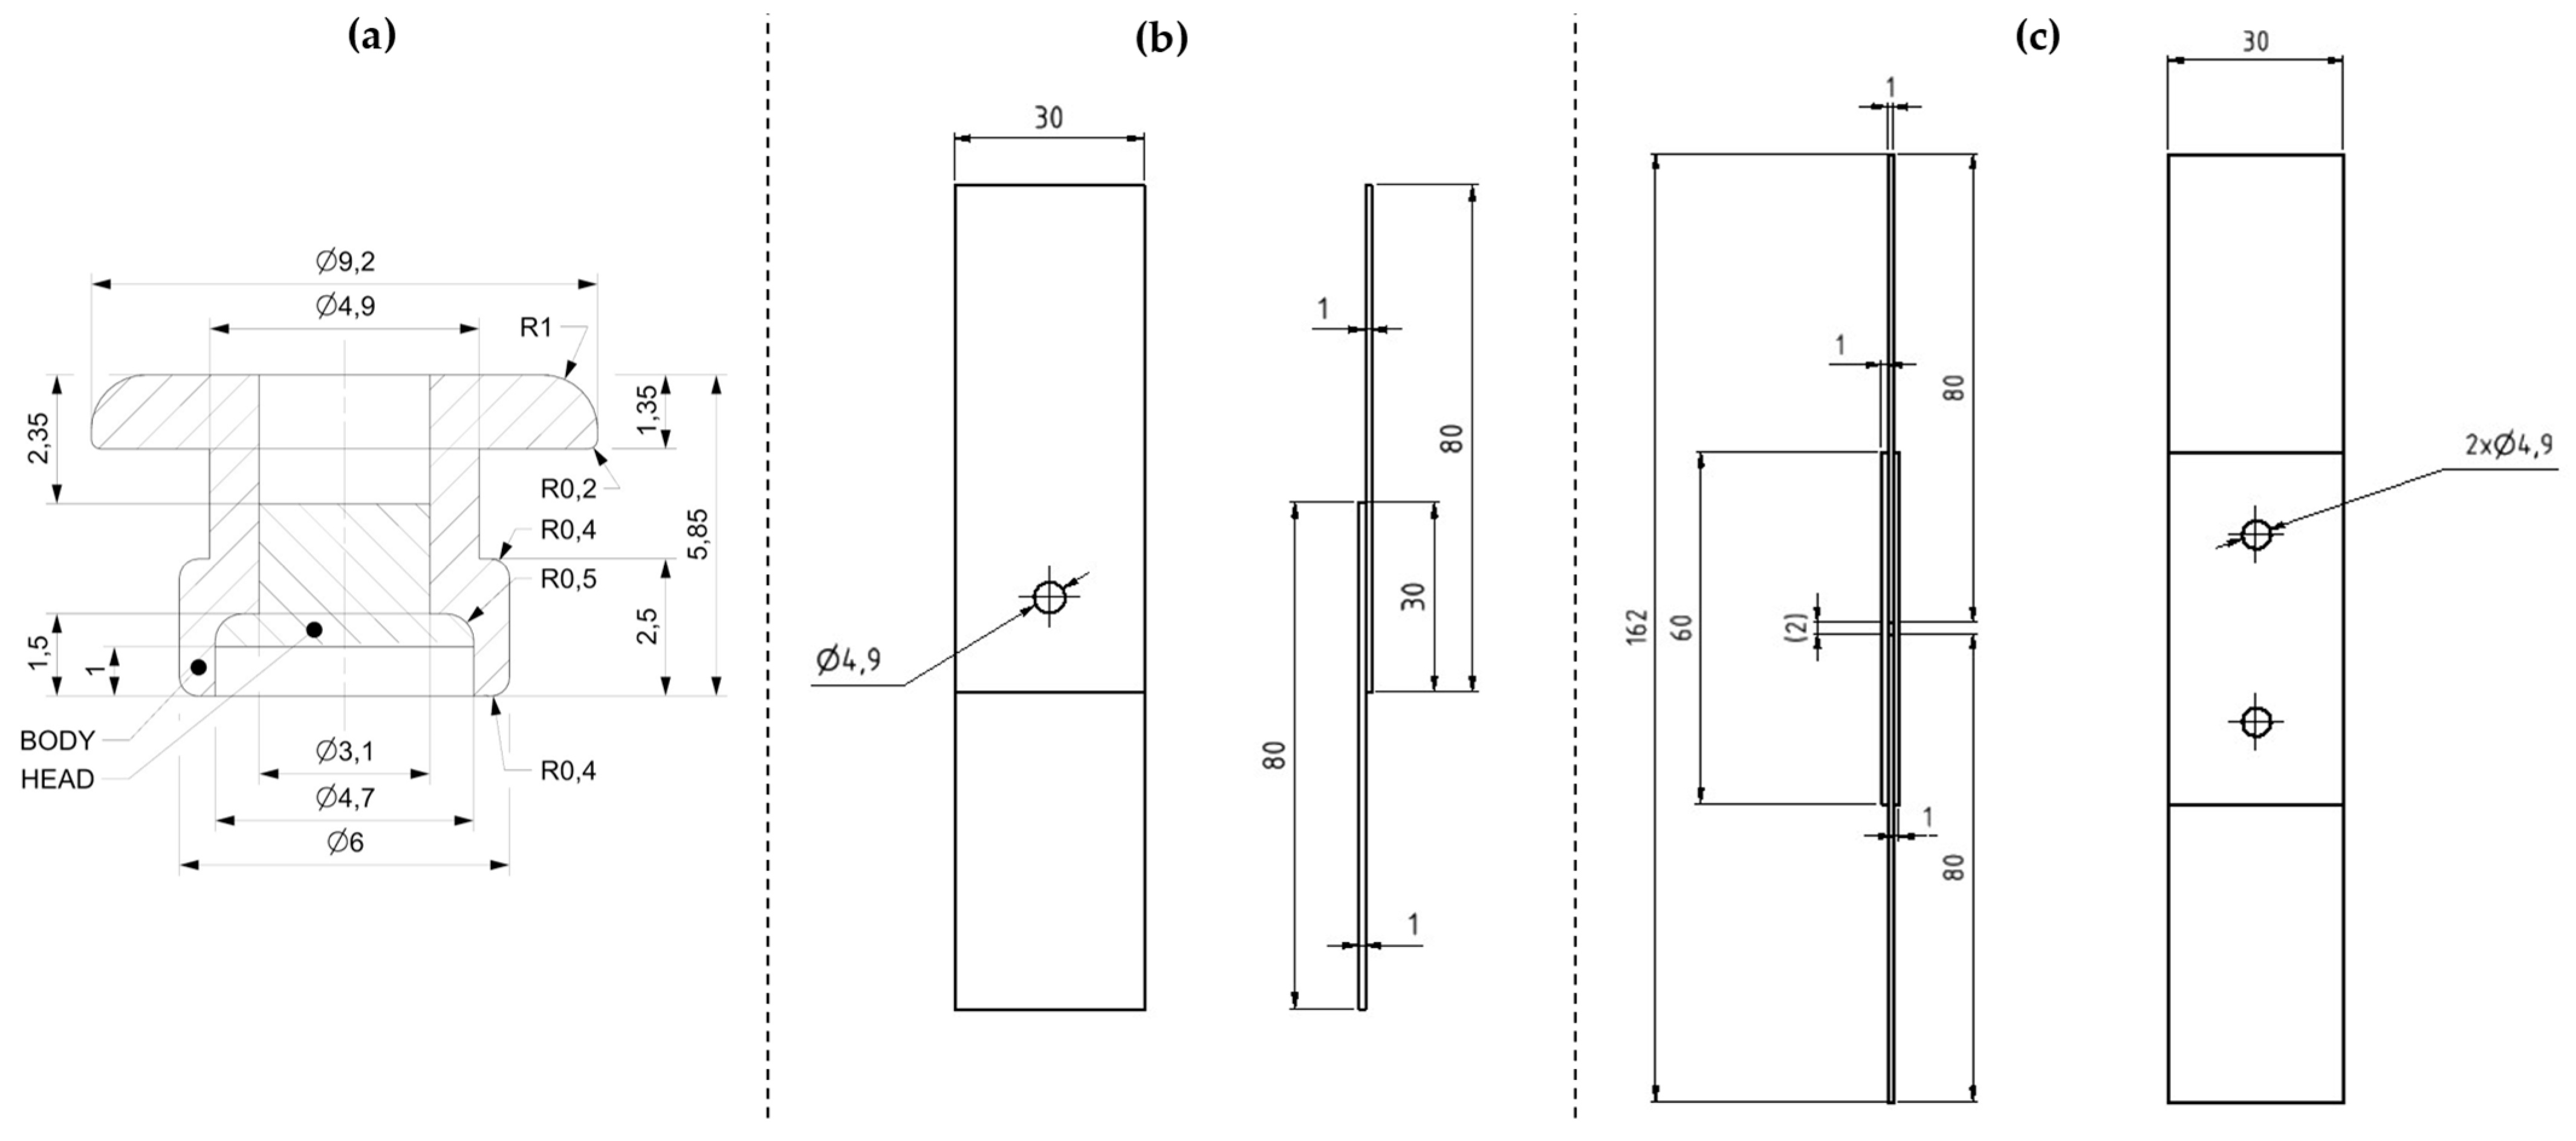
Figure 3.
Dimensions of specimens used for experimental testing of riveted joints: (a) blind rivet DIN 7337—4.8 × 8 after riveting (b) T1 specimens for single-lap shear tensile test; (c) T2 specimens used for double-lap shear tensile test.
Figure 3.
Dimensions of specimens used for experimental testing of riveted joints: (a) blind rivet DIN 7337—4.8 × 8 after riveting (b) T1 specimens for single-lap shear tensile test; (c) T2 specimens used for double-lap shear tensile test.
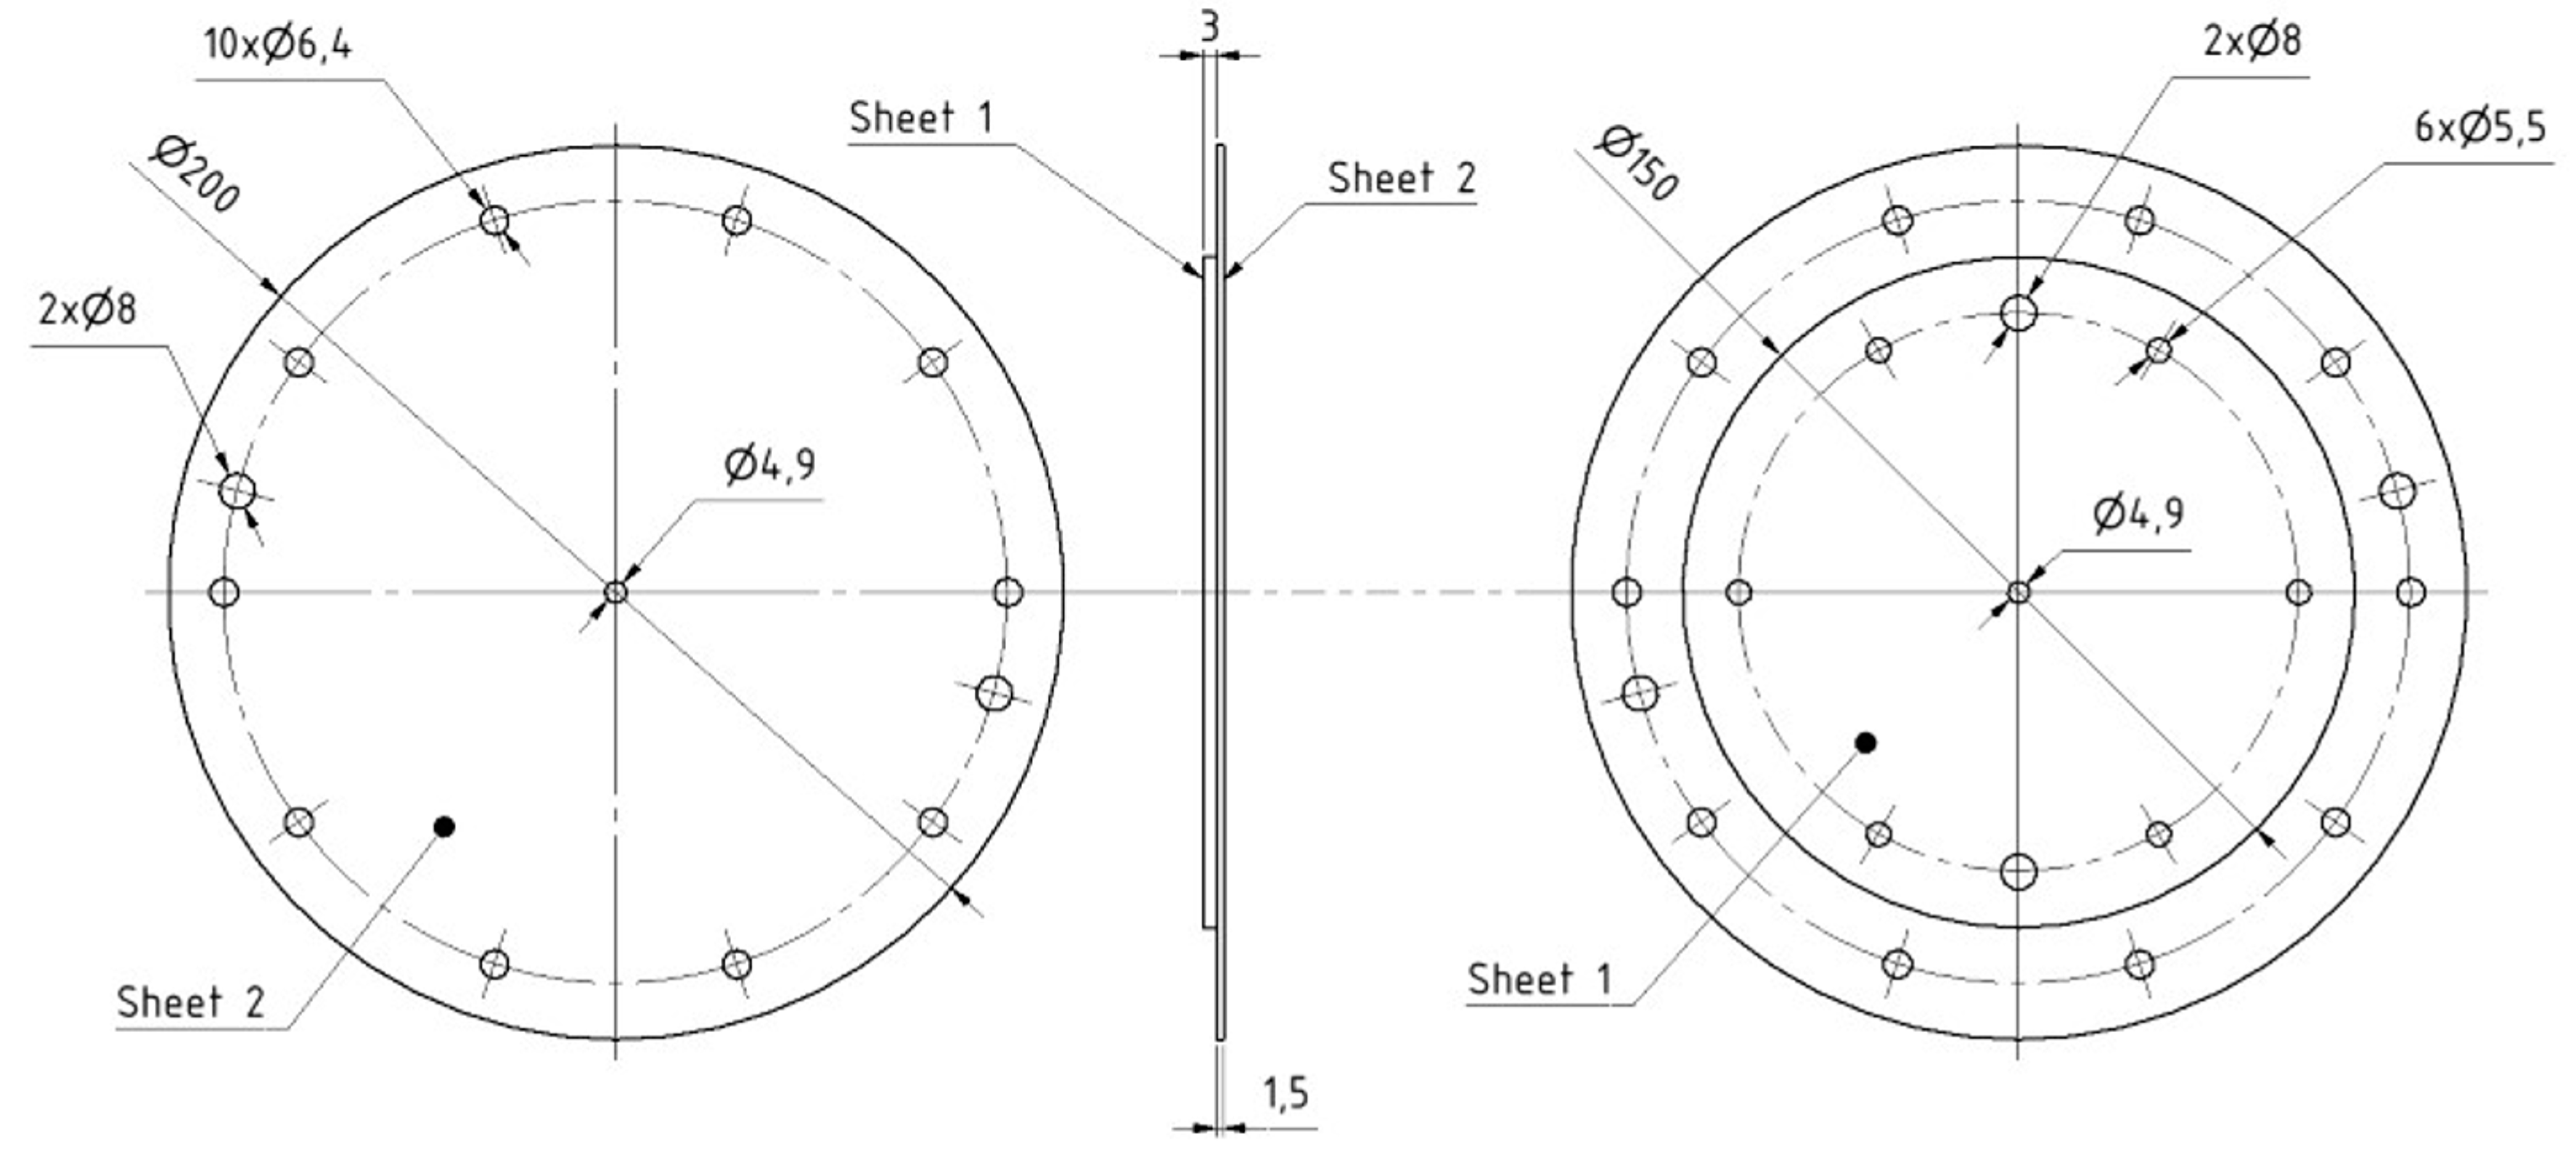
Figure 4.
Dimensions of adherends in T3 specimens ( mm) used for pure normal tensile test.
Figure 4.
Dimensions of adherends in T3 specimens ( mm) used for pure normal tensile test.
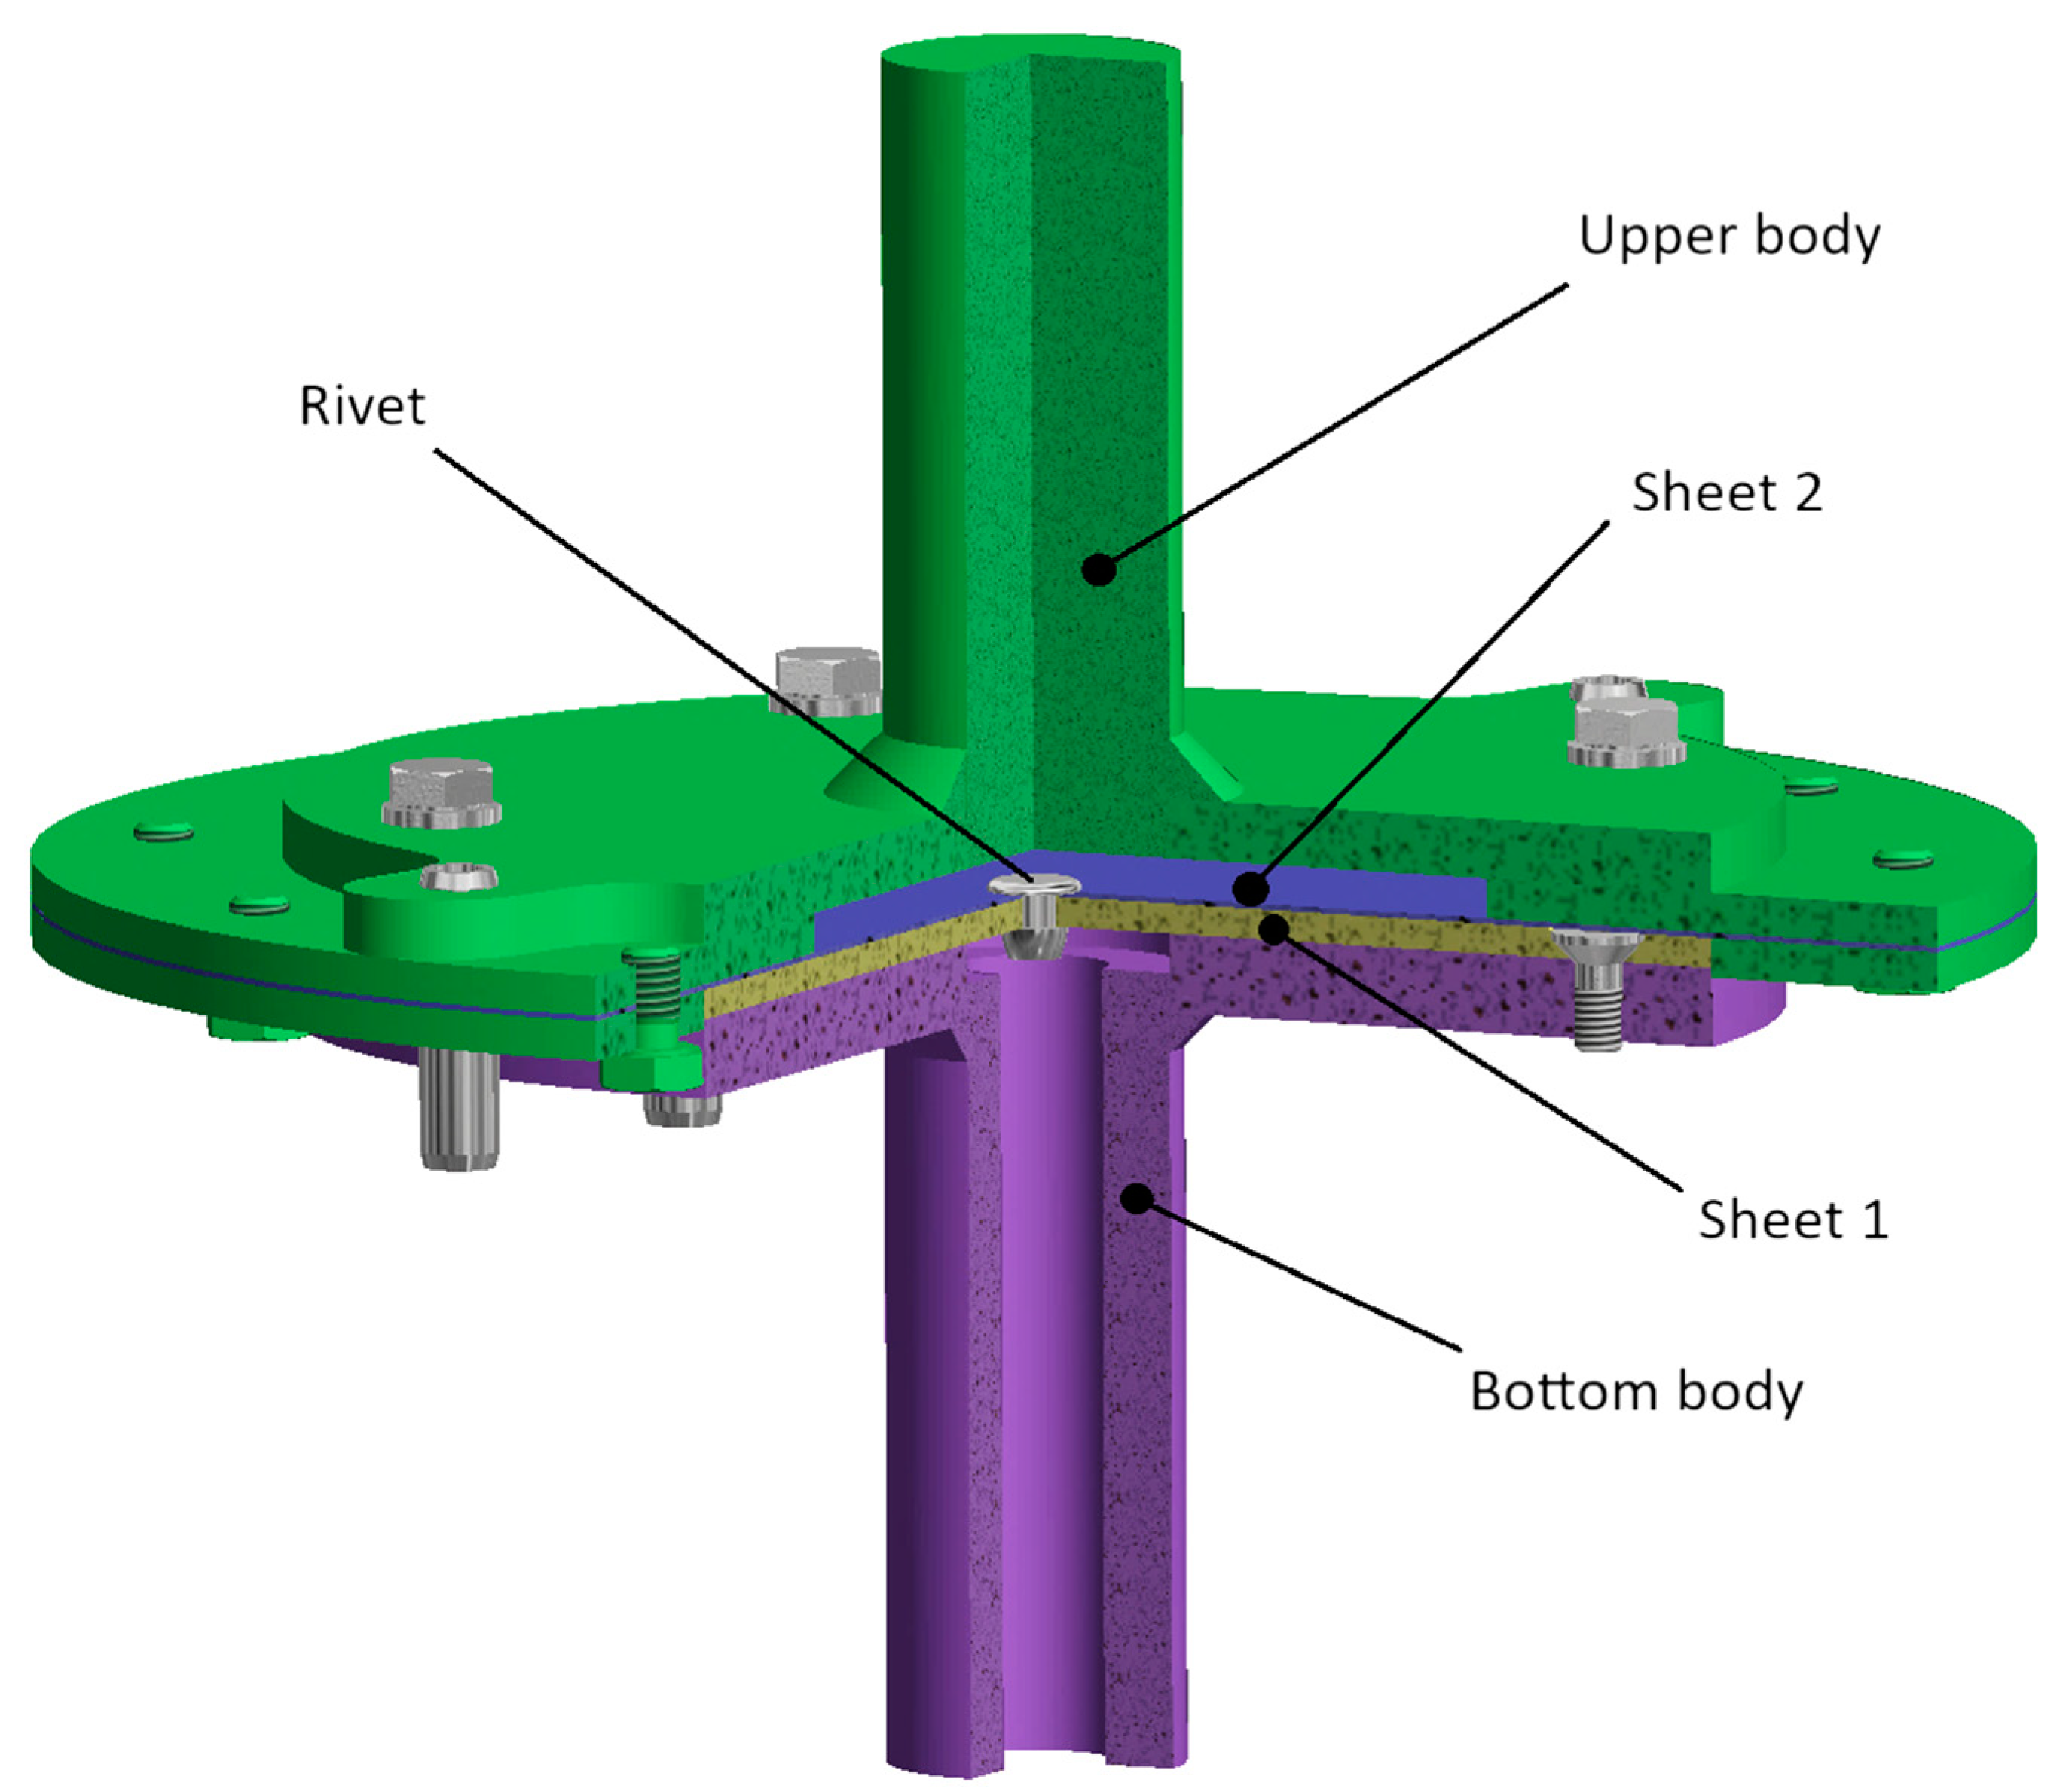
Figure 5.
Assembly of testing equipment specially designed for testing pure normal loading of rivets.
Figure 5.
Assembly of testing equipment specially designed for testing pure normal loading of rivets.
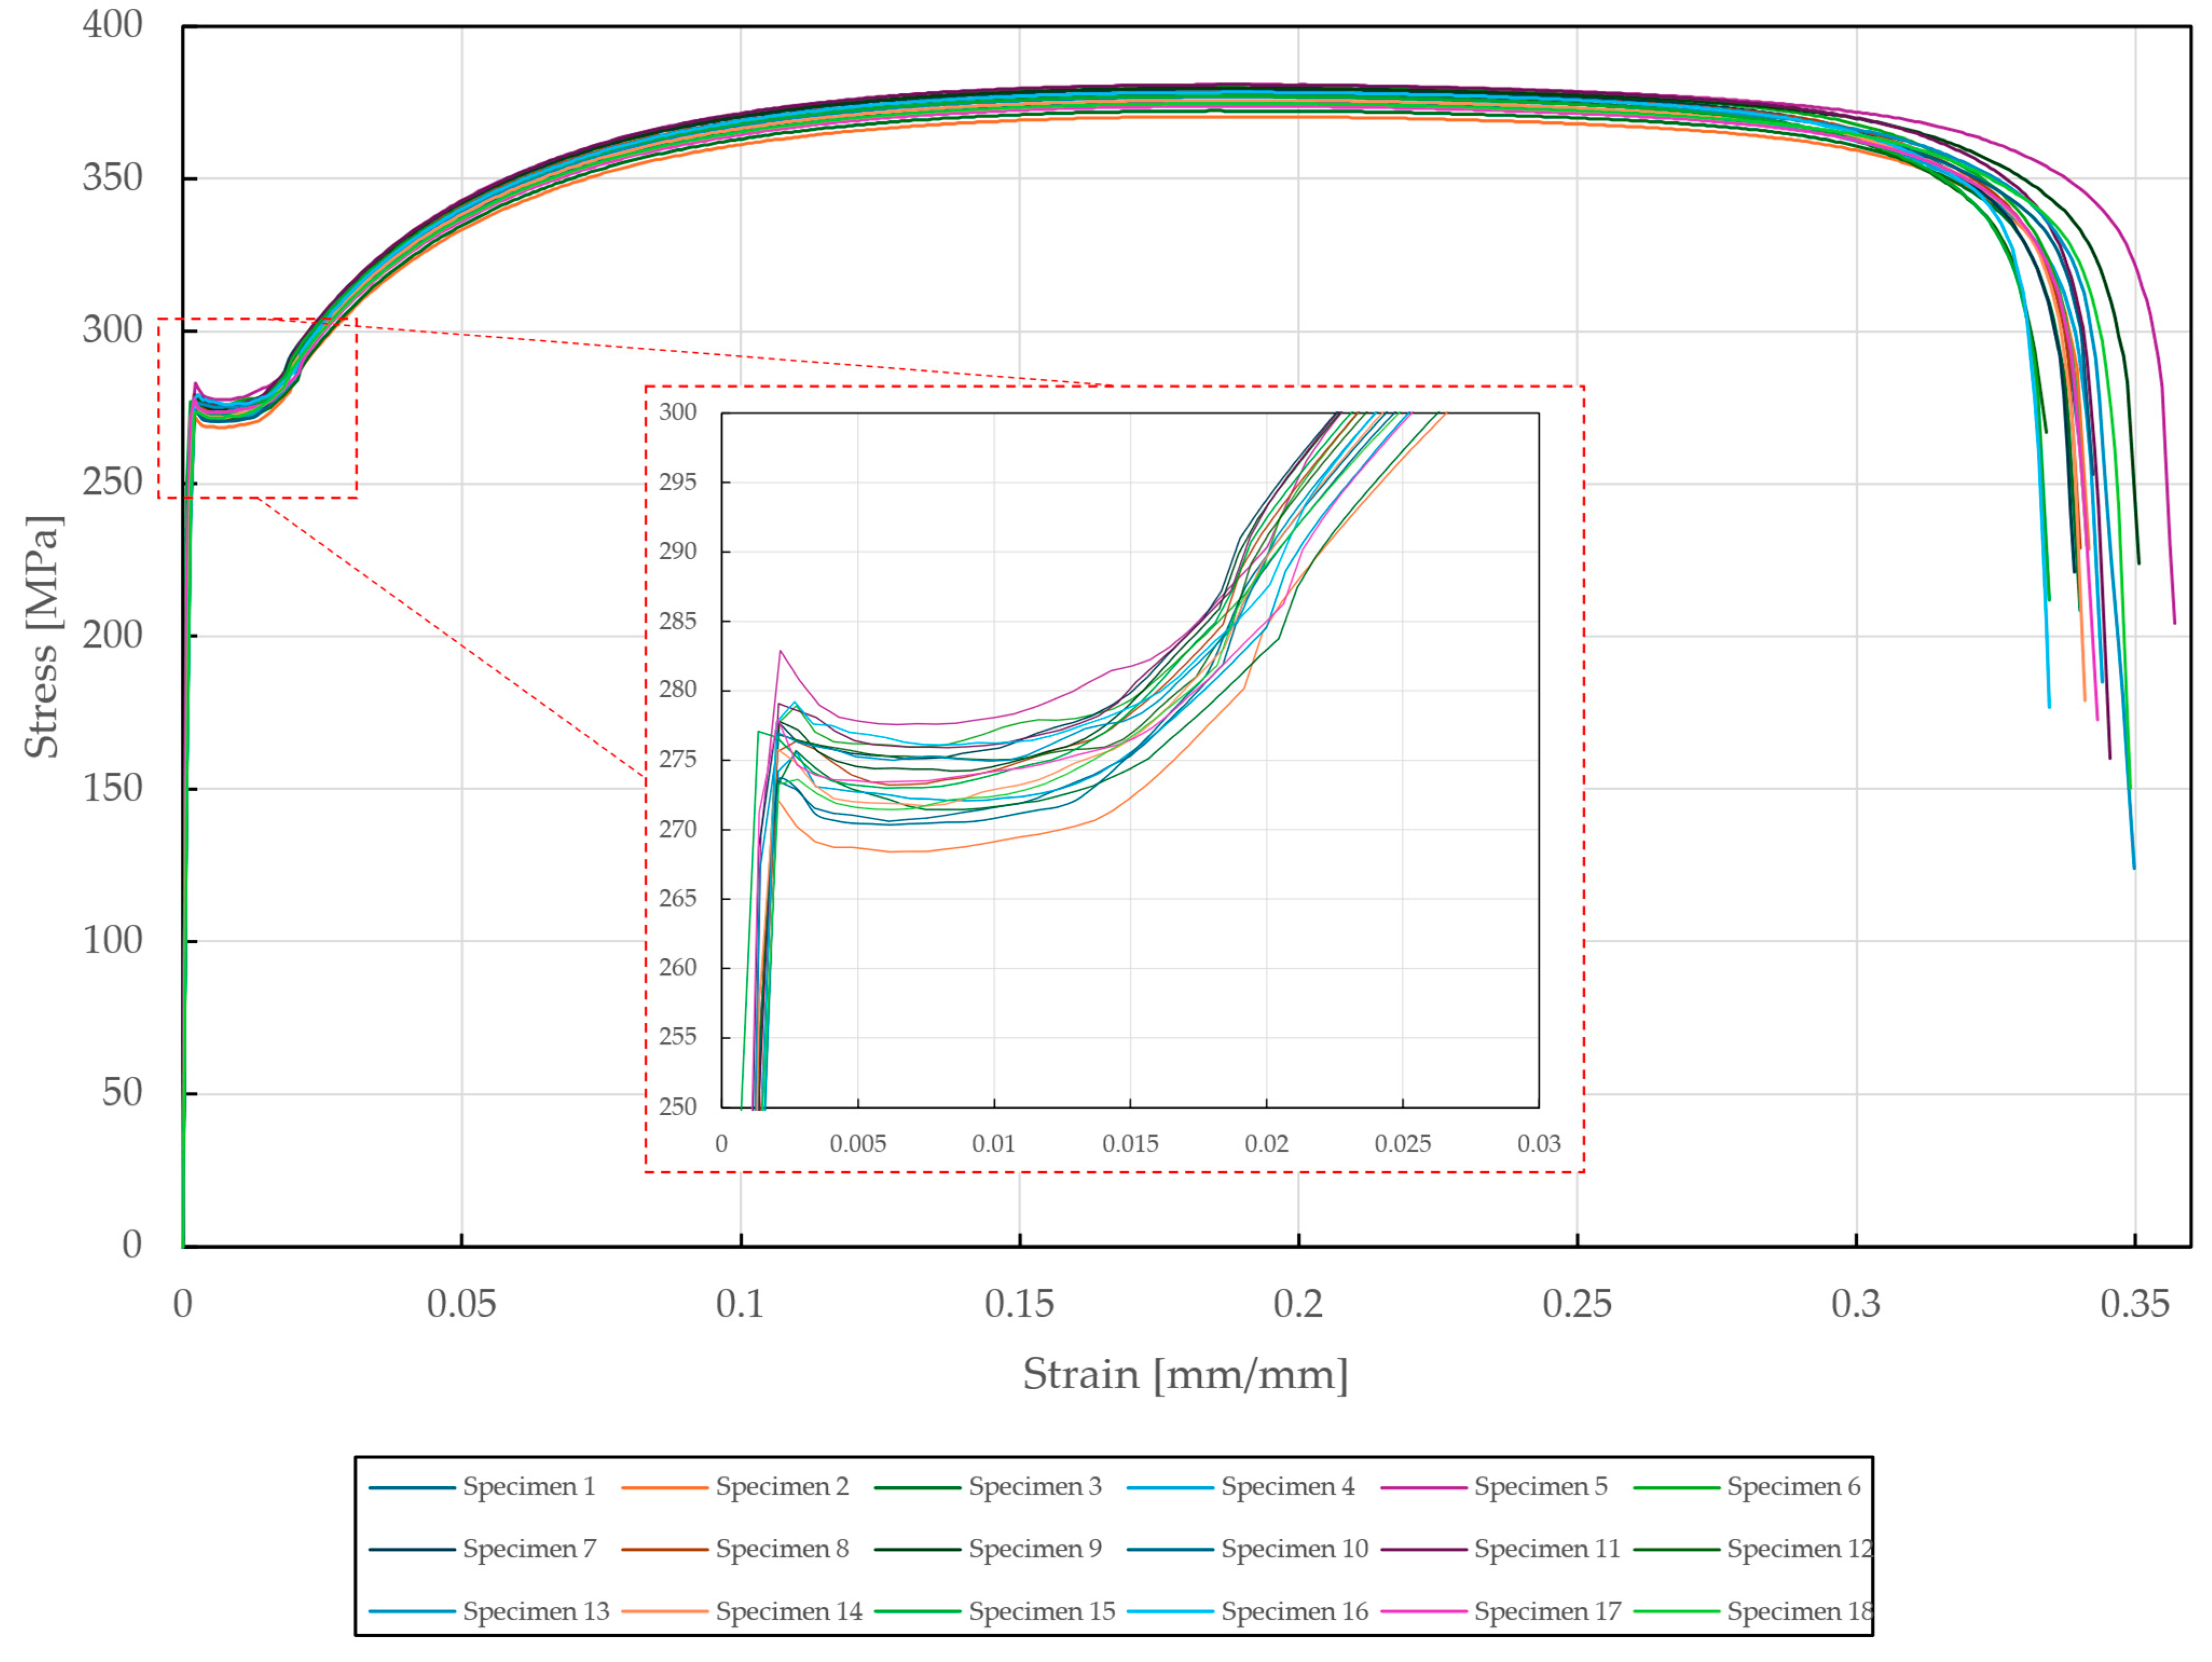
Figure 6.
Stress–strain diagram of DX51D + Z275 steel tested according to EN ISO 6892-1.
Figure 6.
Stress–strain diagram of DX51D + Z275 steel tested according to EN ISO 6892-1.
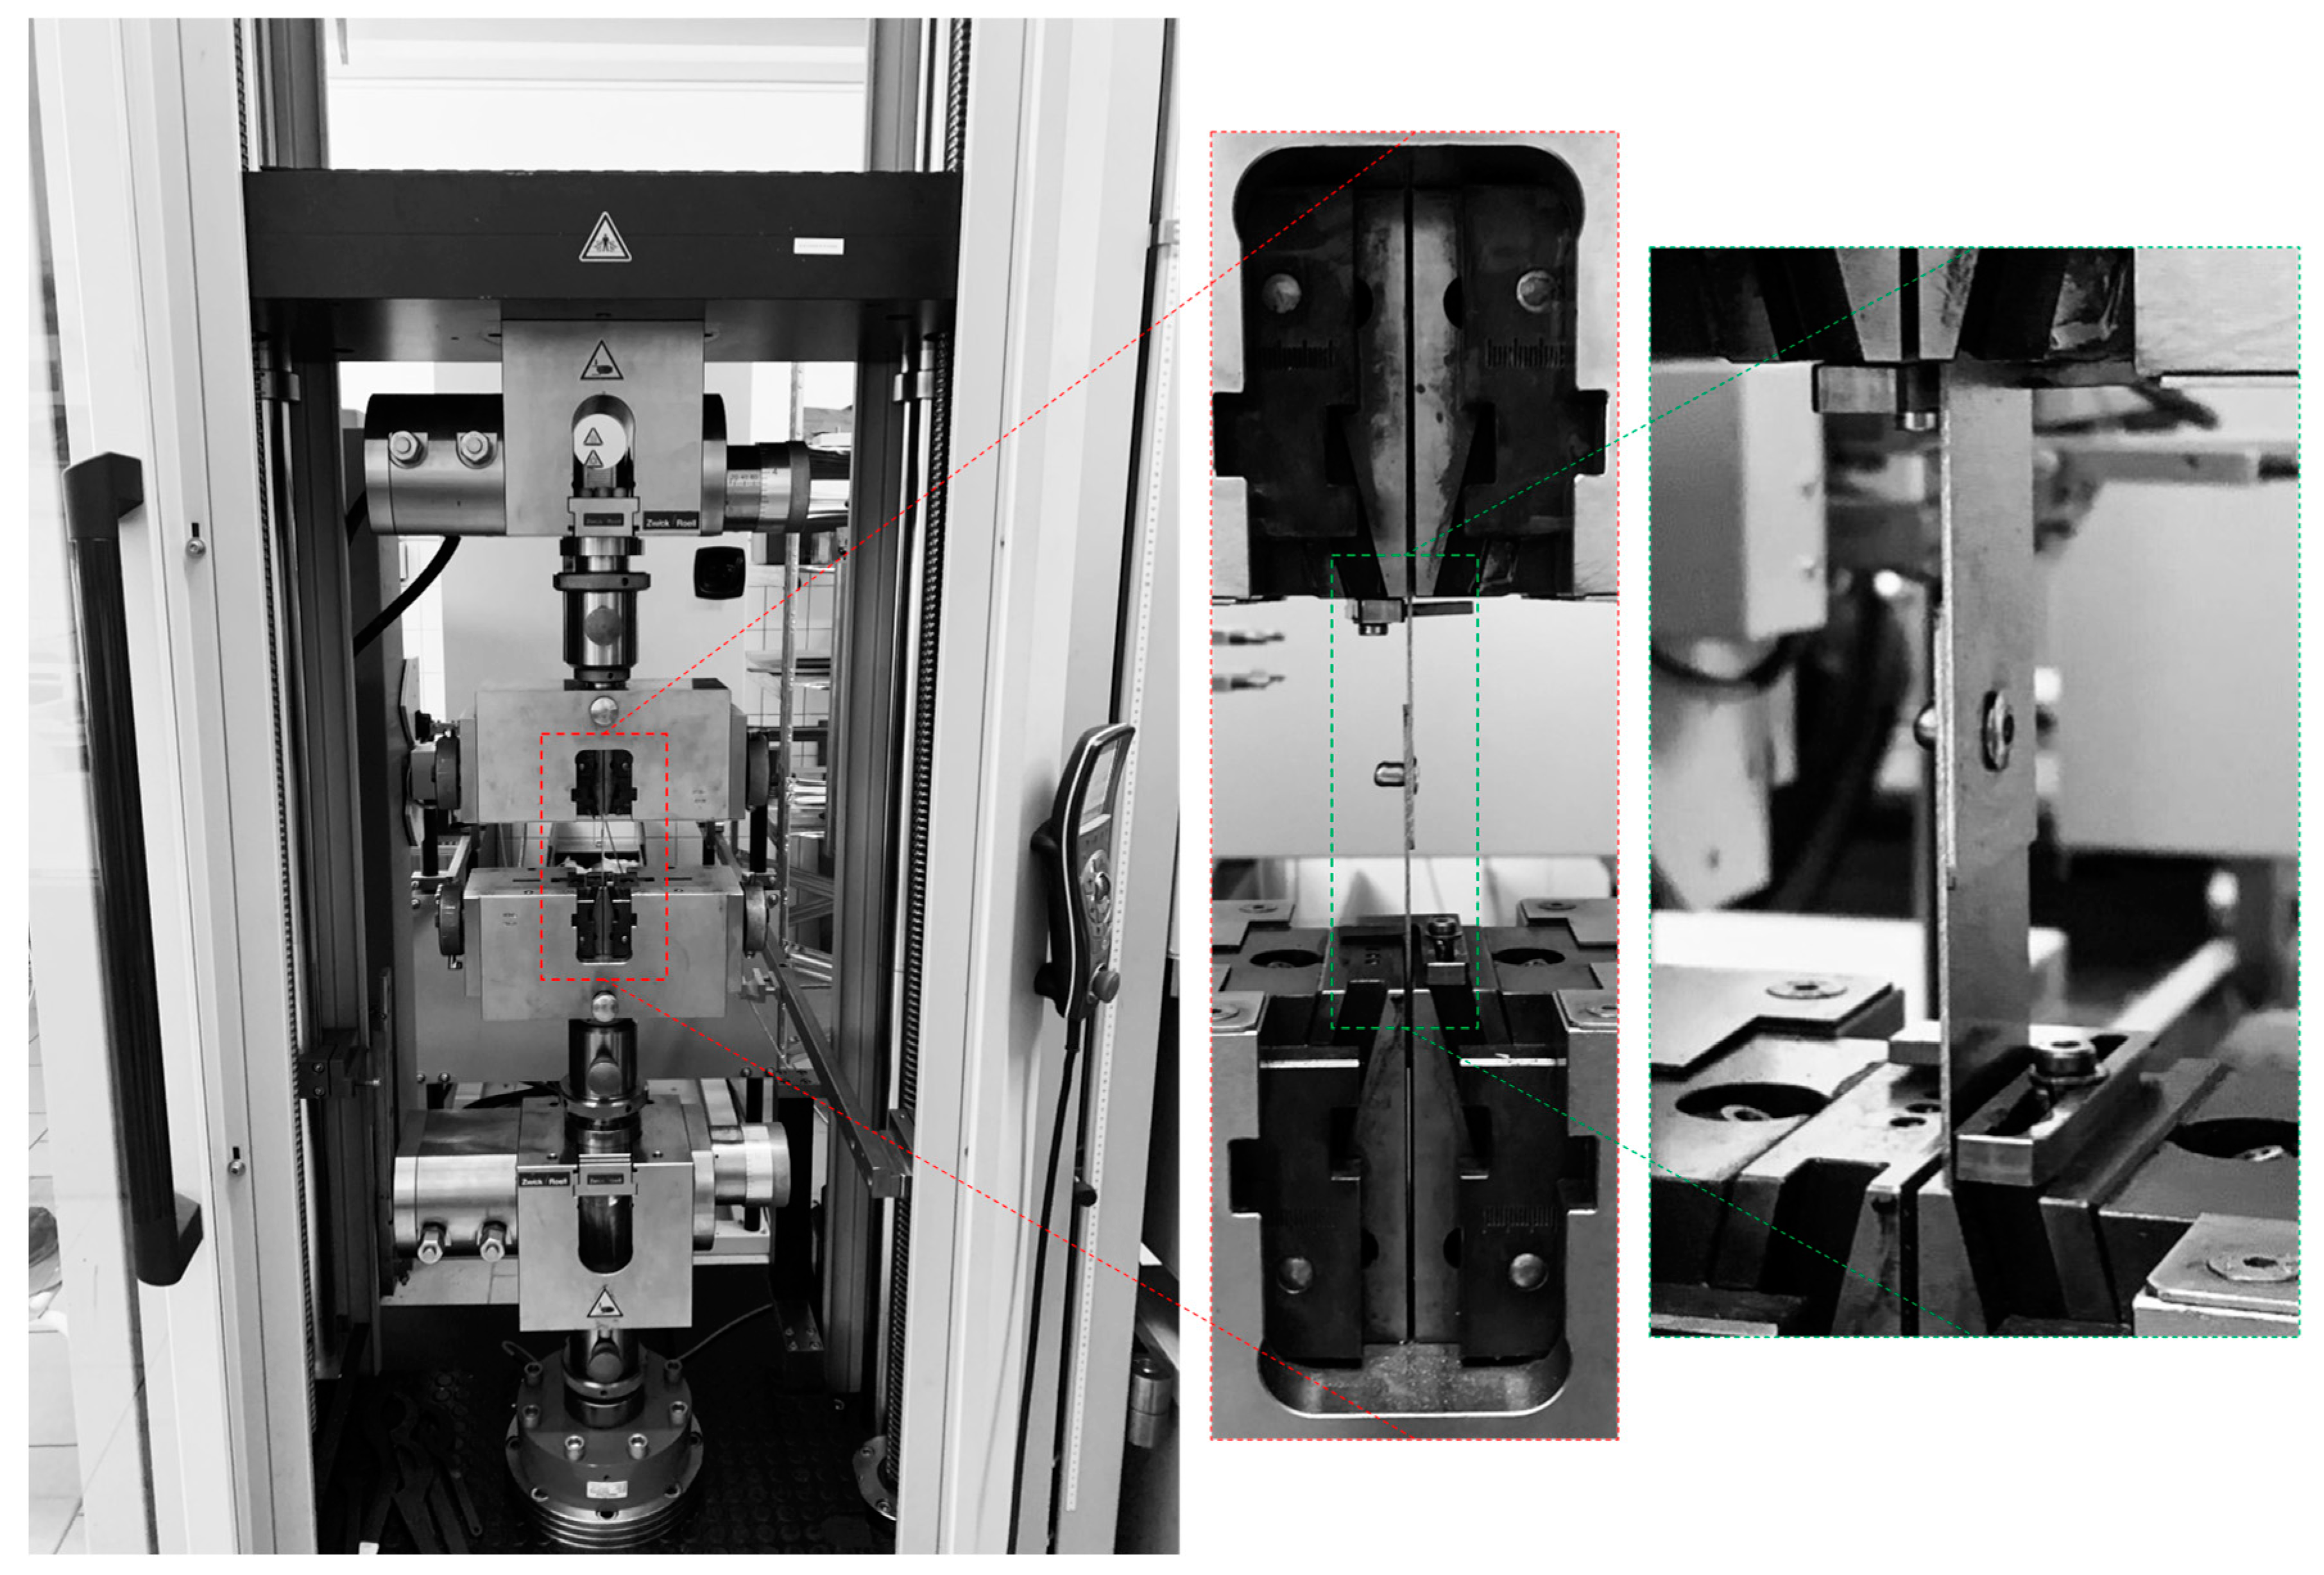
Figure 7.
Experimental setup for tensile testing of riveted specimens on Zwick Roell Z250.
Figure 7.
Experimental setup for tensile testing of riveted specimens on Zwick Roell Z250.
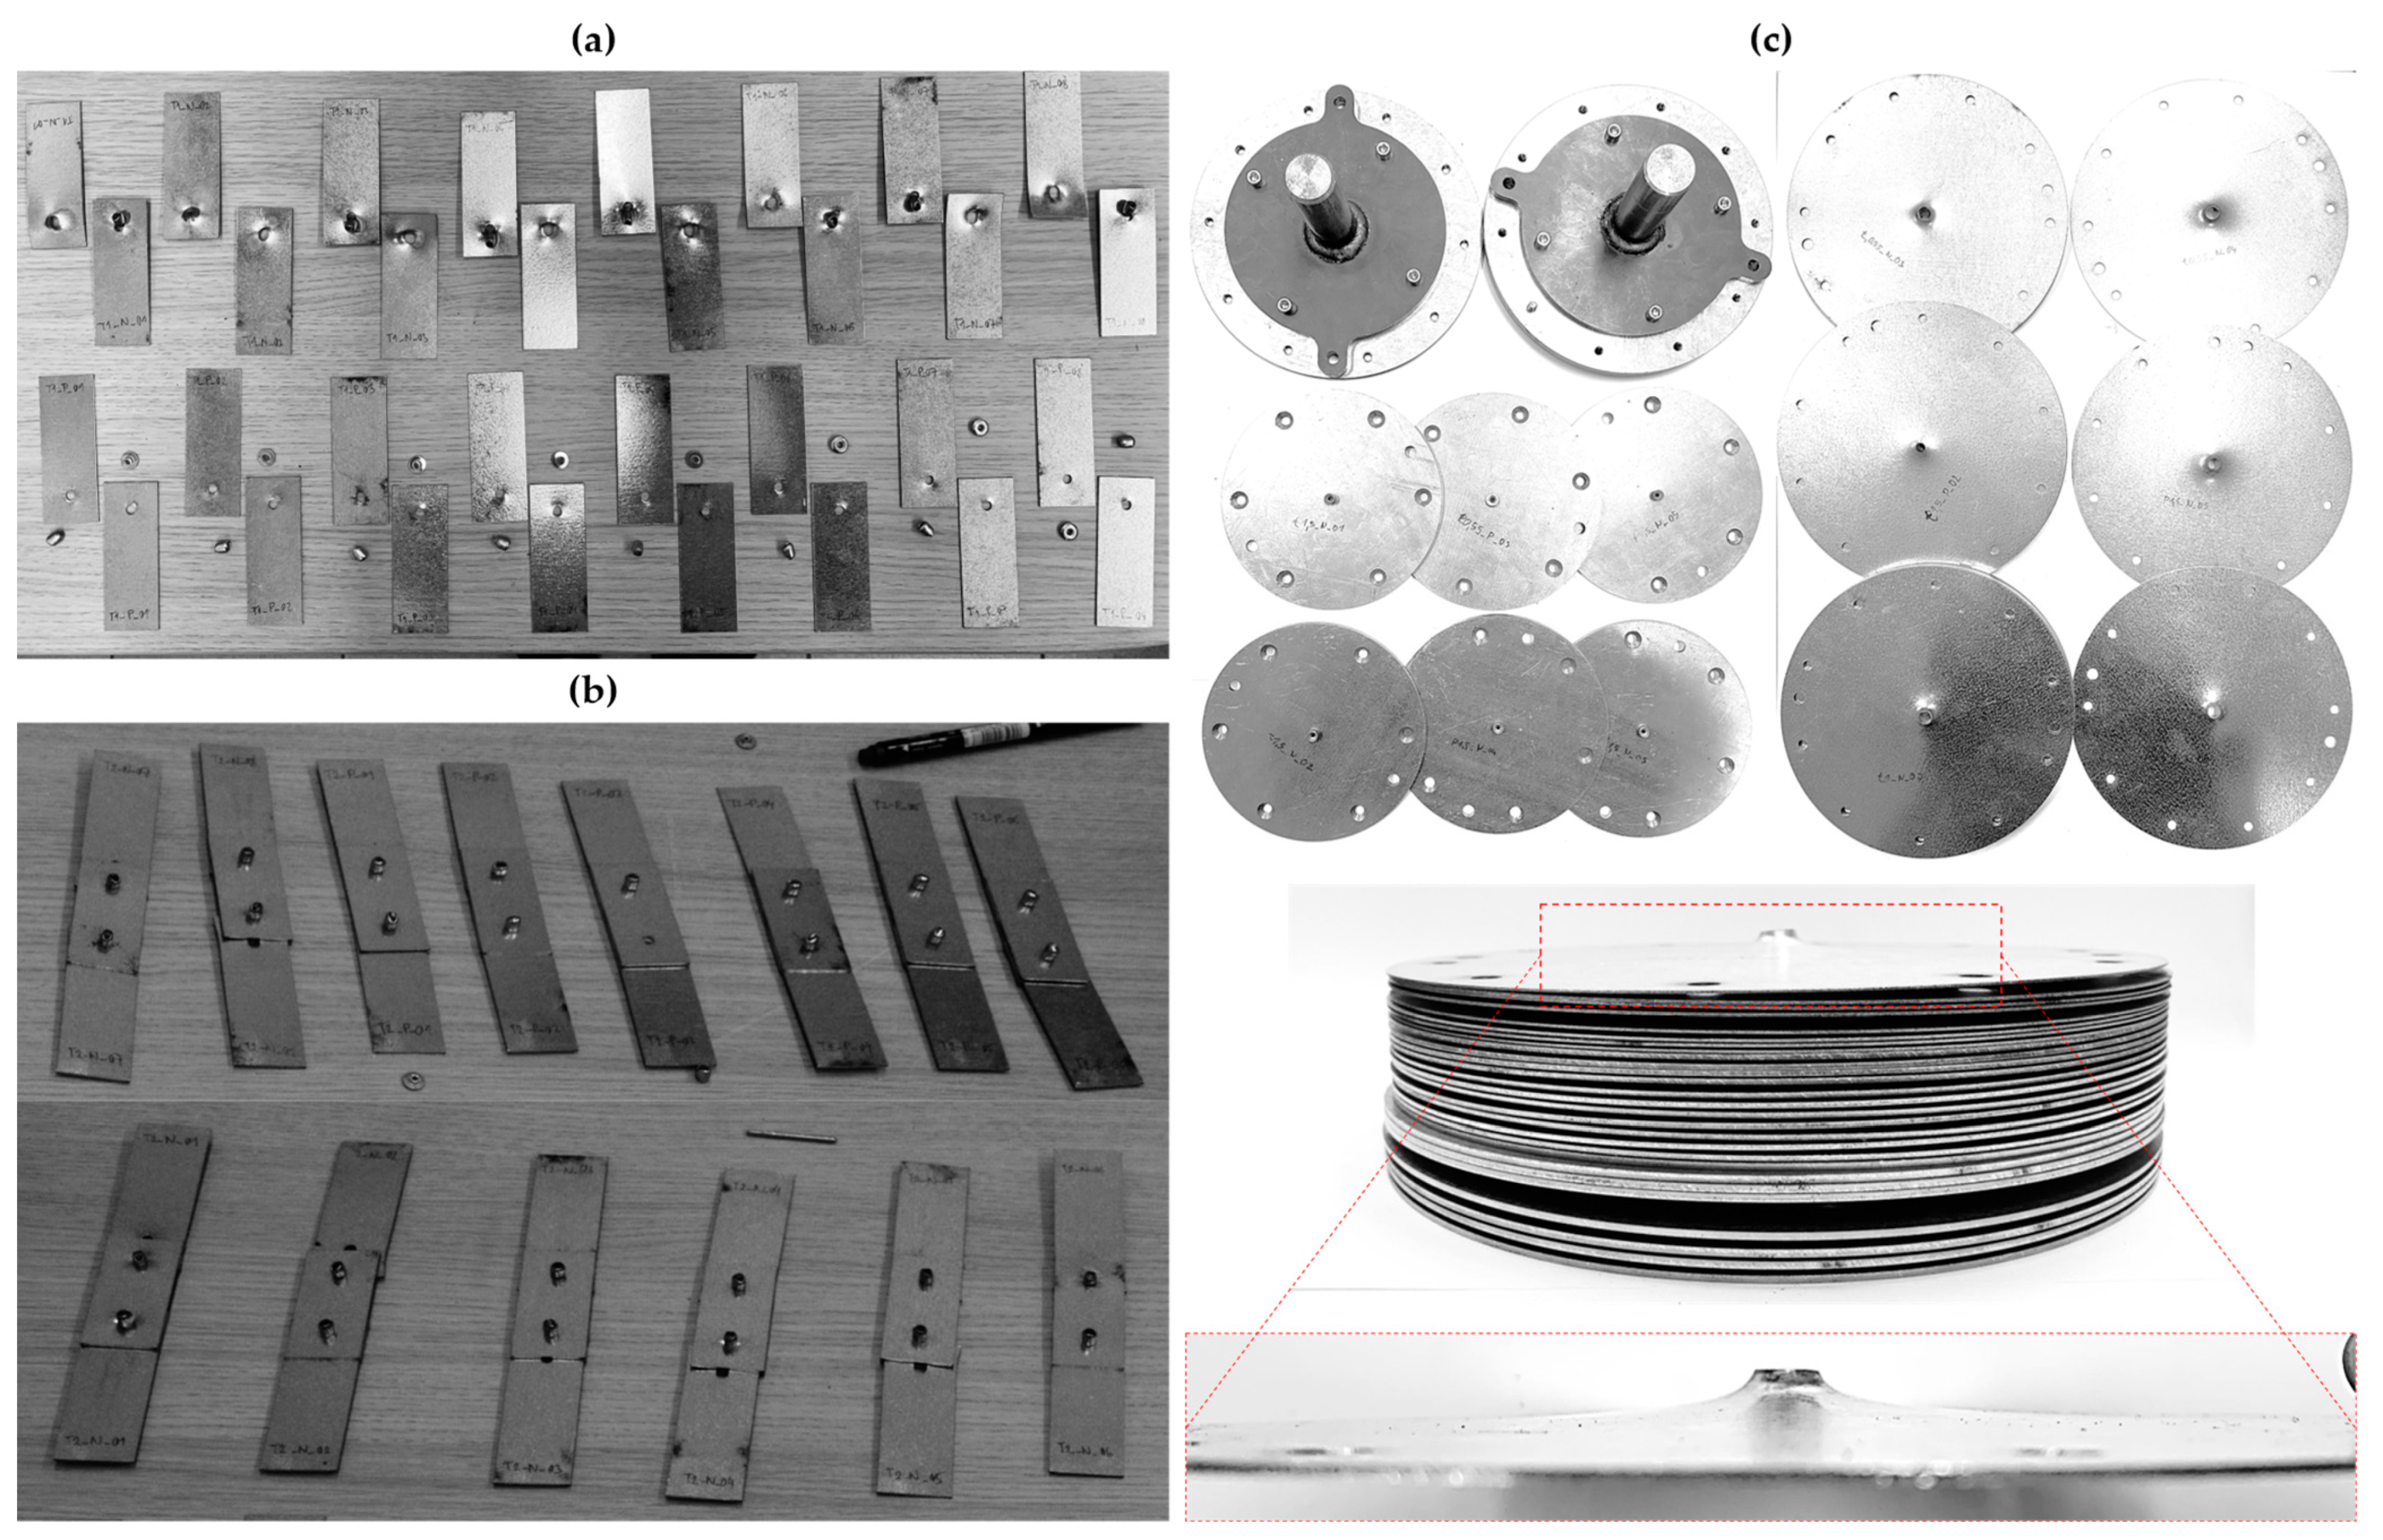
Figure 8.
Riveted specimens post experimental tensile testing: (a) T1 specimens with A2/A2 (top) and St/St (bottom) rivets subjected to single-lap shear tensile test; (b) T2 specimens with A2/A2 (bottom) and St/St (top) rivets subjected to double-lap shear tensile test; (c) T3 specimens subjected to pure normal tensile test.
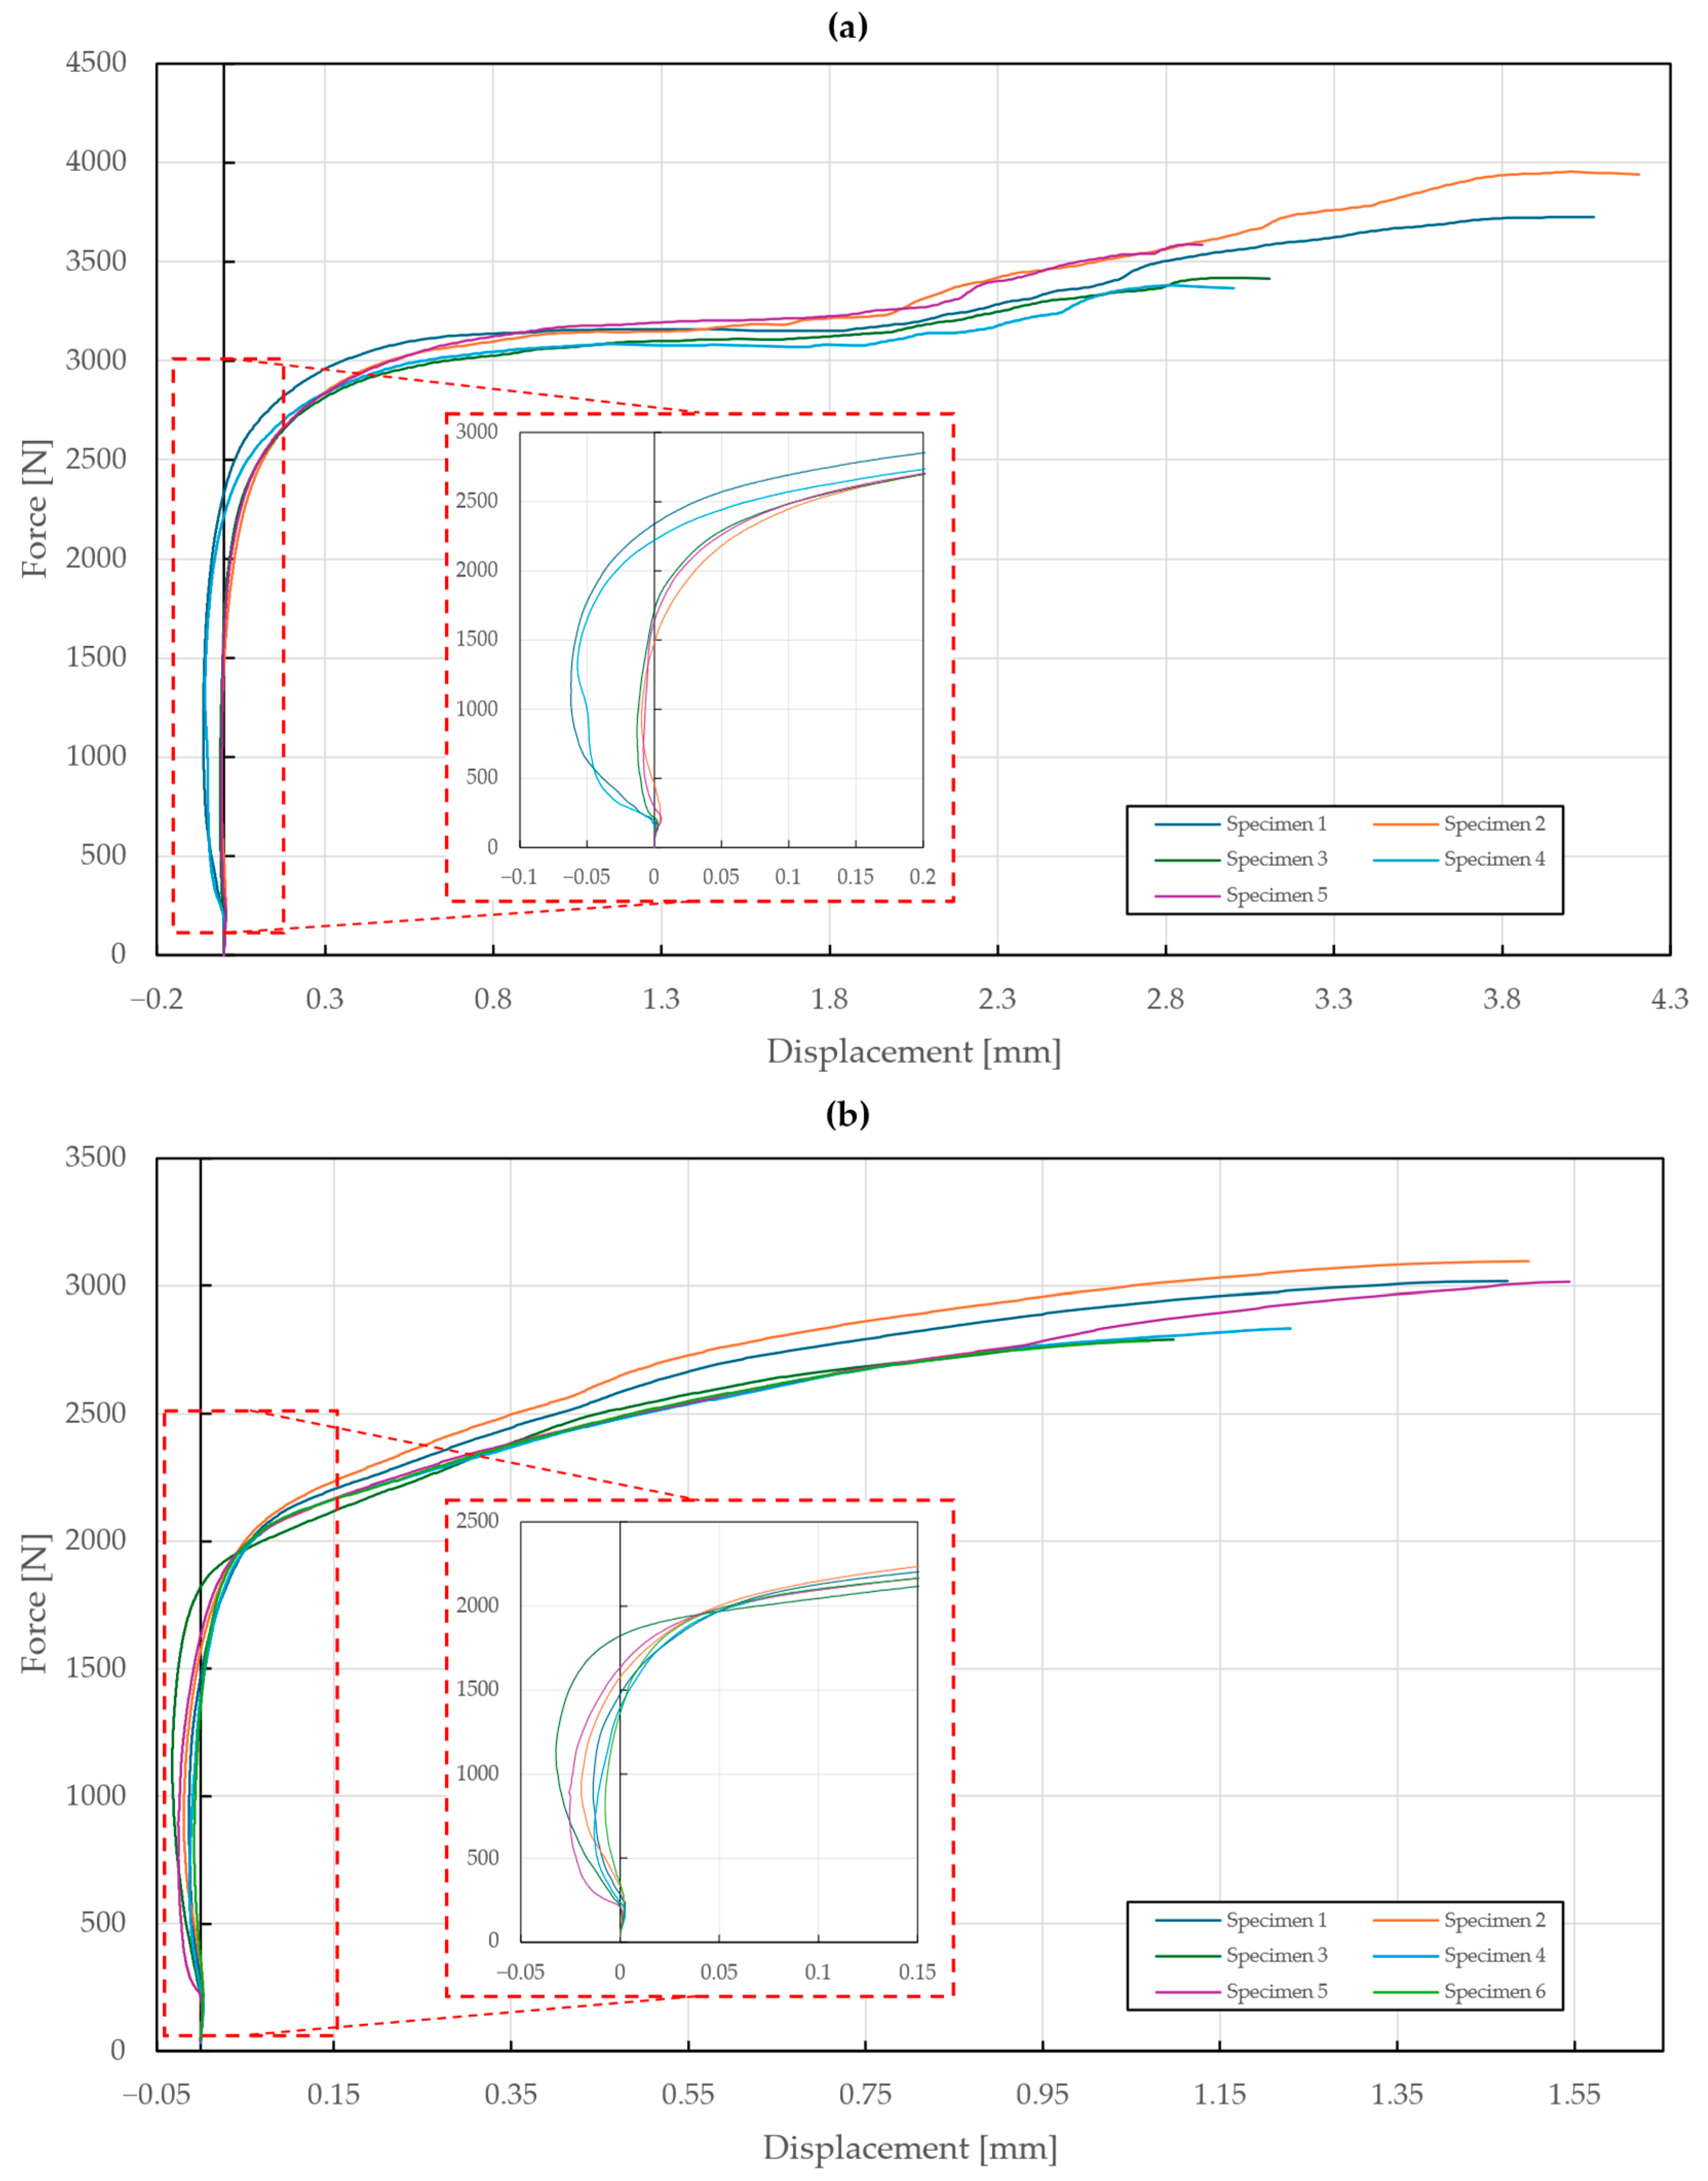
Figure 9.
Force–displacement diagram of single-lap shear tensile loading of T1 specimens: (a) stainless steel rivets DIN 7337—4.8 × 8 A2/A2; (b) galvanized carbon steel rivets DIN 7337—4.8 × 8 St/St.
Figure 9.
Force–displacement diagram of single-lap shear tensile loading of T1 specimens: (a) stainless steel rivets DIN 7337—4.8 × 8 A2/A2; (b) galvanized carbon steel rivets DIN 7337—4.8 × 8 St/St.
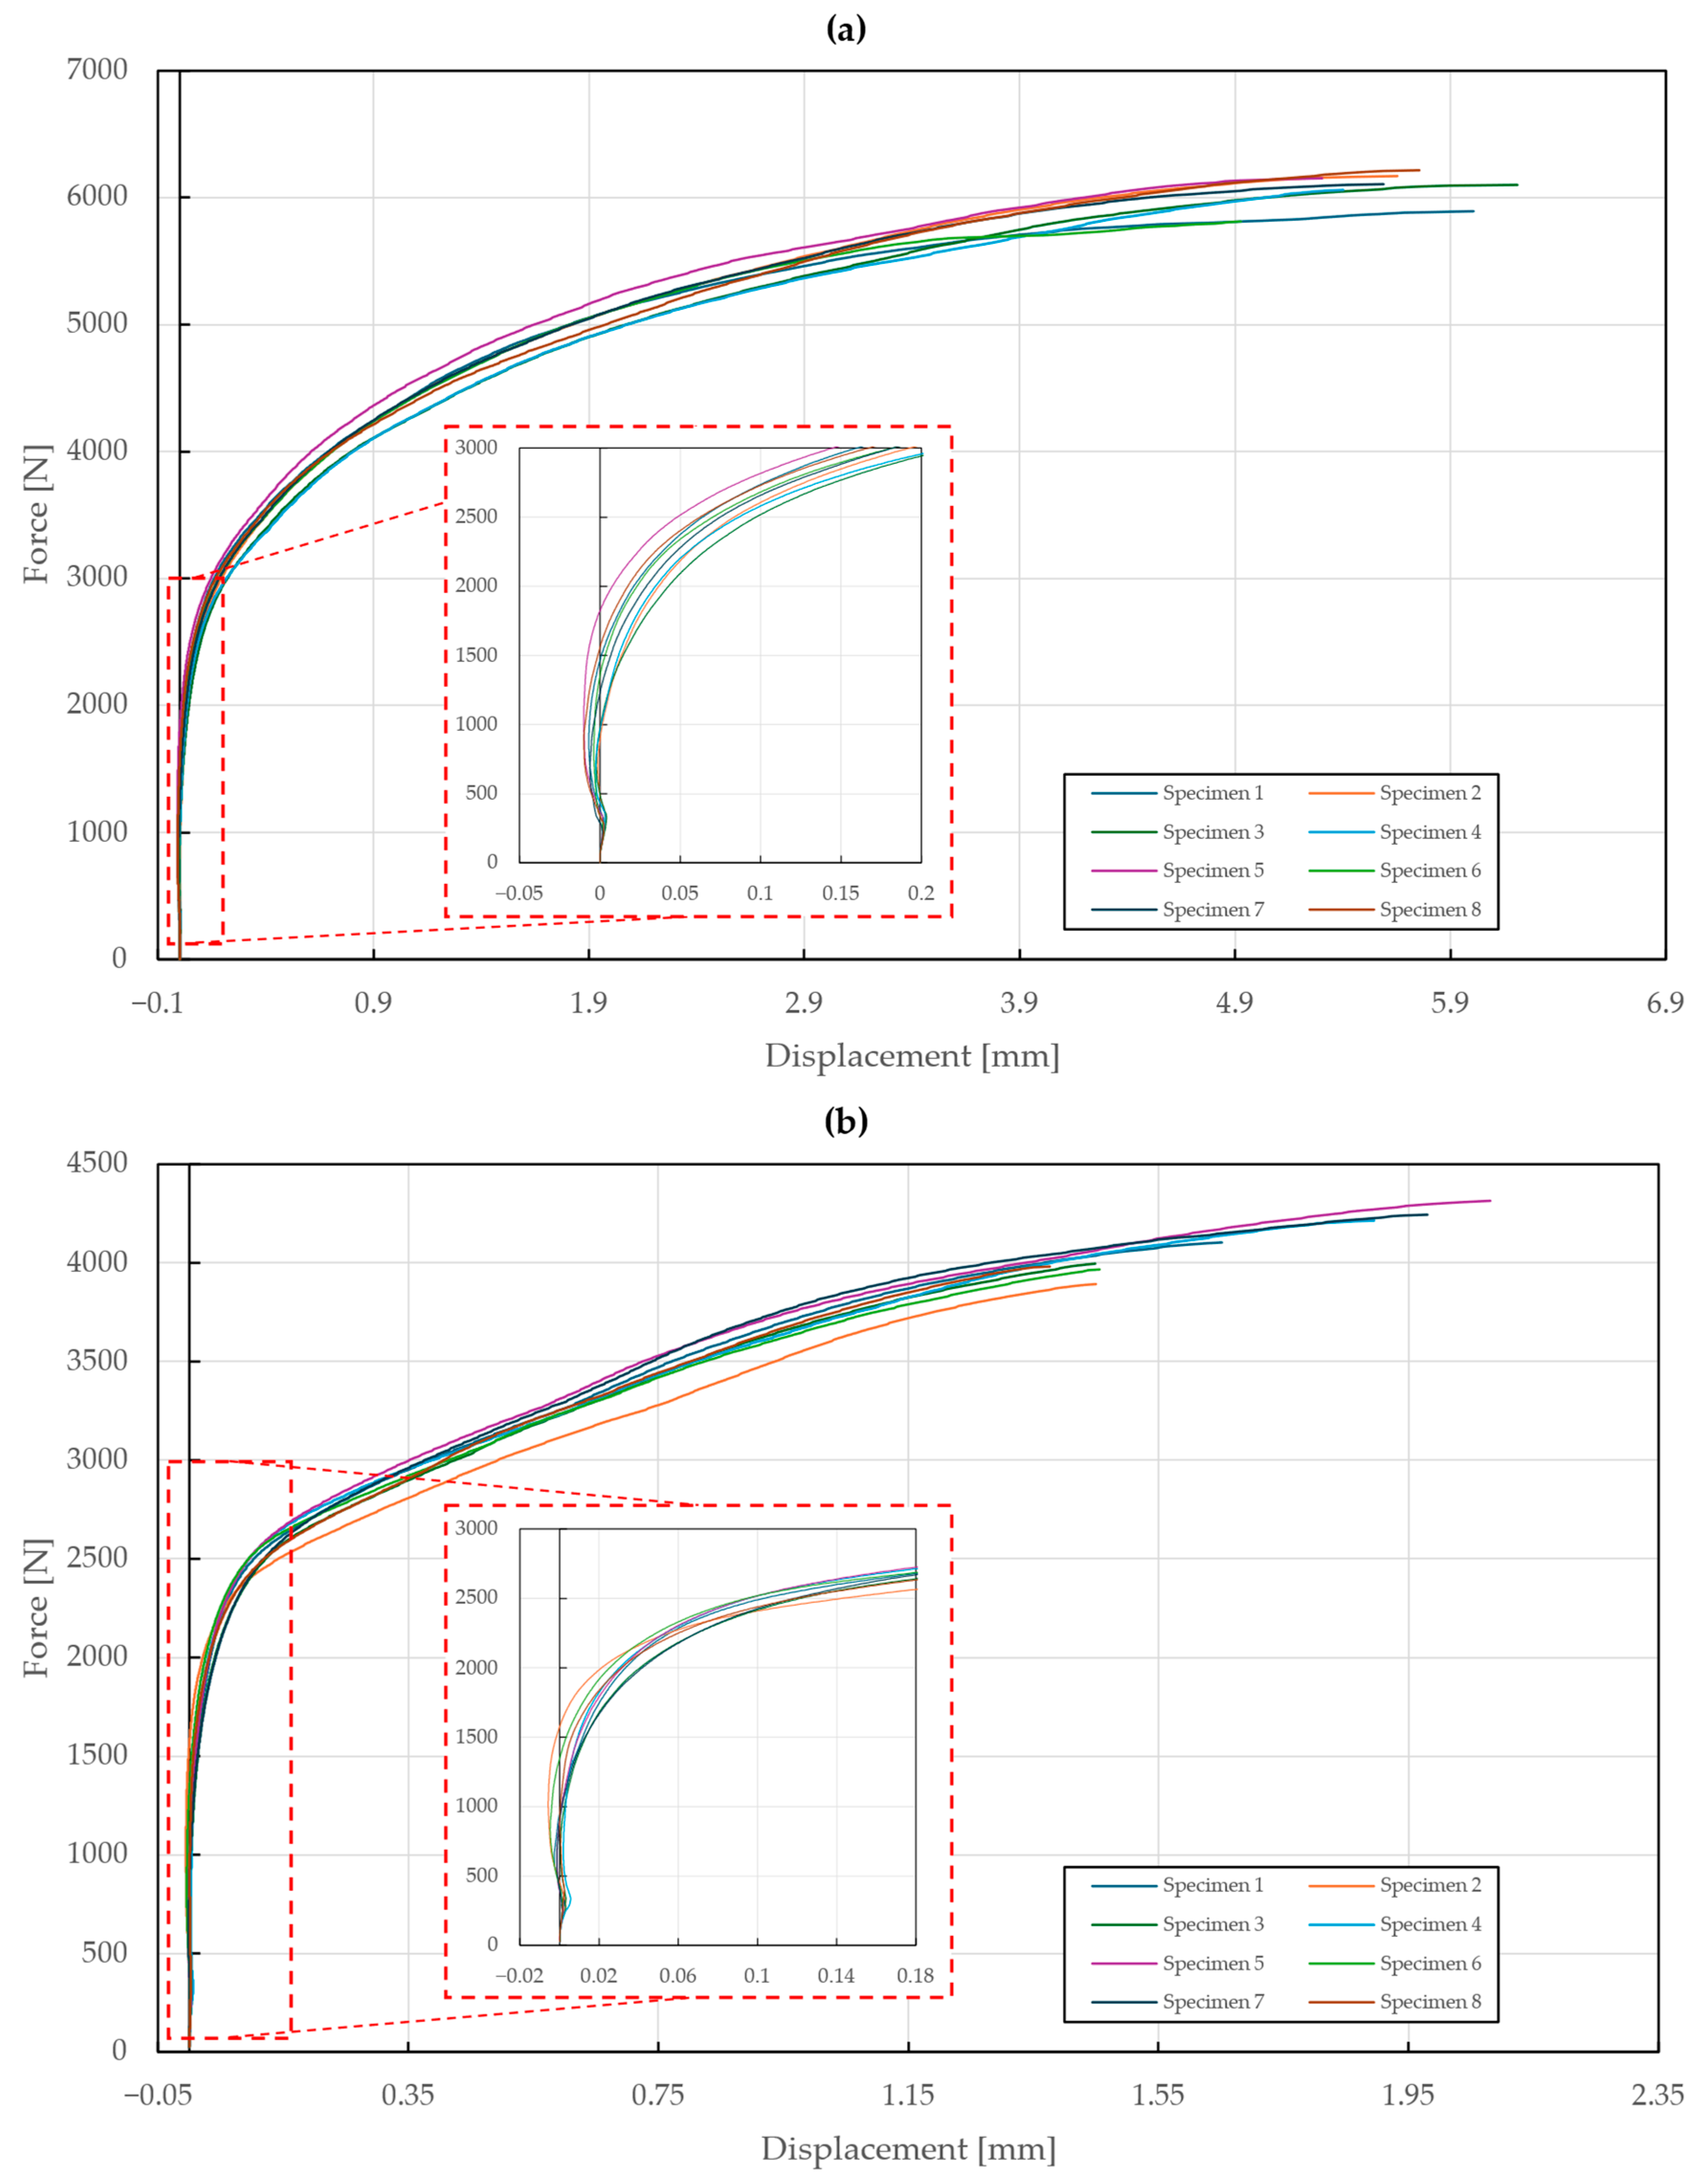
Figure 10.
Force–displacement diagram of double-lap shear tensile loading of T2 specimens: (a) stainless steel rivets DIN 7337—4.8 × 8 A2/A2; (b) galvanized carbon steel rivets DIN 7337—4.8 × 8 St/St.
Figure 10.
Force–displacement diagram of double-lap shear tensile loading of T2 specimens: (a) stainless steel rivets DIN 7337—4.8 × 8 A2/A2; (b) galvanized carbon steel rivets DIN 7337—4.8 × 8 St/St.
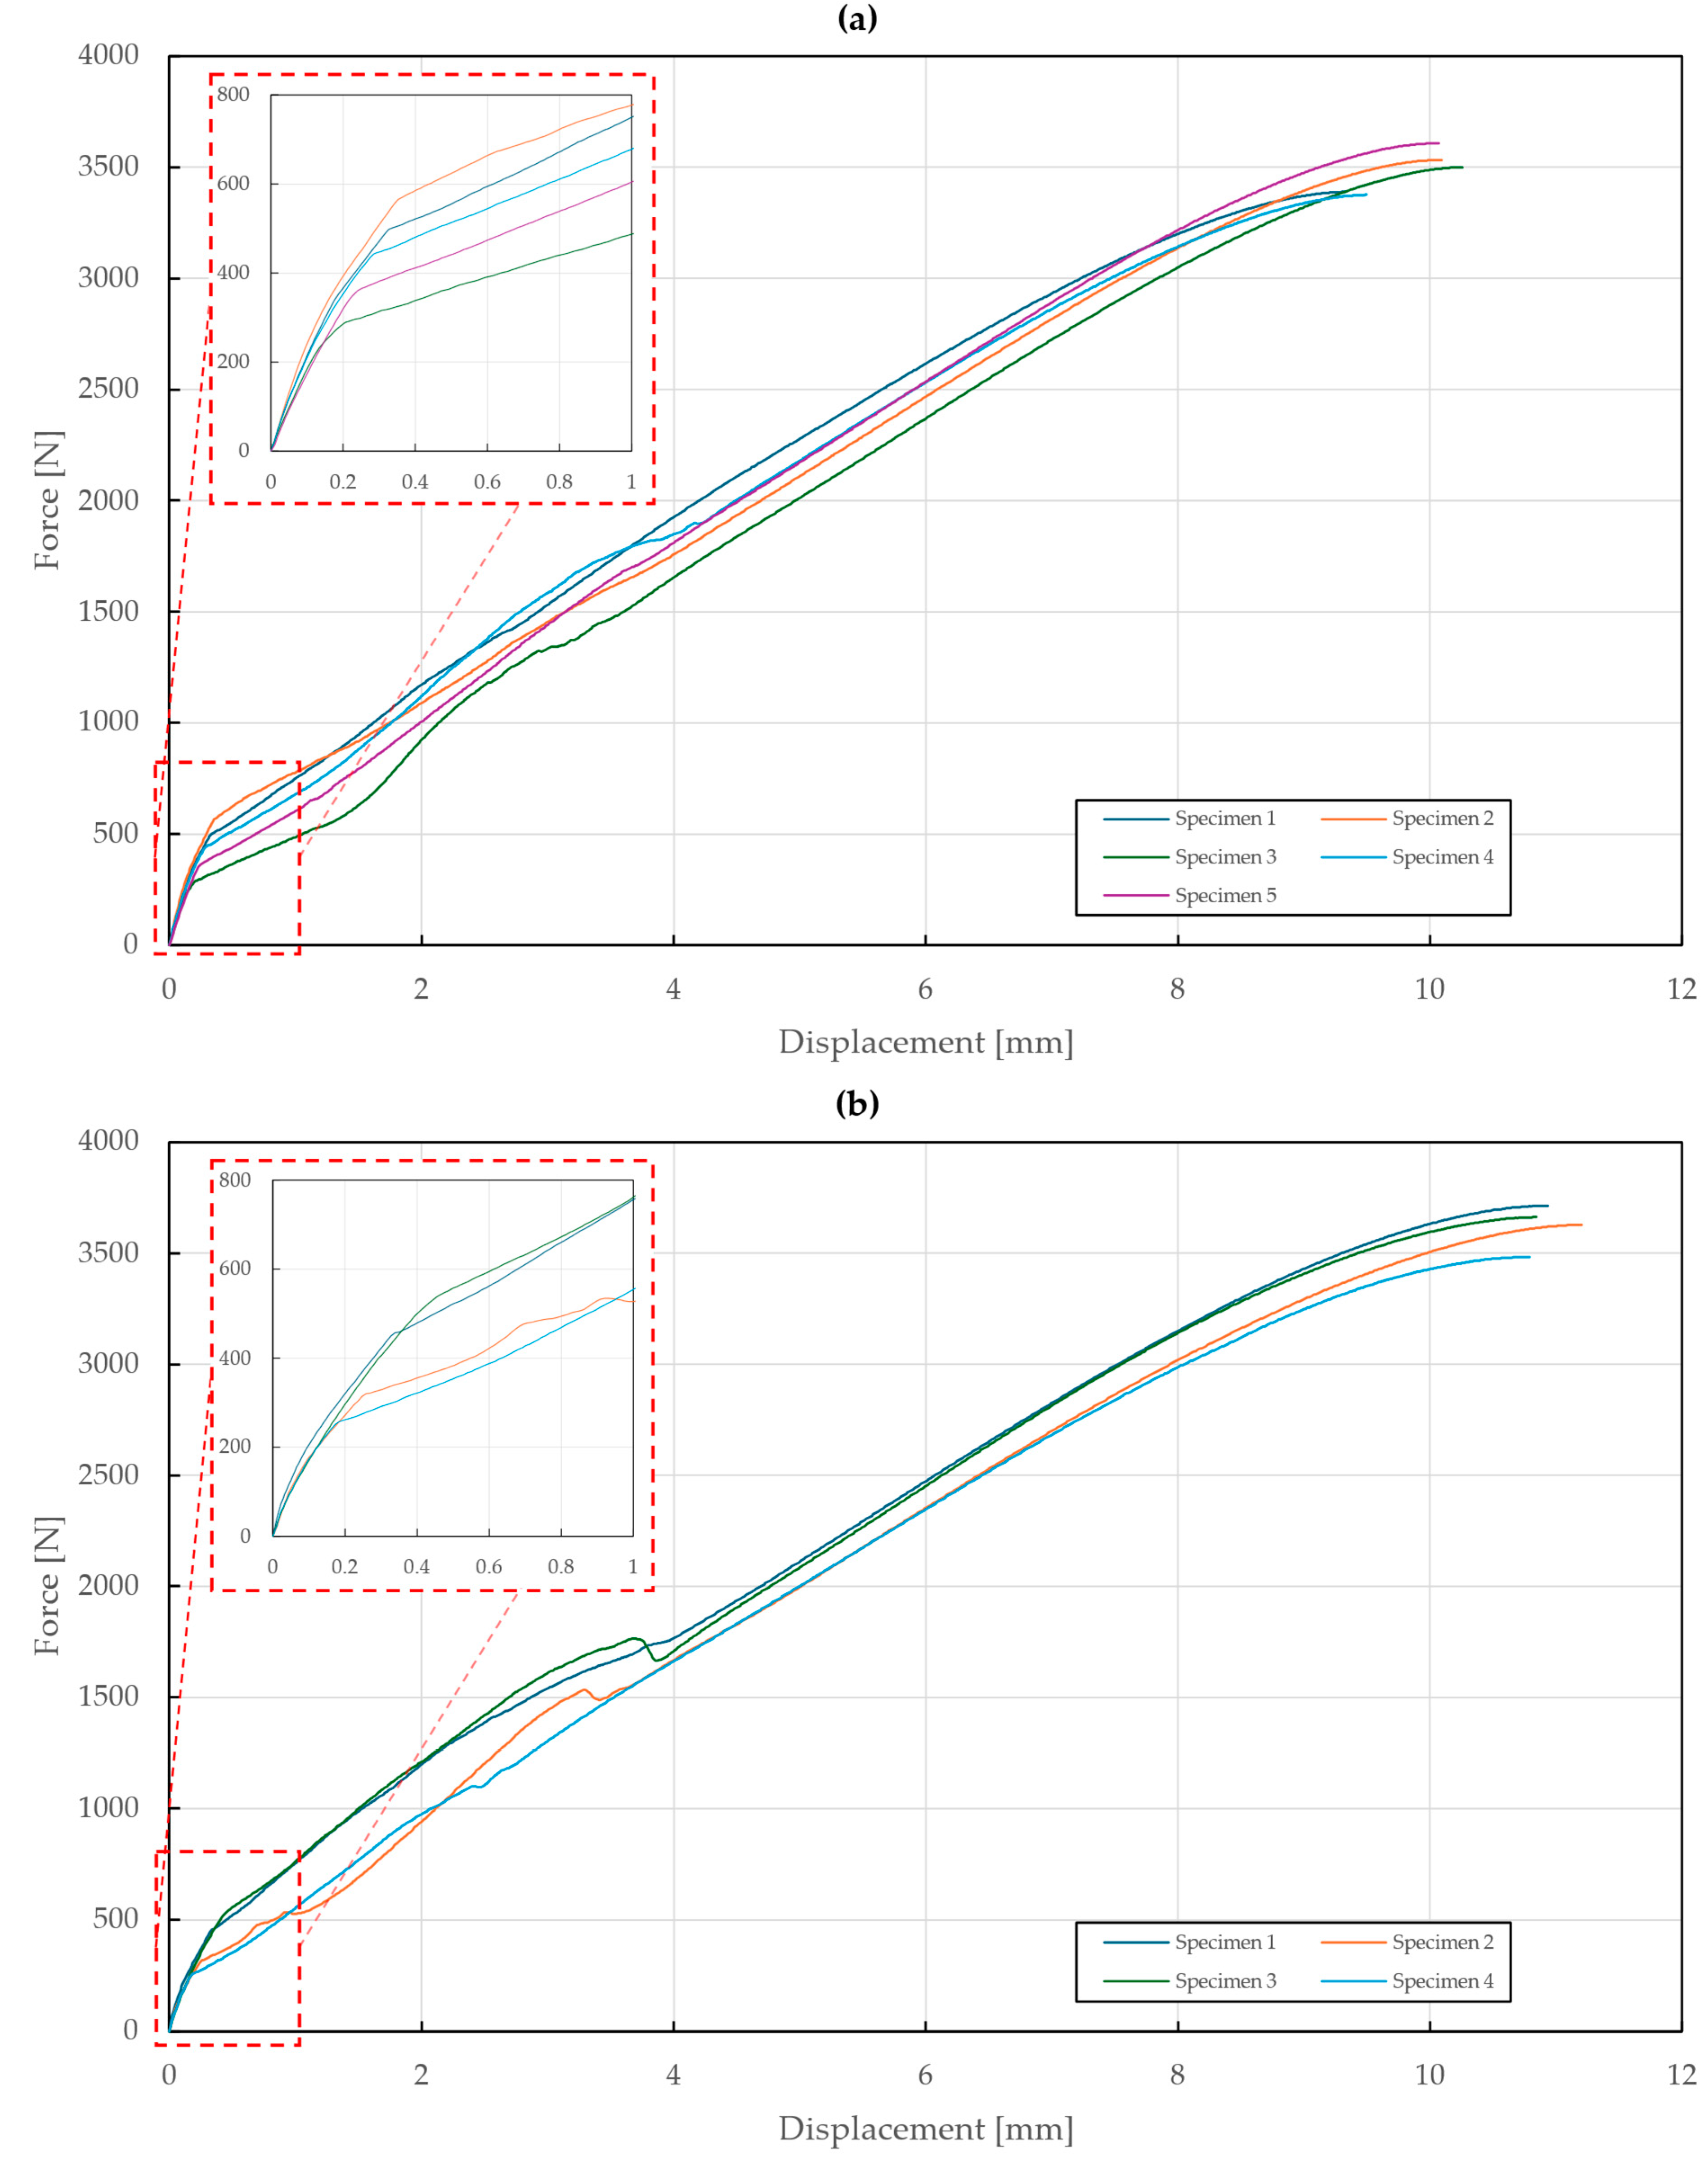
Figure 11.
Force–displacement diagram of pure normal tensile loading of T3 specimens ( mm): (a) stainless steel rivets DIN 7337—4.8 × 8 A2/A2; (b) galvanized carbon steel rivets DIN 7337—4.8 × 8 St/St.
Figure 11.
Force–displacement diagram of pure normal tensile loading of T3 specimens ( mm): (a) stainless steel rivets DIN 7337—4.8 × 8 A2/A2; (b) galvanized carbon steel rivets DIN 7337—4.8 × 8 St/St.
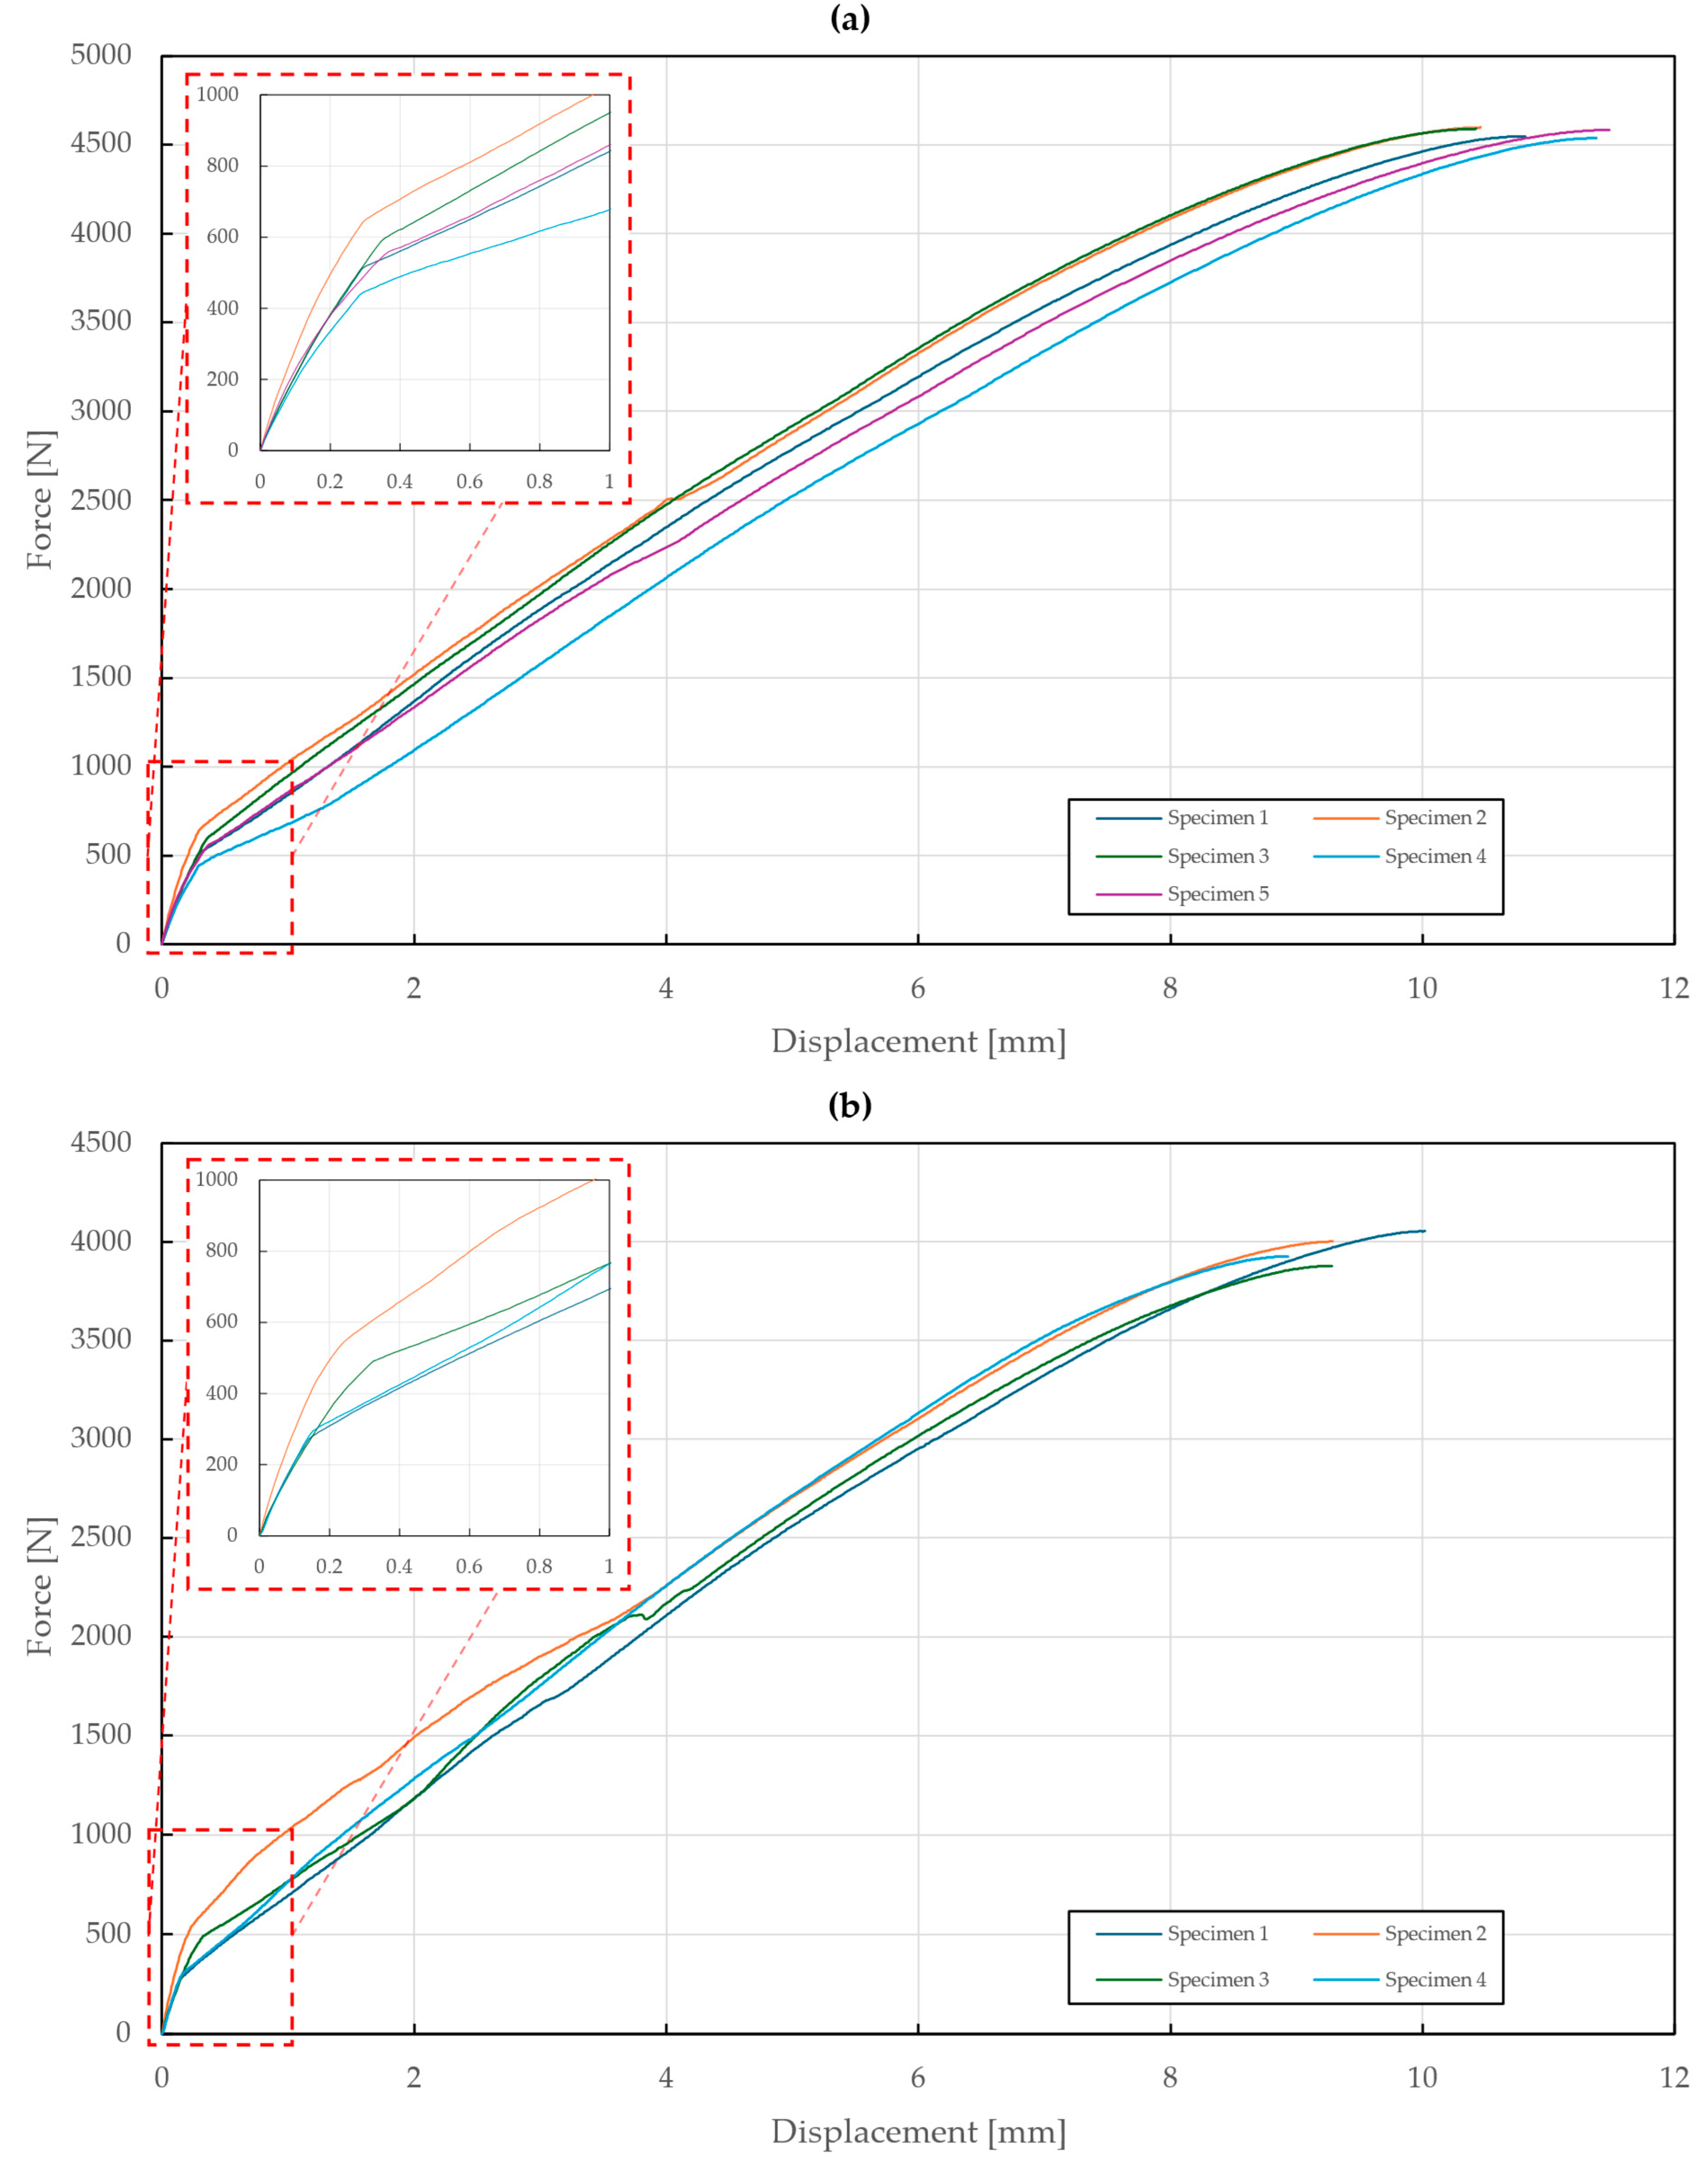
Figure 12.
Force–displacement diagram of pure normal tensile loading of T3 specimens ( mm): (a) stainless steel rivets DIN 7337—4.8 × 8 A2/A2; (b) galvanized carbon steel rivets DIN 7337—4.8 × 8 St/St.
Figure 12.
Force–displacement diagram of pure normal tensile loading of T3 specimens ( mm): (a) stainless steel rivets DIN 7337—4.8 × 8 A2/A2; (b) galvanized carbon steel rivets DIN 7337—4.8 × 8 St/St.
Figure 13.
Force–displacement diagram of pure normal tensile loading of T3 specimens ( mm): (a) stainless steel rivets DIN 7337—4.8 × 8 A2/A2; (b) galvanized carbon steel rivets DIN 7337—4.8 × 8 St/St.
Figure 13.
Force–displacement diagram of pure normal tensile loading of T3 specimens ( mm): (a) stainless steel rivets DIN 7337—4.8 × 8 A2/A2; (b) galvanized carbon steel rivets DIN 7337—4.8 × 8 St/St.
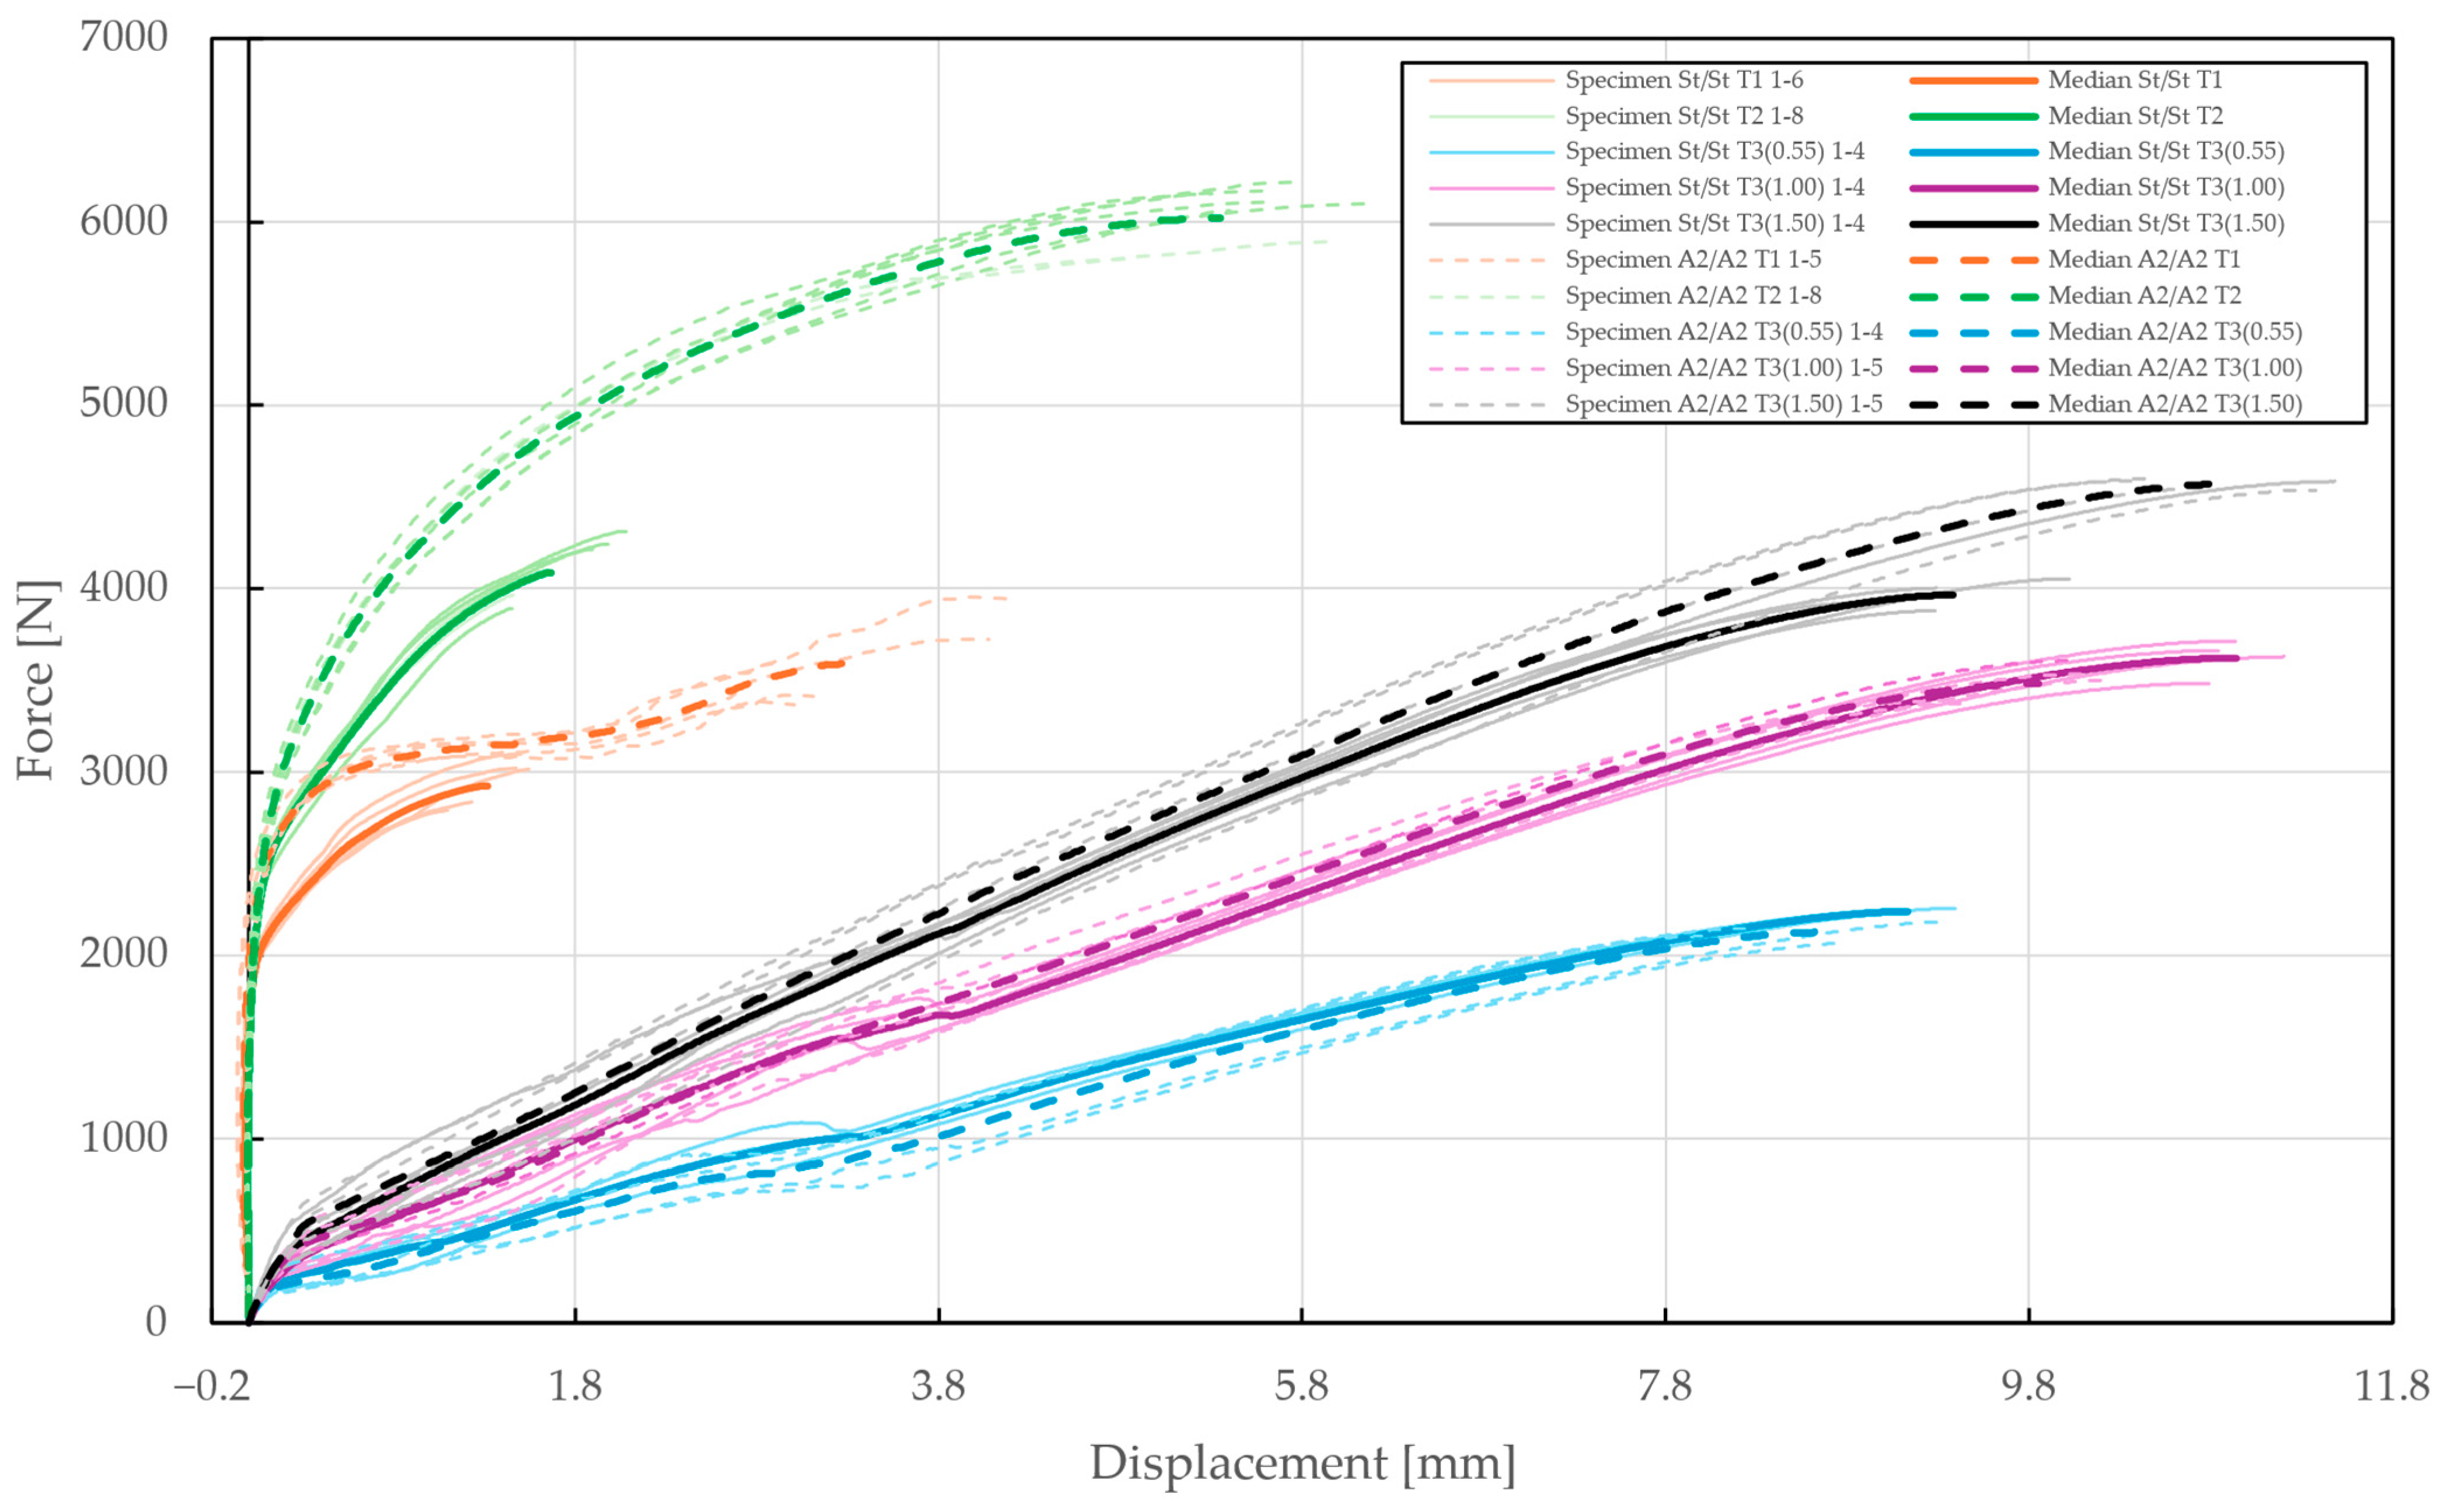
Figure 14.
Force–displacement diagram of single-lap shear (T1), double-lap shear (T2), and pure normal loadings (T3) of specimens riveted with DIN 7337—4.8 × 8 A2/A2 and St/St blind rivets.
Figure 14.
Force–displacement diagram of single-lap shear (T1), double-lap shear (T2), and pure normal loadings (T3) of specimens riveted with DIN 7337—4.8 × 8 A2/A2 and St/St blind rivets.
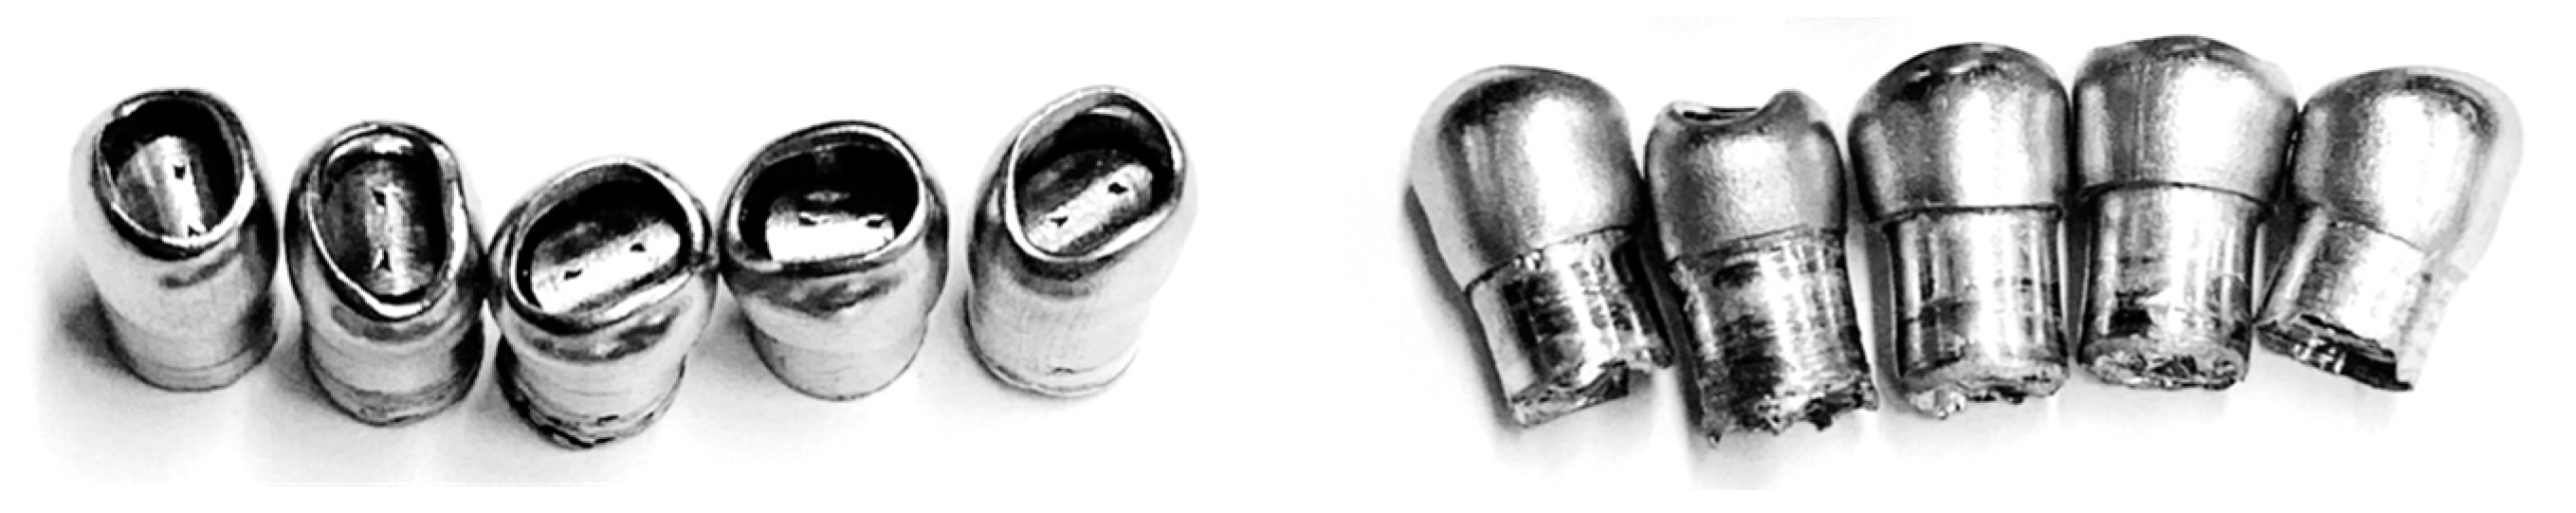
Figure 15.
Blind rivets destructed during experimental testing.
Figure 15.
Blind rivets destructed during experimental testing.
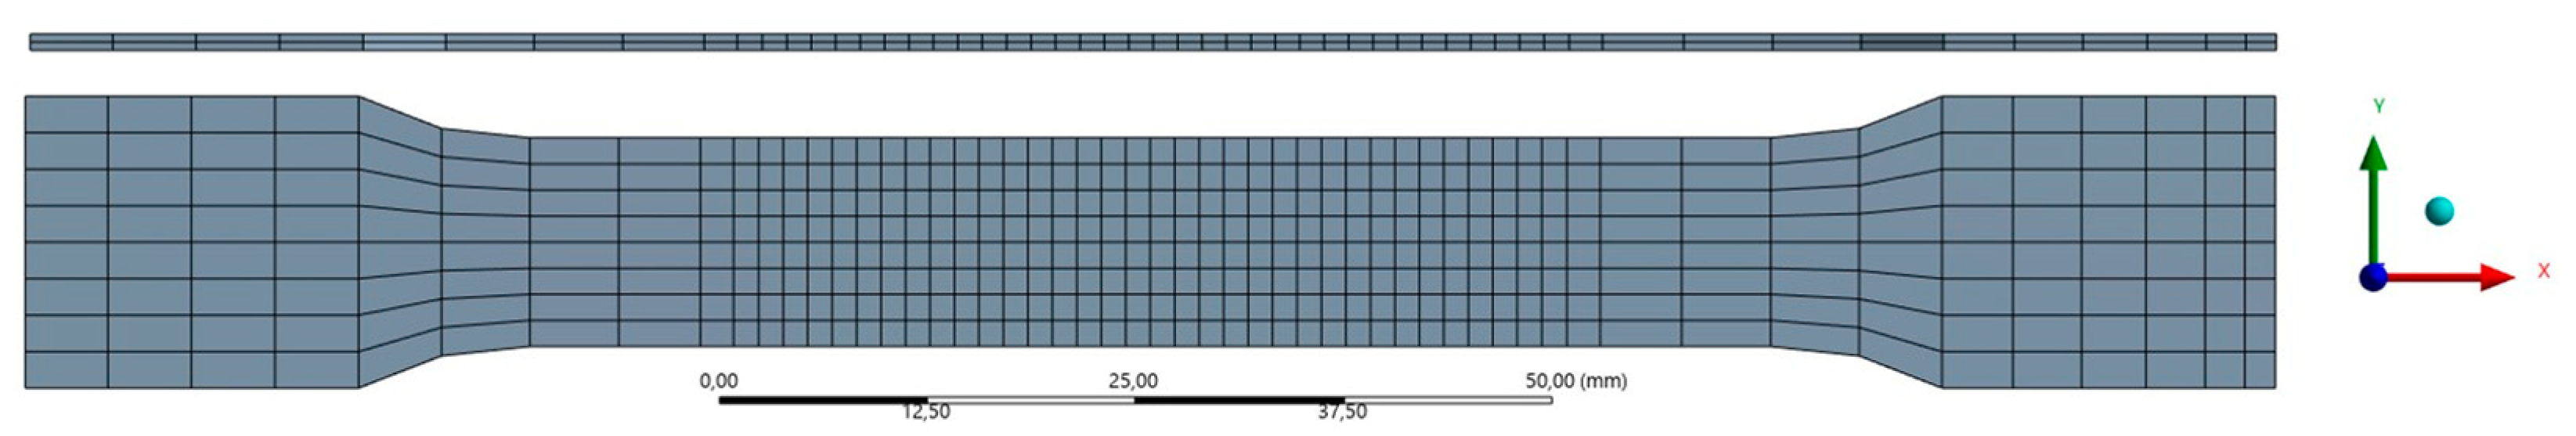
Figure 16.
Finite element model of the steel sheet specimens.
Figure 16.
Finite element model of the steel sheet specimens.
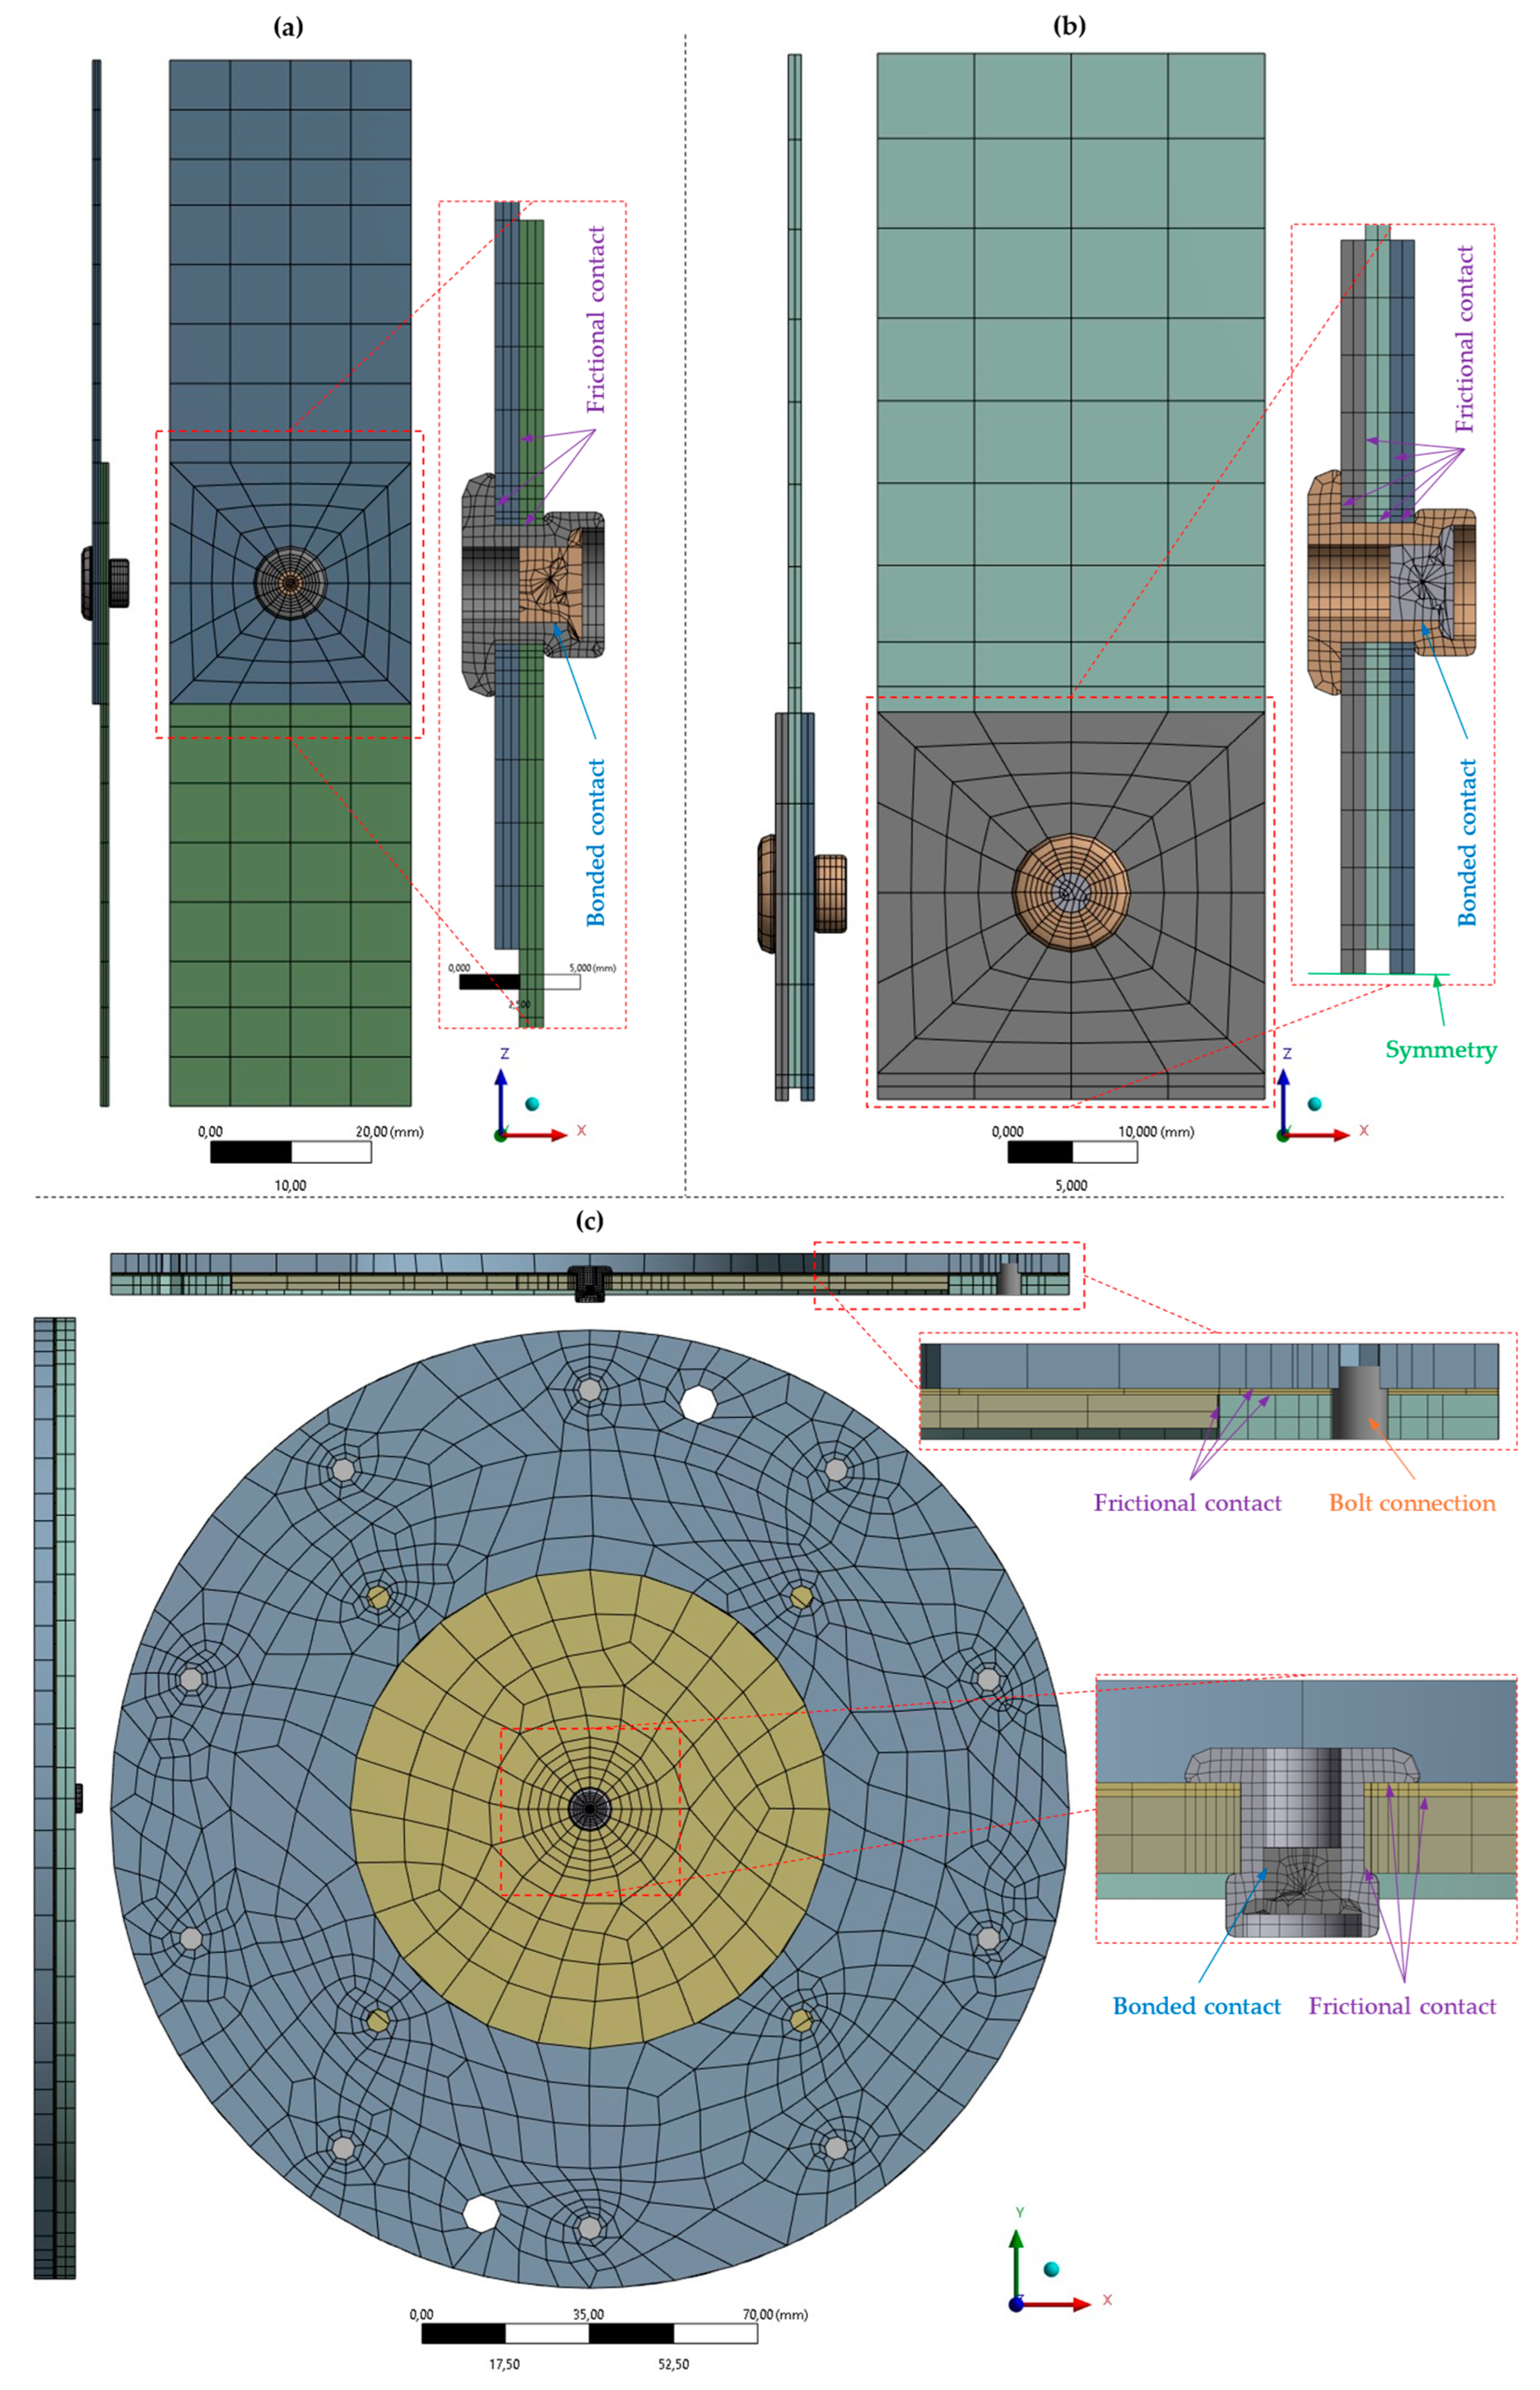
Figure 17.
Finite element model of riveted specimens: (a) T1 specimen for single-lap shear loading; (b) T2 specimen for double-lap shear loading; and (c) T3 specimen for pure normal loading of rivet joint.
Figure 17.
Finite element model of riveted specimens: (a) T1 specimen for single-lap shear loading; (b) T2 specimen for double-lap shear loading; and (c) T3 specimen for pure normal loading of rivet joint.
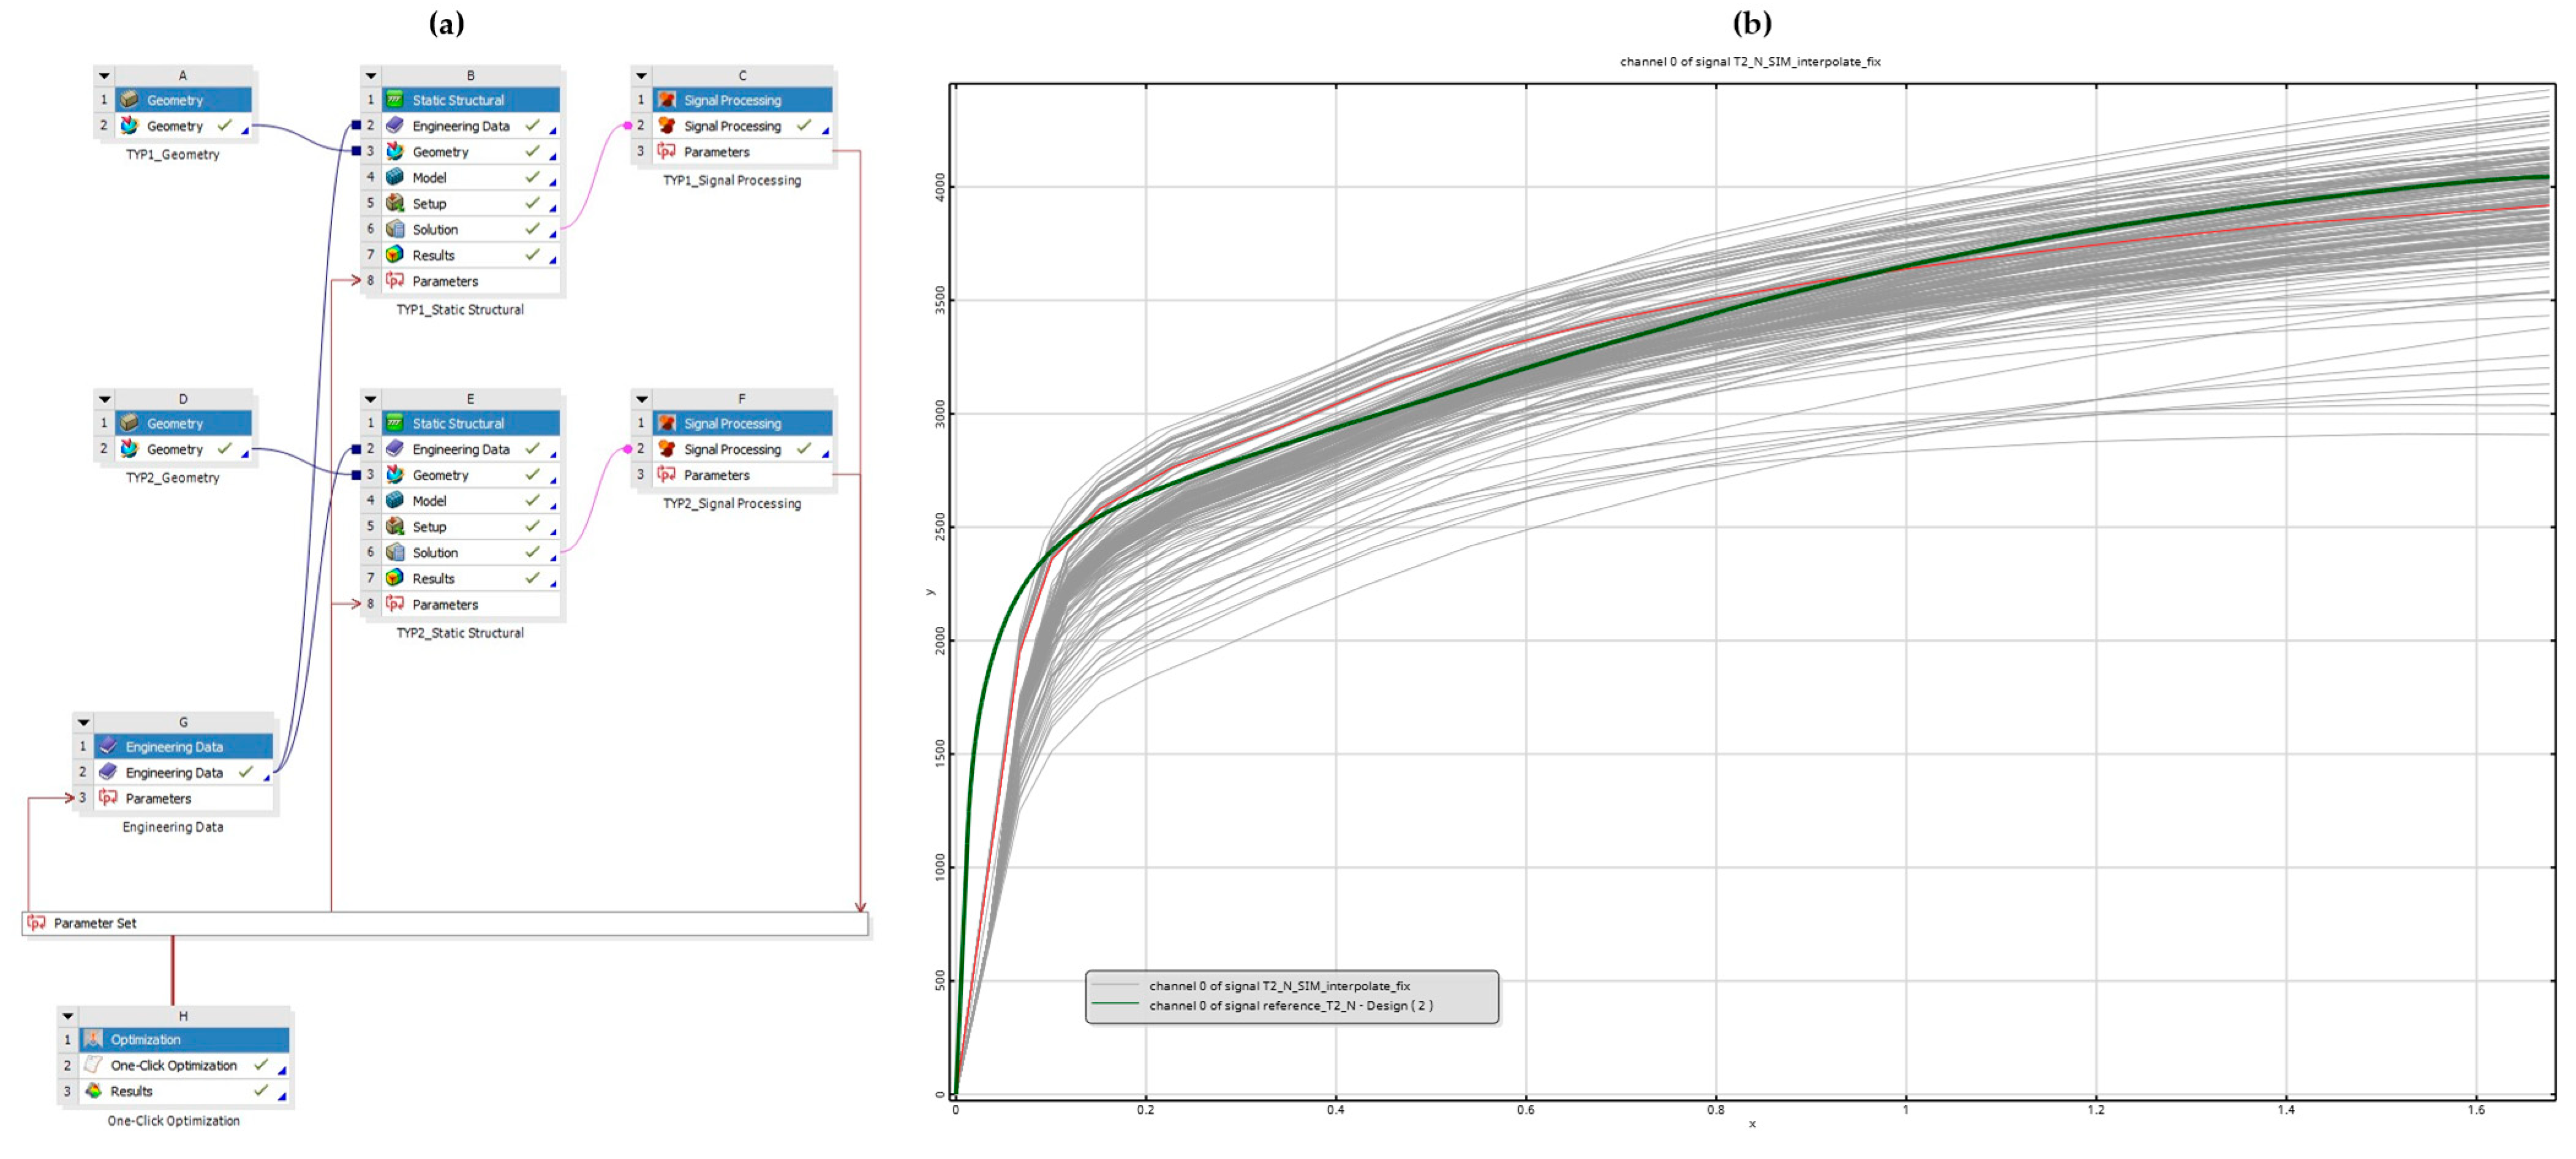
Figure 18.
Overview of the numerical simulation’s fitting: (a) parametrized FE model with automated post-processing of two parallel simulations; (b) model calibration of double-lap shear T2 specimen (green is the reference force–displacement curve from the experiment).
Figure 18.
Overview of the numerical simulation’s fitting: (a) parametrized FE model with automated post-processing of two parallel simulations; (b) model calibration of double-lap shear T2 specimen (green is the reference force–displacement curve from the experiment).
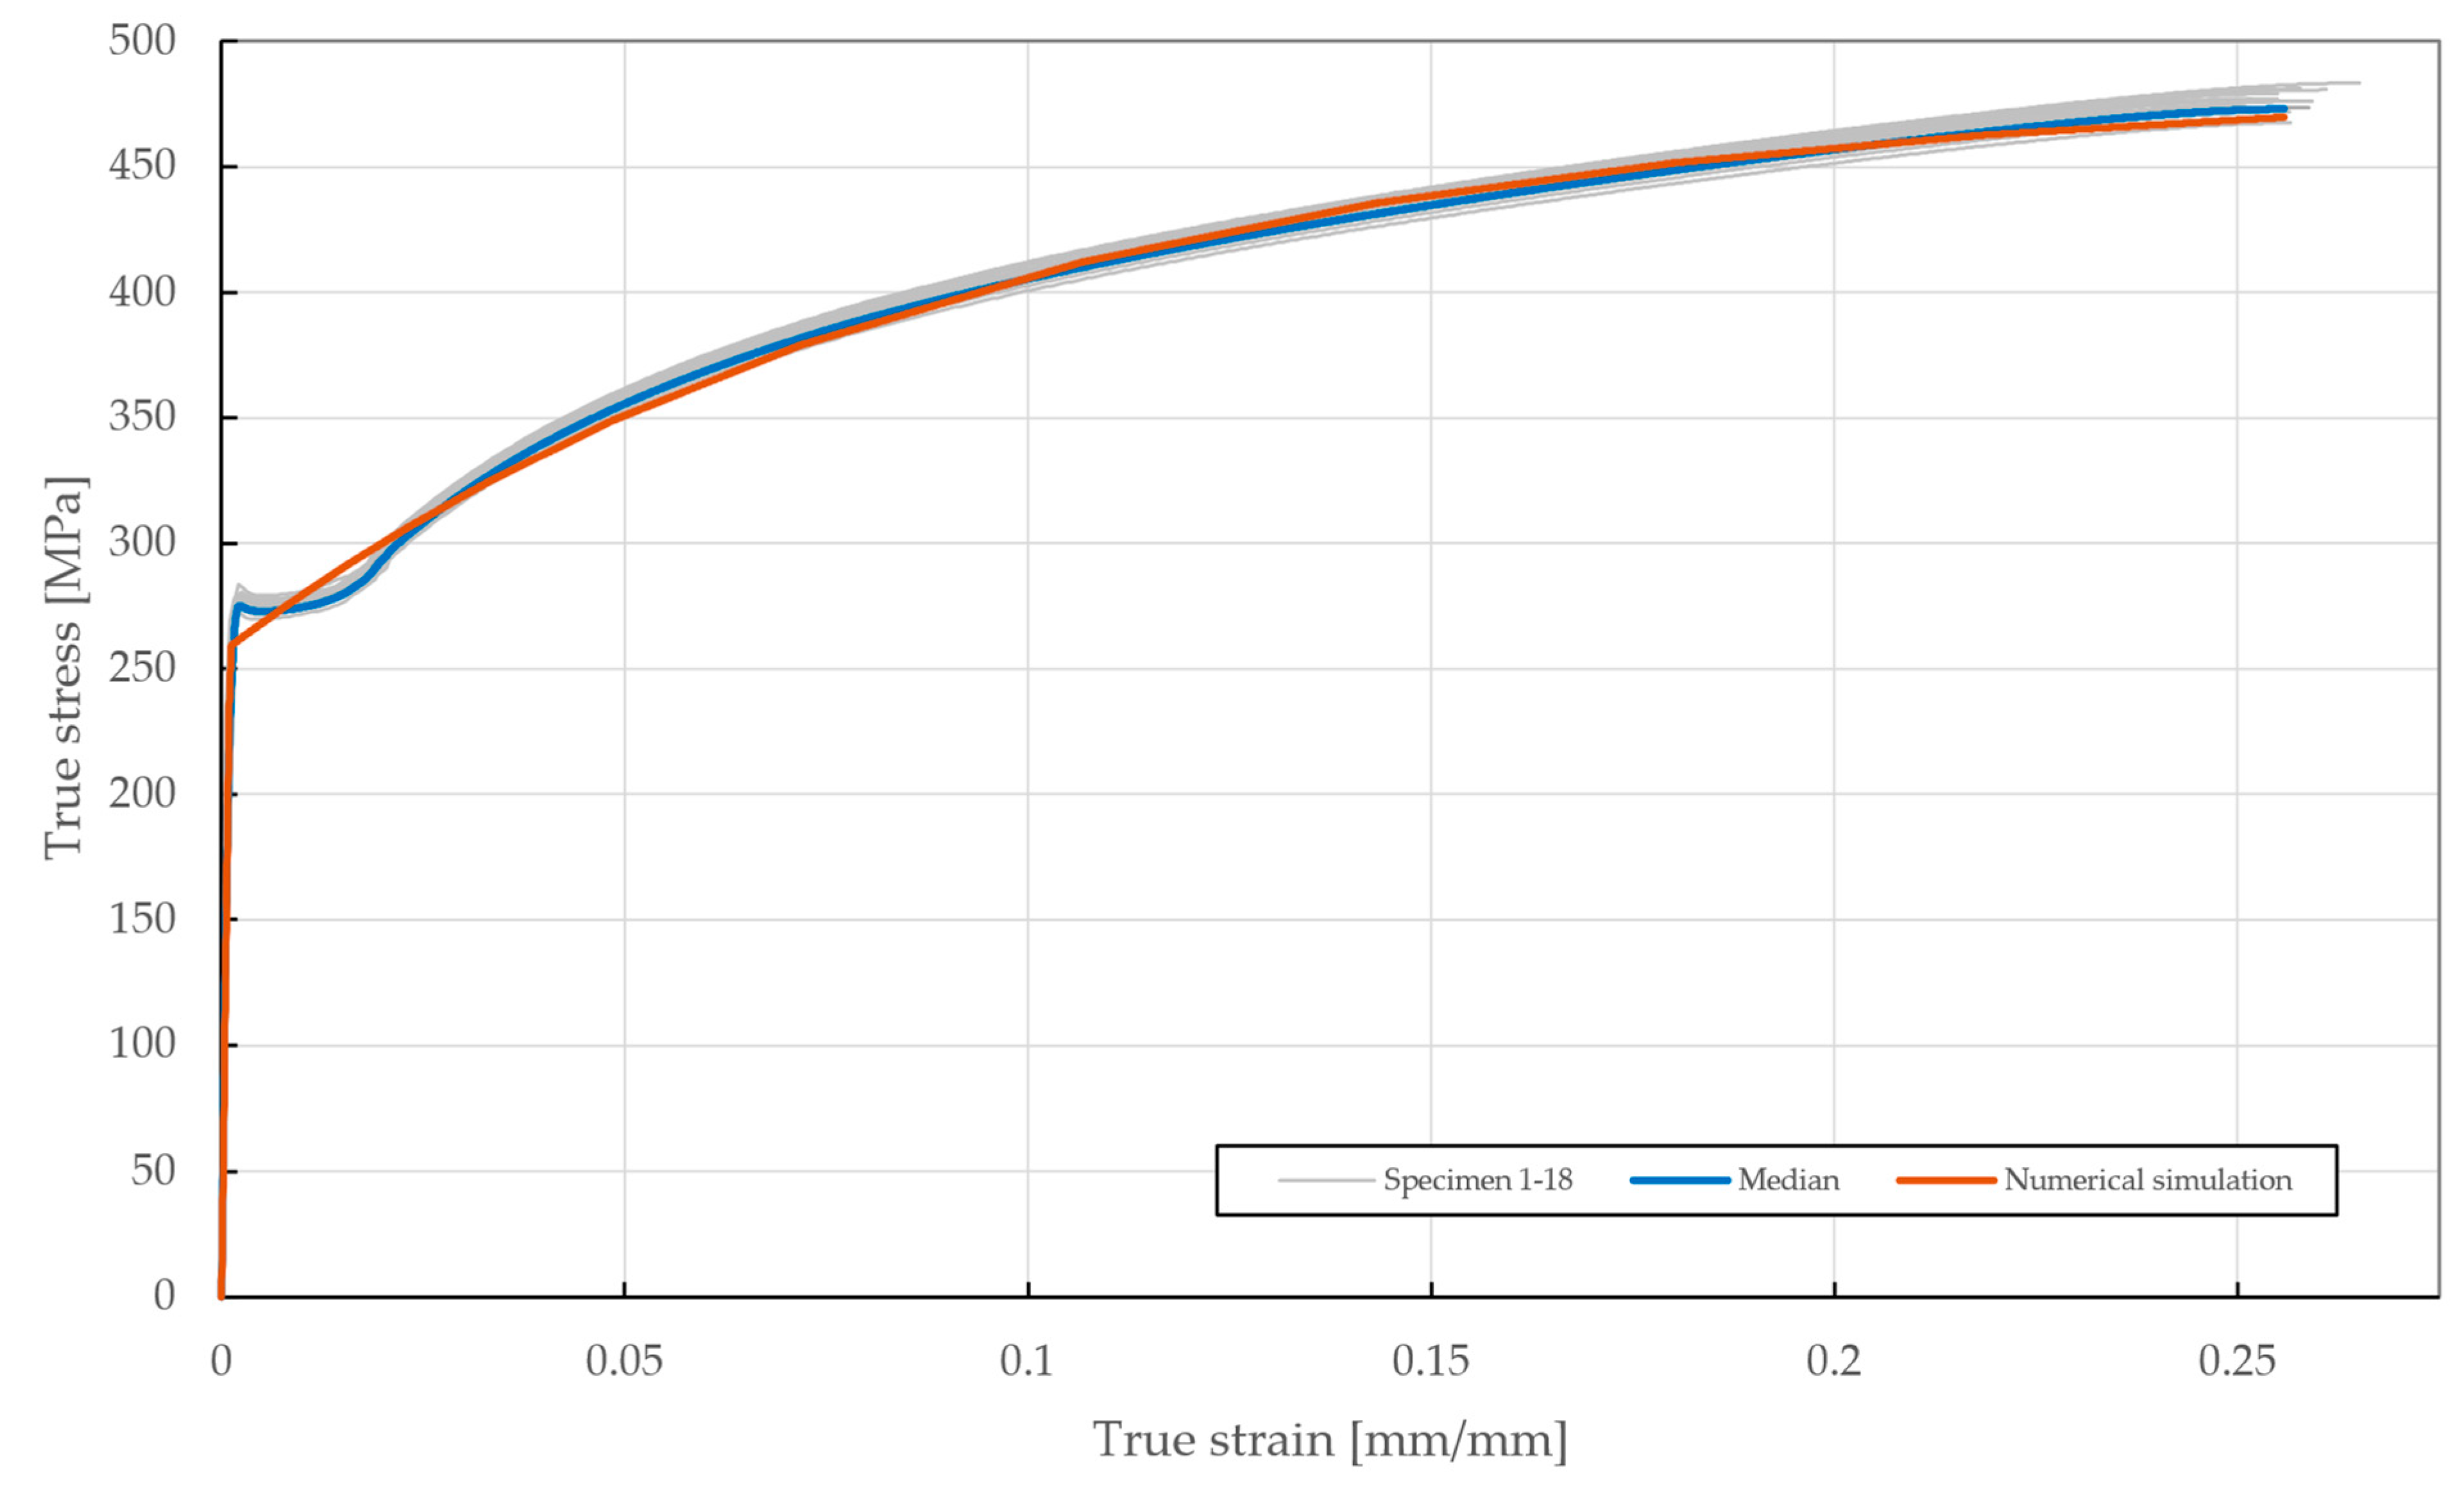
Figure 19.
True stress–strain curve of the DX51D + Z275 steel sheet specimen experimentally tested according to EN ISO 6892-1 and the results of the fitted non-linear numerical simulation.
Figure 19.
True stress–strain curve of the DX51D + Z275 steel sheet specimen experimentally tested according to EN ISO 6892-1 and the results of the fitted non-linear numerical simulation.
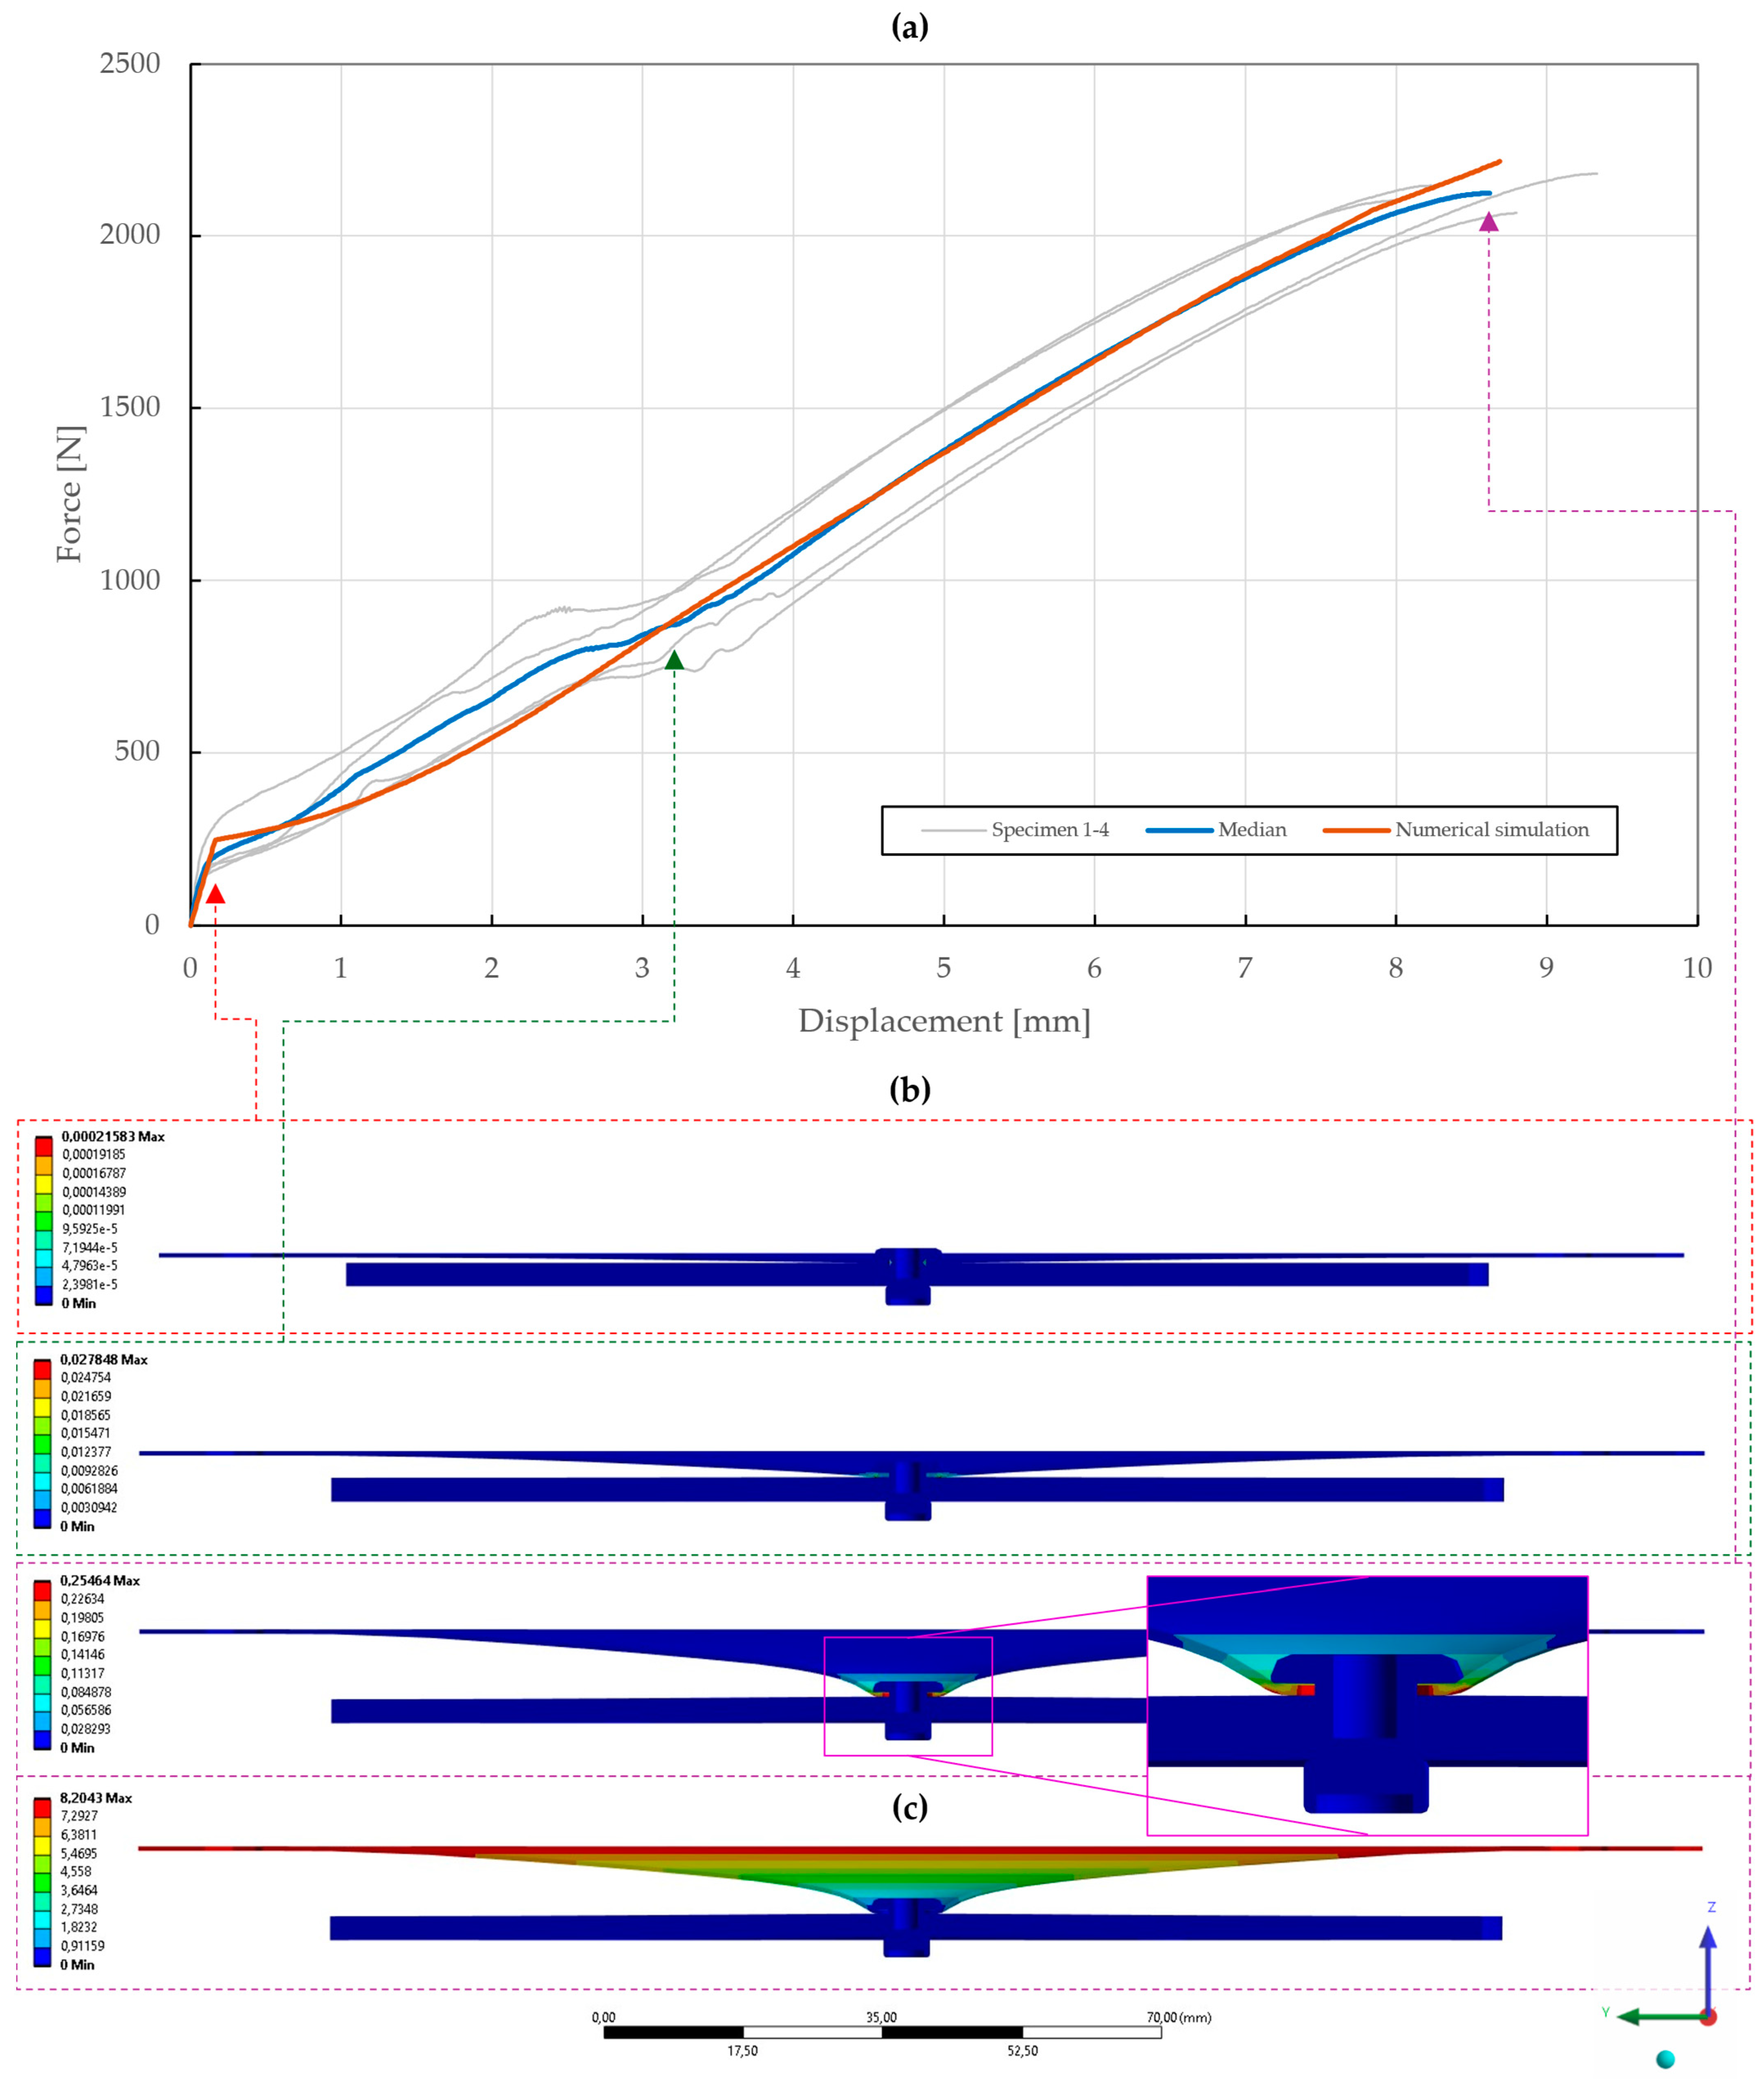
Figure 20.
Force–displacement curve of single-lap shear T1 specimen riveted with DIN 7337—4.8 × 8 A2/A2 blind rivet and the results of its fitted non-linear numerical simulation: (a) force–displacement curve; (b) deformation after experimental tensile testing; (c) results of equivalent plastic strain from numerical simulation [mm/mm]; (d) results of total deformation from numerical simulation [mm].
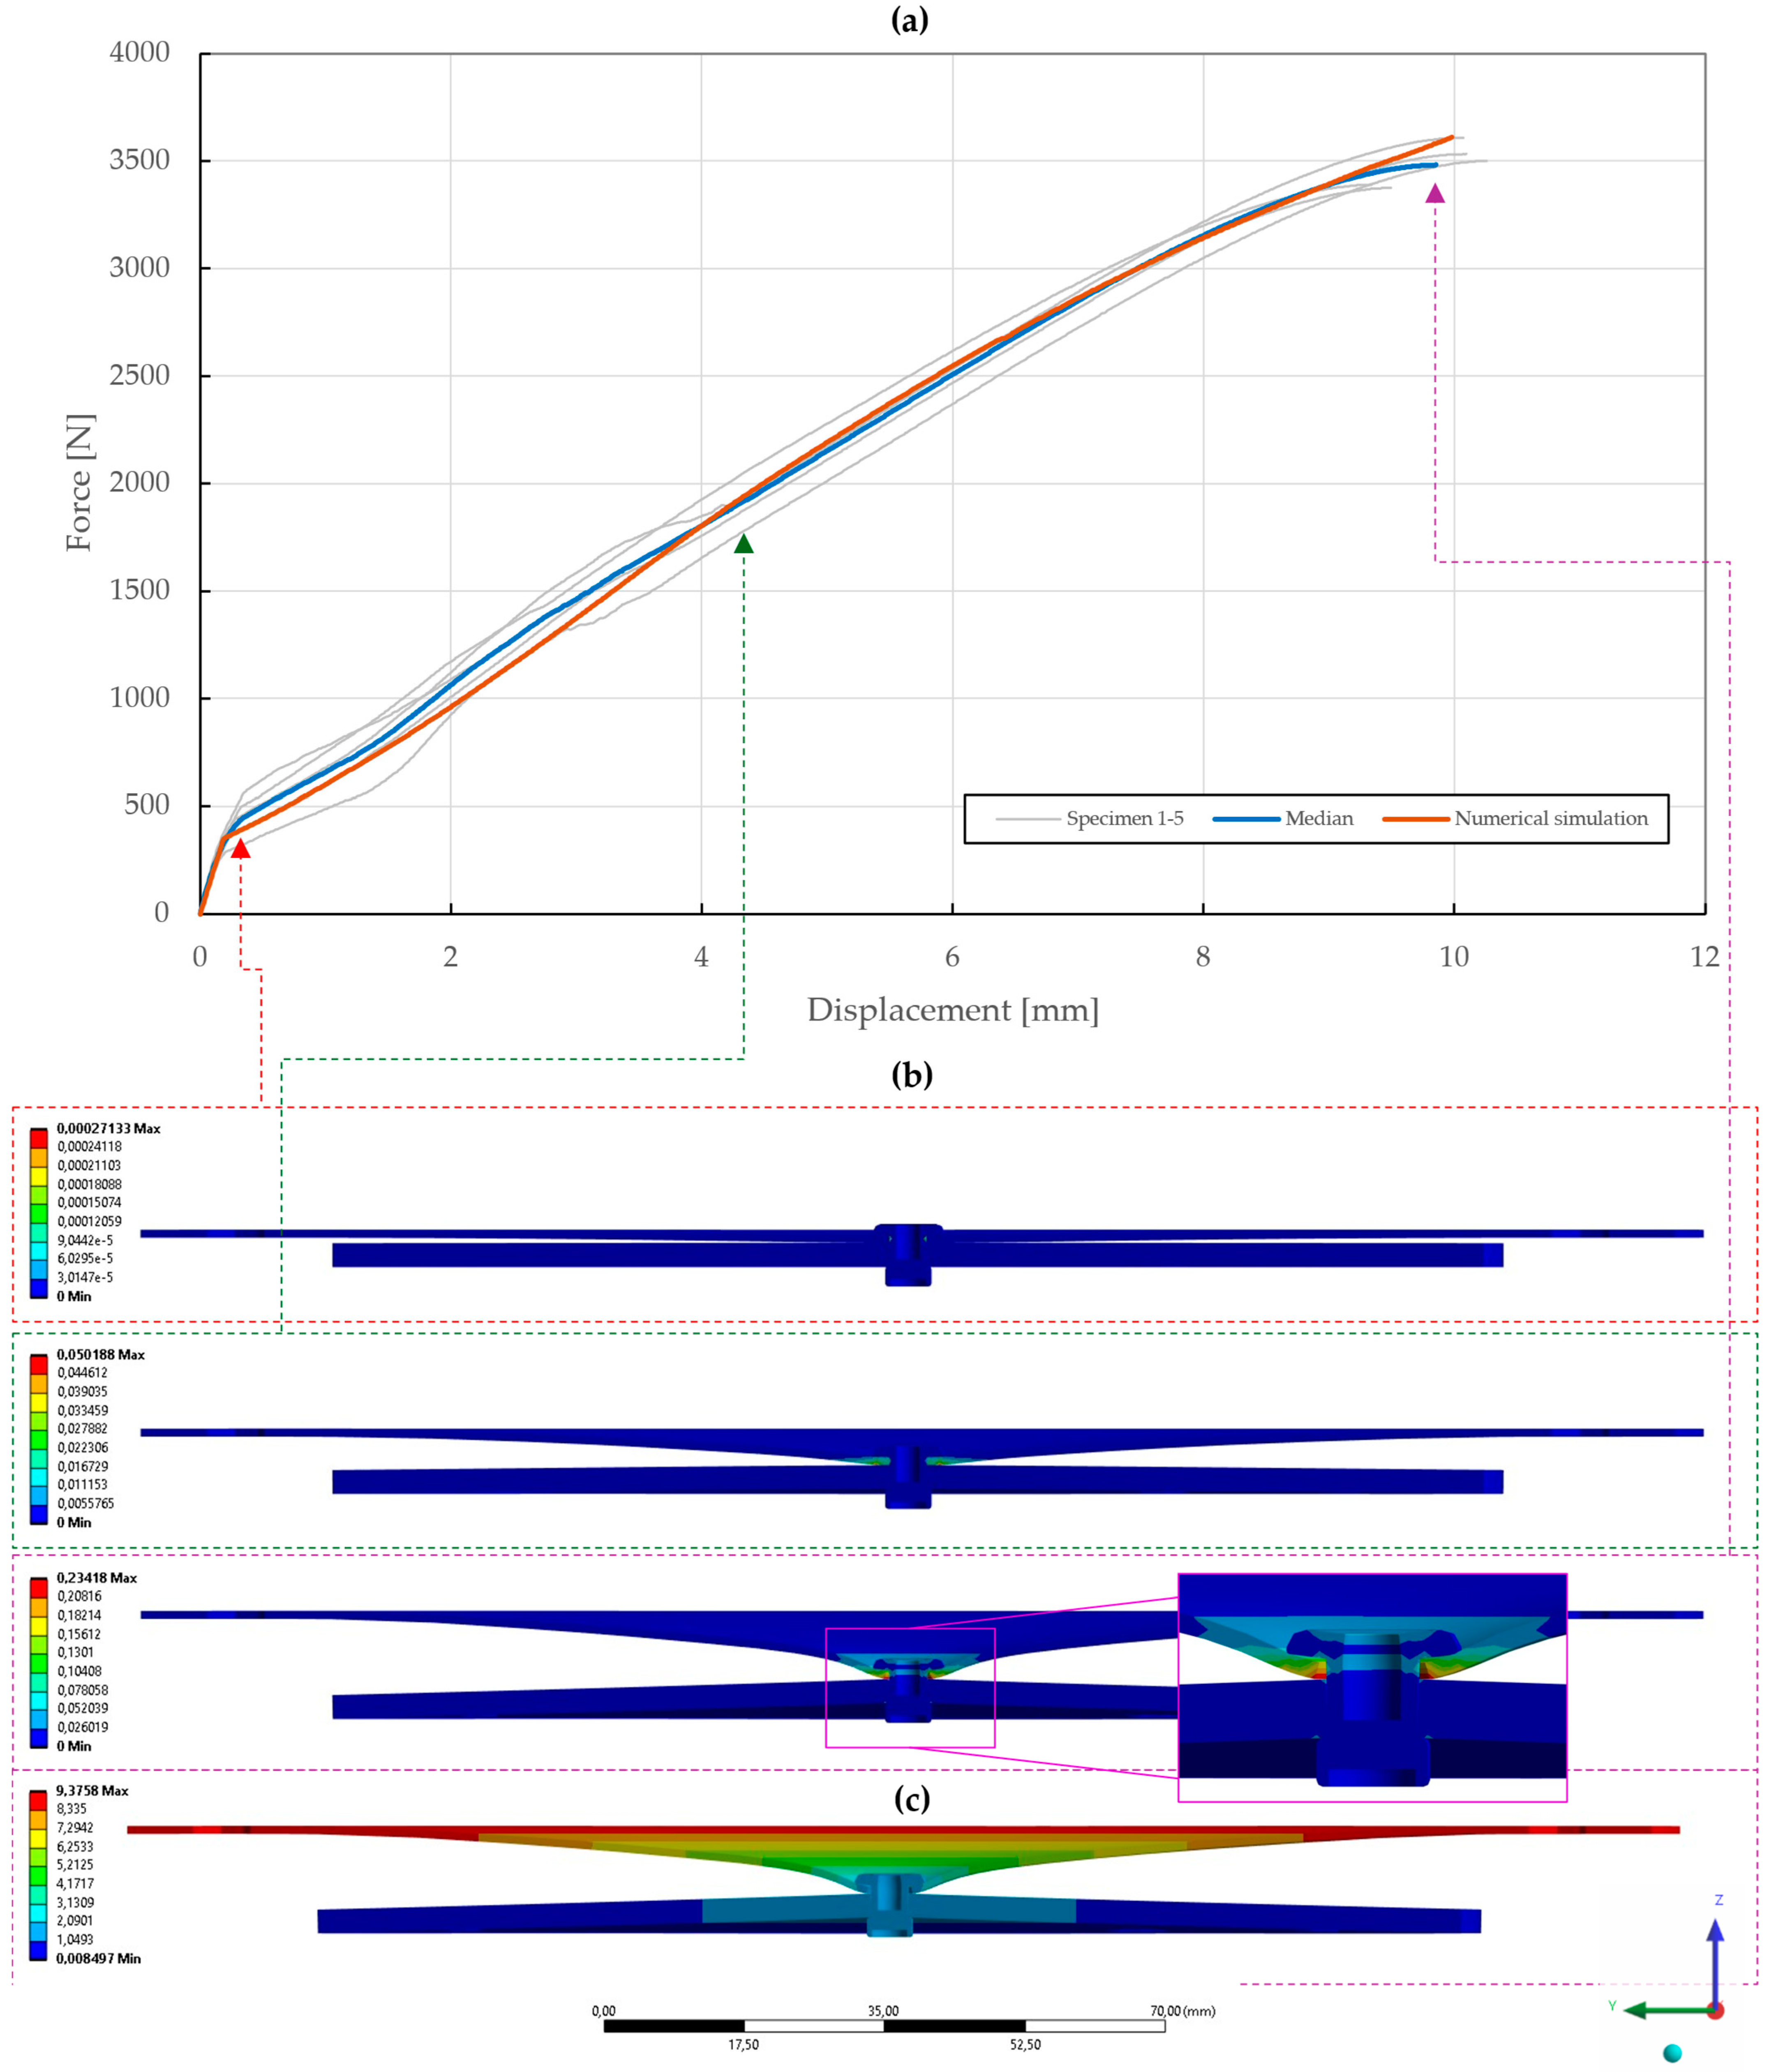
Figure 21.
Force–displacement curve of double-lap shear T2 specimen riveted with DIN 7337—4.8 × 8 A2/A2 blind rivet and the results of its fitted non-linear numerical simulation: (a) force–displacement curve; (b) deformation after experimental tensile testing; (c) results of equivalent plastic strain from numerical simulation [mm/mm]; (d) results of total deformation from numerical simulation [mm].
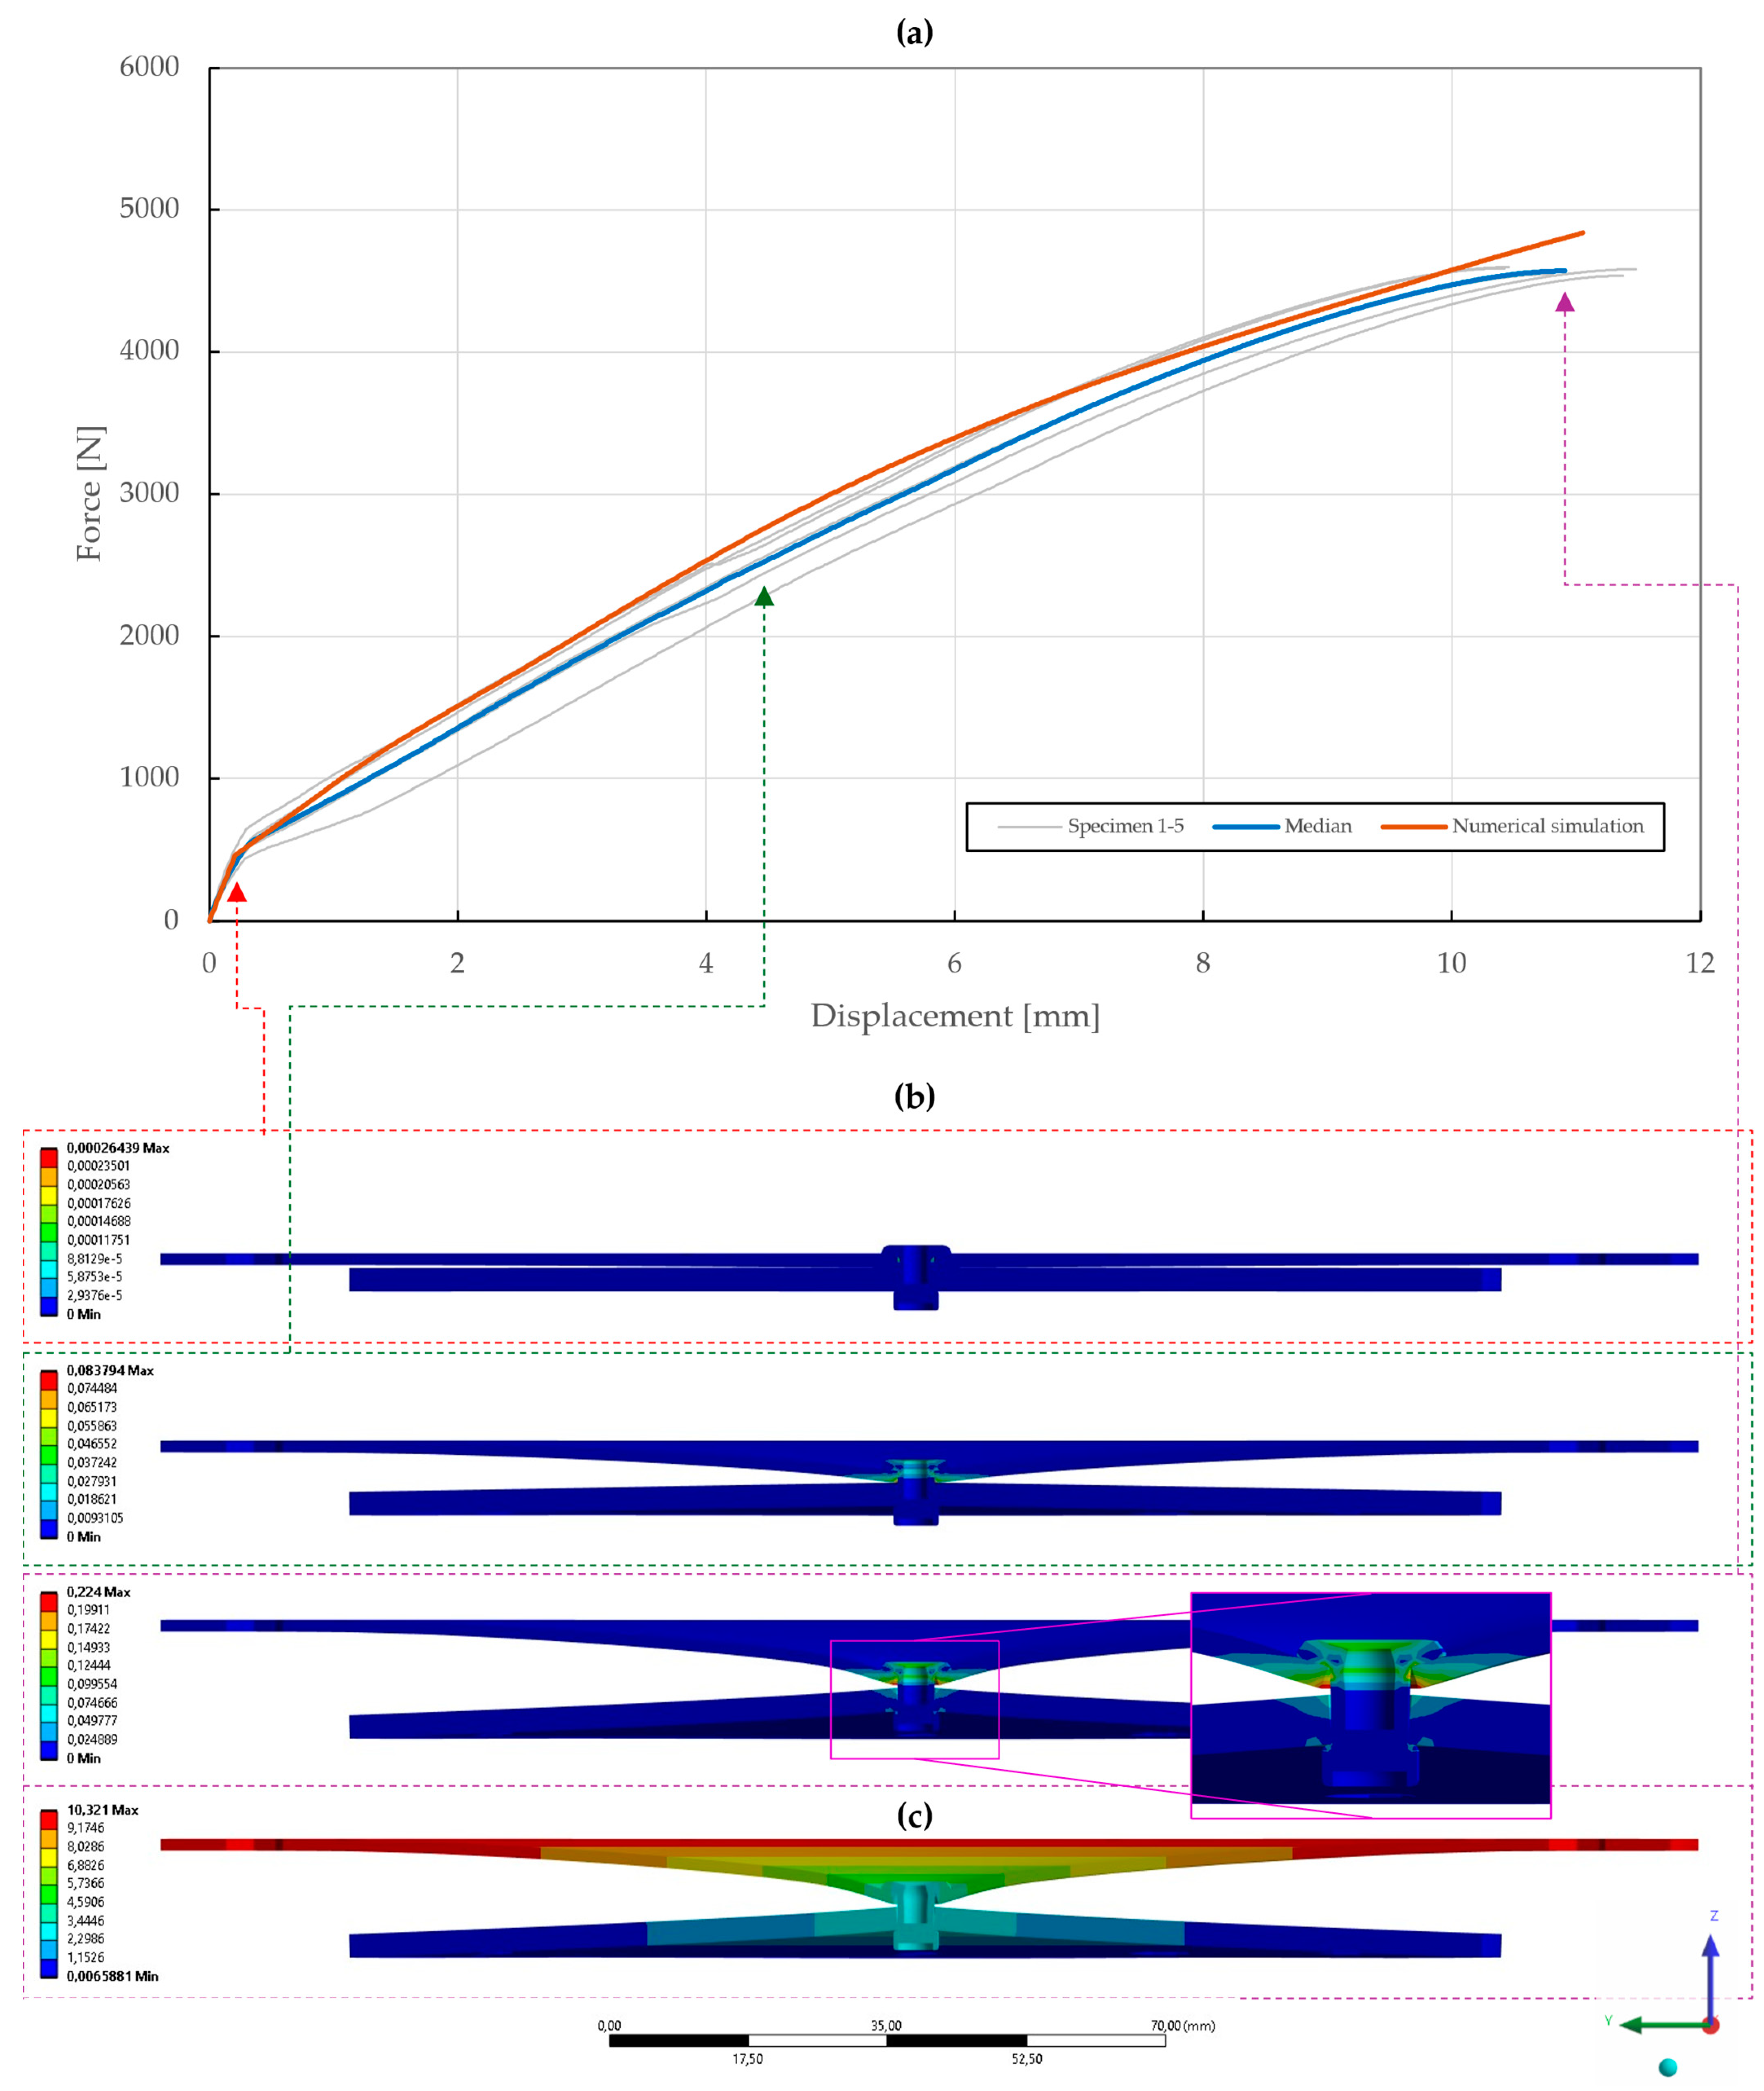
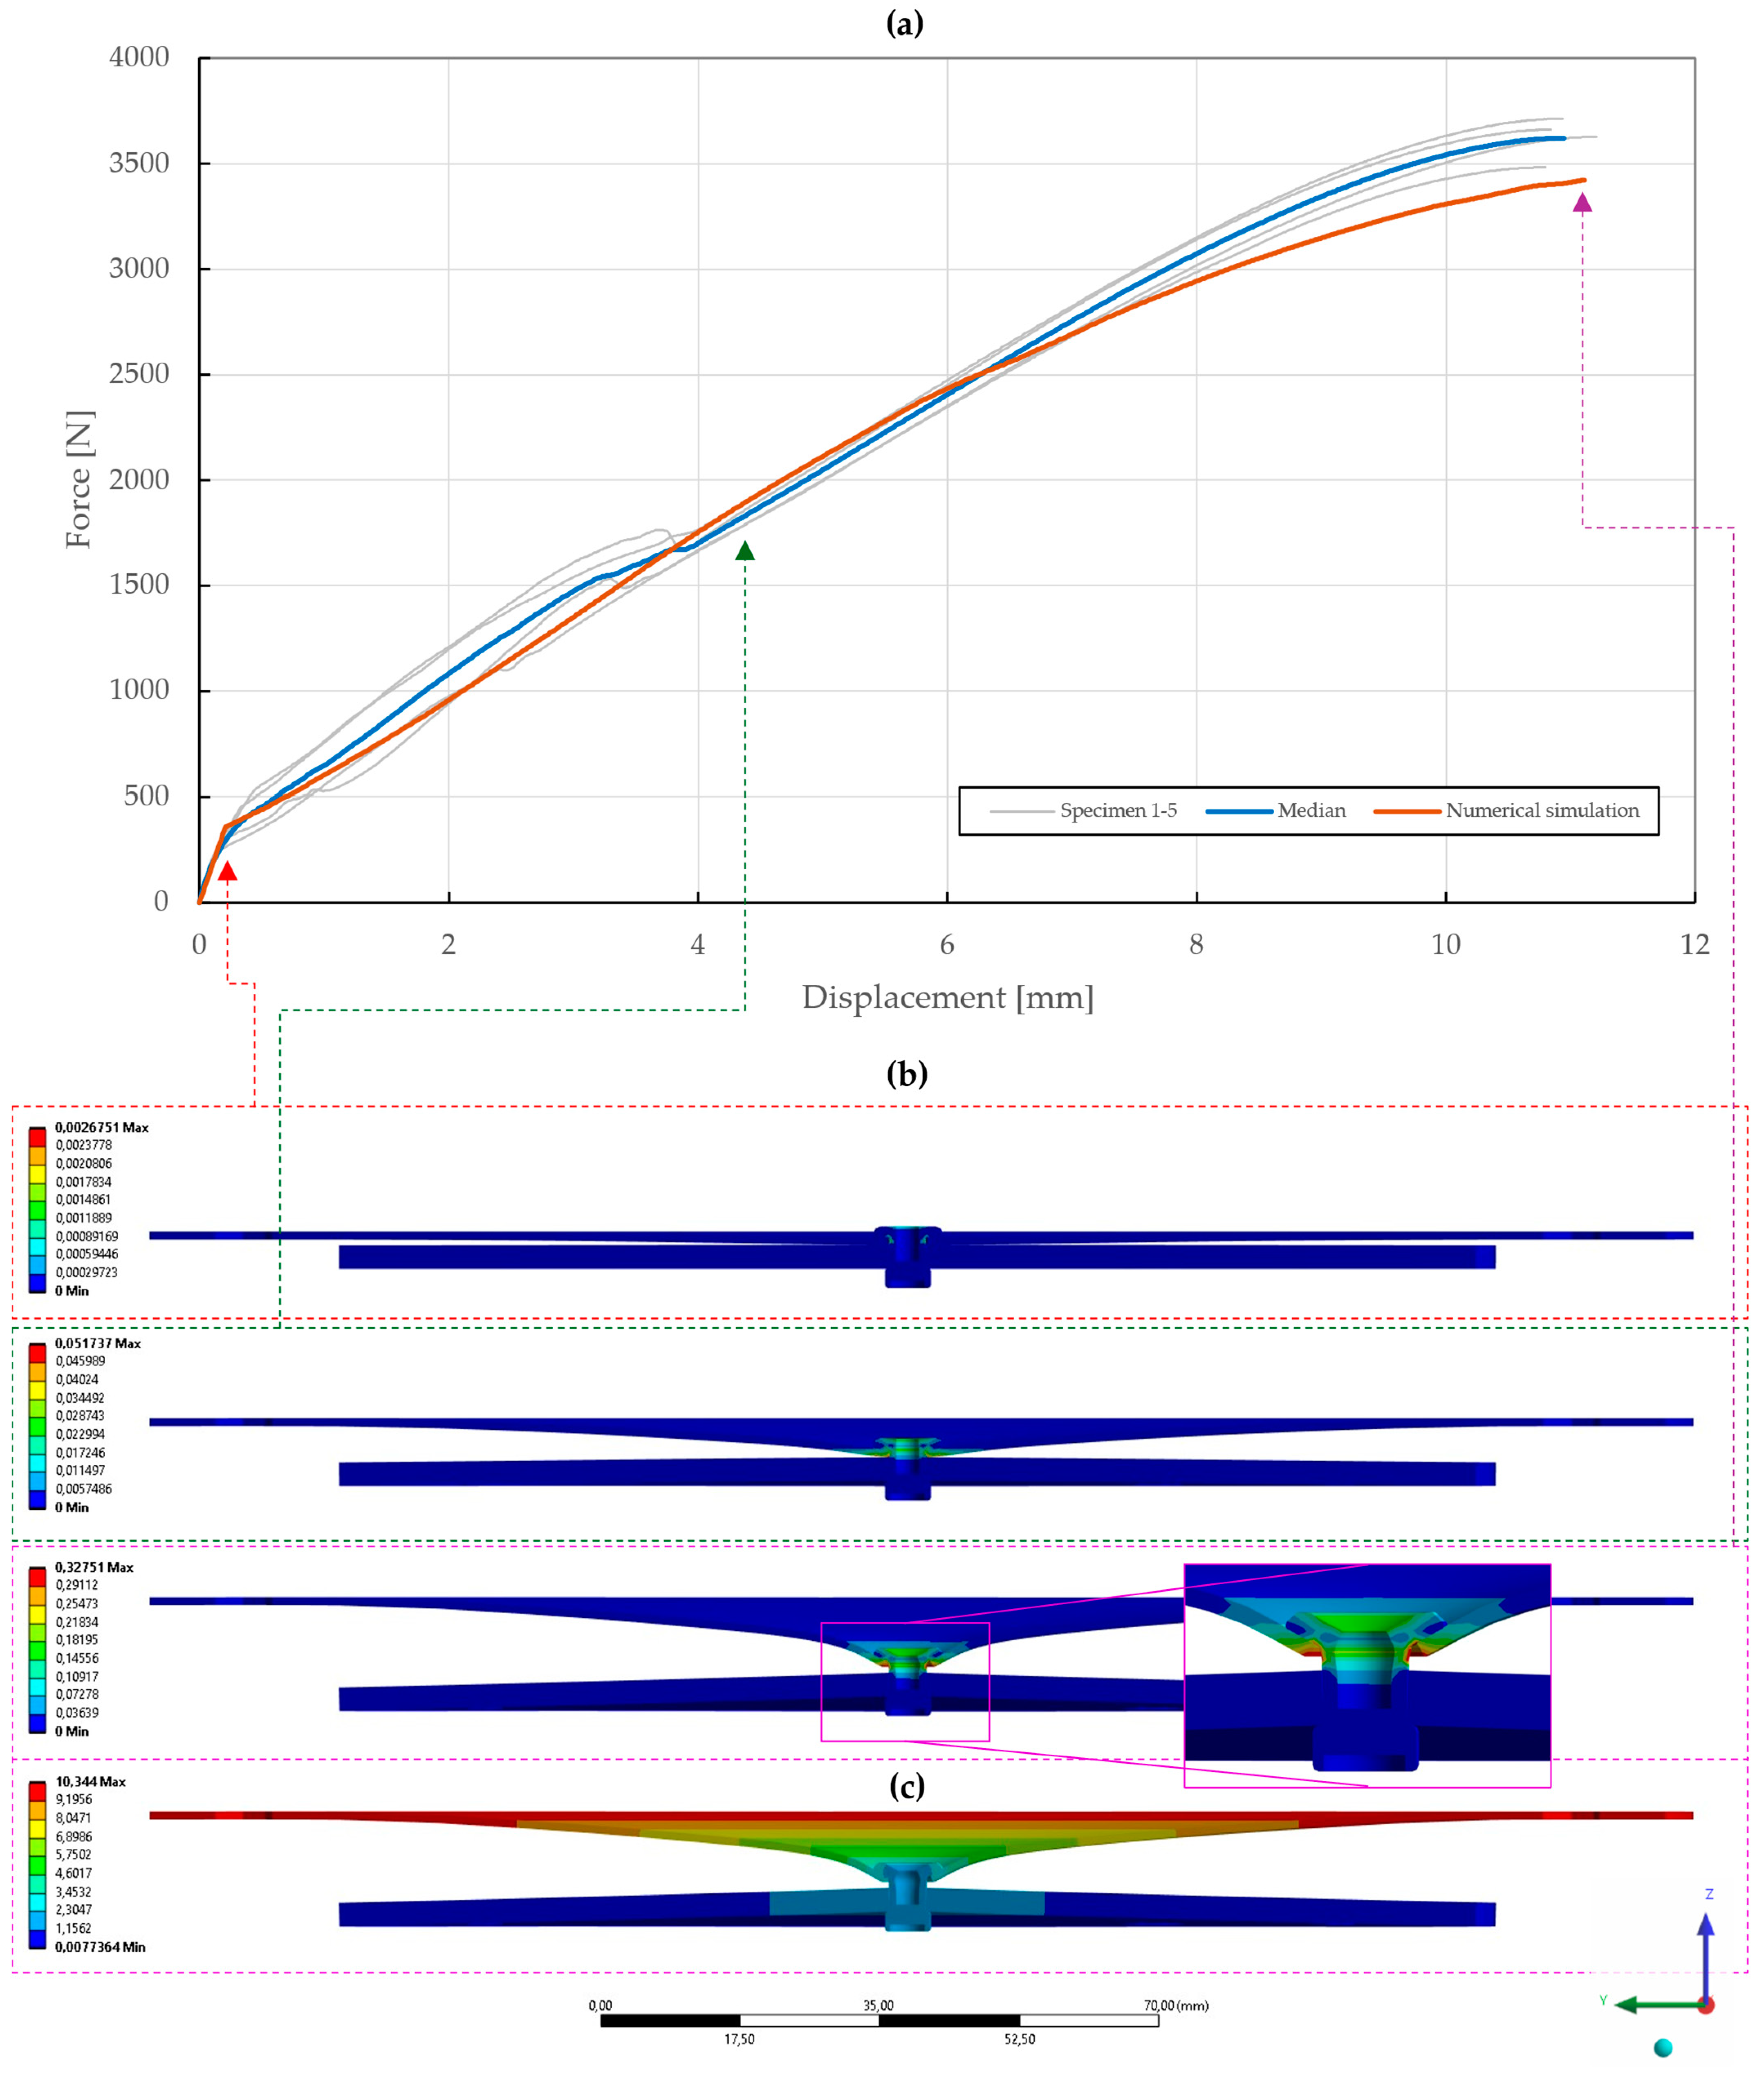
Figure 22.
Force–displacement curve of pure normal T3 specimen ( mm) riveted with DIN 7337—4.8 × 8 A2/A2 blind rivet and the results of its fitted non-linear numerical simulation: (a) force–displacement curve; (b) results of equivalent plastic strain from numerical simulation [mm/mm]; (c) results of total deformation from numerical simulation [mm].
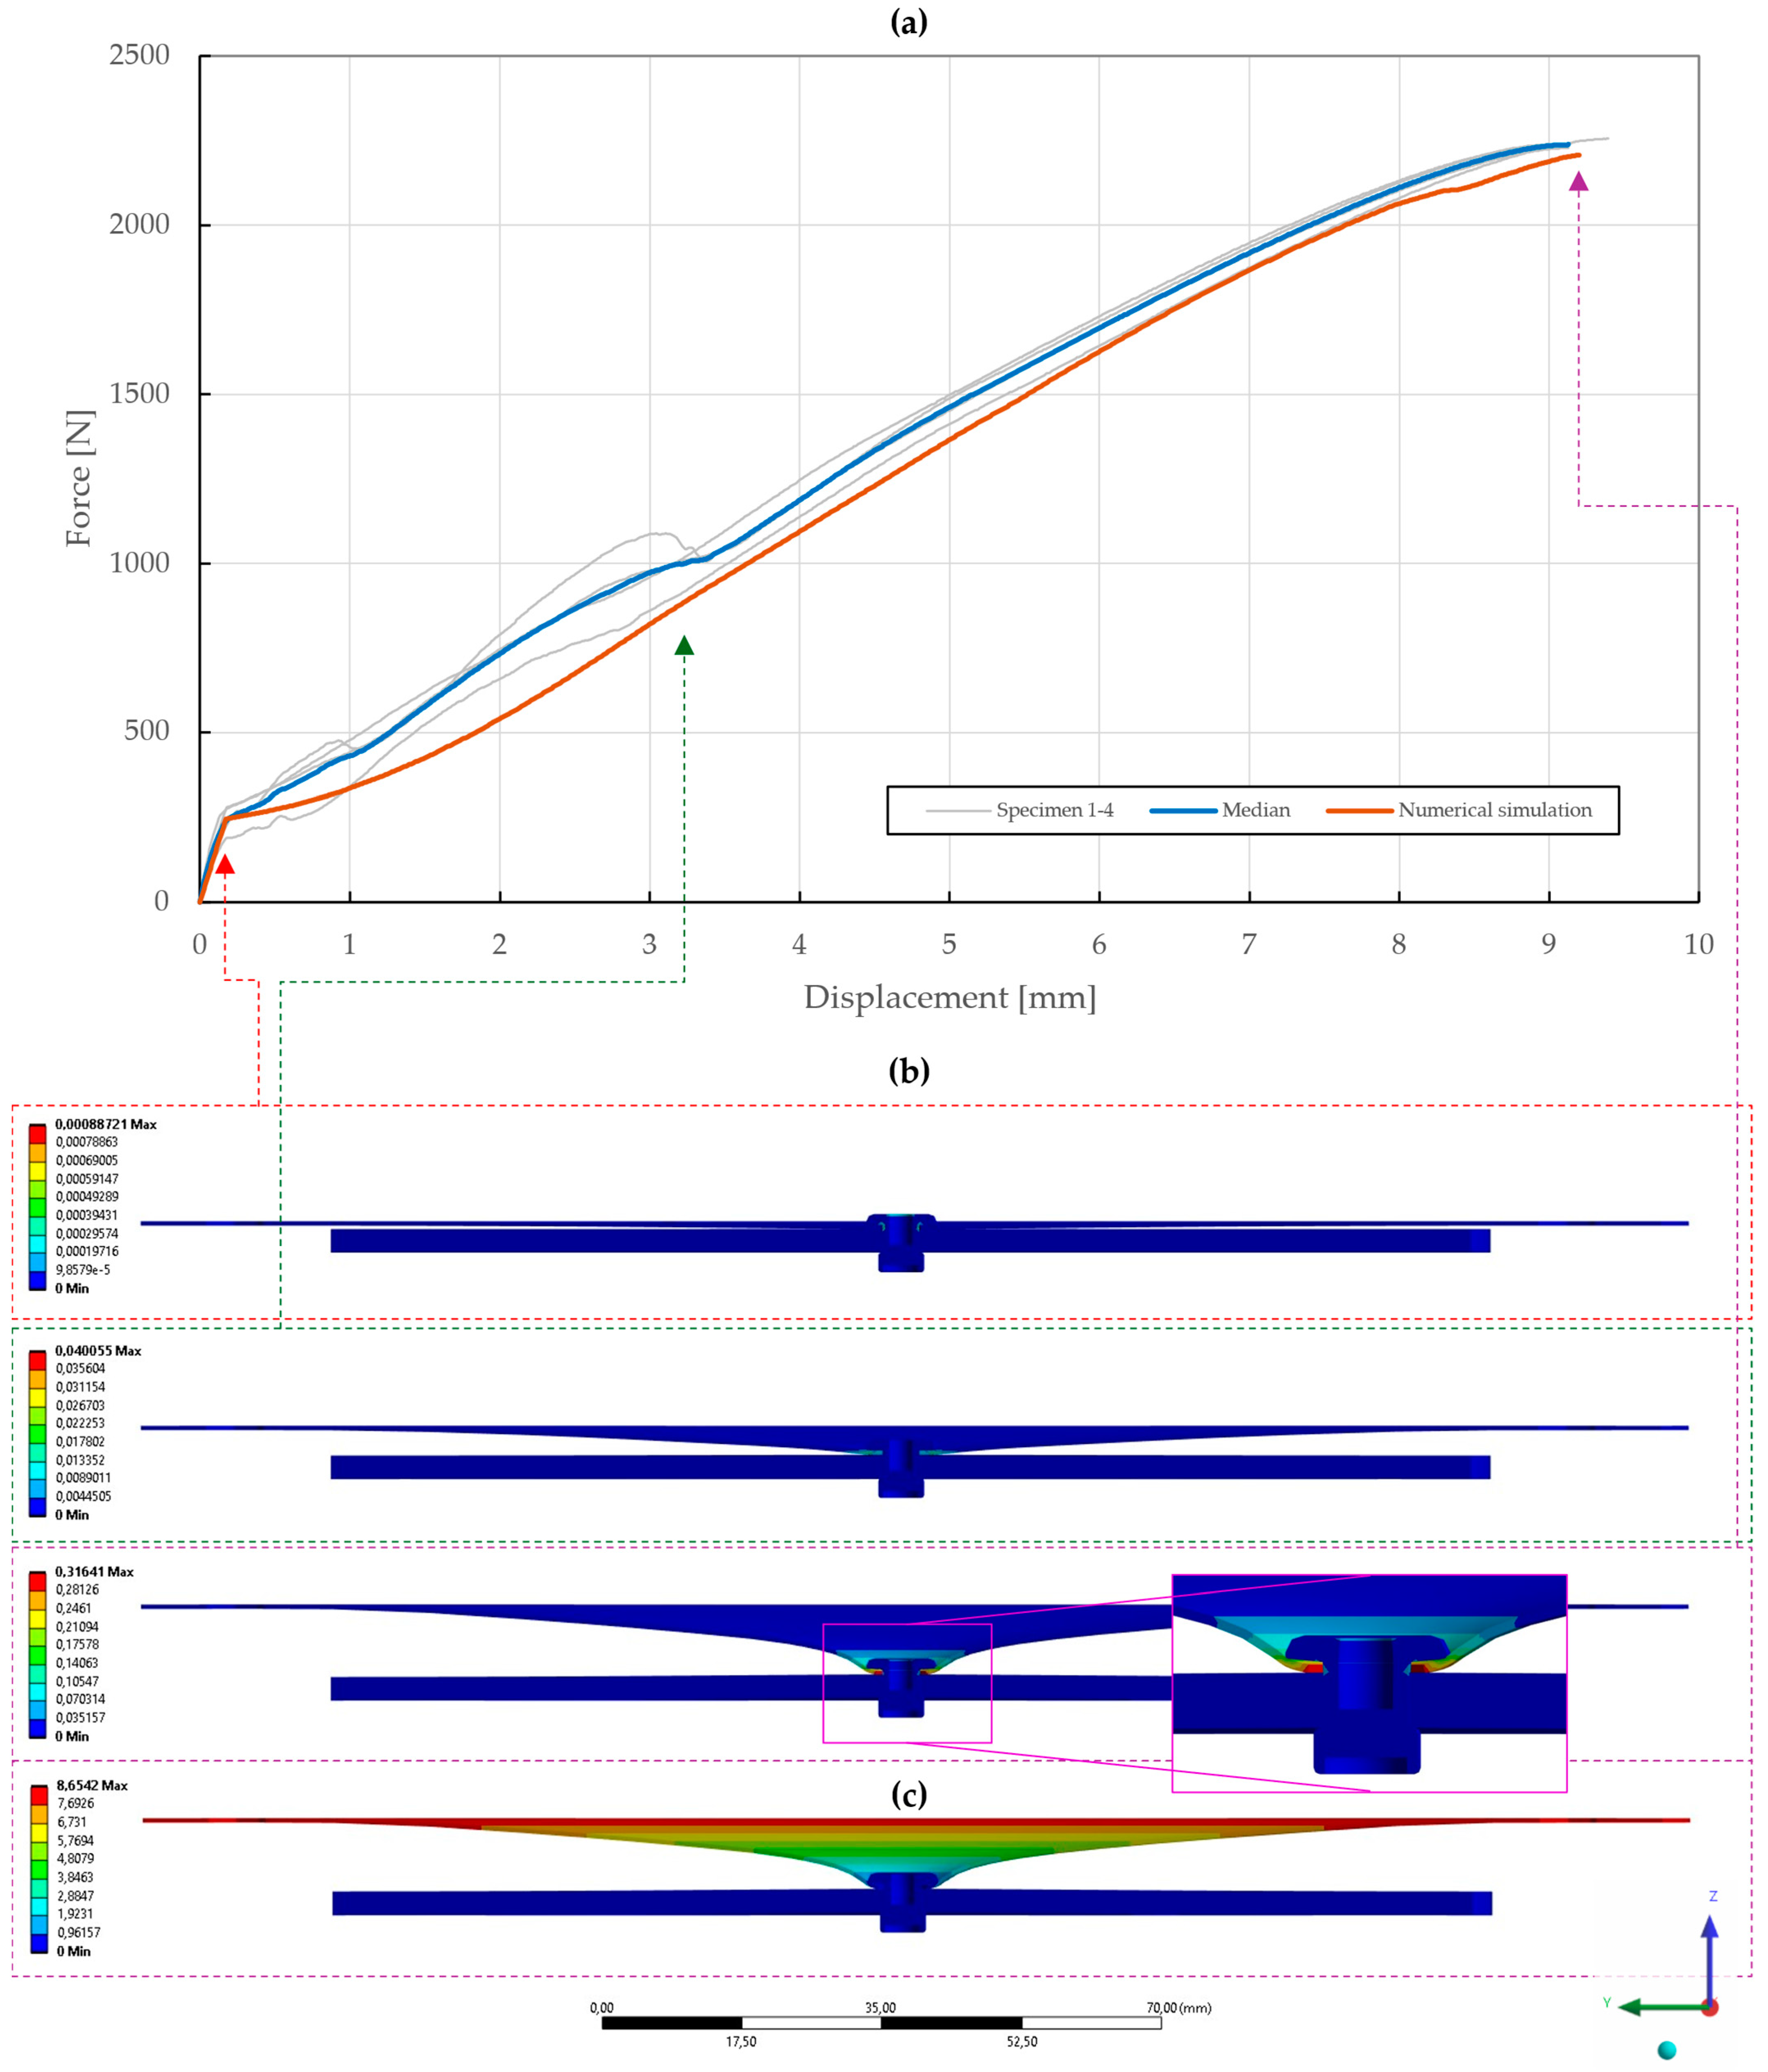
Figure 23.
Force–displacement curve of pure normal T3 specimen ( mm) riveted with DIN 7337—4.8 × 8 A2/A2 blind rivet and the results of its fitted non-linear numerical simulation: (a) force–displacement curve; (b) results of equivalent plastic strain from numerical simulation [mm/mm]; (c) results of total deformation from numerical simulation [mm].
Figure 24.
Force–displacement curve of pure normal T3 specimen ( mm) riveted with DIN 7337—4.8 × 8 A2/A2 blind rivet and the results of its fitted non-linear numerical simulation: (a) force–displacement curve; (b) results of equivalent plastic strain from numerical simulation [mm/mm]; (c) results of total deformation from numerical simulation [mm].
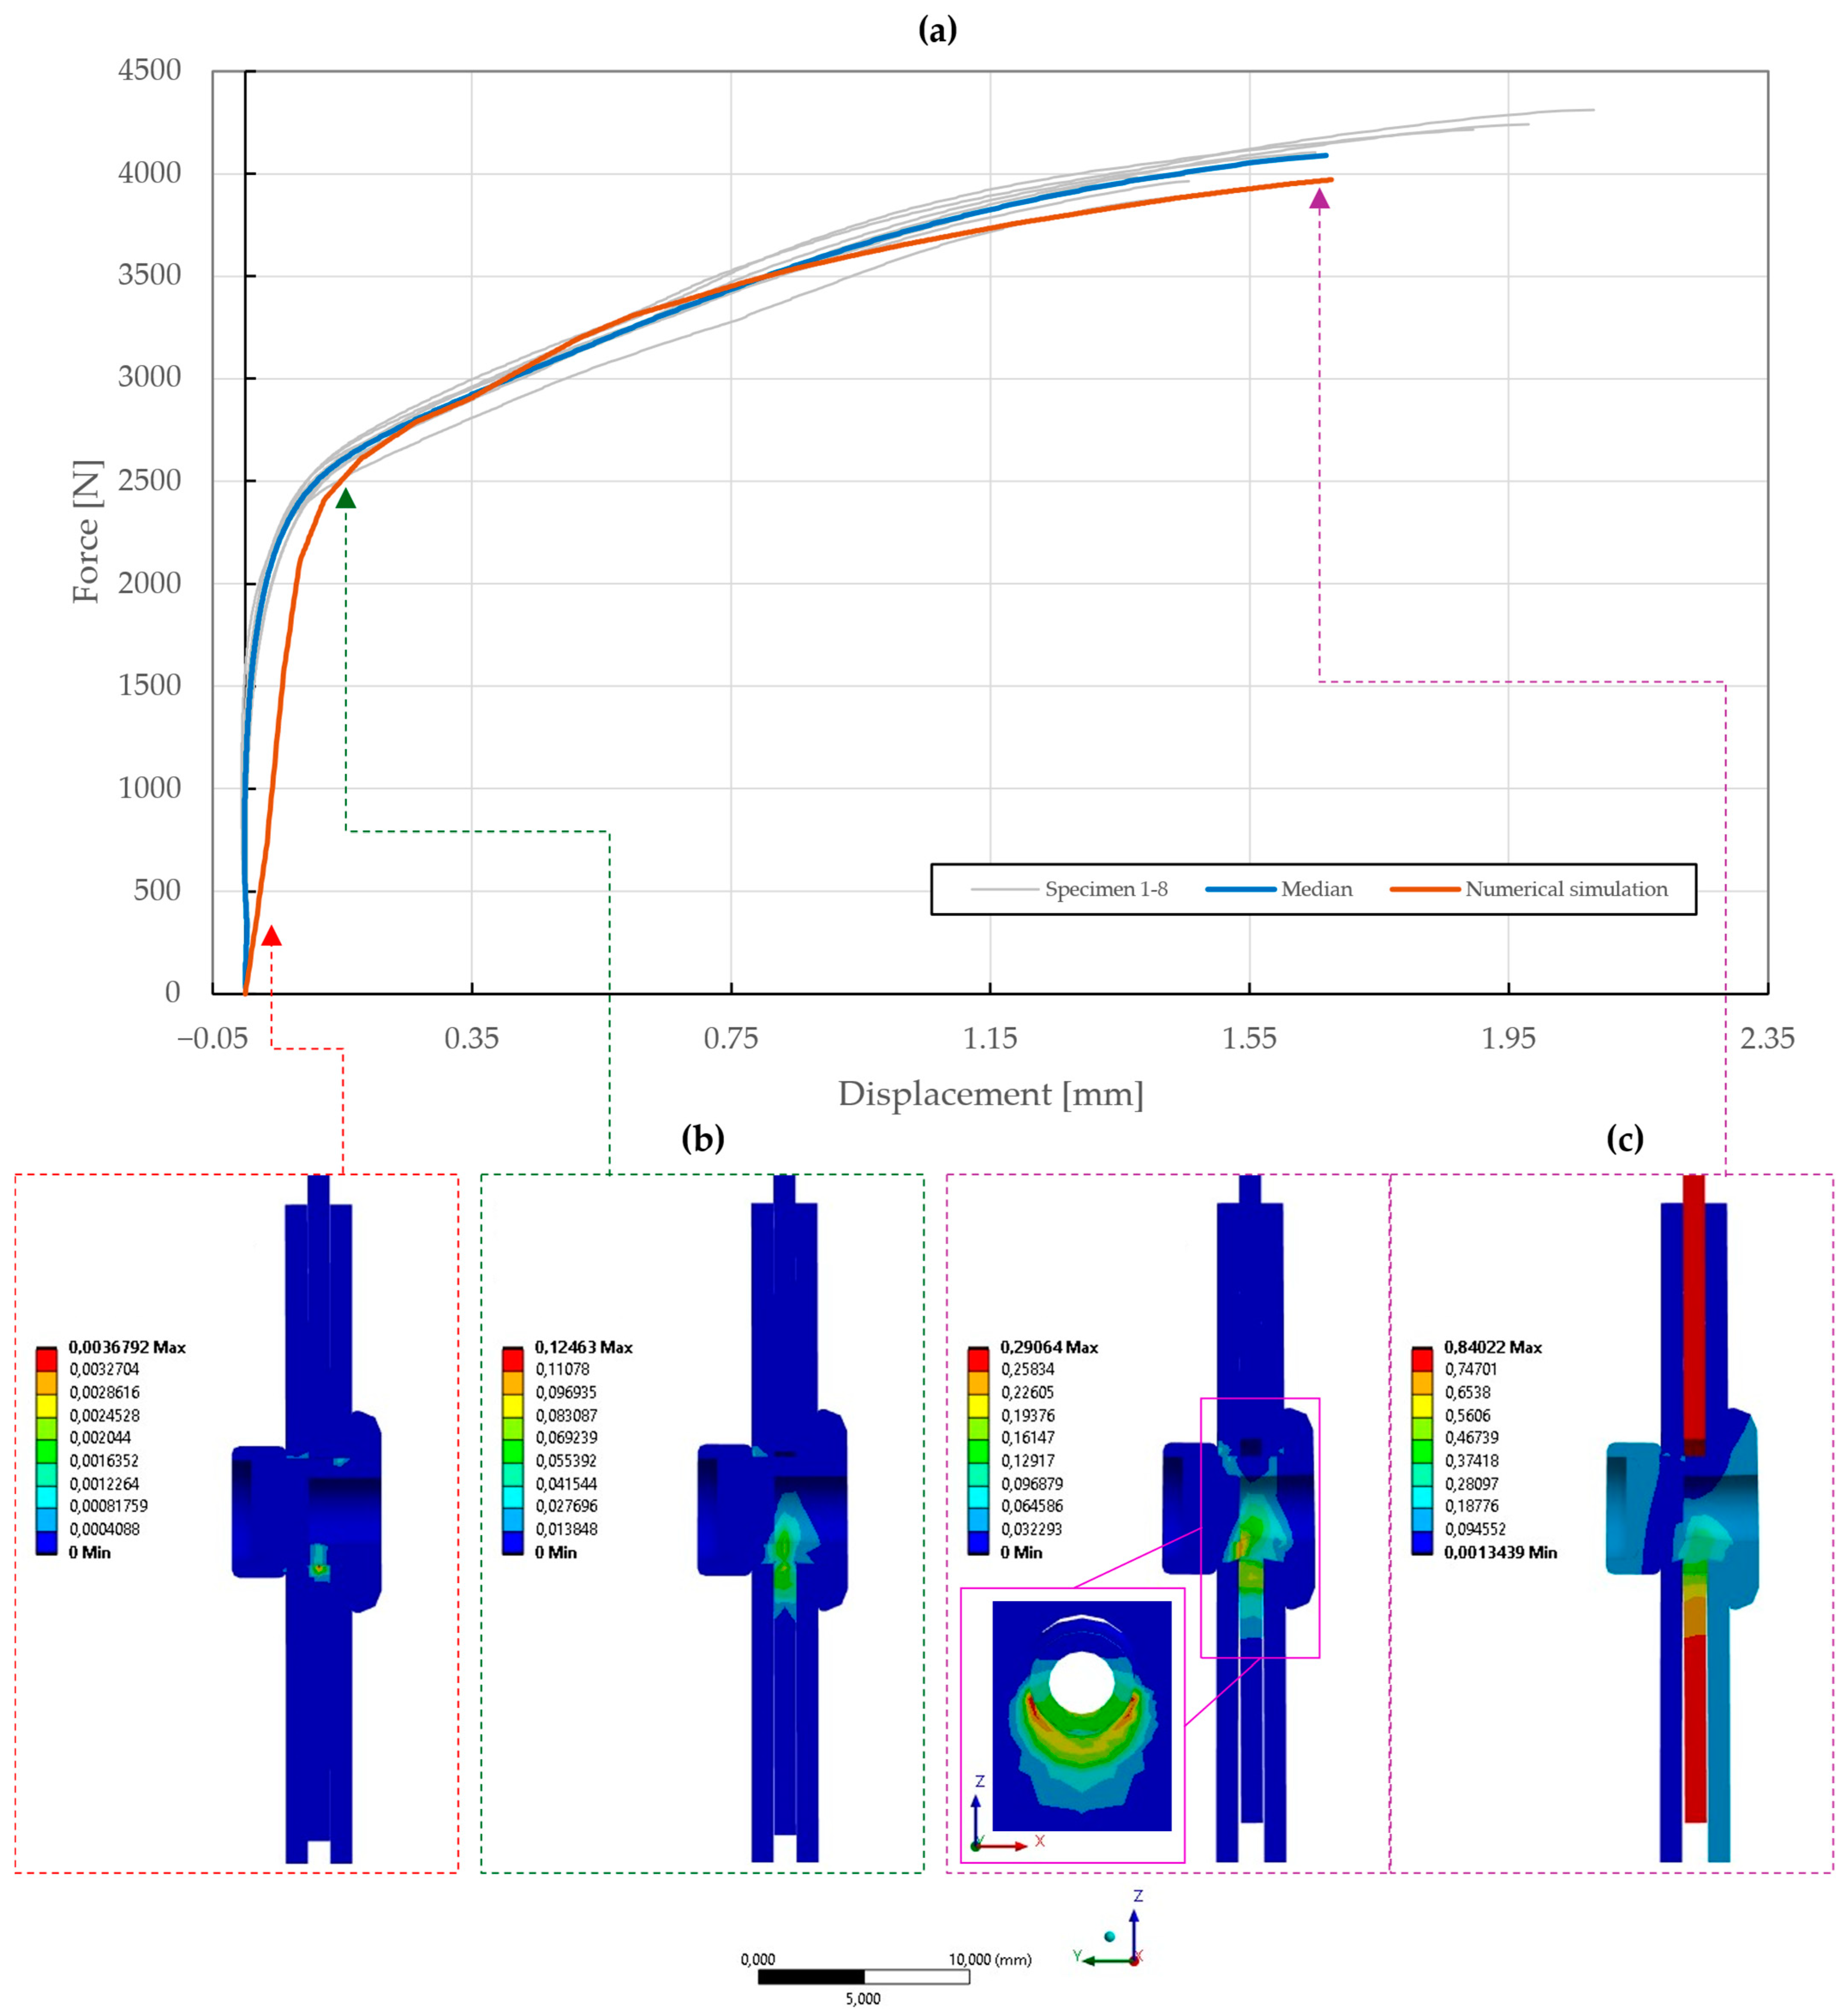
Figure 25.
Force–displacement curve of single-lap shear T1 specimen riveted with DIN 7337—4.8 × 8 St/St blind rivet and the results of its fitted non-linear numerical simulation: (a) force–displacement curve; (b) results of equivalent plastic strain from numerical simulation [mm/mm]; (c) results of total deformation from numerical simulation [mm].
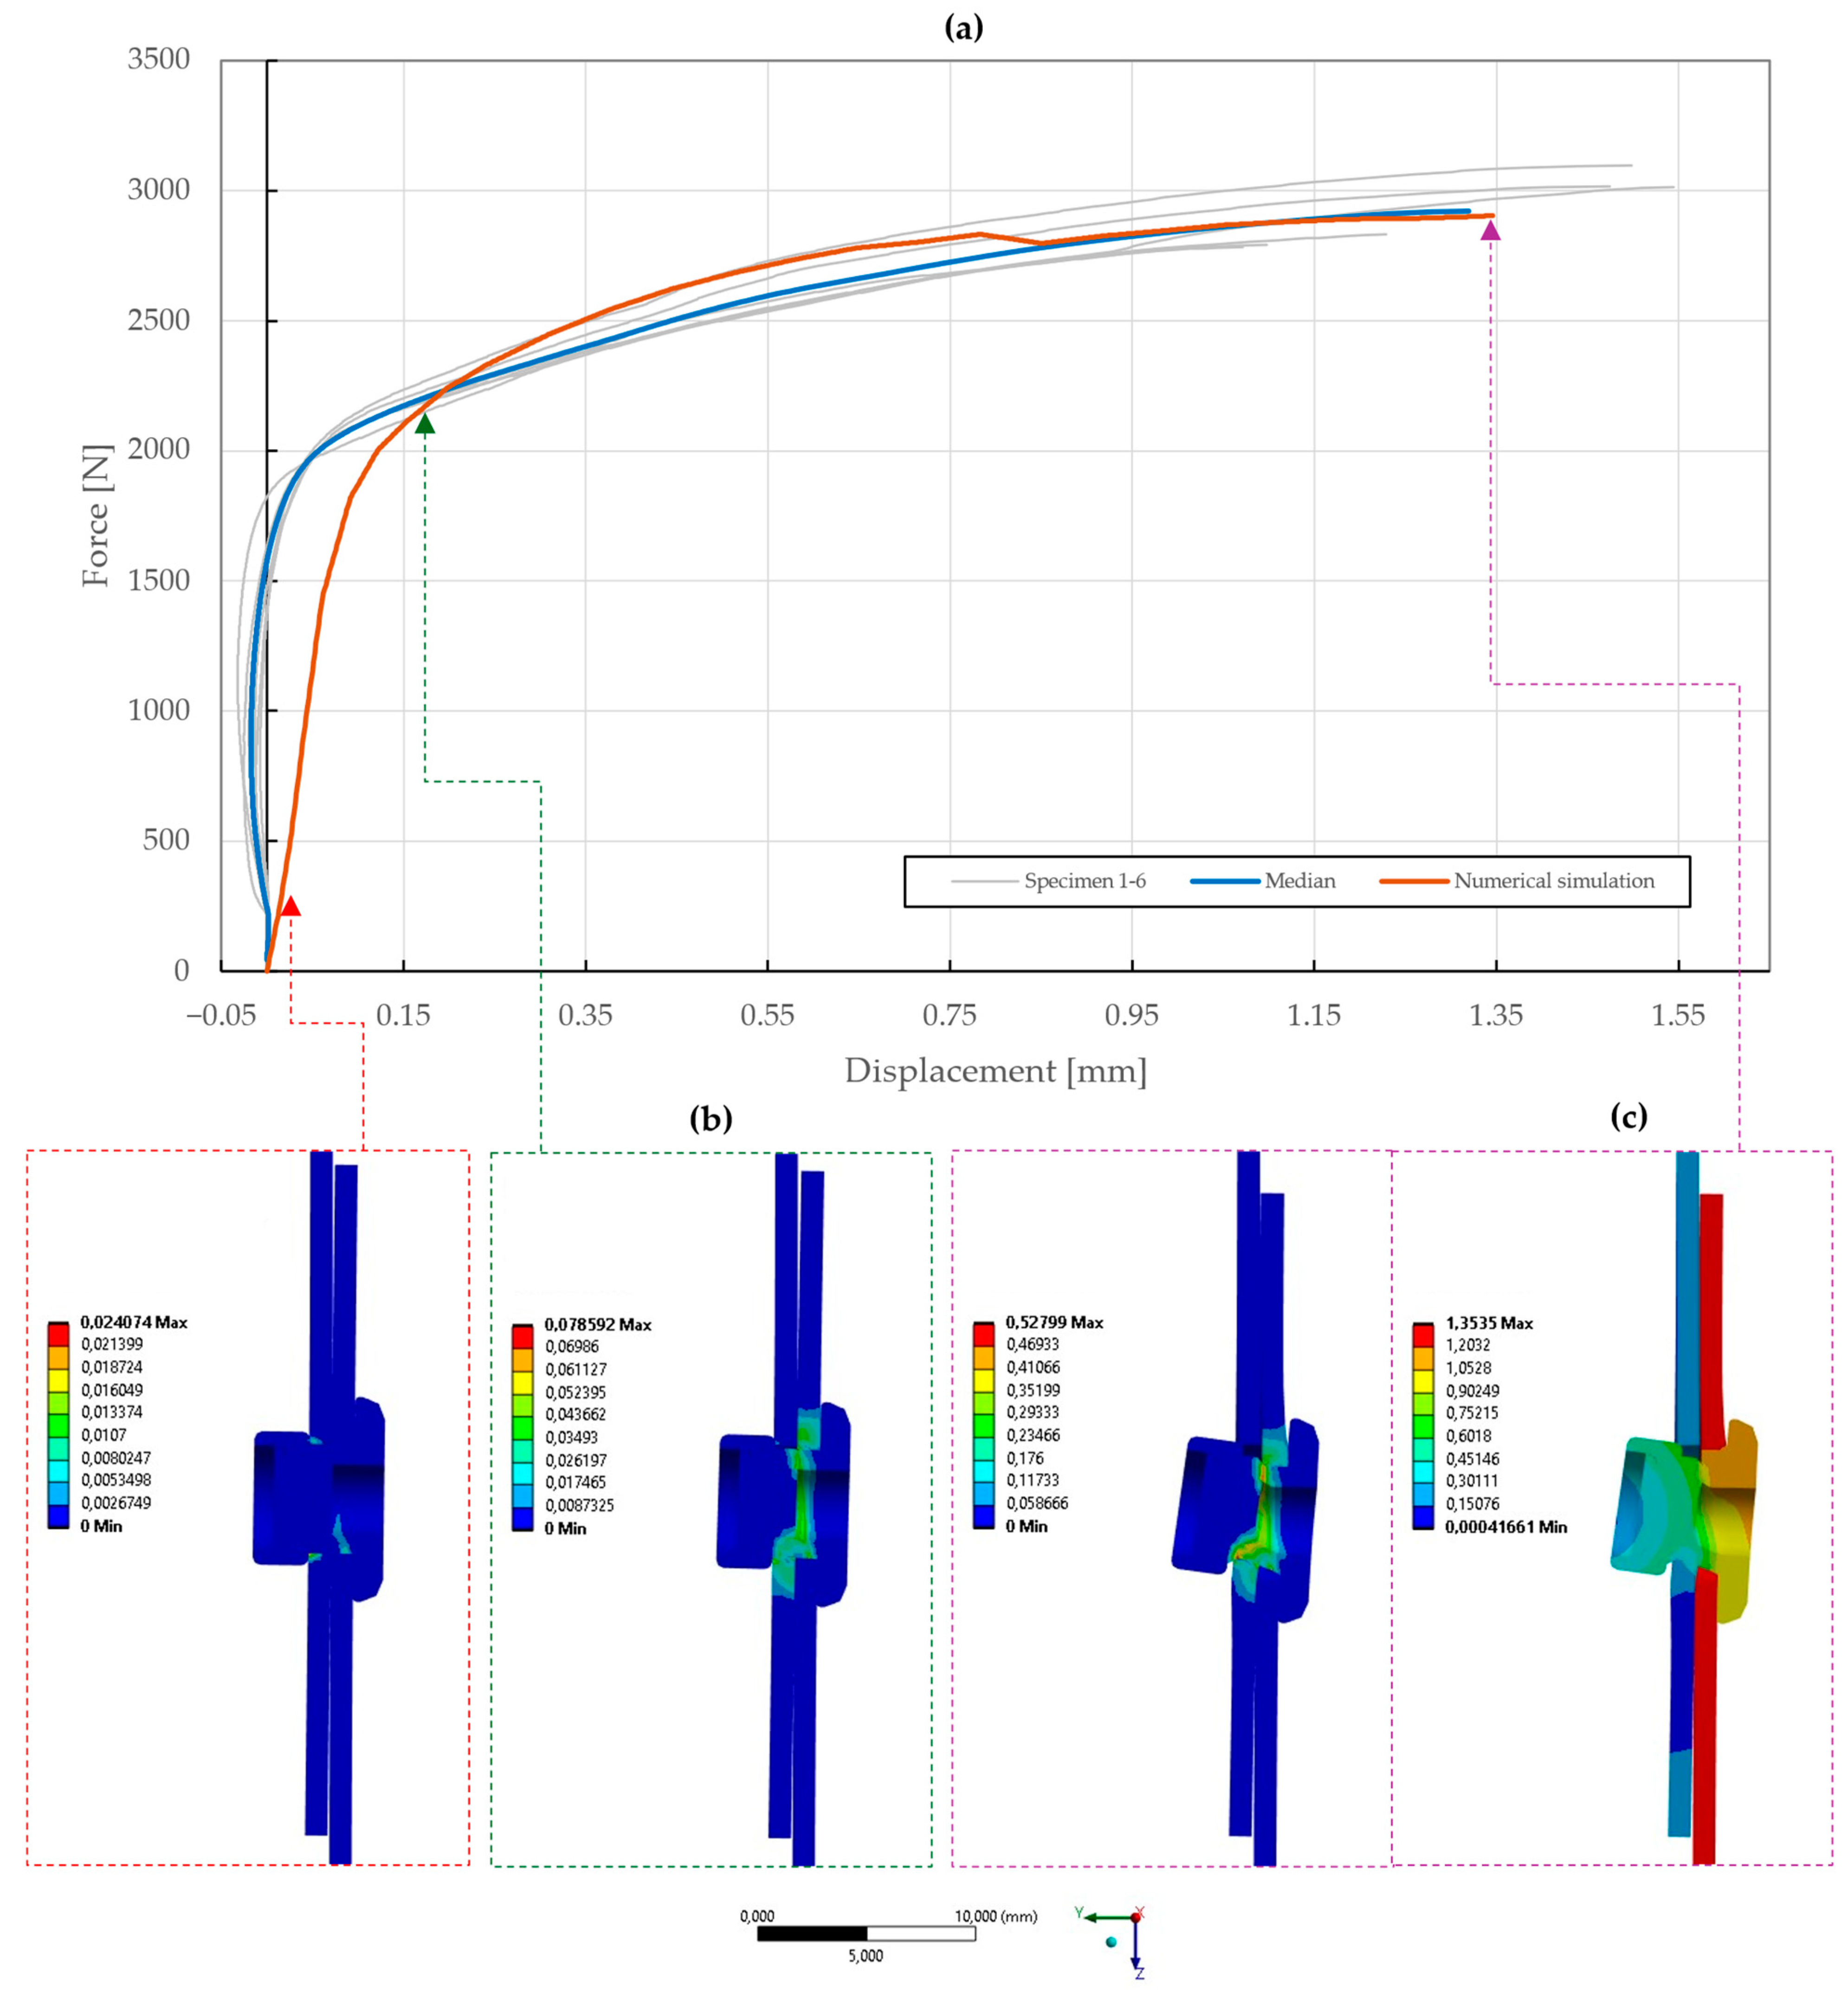
Figure 26.
Force–displacement curve of double-lap shear T2 specimen riveted with DIN 7337—4.8 × 8 St/St blind rivet and the results of its fitted non-linear numerical simulation: (a) force–displacement curve; (b) results of equivalent plastic strain from numerical simulation [mm/mm]; (c) results of total deformation from numerical simulation [mm].
Figure 27.
Force–displacement curve of pure normal T3 specimen ( mm) riveted with DIN 7337—4.8 × 8 St/St blind rivet and the results of its fitted non-linear numerical simulation: (a) force–displacement curve; (b) results of equivalent plastic strain from numerical simulation [mm/mm]; (c) results of total deformation from numerical simulation [mm].
Figure 28.
Force–displacement curve of pure normal T3 specimen ( mm) riveted with DIN 7337—4.8 × 8 St/St blind rivet and the results of its fitted non-linear numerical simulation: (a) force–displacement curve; (b) results of equivalent plastic strain from numerical simulation [mm/mm]; (c) results of total deformation from numerical simulation [mm].
Figure 29.
Force–displacement curve of pure normal T3 specimen ( mm) riveted with DIN 7337—4.8 × 8 St/St blind rivet and the results of its fitted non-linear numerical simulation: (a) force–displacement curve; (b) results of equivalent plastic strain from numerical simulation [mm/mm]; (c) results of total deformation from numerical simulation [mm].
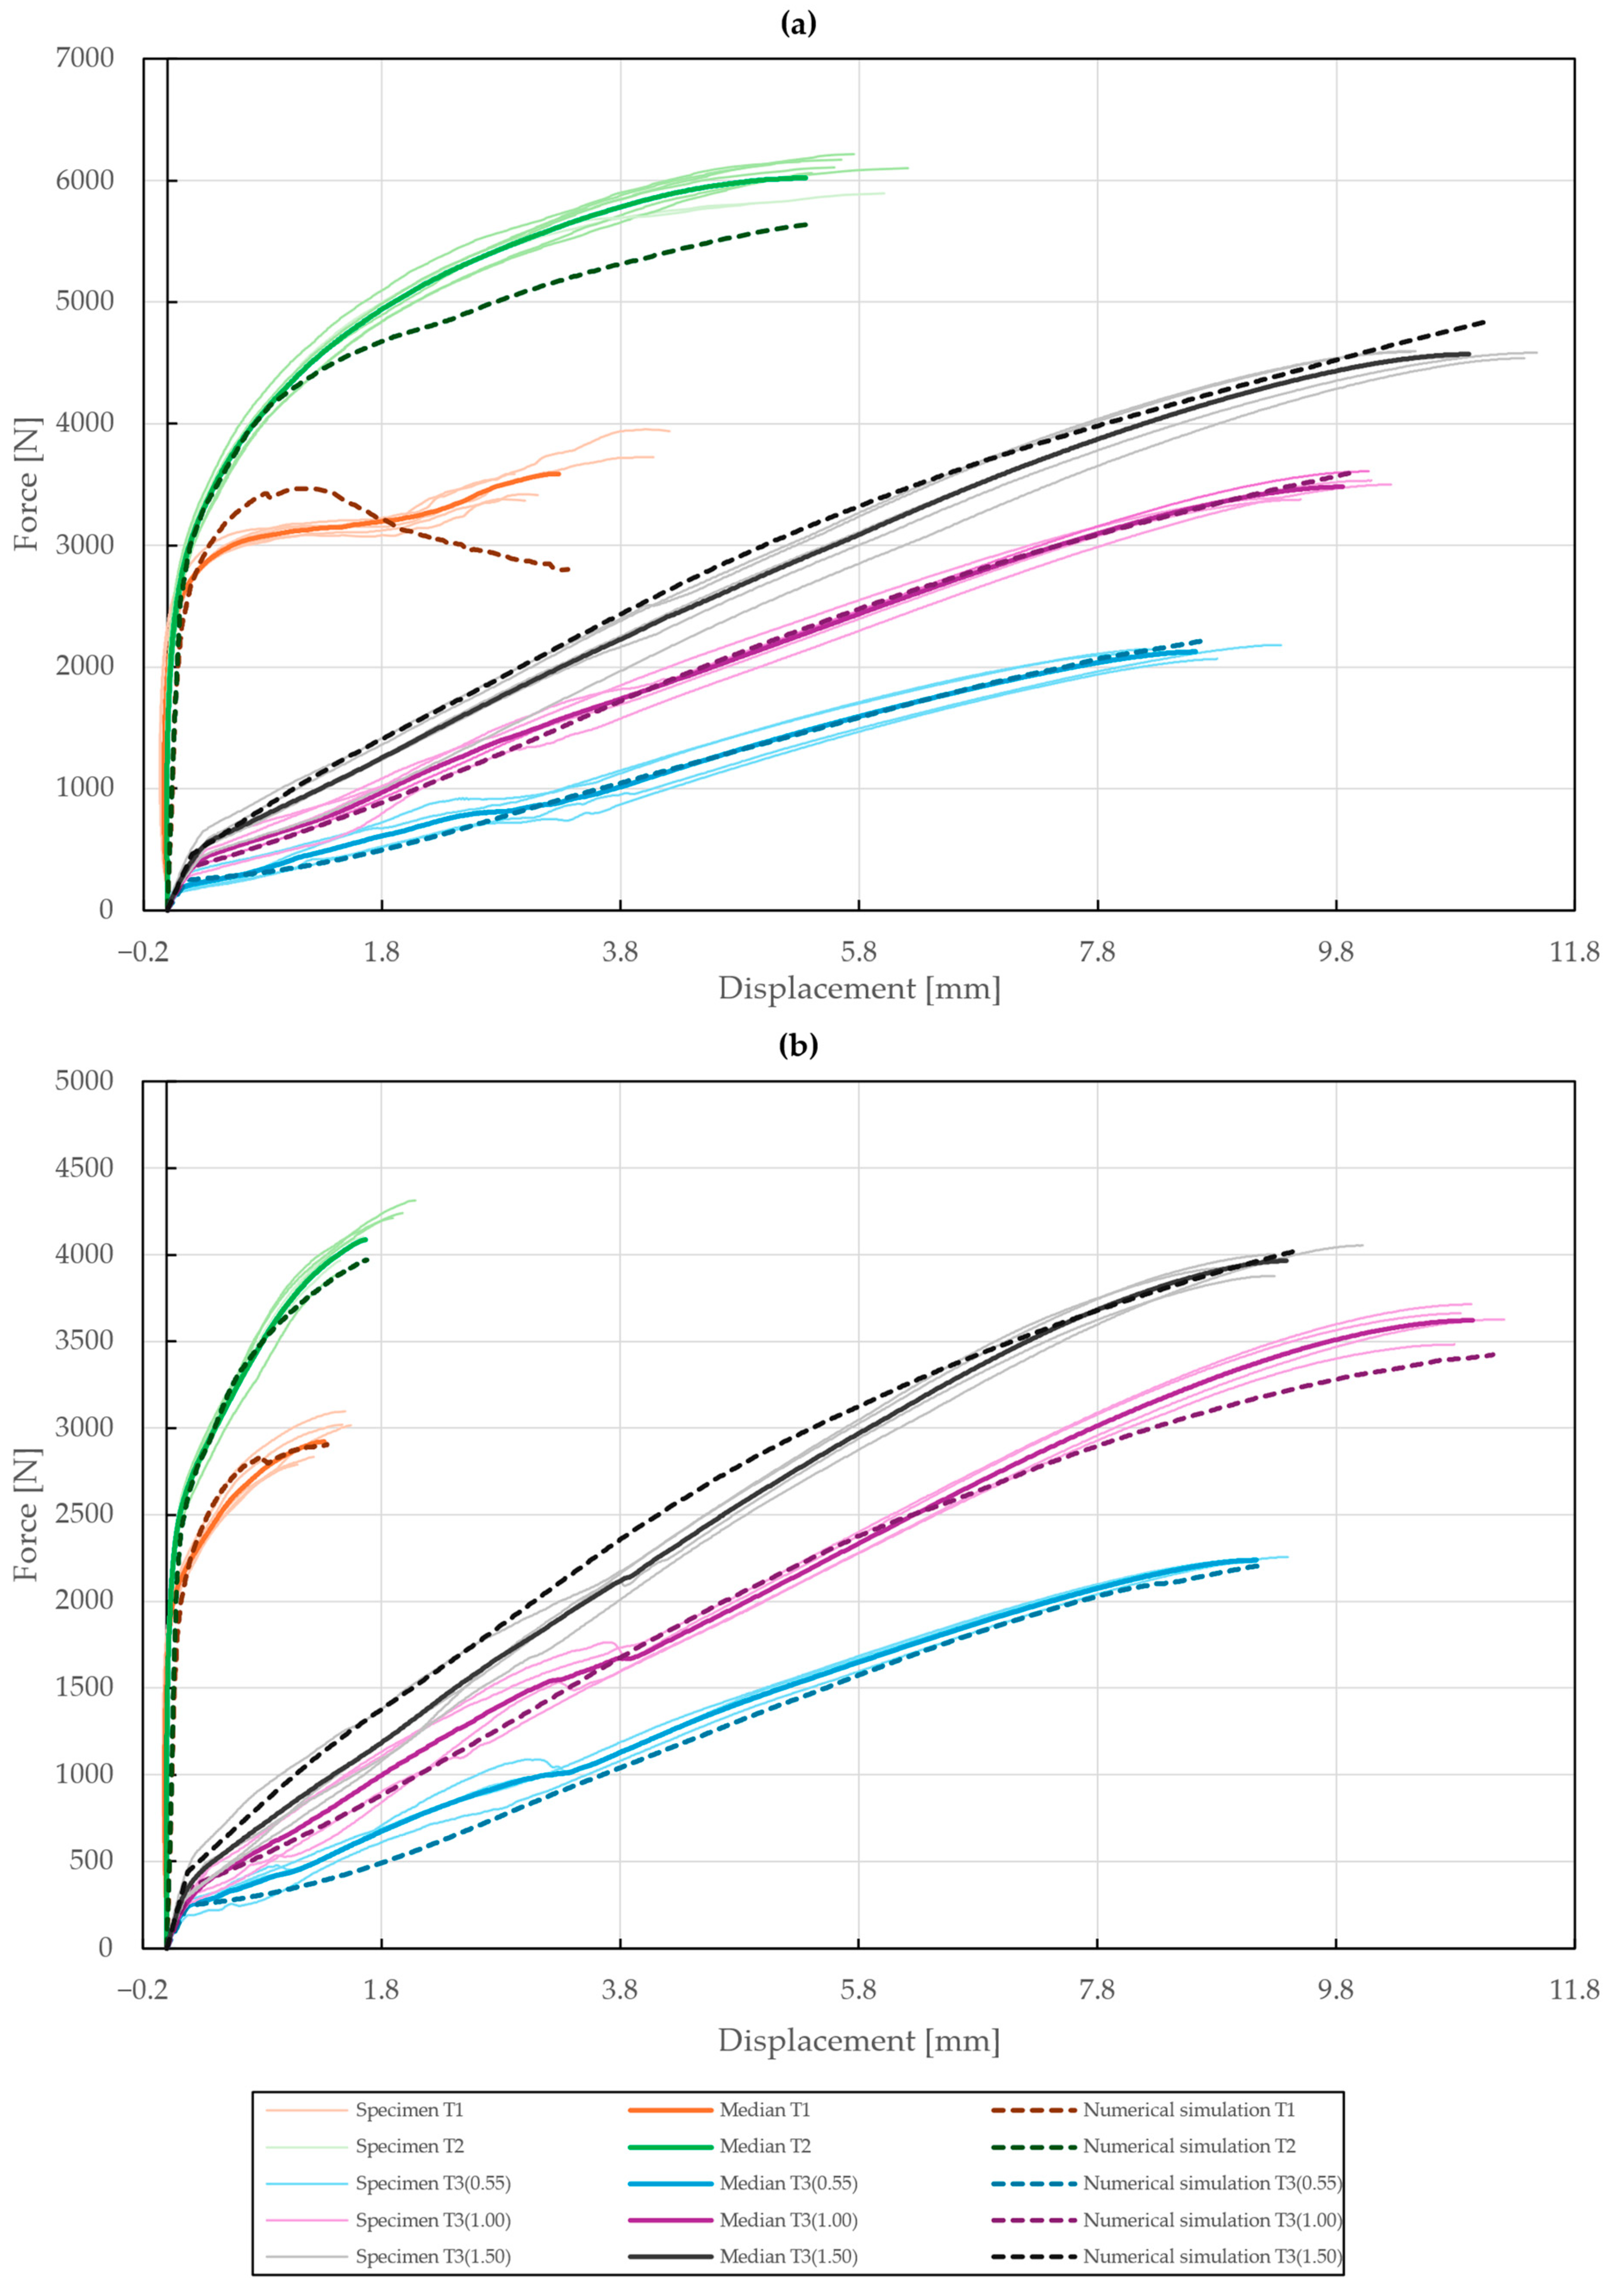
Figure 30.
Force–displacement curve of single-lap shear (T1), double-lap shear (T2), and pure normal loading (T3) of specimens riveted with DIN 7337 blind rivets and the corresponding results of their fitted non-linear numerical simulations: (a) stainless steel blind rivet DIN 7337—4.8 × 8 A2/A2; (b) galvanized carbon steel blind rivet DIN 7337—4.8 × 8 St/St.
Table 1.
Chemical composition of DX51D + Z275 steel.
Table 1.
Chemical composition of DX51D + Z275 steel.
| C [%] | Mn [%] | Si [%] | P [%] | S [%] | Cu [%] | Cr [%] | Ni [%] | Al [%] | V [%] | Mo [%] |
|---|
| 0.04 | 0.24 | 0.023 | 0.007 | 0.004 | 0.04 | 0.03 | 0.023 | 0.03 | 0.001 | 0.002 |
Table 2.
Mechanical properties of DX51D + Z275 steel.
Table 2.
Mechanical properties of DX51D + Z275 steel.
| Mechanical Property | [Unit] | DX51D + Z275 |
|---|
| Test temperature | [°C] | 23 |
| Average coating thickness | [g/m2] | 286 |
| [MPa] | 315 |
| [MPa] | 367 |
| [%] | 39.6 |
Table 3.
Mechanical properties of DIN 7337—4.8 × 8 blind rivets.
Table 3.
Mechanical properties of DIN 7337—4.8 × 8 blind rivets.
| Mechanical Property | [Unit] | DIN 7337—4.8 × 8 |
|---|
| A2/A2 | St/St |
|---|
| [N] | 5000 1 | 3700 1 |
| [N] | 4000 1 | 2900 1 |
| [MPa] | 442.1 | 302 |
| [MPa] | 288.7 | 188.4 |
Table 4.
Overview of failure modes observed in riveted specimens.
Table 4.
Overview of failure modes observed in riveted specimens.
| Specimen Configuration | Failure Mode |
|---|
| DIN 7337—4.8 × 8 A2/A2 | DIN 7337—4.8 × 8 St/St |
|---|
| Single-lap shear T1 | Rivet slippage | Rivet failure |
| Double-lap shear T2 | Steel sheet failure | Rivet failure |
| mm) | Rivet slippage | Rivet slippage |
| mm) | Rivet slippage | Rivet slippage |
| mm) | Rivet slippage | Rivet failure |
Table 5.
Calibrated material parameters of DX51D + Z275 steel sheet specimen.
Table 5.
Calibrated material parameters of DX51D + Z275 steel sheet specimen.
| Material Parameter | [Unit] | DX51D + Z275 |
|---|
| [MPa] | |
| [–] | 0.29029 |
| [MPa] | 258.96 |
| [MPa] | 2442.3 |
| [–] | 10.831 |
Table 6.
Calibrated material parameters of DIN 7337—4.8 × 8 blind rivets.
Table 6.
Calibrated material parameters of DIN 7337—4.8 × 8 blind rivets.
| Material Parameter | [Unit] | DIN 7337—4.8 × 8 |
|---|
| A2/A2 | St/St |
|---|
| [MPa] | | |
| [–] | 0.27672 | 0.33747 |
| [MPa] | 425.93 | 291.13 |
| [MPa] | 4784.4 | 2980.6 |
| [–] | 3.6501 | 17.724 |


