

Tissue Paper Softness: A Comparison Between Different Experimental Assessment Approaches


 , ,
, ,  ,
,  and
and 
Abstract
1. Introduction
2. Materials and Methods
2.1. Set of Paper Products
2.2. Experimental Methodology
3. Results
3.1. Comparison Between Methods
3.2. Products Analysis (Rougher, Softer, and Highest Difference)
4. Conclusions
Author Contributions
Funding
Institutional Review Board Statement
Informed Consent Statement
Data Availability Statement
Acknowledgments
Conflicts of Interest
References
- Hollmark, H. Mechanical properties of tissue. In Handbook of Physical and Mechanical Testing of Paper and Paperboard; Mark, R.E., Ed.; Dekker: New York, NY, USA, 1983; Volume 1. [Google Scholar]
- Kimari, O. Chapter 3—Tissue. In Papermaking Science and Technology, Book 18—Paper and Board Grades; Paulapuro, H., Ed.; Finnish Paper Engineers’ Association and TAPPI: Helsinki, Finland, 2000. [Google Scholar]
- Das, R.; Pan, K.; Green, S.; Phani, A.S. Creped Tissue Paper: A Microarchitected Fibrous Network. Adv. Eng. Mater. 2021, 23, 2000777. [Google Scholar] [CrossRef]
- Abbott, J.C.; Schnabel, K. Hygiene papers. In Papermaking Science and Technology, Book 17—Pulp and Paper Testing; Chapter 11; Levlin, J.E., Söderhjelm, L., Eds.; Finnish Paper Engineers’ Association and TAPPI: Helsinki, Finland, 2000. [Google Scholar]
- de Assis, T.; Reisinger, L.W.; Dasmohapatra, S.; Pawlak, J.J.; Jameel, H.; Pal, L.; Kavalew, D.; Gonzalez, R.W. Performance and sustainability vs. the shelf price of tissue paper Kitchen Towels. BioResources 2019, 13, 6868–6892. [Google Scholar] [CrossRef]
- Statista. Tissue & Hygiene Paper—Worldwide. Available online: https://www.statista.com/outlook/cmo/tissue-hygiene-paper/worldwide (accessed on 18 November 2024).
- de Assis, T.; Reisinger, L.W.; Pal, L.; Pawlak, J.J.; Jameel, H.; Gonzalez, R.W. Understanding the effect of machine technology and cellulosic fibers on tissue properties—A review. BioResources 2018, 13, 4593–4629. [Google Scholar] [CrossRef]
- Morais, F.P.; Mendes, A.O.; Carta, A.M.M.S.; Fiadeiro, P.T.; Amaral, M.E.; Curto, J.M.R. Chapter 6—A 3D Fiber-Based Strategy for Optimization of Tissue Materials Using a Combination of Liquid Absorbency/Retention Methods. In Engineering Design Applications V. Advanced Structured Materials; Öchsner, A., Altenbach, H., Eds.; Springer: Cham, Switzerland, 2023; Volume 171. [Google Scholar]
- Hollmark, B.H. The softness of household paper products and related products. In The Fundamental Properties of Paper Related to Its Uses; Bolam, F.M., Ed.; Technical Division; The British Paper and Board Industry Federation: London, UK, 1976. [Google Scholar]
- Rust, J.P.; Keadle, T.L.; Allen, D.B.; Shalev, I.; Barker, R.L. Tissue Softness Evaluation by Mechanical Stylus Scanning. Text. Res. J. 1994, 64, 163–168. [Google Scholar] [CrossRef]
- Yokura, H.; Kohono, S.; Iwasaki, M. Objective Hand Measurement of Toilet Paper. J. Text. Eng. 2004, 50, 1–5. [Google Scholar] [CrossRef]
- Lima, M.; da Silva, L.F.; Vasconcelos, R.; Carneiro, A. FRICTORQ, Mechatonic Design for the Objective Measurement of Friction in 2D Soft Surfaces. In Proceedings of the 1st International Conference on Innovations, Recent Trends and Challenges in Mechatronics, Mechanical Engineering and New High-Tech Products Development MECAHITECH’09, Bucharest, Romania, 8–9 October 2009; pp. 144–153. [Google Scholar]
- Furman, G.; De Roever, E.; Frette, G.; Gomez, S. Analysis of the surface softness of tissue paper using confocal laser scanning microscopy. Celul. Pap. 2010, 26, 30–38. [Google Scholar]
- Rosen, B.-G.; Fall, A.; Rosen, S.; Farbrot, A.; Bergström, P. Topographic modelling of haptic properties of tissue products. J. Phys. Conf. Ser. 2014, 483, 012010. [Google Scholar] [CrossRef]
- Rastogi, V.K.; Großmann, H.; Ray, A.K.; Greiffenberg, I. Dependence of Softness Perception on Tissue Physical Properties and Development of Neural Model for Predicting Softness. IPPTA Q. J. Indian Pulp Pap. Tech. Assoc. 2017, 29, 128–135. [Google Scholar]
- Ko, Y.C.; Park, J.Y.; Lee, J.H.; Kim, H.J. Principles of Developing a Softness Evaluation Technology for Hygiene Paper. J. Korea TAPPI 2017, 49, 184–193. [Google Scholar] [CrossRef]
- Spina, R.; Cavalcante, B. Characterizing materials and processes used on paper tissue converting lines. Mater. Today Commun. 2018, 17, 427–437. [Google Scholar] [CrossRef]
- Gigac, J.; Fišerová, M.; Stankovská, M.; Opálená, E. Correlation between subjective and objective assessment of hygienic paper products softness. Pap. Celul. 2018, 73, 52–56. [Google Scholar]
- Ko, Y.C.; Park, J.Y.; Melani, L.; Park, N.Y.; Kim, H.J. Principles of developing physical test methods for disposable consumer products. Nord. Pulp Pap. Res. J. 2019, 34, 75–87. [Google Scholar] [CrossRef]
- Wang, Y.; De Assis, T.; Zambrano, F.; Pal, L.; Venditti, R.; Dasmohapatra, S.; Pawlak, J.; Gonzalez, R. Relationship between Human Perception of Softness and Instrument Measurements. BioResources 2019, 14, 780–795. [Google Scholar] [CrossRef]
- Perng, Y.-S.; Teng, T.-Y.; Chang, C.-H. A study of the softness of household tissues using a tissue softness analyzer and hand-felt panels. TAPPI J. 2019, 18, 195–209. [Google Scholar] [CrossRef]
- Gigac, J.; Fišerová, M.; Stankovská, M.; Maholányiová, M. Prediction of Water-Absorption Capacity and Surface Softness of Tissue Paper Products using Photoclinometry. O Pap. 2019, 80, 91–97. [Google Scholar]
- Mendes, A.D.O.; Vieira, J.C.; Carta, A.M.; Galli, E.; Simões, R.; Silva, M.J.D.S.; Costa, A.P.; Fiadeiro, P.T. Influence of Tissue Paper Converting Conditions on Finished Product Softness. BioResources 2020, 15, 7178–7190. [Google Scholar] [CrossRef]
- Ismail, M.Y.; Patanen, M.; Kauppinen, S.; Kosonen, H.; Ristolainen, M.; Hall, S.A.; Liimatainen, H. Surface analysis of tissue paper using laser scanning confocal microscopy and micro-computed topography. Cellulose 2020, 27, 8989–9003. [Google Scholar] [CrossRef]
- Prinz, M.; Zollner-Croll, H.; Wölfle, C. Hygiene Paper Softness—New insight into the manufacturing process with an optimized tissue softness analyser. In Proceedings of the 16th Minisymposium Verfahrenstechnik & 7th Partikelforum, TU Wien, Wien, Vienna, 21–22 September 2020. [Google Scholar]
- Reitbauer, J.; Harrer, F.; Eckhart, R.; Bauer, W. Focus variation technology as a tool for tissue surface characterization. Cellulose 2021, 28, 6813–6827. [Google Scholar] [CrossRef]
- Vieira, J.C.; Morais, F.; Mendes, A.D.O.; Ribeiro, M.L.; Carta, A.M.; Curto, J.; Amaral, M.E.; Fiadeiro, P.T.; Costa, A.P. Mechanical and softness characterization of “deco” and “micro” embossed tissue papers using finite element model (FEM) validation. Cellulose 2022, 29, 5895–5912. [Google Scholar] [CrossRef]
- Vieira, J.C.; Mendes, A.D.O.; Ribeiro, M.L.; Vieira, A.C.; Carta, A.M.; Fiadeiro, P.T.; Costa, A.P. Embossing Pressure Effect on Mechanical and Softness Properties of Industrial Base Tissue Papers with Finite Element Method Validation. Materials 2022, 15, 4324. [Google Scholar] [CrossRef]
- Vieira, J.C.; Mendes, A.D.O.; Ribeiro, M.L.; Vieira, A.C.; Carta, A.M.; Fiadeiro, P.T.; Costa, A.P. FEM Analysis Validation of Rubber Hardness Impact on Mechanical and Softness Properties of Embossed Industrial Base Tissue Papers. Polymers 2022, 14, 2485. [Google Scholar] [CrossRef]
- Kraljevski, I.; Duckhorn, F.; Tschöpe, C.; Schubert, F.; Wolff, M. Paper Tissue Softness Rating by Acoustic Emission Analysis. Appl. Sci. 2023, 13, 1670. [Google Scholar] [CrossRef]
- Prinz, M.; Zollner-Croll, H.; Bauer, W.; Meltzer, F.P. A New Method to Evaluate the Hand-feel Potential of Furnishes for Tissue Paper Products. BioResources 2021, 16, 684–697. [Google Scholar] [CrossRef]
- Reitbauer, J.; Eckhart, R.; Bauer, W. An analytical approach to assess the interrelation of surface properties and softness of tissue paper. TAPPI J. 2023, 22, 87–95. [Google Scholar] [CrossRef]
- Gwo, C.-B.; Teng, T.-Y.; Chang, C.-H.; Chen, S.-S.; Perng, Y.-S. Quantification of the degree of preference for different tissue products based on a hand-felt tissue test panel. TAPPI J. 2023, 22, 305–320. [Google Scholar] [CrossRef]
- Hollmark, H.; Ampulski, R.S. Measurement of tissue paper softness: A literature review. Nord. Pulp Pap. Res. J. 2004, 19, 345–353. [Google Scholar] [CrossRef]
- Pawlak, J.J.; Frazier, R.; Vera, R.E.; Wang, Y.; Gonzalez, R. Review: The Softness of Hygiene Tissue. BioResources 2022, 17, 3509–3550. [Google Scholar] [CrossRef]
- EMTEC TSA—Tissue Softness Analyzer Manual. Available online: https://www.emtec-electronic.de/en/tsa-tissue-softness-analyzer.html (accessed on 7 June 2018).
- Kawabata, S. The Standardization and Analysis of Hand Evaluation, 2nd ed.; The Textile Machinery Society of Japan: Osaka, Japan, 1980. [Google Scholar]
- Borch, J.; Lyne, M.B.; Mark, R.E.; Habeger, C.C., Jr. Handbook of Physical Testing of Paper, 2nd ed.; Revised and Expanded; Marcel Dekker, Inc.: New York, NY, USA, 2001; Volume 2. [Google Scholar]
- Vieira, J.C.; Mendes, A.D.O.; Carta, A.M.; Fiadeiro, P.T.; Costa, A.P. Optical 3D crepe reconstruction for industrial base tissue paper characterization. Cellulose 2022, 29, 9919–9934, Erratum in Cellulose 2022, 29, 9935–9937. [Google Scholar] [CrossRef]
- Vieira, J.C.; Mendes, A.D.O.; Ribeiro, M.L.; Vieira, A.C.; Carta, A.M.; Fiadeiro, P.T.; Costa, A.P. Embossing Lines and Dots Geometry Effect on the Key Tissue Paper Properties with Finite Element Method Analysis. Polymers 2022, 14, 3448. [Google Scholar] [CrossRef]


| Product ID | TSA Handfeel | Rearrangement of the Tissue Products | Product ID | TSA Handfeel | TSA Rank |
|---|---|---|---|---|---|
| A | High (91) | Rougher | B | Low (50) | 1 |
| B | Low (50) | ↓ | C | Intermediate (68) | 2 |
| C | Intermediate (68) | Softer | A | High (91) | 3 |
| Product ID | Subjective Evaluation | Rearrangement of the Tissue Products | Product ID | Subjective Evaluation | Subjective Rank |
|---|---|---|---|---|---|
| A | Soft (5) | Rougher | B | Rough (1) | 1 |
| B | Rough (1) | ↓ | C | Mild (3) | 2 |
| C | Mild (3) | Softer | A | Soft (5) | 3 |
| Product ID | TSA Rank | Rearrangement of the Tissue Products | Product ID | TSA Rank |
|---|---|---|---|---|
| T01 | 21 | T22 | 1 | |
| T02 | 25 | T14 | 2 | |
| T03 | 16 | T15 | 3 | |
| T04 | 8 | T09 | 4 | |
| T05 | 22 | T08 | 5 | |
| T06 | 19 | T12 | 6 | |
| T07 | 7 | T07 | 7 | |
| T08 | 5 | T04 | 8 | |
| T09 | 4 | T23 | 9 | |
| T10 | 28 | T16 | 10 | |
| T11 | 24 | T20 | 11 | |
| T12 | 6 | T21 | 12 | |
| T13 | 15 | T18 | 13 | |
| T14 | 2 | Rougher | T19 | 14 |
| T15 | 3 | ↓ | T13 | 15 |
| T16 | 10 | Softer | T03 | 16 |
| T17 | 27 | T27 | 17 | |
| T18 | 13 | T26 | 18 | |
| T19 | 14 | T06 | 19 | |
| T20 | 11 | T24 | 20 | |
| T21 | 12 | T01 | 21 | |
| T22 | 1 | T05 | 22 | |
| T23 | 9 | T28 | 23 | |
| T24 | 20 | T11 | 24 | |
| T25 | 26 | T02 | 25 | |
| T26 | 18 | T25 | 26 | |
| T27 | 17 | T17 | 27 | |
| T28 | 23 | T10 | 28 | |
| T29 | 29 | T29 | 29 |
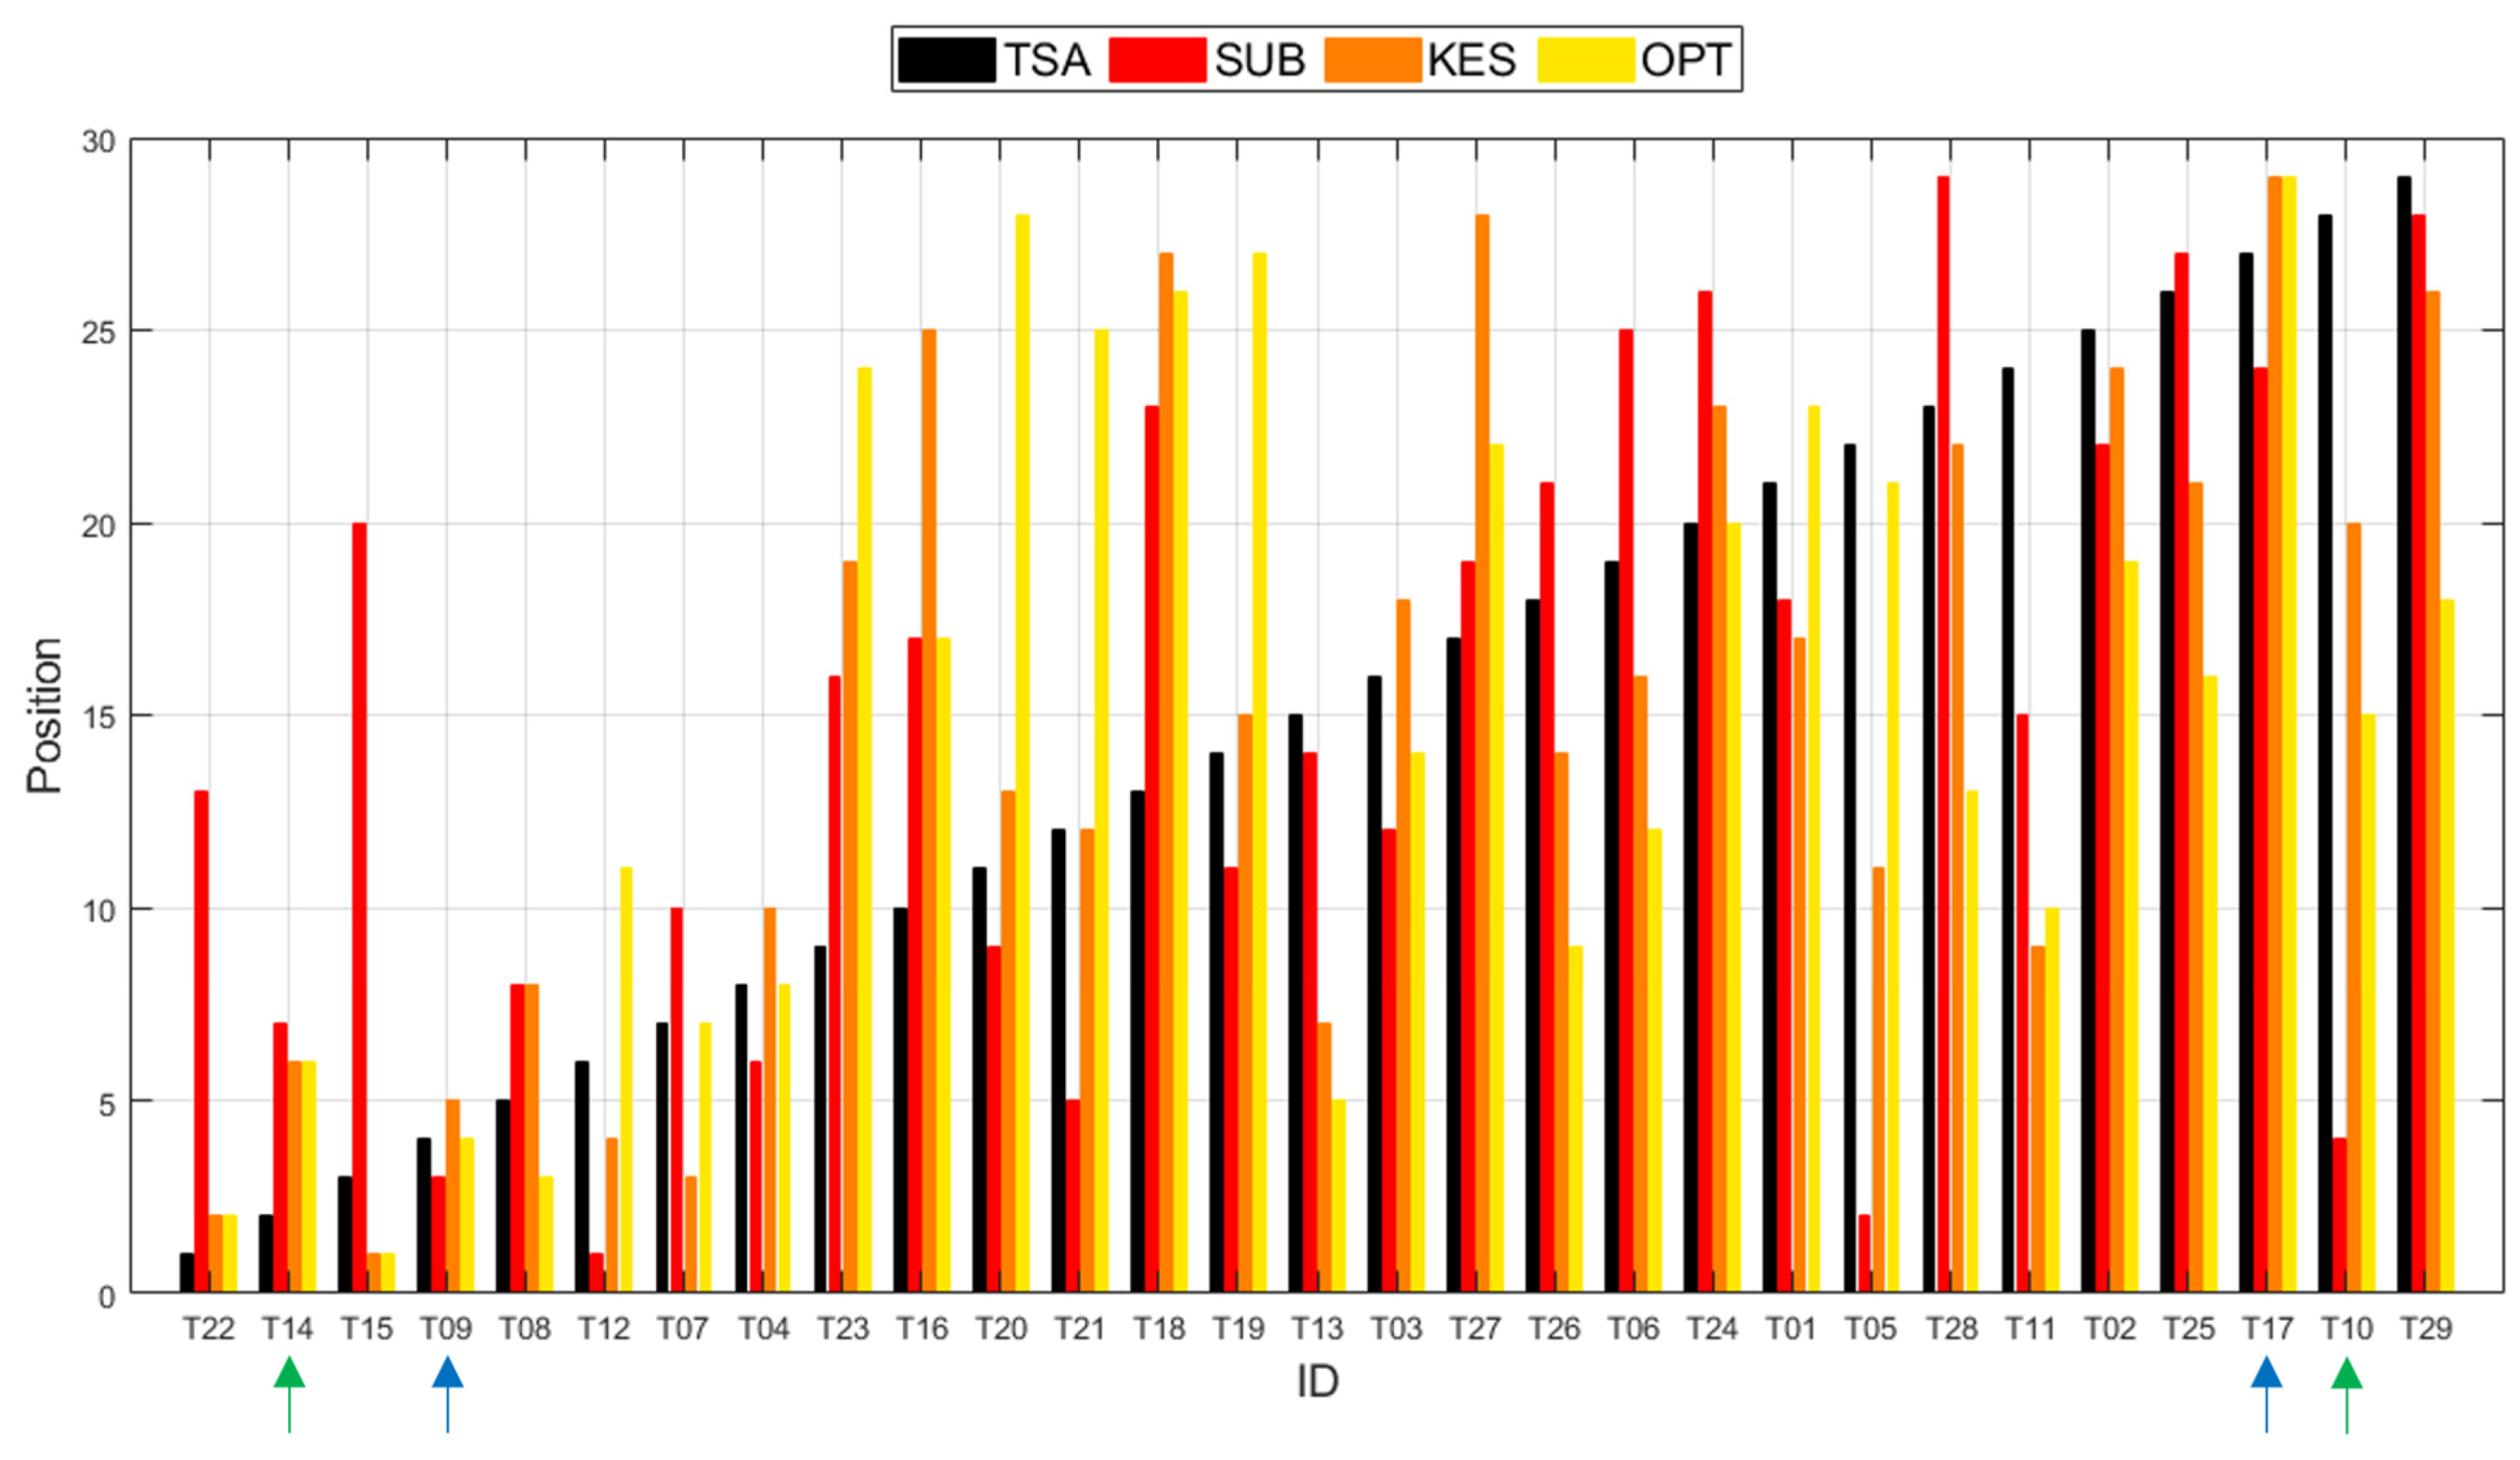
| Ranks | ||||
|---|---|---|---|---|
| Product ID | TSA | SUB | KES | OPT |
| T22 | 1 | 13 | 2 | 2 |
| T14 | 2 | 7 | 6 | 6 |
| T15 | 3 | 20 | 1 | 1 |
| T09 | 4 | 3 | 5 | 4 |
| T08 | 5 | 8 | 8 | 3 |
| T12 | 6 | 1 | 4 | 11 |
| T07 | 7 | 10 | 3 | 7 |
| T04 | 8 | 6 | 10 | 8 |
| T23 | 9 | 16 | 19 | 24 |
| T16 | 10 | 17 | 25 | 17 |
| T20 | 11 | 9 | 13 | 28 |
| T21 | 12 | 5 | 12 | 25 |
| T18 | 13 | 23 | 27 | 26 |
| T19 | 14 | 11 | 15 | 27 |
| T13 | 15 | 14 | 7 | 5 |
| T03 | 16 | 12 | 18 | 14 |
| T27 | 17 | 19 | 28 | 22 |
| T26 | 18 | 21 | 14 | 9 |
| T06 | 19 | 25 | 16 | 12 |
| T24 | 20 | 26 | 23 | 20 |
| T01 | 21 | 18 | 17 | 23 |
| T05 | 22 | 2 | 11 | 21 |
| T28 | 23 | 29 | 22 | 13 |
| T11 | 24 | 15 | 9 | 10 |
| T02 | 25 | 22 | 24 | 19 |
| T25 | 26 | 27 | 21 | 16 |
| T17 | 27 | 24 | 29 | 29 |
| T10 | 28 | 4 | 20 | 15 |
| T29 | 29 | 28 | 26 | 18 |
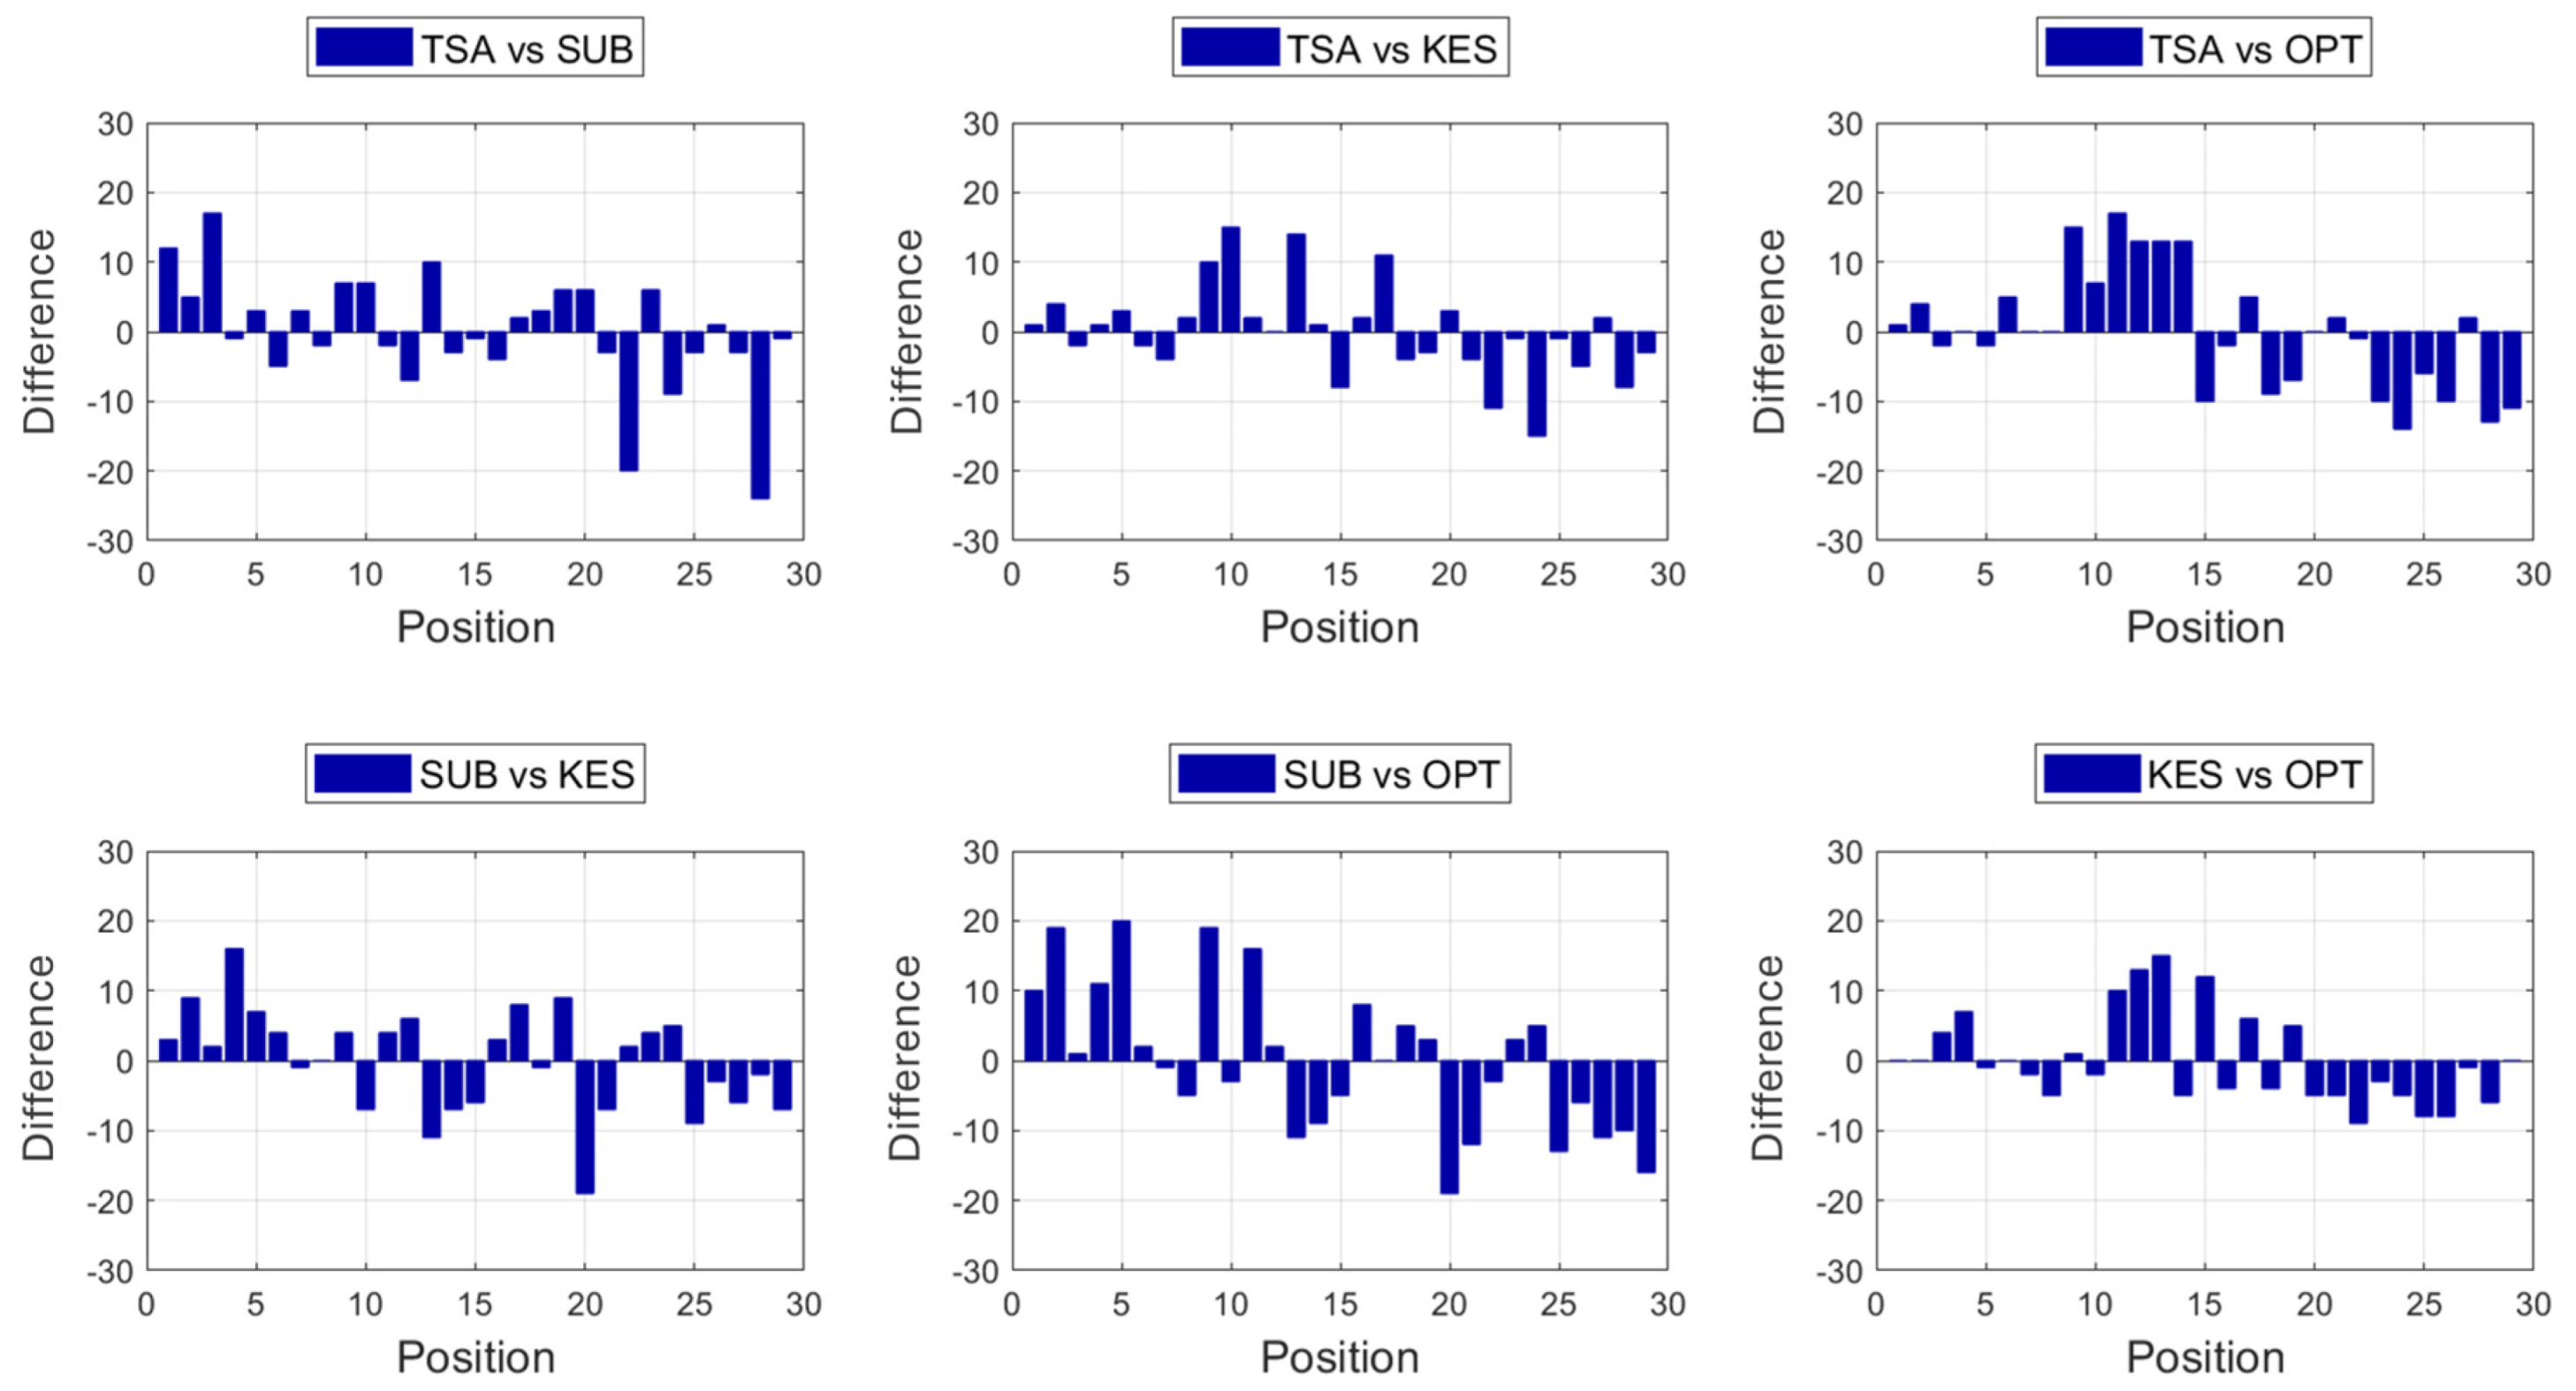
| Rank Differences Between Approaches | ||||||
|---|---|---|---|---|---|---|
| Product ID | TSA vs. SUB | TSA vs. KES | TSA vs. OPT | SUB vs. KES | SUB vs. OPT | KES vs. OPT |
| T22 | +12 | +1 | +1 | +3 | +10 | 0 |
| T14 | +5 | +4 | +4 | +9 | +19 | 0 |
| T15 | +17 | −2 | −2 | +2 | +1 | +4 |
| T09 | −1 | +1 | 0 | +16 | +11 | +7 |
| T08 | +3 | +3 | −2 | +7 | +20 | −1 |
| T12 | −5 | −2 | +5 | +4 | +2 | 0 |
| T07 | +3 | −4 | 0 | −1 | −1 | −2 |
| T04 | −2 | +2 | 0 | 0 | −5 | −5 |
| T23 | +7 | +10 | +15 | +4 | +19 | +1 |
| T16 | +7 | +15 | +7 | −7 | −3 | −2 |
| T20 | −2 | +2 | +17 | +4 | +16 | +10 |
| T21 | −7 | 0 | +13 | +6 | +2 | +13 |
| T18 | +10 | +14 | +13 | −11 | −11 | +15 |
| T19 | −3 | +1 | +13 | −7 | −9 | −5 |
| T13 | −1 | −8 | −10 | −6 | −5 | +12 |
| T03 | −4 | +2 | −2 | +3 | +8 | −4 |
| T27 | +2 | +11 | +5 | +8 | 0 | +6 |
| T26 | +3 | −4 | −9 | −1 | +5 | −4 |
| T06 | +6 | −3 | −7 | +9 | +3 | +5 |
| T24 | +6 | +3 | 0 | −19 | −19 | −5 |
| T01 | −3 | −4 | +2 | −7 | −12 | −5 |
| T05 | −20 | −11 | −1 | +2 | −3 | −9 |
| T28 | +6 | −1 | −10 | +4 | +3 | −3 |
| T11 | −9 | −15 | −14 | +5 | +5 | −5 |
| T02 | −3 | −1 | −6 | −9 | −13 | −8 |
| T25 | +1 | −5 | −10 | −3 | −6 | −8 |
| T17 | −3 | +2 | +2 | −6 | −11 | −1 |
| T10 | −24 | −8 | −13 | −2 | −10 | −6 |
| T29 | −1 | −3 | −11 | −7 | −16 | 0 |
| Average | 0.0 | 0.0 | 0.0 | 0.0 | 0.0 | 0.0 |
| Standard Deviation | 8.4 | 6.7 | 8.7 | 7.4 | 10.7 | 6.5 |
| Product ID (Order Based on KES) | KES Rank | OPT Rank | Differences (KES vs. OPT) |
|---|---|---|---|
| T15 | 1 | 1 | 0 |
| T22 | 2 | 2 | 0 |
| T07 | 3 | 7 | +4 |
| T12 | 4 | 11 | +7 |
| T09 | 5 | 4 | −1 |
| T14 | 6 | 6 | 0 |
| T13 | 7 | 5 | −2 |
| T08 | 8 | 3 | −5 |
| T11 | 9 | 10 | +1 |
| T04 | 10 | 8 | −2 |
| T05 | 11 | 21 | +10 |
| T21 | 12 | 25 | +13 |
| T20 | 13 | 28 | +15 |
| T26 | 14 | 9 | −5 |
| T19 | 15 | 27 | +12 |
| T06 | 16 | 12 | −4 |
| T01 | 17 | 23 | +6 |
| T03 | 18 | 14 | −4 |
| T23 | 19 | 24 | +5 |
| T10 | 20 | 15 | −5 |
| T25 | 21 | 16 | −5 |
| T28 | 22 | 13 | −9 |
| T24 | 23 | 20 | −3 |
| T02 | 24 | 19 | −5 |
| T16 | 25 | 17 | −8 |
| T29 | 26 | 18 | −8 |
| T18 | 27 | 26 | −1 |
| T27 | 28 | 22 | −6 |
| T17 | 29 | 29 | 0 |
| Product ID | Line | Thickness | Number of Plies | TSA Rank | SUB Rank | KES Rank | OPT Rank |
|---|---|---|---|---|---|---|---|
| T15 | Industrial | Low | 2 | 3 | 20 | 1 | 1 |
| T17 | Commercial | High | 5 | 27 | 24 | 29 | 29 |
| Product ID | Line | Thickness | Number of Plies | TSA Rank | SUB Rank | KES Rank | OPT Rank |
|---|---|---|---|---|---|---|---|
| T20 | Commercial | High | 2 | 11 | 9 | 13 | 28 |
Disclaimer/Publisher’s Note: The statements, opinions and data contained in all publications are solely those of the individual author(s) and contributor(s) and not of MDPI and/or the editor(s). MDPI and/or the editor(s) disclaim responsibility for any injury to people or property resulting from any ideas, methods, instructions or products referred to in the content. |
© 2025 by the authors. Licensee MDPI, Basel, Switzerland. This article is an open access article distributed under the terms and conditions of the Creative Commons Attribution (CC BY) license (https://creativecommons.org/licenses/by/4.0/).
Share and Cite
Mendes, A.d.O.; Vieira, J.C.; Carta, A.M.; Curto, J.M.R.; Amaral, M.E.; Costa, A.P.; Fiadeiro, P.T. Tissue Paper Softness: A Comparison Between Different Experimental Assessment Approaches. Materials 2025, 18, 228. https://doi.org/10.3390/ma18020228
Mendes AdO, Vieira JC, Carta AM, Curto JMR, Amaral ME, Costa AP, Fiadeiro PT. Tissue Paper Softness: A Comparison Between Different Experimental Assessment Approaches. Materials. 2025; 18(2):228. https://doi.org/10.3390/ma18020228
Chicago/Turabian StyleMendes, António de O., Joana C. Vieira, Ana M. Carta, Joana M. R. Curto, Maria E. Amaral, Ana P. Costa, and Paulo T. Fiadeiro. 2025. "Tissue Paper Softness: A Comparison Between Different Experimental Assessment Approaches" Materials 18, no. 2: 228. https://doi.org/10.3390/ma18020228
APA StyleMendes, A. d. O., Vieira, J. C., Carta, A. M., Curto, J. M. R., Amaral, M. E., Costa, A. P., & Fiadeiro, P. T. (2025). Tissue Paper Softness: A Comparison Between Different Experimental Assessment Approaches. Materials, 18(2), 228. https://doi.org/10.3390/ma18020228