To investigate the variation patterns of fatigue life in weathered steel specimens with V-groove welded joints affected by corrosion under high-altitude low-temperature environments, fatigue tests were conducted on corroded V-groove welded joint specimens of weathered steel based on orthogonal experimental design. The fatigue test results were calculated and summarized, followed by comparative analysis to identify the optimal combination of influencing factors for fatigue life.
2.1. Specimen Dimension Design and Parameters
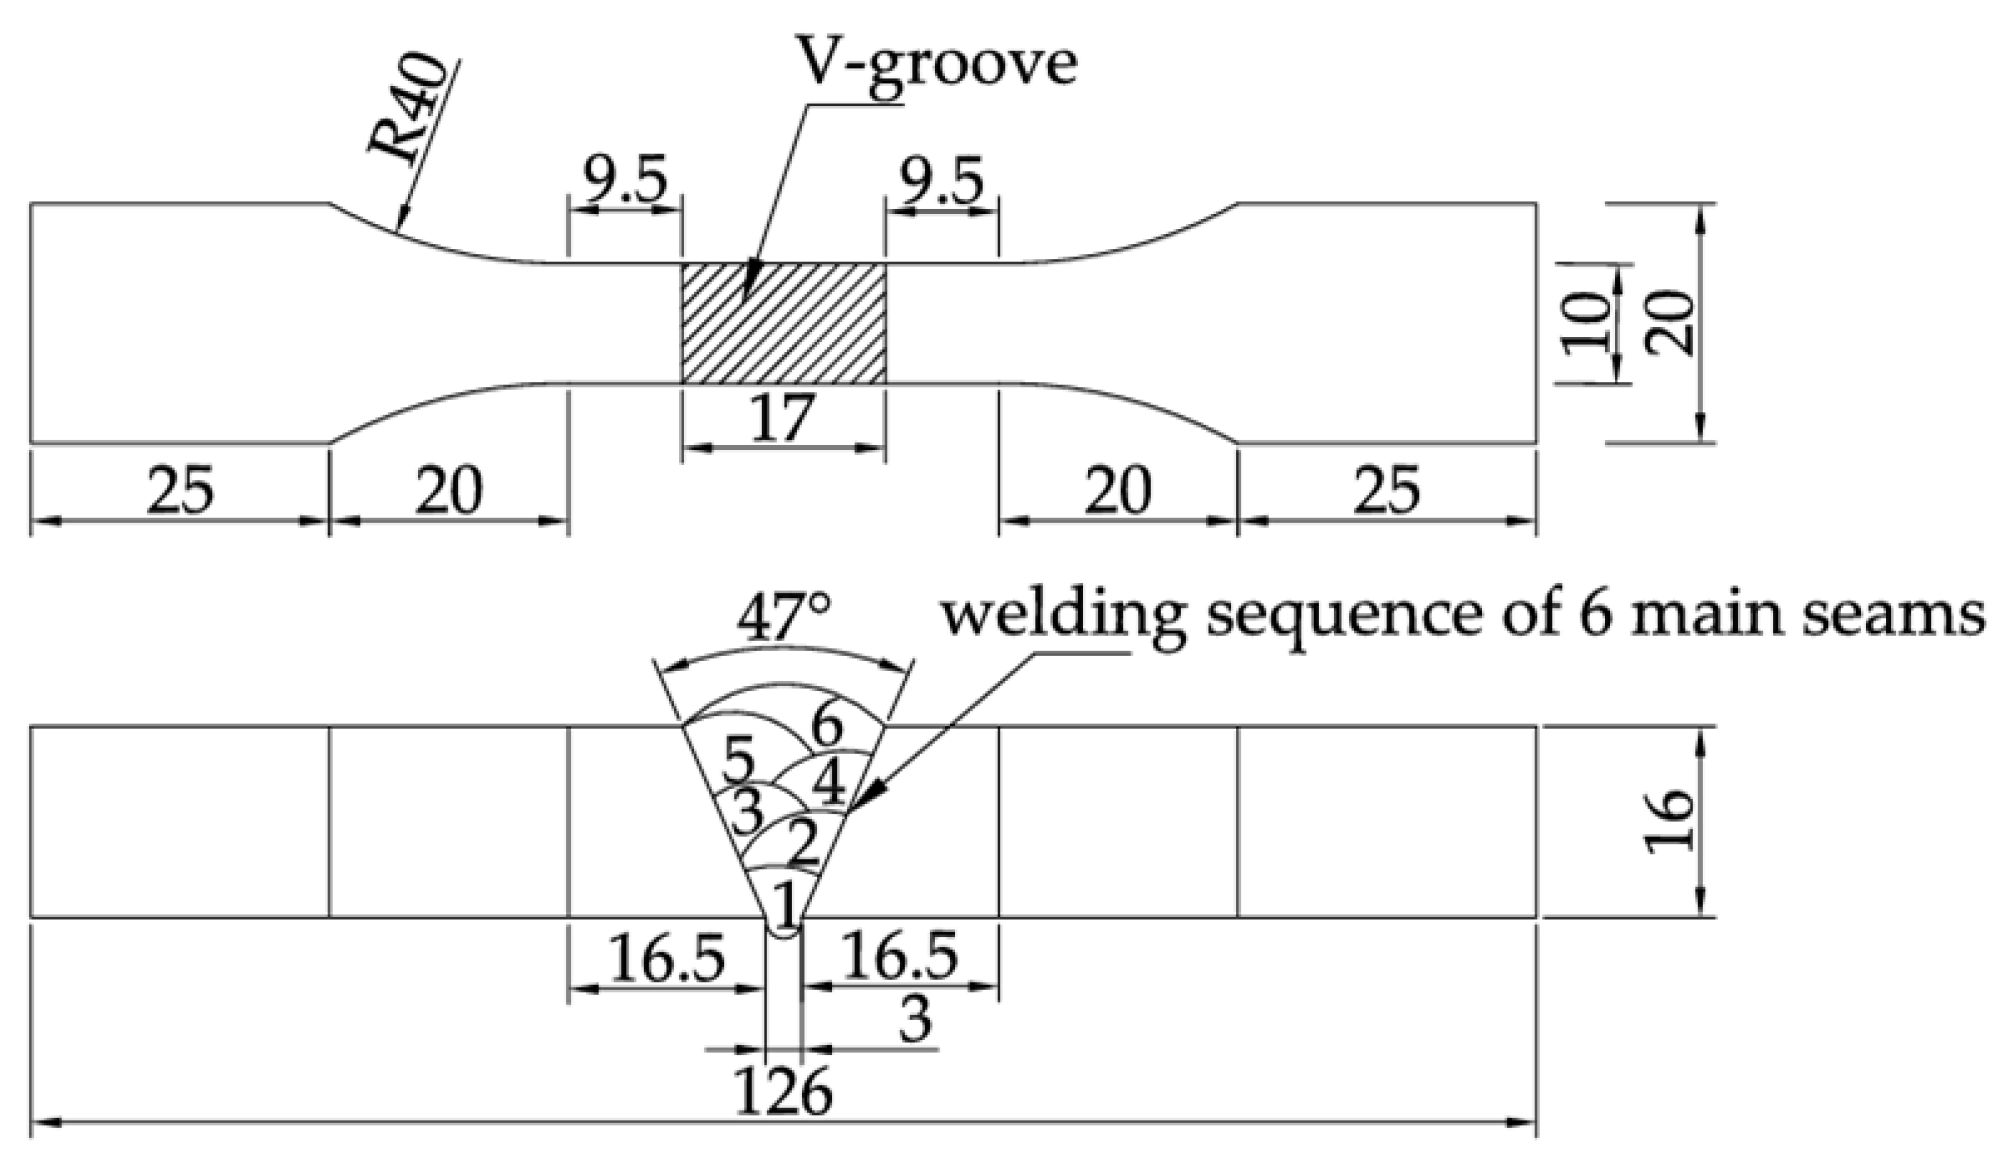
This test utilized 16 mm thick Q500qENH weathering steel plates to prepare V-groove welded joint specimens, with geometric dimensions shown in
Figure 1 and base metal chemical composition detailed in
Table 1. To address the welding characteristics of this high-strength bridge steel, JWER60NHQ solid wire (GMAW) with a diameter of 1.20 mm and JWS60NHQ submerged arc welding wire (SAW) with a diameter of 4 mm were selected. The chemical compositions of both wires are specified in
Table 2. Take the chemical compositions of the weathering steel base metal and weld metal (
Table 1 and
Table 2) from the actual production data provided by the manufacturer. Before factory delivery of the specimens, follow the weld inspection methods for welded specimens specified in GB/T 11345-2023 [
18], and conduct UF Union-PXUT-350BPLUS (Nantong City, Jiangsu Province, China) ultrasonic flaw detection on the welds of all weathering steel V-groove welded joint specimens in each group to avoid defects such as insufficient weld fusion. A hybrid welding method combining gas metal arc welding (GMAW) and submerged arc welding (SAW) was employed. The procedure strictly adhered to the technical requirements of: GB/T 985.1-2008 [
19], and GB 50661-2011 [
20]. The specific welding parameters of Q500qENH weathering steel V-groove welded joint specimens are presented in
Table 3, including welding passes, welding current, welding voltage, and welding speed. Representative welded specimens were visually inspected, and the average weld toe transition radius of the specimen welds was found to be approximately 15 mm, with the weld toe reinforcement around 1.2 mm—both meet the geometric dimension requirements for welded specimen welds specified in GB 50661-2011 [
20] (see
Table 4). To ensure uniform exposure of the test specimens to the corrosive medium, a surface pretreatment was conducted prior to periodic immersion corrosion testing, following the national standard GB/T 16545-2015 [
21]. The pretreatment involved a combination of grinding with an Dongcheng-DCSM02-100E (Nantong City, Jiangsu Province, China) angle grinder and immersion in an acetone solution to remove surface impurities and the dense oxide layer on the metal. After completing the above pretreatment, the standardized specimens were thoroughly dried, followed by dimensional measurement and systematic numbering (see
Table 4 for details).
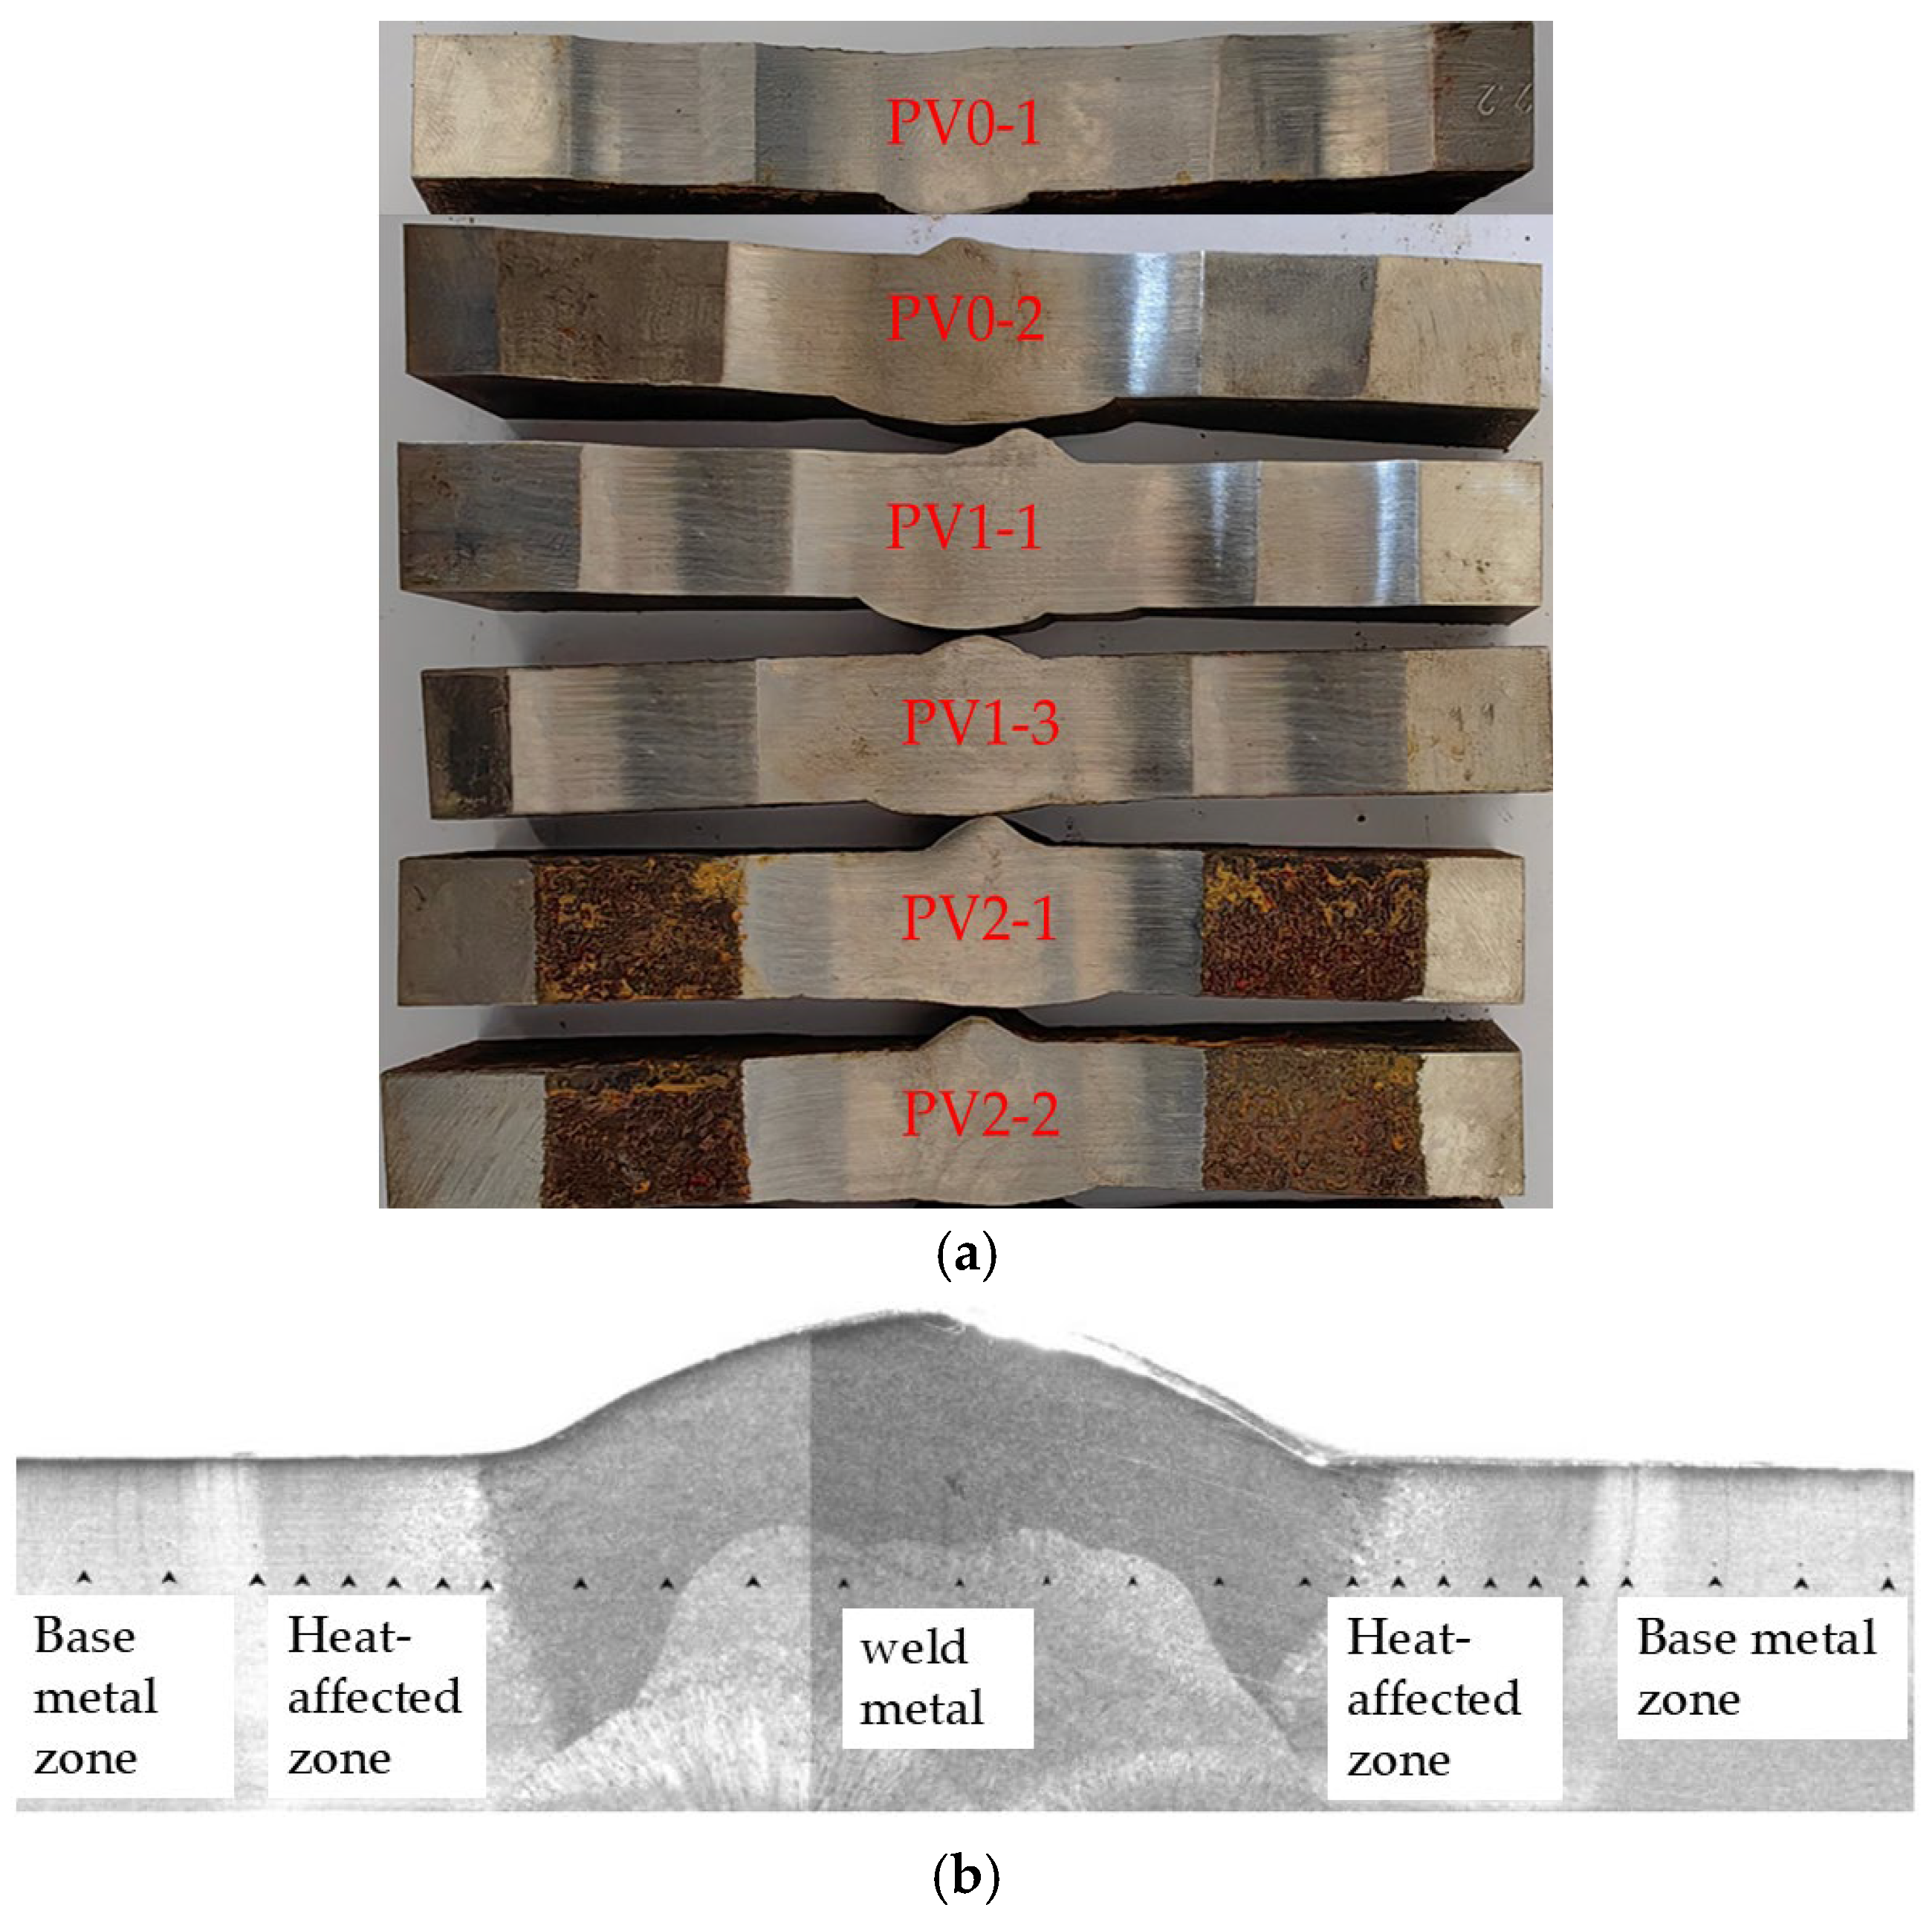
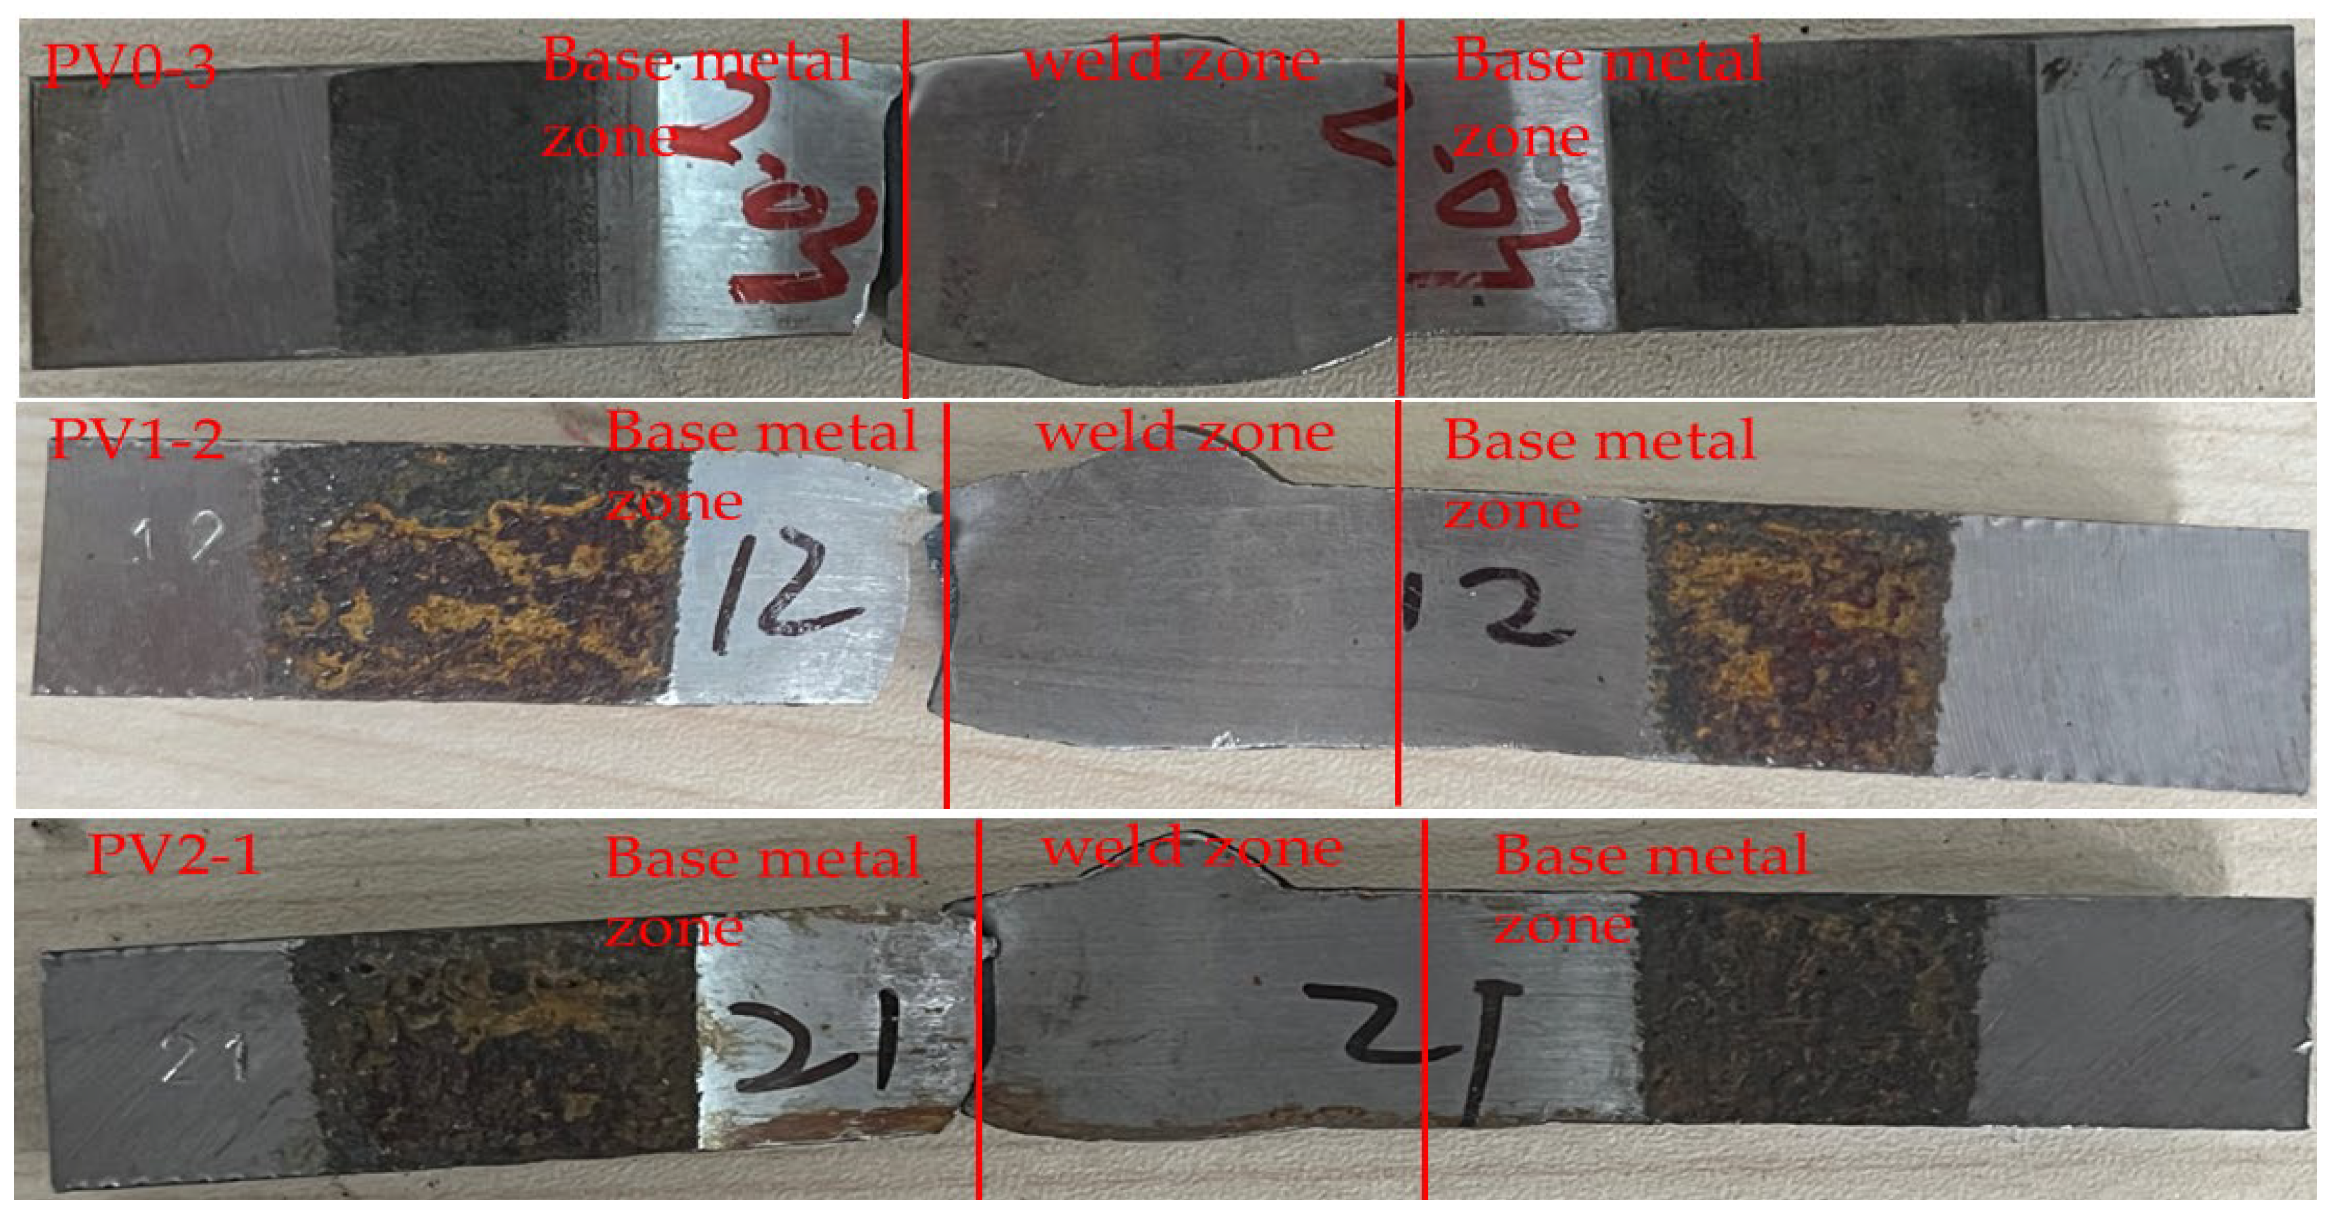
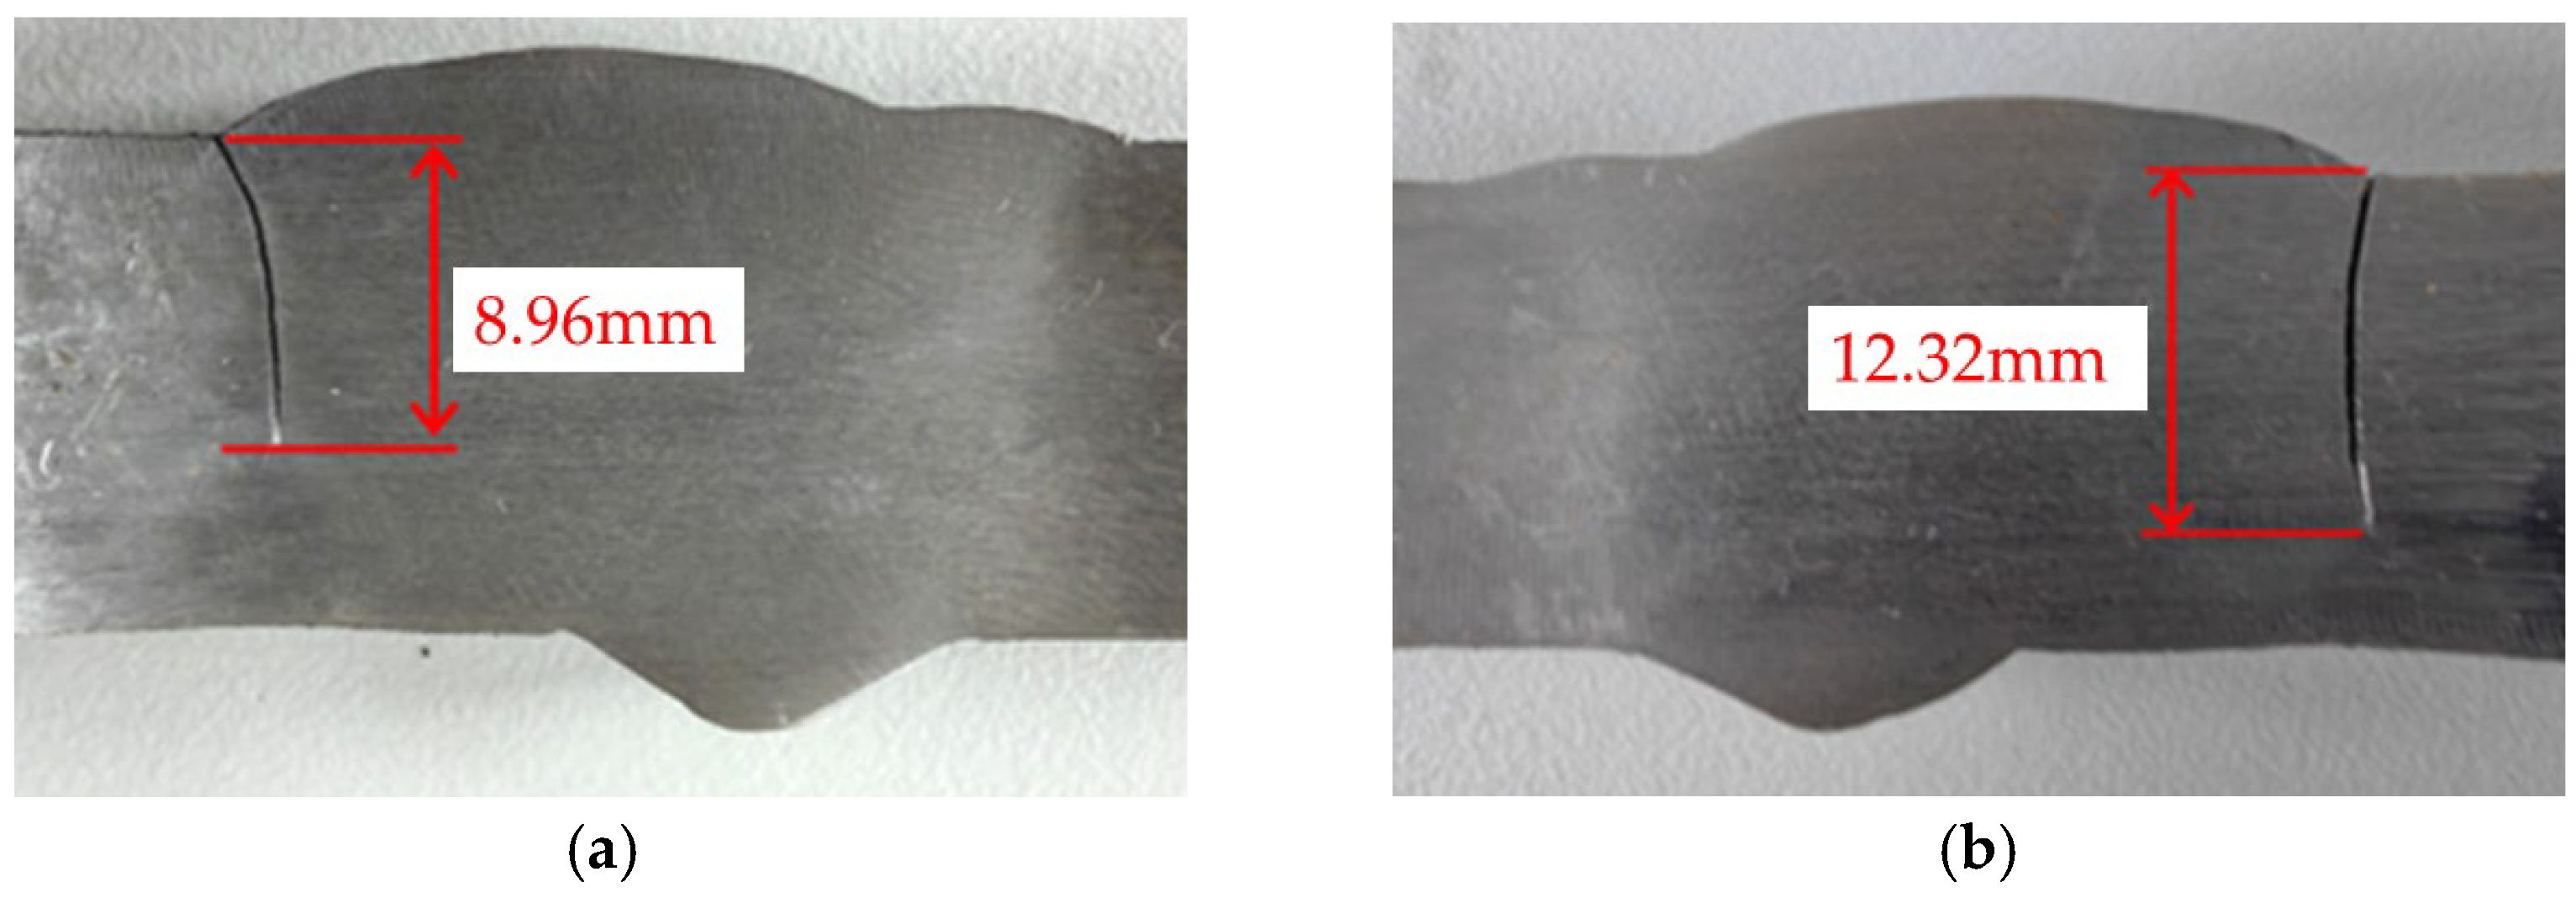
The specimen numbering adopts a four-level coding system: “test type-specimen form-corrosion cycle-parallel sample serial number”. For example, the code “PV2-2” represents: the second parallel specimen (2) after 2 corrosion cycles (2) of V-groove welded joint specimen (V) in fatigue test (P). This coding system ensures traceability of test samples and scientific management of experimental data. The morphology of the finished V-groove welded joint specimens is shown in
Figure 2a. Due to the limitation of polishing equipment, the production factory only polished some corroded specimens. Due to the shooting conditions of the production factory, only two specimens from each group were taken for recording. The distribution of the base metal zone, heat-affected zone, and weld zone of the V-groove welded joint specimens is shown in
Figure 2b.
2.2. Alternate Immersion Corrosion Test
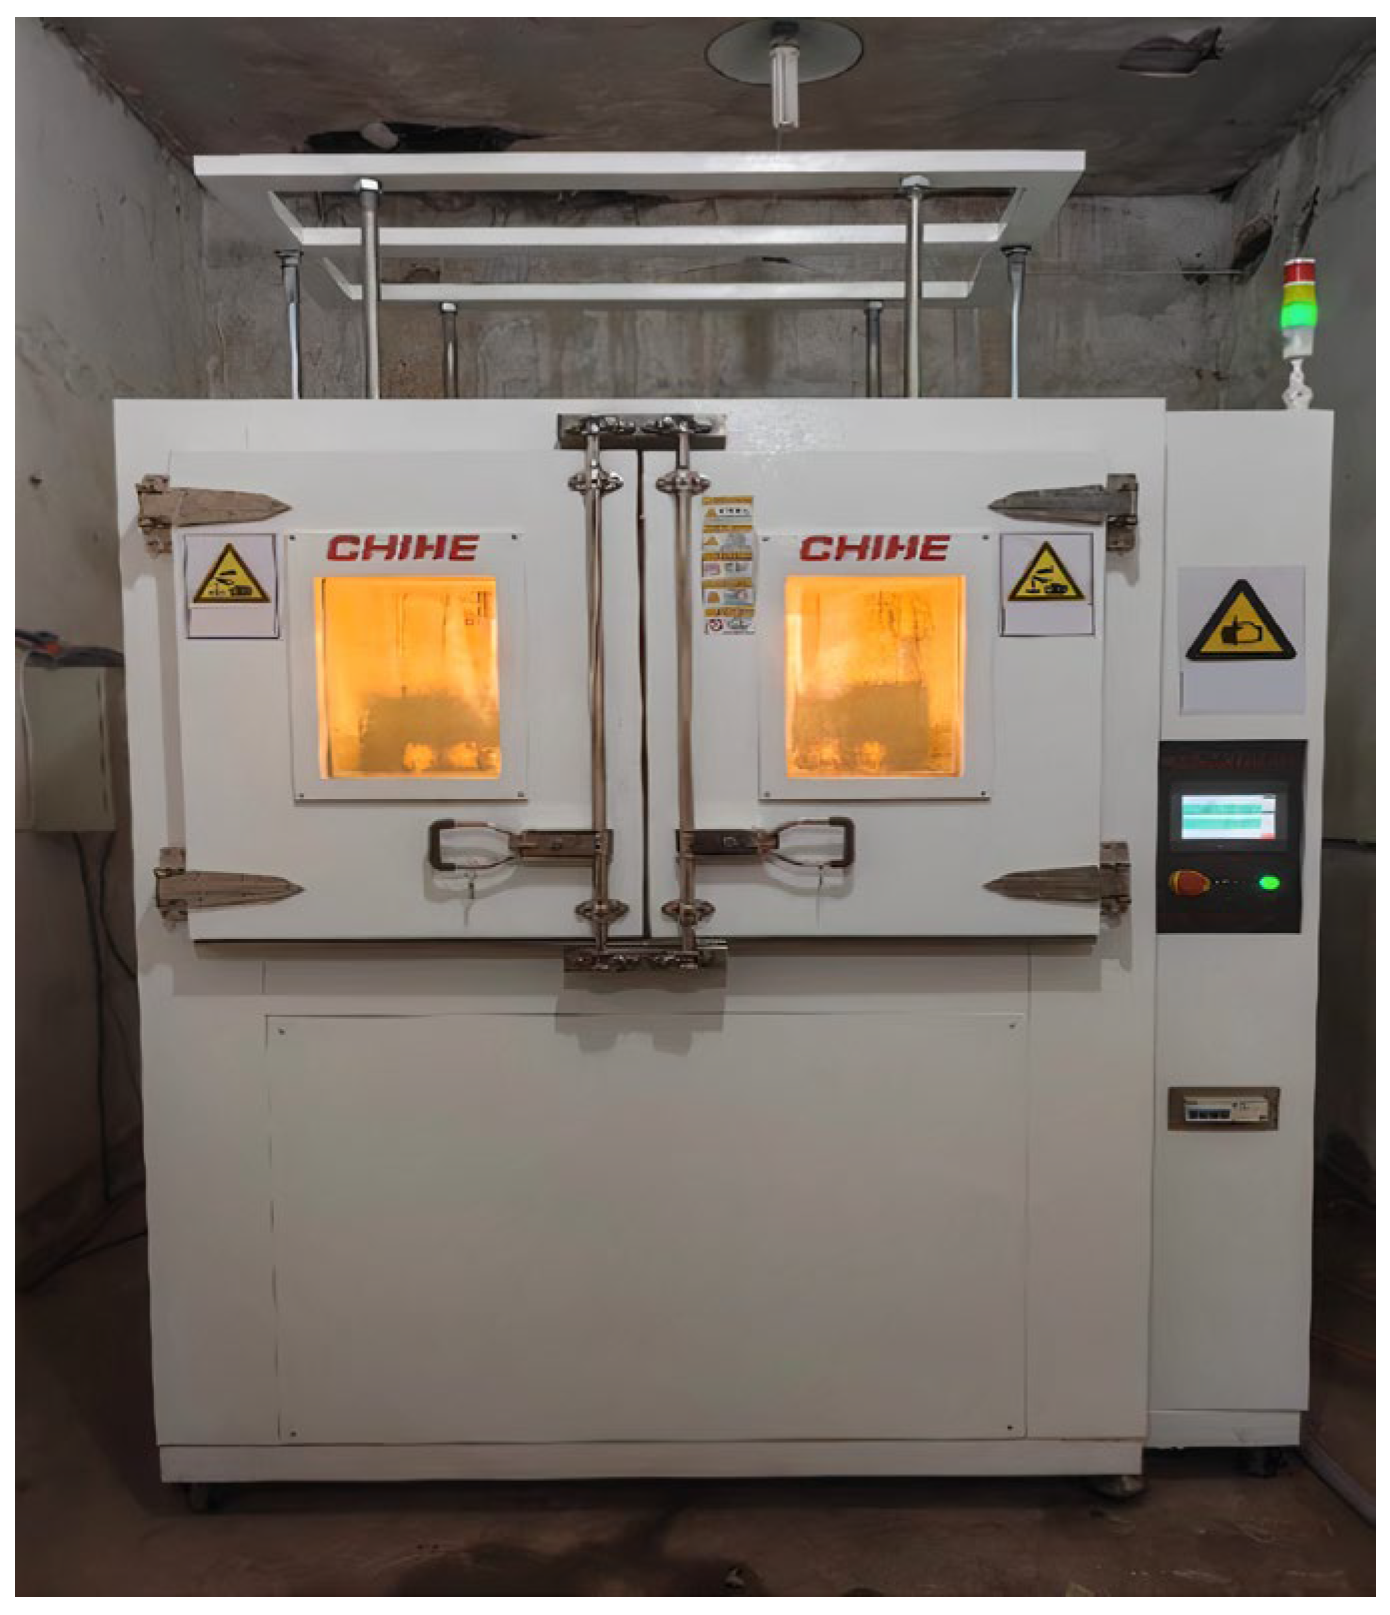
This study employed a standardized periodic immersion corrosion test apparatus (
Figure 3) to conduct cyclic immersion corrosion tests on three groups of fatigue specimens (nine in total) under three corrosion durations: 0 days (0 d), 9 days (9 d), and 18 days (18 d). The corrosion process was designed in accordance with: TB/T 2375-1993 [
22], and GB/T 19746-2018 [
23].
When simulating the corrosive environment of plateau regions using a sodium bisulfite (NaHSO3) solution, periodic immersion corrosion tests were performed on weathering steel specimens via a dry-wet cyclic immersion method.
The requirements of TB/T 2375-1993 [
22] were followed: when conducting periodic immersion corrosion tests via the dry-wet cyclic immersion method, the duration of each dry-wet cycle (including drying time and immersion time) was set to 60 ± 3 min—with the immersion time at 12 ± 1.5 min and the drying time at 48 ± 1.5 min [
24]. During the corrosion test, the temperature in the cyclic immersion corrosion test chamber (
Figure 3) was maintained at 45 ± 2 °C, and the relative humidity was maintained at 70 ± 5% RH.
In related work from the same group [
25], cyclic immersion corrosion tests were conducted on Q500qENH weathering steel V-groove welded joint specimens using a sodium bisulfite (NaHSO
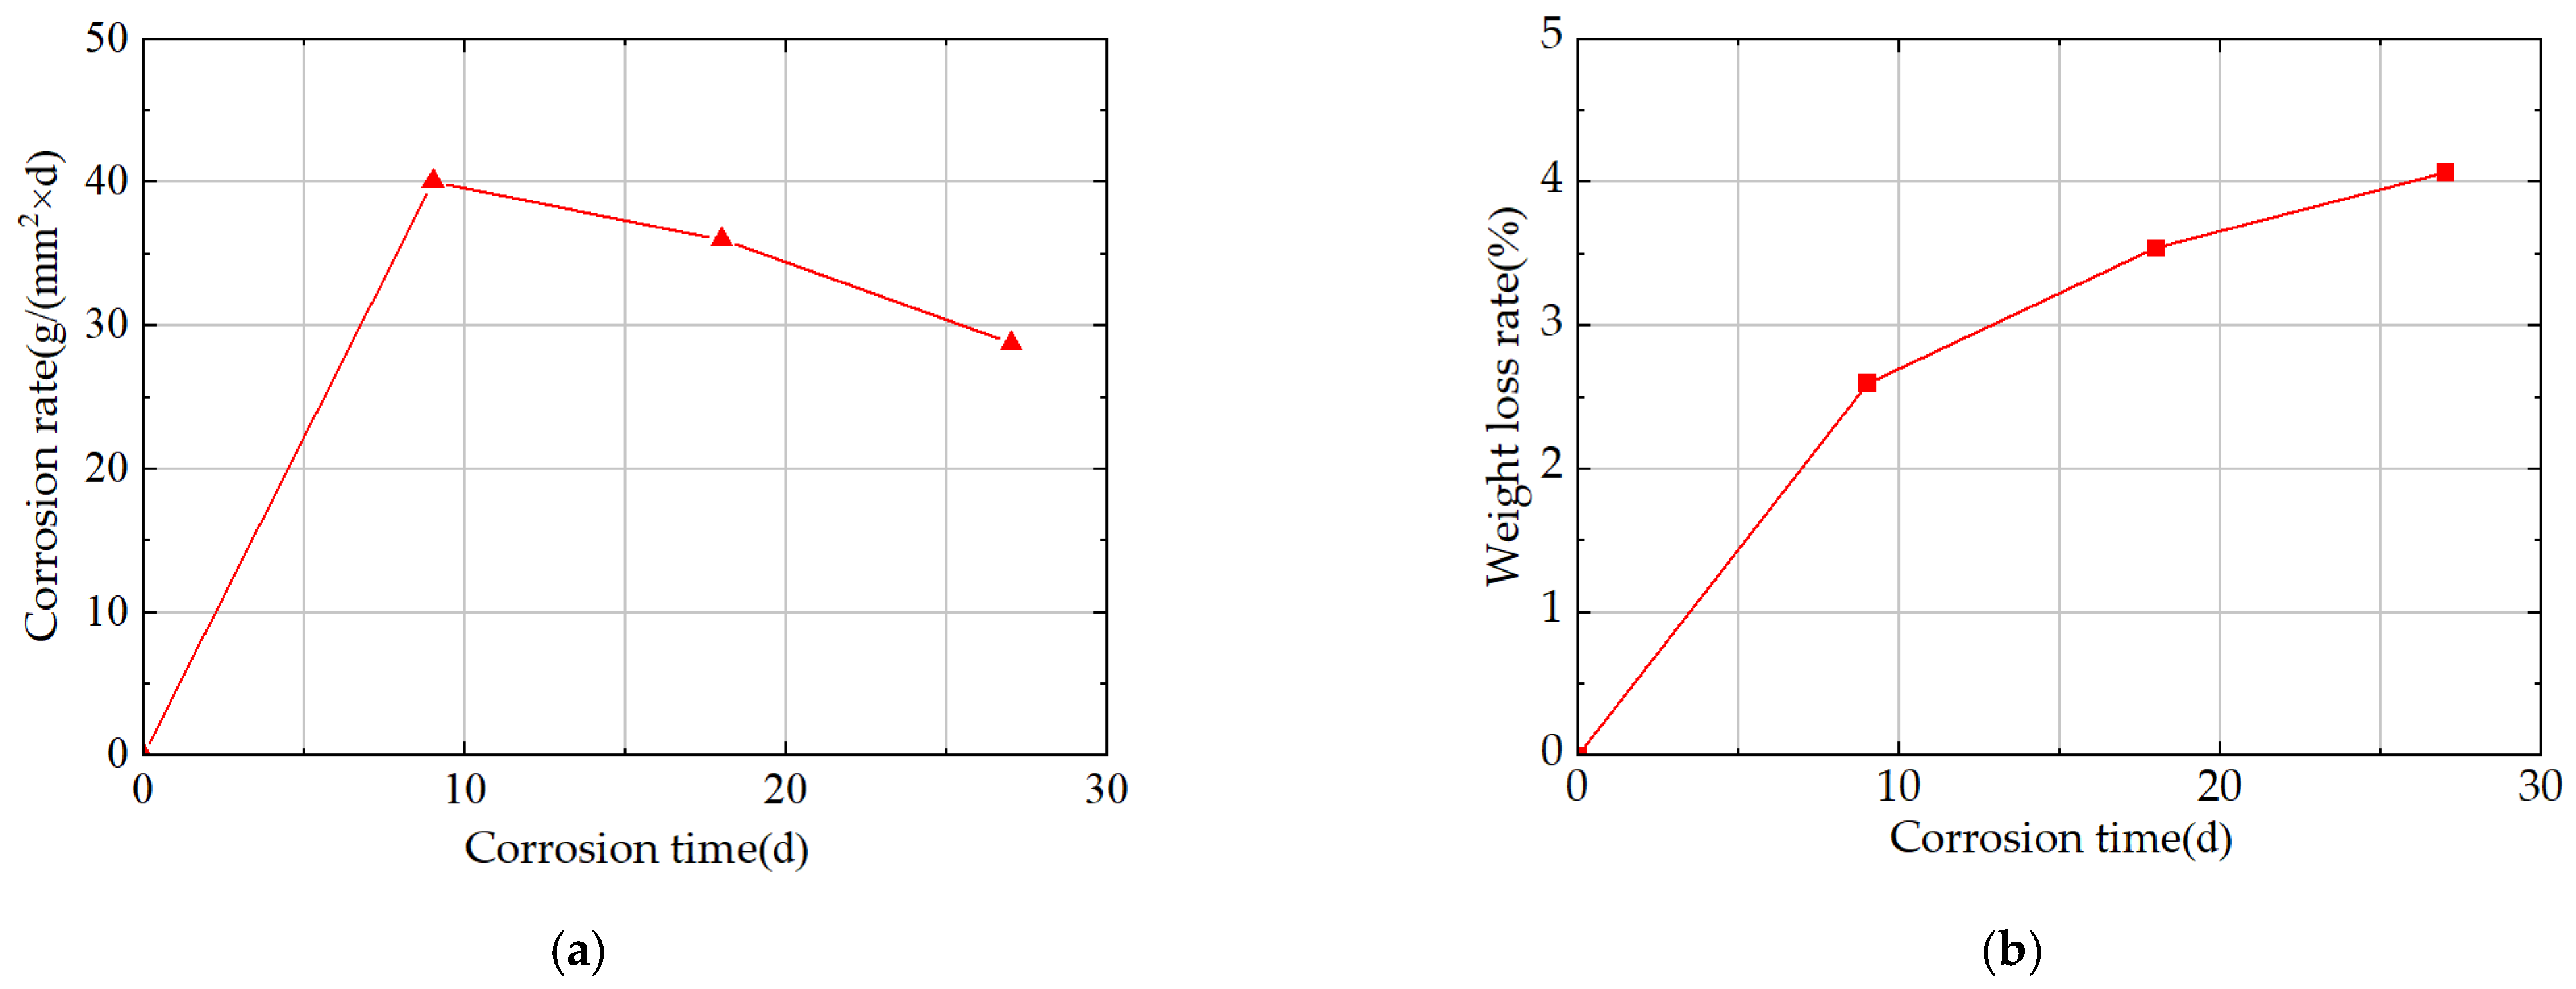
3) corrosion solution for durations of 0 days (0 d), 9 days (9 d), 18 days (18 d), and 27 days (27 d), and the corrosion rate of the corroded specimens was analyzed (see
Figure 4a).
Results show that the specimens’ corrosion rate peaks at 9 d; from 9 d to 27 d, the corrosion rate decreases with prolonged corrosion time and gradually stabilizes. Specifically, the corrosion rate at 18 d is 10.18% lower than that at 9 d, and the corrosion rate at 27 d is 20.00% lower than that at 9 d.
The variation in weight loss rate with corrosion time in integral welded joint specimens is shown in
Figure 4b. For these integral specimens, the weight loss rate reaches 2.60% at 9 d; at this point, the rust layer on the specimens remains incompletely dense, leading to a relatively high corrosion rate and a nearly linear increase in mass loss. The weight loss rate of the integral specimens reaches 3.54% at 18 d, an increase of 0.94% compared with that at 9 d; at 27 d, it reaches 4.07%, with an increase of only 0.53% compared with that at 18 d.
This phenomenon can be explained as follows: as a dense protective rust layer gradually forms on the specimen surface, the contact area between the corrosive medium and the specimen surface decreases gradually, causing the corrosion rate to decline over time and ultimately resulting in a sublinear growth characteristic of weight loss rate with corrosion time.
For exploratory analysis, the 0–18 d period in cyclic immersion corrosion tests was treated as a complete corrosion cycle; the 0–9 d interval within this cycle was defined as the “early corrosion stage,” and 9–18 d was defined as the “late corrosion stage.” Such cyclic immersion corrosion tests were conducted to explore the variation law of fatigue performance of weathering steel V-groove welded joint specimens with corrosion time.
In SO
2-containing industrial atmospheres, weathering steel surfaces form corrosion products mainly consisting of α-FeOOH, γ-FeOOH, and small amounts of Fe
3O
4. The rust layer initially forms with γ-FeOOH as the initial corrosion product. As corrosion proceeds, γ-FeOOH transforms into the more stable α-FeOOH, and the oxide film densifies [
26].
In related work from the same group [
25], NaHSO
3 solution was used as the corrosive medium to conduct cyclic immersion corrosion tests on Q500qENH weathering steel. XRD phase analysis of the rust layer was performed to reveal specific components: acicular γ-FeOOH, rose petal-like β-FeOOH, cotton ball-shaped α-FeOOH, and small amounts of Fe
3O
4. As corrosion time extends, γ-FeOOH converts to α-FeOOH. This similarity in phase evolution confirms that using NaHSO
3 solution in cyclic immersion tests simulates corrosion processes analogous to those in SO
2-containing plateau atmospheric environments.
Given the increasingly severe industrial pollution in the western plateau regions of China, such as the continuous rise in sulfur dioxide (SO
2) emissions in Sichuan and Qinghai provinces [
27], it is recognized that harsh environmental conditions significantly reduce the corrosion resistance of weathering steel welded joint specimens. Accelerated tests under simulated harsh conditions were therefore performed. Thus, sodium bisulfite (NaHSO
3) solution with an initial concentration of (1.00 ± 0.05) × 10
−2 mol/L was used as the corrosive medium. Supplementary NaHSO
3 corrosive solution (concentration: 2.00 × 10
−2 mol/L) was added daily, no more than twice, with each addition taking no more than two minutes to maintain the concentration of NaHSO
3 solution in the periodic immersion corrosion test chamber at (1.00 ± 0.05) × 10
−2 mol/L, and accelerated corrosion tests were performed on weathering steel fatigue specimens.
The concentration design is based on the following scientific rationale: firstly, the NaHSO3 solution can form an effective electrochemical corrosion system with the weathering steel component, significantly accelerating the corrosion process; secondly, experimental measurements show that the pH value of this NaHSO3 solution is 4.60 ± 0.20, which aligns well with the weakly acidic condensate environment (primarily composed of SO2 hydration products) naturally formed on weathering steel component surfaces in plateau regions. This experimental design not only ensures that the electrochemical characteristics of the corrosion process match real-world conditions but also guarantees the similarity in morphology and composition of corrosion products. It thereby provides a reliable experimental foundation for studying the corrosion mechanisms of weathering steel in sulfur-polluted atmospheric environments in plateau areas.
It should be clarified that the applicability of the cyclic immersion corrosion tests conducted in this study—which use (1.00 ± 0.05) × 10−2 mol/L NaHSO3 solution as the corrosion medium—is limited to highly SO2-enriched regions of western China (e.g., western Sichuan, eastern Qinghai).
The tests provide reference data for the corrosion behavior of 16 mm thick Q500qENH weathering steel V-groove welded joints in these regions; the corrosion morphology and rate trends they exhibit preliminarily reflect the long-term outdoor exposure characteristics of the material under such specific conditions.
It should be emphasized that these test results do not directly equate to the on-site corrosion behavior of Q500qENH weathering steel in all plateau regions or under all structural forms of components. In specific engineering applications, it is necessary to combine actual environmental parameters of the target region (e.g., SO2 concentration, temperature, humidity) with structural characteristics of the components and conduct further targeted verification.
2.3. Fatigue Testing Protocol for Welded Specimens
Multiple parameters (e.g., corrosion time, stress level, temperature) influence the fatigue performance of Q500qENH weathering steel V-groove welded joint specimens. Therefore, these three parameters are included in the fatigue test protocol for Q500qENH weathering steel V-groove welded joint specimens.
For multi-factor coupling test design, the variable control approach by Mehdi et al. [
28] is referred to: gradient levels of key parameters (e.g., magnetic field intensity, purification time) are set to exploratively screen for optimal working conditions, providing references for the rational design of the “corrosion-low temperature-stress” multi-variables in fatigue tests of weathering steel. Herein, the orthogonal test design approach matches the requirements of multi-factor coupling test design. Given limited experimental resources, the L
9(3
3) orthogonal experimental design is used to conduct exploratory analysis of key factors influencing the fatigue performance of specimens, evaluate the main effects of each parameter on fatigue life within a feasible experimental scope, and provide direction for subsequent confirmatory experiments.
This study focuses on the fatigue performance of weathering steel V-groove welded joint specimens and examines three primary influencing factors: corrosion duration (D), ambient temperature (T), and stress level (S). A three-factor, three-level test protocol is developed using the orthogonal experimental design method. The parameter levels of the three influencing factors (D, T, S) are presented in
Table 4; this design enables systematic investigation of fatigue performance under coupled environmental and mechanical conditions.
The stress level (S) is defined as the maximum applied stress value in fatigue tests. Its three parameter levels are set as 0.30×, 0.40×, and 0.50× the yield strength. The yield strength data are taken from the same research group’s literature [
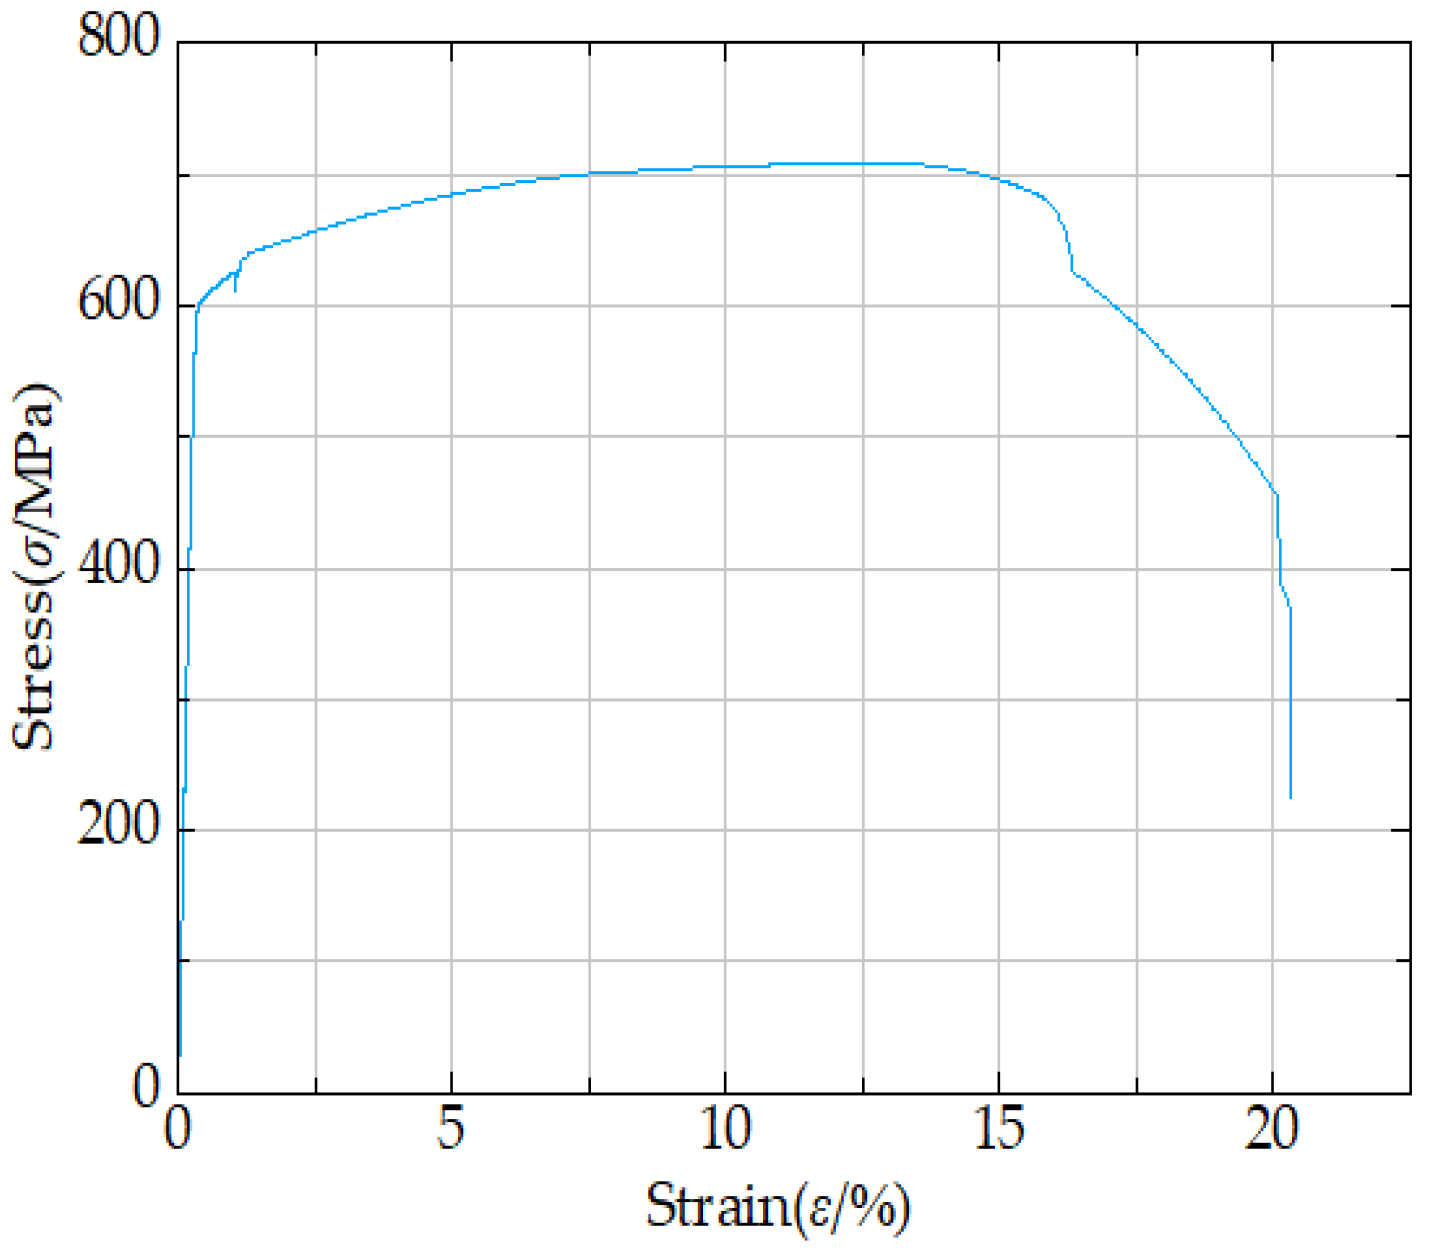
25], which comes from tensile tests at room temperature on 16 mm thick Q500qENH weathering steel V-groove welded joint specimens; the average yield strength of uncorroded specimens is 580.07 MPa (
Table 5). A stress ratio (R) of 0.10 is maintained during the fatigue tests.
In
Table 5, E is used to denote elastic modulus;
fy for yield strength;
fu for ultimate tensile strength; A for percentage elongation after fracture;
fy/
fu for yield-to-ultimate strength ratio; and εu for ultimate strain.
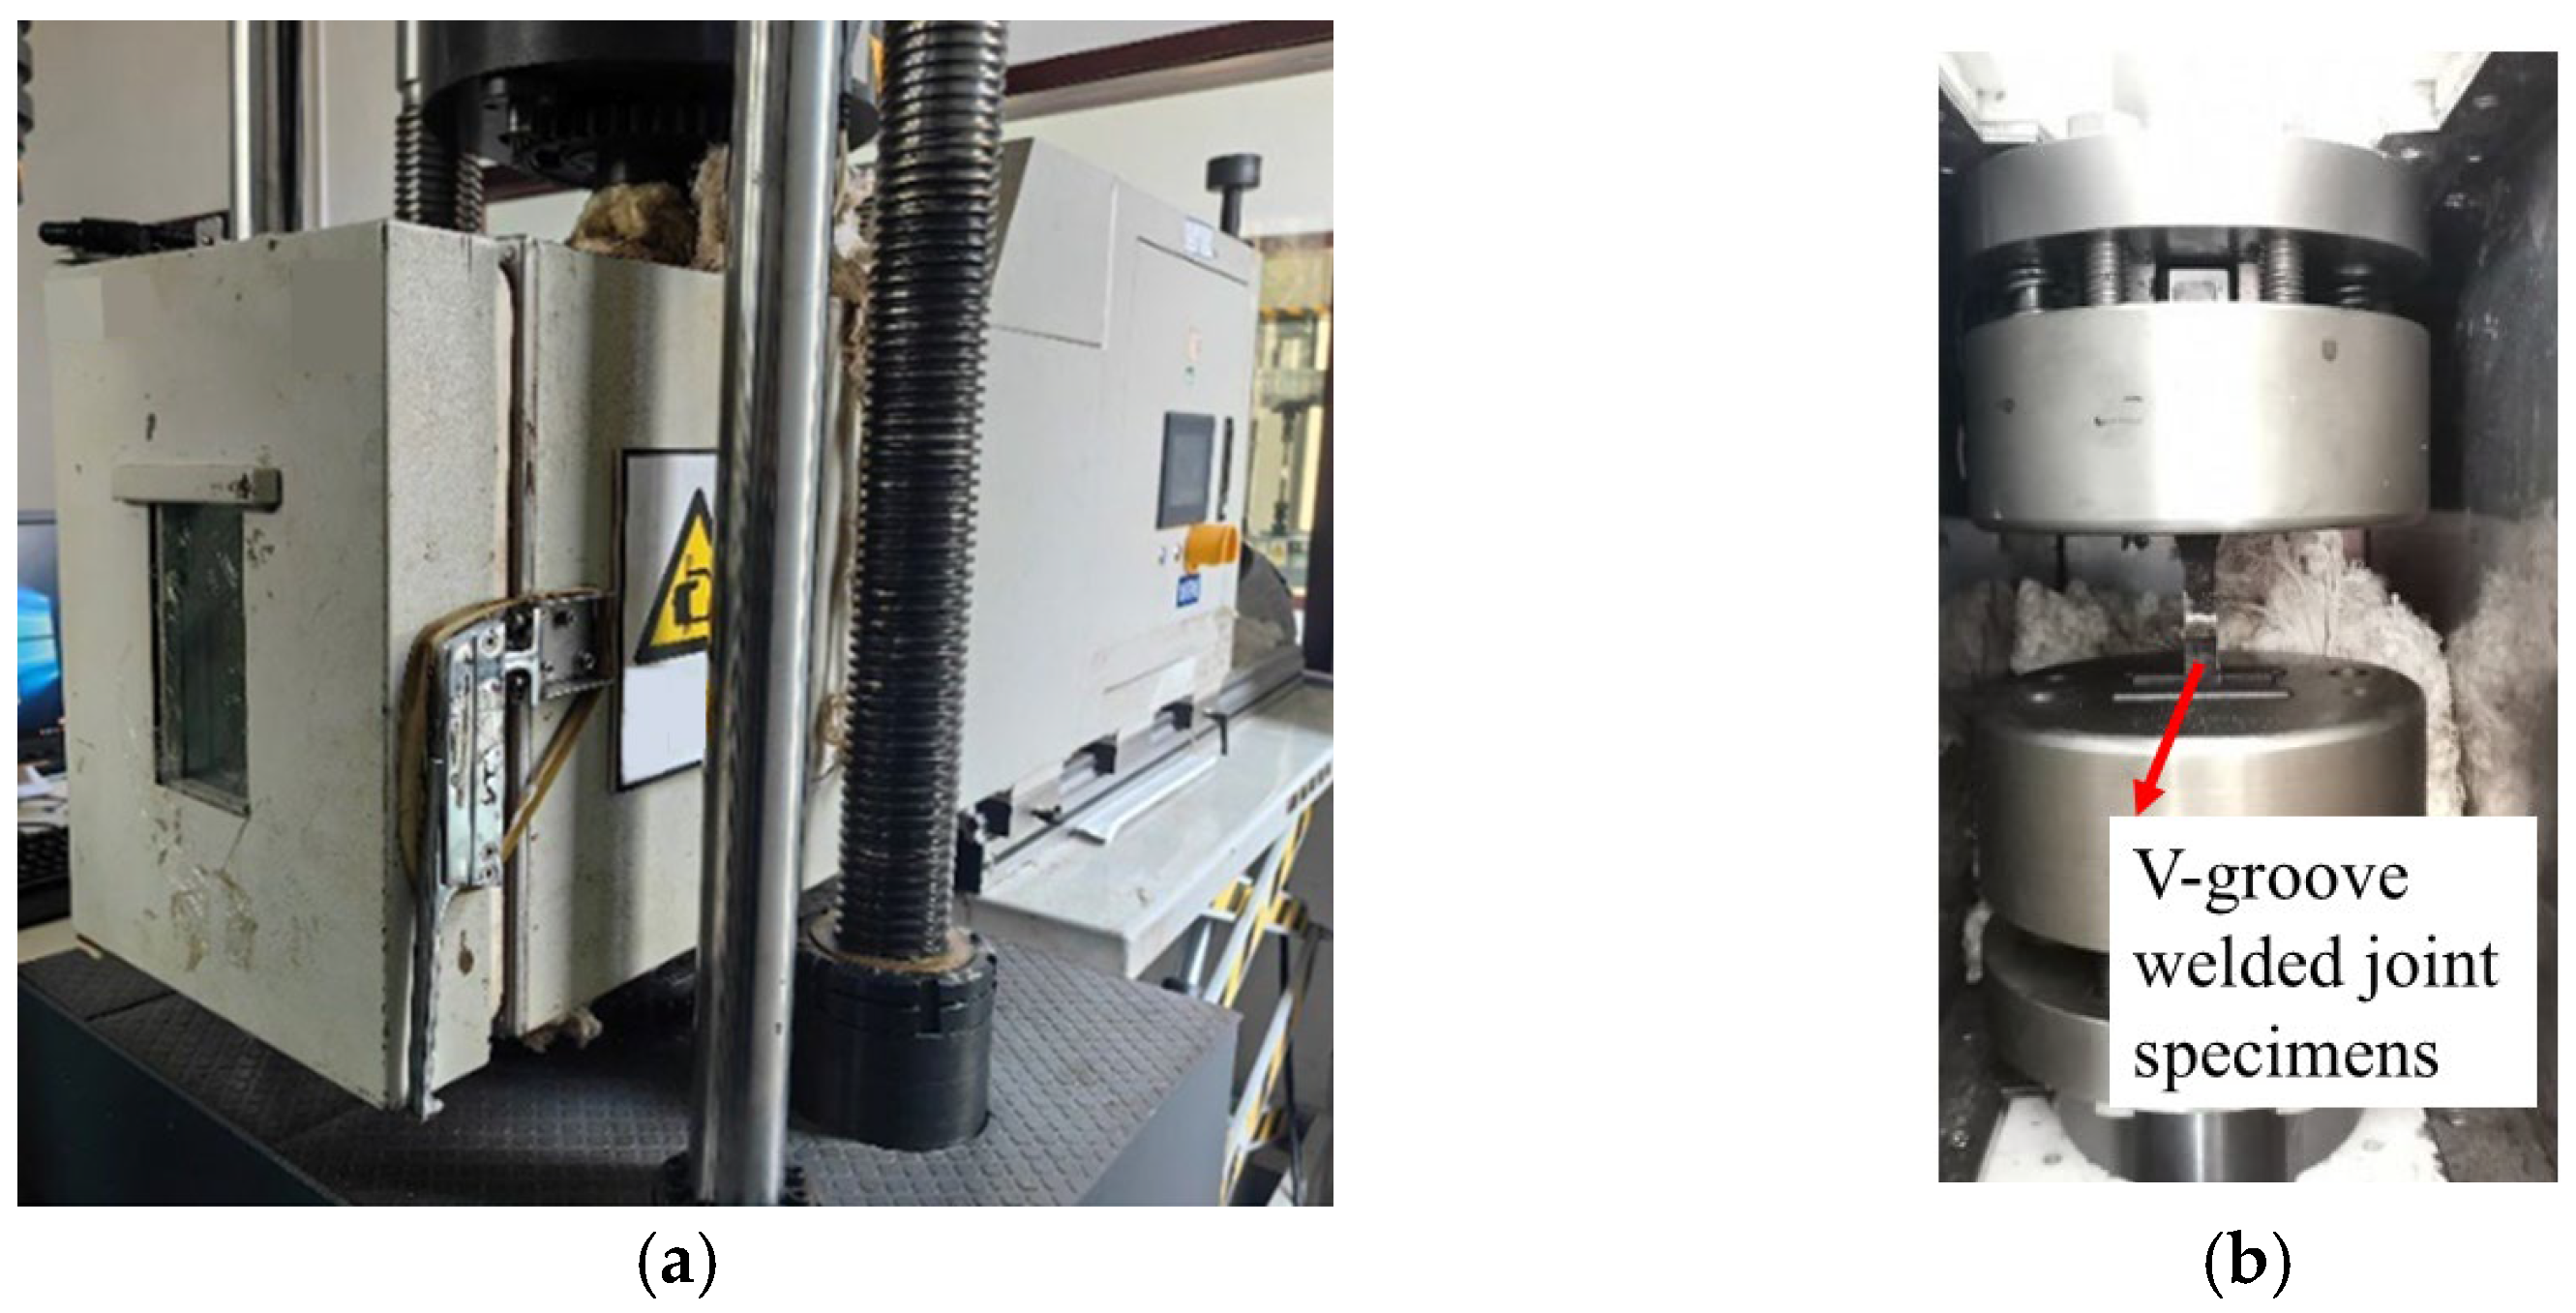
The single-point fatigue testing method was adopted in this study, which is defined as testing one specimen per stress level. This fatigue testing method was combined with orthogonal experimental design to efficiently utilize limited specimens. A CIMACH GPS-200 (Changchun City, Jilin Province, China) high-frequency tensile-compressive fatigue testing machine equipped with a low-temperature environmental chamber and a liquid nitrogen tank was used to systematically evaluate the cryogenic fatigue performance of the specimens (
Figure 5). The tests strictly simulated two typical cryogenic conditions (−20 °C and −40 °C), with loading procedures performed according to the experimental scheme outlined in
Table 4. Two failure criteria were implemented as termination conditions: when the cycle count reached 2.00 × 10
6 cycles (i.e., two million cycles), or when the relative value of the specimen’s elongation amount attained 3 mm. Through these experiments, complete fatigue life data for all specimens were successfully obtained (detailed in
Table 6), providing a reliable comprehensive dataset for analyzing fatigue performance under cryogenic conditions. Each group of specimens was subjected to the specific test once.
As shown in
Table 6, some specimens did not fracture even after 2.00 × 10
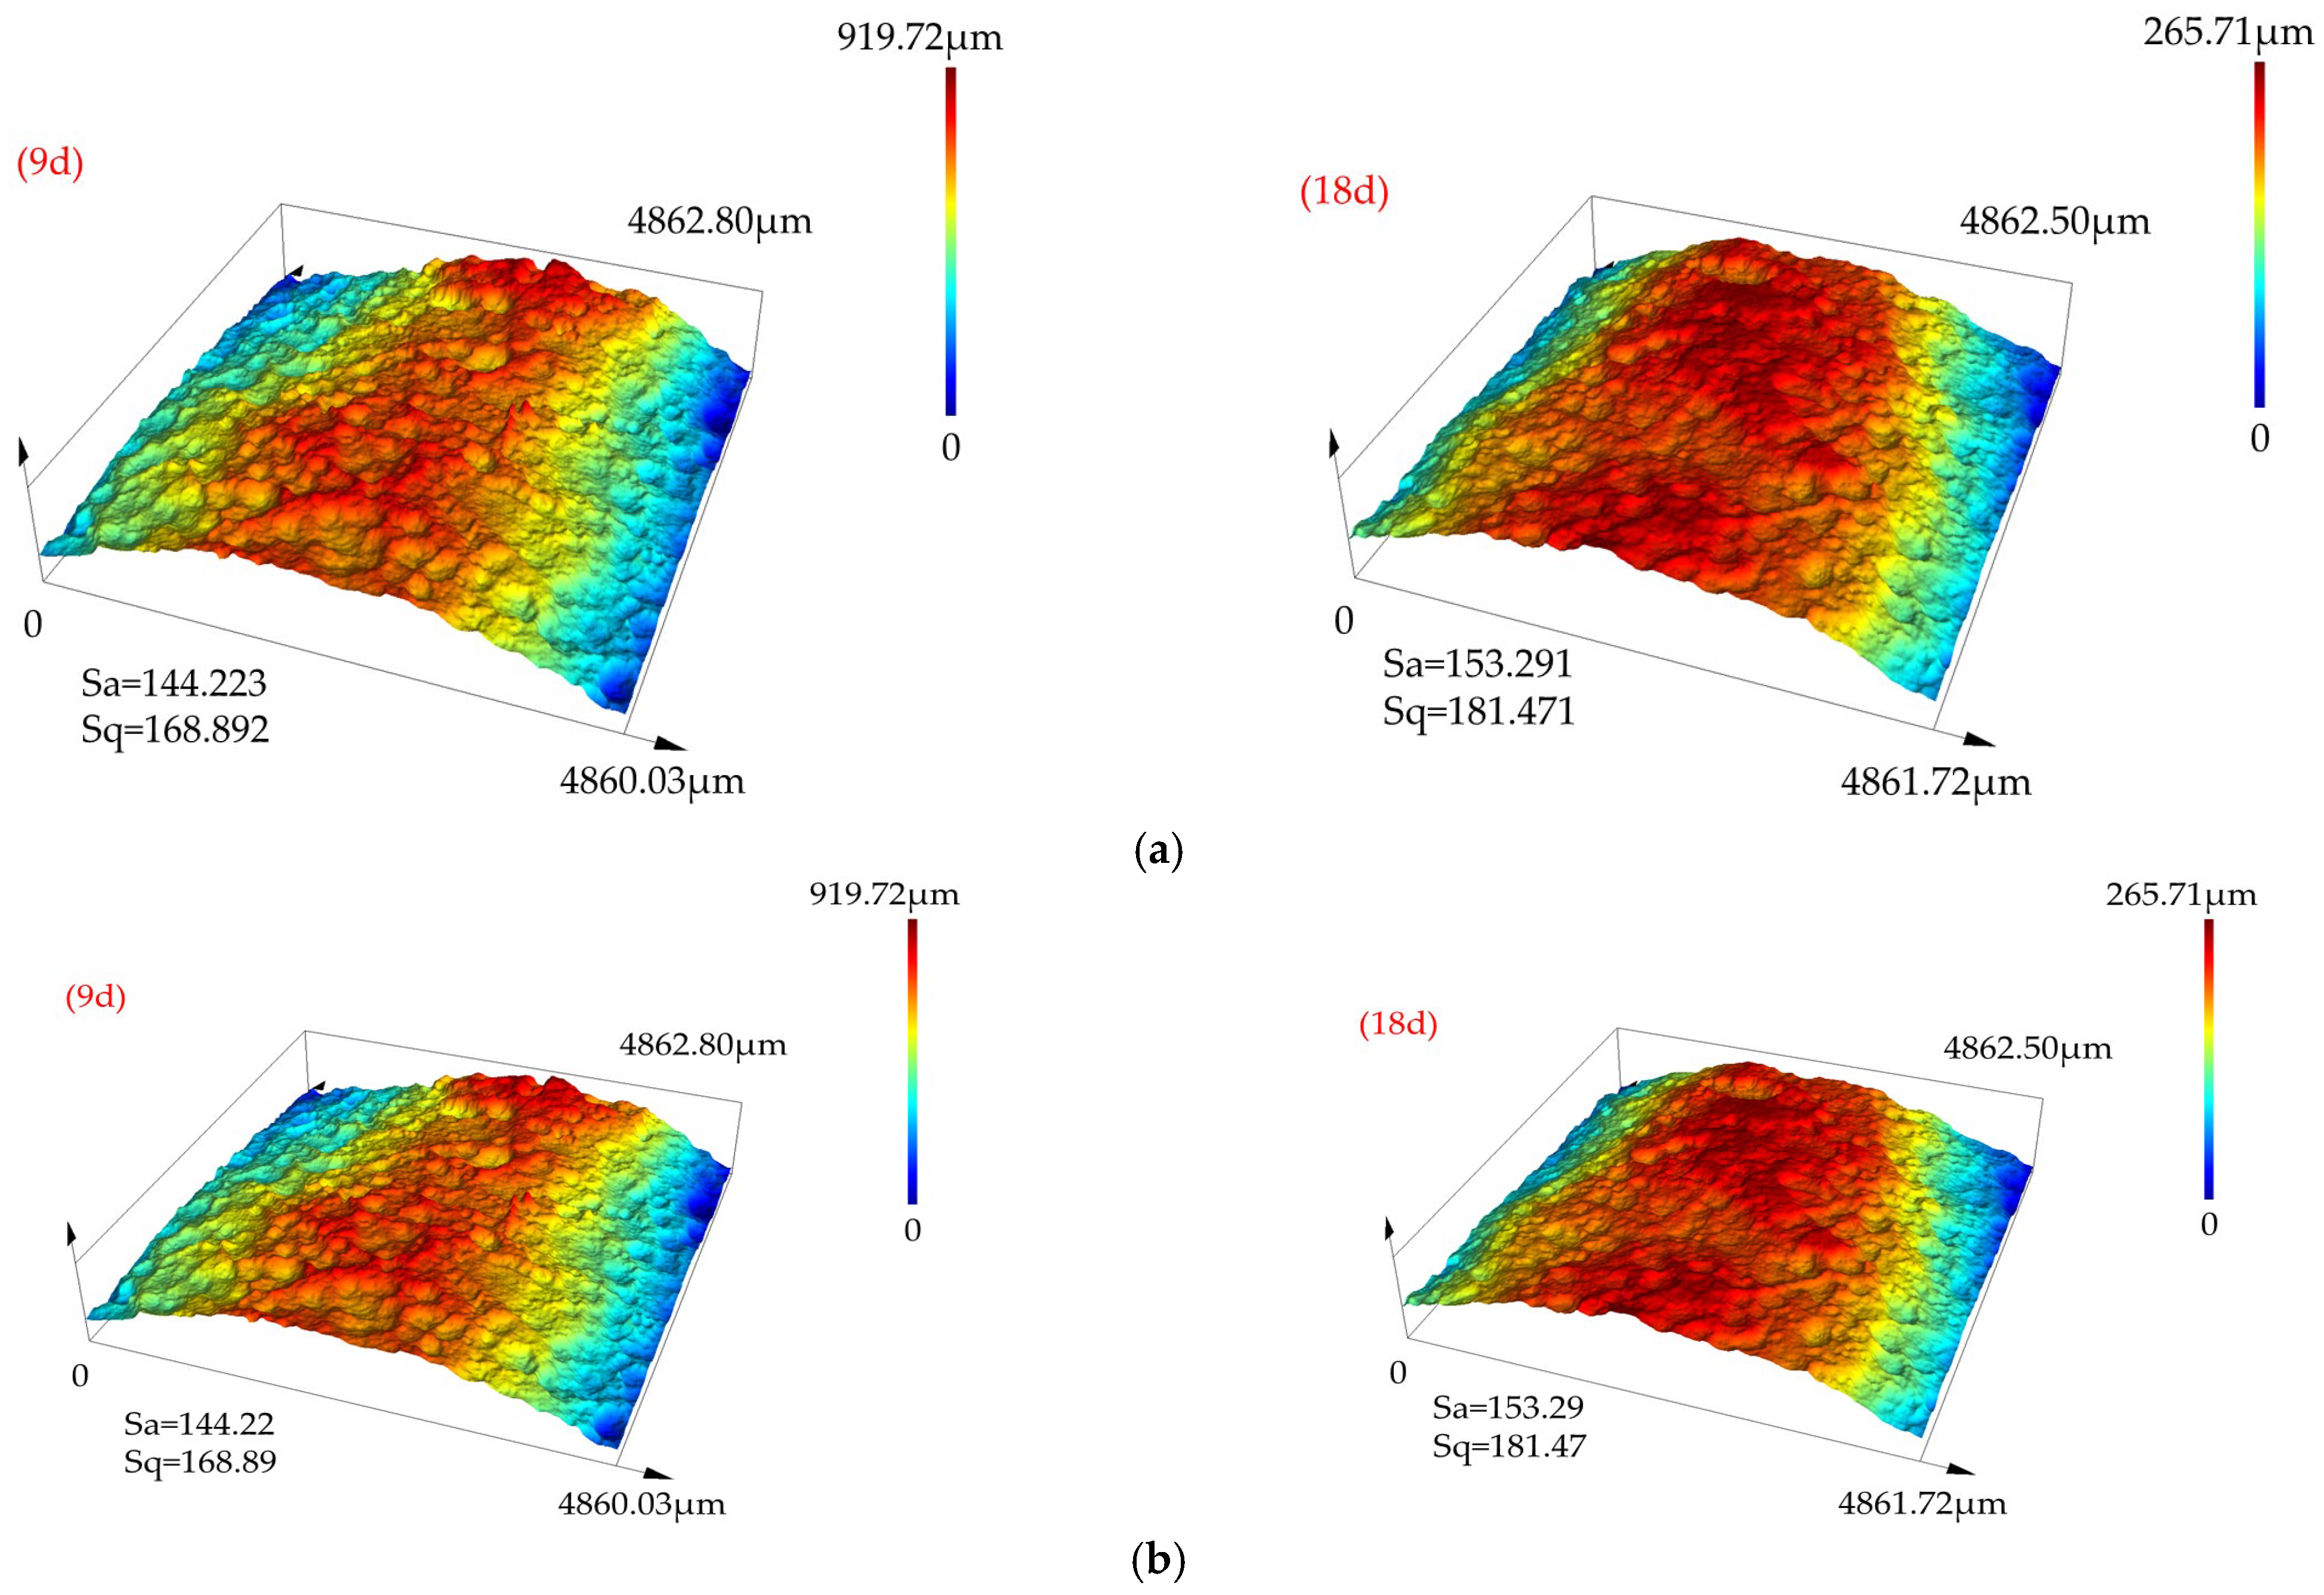
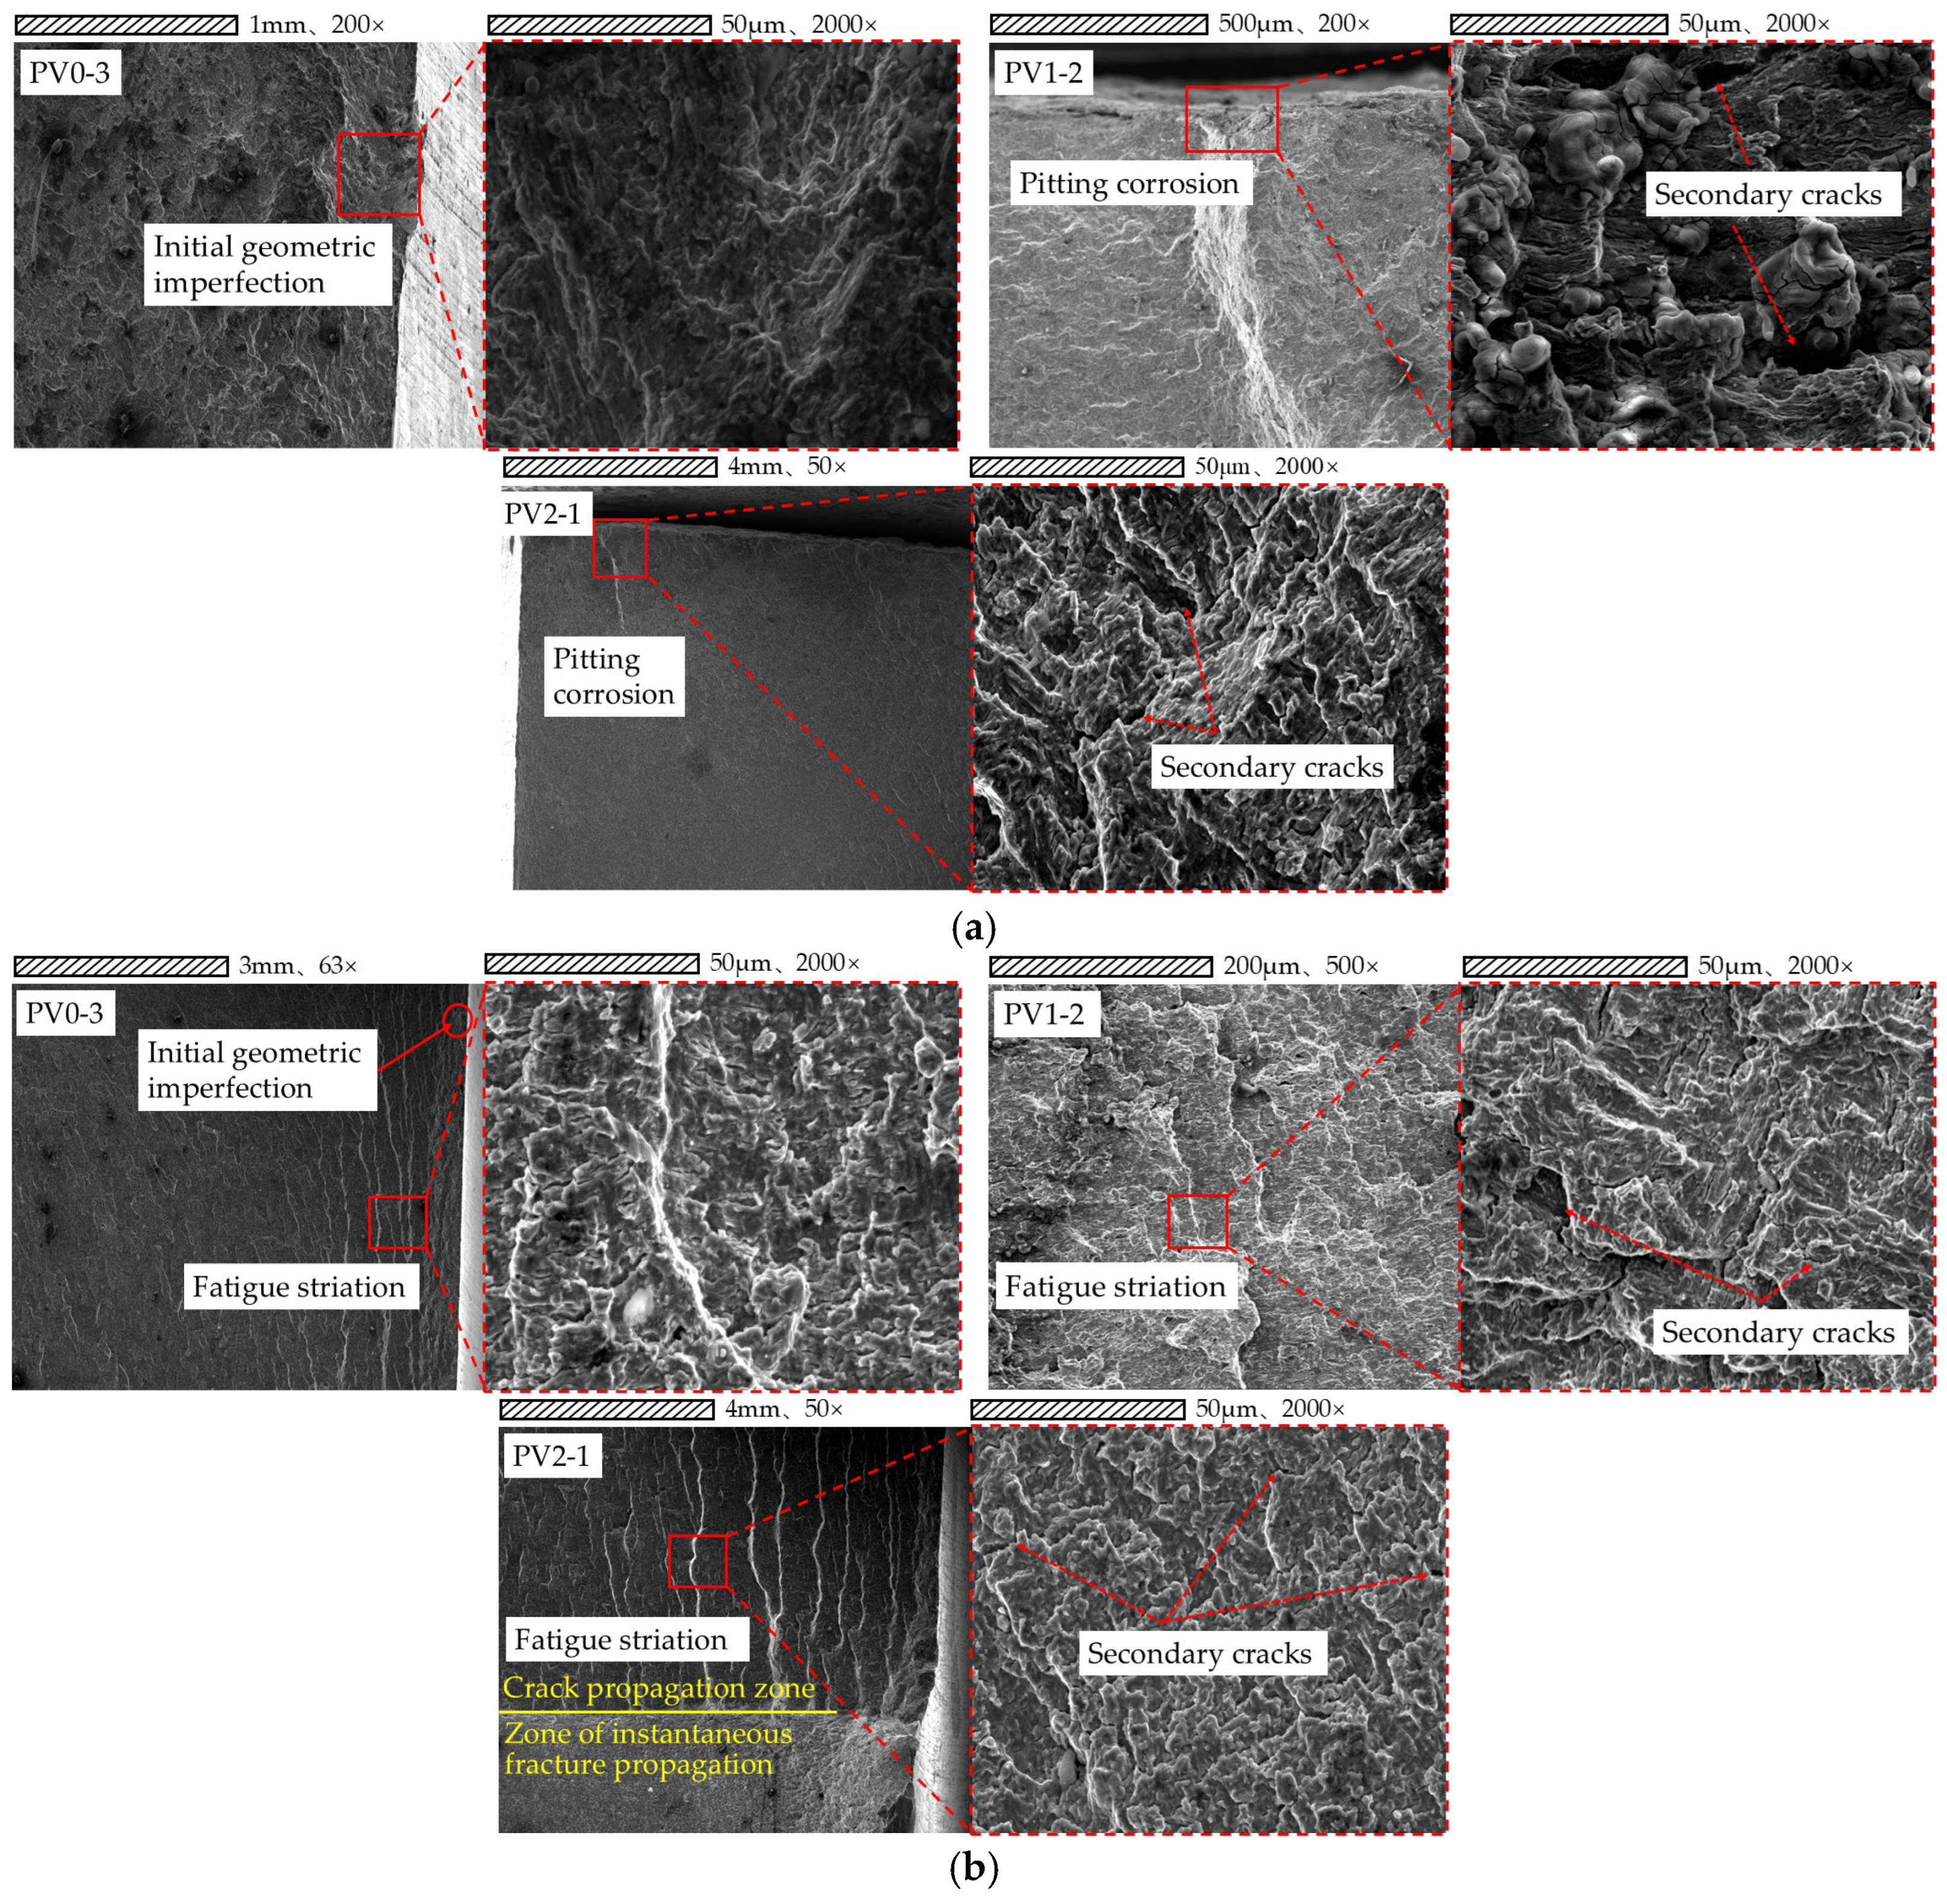
6 loading cycles, which is primarily attributed to the lower applied stress levels and the beneficial effects of low-temperature conditions on the material’s fatigue performance. For the weathering steel V-groove welded joint specimens that did not fully fracture, the fatigue loading was continued in the low-temperature fatigue testing apparatus under the same loading conditions as in the orthogonal experimental design until fracture occurred. Subsequently, the crack propagation morphology at the fracture surfaces of the specimens was characterized microscopically using a FEI Qunata600F (Hillsboro, OR, USA) scanning electron microscope (SEM).
The fatigue loading cycles of Specimen PV0-1 (T = 20 °C, S = 174 MPa) are reported as 1,319,500 cycles—fracturing before reaching the test termination cycle of 2.00 × 10⁶ cycles. The fatigue loading cycles of Specimen PV1-1 (T = −40 °C, S = 174 MPa) are noted to reach the test termination cycle (2.00 × 10⁶ cycles, no fracture), with the fatigue loading cycles increasing by ≥51.6% compared to the uncorroded group (PV0-1). Specimen PV2-2 (T = −20 °C, S = 174 MPa) is also confirmed to reach the test termination cycle (2.00 × 10⁶ cycles). Comparison of these results confirms that under the matched stress of 174 MPa, mild/moderate corrosion (9 d, 18 d) significantly extends the fatigue loading cycles compared to no corrosion.
The fatigue loading cycles of Specimen PV0-2 (T = −20 °C, S = 232 MPa) are recorded as only 332,700 cycles. Specimen PV1-2 (T = 20 °C, S = 232 MPa) is confirmed to reach the test termination cycle (2.00 × 10⁶ cycles), with its fatigue loading cycles increasing by ≥501% compared to the uncorroded group (PV0-2).
