1. Introduction
Since its discovery in the 19th century, ionizing radiation has been an incredibly fascinating phenomenon, attracting the attention of scientists, engineers, and medics. Today, it is impossible to imagine the world of science and medicine without its applications. Unfortunately, ionizing radiation is extremely harmful to living organisms [
1,
2,
3]. Over the years, new techniques and materials have been developed to protect people, especially operators of radiation-using devices, from its effects. Historically, the first shields were made of high-mass metals, such as lead or tungsten; unfortunately, such solutions had numerous drawbacks. Lead is toxic and has a negative impact on living organisms, and these metals are also difficult to form and process. With the development of materials science, composite materials based on polymers have been developed that can be used to protect against ionizing radiation. The advancement of materials, especially nano- and microcomposites, has resulted in further breakthroughs in their application as shields, as highlighted in recent review papers [
4,
5,
6,
7,
8]. However, this development has also brought new challenges, such as the disposal and recycling of composite materials.
In recent years, Sobczak et al. [
9,
10,
11,
12] have developed a new group of micro- and nanocomposite materials based on paraffin. These materials, which exhibit unique physical properties, such as easy molding using heat and the force of bare hands, could find numerous applications in industry and medicine. Furthermore, in their latest publication, Sobczak et al. [
12] presented two recycling methods, based on physical and chemical approaches, where one of them allow the recovery of microparticles from composites and their reuse in a closed cycle. The recycling issue is particularly important in the context of medical applications, as these composites could be used to protect patients during therapy or diagnostic testing. Due to hygiene requirements, these materials must be sterile, which is why they are often treated as disposable products. This generates large amounts of medical waste and increases treatment costs. The possibility of recovering microparticles and nanoparticles, which constitute the main part of the cost of manufacturing such materials, would enable their reuse in new shields for subsequent patients. Therefore, a reliable and quantitative evaluation of recycling will allow for better planning of the life cycle of composites, optimization of their use, and reduction of costs, as well as negative environmental impact. As a consequence, recycling is not only a technical challenge, but also a necessity in the protection of the environment and modern medicine. To fully assess the effectiveness of the recycling process, it is necessary to quantitatively, rather than solely qualitatively, determine the number of recovered particles. In fact, even if constantly enriching the data with new composite propositions (among various areas) is vital and essential for further improvement while finding
the golden mean, the overall issue of recycling should not be ignored. The final stage of the product’s life cycle should be the reprocessing of the waste, which not only results in saving natural resources but also paves the way to the production of novel materials.
The literature already reports the implementation of various techniques that would allow for the estimation of recycling effectiveness. Howarth et al. [
13] focused on the estimation of the specific energy requirements of carbon fibre-reinforced plastic (CFRP) waste milling (bearing in mind an industrial scale) with a modelling approach. The study also included an experimental procedure using a milling machine, where the power demand was collected with a clamp meter. The outcomes showed that the mathematical model and experimental part were in good agreement (a slight difference could reflect the transient nature of the processing). All in all, the authors concluded that mechanical recycling via milling can be environmentally advantageous, as the energy required for this process (2.03–0.27 MJ/kg) is substantially lower than the embodied energy of new carbon fiber (183–286 MJ/kg). The life-cycle assessment (LCA) metrics are also considered. For example, Hervy et al. [
14] analyzed the environmental impact (LCA study with various categories for instance global warming potential (GWP) in
eq, or acidification potential (AP), in
eq) of epoxy composites reinforced with bacterial cellulose (BC) and nanofibrillated cellulose (NFC), while neat polylactide and 30 wt.% randomly oriented glass fibre-reinforced polypropylene (GF/PP) composites constituted reference materials for a comparison. The study demonstrated that epoxy composites reinforced with BC and NFC exhibited a higher GWP indicator compared to the referenced materials, and the authors pointed to further necessary steps to create “truly green” nanocellulose-reinforced polymer composites including, e.g., a decrease in the energy required for NFC production. Nonetheless, the shielding area is not omitted; Pourzahedi et al. [
15] emphasized the significance of carbon nanotube (CNT) composites in the area of electromagnetic interference (EMI) shielding applications (particularly in satellites). The study included a comparison of the life cycle energy benefits between CNT composites and the conventional solutions, where, based on the results, it was pointed out that when using CNT composites, a decrease in the mass of EMI shielding, fuel consumption, and primary energy demand was noted. It should be noted that the life cycle assessment issue is present in other sectors; for instance, in building sector [
16], medicine [
17], or in the production of vehicle parts [
18].
Remaining on this topic, one should indicate the role of computer methods in these analyses. Indeed, it could be observed that these methods are progressively becoming an integral part of recycling analyses, such as application of convolutional neural network (CNN) tools in intelligent waste identification and recycling (IWIR) [
19]. The superiority of the computed methods can be attributed to their accuracy (an ability to detect required compounds, specific features, minor impurities, and other inconsistencies in the acquired images), repeatability, and ability to process big data, along with their quick creation of comprehensive recycling reports.
Machine learning methods, including deep neural networks, have been applied for the automatic segmentation and analysis of fly ash microspheres based on images acquired with an optical microscope [
20]. This approach enables the precise determination of particle size distribution and volume fraction, facilitating rapid and efficient quality control of construction materials [
20]. In Zhupanska et al.’s study [
21], an unsupervised machine learning method utilizing statistical distance metrics was developed for the automatic segmentation of micro-CT images of damaged CFRP composites. Similarly, in Furat et al.’s article [
22], convolutional neural networks were employed to enhance grain boundaries and perform automatic segmentation of the microstructure in 3D CT data of an AlCu specimen. The method allowed accurate and efficient segmentation across the entire series of scans, even when ground truth data was only available for a single time step. In all of these examples, large datasets of image data were required to develop the methods, which are not always accessible.
This work aims to develop a tool based on microscopic image analysis to evaluate the effectiveness of microparticle recovery from paraffin-based composites in a simple, quick, and cost-effective manner. For this purpose, a computational image analysis technique is demonstrated that enables the characterization of particles and the assessment of their content within the investigated area. This is particularly useful in experimental laboratory studies where only a limited number of microscopic sample images are available. In the current study, 10 images of the sample were available before and after recycling. The image analysis enabled a quantitative assessment of the new recycling method, clearly showing its effectiveness and providing a basis for estimating microparticle recovery from paraffin-based composites.
3. Results
The following subsections present the results of microscopic image analysis of the investigated composites before and after recycling. This analysis includes the number and density of particles, as well as their area.
3.1. Quantitative Analysis of Particle Count and Density
For each analyzed image, both before and after the recycling process, the number of particles as well as their total area were calculated. In addition, the percentage share of the particle area relative to the total image area was determined, enabling an assessment of the effectiveness of the particle recycling method. The obtained results that are based on images acquired from different regions of the composite sample (not subjected to recycling protocol) are summarized in
Table 1.
The analysis of the results obtained for ten images of the sample prior to recycling demonstrated that the number of particles remained relatively stable, ranging from 2417 to 3056 (mean: 2677). The slight variations in particle count indicate a uniform distribution of particles within the sample. In terms of the total particle area, greater variability was observed. The values ranged from 2.54 million to 2.87 million px (25,425.96–28,), with a mean value of 2.69 million px (26,). These findings suggest that, despite a comparable number of particles, their sizes and shapes may locally differ depending on the analyzed region of the sample. Such variability is a natural consequence of the structural heterogeneity of the material in some places, resulting from local particle agglomeration. This stems from the composites’ functionality; the samples are characterized by susceptibility to shape-change under the influence of heat and hand pressure. Consequently, modifications in the shape of the composites induce alterations in the distribution of particles within the matrix.
The particle density, defined as the percentage share of the particle area in the total image area, ranged from 40.87% to 46.12%, with a mean value of 43.30%. This mean indicates that the particles occupied slightly less than half of the analyzed image area. The highest density was recorded in region No. 6 (46.12%), while the lowest was observed in region No. 1 (40.87%), representing a difference of more than 5 percentage points. This finding suggests that the spatial distribution of particles within the sample is not entirely uniform, and local particle aggregations may significantly affect particle density in specific regions. The obtained results indicate that, although the analyzed images were derived from the same sample, local variations in particle area and density were observed. This confirms that, when interpreting quantitative results, the heterogeneity of the examined materials must be taken into account, even when they originate from a single source. The same measurements were performed for the sample after recycling. The results are presented in
Table 2.
The analysis of the obtained results indicates a relatively high consistency of the morphometric parameters of the particles. The mean particle count was 2682, with extreme values ranging from 2275 (No. 10) to 3018 (No. 2). The highest particle density was recorded in region No. 2, where the number of objects reached 3018, and the corresponding total area amounted to 591,514 px (), which also translated into the highest particle density in the entire dataset (9.51%). Conversely, the lowest particle count was observed in region No. 10, where 2275 particles with a total area of 449,639 px () were identified. The particle density in this case was also the lowest, at 7.23%. The total particle area in individual images was proportional to their count. Most of the analyzed images exhibited comparable particle density, ranging from 7.23% to 9.51%, with a mean value of 8.30%. Such small differences indicate a high degree of sample homogeneity, while the observed deviations may be attributed to factors related to sample preparation for image analysis (including placement of a sample on a glass with a spatula from the vial). Therefore, the obtained results demonstrate that the examined sample exhibits stable morphometry within the analyzed image fields, with dominant values of particle count, total area, and density pointing to its high homogeneity (with the exception of region No. 10).
3.2. Analysis of Particle Area
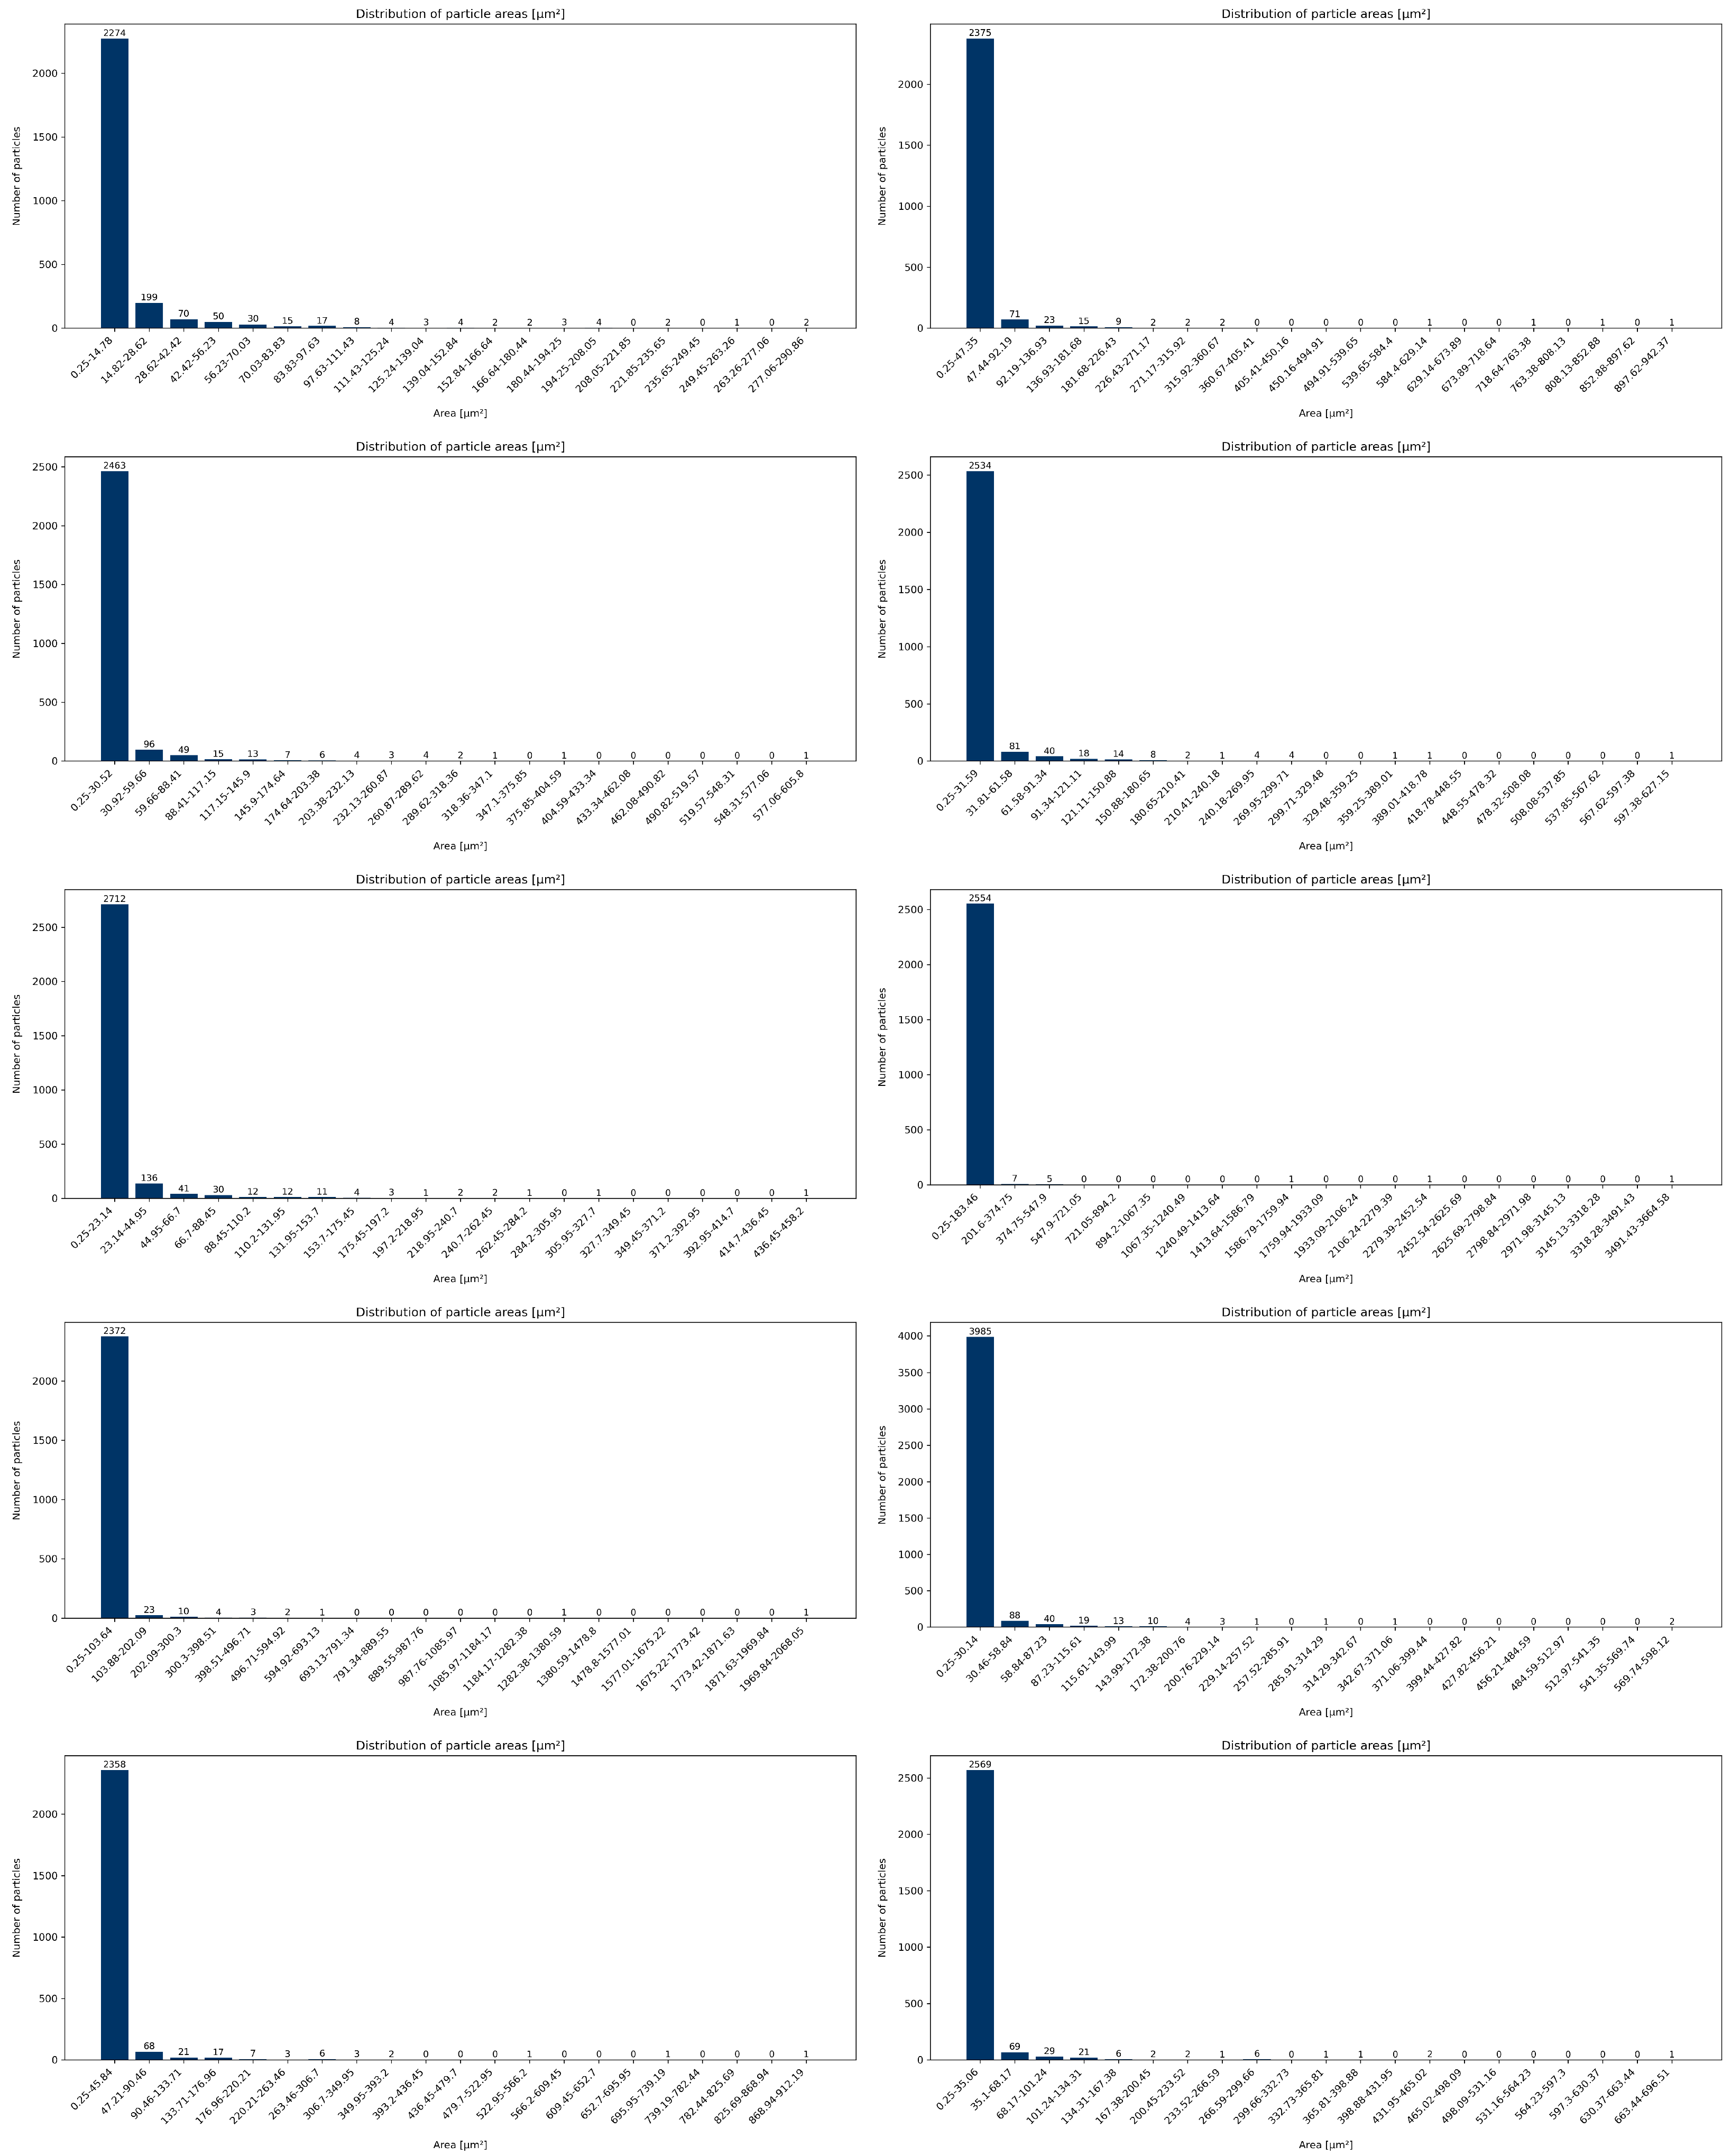
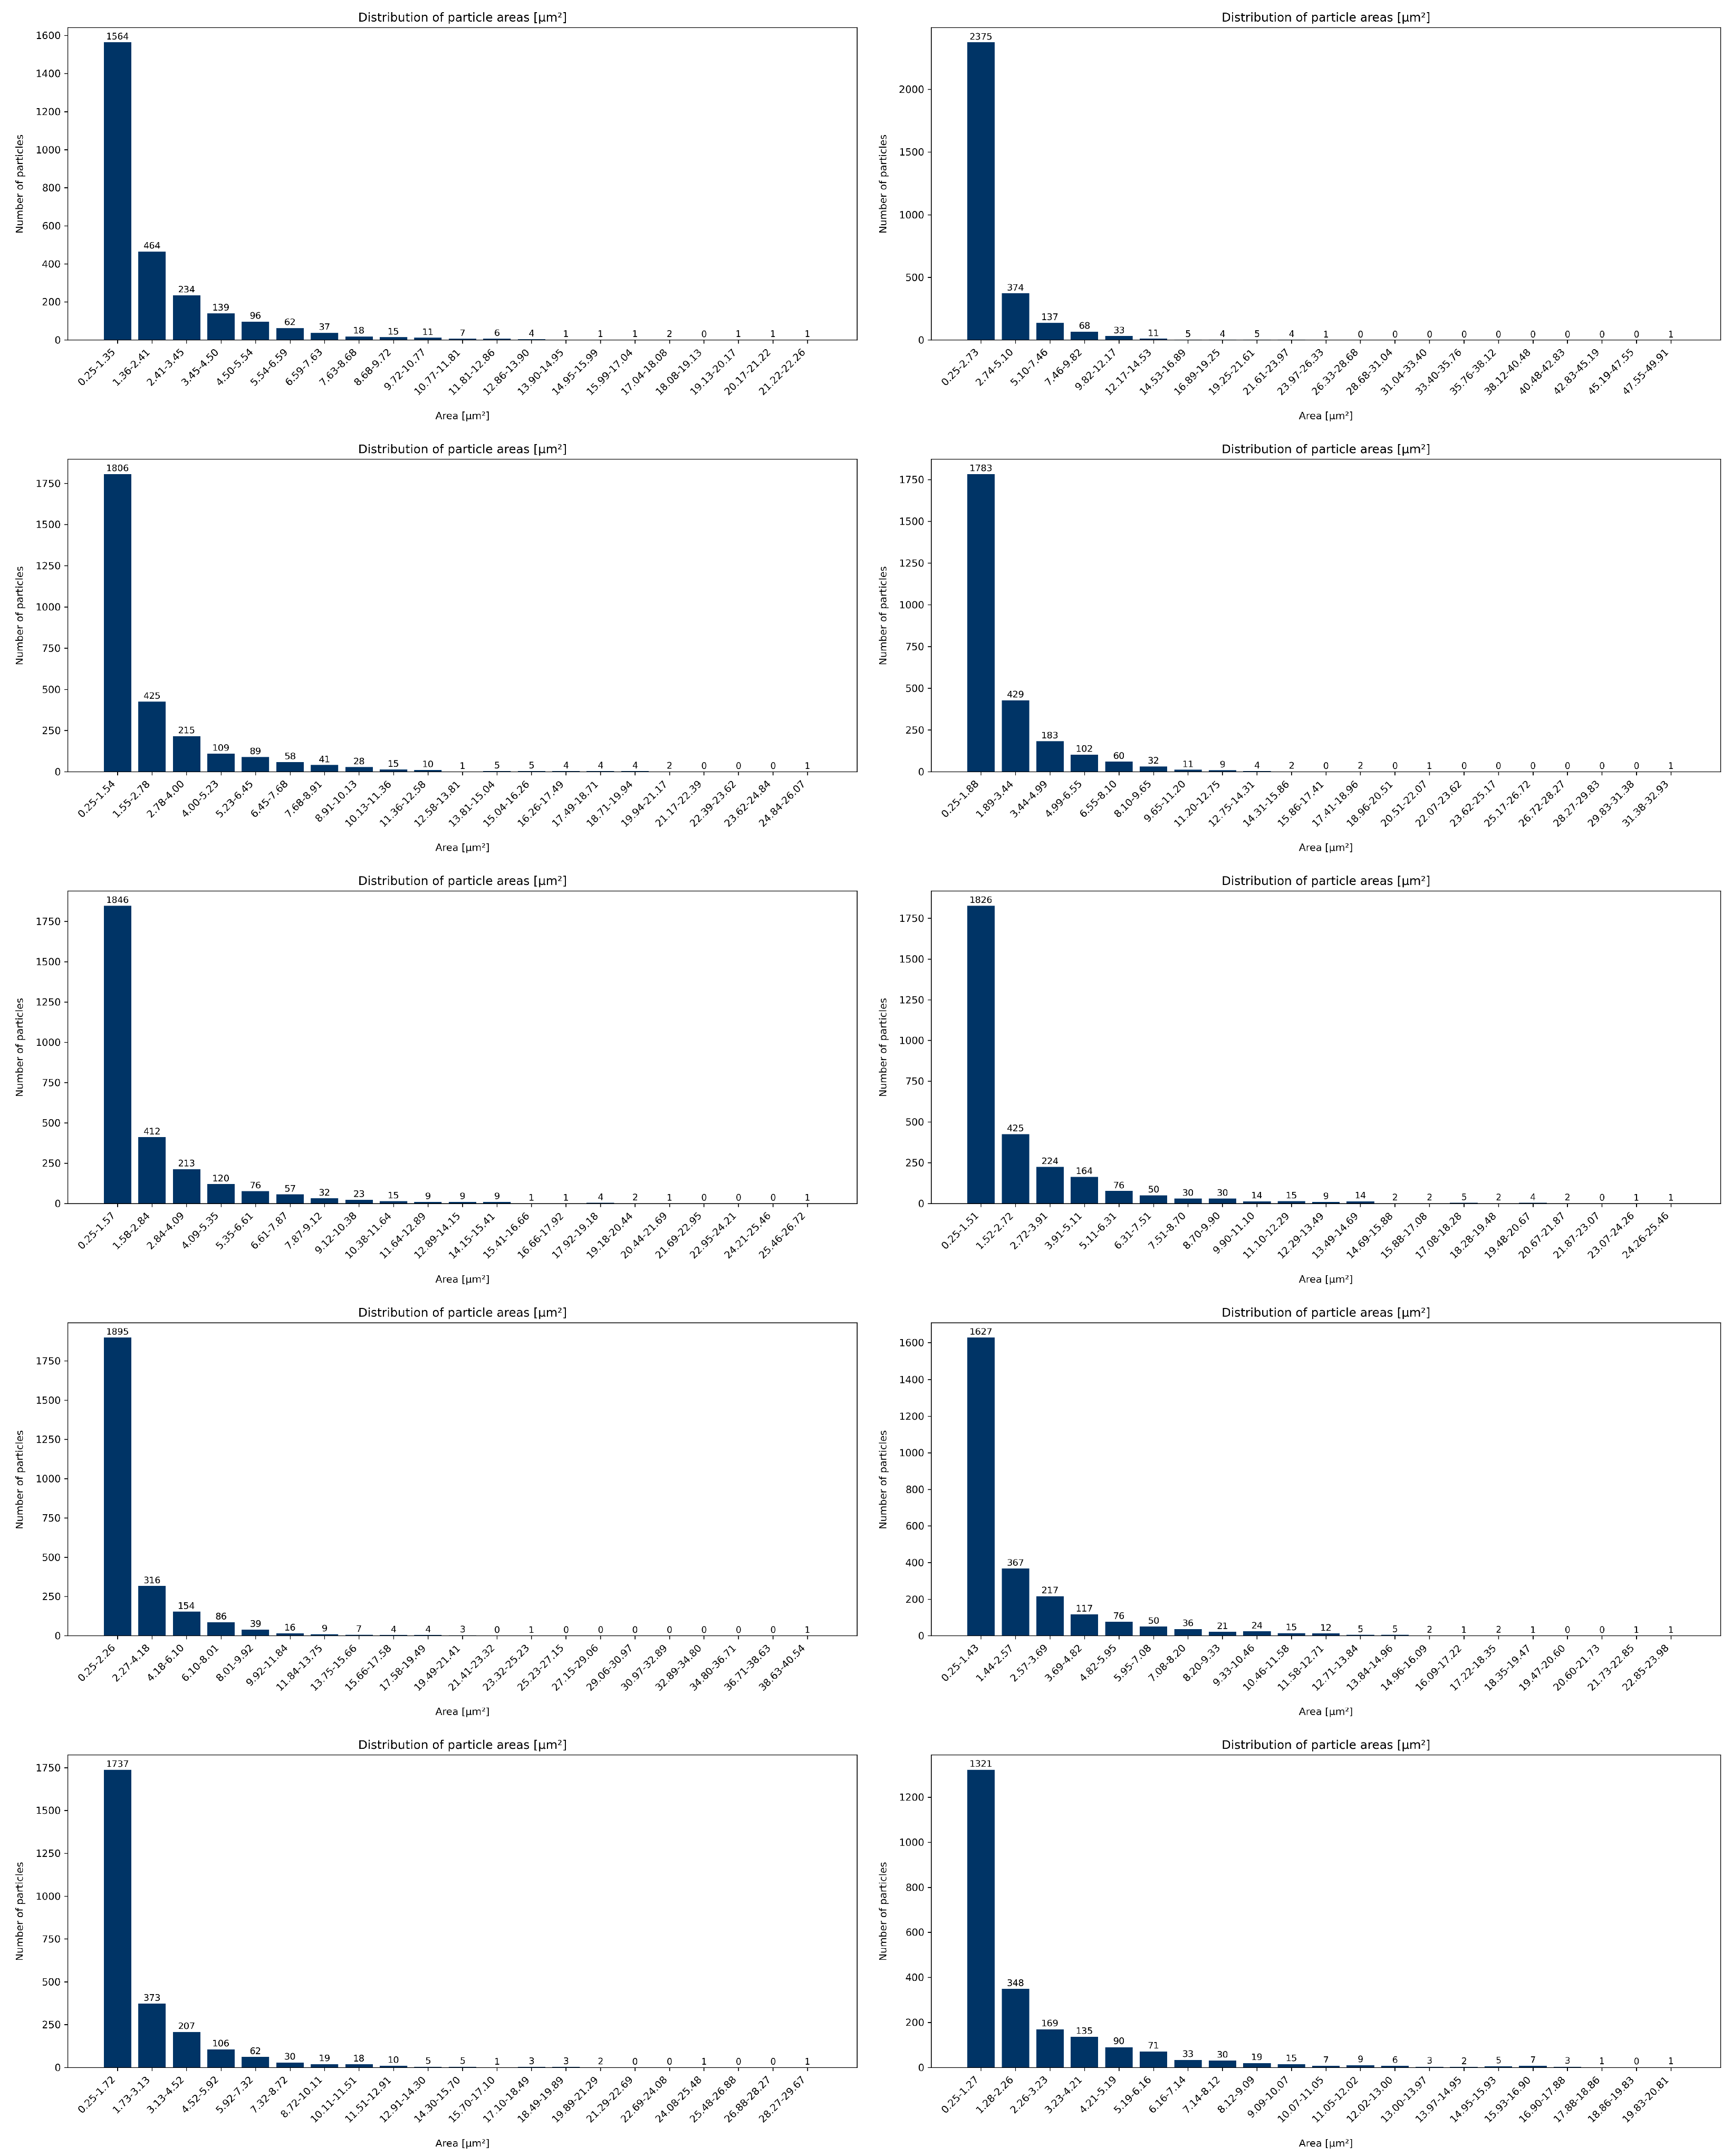
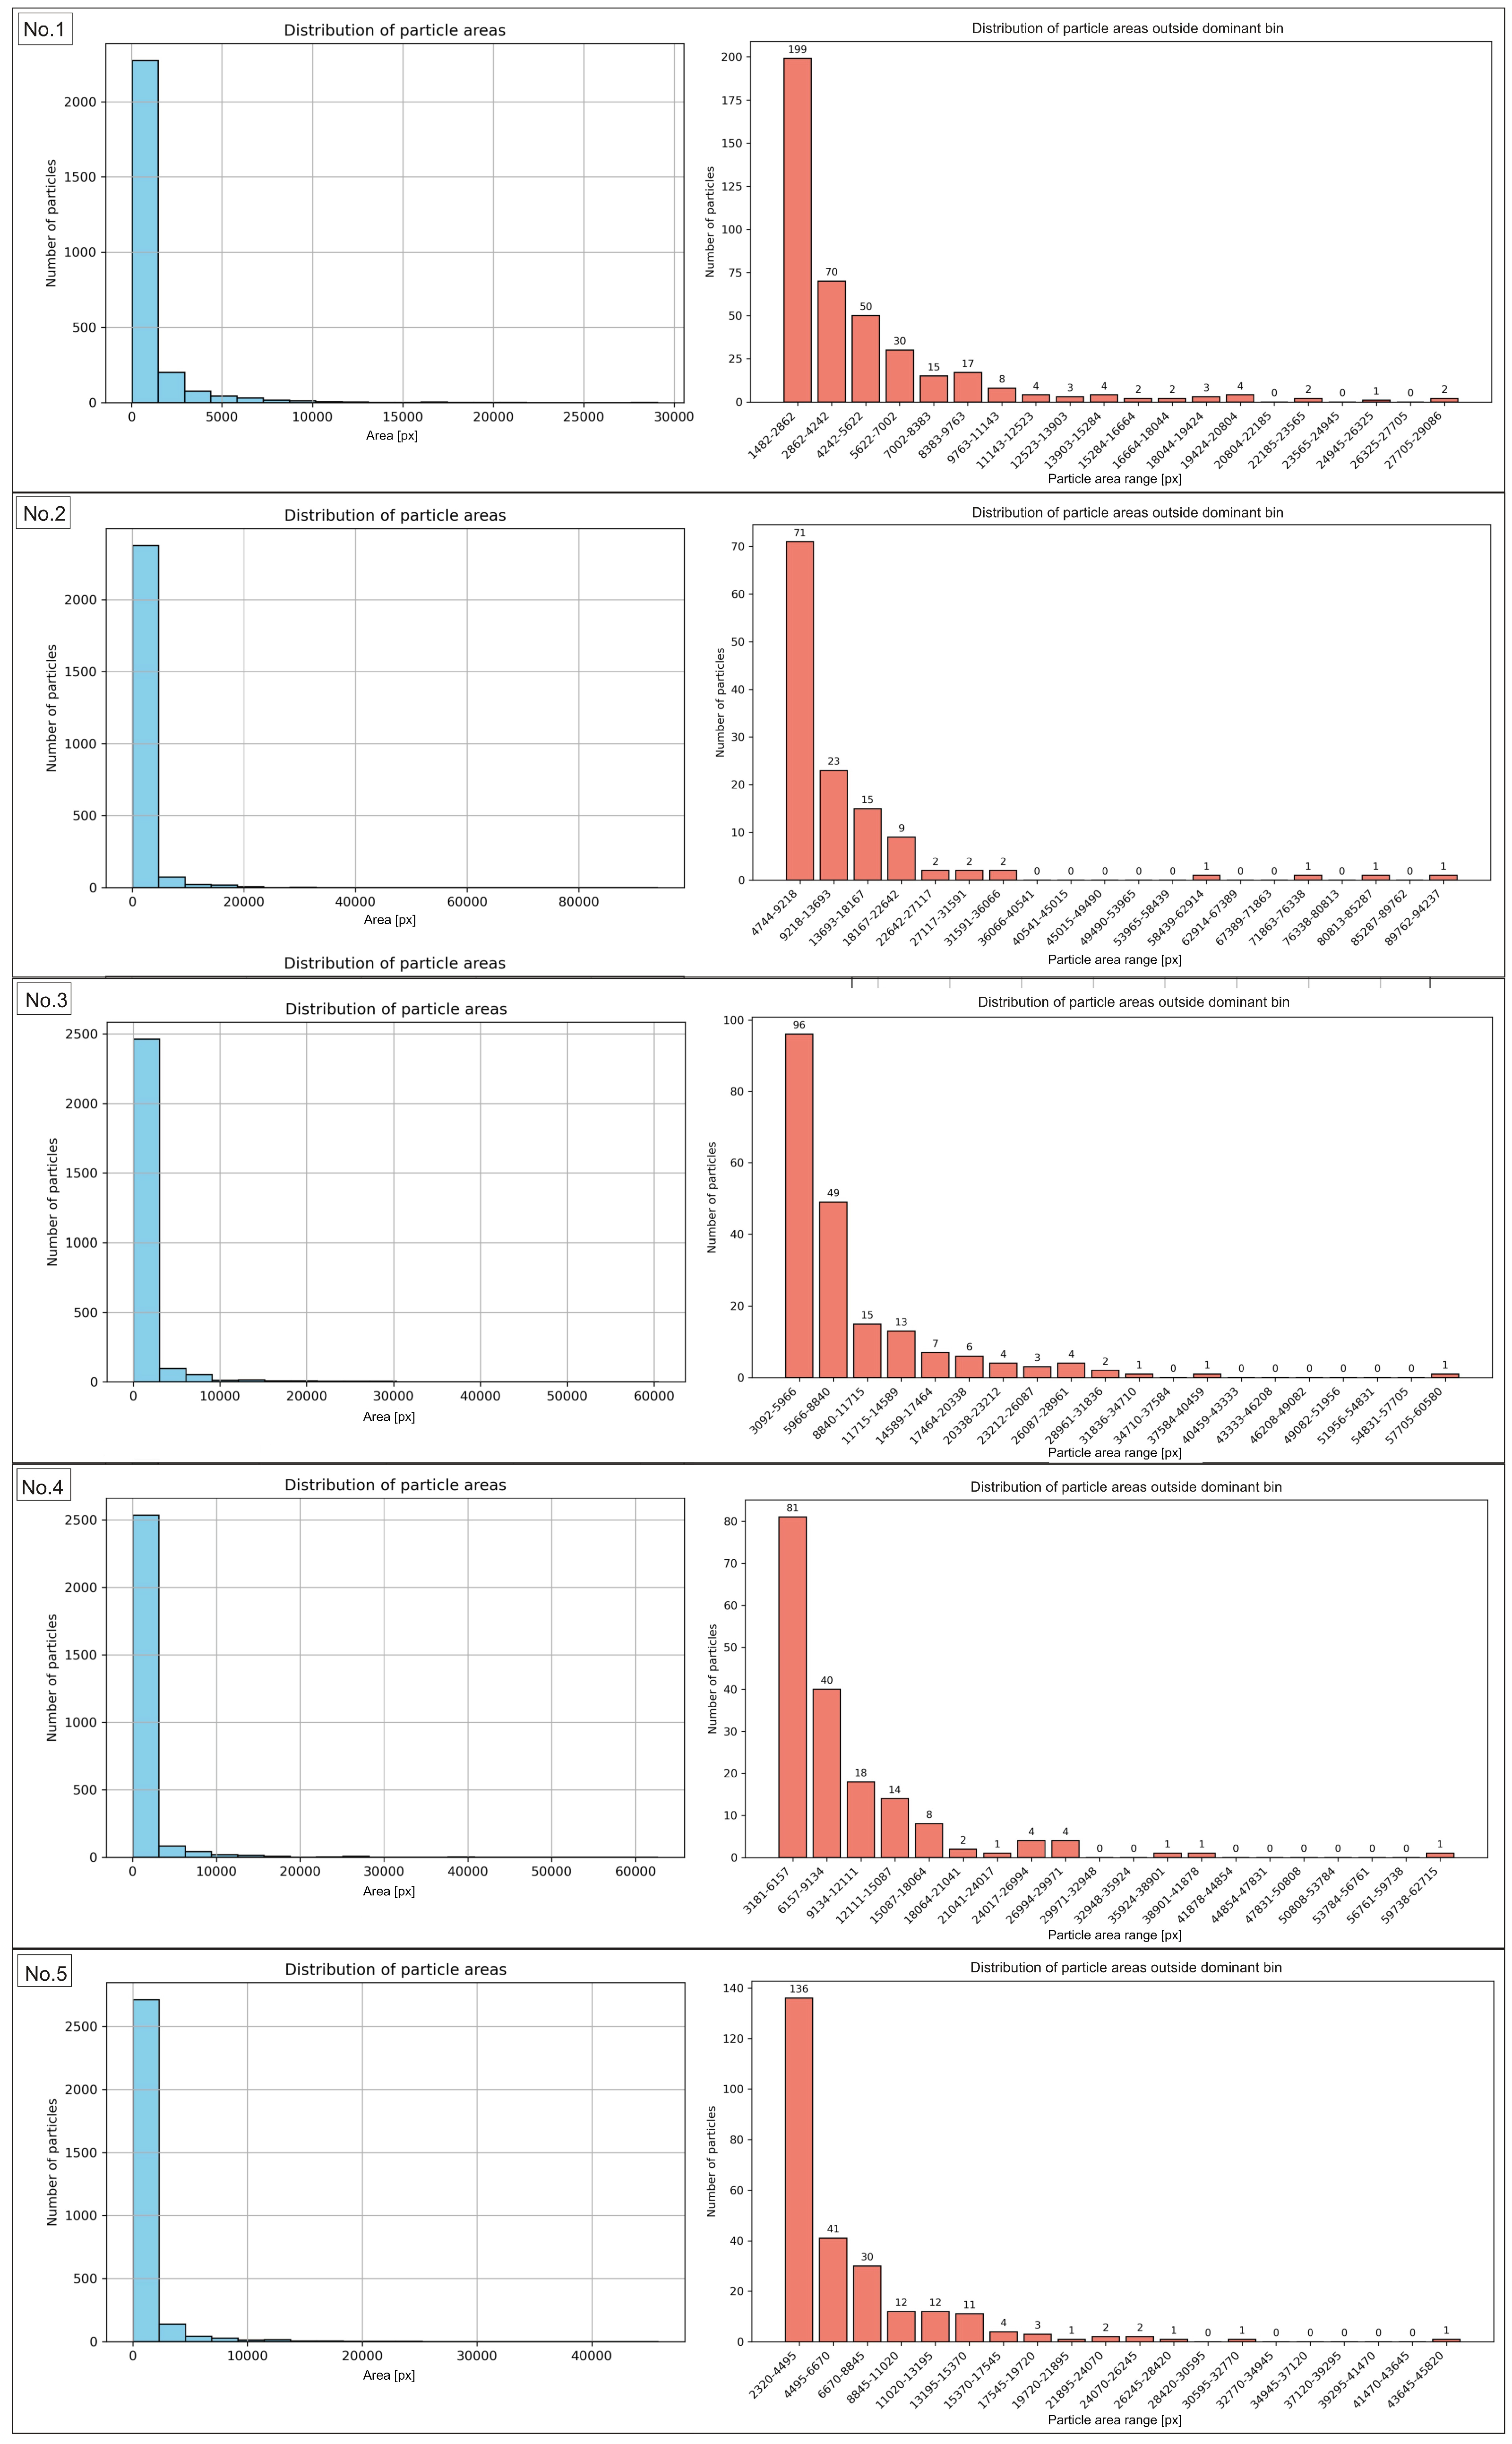
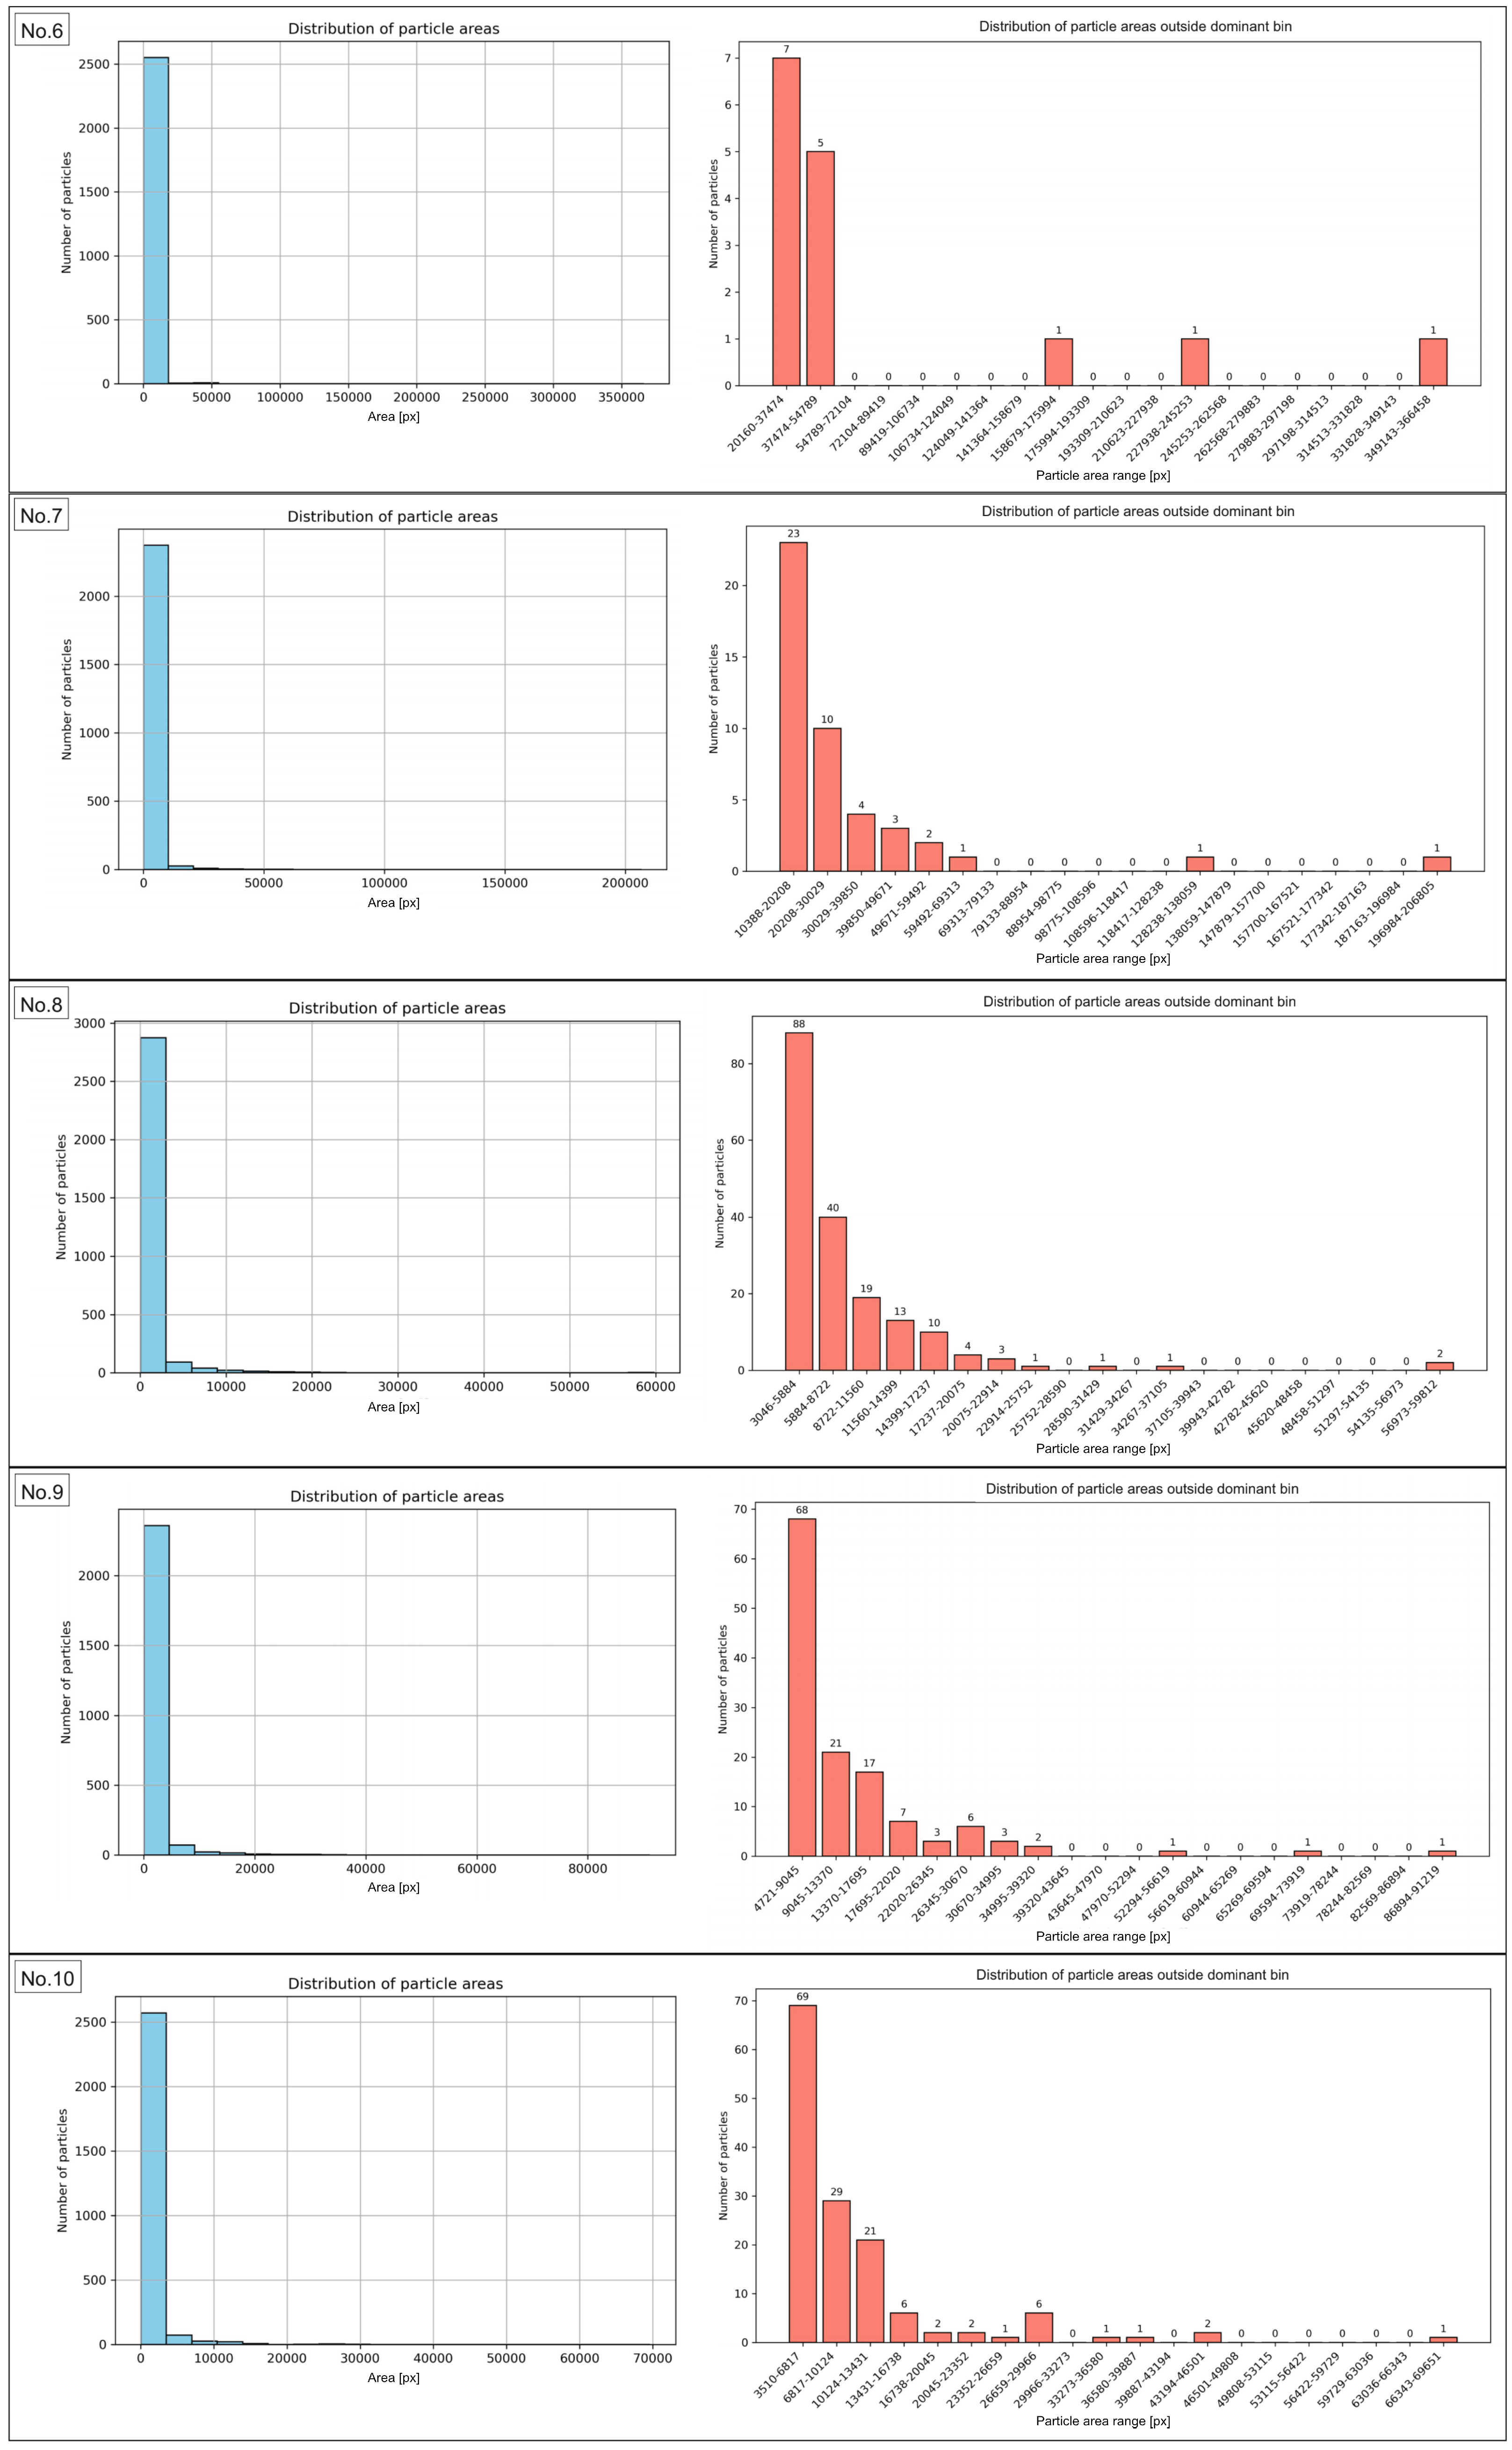
In order to characterize the manufactured composite and determine which particle area fractions are dominant in the recycled sample, an analysis of particle areas in the sample images before and after the recycling process was conducted. The results are presented in the form of particle area distribution histograms. They show the frequency of particles occurring within specific area ranges, providing information about the structure of the studied material. This demonstrates which particle area classes dominate and indicates the degree of uniformity or variability in particle sizes. The peaks of the histogram represent the most frequently occurring areas, while a broad distribution reflects a heterogeneous mixture. The histograms of the particle area range for the sample before recycling are presented in
Figure 6 and
Figure 7 for regions No. 1 to No. 5, and No. 6 to No. 10, respectively. The same data, expressed in
, are presented in
Figure A1.
Table 3 presents the range of particle area values most frequently observed in the analyzed images of the sample before recycling, the number of particles within this range, and their percentage share relative to all particles in the image.
The results of the morphometric analysis showed that the vast majority of particles in the examined sample fell within specific area ranges, confirming the high morphological uniformity of the material. The number of particles within the dominant area intervals ranged from 2274 to 2874, accounting for 84.54% to as much as 99.42% of the total particle population. This indicates that nearly all objects were characterized by areas within the established limits, while particles deviating from these ranges represented only a marginal share. The exact data for particles outside the range are presented in
Tables S1–S10. Of particular importance was the finding that in area No. 6, the widest surface area range, from 25 to 18,346 px, was identified, encompassing 99.42% of the particles. The broadening of this interval resulted from the presence of a few larger objects. However, the majority of the population remained consolidated within this broad boundary. In contrast, region No. 1 showed the lowest proportion of particles falling within the most common surface range (84.54%), indicating greater local morphological variability compared to the other regions. The analysis of particle area distribution in regions 2 through 10, excluding region No. 1, demonstrated the stability and high reproducibility of the results. The share of particles in the dominant ranges exceeded 90%, and in most cases was approximately 95%. Such a distribution indicates the morphological consistency of the studied material. The obtained results clearly confirm that the particle sizes in the analyzed region are strongly concentrated within specific area ranges. The same analyses were conducted for the sample images after recycling. The results are presented in
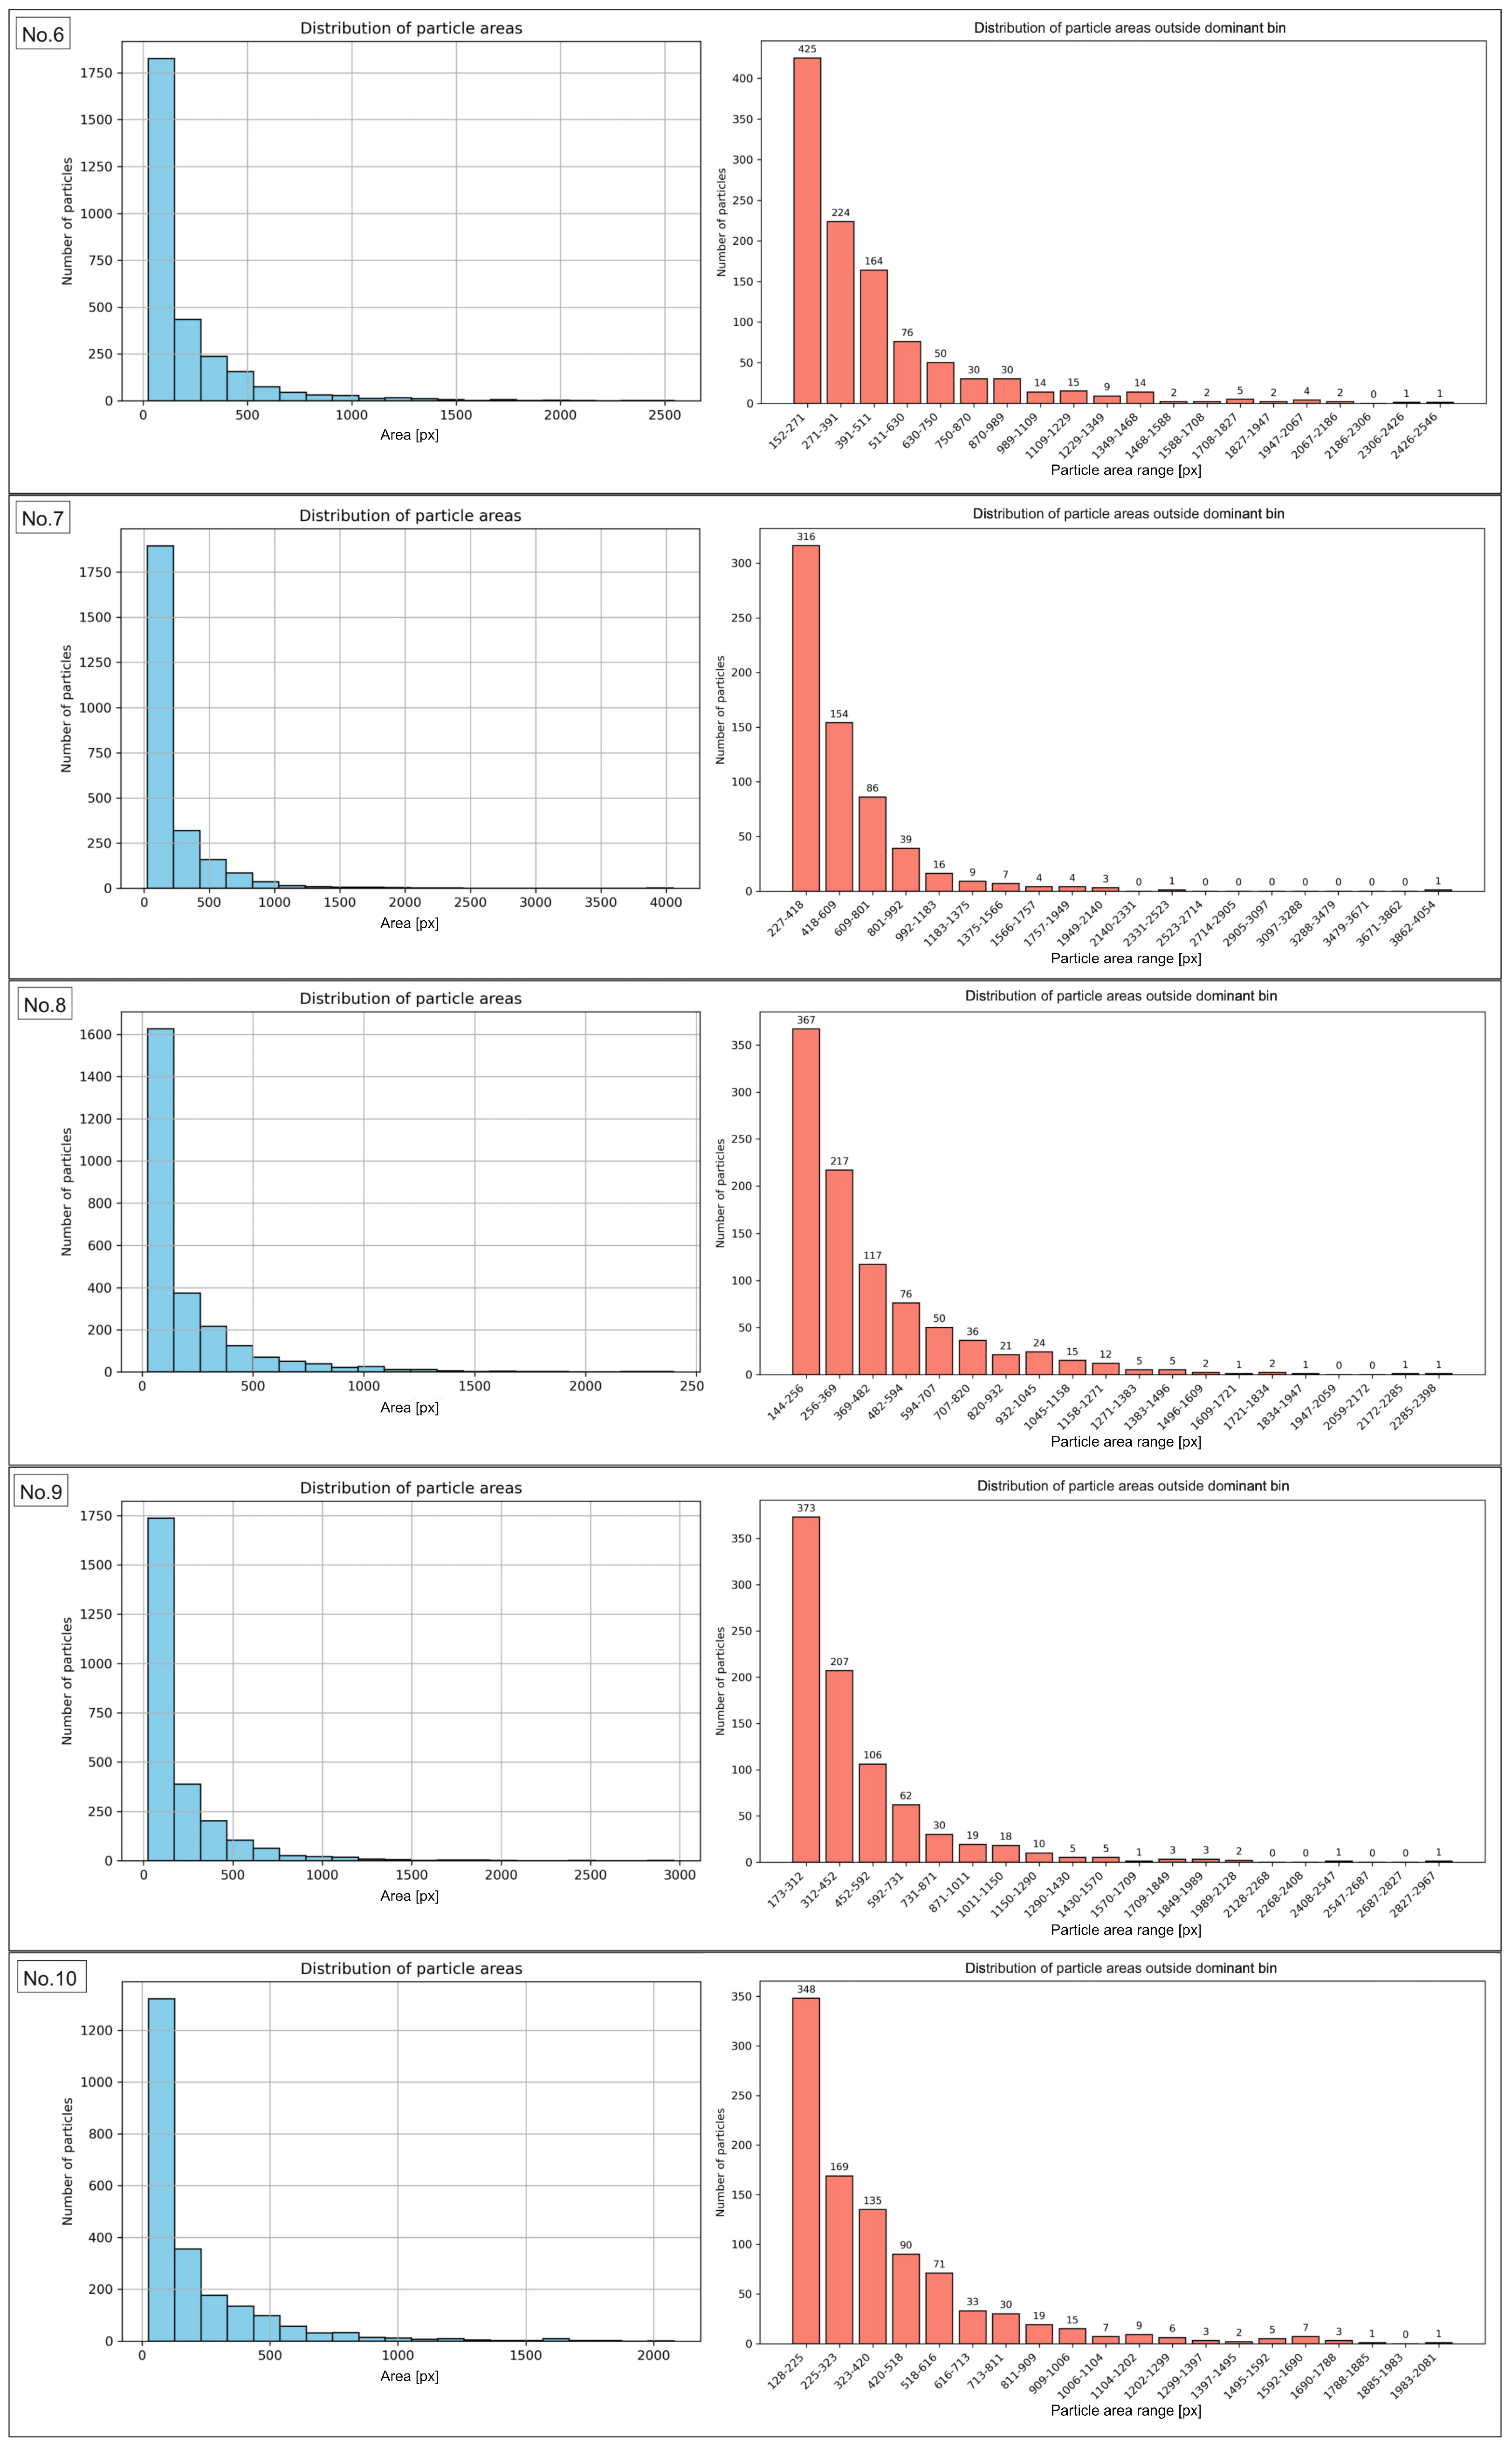
Figure 8, for images from No. 1 to No. 5, and in
Figure 9, for images from No. 6 to No. 10, while
Table 4 included numerical values. The same data, expressed in
, are presented in
Figure A2.
Analysis of the presented results indicates that the distribution of the most frequently occurring particles in the examined sample is relatively homogeneous, with the share of particles within the dominant area ranges varying broadly from 58.07% to 78.69%. The highest value was recorded for region No. 2, in which 2375 particles were detected, accounting for 78.69% of their total number in the image. Such a high proportion indicates a clear dominance of particles with sizes corresponding to this range and a relatively small presence of particles with extreme dimensions. Conversely, the lowest share of particles within the dominant range was observed in regions No. 1 and No. 10, where it amounted to 58.69% and 58.07%, respectively. This means that in these images, a larger portion of the population was characterized by areas outside the analyzed range, suggesting a local increase in morphometric variability. In the remaining regions, the share of particles fell within the range from 63.05% (No. 6) to 74.75% (No. 7), indicating the stability and repeatability of the results in most analyzed cases. The numerical values for particles outside main range are presented in
Tables S11–S20. It is worth emphasizing that all dominant area ranges started from the value of 25 px, while their upper limits varied between regions depending on the local particle distribution, ranging from 127 px (No. 10) to 273 px (No. 2). This indicates relatively small but noticeable differences in the maximum sizes of the most frequently occurring particles across individual image fields. Generally, the obtained results clearly confirm that the majority of particles in the examined sample fall within relatively narrow and repeatable area ranges, with the exceptions of regions No. 1 and No. 10.
4. Discussion
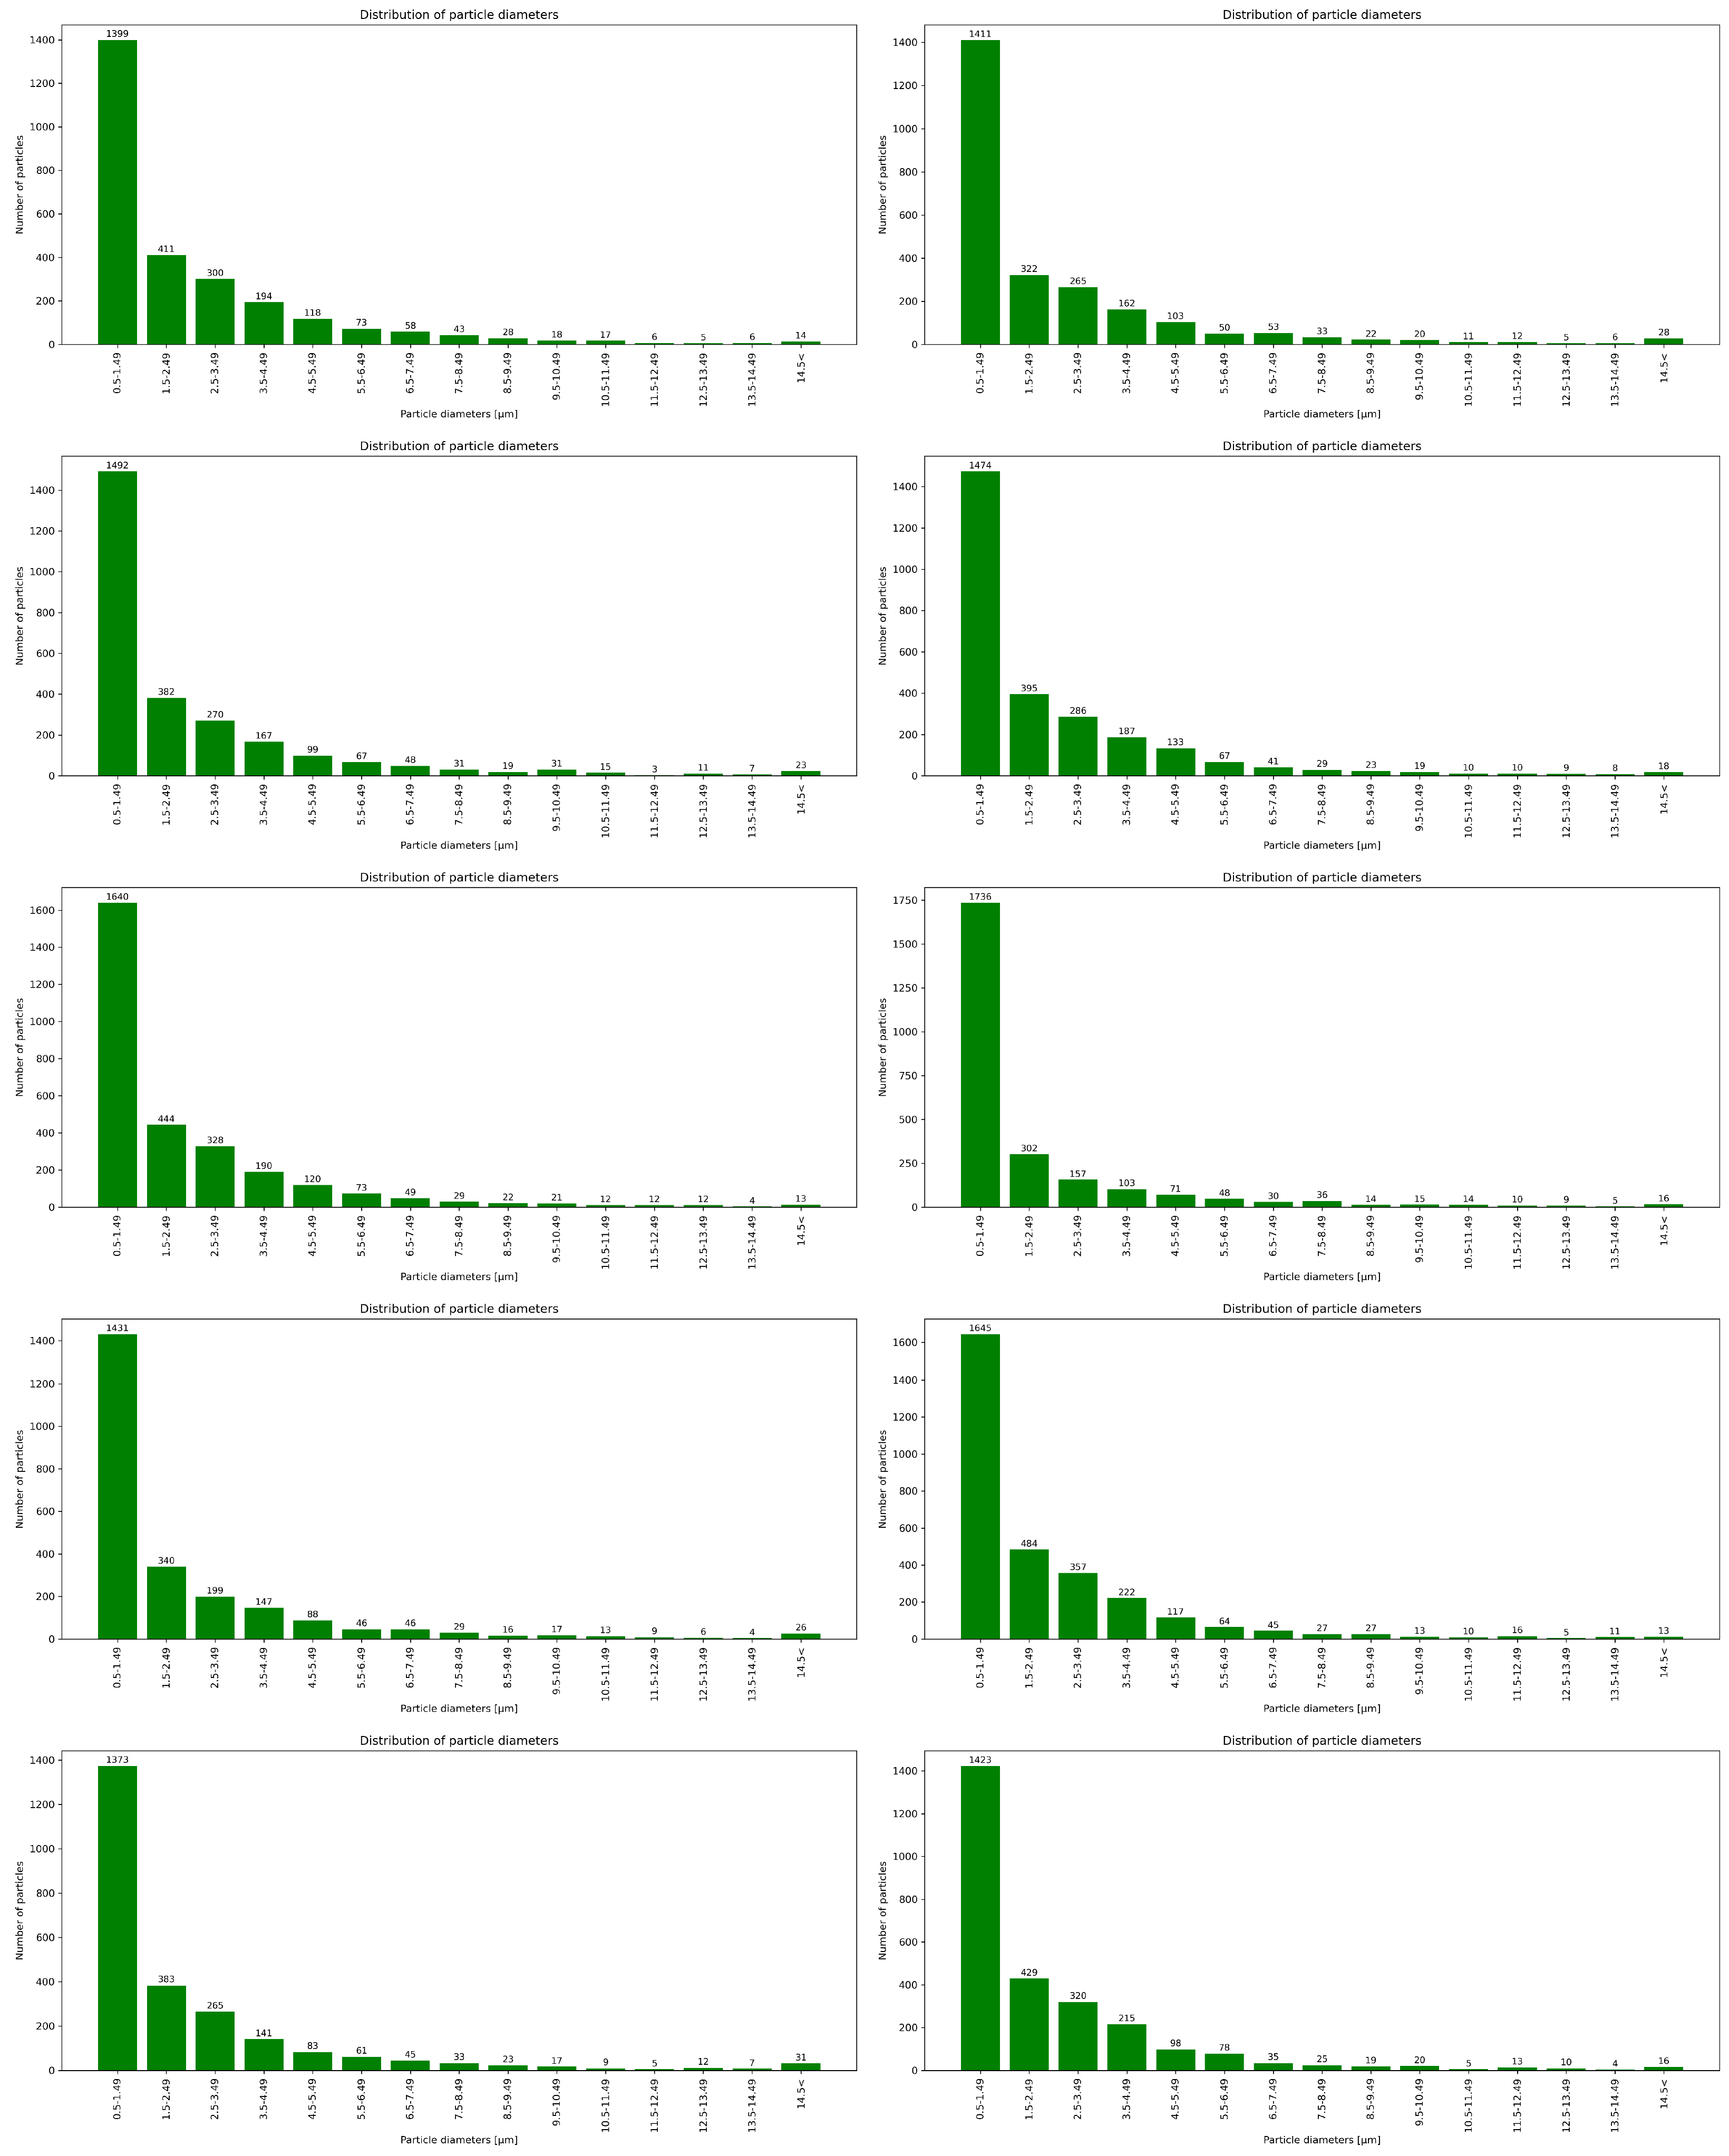
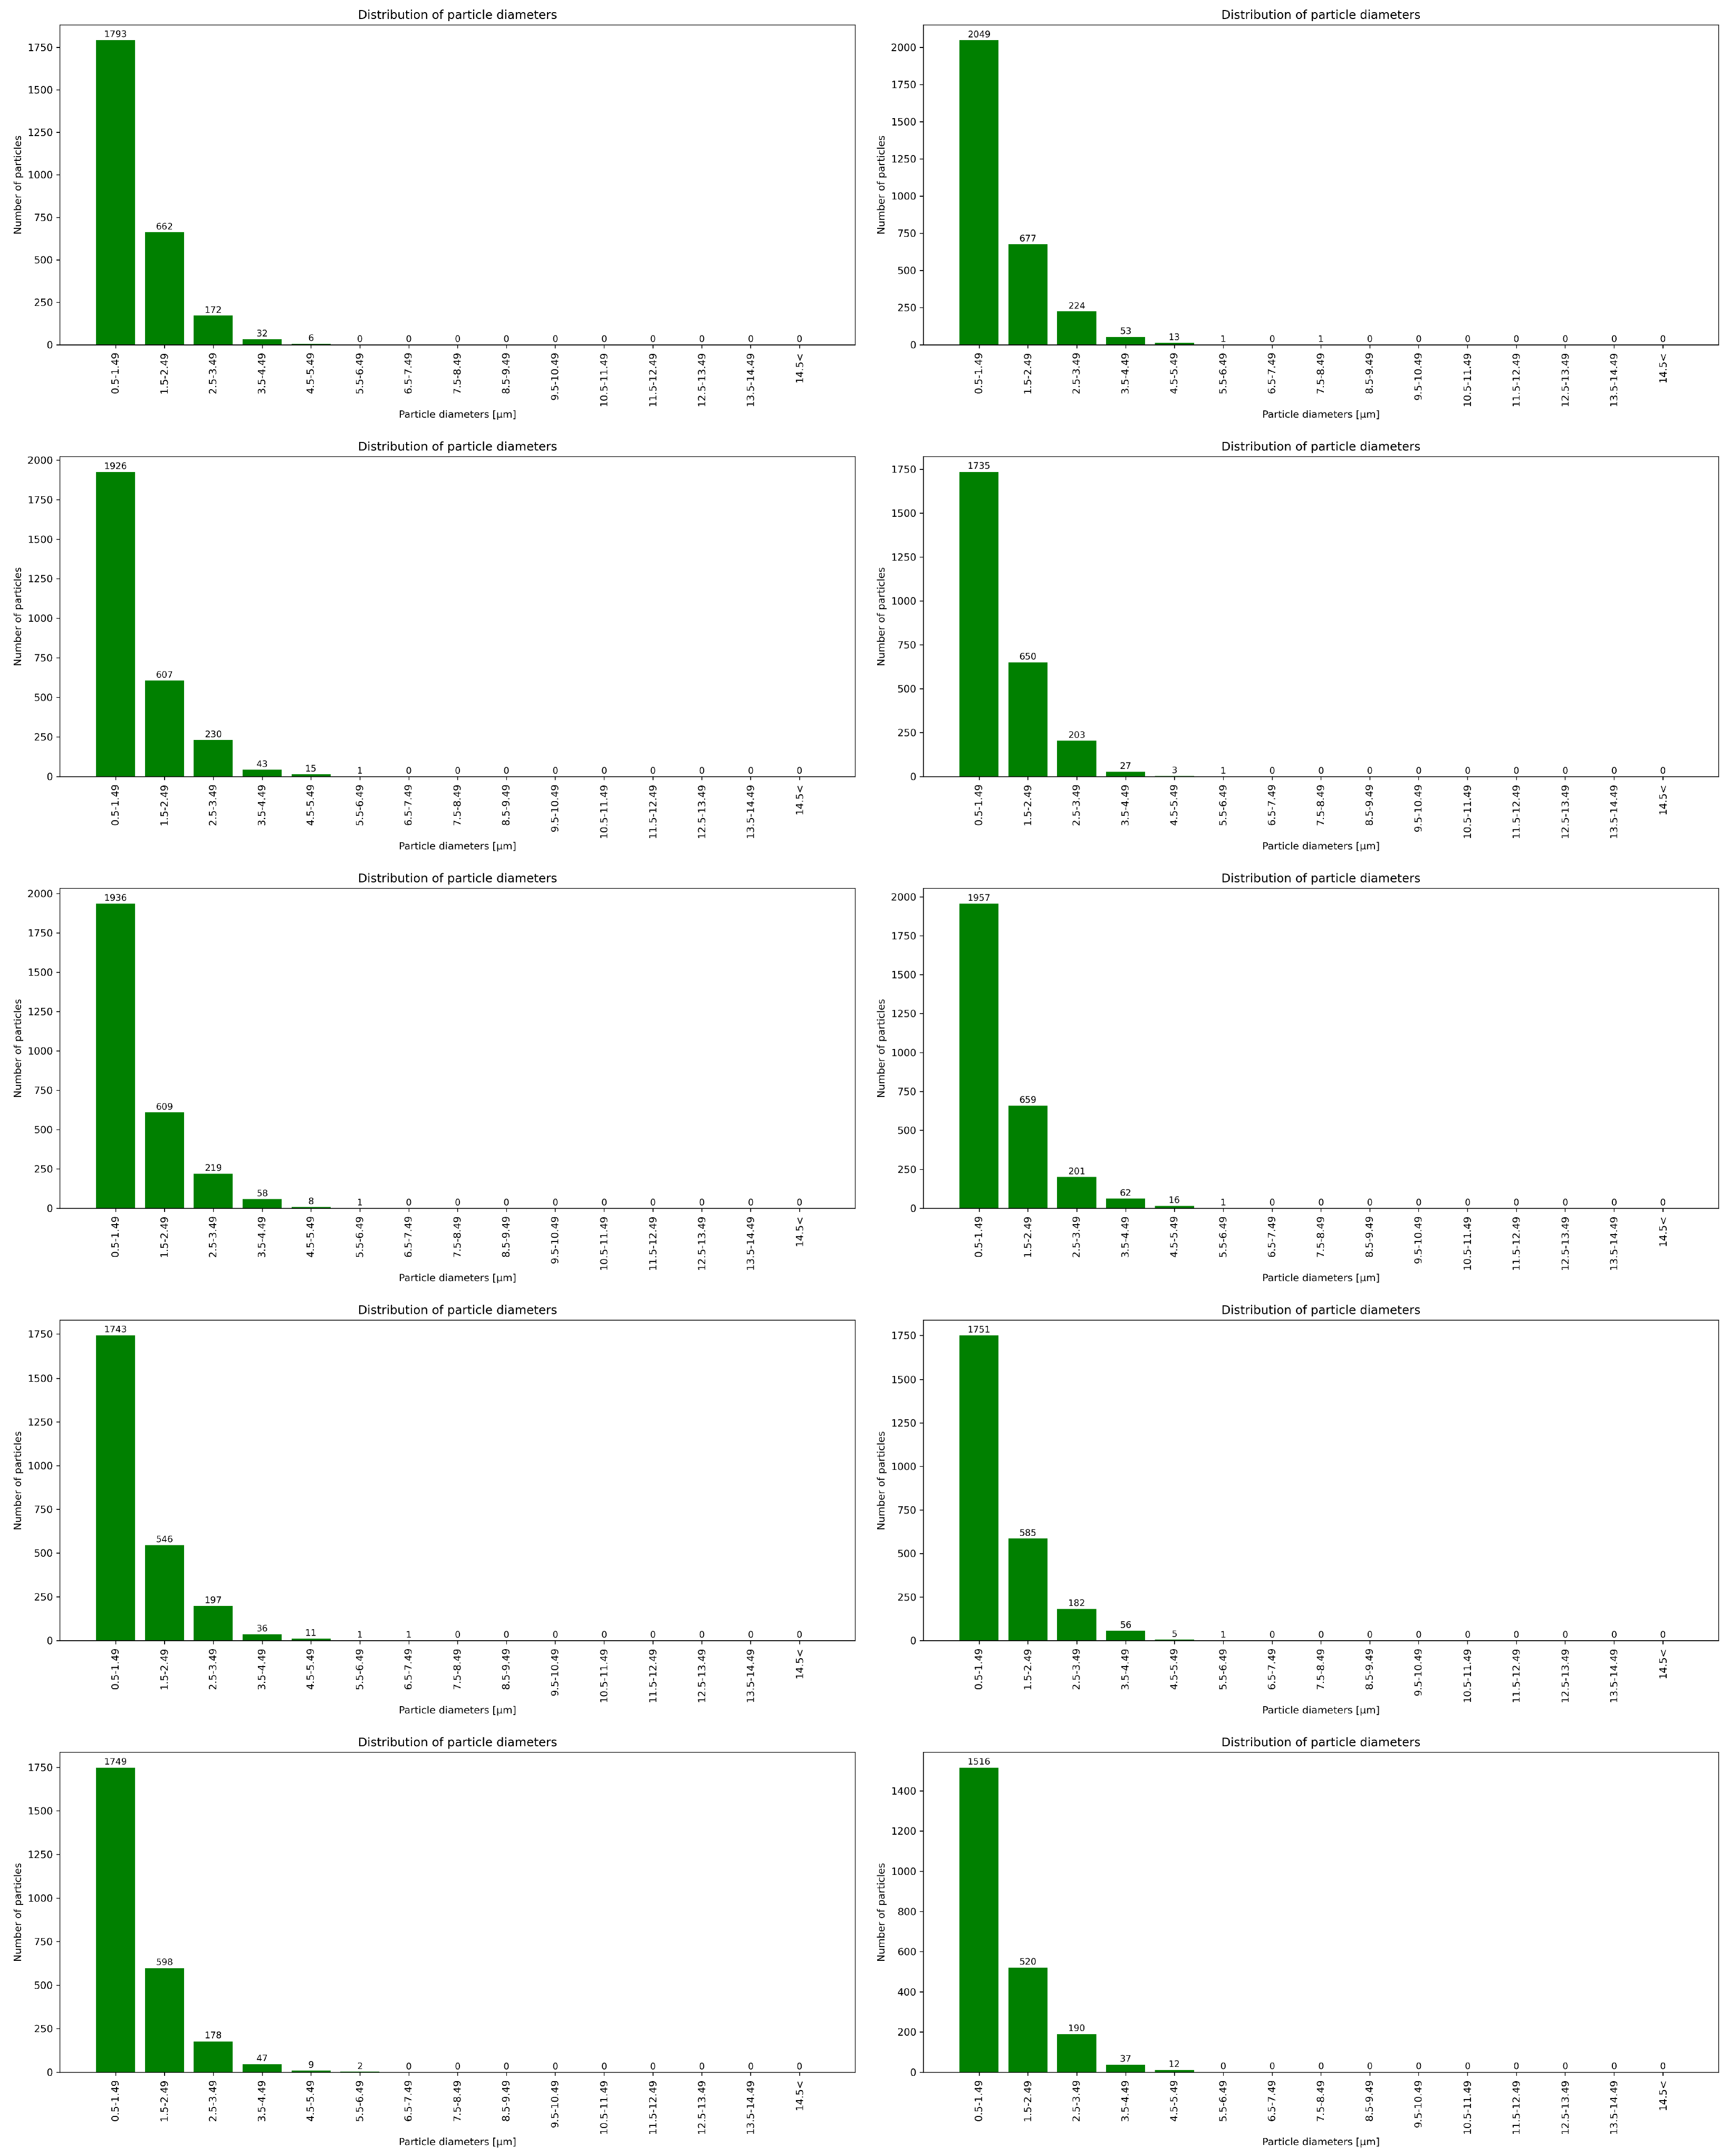
The comparison of data determined for the sample before and after the recycling process indicated that even though a number of particles remained at relatively the same level (2677 and 2682, accordingly for sample prior and after recycling process), the explicit decrease was stated for total area value and particle density. Consequently, the effectiveness of the recycling process could be confirmed. Before recycling, the average total particle area amounted to 2.69 million px, whereas after recycling it decreased to approximately 516 thousand px. This corresponds to nearly a fivefold reduction in surface coverage. Similarly, the average particle density significantly decreased from 43.30% to 8.30%. These results show that despite a comparable number of particles, the recycling process led to a substantial removal of bigger particles and agglomerates, resulting in a lowered area fraction of particles within the examined area, as particle size distribution histograms before recycling (
Figure A3) and after recycling (
Figure A4) confirm. Additionally, a pronounced narrowing of the density range was observed (from 40.87–46.12% before recycling to 7.23–9.51% after recycling). Post-recycling, variability between individual images was markedly reduced, indicating a more uniform distribution of smaller particles. The findings confirm that the applied recycling method was effective in recovering a significant number of particles. The examination of particle area distribution histograms before and after recycling enabled the evaluation of variations in particle areas and the determination of the degree of their concentration within specific size intervals. In samples analyzed prior to recycling, the vast majority of particles were located within dominant intervals. Their share ranged from 84.54% to 99.42%, with nine out of ten regions exceeding 90%. Post-recycling analysis revealed a marked decrease in the proportion of particles within the dominant area ranges, varying from 58.07% (regions No. 10) to 78.69% (regions No. 2).
The developed analysis revealed, that—taking into consideration mean values included in
Table 1 and
Table 2—the number of particles could be stated at a relatively similar level for both samples. Nevertheless, it is important to acknowledge that image analysis techniques, like any other technique, possess
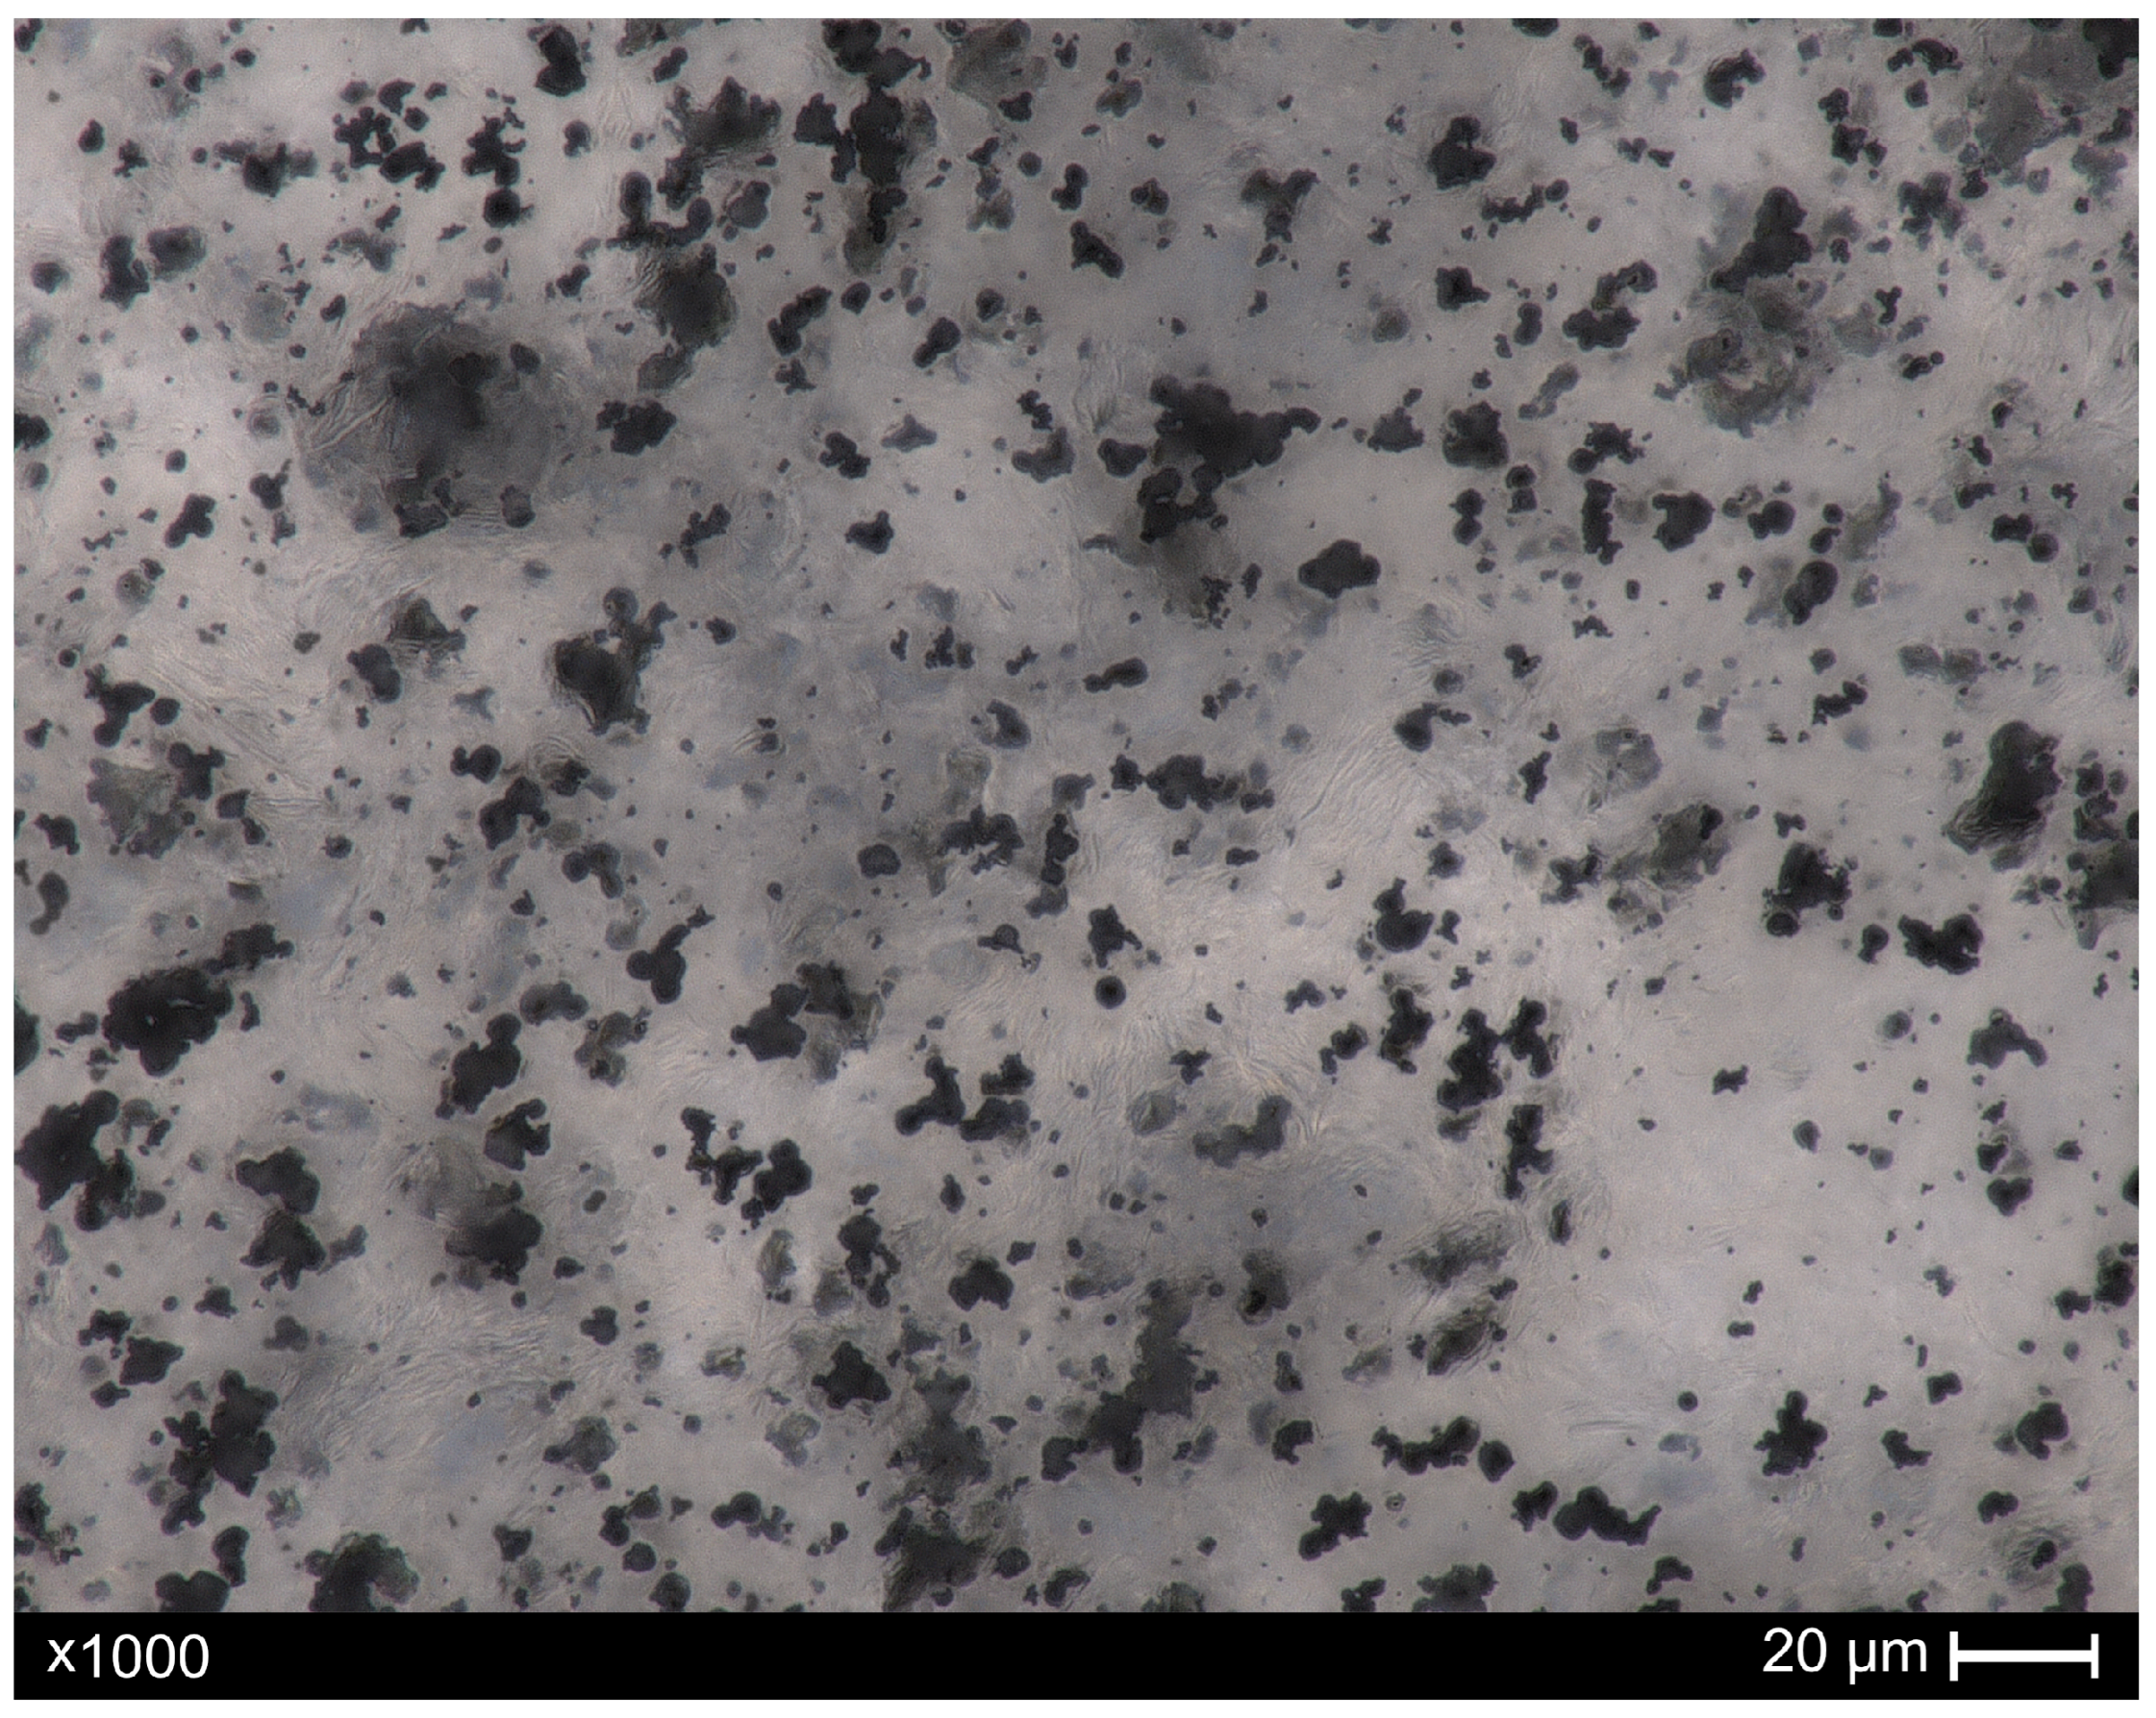
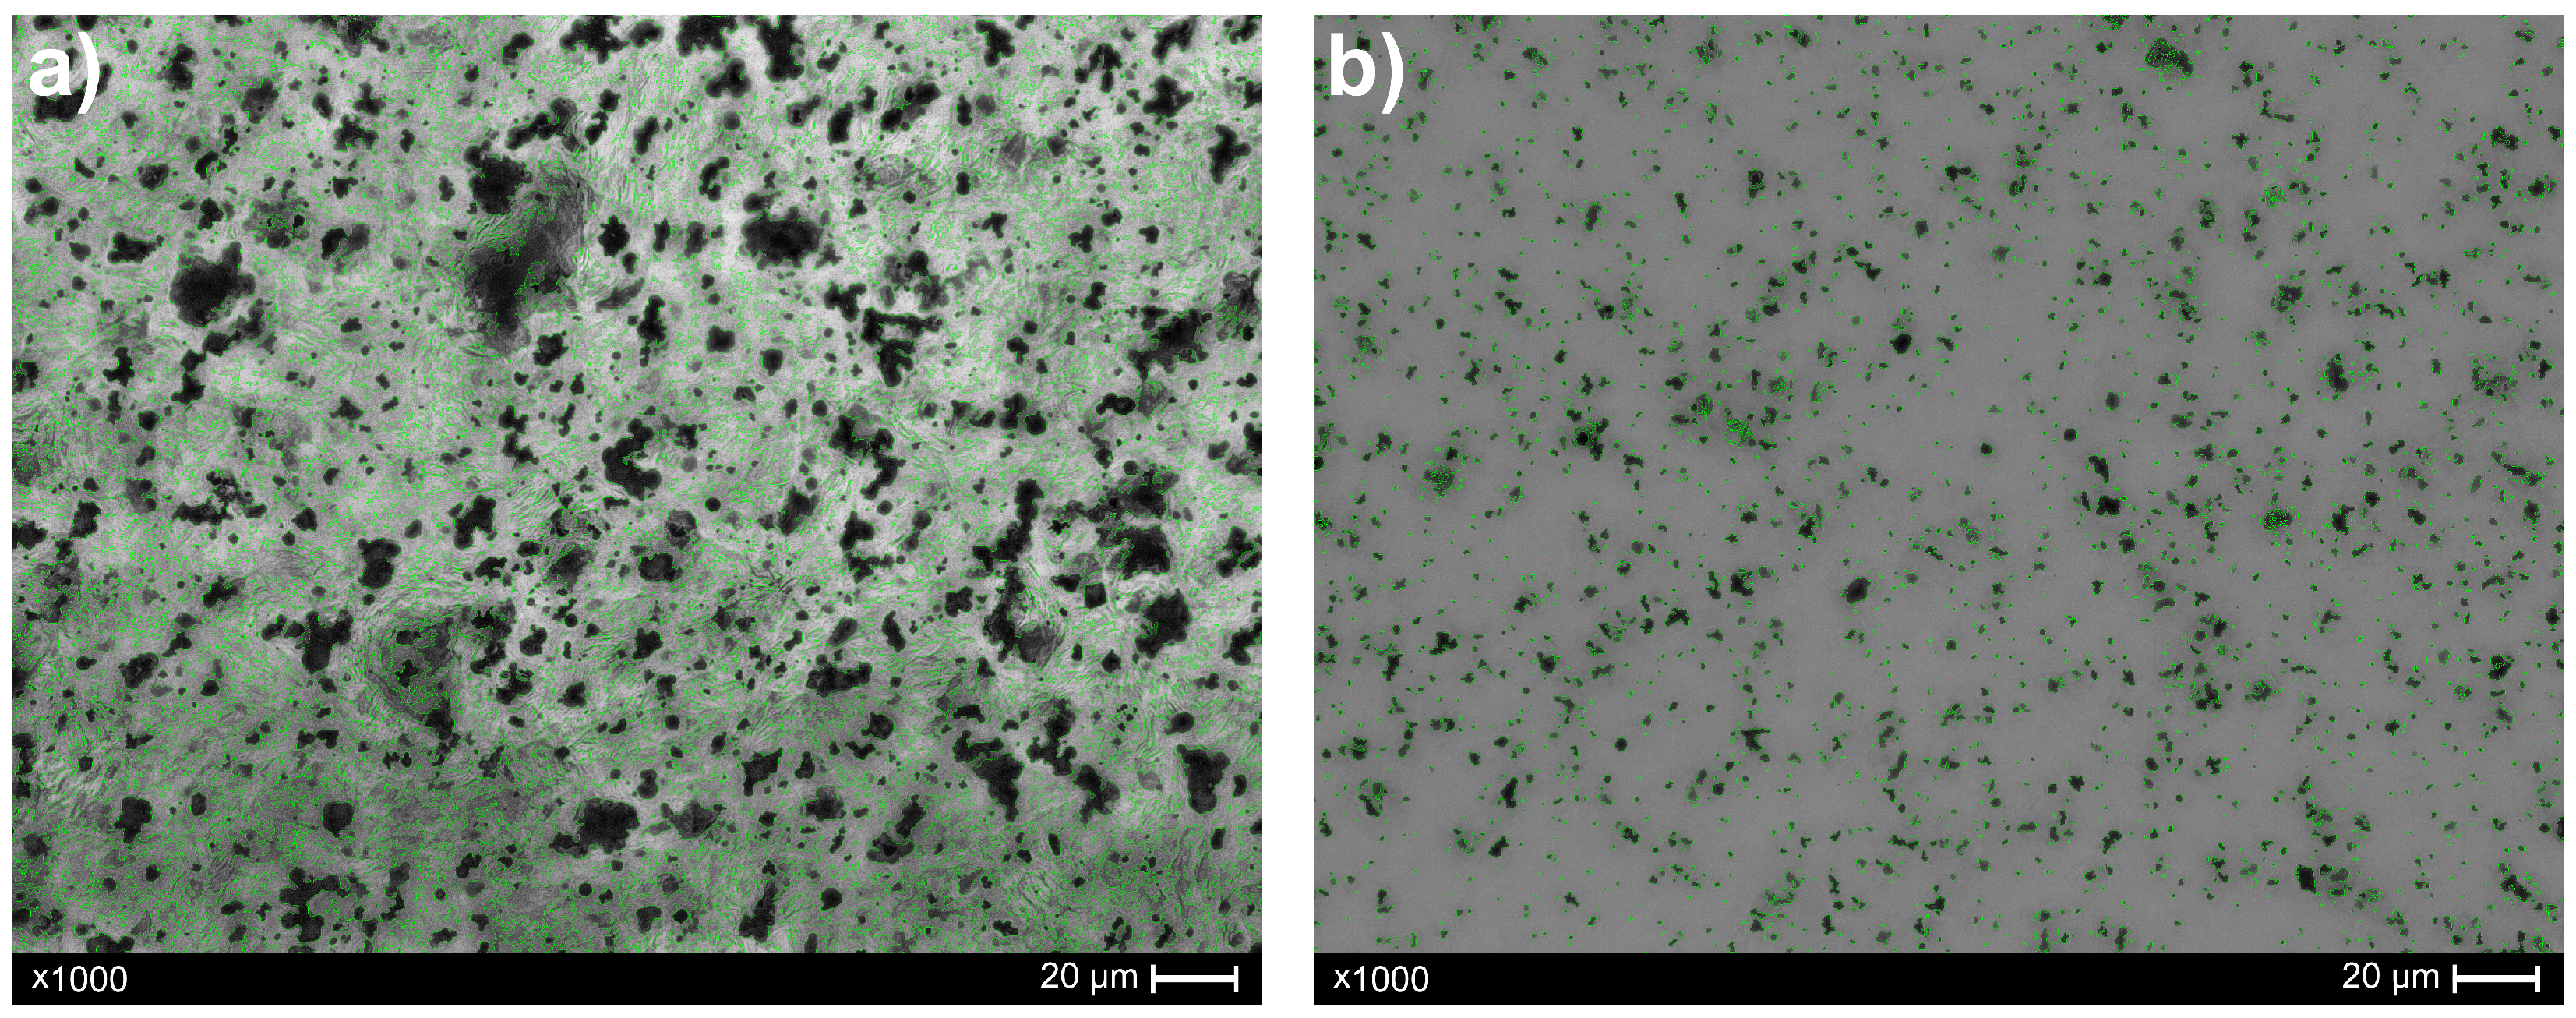
inherent limitations. It could encounter difficulties in accurately quantifying particle counts in the presence of agglomerates. Here, the image characterization exhibited some agglomerates (
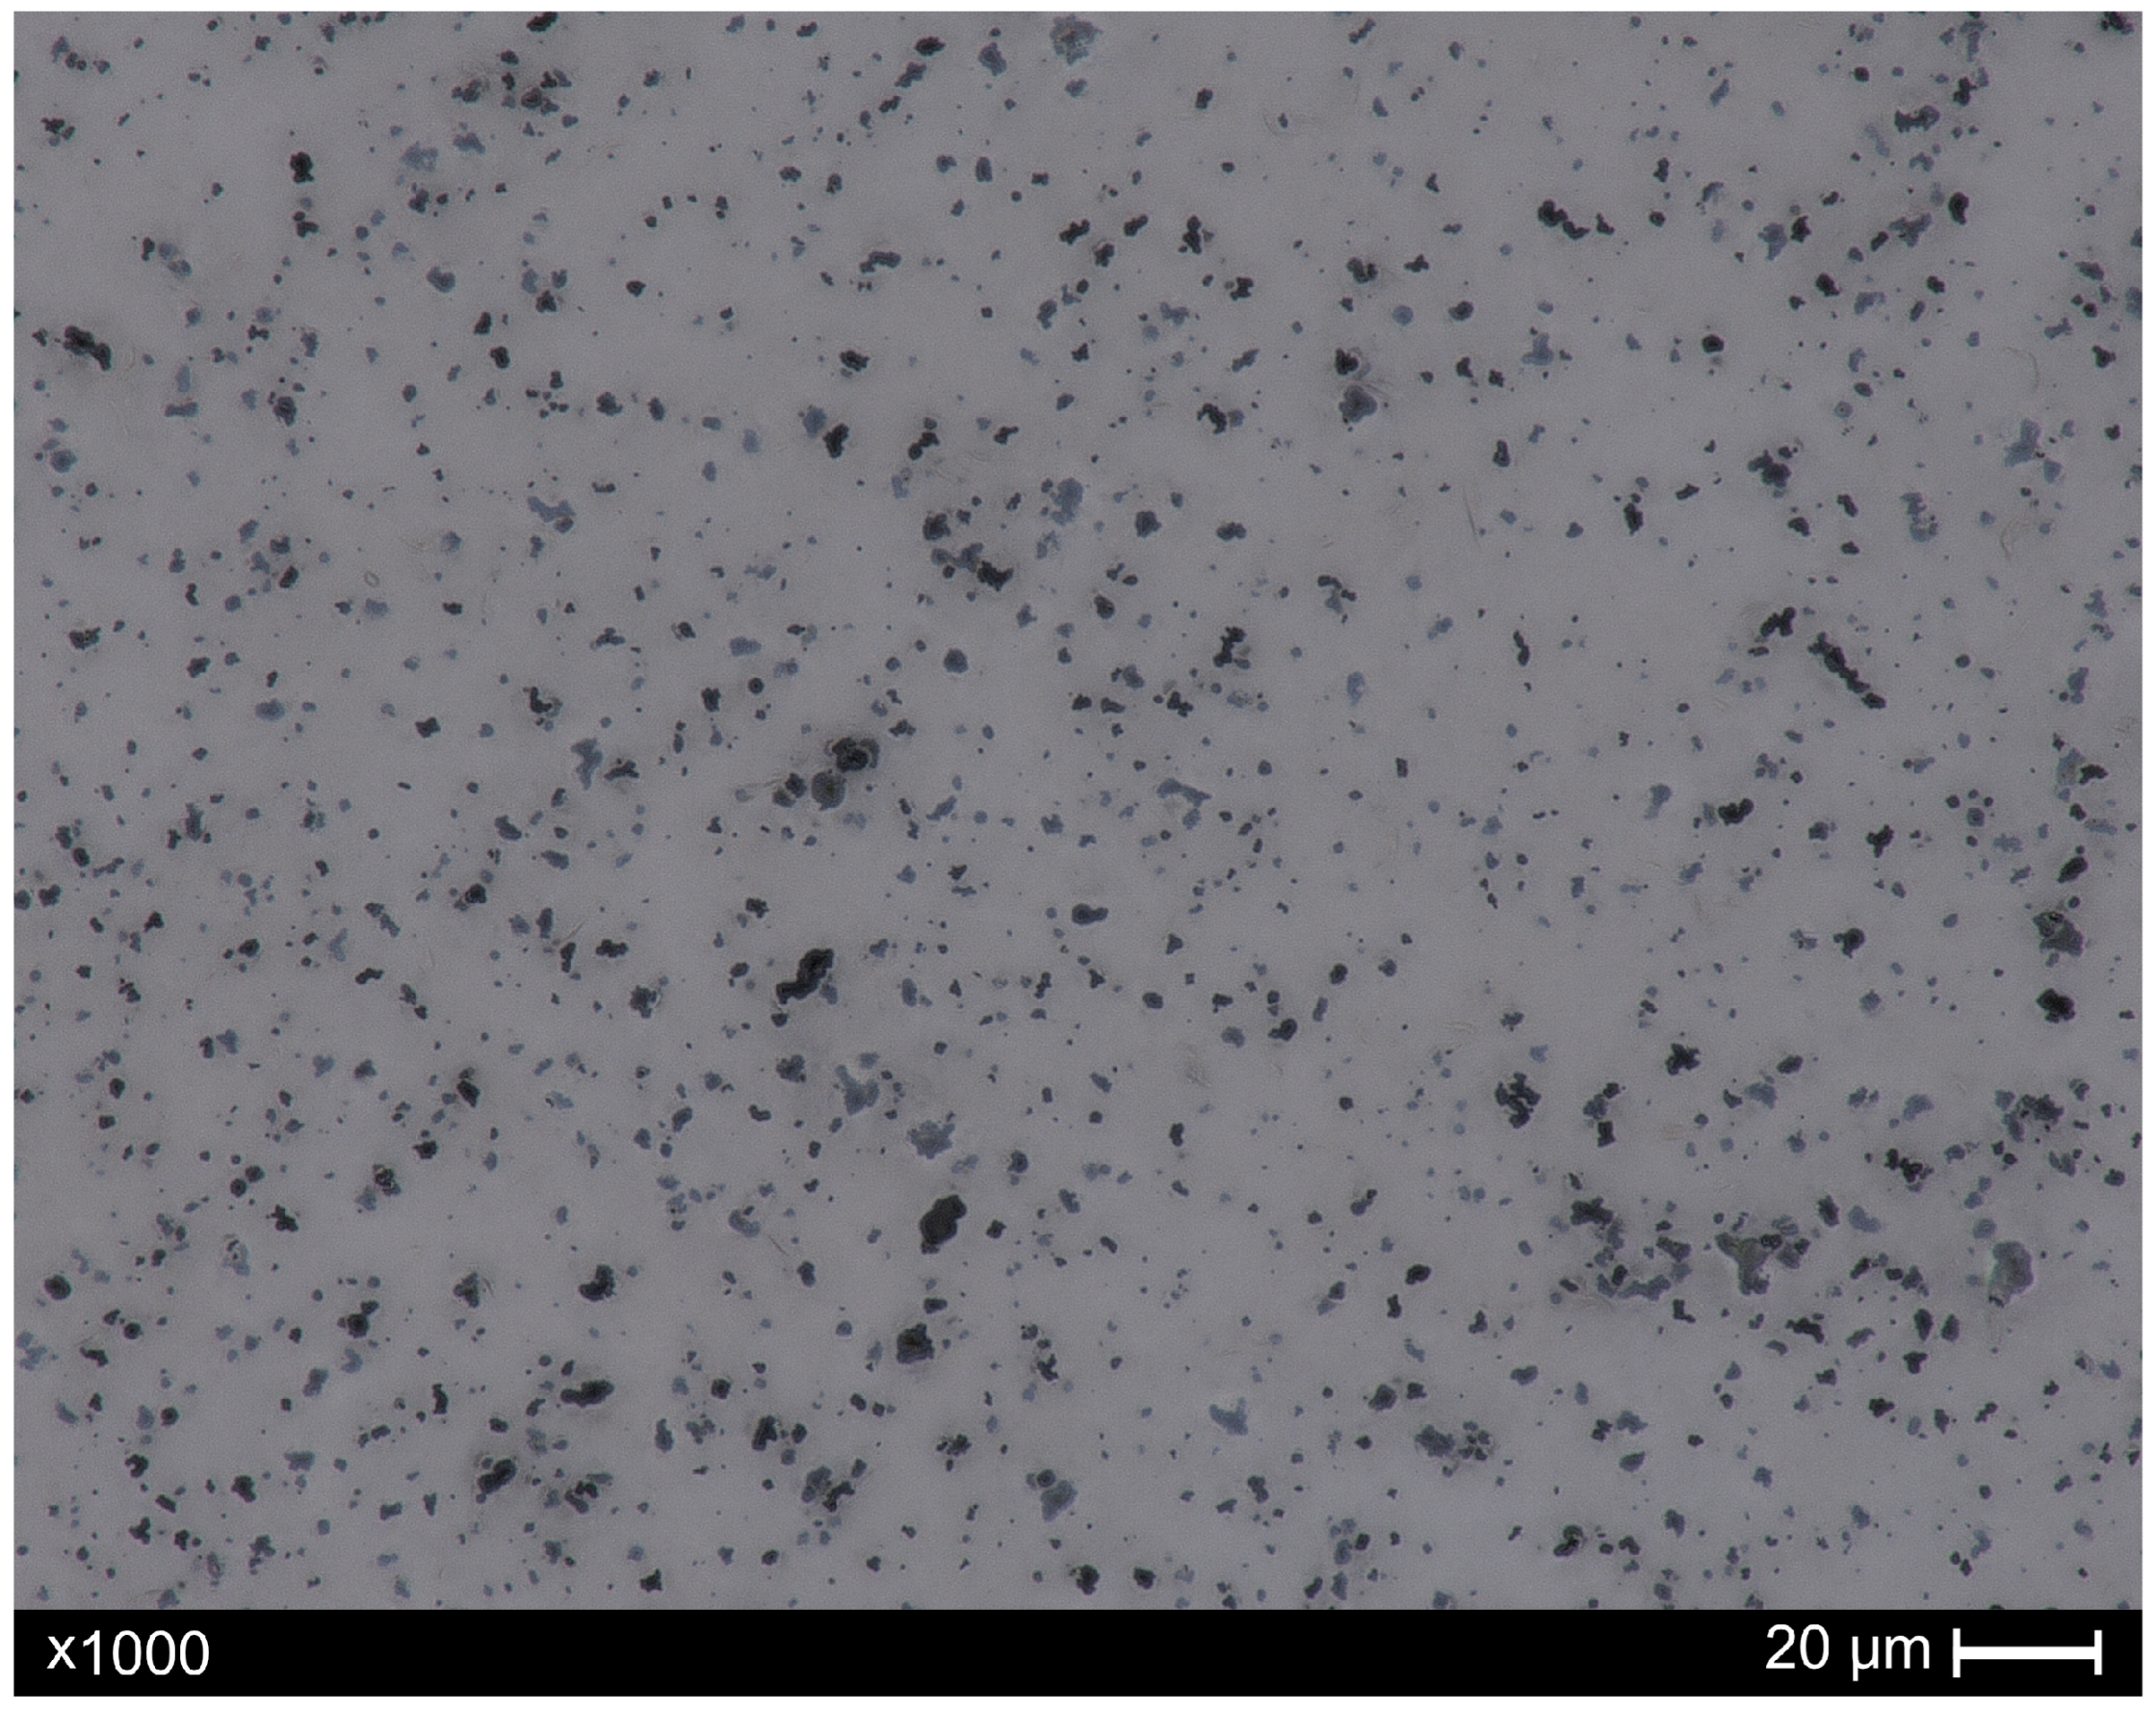
Figure 1), which, again, are a consequence of the composite’s functionality or, potentially, emphasizes the need for the further advancement of the manufacturing process. Despite this, the explicit difference is noticeable in the values of total area as well as particle density (as mentioned above), confirming the efficiency of the recycling protocol. Indeed, melting the paraffin matrix and adding turpentine facilitated phase separation (paraffin and tungsten particles); consequently, after centrifugation step, the tungsten microparticles gathered at the bottom of the vial. Finally, the residuals—tungsten microparticles that remained in the waste (i.e., paraffin, turpentine) above the sediment part—showed lower numbers of particle density (mean value 8.30%) in comparison to the manufactured composite sample (mean value of particle density 43.30%), which confirms the contribution of all subsequent steps in the recycling protocol.
5. Conclusions
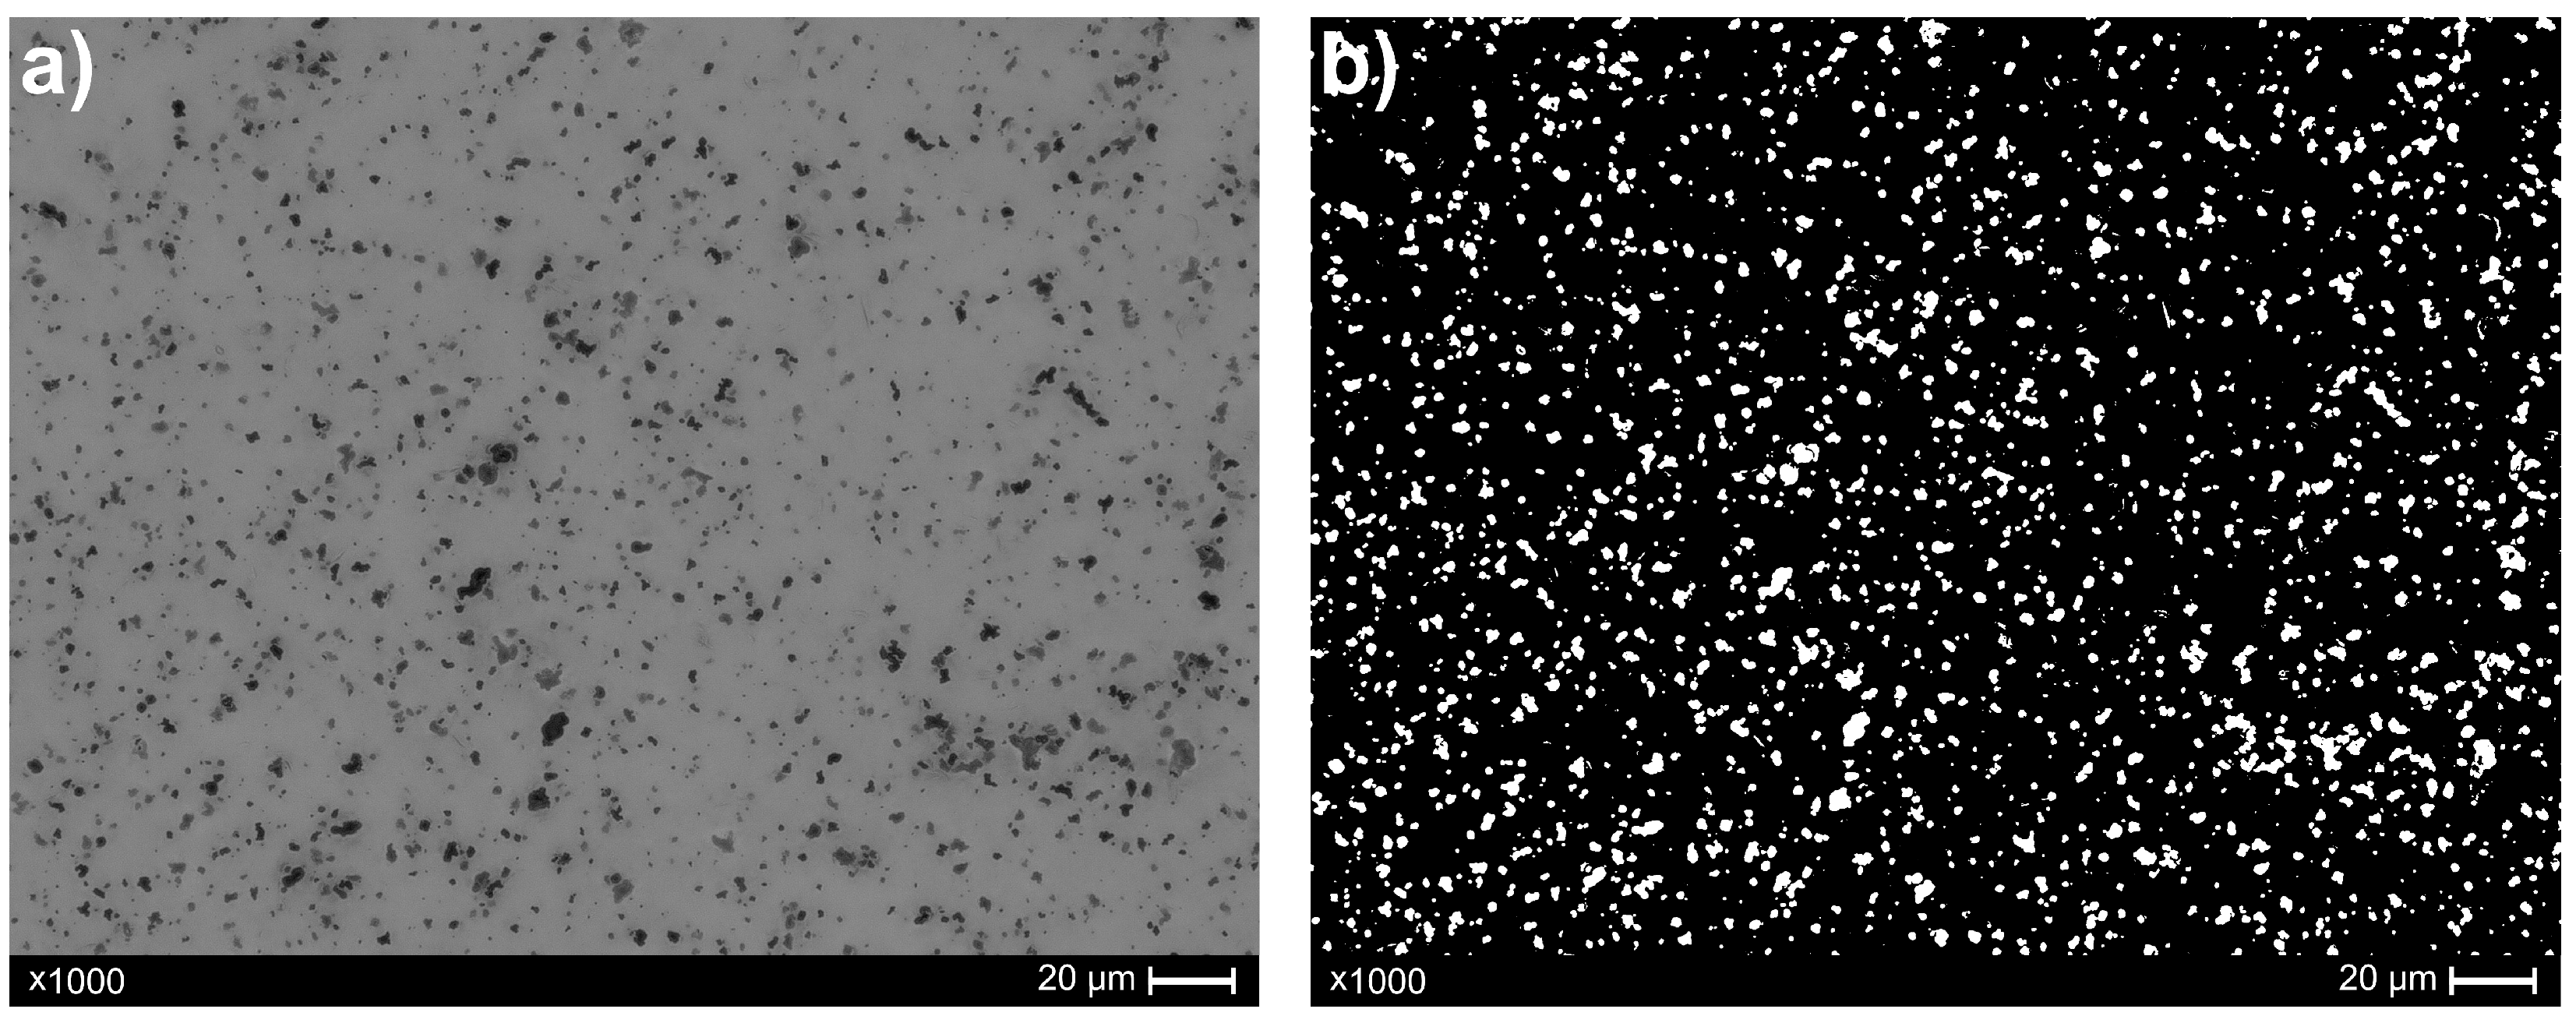
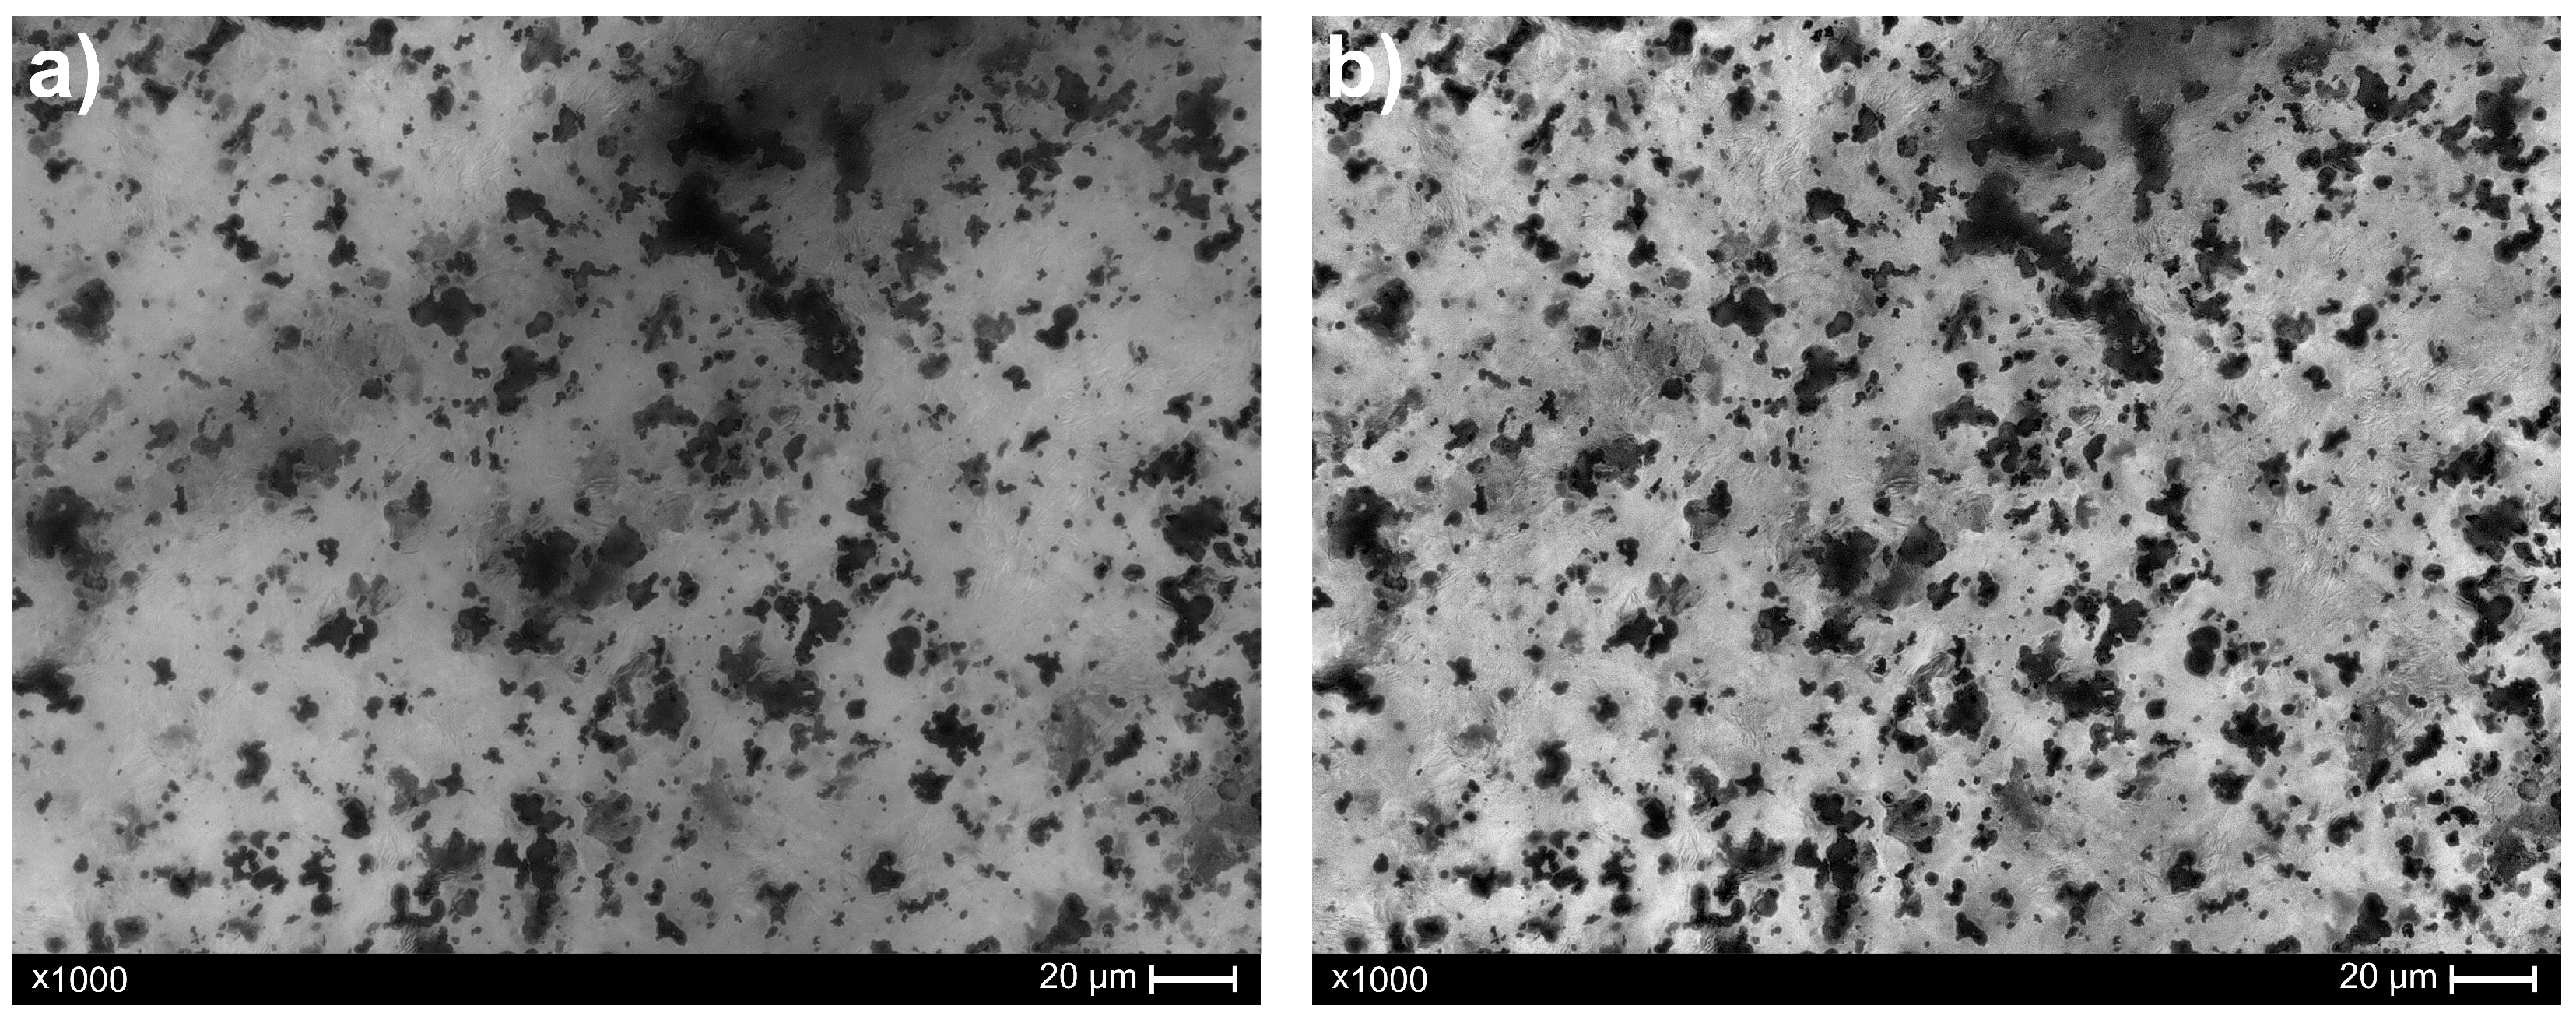
This study refers to the quantitative analysis estimation of a recycling process utilizing commonly available and relatively straightforward tools—images acquired with a visible-light microscopy accompanied by computed processing (adaptive thresholding, smoothing step, etc.) Quantitative analysis of particle count, surface area, and density before and after the recycling process provided essential information on the morphology and homogeneity of the examined sample. Prior to recycling, the number of particles was relatively stable, while the total particle area and density exhibited greater variability, indicating local differences in particle size and agglomeration, confirming the heterogeneous structure of the material. The existence of agglomerates arises from the functionality of developed composites as the shape is influenced by hand-force; consequently, changes in shape lead to an alteration in the location of dispersed particles within matrix. The simplicity of the manufacturing procedure cannot be overlooked as it could play a role in agglomeration phenomena; thus, improvements (for instance, additional steps following cold mixing) may be worth exploring regarding their overall impact on the contribution of the presented analyses. After recycling, the particle count remained close to the initial state, whereas the total particle area and density decreased significantly the value of the total particles area reduced from 26, to , while the primary particle density value of 43.30% decreased to 8.30% according to the samples before and after the recycling process. Based on the acquired microscopy images, it can be noticed that most particles exhibited a more uniform dispersion within wastes (melted paraffin and turpentine) and narrower size distribution, thus generally demonstrating the efficiency of the recycling process. However, minor deviations in the number of particles and their size were observed in some images. The results confirm that the recycling process allows for the recovery of larger particles and agglomerates. Moreover, quantitative analysis of particle area and density distribution provides a reliable method for assessing the effectiveness of the recycling process. These findings also highlight the importance of considering local heterogeneity when interpreting morphometric results, even for samples originating from a single source. Further research should be conducted focusing on the investigation of the quantitative estimation of recovered particles using alternative techniques (for instance, gravimetric methods), thus allowing for a holistic approach to the assessment of the efficiency of the recycling protocol.
