Article

Thermodynamic Evaluation and Optimization of the CaO-TiO2-SiO2 Ternary System

School of Material Science and Engineering, Central South University, Changsha 410083, China
*
Authors to whom correspondence should be addressed.
Materials 2025, 18(19), 4448; https://doi.org/10.3390/ma18194448
Submission received: 16 August 2025 / Revised: 16 September 2025 / Accepted: 18 September 2025 / Published: 23 September 2025

Abstract

The thermodynamic equilibrium of the CaO-TiO2-SiO2 system plays a crucial role in the design of ceramic materials. CaO-TiO2-SiO2 ternary systems were thermodynamically evaluated and optimized using the CALculation of PHAse Diagram (CALPHAD) method. The liquid phase was modeled with the ionic two-sublattice model, represented as (Ca+2,Ti+2,Ti+3)P(O−2,Va,O,TiO2,SiO2,SiO4−4)Q, and the ternary compound was described using the compound energy formalism (CEF) model. A set of self-consistent thermodynamic parameters was obtained for the CaO-TiO2-SiO2 system. The complete parameters are listed, which reliably could describe the phase equilibria and thermodynamic properties of the ternary system. This thermodynamic description provides a valuable foundation for developing larger thermodynamic databases for multicomponent silicate systems.

1. Introduction

CaO-SiO2-based glasses, constituting a fundamental silicate glass system, continue to be studied extensively due to the tunable physicochemical properties, favorable biocompatibility, and relatively low cost. Significant research interest is sustained in fields such as construction, photovoltaics, biomedicine, low-carbon materials and particularly in the development of glass-ceramics and opacified glazes [1]. The addition of modifiers like B2O3 and TiO2 to CaO-SiO2-based glasses enables the production of glass-ceramics exhibiting diverse crystalline phases and superior properties [2,3,4].
A prominent application of the CaO-TiO2-SiO2 system is in the development of zirconium-free opaque glazes [5,6]. Conventional zirconium silicate opacifiers are increasingly phased out due to concerns over natural radioactivity and high cost. TiO2 represents an effective alternative opacifier. However, its direct introduction often leads to undesirable yellowing of the glaze, primarily caused by the formation of rutile TiO2. Recent studies have demonstrated that optimizing the composition and heat treatment to promote the oriented crystallization of titanite (CaTiSiO5) instead of rutile can effectively mitigate yellowing while achieving superior whiteness and a higher refractive index. This highlights the critical need for a thorough understanding of the phase equilibria within the CaO-TiO2-SiO2 system to rationally design these materials. Furthermore, this ternary system serves as the fundamental foundation for more complex multi-component systems (e.g., CaO-TiO2-SiO2-B2O3) used in advanced glass-ceramics. Although glasses are non-equilibrium materials, their controlled crystallization—essential for glass-ceramic production—is intrinsically guided by the underlying equilibrium phase diagram. The diagram predicts the stable crystalline phases that form upon heat treatment, making accurate thermodynamic data a prerequisite for optimizing processing conditions and final properties. Consequently, the thorough understanding of the phase equilibria in the CaO-SiO2-TiO2-B2O3 system is essential for designing novel high-performance glass-ceramics and enhancing the properties of existing materials. The knowledge provides the fundamental theoretical underpinning for industrial practices in glass-ceramic manufacturing and related fields. To efficiently acquire phase equilibrium data, thermodynamic calculations should be performed using appropriate databases and specialized software [7,8].
The CALPHAD method facilitates the development of self-consistent thermodynamic databases [9]. When integrated with appropriate computational tools, this approach significantly reduces the time and cost involved in materials development, thereby offering valuable guidance for the design of advanced materials. Establishing a reliable multicomponent thermodynamic database for the CaO-SiO2-TiO2-B2O3 quaternary system necessitates accurate thermodynamic descriptions of all constituent ternary subsystems. Therefore, the thermodynamic parameters of the CaO-TiO2-SiO2 ternary system are indispensable for constructing a self-consistent multicomponent thermodynamic database for the CaO-SiO2-TiO2-B2O3 system.
This work critically assesses previous experimental investigations and thermodynamic optimization results for the CaO-TiO2-SiO2 ternary system and its constituent binary subsystems. Based on earlier work, a comprehensive re-optimization of the CaO-TiO2-SiO2 system was conducted using the two-sublattice ionic liquid model for the liquid phase. The compound energy formalism (CEF) was applied to model and optimize the phase CaTiSiO5 within the CaO-TiO2-SiO2 system. This work yields a set of self-consistent thermodynamic parameters that reliably reproduce the phase equilibria and thermodynamic properties of the system.

2. Review of Literature Data

2.1. CaO-TiO2 System

In the 1930s, phase equilibria on the TiO2-rich side of the CaO-TiO2 system were experimentally determined by Umezu [10], Fukusima [11], and Von Wartenberg et al. [12]. The existence of three intermediate phases CaTiO3, Ca3Ti2O7, and Ca2TiO4 along with two eutectic reactions was demonstrated in their work. In 1954, the experimental phase diagram data for the CaO-TiO2 system were nearly simultaneously reported by DeVries et al. [13] and Coughanour et al. [14] using X-ray diffraction (XRD) analysis. The presence of the CaTiO3 and Ca3Ti2O7 phases was confirmed through these studies. Based on XRD patterns published by DeVries et al. [13], Roth [15] synthesized a sample with a molar ratio of CaO:TiO2 = 4:3 via solid-state reaction and identified the Ca4Ti3O10 phase for the first time. Roth [15] determined incongruent melting temperatures of 2013 K and 2028 K for Ca3Ti2O7 and Ca4Ti3O10, respectively. Subsequent detailed studies of liquidus relations in the CaO–TiO2 system by Jongejan and Wilkins [16] and Kimura and Muan [17] further confirmed the existence of Ca4Ti3O10. In 1976, Tulgar [18] reported an additional compound, Ca5Ti4O13. More recently, Gong et al. [19] prepared a series of specimens with varying CaO:TiO2 ratios through solid-state synthesis and experimentally verified that CaTiO3, Ca3Ti2O7, and Ca4Ti3O10 are thermodynamically stable in the CaO-TiO2 system.
In 1946, Naylor and Cook [20] employed solution calorimetry to experimentally determine the heat content and entropy of CaTiO3. In 1955, King [21] measured the heat capacity of Ca3Ti2O7 over the temperature range 51–298 K using adiabatic calorimetry and reported its entropy at 298 K. Taylor and Schmalzried [22] performed thermodynamic measurements on CaTiO3 and Ca4Ti3O10 at 823 K using electromotive force (EMF) measurements with solid-state fluoride electrolyte cells. The formation enthalpy of the CaTiO3 was determined by Takayama-Muromachi and Navrotsky [23] via solution calorimetry. Guyot et al. [24] investigated the heat content of CaTiO3 via drop calorimetry. In 1999, Woodfield et al. [25] obtained heat capacity data for CaTiO3 using adiabatic calorimetry. That same year, Putnam et al. [26] studied its formation enthalpy using solution calorimetry. The structural transition temperature of CaTiO3 was reported by Ali et al. [27] and subsequently confirmed by Yashima et al. [28] through neutron diffraction analysis. Jacob and Abraham [29] determined the standard Gibbs free energies of formation for CaTiO3, Ca3Ti2O7, and Ca4Ti3O10 between 900 and 1250 K using solid-state cells with single-crystal CaF2 electrolyte. Navi et al. [30] also reported the formation enthalpy of CaTiO3. More recently, Gong et al. [19] prepared specimens via solid-state reaction and reported heat capacities of Ca3Ti2O7 and Ca4Ti3O10 from 300 to 1073 K, along with their standard formation enthalpies at 298 K, using a combination of differential scanning calorimetry (DSC) and solution calorimetry.
Kaufman [31], Kirschen et al. [32], Danek et al. [33], and Gong et al. [19] have conducted thermodynamic assessments of the CaO-TiO2 system and reported calculated phase diagrams. However, notable discrepancies exist among their computational results. In 1988, Kaufman [31] published a calculated phase diagram that included the compounds CaTiO3, Ca3Ti2O7, and Ca4Ti3O10. Nevertheless, the calculated melting point of Ca3Ti2O7 was higher than most experimental values, and the structural transition of CaTiO3 was not accounted for. Furthermore, the melting temperatures of CaO and TiO2 adopted by Kaufman [31] differ from those widely accepted in subsequent research. In 1999, Kirschen et al. [32] performed thermodynamic modeling of the CaO-TiO2 system using the Margules solution model to describe the liquid phase. The calculated phase diagram incorporated three intermediate phases: CaTiO3, Ca3Ti2O7, and Ca5Ti4O13. In 2002, Danek et al. [33] reported another calculated phase diagram for the same system, which included only two intermediate compounds, CaTiO3 and Ca3Ti2O7. The computed melting point of Ca3Ti2O7 showed a slight deviation from experimental data. Additionally, polymorphic transitions in CaTiO3 were omitted, and the melting temperatures used for CaO and TiO2 significantly diverged from the consensus values established by later researchers. Gong et al. [19] carried out a critical evaluation of experimental data from the literature and optimized the thermodynamic parameters of the CaO-TiO2 system using key experimental measurements. The liquid phase was modeled using the regular substitutional solution model. The calculated phase diagram and thermodynamic properties showed excellent agreement with reliable experimental data. More recently, Ye et al. [34] reoptimized the system by adopting an ionic two-sublattice model for the liquid phase. The resulting phase equilibria and thermodynamic properties are in excellent consistency with experimental findings. Therefore, the thermodynamic parameters reported by Ye et al. [34] were adopted in the present study. The calculated phase diagram for the CaO-TiO2 binary system is presented in Figure 1.

2.2. CaO-SiO2 System

The first complete phase diagram of the CaO-SiO2 binary system was established by Rankin [35] in 1915, who reported melting points of 2399 K for Ca2SiO4 and 1813 K for CaSiO3, along with three eutectic points in the system. The study also demonstrated that Ca3SiO5 decomposes incongruently at 2173 K into CaO and Ca2SiO4. In 1927, Greig [36] employed quenching techniques to investigate the liquid miscibility gap in the CaO-SiO2 system and provided detailed liquidus data on the SiO2-rich side. Using similar quenching methods, Osborn [37] reported that Ca3Si2O7 melts peritectically at 1737 K and forms a eutectic at 1733 K. The solubility of CaO in Ca2SiO4 was experimentally determined by Trömel et al. [38] using differential thermal analysis (DTA) and high-temperature X-ray diffraction. The results indicated that Ca2SiO4 is stable only within the temperature range of 1573–2073 K. In 1979, a detailed investigation of the liquid miscibility gap in the CaO–SiO2 system was conducted by Tewhey et al. [39]. The activities of SiO2 and CaO in the binary system were experimentally determined by Kay and Taylor [40] and Sharma and Richardson [41], respectively. These findings have been widely referenced in subsequent research.
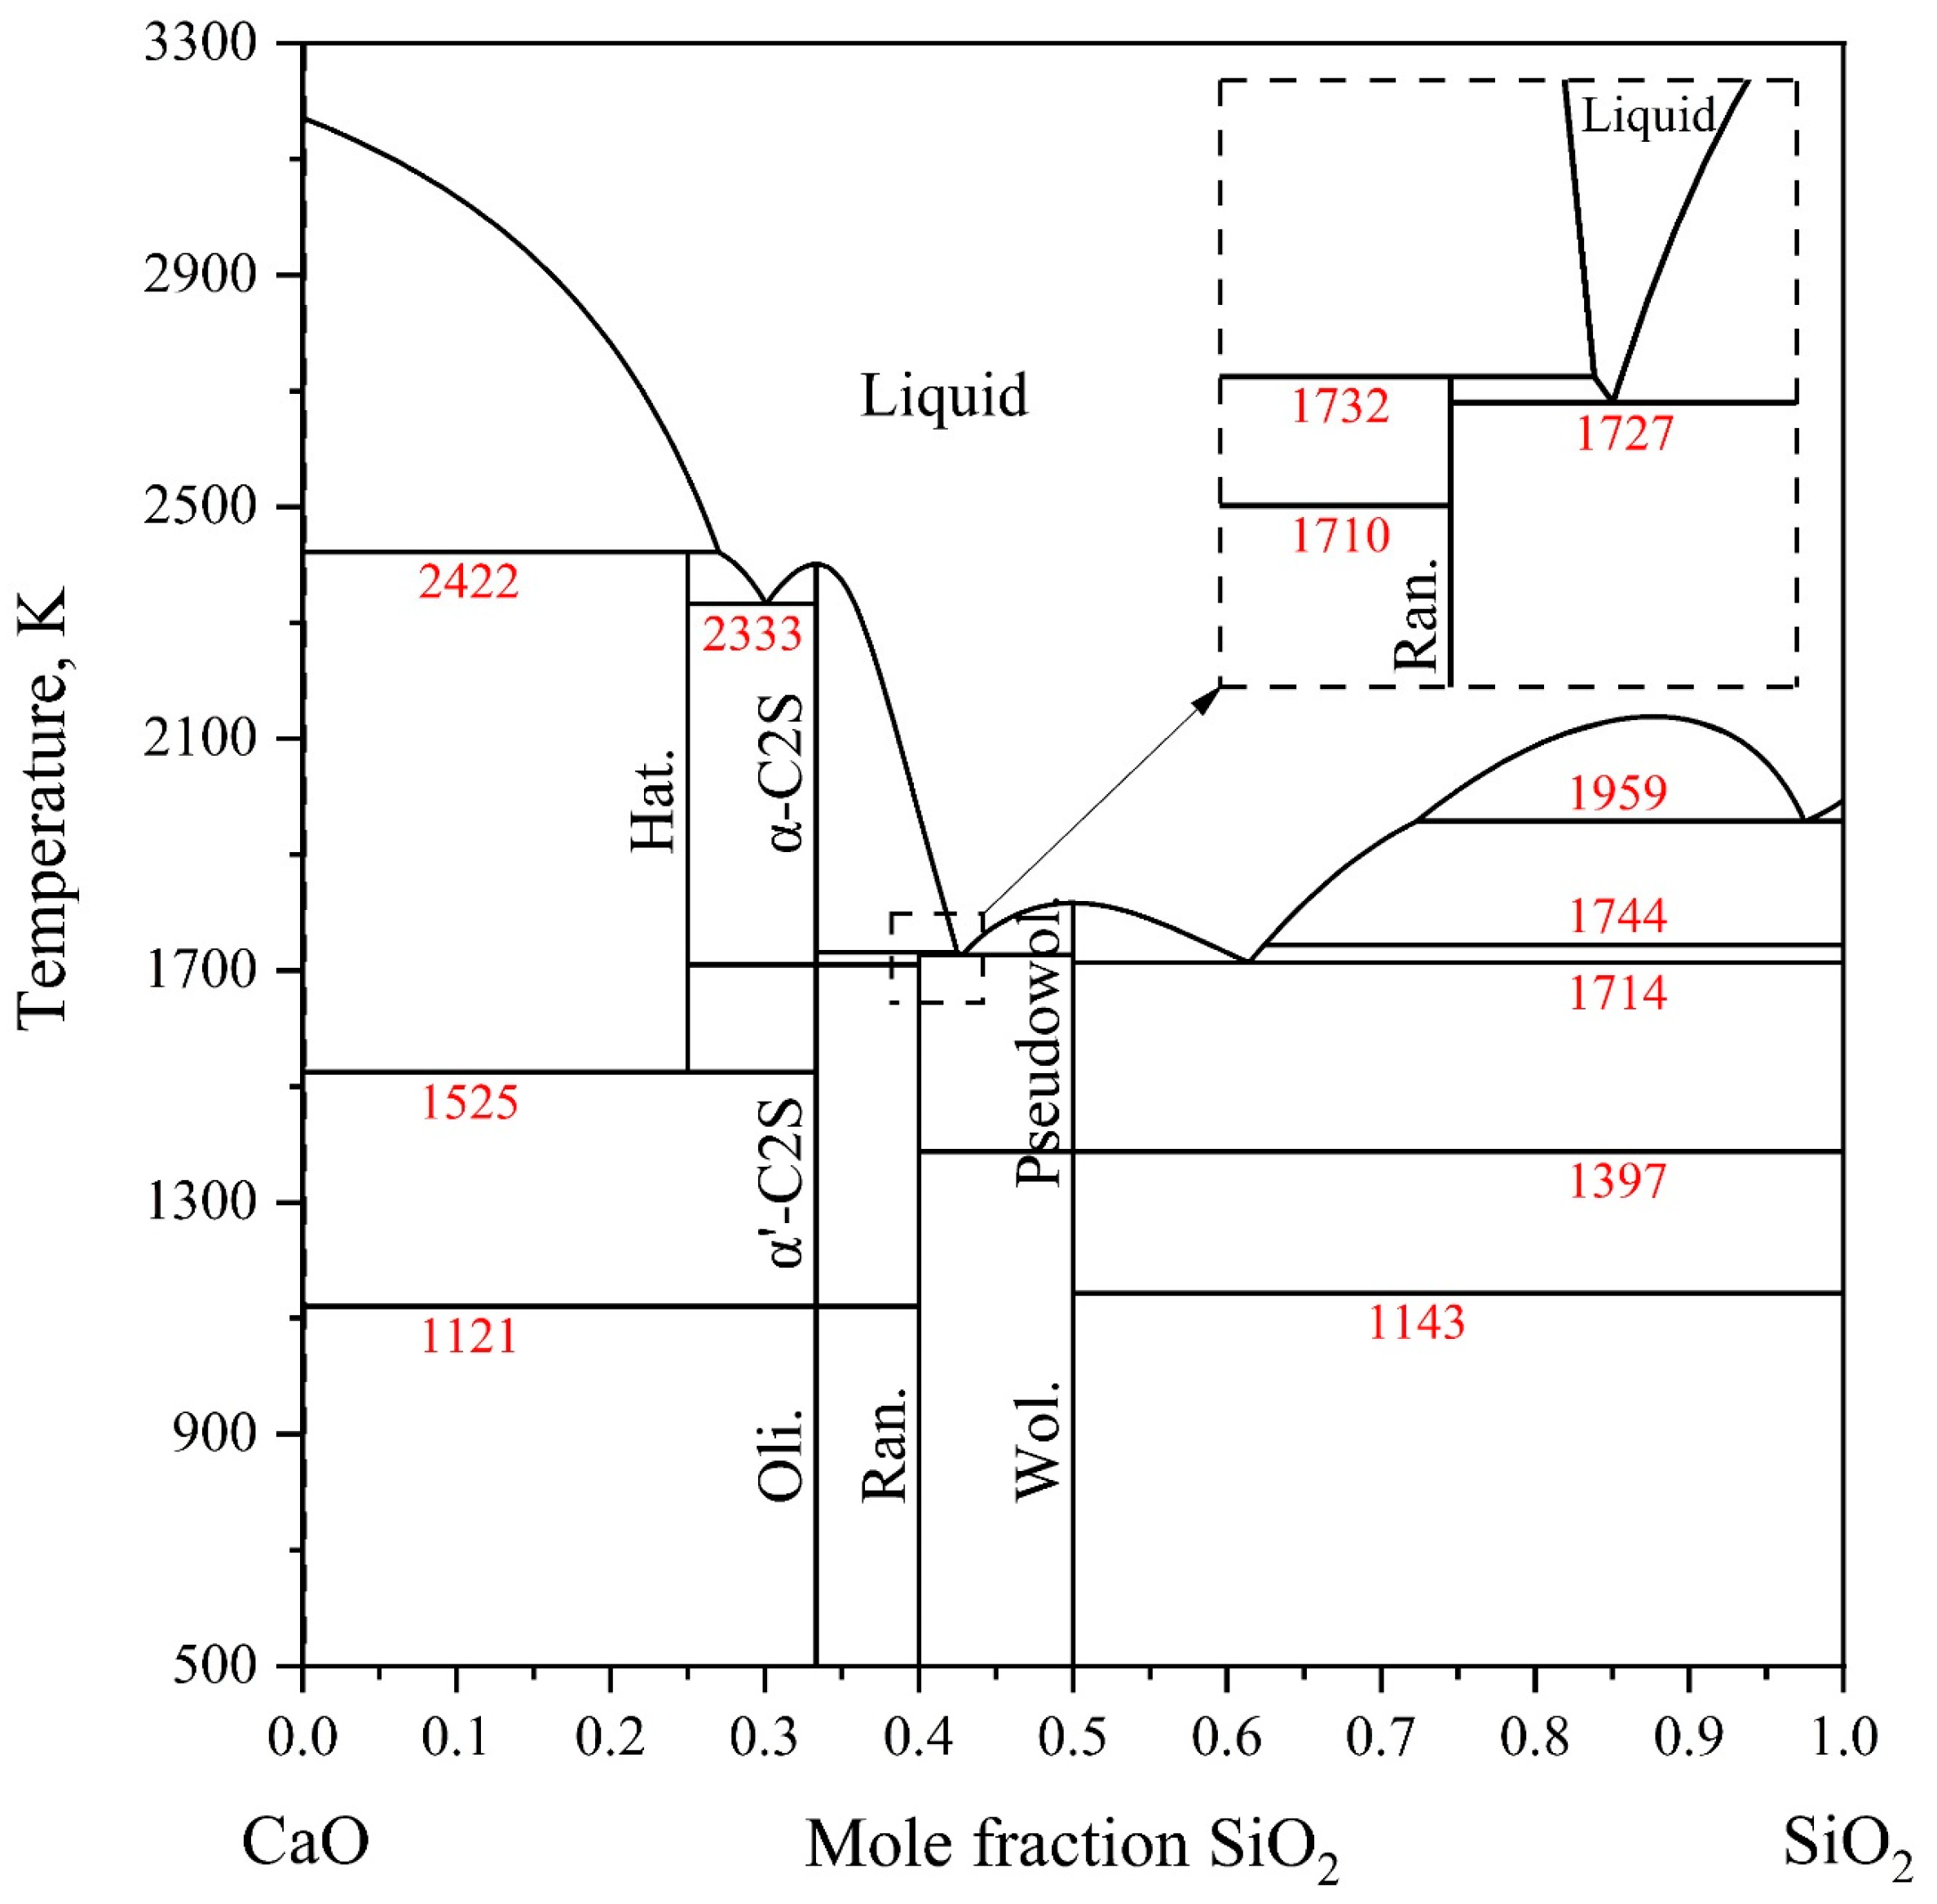
In 1990, Taylor and Dinsdale [42] conducted a thermodynamic optimization of the CaO-SiO2 system through a critical evaluation of available thermodynamic and phase diagram data. They employed an extended Kapoor–Frohberg cellular model to describe the liquid phase. Subsequently, Hillert et al. [43] developed a thermodynamic description using an ionic two-sublattice model for the liquid phase; however, a discrepancy was observed between their calculated liquid miscibility gap and experimental results. To improve the reliability of the thermodynamic parameters, Hillert et al. [44] reassessed the thermodynamic properties of the Ca3Si2O7 phase the following year. In 1994, Eriksson et al. [45] adopted the quasi-chemical model to represent the liquid phase. Shu et al. [46] utilized the Royal Institute of Technology (KTH) model for the liquid phase, though the calculated activity of SiO2 deviated from experimental measurements. In 1995, Huang et al. [47] performed a thermodynamic assessment using an ionic two-sublattice model, (Ca2+)p(O2−,SiO44−,SiO2)q, for the liquid phase. The calculations accurately reproduced experimental phase diagrams and thermodynamic properties. This model is compatible with the thermodynamic approach adopted in the present study. Therefore, the parameters reported by Huang et al. [47] were employed in this work. The calculated binary phase diagram from their assessment is presented in Figure 2.

2.3. SiO2-TiO2 System

In 1933, Bunting [48] experimentally investigated phase equilibria in the SiO2-TiO2 system and reported a eutectic reaction at 8.0 at.% TiO2 and 1813 K. Subsequent studies by Rickers and Hummel [49] and Agamawi and White [50] also determined the eutectic reaction on the SiO2-rich side, though their results showed discrepancies with the data of Bunting [48]. In 1954, DeVries et al. [51] confirmed a eutectic reaction at 8.1 at.% TiO2 and 1823 K. Their work also established the presence of a liquid miscibility gap extending from 15 to 90.8 at.% TiO2 at 2053 K. In 1957, Mctaggart and Andrews [52] experimentally investigated liquid–liquid immiscibility in the system and demonstrated the coexistence of two liquid phases above 2038 K. Phase equilibria at temperatures above 2533 K were later reported by Kirschen et al. [32] and Kirillova et al. [53]. More recently, Ilatovskaia and Fabrichnaya [54] examined phase equilibria through high-temperature furnace reactions, using scanning electron microscopy (SEM) and DTA to construct the phase diagram.
In 1988, Kaufman [31] conducted the first thermodynamic assessment of the SiO2-TiO2 system based on experimental data for the liquid miscibility gap. Subsequently, DeCapitani and Kirschen [55] and Kirschen et al. [32] performed thermodynamic assessments using the Margules solution model for the liquid phase, assuming both temperature-independent and temperature-dependent interaction parameters. Kirillova et al. [53] reported a calculated phase diagram employing a subregular solution model for the liquid phase, grounded in key experimental measurements. In 2014, Boulay et al. [56] carried out a thermodynamic assessment that incorporated recent experimental data and adopted an ionic two-sublattice model, (Ti+4)p(O−2,SiO4−4,SiO2)q, for the liquid phase. However, the formulation of their liquid model deviates from currently accepted conventions. In 2022, Ilatovskaia et al. [54] reoptimized the SiO2-TiO2 system using an ionic two-sublattice model formulated as (Ti+2,Ti+3)P(O−2,SiO4−4,TiO2,SiO2)Q for the liquid phase, combined with critical experimental measurements. The optimized results show excellent agreement with experimental phase diagrams. Therefore, the thermodynamic parameters reported by Ilatovskaia et al. [54] were adopted in the present study. The calculated SiO2-TiO2 binary phase diagram is presented in Figure 3.

2.4. CaO-TiO2-SiO2 System

In 1955, DeVries et al. [57] carried out the first systematic investigation of the phase diagram for the CaO-TiO2-SiO2 system in air. The study employed the equilibration–quenching technique along with characterization methods such as petrographic microscopy and XRD. Based on the experimental results, they constructed the liquidus projection and revealed a broad liquid immiscibility region within the system. In 1976, Panek et al. [58] experimentally determined the phase diagram of the CaTiO3-Ca2SiO4 pseudobinary system, particularly in the vicinity of the eutectic point, using quenching techniques and XRD. In 1998, Kirschen et al. [32,55,59] updated the primary phase fields and the immiscibility region of the CaO-TiO2-SiO2 system based on equilibration experiments conducted at 1873 K, followed by Köhler extrapolation. A significant discrepancy between their results and those of DeVries et al. [57] was identified in the stability field of CaSiO3. Recently, Wan et al. [60] experimentally determined the phase relations within the CaO-TiO2-SiO2 system at 1673 K under an oxygen partial pressure (PO2) of 10−10 atm. The approach combined equilibration–quenching experiments with composition analysis of equilibrium phases using SEM coupled with energy-dispersive X-ray spectroscopy (EDS), leading to the establishment of the 1673 K isothermal section. In further work, Wan et al. [61] investigated the influence of MnO on liquid–perovskite (CaTiO3) phase equilibria in the same system at 1673 K. Using high-temperature equilibration–quenching techniques along with XRD, X-ray photoelectron spectroscopy (XPS), and SEM analysis, they experimentally determined the liquidus surface at that temperature. Since the present study focuses exclusively on the thermodynamic assessment of the CaO-TiO2-SiO2 system at standard atmospheric pressure, the experimental phase diagram data reported by Devries et al. [57] and Wan et al. [61] were primarily adopted during the optimization process.
In 1954, King et al. [62] reported the first measurements of the heat capacity, entropy, and heat content of sphene(CaTiSiO5) using adiabatic calorimetry. Their results indicated that CaTiSiO5 melts at 1670 K, with a molar enthalpy of fusion of 123.80 kJ·mol−1 and a molar entropy of fusion of 75.14 J·mol−1·K−1. Todd and Kelley [63] determined the enthalpy of formation of CaTiSiO5 using hydrofluoric acid solution calorimetry. Zhang et al. [64] measured the heat capacity of CaTiSiO5 between 300 and 900 K via differential scanning calorimetry (DSC), revealing two phase transitions near 500 K and 900 K. Xirouchakis et al. [65] re-determined the enthalpy of formation of sphene at 298 K using a 2PbO·B2O3 solvent at 702 °C. In 1999, Thieblot et al. [66] investigated the heat capacity of CaTiSiO5 using drop calorimetry and reported a melting temperature of 1658 ± 3 K, which is slightly lower than the value given by King et al. [62]. This result is consistent with the melting temperature range of 1648–1656 K measured by Crowe et al. [67] in 1986 using differential thermal analysis (DTA). Tangeman and Xirouchakis [68] employed DSC to determine the heat capacity of sphene from 328 to 938 K, observing a structural transition near 483 K with an associated enthalpy change of 0.196 ± 0.007 kJ·mol−1. Several studies have reported phase transition temperatures for CaTiSiO5. For example, Taylor and Brown [69] experimentally determined a transition temperature of 493 ± 20 K, corresponding to a structural change from the monoclinic space group P21/a to A2/a. In 1996, Meyer et al. [70] studied the thermal behavior of CaTiSiO5 using infrared and Raman spectroscopy along with XRD, identifying two structural transitions at 500 K and 825 K. Additional phase transition temperatures were reported by Chrosch et al. [71] and Bismayer et al. [72]. In the present thermodynamic optimization, only two polymorphs of CaTiSiO5 (α and β) were considered due to the lack of thermodynamic data—such as the transition enthalpy from β to γ—for higher-temperature phases. Should a γ-CaTiSiO5 phase exist, its thermodynamic properties are expected to be very similar to those of β-CaTiSiO5.
In 1994, Pelton and Wu [73] performed a thermodynamic optimization of the CaO-TiO2-SiO2 system using the Modified Quasichemical Model to describe the liquid phase. Subsequently, Decapitani and Kirschen [32,55,59] applied the Köhler extrapolation formalism [74] to represent the miscibility gap in the system, using this method to model the Gibbs free energy of the liquid phase. Danek and Nerad [33] also conducted a thermodynamic assessment of the CaO-TiO2-SiO2 system employing the Le Chatelier-Schröder equation. However, the existing thermodynamic descriptions of the CaO-TiO2-SiO2 ternary system lack a systematic evaluation of all available experimental data, and the calculated results show significant deviations from experimental observations. Therefore, a critical reassessment of the experimental data and a comprehensive re-optimization of the thermodynamic parameters for this ternary system are necessary. In the present work, a thorough thermodynamic optimization of the CaO-TiO2-SiO2 system was carried out based on a critical review of experimental phase equilibria and thermodynamic property data, using the ionic two-sublattice model to describe the liquid phase.

3. Thermodynamic Modeling

Thermodynamic models of all solid phases in the CaO-TiO2-SiO2 system are listed in Table 1.

3.1. Unary Components

The Gibbs energies of CaO, TiO2 and SiO2 are expressed as in the following:
G ( T ) 0 H S E R = a + b T + c T l n T + d T 2 + e T 1 + f T 3 + g T 7 + h T 9
where HSER denotes the standard molar enthalpy of the pure elements (Ca, Ti, Si, and O) in the Standard Element Reference state at 298.15 K and 101,325 Pa, J·mol−1; T represents the absolute temperature in Kelvin (K); a~h are those in the model that require optimization based on experimental data. The thermodynamic parameters for the pure components CaO, TiO2, and SiO2, as utilized by Huang et al. [47] and Ilatovskaia et al. [54] were adopted in the present study.

3.2. Liquid Phase

The liquid phase of the CaO-TiO2-SiO2 system is described by the ionic two-sublattice liquid model with the formula (Ca+2,Ti+2,Ti+3)P(O−2,Va,O,TiO2,SiO2,SiO4−4)Q, P and Q are the number of sites on the cation and anion sublattice, respectively, that vary depending on the composition to keep electroneutrality. The Gibbs energy is represented by the expression in the following:
G m l i q u i d H S E R = + y T i + 2 y O 2 G T i + 2 : O 2 l i q u i d + y T i + 3 y O 2 G T i + 3 : O 2 l i q u i d + y C a + 2 y O 2 G C a + 2 : O 2 l i q u i d + y C a + 2 y S i O 4 4 G C a + 2 : S i O 4 4 l i q u i d + Q y T i + 2 y V a G T i + 2 : V a l i q u i d + y T i + 3 y V a G T i + 3 : V a l i q u i d + y C a + 2 y V a G C a + 2 : V a l i q u i d + y S i O 2 G S i O 2 l i q u i d + y O G O l i q u i d + y T i O 2 G T i O 2 l i q u i d + P R T y T i + 2 ln y T i + 2 + y T i + 3 ln y T i + 3 + y C a + 2 ln y C a + 2 + Q R T y O 2 ln y O 2 + y V a ln y V a + y S i O 2 ln y S i O 2 + y S i O 4 4 ln y S i O 4 4 + y O ln y O + y T i O 2 ln y T i O 2 + G m L i q u i d E
where y represents the site fraction of each species in their own sublattices in the liquid phase; G l i q u i d denotes the Gibbs energy of the endmember; and R is the gas constant (R = 8.314 J·(mol·K)−1). G m L i q u i d E is the excess Gibbs energy, which is defined as follows:
G m L i q u i d E = + y T i + 2 y T i + 3 y O 2 L T i + 2 , T i + 3 : O 2 l i q u i d + y T i + 2 y O 2 y V a L T i + 2 : O 2 , V a l i q u i d + y T i + 3 y O 2 y T i O 2 L T i + 3 : O 2 , T i O 2 l i q u i d + y S i O 2 y O L S i O 2 , O l i q u i d + y C a + 2 y O 2 y O L C a + 2 : O 2 , O l i q u i d + y C a + 2 y O 2 y S i O 2 L C a + 2 : O 2 , S i O 2 l i q u i d + y C a + 2 y S i O 4 4 y S i O 2 L C a + 2 : y S i O 4 4 , S i O 2 l i q u i d + y C a + 2 y O 2 y T i O 2 L C a + 2 : O 2 , T i O 2 l i q u i d + y C a + 2 y O 2 y T i O 2 y S i O 2 L C a + 2 : O 2 , T i O 2 , S i O 2 l i q u i d + y C a + 2 y S i O 4 4 y T i O 2 L C a + 2 : S i O 4 4 , T i O 2 l i q u i d + y C a + 2 y S i O 4 4 y S i O 2 y T i O 2 L C a + 2 : S i O 4 4 , S i O 2 , T i O 2 l i q u i d
where L are the interaction parameters which utilize the Redlich–Kister polynomials in the liquid phase. The first eight interaction parameters are sourced from the works of Ilatovskaia et al. [54], Huang et al. [47], Hampl et al. [75] and Ye et al. [34] The last three parameters are assessed in the present work.

3.3. Binary Intermediate Compounds

Three stoichiometric intermediate compounds: Ca3Ti2O7, Ca4Ti3O10 and CaTiO3 were reported to exist in the CaO-TiO2 system. Ca3Ti2O7 and Ca4Ti3O10 are considered as stoichiometric compounds in the present work. The Gibbs energies for Ca3Ti2O7 and Ca4Ti3O10 can be described as
G m C i T j H S E R = i · G C a O s o l i d 0 + j · G T i O 2 s o l i d 0 + a + b T
where i and j represent the ratios for CaO and TiO2 in each formula. G C a O s o l i d 0 (= G C A O S ) and G T i O 2 s o l i d 0 (= G T I O 2 S ) are the Gibbs energies of pure solid CaO and TiO2, respectively. a and b are derived from the work of Ye et al. [34], which are associated with the formation enthalpies and entropies of Ca3Ti2O7 and Ca4Ti3O10. The thermodynamic description of structural transformation of CaTiO3 by Gong et al. [19] is reasonable and therefore adopted in this work. There are no intermediate compounds in the TiO2-SiO2 system. The Gibbs energy expression for all solid phases in the CaO-SiO2 system is described by
G m ( T ) 0 H S E R = a + b T + c T l n T + d T 2 + e T 1
where a~e are the optimized parameters. The thermodynamic parameters for the CaO-SiO2 system were adopted from those reported by Huang et al. [47].

3.4. Ternary Intermediate Compound

In the CaO-TiO2-SiO2 system, CaTiSiO5 is the only ternary intermediate phase. Based on the experimental findings reported by Tangeman et al. [68], CaTiSiO5 undergoes a structural transition from the monoclinic space group P21/a to A2/a near 500 K. In the present work, the CaTiSiO5 is described as a stoichiometric intermediate compound, incorporating its structural transition. Its Gibbs energy expression is given by
G m C T A H S E R = a + b T + c T l n T + d T 2 + e T 1 + f T 3
where a~f are parameters to be optimized.

4. Results and Discussion

In the present work, the CaO-TiO2-SiO2 system was thermodynamically optimized based on a critical assessment of experimental data from the literature. The optimization was conducted using the PARROT module of the Thermo-Calc software (https://thermocalc.com/), which applies a least-squares method to minimize the discrepancies between calculated and experimental values. Through careful evaluation of the available experimental data, appropriate weights were assigned to each dataset to ensure a reliable optimization.
Robust thermodynamic descriptions of the constituent binary subsystems are essential for the thermodynamic modeling of ternary systems. The optimization process began by incorporating the previously established thermodynamic descriptions for the CaO-TiO2, CaO-SiO2, and TiO2-SiO2 systems reported by Ye et al. [34], Huang et al. [47], and Ilatovskaia et al. [54], respectively. Subsequently, thermodynamic parameters for relevant ternary intermediate compounds and ternary interaction parameters were introduced based on the available experimental data. The thermodynamic parameters for the ternary compound CaTiSiO5 were optimized based on experimental thermodynamic properties, including entropy, enthalpy of formation, heat capacity, and transition enthalpy. The ternary interaction parameters for the liquid phase were refined using experimental liquidus data. Finally, a simultaneous optimization of all parameters was carried out, resulting in a self-consistent set of thermodynamic parameters that accurately represent the CaO-TiO2-SiO2 system. The optimized thermodynamic parameters obtained in this study are summarized in Table 2.
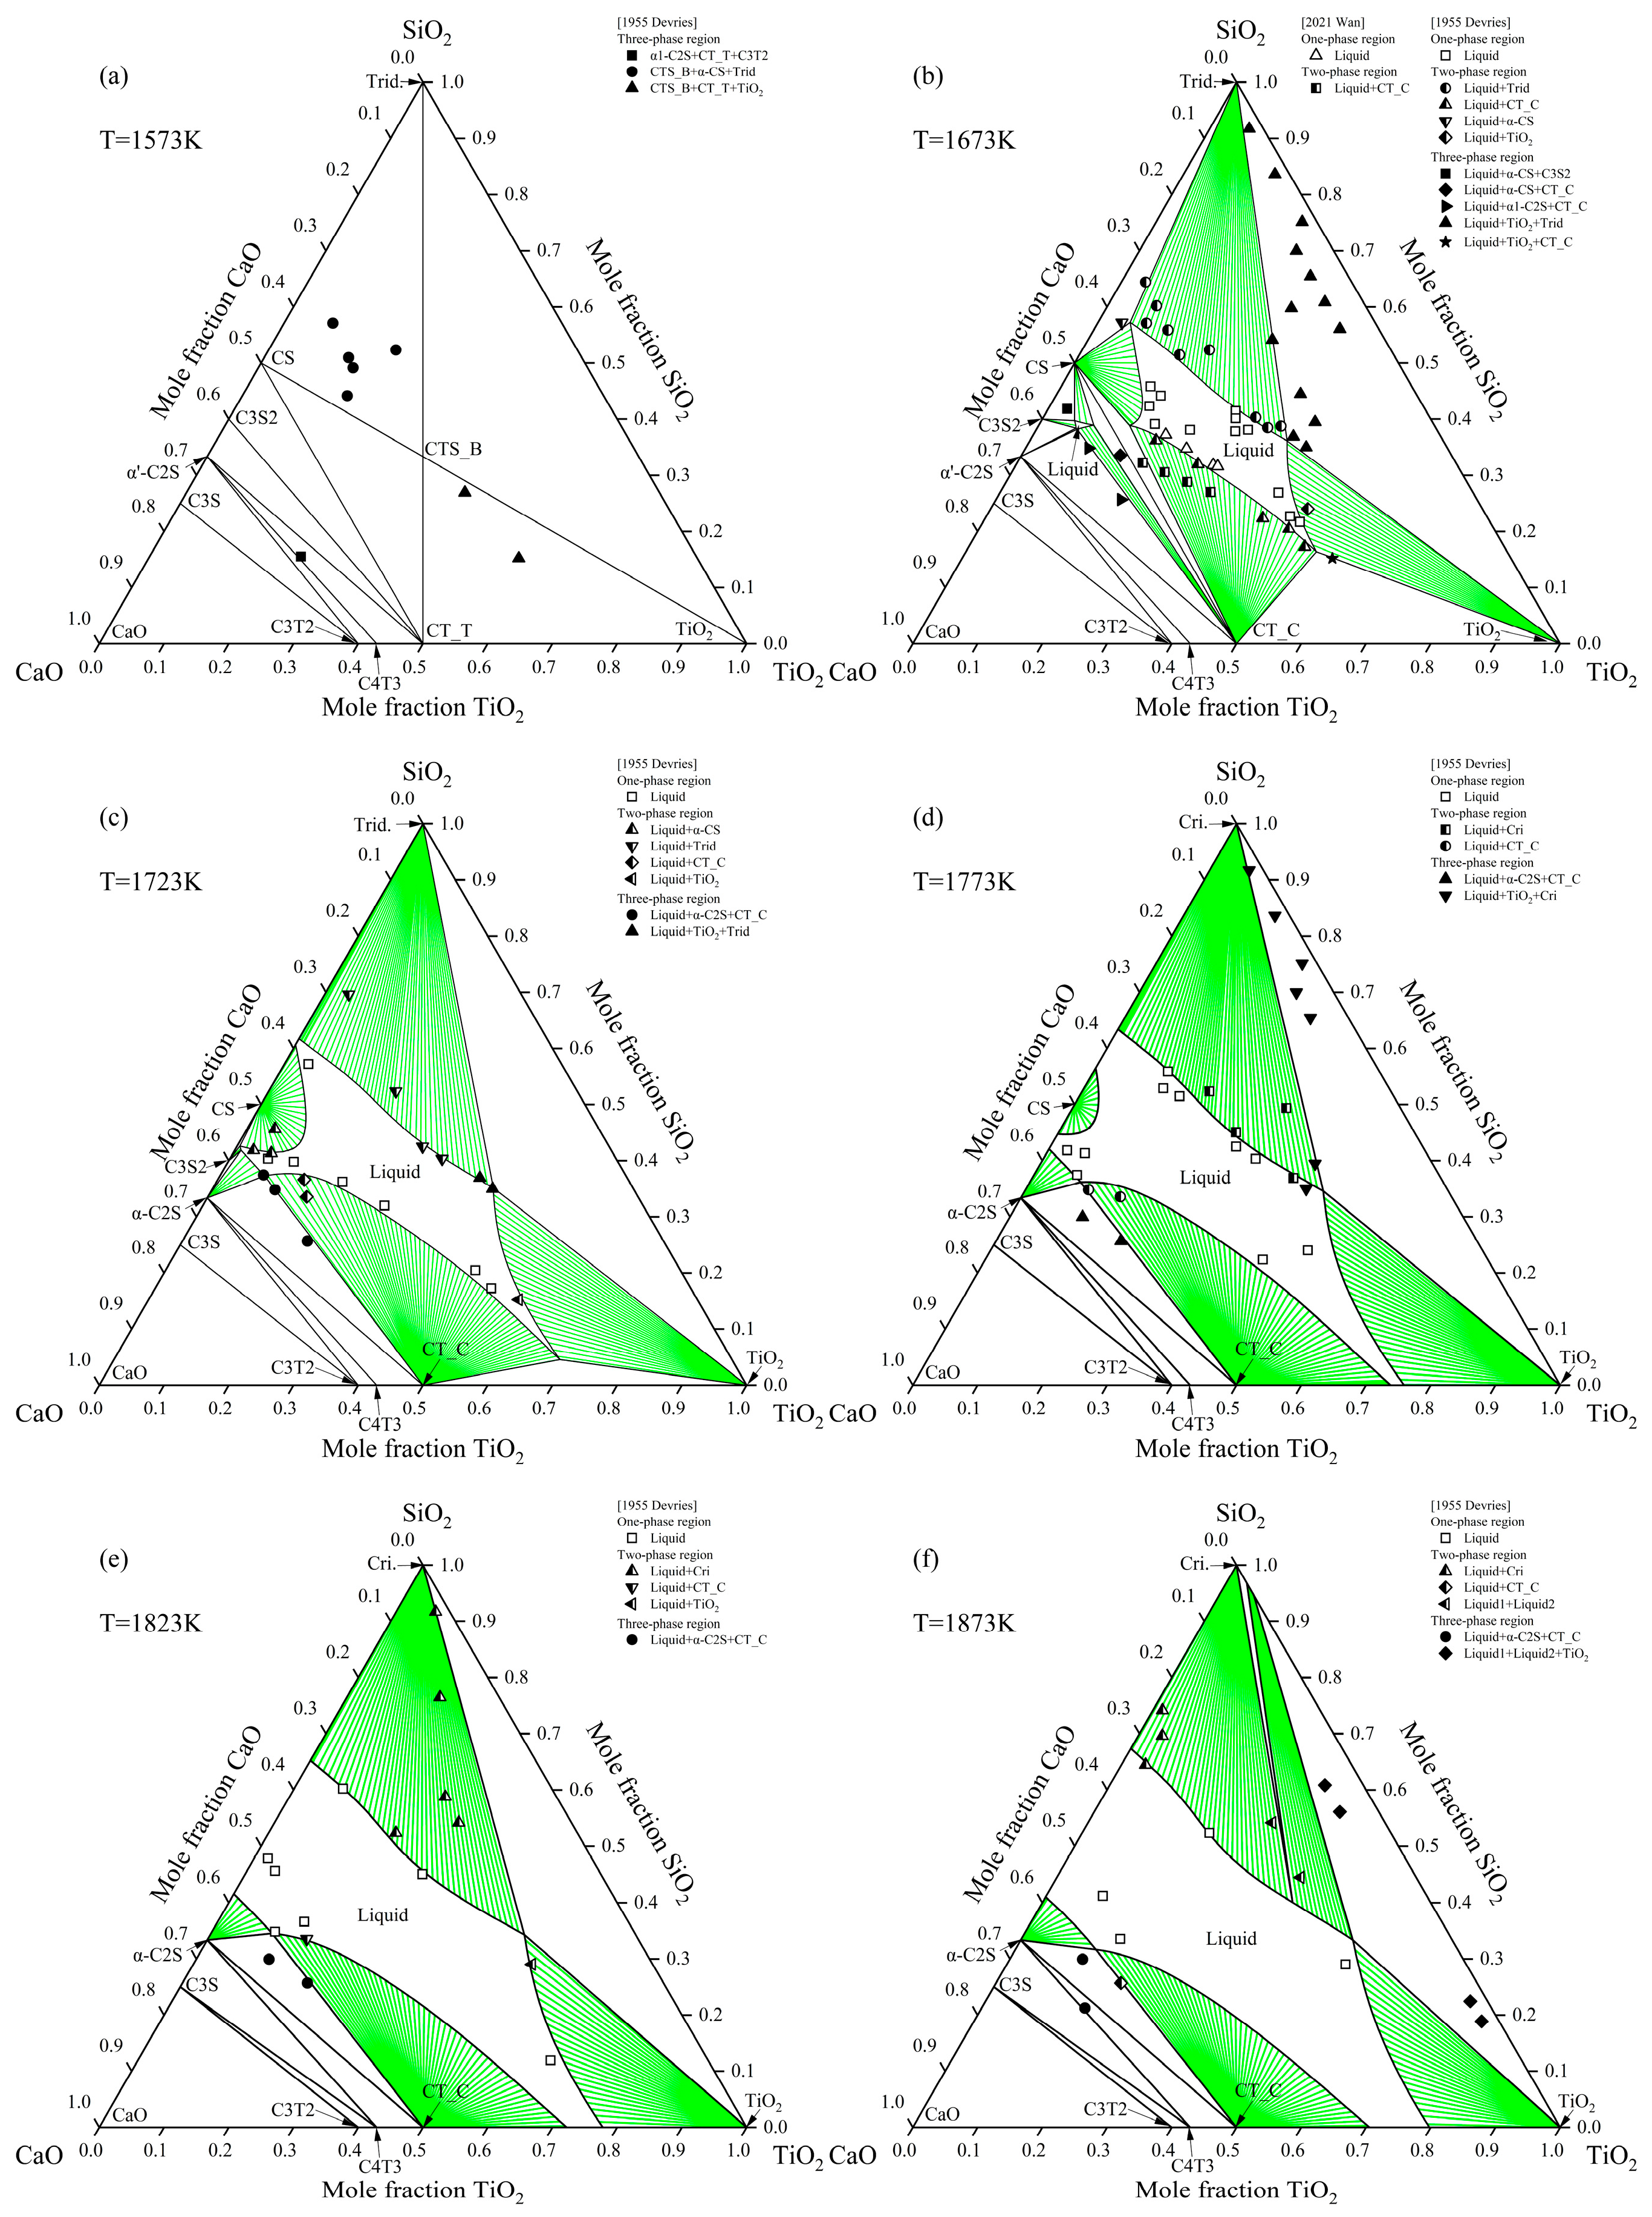
Figure 4 presents the isothermal sections of the CaO-TiO2-SiO2 system at 1573 K, 1673 K, 1723 K, 1773 K, 1823 K, and 1873 K, along with comparisons to available experimental data reported in the literature [57,61]. The phase relations observed in all six sections are consistent with the experimental results reported by Devries et al. [57,61]. A primary difference between the present assessment and the study by Devries et al. [57] concerns the Ca4Ti3O10 phase, which was not detected in their work. However, subsequent experimental studies [15,19] have conclusively identified this compound. Consequently, based on a comprehensive evaluation of all available experimental data, Ca4Ti3O10 is accepted as a stable phase in the present thermodynamic optimization of the CaO-TiO2 system. It is noteworthy that while the phase assemblage interpretation differs, the high-temperature liquidus data reported by Devries et al. [57] are of high quality and are consistent with other literature sources [61]. Therefore, the present thermodynamic optimization was constrained to reproduce these reliable liquidus data, and as shown in Figure 4, the calculated liquidus exhibit excellent agreement with the experiments from [59,63].
Table 3 presents a comparison between the calculated enthalpy of formation, entropy of formation, and enthalpy of transition for CaTiSiO5 and available experimental data. In the CaO-TiO2-SiO2 system, the ternary intermediate phase CaTiSiO5 is the only one identified. It can be seen from the table that the calculated enthalpy and entropy of formation of CaTiSiO5 agree well with the experimental values. The structural transition in CaTiSiO5 was considered based on the experimental results reported by Tangeman et al. [68]. The calculated transition enthalpy of 199 J·mol−1 and transition temperature of 486 K show good agreement with the experimental data (transition enthalpy: 196 ± 7 J·mol−1; transition temperature: 483 ± 7 K) reported by Tangeman et al. [68]. The melting point of CaTiSiO5 obtained in this work is 1669 K. Compared to the experimental melting points (1670 K [62], 1658 ± 3 K [66], and 1648–1656 K [67]) reported in the literature for the CaTiSiO5 phase, the calculated value is acceptable considering the associated experimental uncertainties.
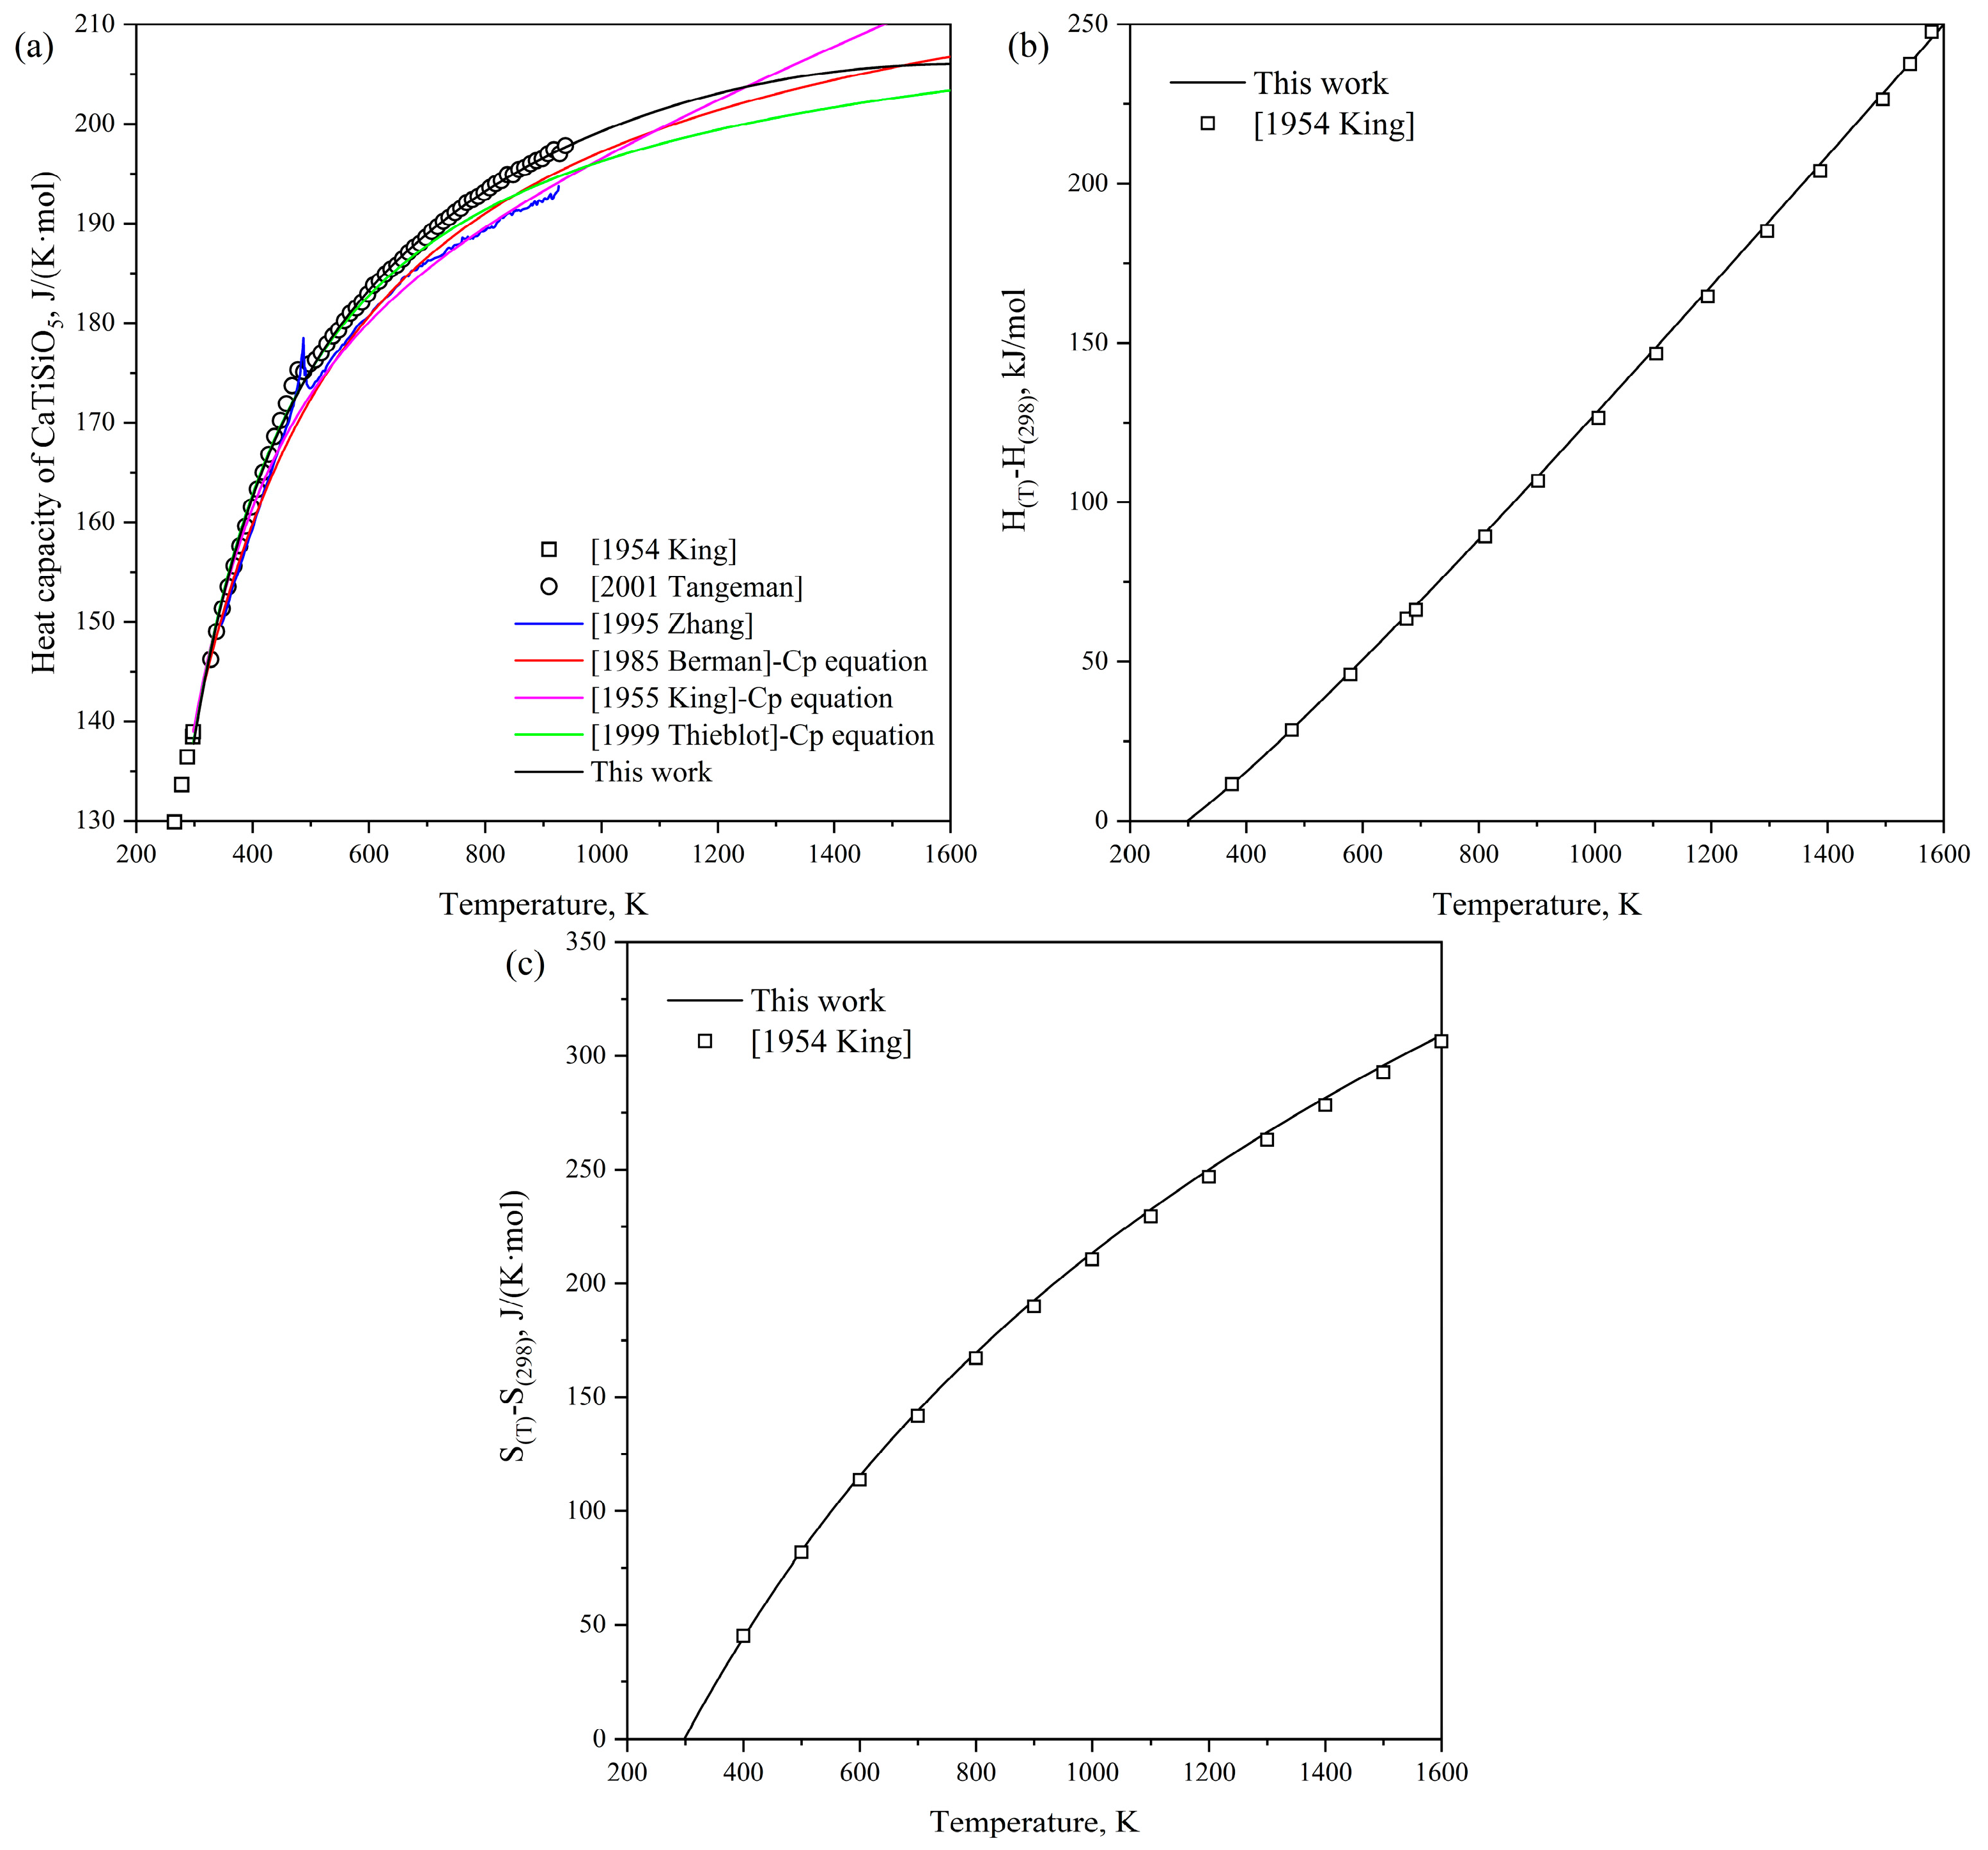
Figure 5 displays the calculated heat capacity, heat content, and S(T)-S(298) of the ternary phase CaTiSiO5, respectively, alongside experimental data from the literature [62,68]. The results calculated are found to be in good agreement with the measurements reported by King et al. [62] and Tangeman et al. [68]. Furthermore, the calculated heat capacity in this work yields a better description of the experimental data compared to previous works [62,64,66,76].

5. Conclusions

In this work, appropriate interaction parameters were introduced to comprehensively optimize the liquid phase and ternary compound of the system based on the existing experimental data by means of the CALPHAD approach. A set of self-consistent thermodynamic parameters was obtained, satisfactorily reproducing the experimental data of the CaO-TiO2-SiO2 ternary system. The obtained thermodynamic description is of great significance for the design of high-performance ceramic materials.

Author Contributions

Conceptualization, L.Y. and L.Z.; data curation, L.Y.; formal analysis, L.Y. and Z.W.; funding acquisition, L.Z. and L.L.; investigation, L.Y. and W.Z.; methodology, J.W. and L.Y.; Project administration, L.Z.; resources, L.Y. and C.L.; software, C.L.; supervision, L.Z. and L.L.; validation, Z.W.; visualization, L.L.; writing—original draft, L.Y.; writing—review & editing, J.W. and W.Z. All authors have read and agreed to the published version of the manuscript.

Funding

This research was funded by the National Key Research and Development Program of China (No. 2022YFC3900902).

Institutional Review Board Statement

Not applicable.

Informed Consent Statement

Not applicable.

Data Availability Statement

The original contributions presented in the study are included in the article; further inquiries can be directed to the corresponding authors.

Acknowledgments

The authors would like to express their sincere gratitude to colleagues and reviewers whose insightful comments greatly enhanced the manuscript.

Conflicts of Interest

The authors declare no conflicts of interest.

References

  1. Tulyaganov, D.U.; Dimitriadis, K.; Agathopoulos, S.; Fernandes, H.R. Glasses and glass-ceramics in the CaO–MgO–SiO2 system: Diopside containing compositions—A brief review. J. Non-Cryst. Solids 2023, 612, 122351. [Google Scholar] [CrossRef]
  2. Jia, A.Q.; Zhang, W.J.; Cheng, X.Y.; Liu, Z.F. Effects of B2O3 contents on crystallization behaviors and dielectric properties of CaO-B2O3-SiO2 glass ceramics. Key Eng. Mater. 2016, 680, 301–305. [Google Scholar] [CrossRef]
  3. Mukherjee, D.P.; Das, S.K. The influence of TiO2 content on the properties of glass ceramics: Crystallization, microstructure and hardness. Ceram. Int. 2014, 40, 4127–4134. [Google Scholar] [CrossRef]
  4. Son, S.; Kim, K. Effect of TiO2 content on crystallization behavior of CaO–Al2O3–SiO2–ZnO glass-ceramic glaze. Ceram. Int. 2023, 49, 13677–13686. [Google Scholar] [CrossRef]
  5. Lim, Y.; Kim, K.; Han, K.-S. Effect of SiO2/TiO2 ratio on the crystallization behavior of CaO-TiO2-SiO2 glass-ceramic system for opaque white glaze. J. Non-Cryst. Solids 2024, 629, 122863. [Google Scholar] [CrossRef]
  6. Sun, S.; Ding, H.; Ao, W.; Liu, Y.; Chang, L.; Zhang, J. Preparation of a CaCO3-TiO2 composite based opaque glaze: Insight into the mechanism of opacification and glaze yellowing inhibition. J. Eur. Ceram. Soc. 2020, 40, 6171–6180. [Google Scholar] [CrossRef]
  7. Yang, J.; Yan, L.; Ye, L.; Xiao, G.; Wang, K.; Liu, Y.; Zhang, L.; Liu, L.; Du, Y. Thermodynamic evaluation and optimization of the K2O-Al2O3-SiO2 system. J. Am. Ceram. Soc. 2024, 107, 8732–8745. [Google Scholar] [CrossRef]
  8. Ye, L.; Li, C.; Yang, J.; Xiao, G.; Deng, Z.; Liu, L.; Zhang, L.; Jiang, Y. Thermodynamic Assessment of the P2O5-Na2O and P2O5-MgO Systems. Materials 2024, 17, 2221. [Google Scholar] [CrossRef] [PubMed]
  9. Kattner, U.R. The CALPHAD method and its role in material and process development. Tecnol. Metal. Mater. Min. 2016, 13, 3. [Google Scholar] [CrossRef] [PubMed]
  10. Umezu, S. Investigation on the iron blast furnace slag containing titanium. J. Min. Metall. Inst. Jpn. 1930, 46, 867. [Google Scholar]
  11. Fukusima, M. The systems SiO2-CaO-TiO2, CaO·SiO2-CaO·SiO2·TiO2, CaO·SiO2·TiO2-TiO2, CaO·SiO2-CaO·TiO2, and CaO·TiO2-TiO2. Kinsoku No Kenkyu Tokyo 1934, 11, 377–395. [Google Scholar]
  12. Von Wartenberg, H.; Reusch, H. Melting point diagrams of highly fireproof oxides. VII. systems with CaO and BeO. Z. Fuer Anorg. Chem. 1937, 230, 257–276. [Google Scholar]
  13. Devries, R.; Roy, R.; Osborn, E. Phase Equilibria in the System CaO-TiO2. J. Phys. Chem. 1954, 58, 1069–1073. [Google Scholar] [CrossRef]
  14. Coughanour, L.; Roth, R.; Deprosse, V. Phase equilibrium relations in the systems Lime-Titania. J. Res. Natl. Bur. Stand. 1954, 52, 37–42. [Google Scholar] [CrossRef]
  15. Roth, R.S. Revision of the phase equilibrium diagram of the binary system calcia-titania, showing the compound Ca4Ti3O10. J. Res. Natl. Bur. Stand. 1958, 61, 437–440. [Google Scholar] [CrossRef]
  16. Jongejan, A.; Wilkins, A. A re-examination of the system CaO-TiO2 at liquidus temperatures. J. Less Common Met. 1970, 20, 273–279. [Google Scholar] [CrossRef]
  17. Kimura, S.; Muan, A. Phase relations in the system CaO-iron oxide-TiO2 in air. Am. Mineral. J. Earth Planet. Mater. 1971, 56, 1332–1346. [Google Scholar]
  18. Tulgar, H. Solid state relationships in the system calcium oxide-titanium dioxide. Istanbul Tech. Univ. Bul. 1976, 29, 111–129. [Google Scholar]
  19. Gong, W.; Wu, L.; Navrotsky, A. Combined experimental and computational investigation of thermodynamics and phase equilibria in the CaO-TiO2 system. J. Am. Ceram. Soc. 2018, 101, 1361–1370. [Google Scholar] [CrossRef]
  20. Naylor, B.; Cook, O. High-temperature heat contents of the metatitanates of calcium, iron and Magnesium. J. Am. Chem. Soc. 1946, 68, 1003–1005. [Google Scholar] [CrossRef]
  21. King, E. Low-Temperature Heat Capacities and Entropies at 298.16K. of Some Titanates of Aluminum, Calcium, Lithium and Zinc. J. Am. Chem. Soc. 1955, 77, 2150–2152. [Google Scholar] [CrossRef]
  22. Taylor, R.; Schmalzried, H. The free energy of formation of some titanates, silicates, and magnesium aluminate from measurements made with galvanic cells involving solid electrolytes. J. Phys. Chem. 1964, 68, 2444–2449. [Google Scholar] [CrossRef]
  23. Takayama-Muromachi, E.; Navrotsky, A. Energetics of compounds (A2+B4+O3) with the perovskite structure. J. Solid State Chem. 1988, 72, 244–256. [Google Scholar] [CrossRef]
  24. Guyot, F.; Richet, P.; Courtial, P.; Gillet, P. High-temperature heat capacity and phase transitions of CaTiO3 perovskite. Phys. Chem. Miner. 1993, 20, 141–146. [Google Scholar] [CrossRef]
  25. Woodfield, B.F.; Shapiro, J.L.; Stevens, R.; Boerio-Goates, J.; Putnam, R.L.; Helean, K.B.; Navrotsky, A. Molar heat capacity and thermodynamic functions for CaTiO3. J. Chem. Thermodyn. 1999, 31, 1573–1583. [Google Scholar] [CrossRef]
  26. Putnam, R.L.; Navrotsky, A.; Woodfield, B.F.; Boerio-Goates, J.; Shapiro, J.L. Thermodynamics of formation for zirconolite (CaZrTi2O7) from T = 298.15K to T = 1500K. J. Chem. Thermodyn. 1999, 31, 229–243. [Google Scholar] [CrossRef]
  27. Ali, R.; Yashima, M. Space group and crystal structure of the perovskite CaTiO3 from 296 to 1720K. J. Solid State Chem. 2005, 178, 2867–2872. [Google Scholar]
  28. Yashima, M.; Ali, R. Structural phase transition and octahedral tilting in the calcium titanate perovskite CaTiO3. Solid State Ion. 2009, 180, 120–126. [Google Scholar] [CrossRef]
  29. Jacob, K.; Abraham, K. Thermodynamic properties of calcium titanates: CaTiO3, Ca4Ti3O10, and Ca3Ti2O7. J. Chem. Thermodyn. 2009, 41, 816–820. [Google Scholar] [CrossRef]
  30. Navi, N.U.; Shneck, R.Z.; Shvareva, T.Y.; Kimmel, G.; Zabicky, J.; Mintz, M.H.; Navrotsky, A. Thermochemistry of (CaxSr1-x)TiO3, (BaxSr1-x)TiO3, and (BaxCa1-x)TiO3 perovskite solid solutions. J. Am. Ceram. Soc. 2012, 95, 1717–1726. [Google Scholar]
  31. Kaufman, L. Calculation of multicomponent ceramic phase diagrams. Physica B+C 1988, 150, 99–114. [Google Scholar] [CrossRef]
  32. Kirschen, M.; Decapitani, C. Experimental determination and computation of the liquid miscibility gap in the system CaO-MgO-SiO2-TiO2. J. Phase Equilib. 1999, 20, 593–611. [Google Scholar] [CrossRef]
  33. Daněk, V.; Nerád, I. Phase Diagram and Structure of Melts of the System CaO-TiO2-SiO2. Chem. Pap. 2002, 56, 241–246. [Google Scholar]
  34. Ye, L.; Li, C.; Yang, J.; Xiao, G.; Zhang, L.; Jiang, Y.; Liu, L.; Masset, P.J. Critical evaluation and thermodynamic assessment of the Al2O3–TiO2–CaO ternary system. Ceram. Int. 2024, 50, 41349–41363. [Google Scholar] [CrossRef]
  35. Rankin, G. The Ternary System CaO-Al2O3-SiO2. Am. J. Sci. 1915, 39, 1–79. [Google Scholar] [CrossRef]
  36. Greig, J. Immiscibility in silicate melts; Part I. Am. J. Sci. 1927, 5, 1–44. [Google Scholar] [CrossRef]
  37. Osborn, E.F. The compound merwinite (3CaO·MgO·2SiO2) and its stability relations within the system CaO-MgO-SiO2 (preliminary report). J. Am. Ceram. Soc. 1943, 26, 321–332. [Google Scholar] [CrossRef]
  38. Troemel, G.; Fix, W.; Heinke, R. Hochtemperaturuntersuchungen bis 1900 °C an Calciumorthosilikat und Tricalciumsilikat. Tonind.-Ztg. Ker. Rundsch. 1969, 93, 1–8. [Google Scholar]
  39. Tewhey, J.D.; Pc, H. The two phase region in the CaO-SiO2 system: Experimental data and thermodynamic analysis. Phys. Chem. Glas. 1979, 20, 41–53. [Google Scholar]
  40. Kay, D.; Taylor, J. Activities of silica in the lime+alumina+silica system. Trans. Faraday Soc. 1960, 56, 1372–1386. [Google Scholar] [CrossRef]
  41. Sharma, R.; Richardson, F. Solubility of calcium sulphide and activities in lime-silica melts. J. Iron Steel Inst. 1962, 200, 373. [Google Scholar]
  42. Taylor, J.; Dinsdale, A. Thermodynamic and phase diagram data for the CaO-SiO2 system. Calphad 1990, 14, 71–88. [Google Scholar] [CrossRef]
  43. Hillert, M.; Sundman, B.; Wang, X. An assessment of the CaO-SiO2 system. Metall. Trans. B 1990, 21, 303–312. [Google Scholar]
  44. Hillert, M.; Sundman, B.; Wang, X.; Barry, T. A reevaluation op the rankinite phase in the CaO-SiO2 system. Calphad 1991, 15, 53–58. [Google Scholar] [CrossRef]
  45. Eriksson, G.; Wu, P.; Blander, M.; Pelton, A.D. Critical evaluation and optimization of the thermodynamic properties and phase diagrams of the MnO-SiO2 and CaO-SiO2 systems. Can. Metall. Q. 1994, 33, 13–21. [Google Scholar] [CrossRef]
  46. Shu, Q.; Chou, K.C. Thermodynamic Modeling of CaO-CaF2 and CaO-SiO2 Systems. High Temp. Mater. Process. 2015, 34, 95–100. [Google Scholar]
  47. Huang, W.; Hillert, M.; Wang, X. Thermodynamic assessment of the CaO-MgO-SiO2 system. Metall. Mater. Trans. A 1995, 26, 2293–2310. [Google Scholar] [CrossRef]
  48. Bunting, E.N. Phase equilibria in the systems TiO2, TiO2-SiO2 and TiO2-Al2O3. Bur. Stand. J. Res. 1933, 11, 719. [Google Scholar] [CrossRef]
  49. Ricker, R.W.; Hummel, F. Reactions in the System TiO2-SiO2; revision of the phase diagram. J. Am. Ceram. Soc. 1951, 34, 271–279. [Google Scholar]
  50. Agamawi, Y.; White, J. The System Al2O3-TiO2-SiO2. Br. Ceram. Trans. 1952, 51, 293–325. [Google Scholar]
  51. Devries, R.; Roy, R.; Osborn, E. The System TiO2-SiO2. Br. Ceram. Trans. 1954, 53, 525–540. [Google Scholar]
  52. Don Mctaggart, G.; Andrews, A. Immiscibility area in the system TiO2-ZrO2-SiO2. J. Am. Ceram. Soc. 1957, 40, 167–170. [Google Scholar] [CrossRef]
  53. Kirillova, S.; Almjashev, V.; Gusarov, V. Phase relationships in the SiO2-TiO2 system. Russ. J. Inorg. Chem. 2011, 56, 1464–1471. [Google Scholar]
  54. Ilatovskaia, M.; Fabrichnaya, O. Liquid Immiscibility and Thermodynamic Assessment of the Al2O3-TiO2-SiO2 System. J. Phase Equilib. Diffus. 2022, 43, 15–31. [Google Scholar]
  55. Decapitani, C.; Kirschen, M. A generalized multicomponent excess function with application to immiscible liquids in the system CaO-SiO2-TiO2. Geochim. Cosmochim. Acta 1998, 62, 3753–3763. [Google Scholar]
  56. Boulay, E.; Nakano, J.; Turner, S.; Idrissi, H.; Schryvers, D.; Godet, S. Critical assessments and thermodynamic modeling of BaO-SiO2 and SiO2-TiO2 systems and their extensions into liquid immiscibility in the BaO-SiO2-TiO2 system. Calphad 2014, 47, 68–82. [Google Scholar]
  57. Devries, R.; Roy, R.; Osborn, E. Phase equilibria in the system CaO-TiO2-SiO2. J. Am. Ceram. Soc. 1955, 38, 158–171. [Google Scholar]
  58. PÁnek, Z.; KanclÍř, E.; Staroň, J.; Kozlovský, M.; Palčo, Š. The effect of TiO2 on phase transformations of periclase-spinellitic systems in the presence of silicates. Ceram.-Silik. 1976, 20, 13–22. [Google Scholar]
  59. Kirschen, M.; De Capitani, C. Immiscible silicate liquids in the CaO-SiO2-TiO2-Al2O3 system. Schweiz. Mineral. Petrogr. Mitt. 1998, 78, 175–178. [Google Scholar]
  60. Wan, X.; Shi, J.; Klemettinen, L.; Chen, M.; Taskinen, P.; Jokilaakso, A. Equilibrium phase relations of CaO-SiO2-TiO2 system at 1400 °C and oxygen partial pressure of 10−10 atm. J. Alloys Compd. 2020, 847, 156472. [Google Scholar]
  61. Wan, X.; Chen, M.; Qiu, Y.; Shi, J.; Li, J.; Liu, C.; Taskinen, P.; Jokilaakso, A. Influence of manganese oxide on the liquid-perovskite equilibrium in the CaO-SiO2-TiO2 system at 1400 °C in air. Ceram. Int. 2021, 47, 11176–11182. [Google Scholar] [CrossRef]
  62. King, E.; Orr, R.; Bonnickson, K. Low temperature heat capacity, entropy at 298.16K., and high temperature heat content of sphene (CaTiSiO5). J. Am. Chem. Soc. 1954, 76, 4320–4321. [Google Scholar] [CrossRef]
  63. Todd, S.; Kelley, K. Heat and Free-Energy Data for Tricalcium Dititanate, Sphene, Lithium Metatitanate, and Zinc-Titanium Spinel; US Department of Energy, Bureau of Mines: Washington, DC, USA, 1956.
  64. Zhang, M.; Salje, E.; Bismayer, U.; Unruh, H.-G.; Wruck, B.; Schmidt, C. Phase transition(s) in titanite CaTiSiO5: An infrared spectroscopic, dielectric response and heat capacity study. Phys. Chem. Miner. 1995, 22, 41–49. [Google Scholar] [CrossRef]
  65. Xirouchakis, D.; Fritsch, S.; Putnam, R.L.; Navrotsky, A.; Lindsley, D.H. Thermochemistry and the enthalpy of formation of synthetic end-member (CaTiSiO5) titanite. Am. Mineral. 1997, 82, 754–759. [Google Scholar] [CrossRef]
  66. Thiéblot, L.; Tequi, C.; Richet, P. High-temperature heat capacity of grossular (Ca3Al2Si3O12), enstatite (MgSiO3), and titanite (CaTiSiO5). Am. Mineral. 1999, 84, 848–855. [Google Scholar] [CrossRef]
  67. Crowe, M.; Greedan, J.; Garrett, J.; Burke, N.; Vance, E.; George, I. Melt-grown sphene (CaTiSiO5) crystals. J. Mater. Sci. Lett. 1986, 5, 979–980. [Google Scholar] [CrossRef]
  68. Tangeman, J.; Xirouchakis, D. High-temperature heat capacity and thermodynamic properties for end-member titanite (CaTiSiO5). Phys. Chem. Miner. 2001, 28, 167–176. [Google Scholar] [CrossRef]
  69. Taylor, M.; Brown, G. High-temperature structural study of the P21/a↔A2/a phase transition in synthetic titanite, CaTiSiO5. Am. Mineral. 1976, 61, 435–447. [Google Scholar]
  70. Meyer, H.; Zhang, M.; Bismayer, U.; Salje, E.; Schmidt, C.; Kek, S.; Morgenroth, W.; Bleser, T. Phase transformation of natural titanite: An infrared, Raman spectroscopic, optical birefringence and X-ray diffraction study. Phase Transit. A Multinatl. J. 1996, 59, 39–60. [Google Scholar] [CrossRef]
  71. Chrosch, J.; Bismayer, U.; Salje, E.K. Anti-phase boundaries and phase transitions in titanite: An X-ray diffraction study. Am. Mineral. 1997, 82, 677–681. [Google Scholar] [CrossRef]
  72. Bismayer, U.; Zhang, M.; Groat, L.; Salje, E.; Meyer, H.-W. The β-γ phase transition in titanite and the isosymmetric analogue in malayaite. Phase Transit. 1999, 68, 545–556. [Google Scholar]
  73. Pelton, A.; Wu, P. Thermodynamically Optimised Phase Diagrams of Oxide Systems; Technical Report for Phase Diagrams far Ceramists; American Ceramic Society: Westerville, OH, USA, 1994. [Google Scholar]
  74. Kohler, F. Estimation of the thermodynamic data for a ternary system from the corresponding binary systems. Monatshefte Fuer Chem. 1960, 91, 738–740. [Google Scholar]
  75. Hampl, M.; Schmid-Fetzer, R. Thermodynamic description of the Ti-O system. Int. J. Mater. Res. 2015, 106, 439–453. [Google Scholar] [CrossRef]
  76. Berman, R.G.; Brown, T.H. Heat capacity of minerals in the system Na2O-K2O-CaO-MgO-FeO-Fe2O3-Al2O3-SiO2-TiO2-H2O-CO2: Representation, estimation, and high temperature extrapolation. Contrib. Mineral. Petrol. 1985, 89, 168–183. [Google Scholar]
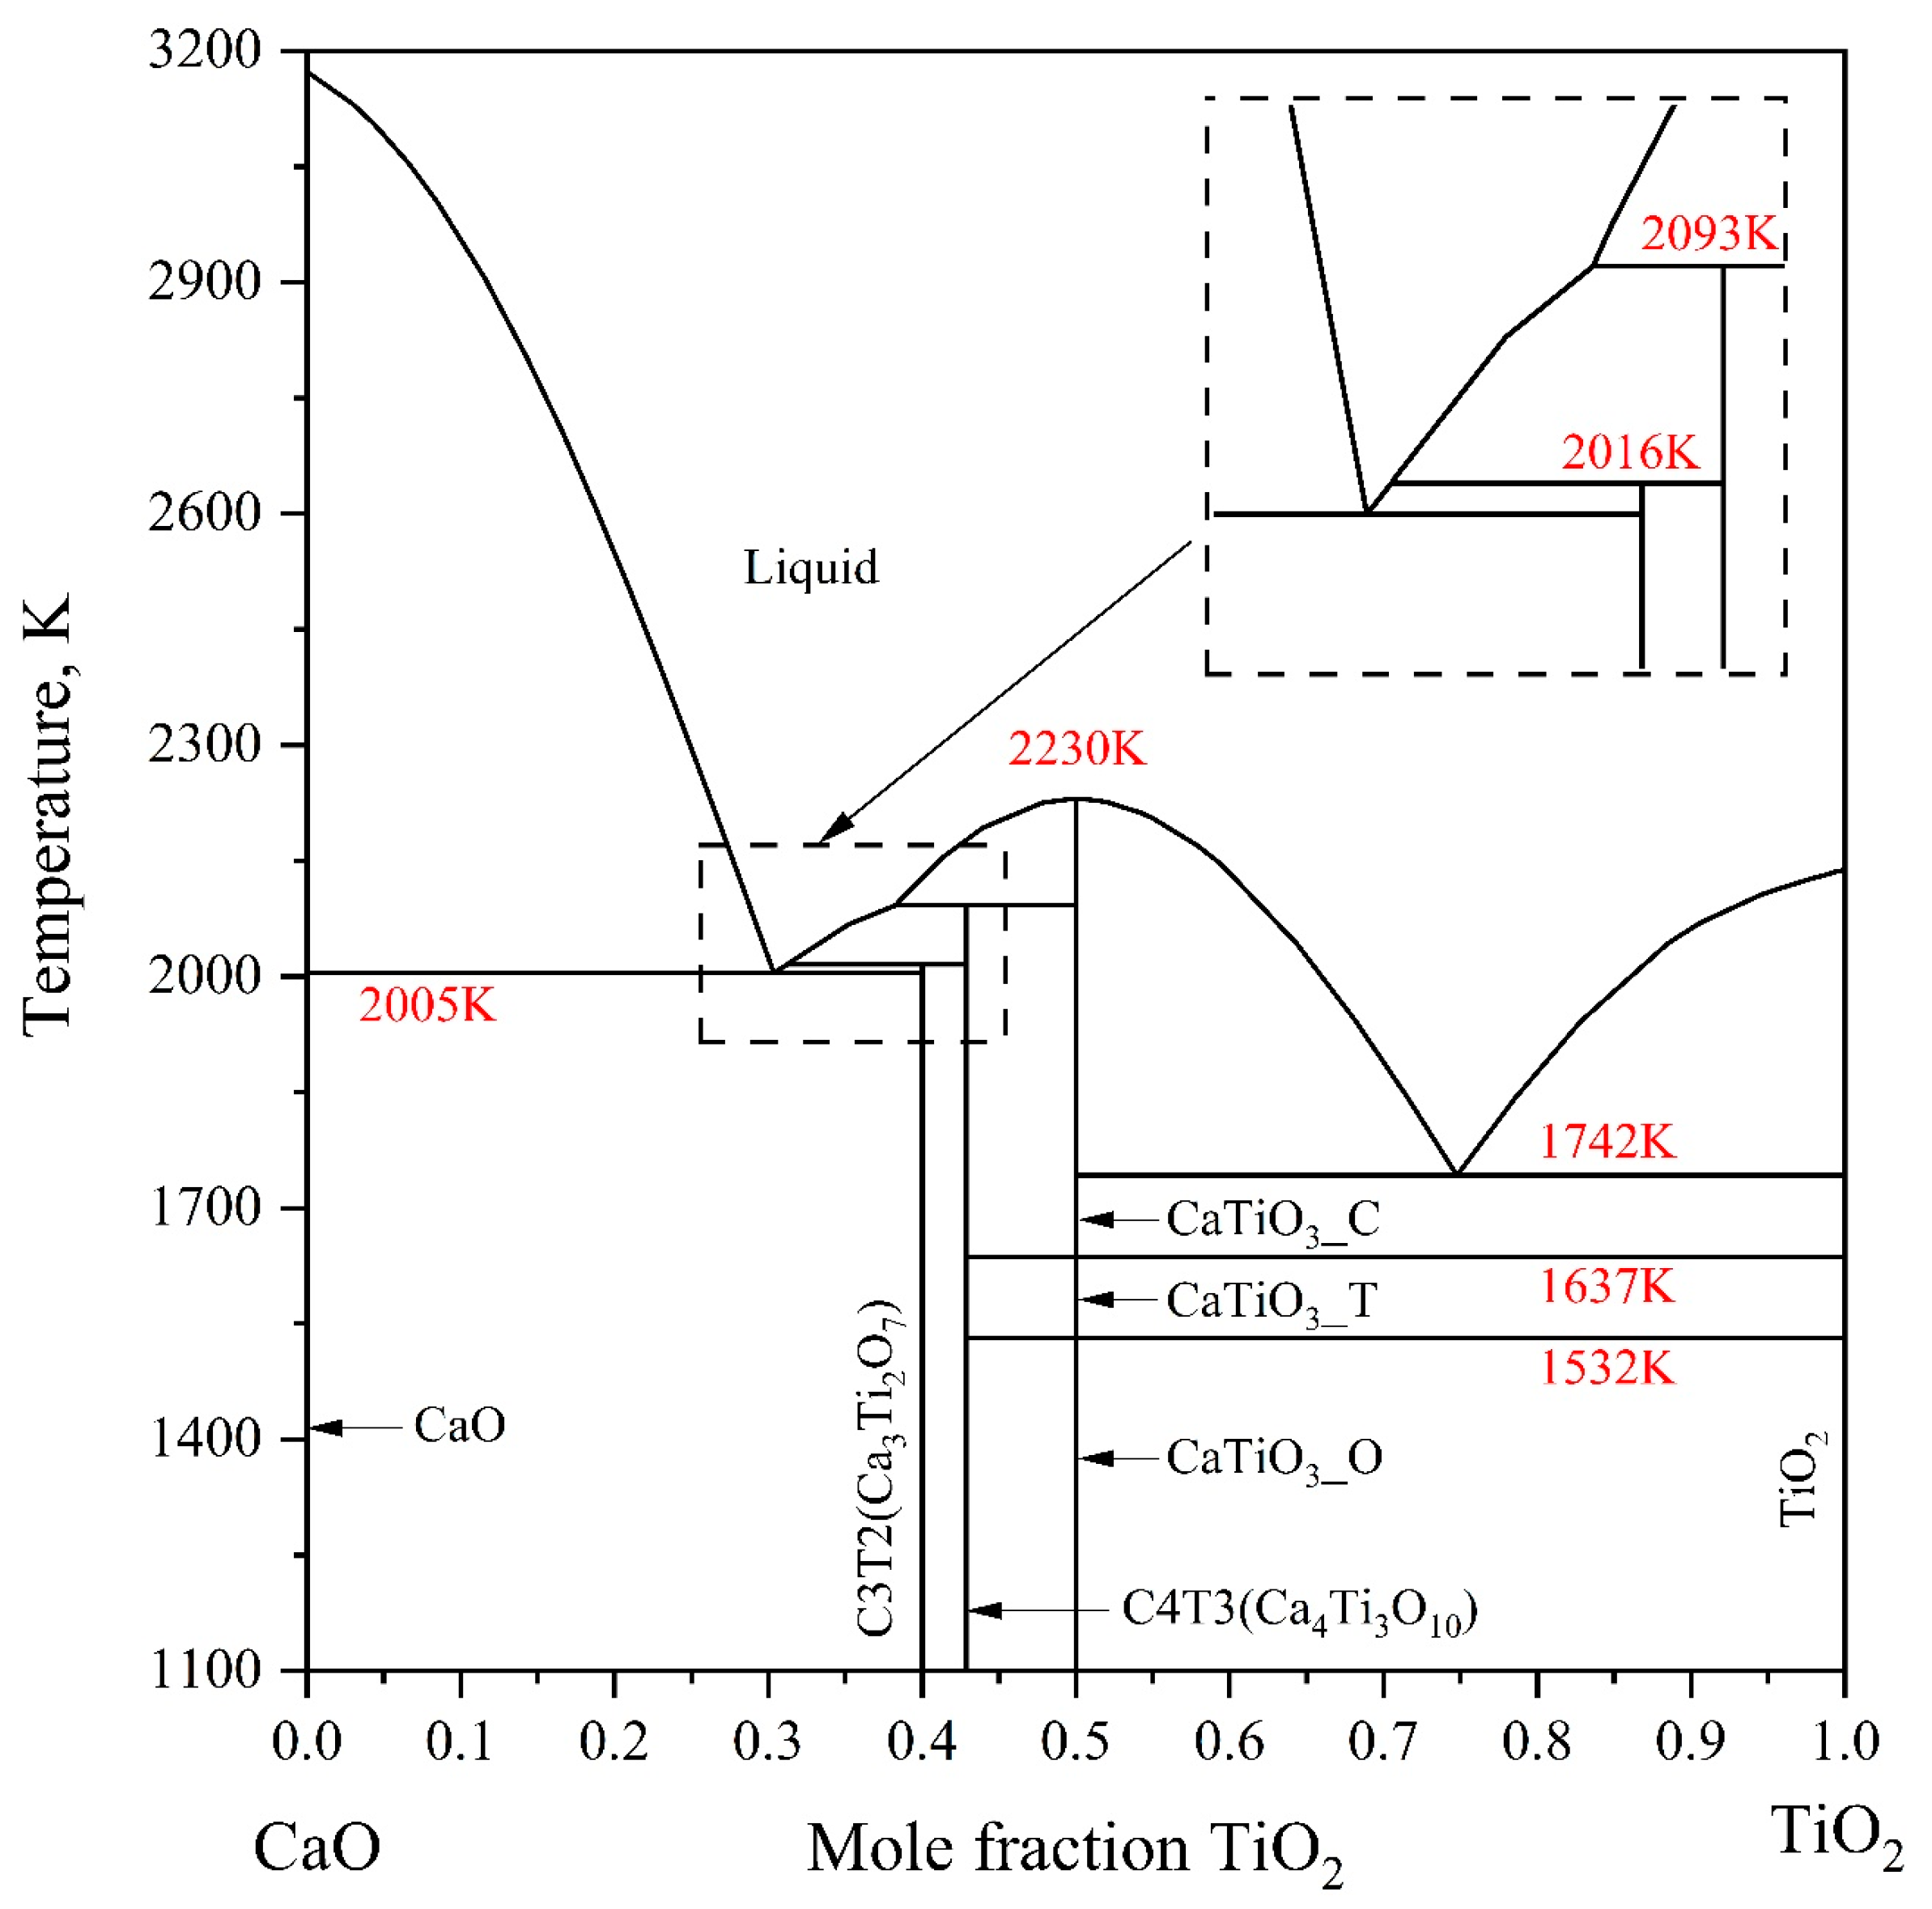
Figure 1. The CaO-TiO2 binary phase diagram evaluated by Ye et al. [34].
Materials 18 04448 g001
Figure 2. The calculated CaO-SiO2 binary phase diagram according to Ref. [47].
Materials 18 04448 g002
Figure 3. The SiO2-TiO2 binary phase diagram calculated by Ilatovskaia et al. [54].
Materials 18 04448 g003
Figure 4. Calculated isothermal sections at (a) 1573, (b) 1673, (c) 1723 K, (d) 1773, (e) 1823, and (f) 1873 K, respectively. The experimental data are obtained from Devries et al. [57] and Wan et al. [61]. The green area represents the two-phase region.
Materials 18 04448 g004
Figure 5. Calculated thermodynamic properties of CaTiSiO5 compared with the experimental data [62,68] and previous works [21,62,64,66,76]: (a) heat capacity; (b) heat content; (c) S(T)-S(298).
Materials 18 04448 g005
Table 1. Thermodynamic models of all stable phases in the CaO-TiO2-SiO2 system.
Phase NameModelReference
Liquid(Ca+2,Ti+2,Ti+3)P(O−2,Va,O,TiO2,SiO2,SiO4−4)QThis work
Periclase (CaO)(Ca+2)1(O−2)1[34]
Rutile (TiO2)(Ti+4)1(O−2)2[34]
Quartz (Qua.)(SiO2)1[47]
Tridymite (Tri.)(SiO2)1[47]
Cristobalite (Cri.)(SiO2)1[47]
Olivine (Oli.)(Ca+2)2(Si+4)1(O−2)4[47]
α′-Ca2SiO4 (α′-C2S)(Ca+2)2(Si+4)1(O−2)4[47]
α-Ca2SiO4 (α-C2S)(Ca+2)2(Si+4)1(O−2)4[47]
Larnite (Lar.)(Ca+2)2(Si+4)1(O−2)4[47]
Pseudowollastonite (Pseudowol.)(Ca+2)1(Si+4)1(O−2)3[47]
Wollastonite (Wol.)(Ca+2)1(Si+4)1(O−2)3[47]
Hatruite (Hat.)(Ca+2)3(Si+4)1(O−2)5[47]
Rankinite (Ran.)(Ca+2)3(Si+4)2(O−2)7[47]
CaTiO3_O (CT_O)(Ca+2)1(Ti+4)1(O−2)3[34]
CaTiO3_T (CT_T)(Ca+2)1(Ti+4)1(O−2)3[34]
CaTiO3_C (CT_C)(Ca+2)1(Ti+4)1(O−2)3[34]
Ca3Ti2O7 (C3T2)(Ca+2)3(Ti+4)2(O−2)7[34]
Ca4Ti3O10 (C4T3)(Ca+2)4(Ti+4)3(O−2)10[34]
CaTiSiO5 (α-Sph.)(Ca+2)1(Ti+4)1(Si+4)1(O−2)5This work
CaTiSiO5 (β-Sph.)(Ca+2)1(Ti+4)1(Si+4)1(O−2)5This work
Table 2. Optimized thermodynamic models and parameters of CaO-TiO2-SiO2 system in the present work.
PhaseModelThermodynamics Parameter
Liquid(Ca+3,Ti+2,Ti+3)P(O−2,Va,
O,TiO2,SiO2,SiO4−4)Q
L C a + 2 : O 2 , T i O 2 , S i O 2 l i q u i d 0 = 993,353.075 + 124.275 T
L C a + 2 : O 2 , T i O 2 , S i O 2 l i q u i d 1 = 971,144 + 111 T
L C a + 2 : O 2 , T i O 2 , S i O 2 l i q u i d 3 = 566,824.54 + 128.98 T
L C a + 2 : S i O 4 4 , T i O 2 l i q u i d 0 = + 96,023 121 T
L C a + 2 : S i O 4 4 , T i O 2 l i q u i d 1 = 263,049.615 + 151.255 T
L C a + 2 : S i O 4 4 , T i O 2 l i q u i d 3 = 161,295.42 + 102.54 T
L C a + 2 : S i O 4 4 , S i O 2 , T i O 2 l i q u i d 0 = + 147,293.725 169.325 T
L C a + 2 : S i O 4 4 , S i O 2 , T i O 2 l i q u i d 1 = + 38,906.74 146.38 T
L C a + 2 : S i O 4 4 , S i O 2 , T i O 2 l i q u i d 3 = 163,706 97 T
α-Sph.(Ca+2)1(Ti+4)1(Si+4)1(O−2)5 G C a + 2 : T i + 4 : S i + 4 : O 2 α S p h . 0 = + G A L P H A S P H E N E
β-Sph.(Ca+2)1(Ti+4)1(Si+4)1(O−2)5 G C a + 2 : T i + 4 : S i + 4 : O 2 β S p h . 0 = + G B E T A S P H E N E
FUNCTIONS
G A L P H A S P H E N = 2,666,471.78552 + 1078.887994 T 174.50986 T l n ( T ) 0.021445 T 2 + 2.30645 × 10 6 T 3 + 2,153,777.409 T 1 ( 298.15 < T < 6000 )
G B E T A S P H E N E = + G A L P H A S P H E N E + 199 0.409465 T ( 298.15 < T < 6000 )
Note: All parameter values are given in SI units.
Table 3. Calculated enthalpy of formation, entropy of formation, and enthalpy of transition for the CaTiSiO5 phases in the CaO-TiO2-SiO2 systems and their comparison with experimental data.
PropertiesT, KCalculated Value (This Work)Experimental ValueReference
f , e l H , kJ·mol−1298.15−2598.21−2601.4 ± 2.38[62]
298.15−2602.84 ± 2.07[63]
298.15−2610.13 ± 2.9[65]
f , o x H , kJ·mol−1298.15−107.17−110.86 ± 1.52[62]
298.15−112.34 ± 1.05[63]
298.15−119.59 ± 2.24[65]
S f , e l , J·mol−1·K−1298.15126.31129.2856 ± 0.8368[62]
f , t r H , kJ·mol−1-0.199 (486 K)0.196 ± 0.007 (483 ± 5 K)[68]
Disclaimer/Publisher’s Note: The statements, opinions and data contained in all publications are solely those of the individual author(s) and contributor(s) and not of MDPI and/or the editor(s). MDPI and/or the editor(s) disclaim responsibility for any injury to people or property resulting from any ideas, methods, instructions or products referred to in the content.