Dynamic Fracture Strength Prediction of HPFRC Using a Feature-Weighted Linear Ensemble Approach
Abstract
1. Introduction
2. Dataset Construction and Feature Engineering
2.1. Dataset Construction and Analysis
2.2. Feature Engineering and Preprocessing
3. Methods
3.1. Feature Weight Linear Stacking
- (1)
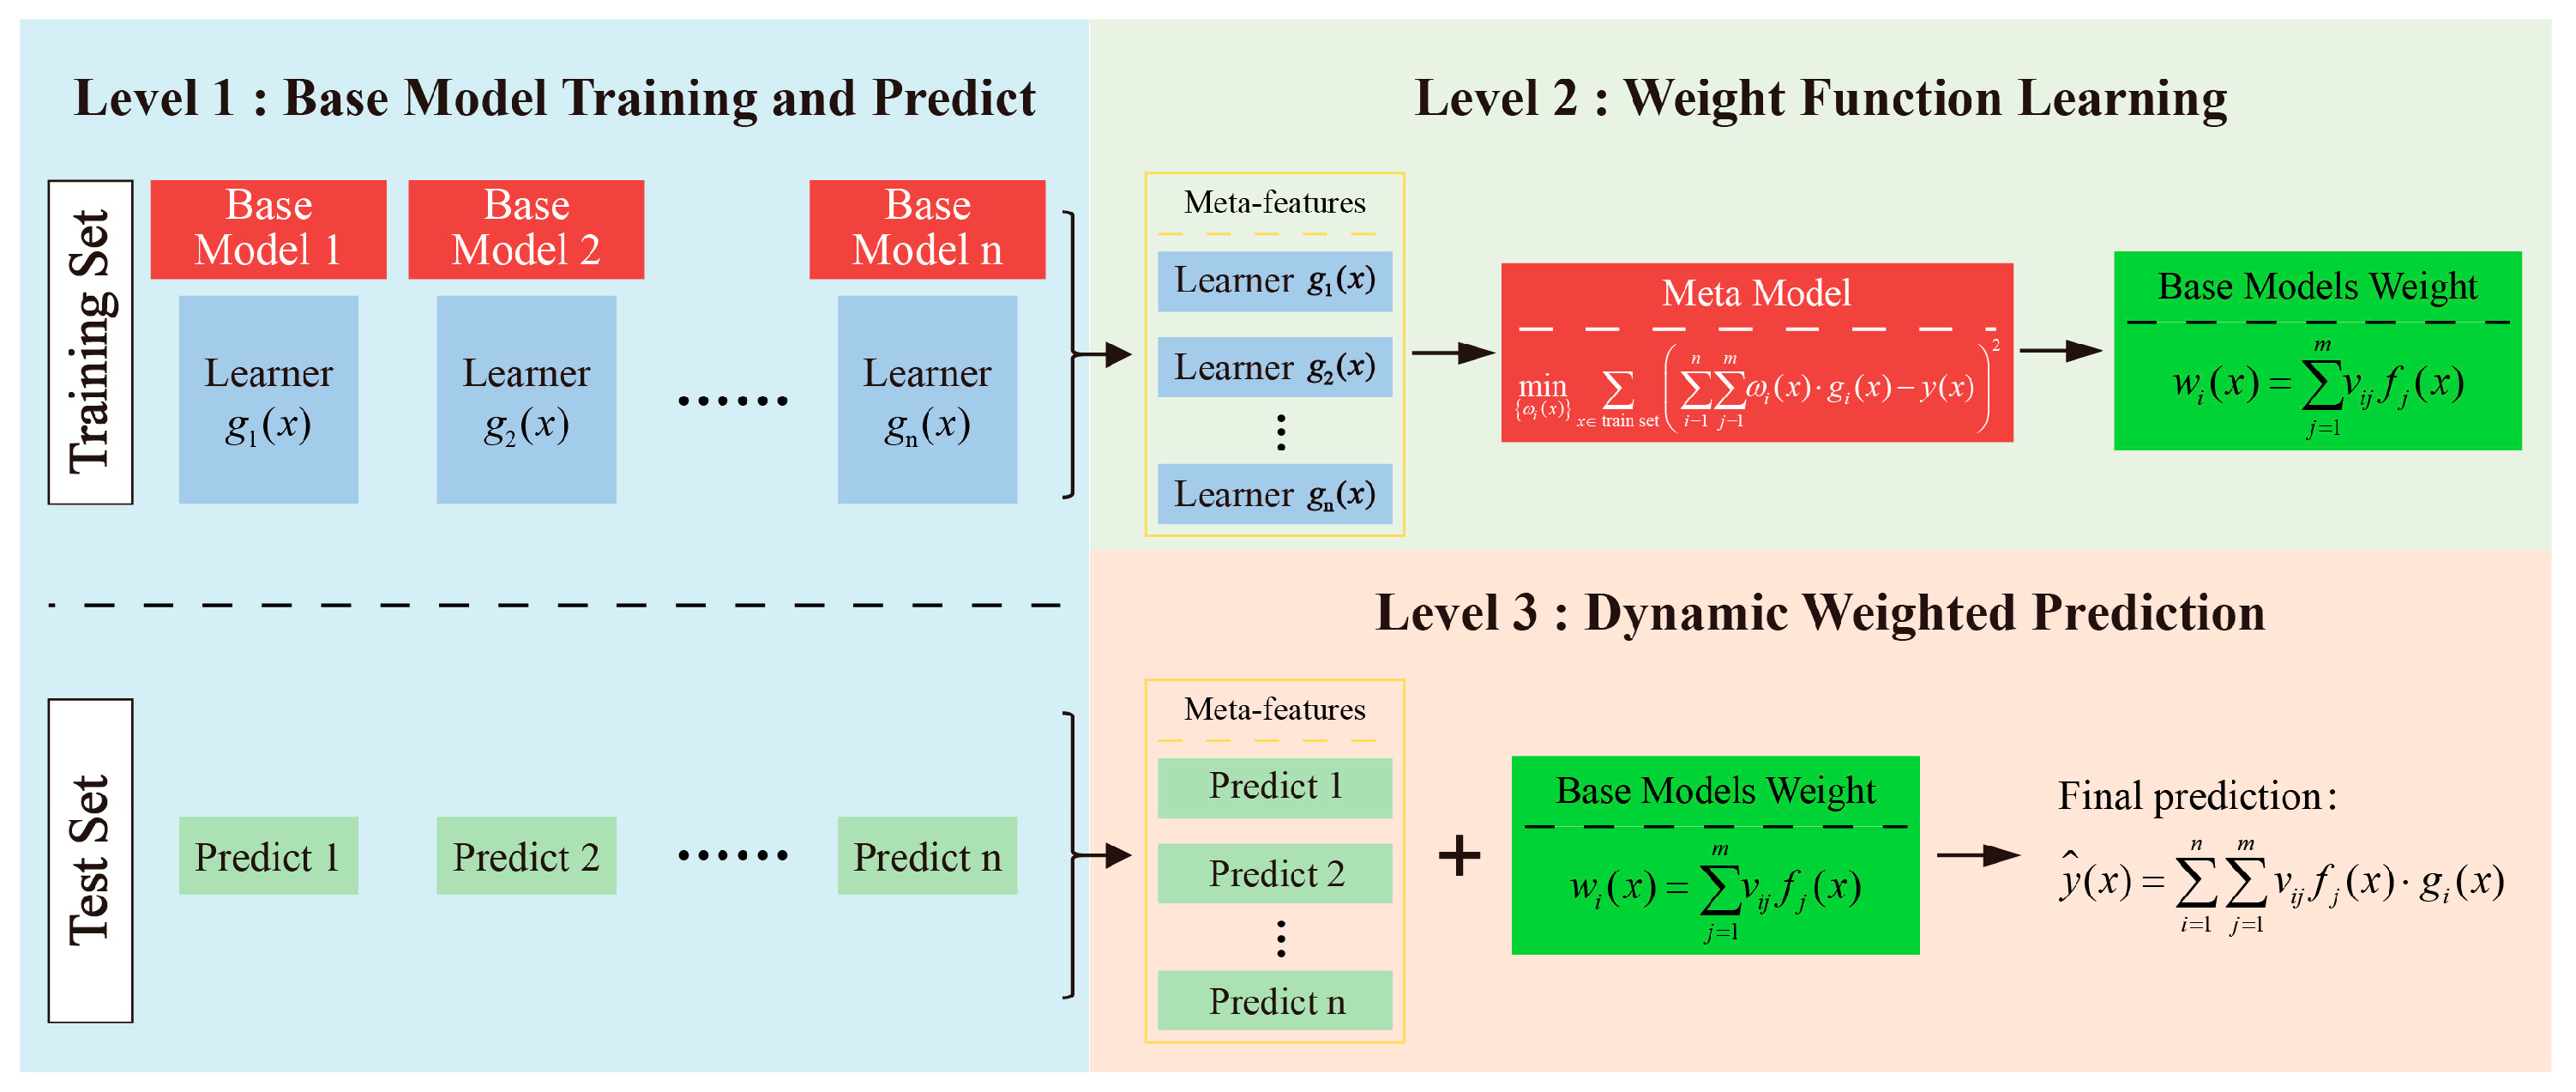
- Base model training and prediction generation: Initially, multiple heterogeneous or homogeneous base learners are trained on the training dataset. Each base model receives the original input features and outputs its preliminary prediction of the target variable. Upon completion of this stage, the predictions from all base models for each training sample are collected, forming a new set of inputs—referred to as meta-features—for the subsequent weight function learning.
- (2)
- Weight function learning: In the second stage, a meta-model is constructed using the meta-features generated in the previous step to learn the relative credibility or contribution of each base model under varying input conditions. The objective is to minimize the weighted squared residual loss function:
- (3)
- Dynamic Weighted Ensemble Prediction. In the prediction phase, once a test sample is input, each base model independently generates its prediction. These individual outputs are then aggregated using the dynamic weight functions learned in the second stage, resulting in the final ensemble prediction:
3.2. Voting Regression
- (1)
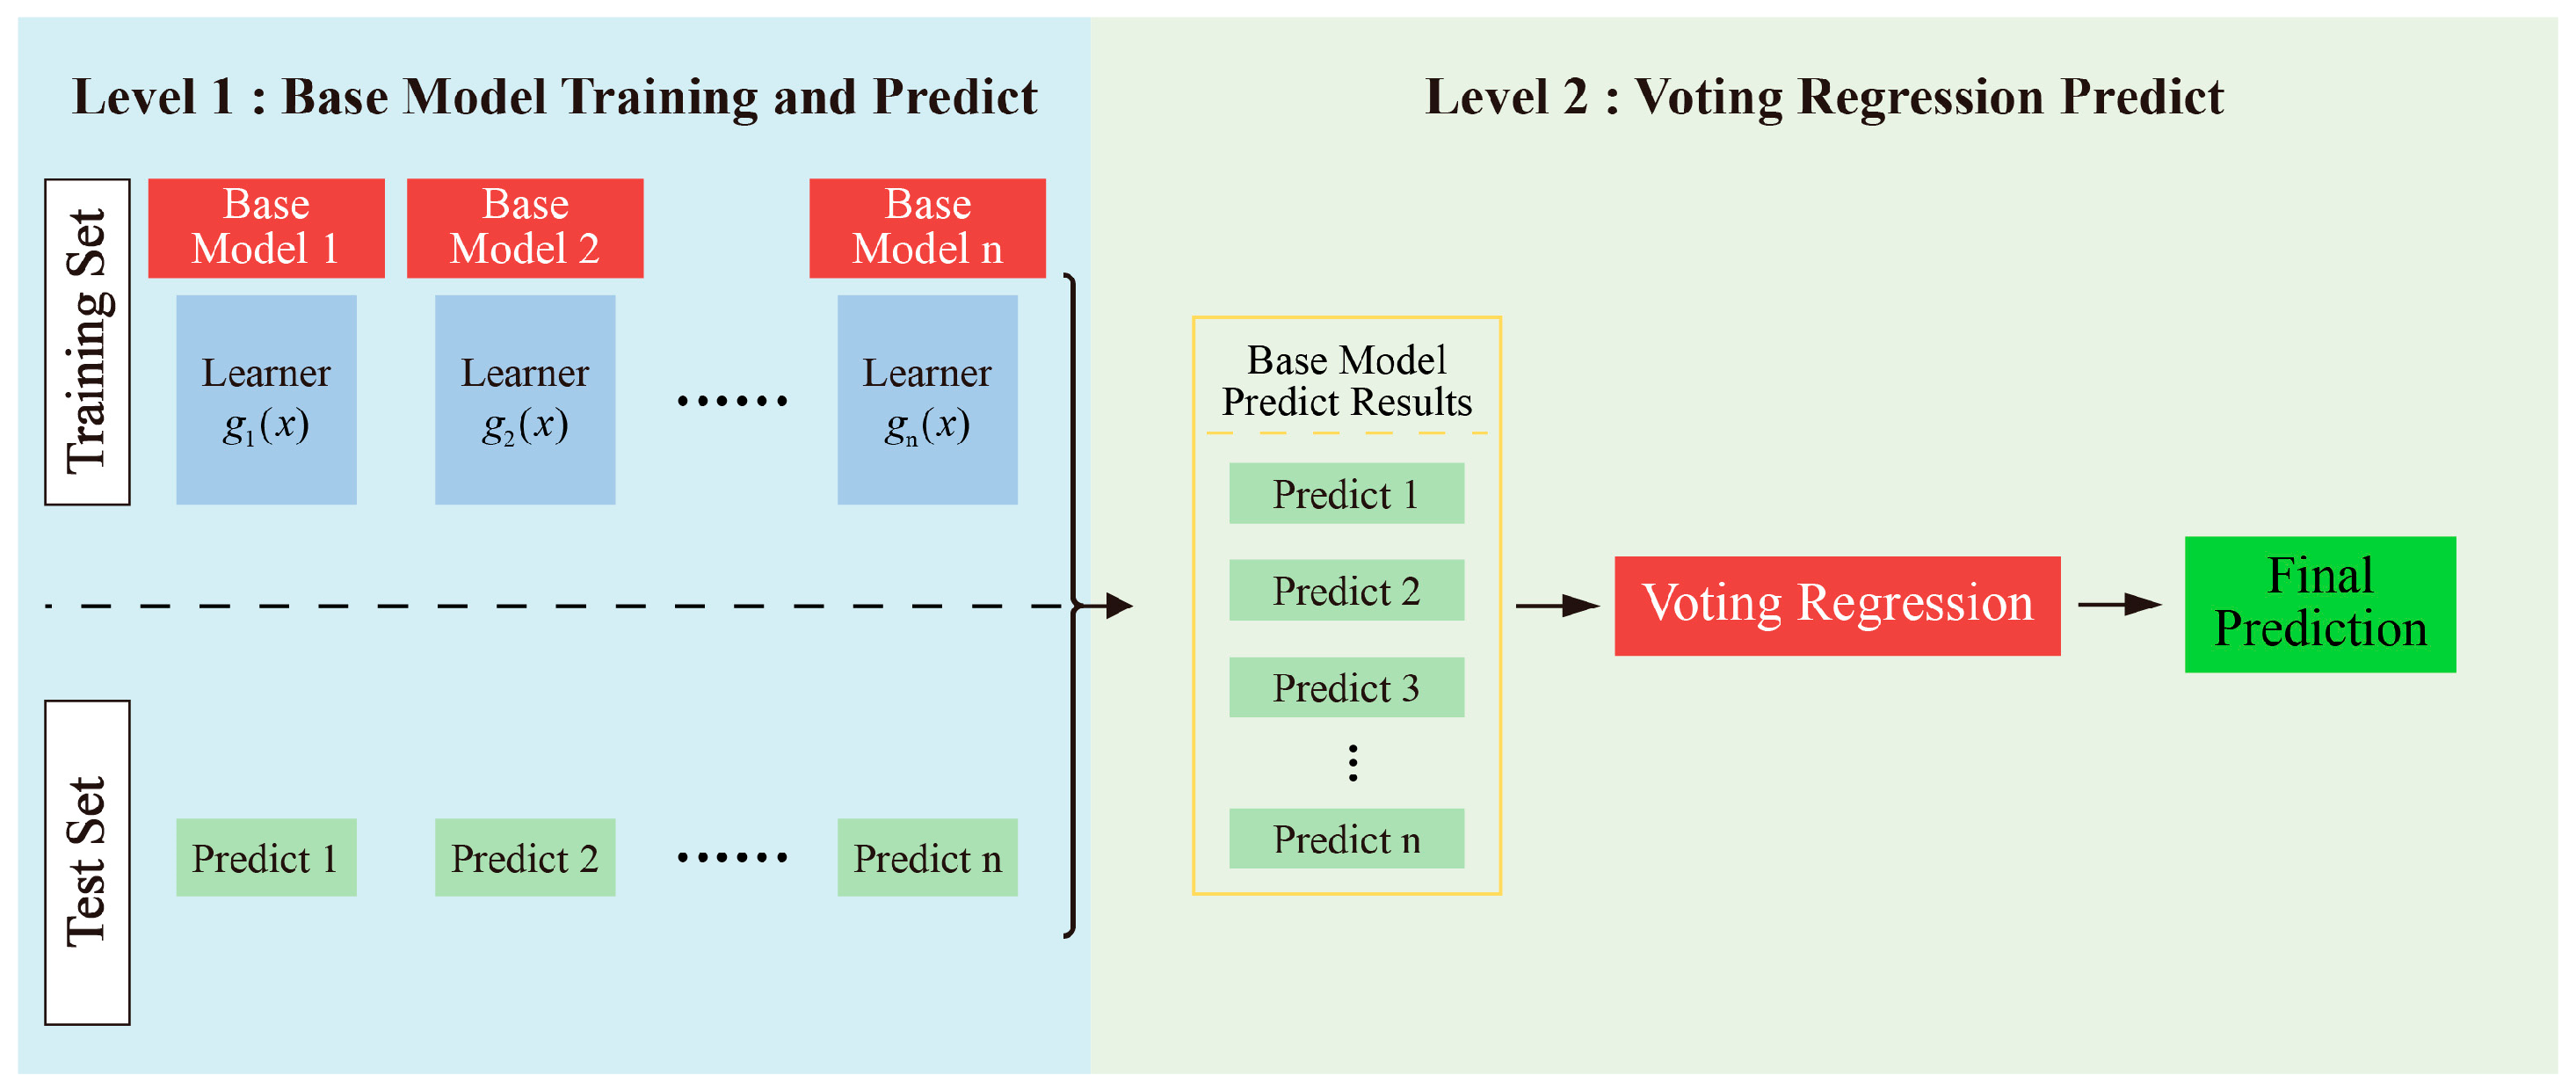
- Base Model Training and Prediction (Stage I): Multiple independent regression models are constructed using the training dataset. Each model learns its individual regression mapping function based on the training data. Once trained, these base models generate independent prediction outputs on the test set as follows:
- (2)
- Voting Regression Prediction (Stage II): The individual predictions from all base models are aggregated to generate the final output. The core idea of the Voting Regression strategy is to compute the average of all base model predictions:
3.3. Machine Learning Models
3.3.1. K-Nearest Neighbors (KNN)
3.3.2. Random Forest (RF)
3.3.3. Support Vector Regression (SVR)
3.3.4. Light Gradient Boosting Machine (LightGBM)
3.3.5. Extreme Gradient Boosting (XGBoost)
3.3.6. Multi-Layer Perceptron Neural Network (MLPNN)
3.4. Prediction Framework Construction
- (1)
- Data Processing and Feature Engineering
- (2)
- Model Training and Ensemble Prediction
- (3)
- Model Evaluation and Interpretation
4. Performance Evaluation Methods
4.1. Evaluation Metric
- (1)
- Coefficient of Determination (R2): This metric measures the proportion of variance in the target variable that is explained by the model. It is defined as [28]
- (2)
- Mean Absolute Error (MAE): MAE quantifies the average absolute difference between predicted and actual values, providing a measure that is less sensitive to outliers. It is calculated as [29]
- (3)
- Root-Mean-Square Error (RMSE): RMSE evaluates the square root of the average squared differences between predicted and actual values, making it more sensitive to large errors [28]:
- (4)
- Systematic Bias (Bias): Bias quantifies the average directional deviation between predictions and actual values, capturing whether the model systematically overestimates or underestimates the target [29]:
4.2. Shapley Additive Explanations (SHAP)
4.3. Local Interpretable Model-Agnostic Explanations (LIME)
5. Results and Discussion
5.1. Comparative Analysis of Model Performance
5.2. Model Interpretation
5.2.1. Multi-Level SHAP Interpretation of the FWL Model
- (1)
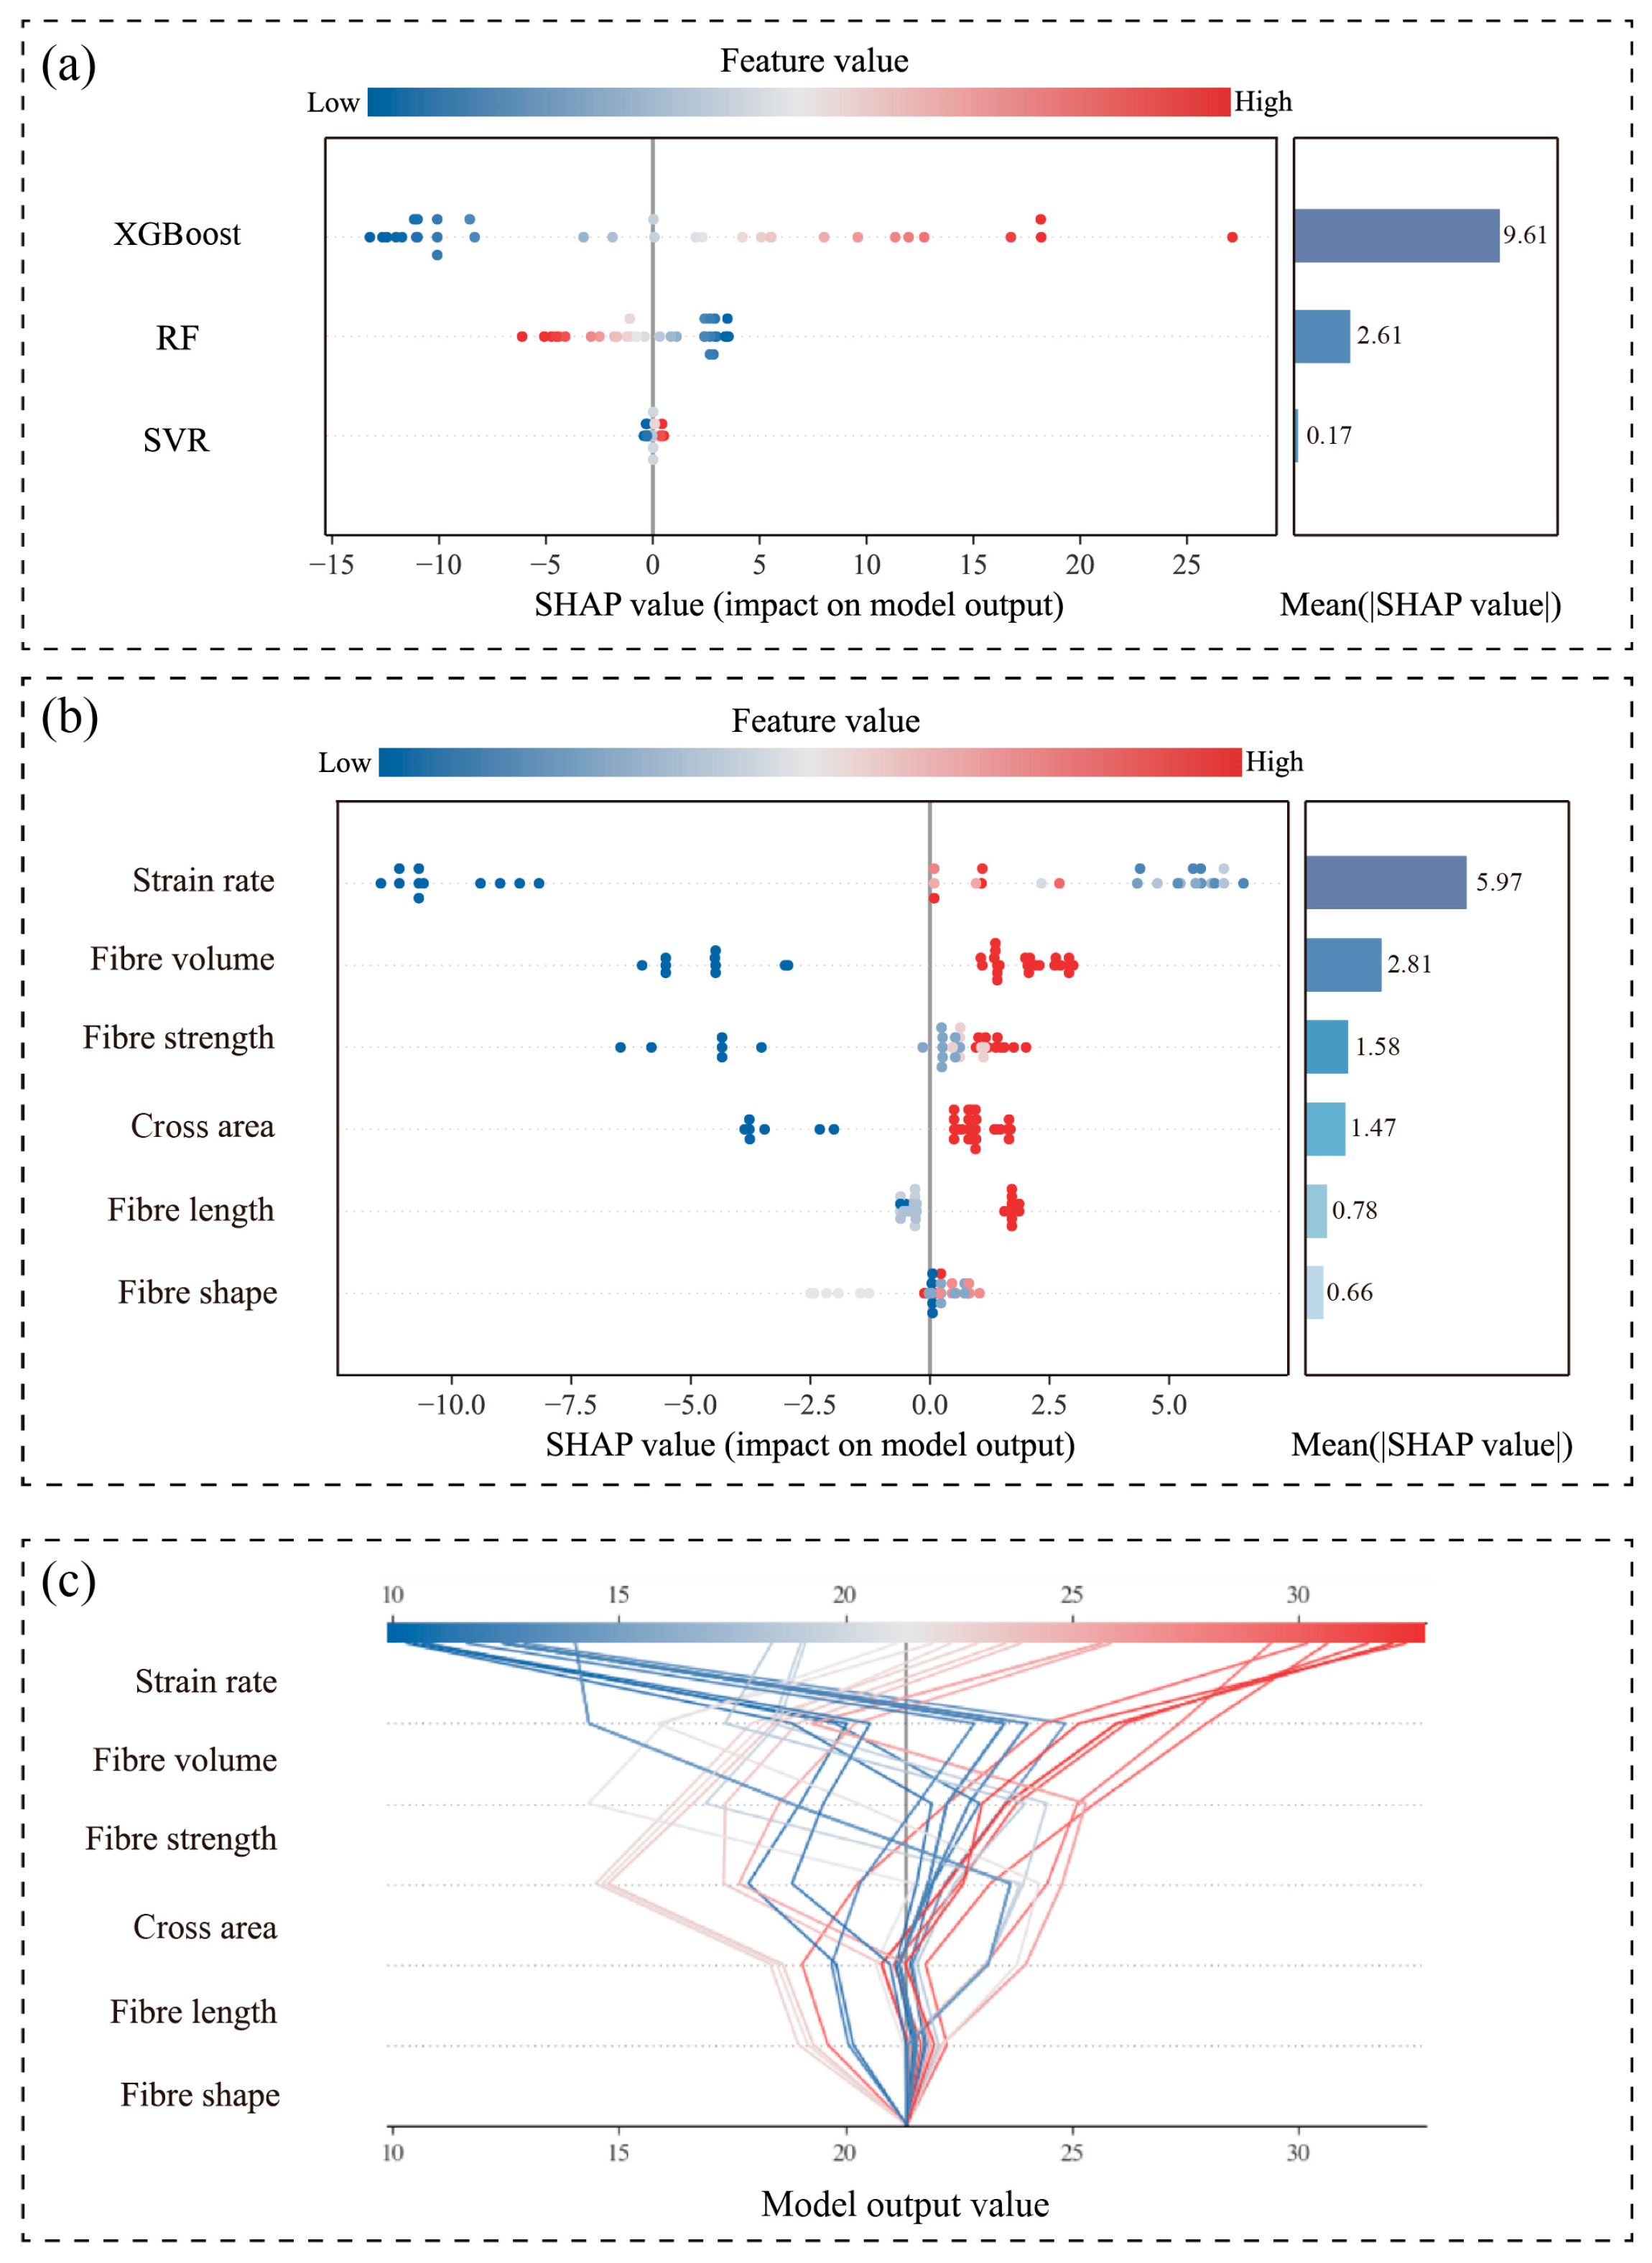
- Strain rate consistently dominates across all base learners, particularly in the RF model (mean SHAP value: 6.74), confirming its role as the primary predictor.
- (2)
- Fiber volume and cross-sectional area subsequently ranked highest in importance, demonstrating stable significance and highlighting the marked dependence of fracture strength predictions on structural parameters (e.g., loading rate and fiber configuration).
- (3)
- SVR exhibits a narrower dispersion of SHAP values with lower magnitudes, indicating limited responsiveness to sample variations and an inability to capture nonlinear relationships in fracture strength evolution. This observation aligns with SVR’s suboptimal predictive performance, validating its limited applicability for this task.
5.2.2. Local Interpretability Under Varying Strain Rates
6. Conclusions
- (1)
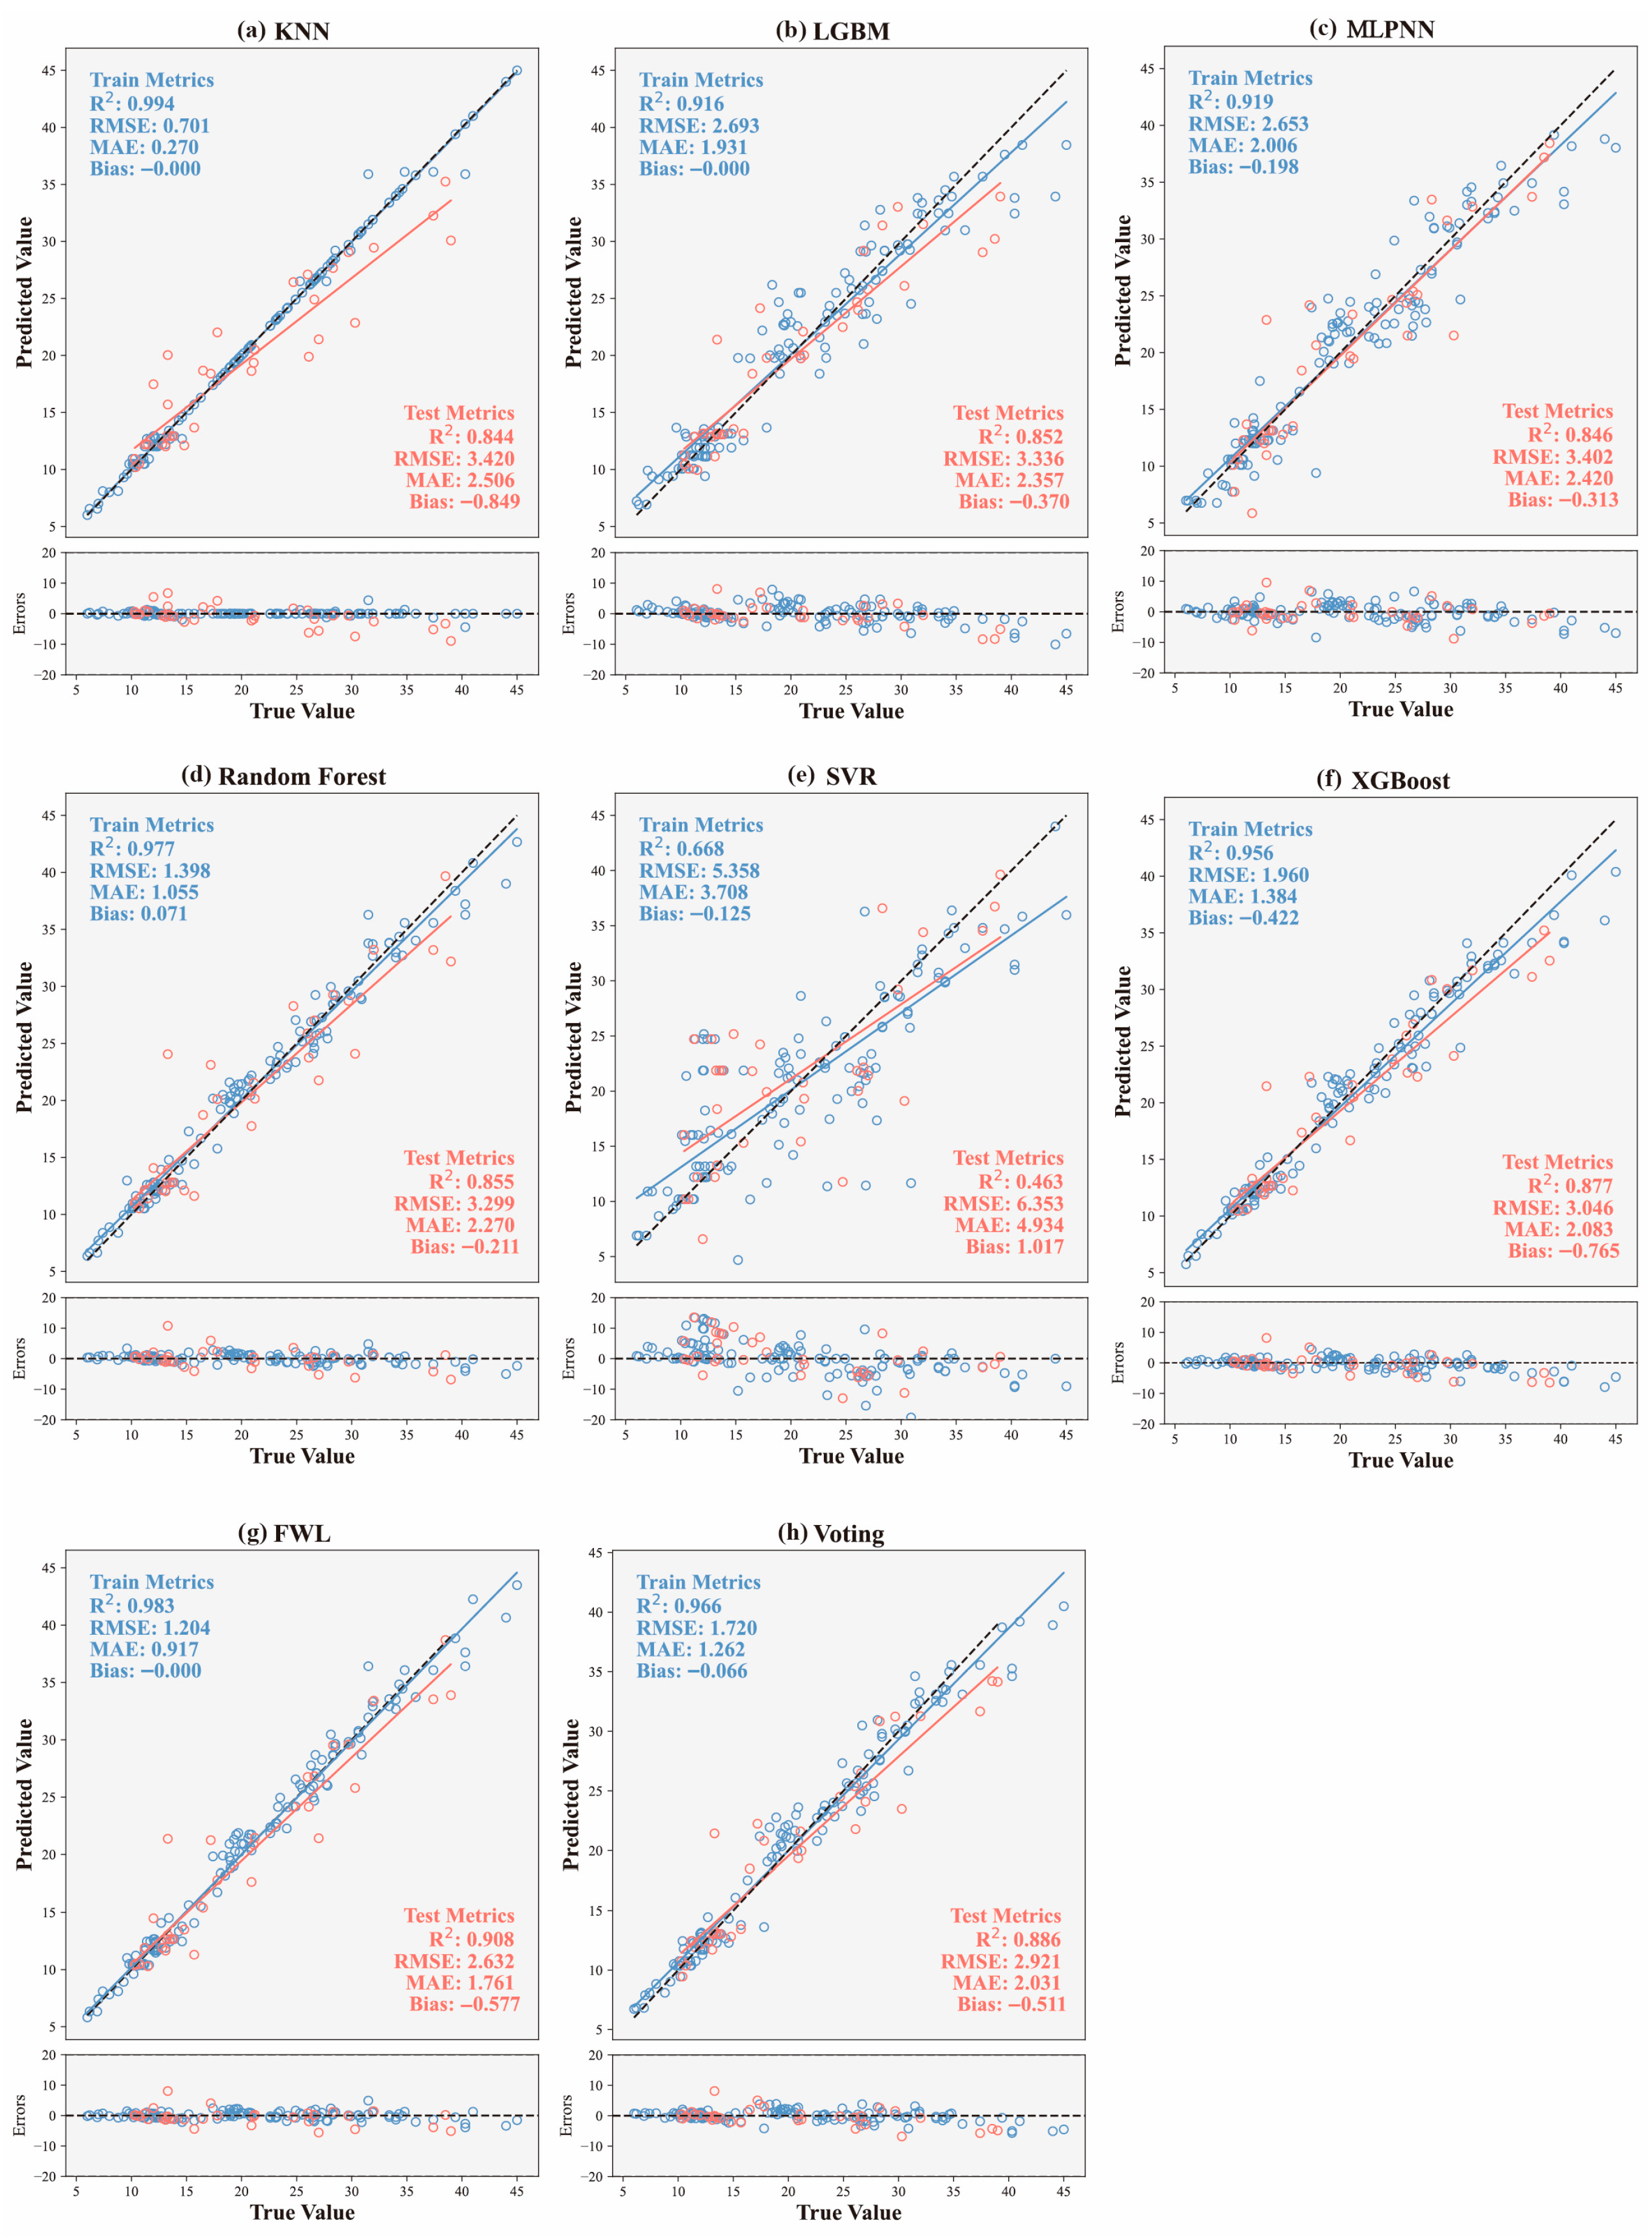
- By introducing a feature-driven dynamic weighting mechanism, the FWL model achieves an optimal combination of diverse base learners. Compared with individual models and conventional ensemble methods (e.g., Voting), the FWL model exhibits superior predictive performance on the test set, achieving a high coefficient of determination (R2 = 0.908), low prediction errors (RMSE = 2.632, MAE = 1.761), and minimal systematic bias (Bias = –0.577). This confirms its enhanced generalization and robustness under heterogeneous input conditions, outperforming state-of-the-art approaches in capturing high-strain-rate nonlinearity.
- (2)
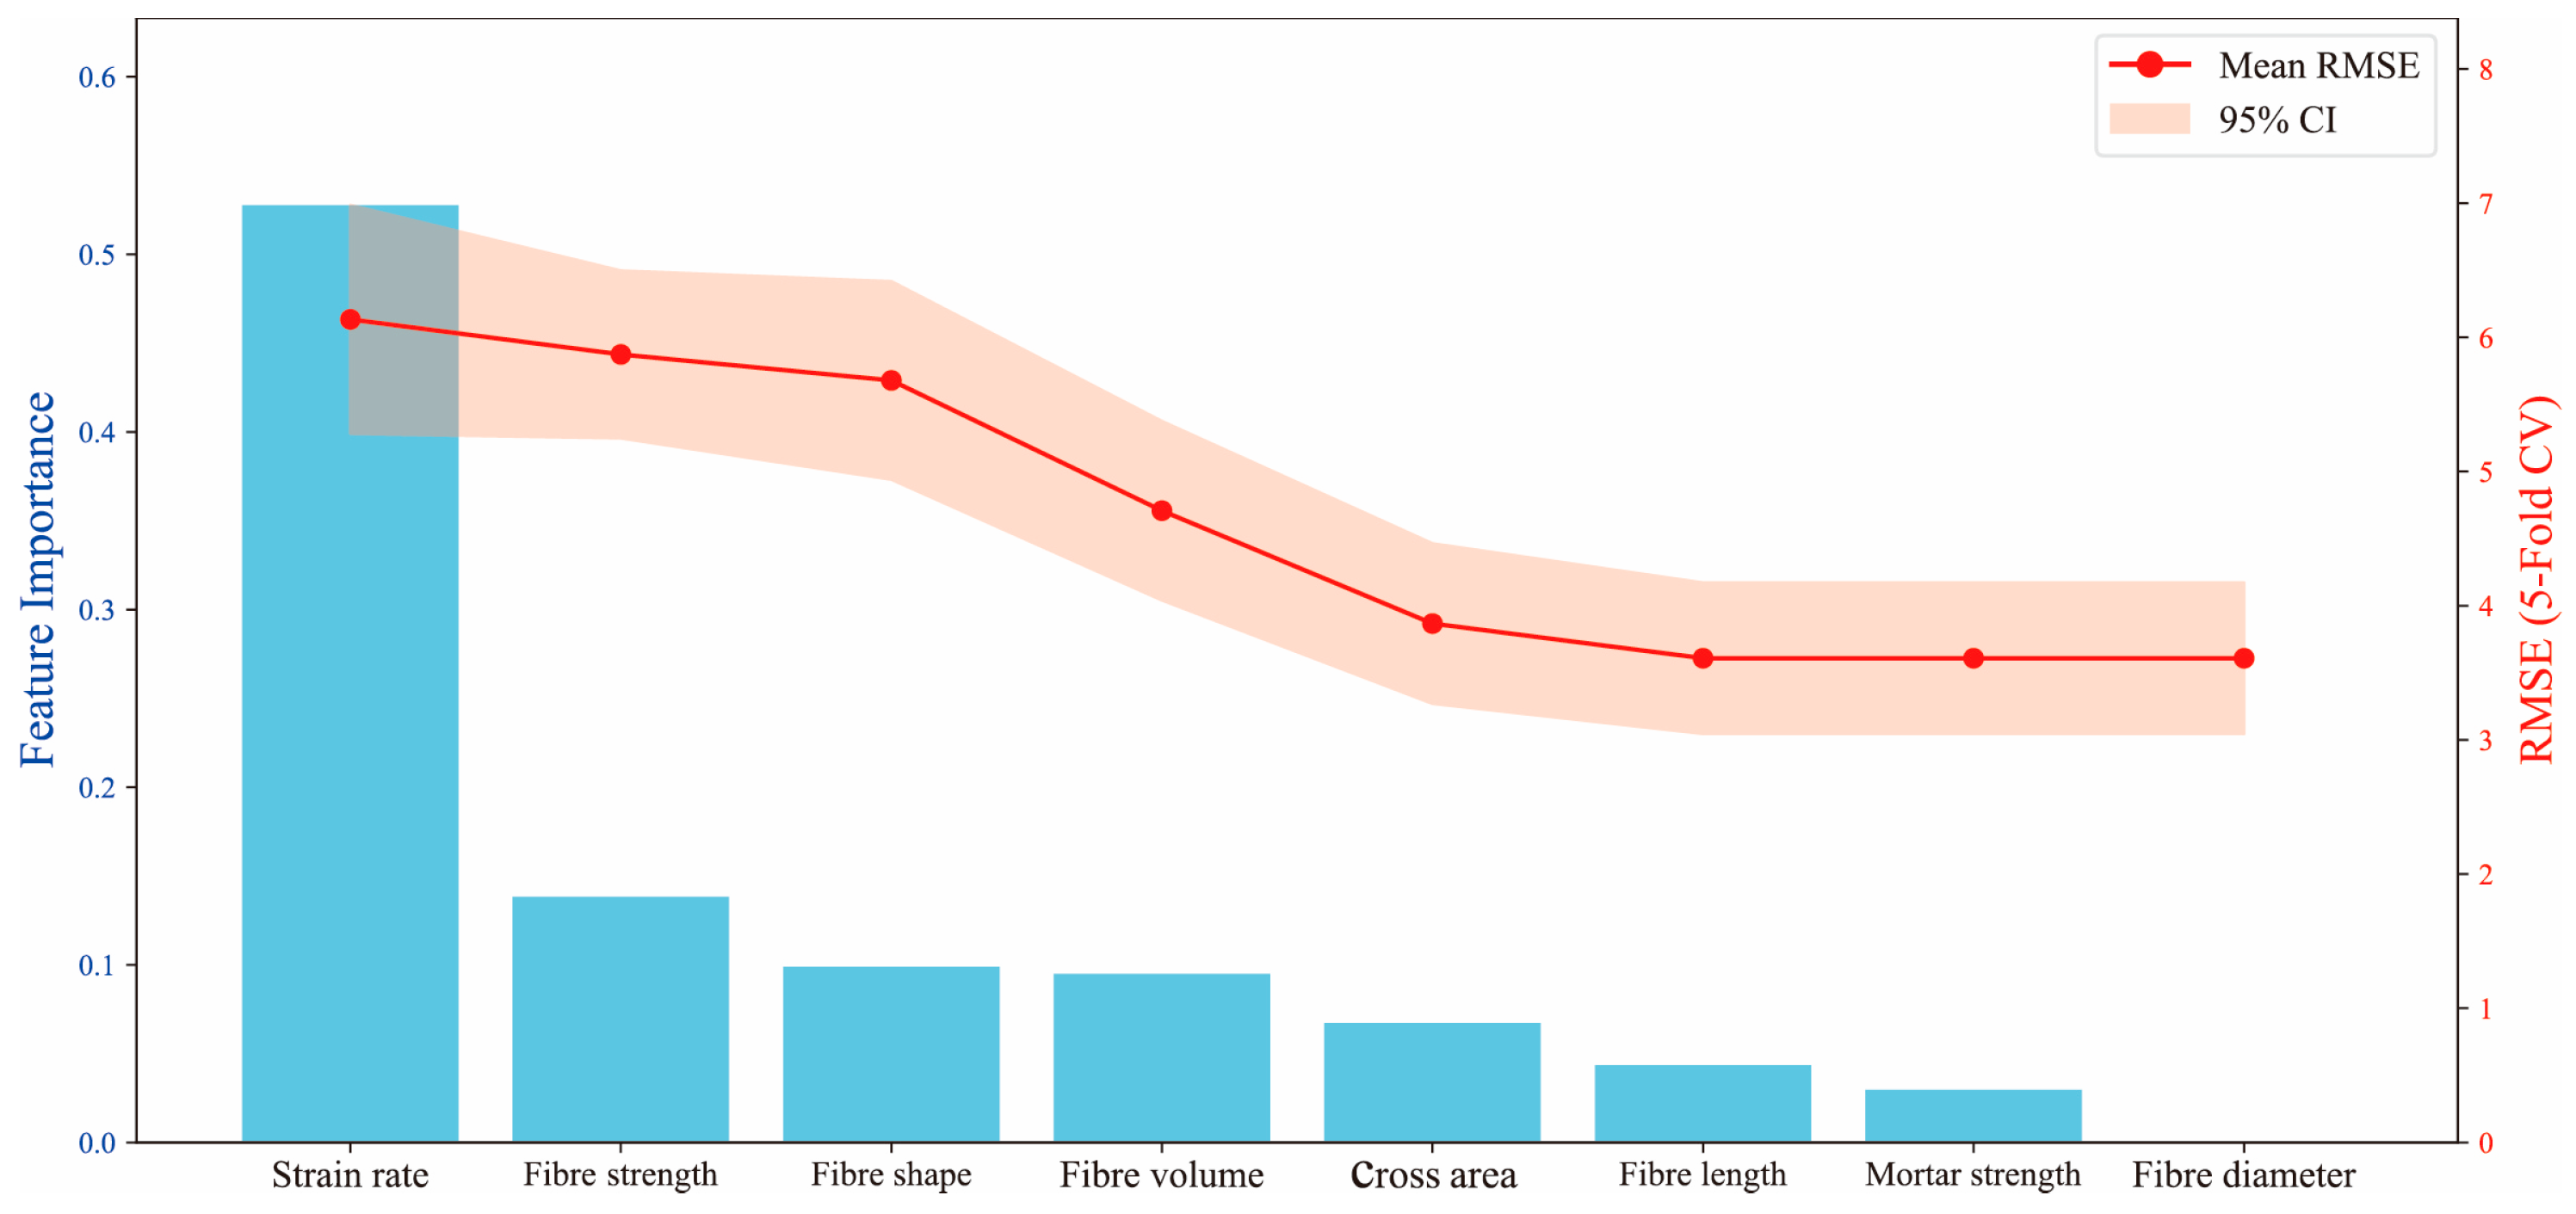
- Global and local feature response mechanisms, analyzed via SHAP, highlight strain rate and fiber volume fraction as consistently dominant predictors across all models. Their critical coupling effect on fracture strength underscores the interplay between loading rate and material microstructure. Feature selection via correlation analysis and error-driven strategies further validates that these variables effectively mitigate redundancy (e.g., excluding mortar compressive strength and fiber diameter), enhancing model efficiency.
- (3)
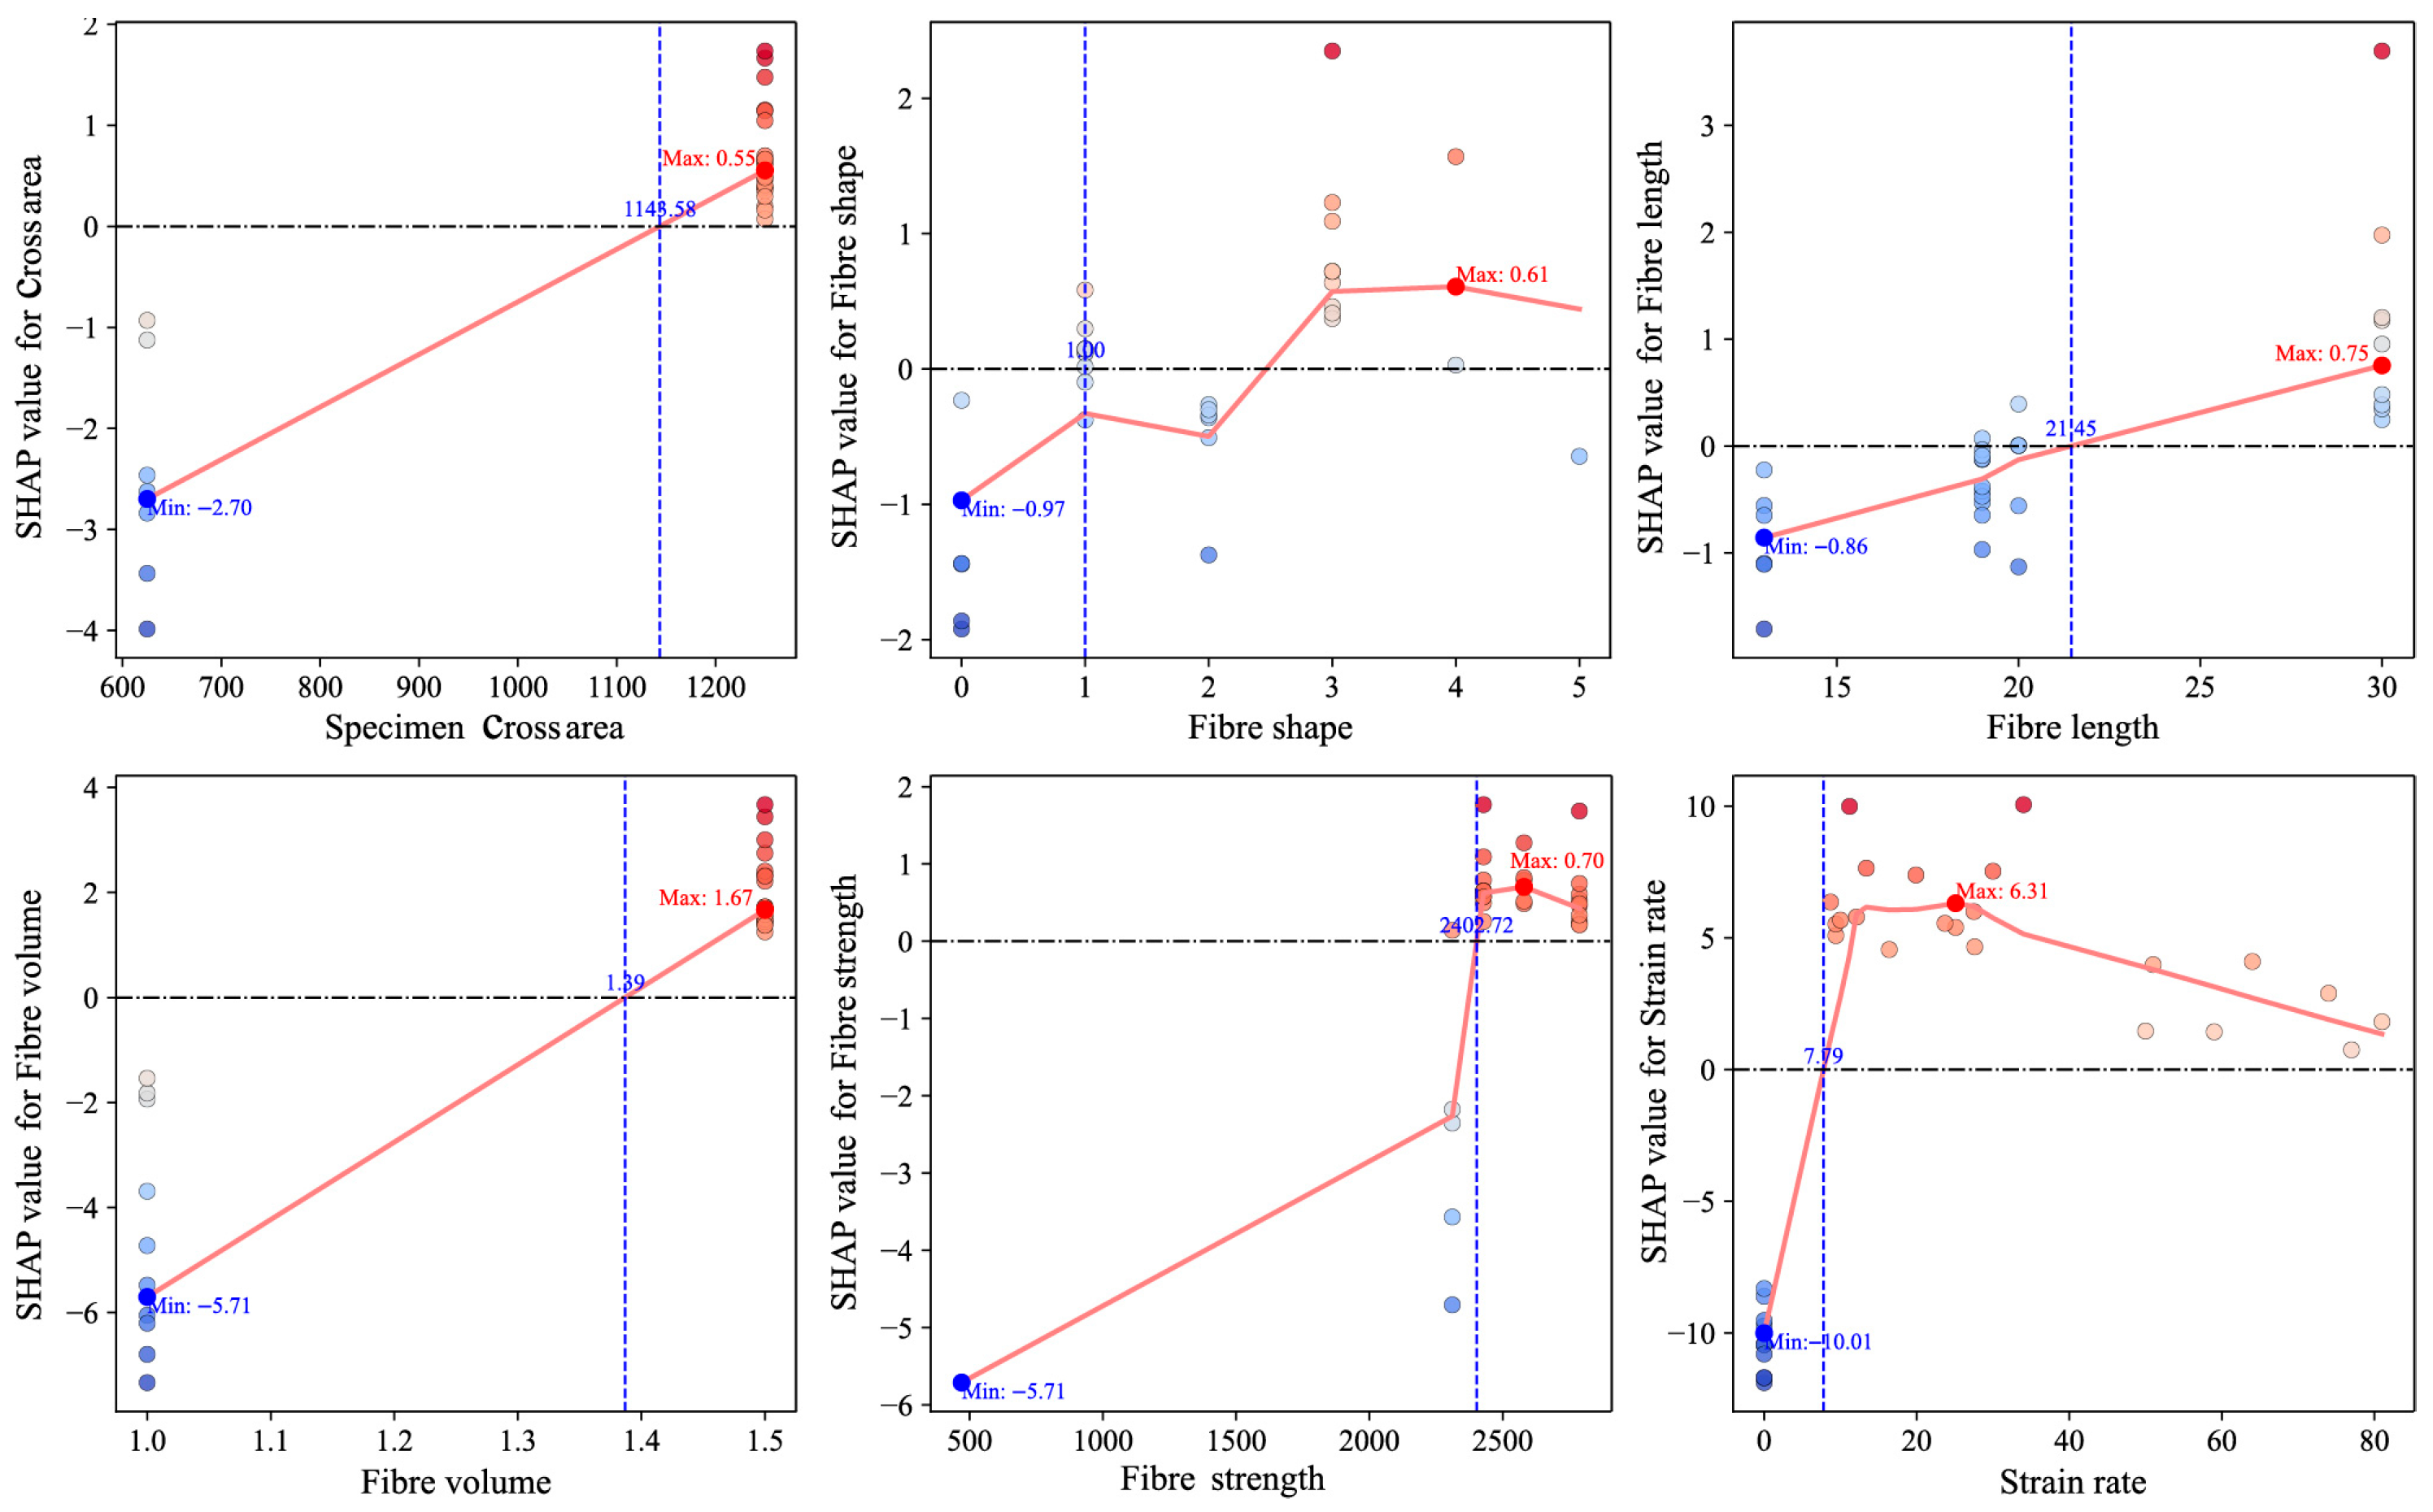
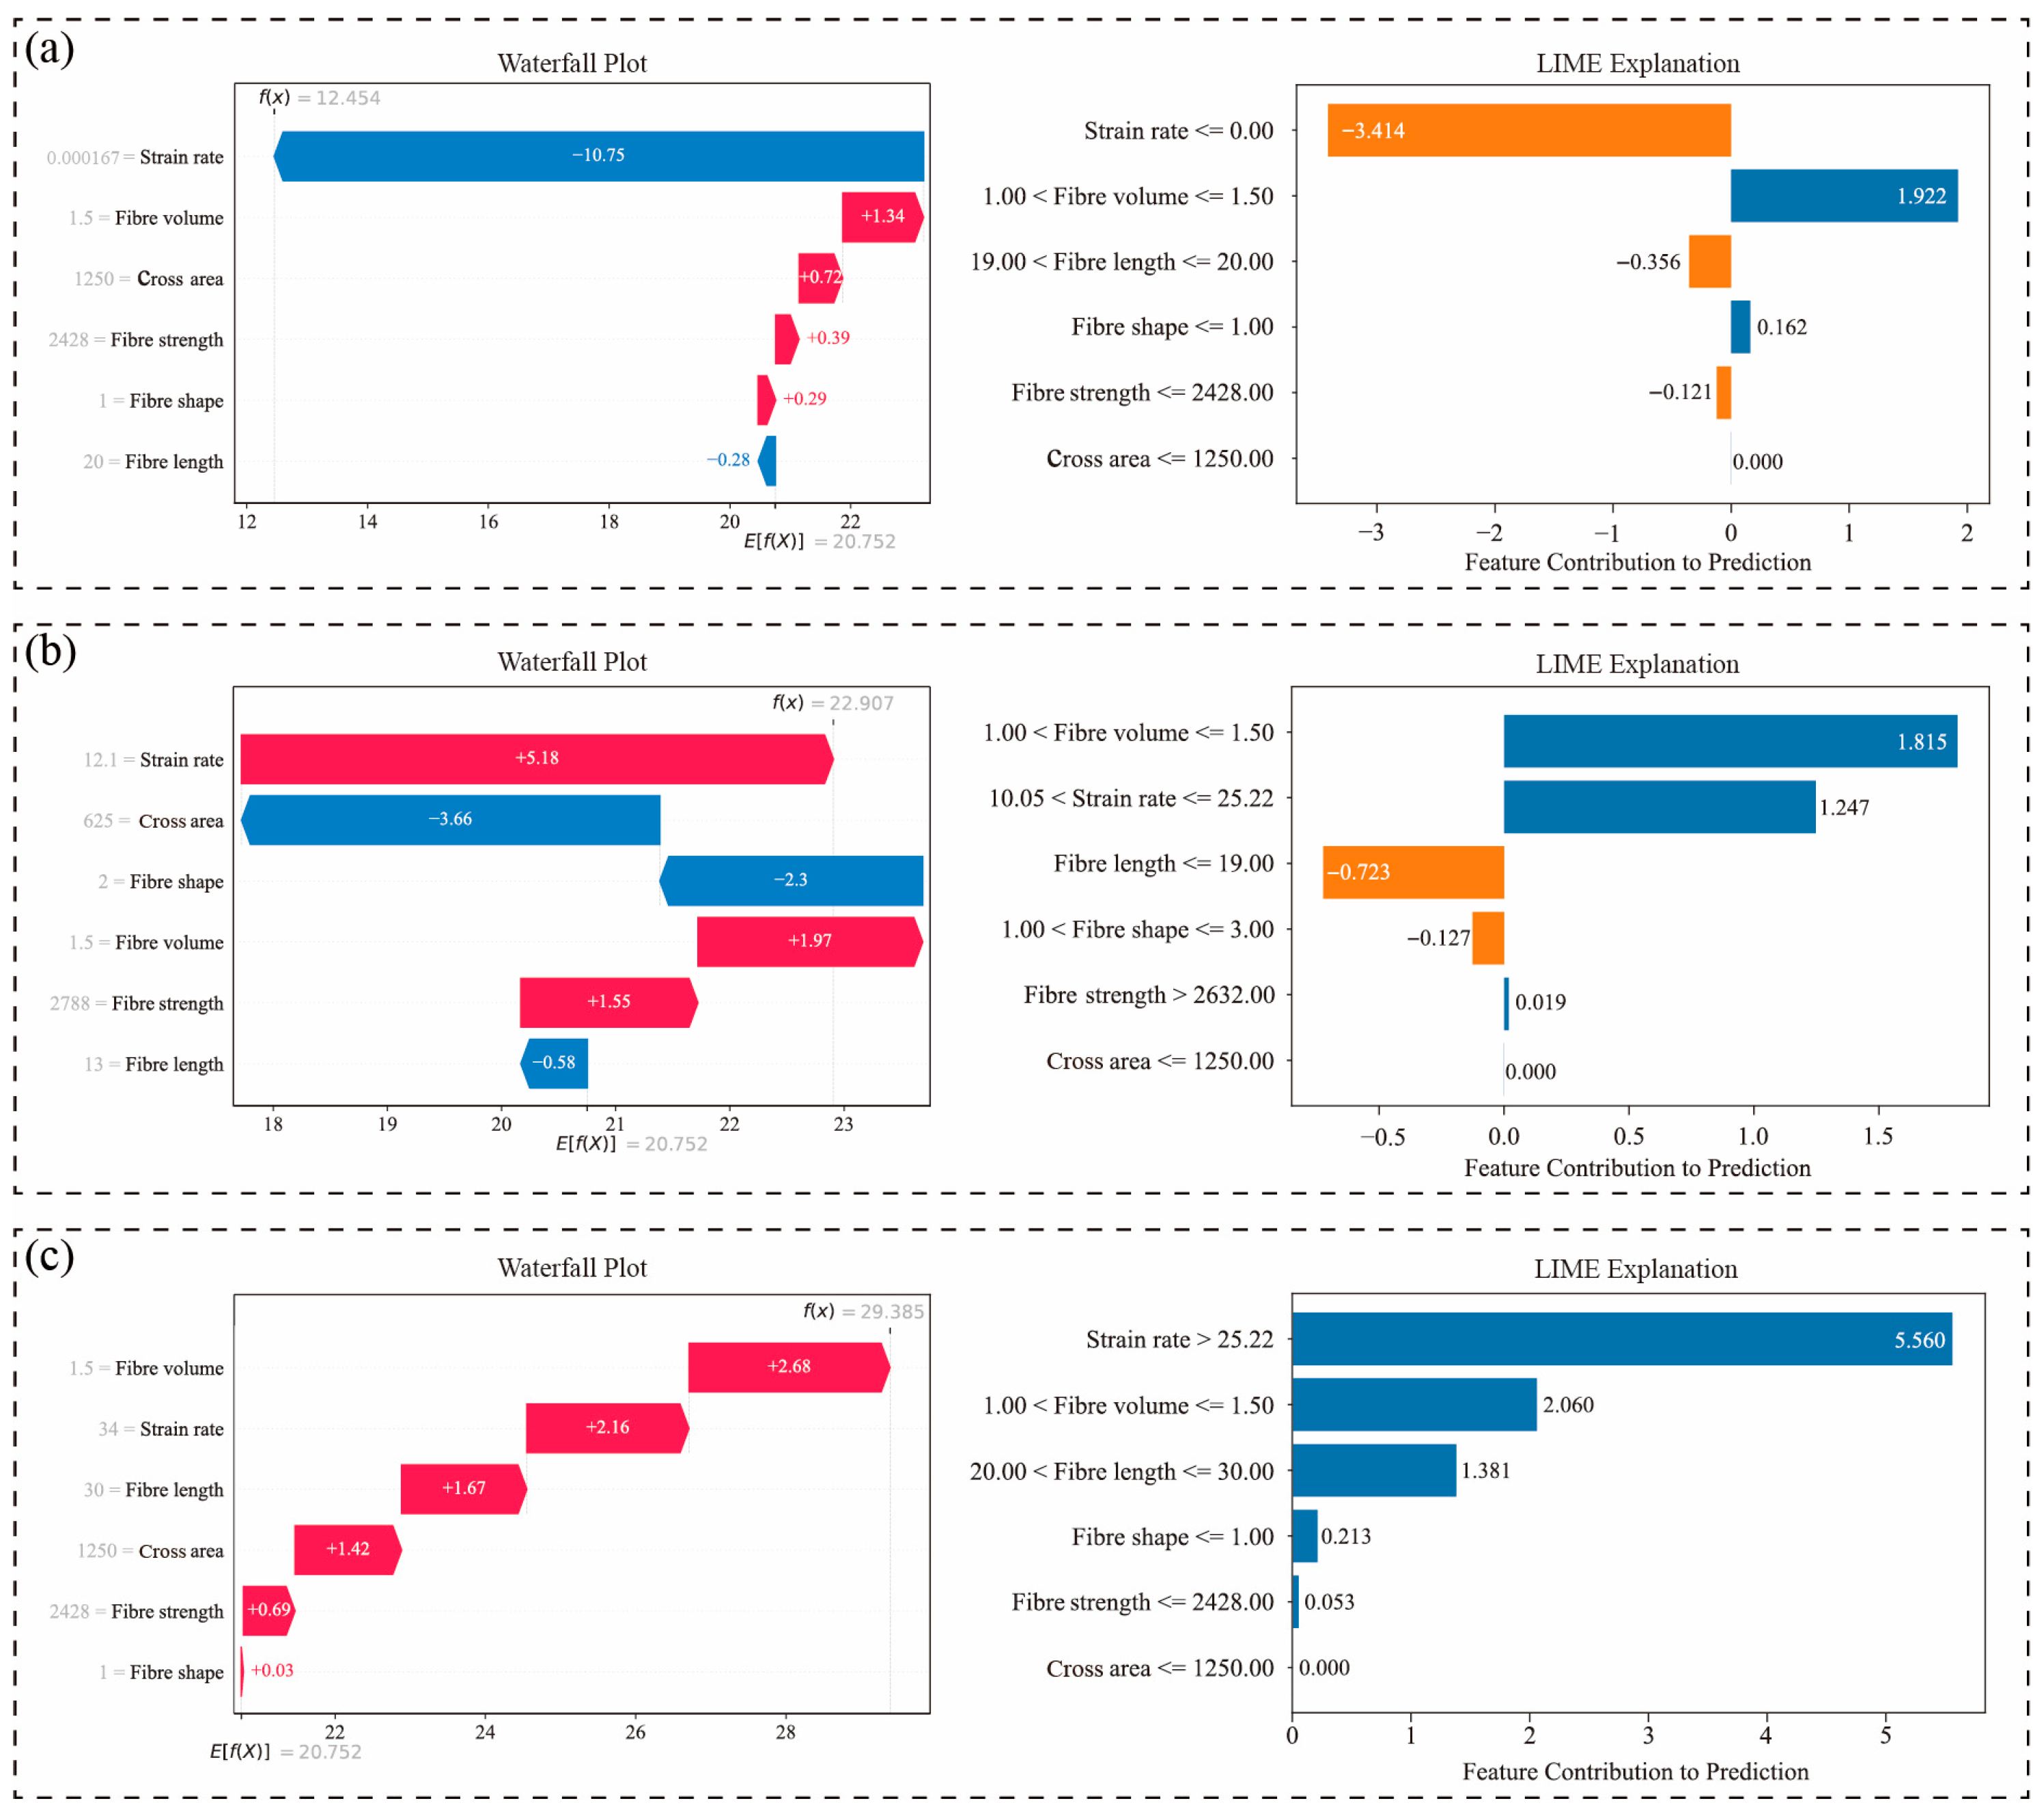
- Local interpretability analysis reveals that strain rate exerts a pronounced nonlinear and stage-dependent effect on the predicted fracture strength of HPFRC. Within the low-strain-rate regime (0–8 s−1), SHAP values shift from negative to positive, indicating a transition from strength suppression to enhancement as loading rate increases. Within the intermediate-strain-rate regime (8–30 s−1), strain rate continues to make a stable and significant positive contribution to strength prediction, suggesting that this interval corresponds to the most prominent phase of dynamic strengthening. Once the strain rate exceeds 30 s−1, SHAP values gradually decline, while the importance of structural features, such as fiber volume fraction and tensile strength, increases, indicating a shift in the governing mechanism from loading-rate sensitivity to material-property dominance.
Author Contributions
Funding
Data Availability Statement
Conflicts of Interest
References
- Tran, T.K.; Kim, D.J.; Choi, E. Behavior of Double-Edge-Notched Specimens Made of High Performance Fiber Reinforced Cementitious Composites Subject to Direct Tensile Loading with High Strain Rates. Cem. Concr. Res. 2014, 63, 54–66. [Google Scholar] [CrossRef]
- Tran, N.T.; Tran, T.K.; Kim, D.J. High Rate Response of Ultra-High-Performance Fiber-Reinforced Concretes under Direct Tension. Cem. Concr. Res. 2015, 69, 72–87. [Google Scholar] [CrossRef]
- Pyo, S.; El-Tawil, S.; Naaman, A.E. Direct Tensile Behavior of Ultra High Performance Fiber Reinforced Concrete (UHP-FRC) at High Strain Rates. Cem. Concr. Res. 2016, 88, 144–156. [Google Scholar] [CrossRef]
- Al-Osta, M.A. Exploitation of Ultrahigh-Performance Fibre-Reinforced Concrete for the Strengthening of Concrete Structural Members. Adv. Civ. Eng. 2018, 2018, 8678124. [Google Scholar] [CrossRef]
- Nguyen, D.L.; Ryu, G.S.; Koh, K.T.; Kim, D.J. Size and Geometry Dependent Tensile Behavior of Ultra-High-Performance Fiber-Reinforced Concrete. Compos. B Eng. 2014, 58, 279–292. [Google Scholar] [CrossRef]
- Saeed, F.H.; Hejazi, F. A Comprehensive Review of Retrofitted Reinforced Concrete Members Utilizing Ultra-High-Performance Fiber-Reinforced Concrete. Materials 2025, 18, 945. [Google Scholar] [CrossRef]
- Sovják, R.; Máca, P.; Imlauf, T. Effect of Fibre Length on the Fracture Energy of UHPFRC. Procedia Eng. 2017, 193, 74–79. [Google Scholar] [CrossRef]
- Cai, X.; Zhou, Z.; Zang, H.; Song, Z. Water saturation effects on dynamic behavior and microstructure damage of sandstone: Phenomena and mechanisms. Eng. Geol. 2020, 276, 105760. [Google Scholar] [CrossRef]
- Cai, X.; Yuan, J.; Zhou, Z.; Wang, Y.; Chen, L.; Liu, Y.; Wang, S. Strain rate-dependency of thermal infrared radiation of sandstone subjected to dynamic loading: Insights from a lab testing. Int. J. Rock Mech. Min. Sci. 2024, 181, 105855. [Google Scholar] [CrossRef]
- Ashkezari, G.D.; Fotouhi, F.; Razmara, M. Experimental Relationships between Steel Fiber Volume Fraction and Mechanical Properties of Ultra-High Performance Fiber-Reinforced Concrete. J. Build. Eng. 2020, 32, 101613. [Google Scholar] [CrossRef]
- Tran, N.T.; Tran, T.K.; Jeon, J.K.; Park, J.K.; Kim, D.J. Fracture Energy of Ultra-High-Performance Fiber-Reinforced Concrete at High Strain Rates. Cem. Concr. Res. 2016, 79, 169–184. [Google Scholar] [CrossRef]
- Tran, T.K.; Kim, D.J. Investigating Direct Tensile Behavior of High Performance Fiber Reinforced Cementitious Composites at High Strain Rates. Cem. Concr. Res. 2013, 50, 62–73. [Google Scholar] [CrossRef]
- Wahba, K.; Marzouk, H. The Use of FBG Sensor to Determine the Fracture Energy Properties of UHPFC. In Proceedings of the Workshop on Civil Structural Health Monitoring (CSHM-4), Berlin, Germany, 6–8 November 2012. [Google Scholar]
- Dang, V.P.; Kim, D.J. Fracture Resistance of Ultra-High-Performance Fiber-Reinforced Concrete Containing Nanoparticles at High Strain Rates. Eng. Fract. Mech. 2023, 289, 109436. [Google Scholar] [CrossRef]
- Nguyen, Q.D.; Nguyen, K.T.; Tran, T.K.; Lee, K.; Huynh, A.T. Fracture Behaviour Assessment of High-Performance Fibre-Reinforced Concrete at High Strain Rates Using Interpretable Modelling Approaches. Heliyon 2024, 10, e24704. [Google Scholar] [CrossRef]
- Nguyen, D.L.; Phan, T.D. Predicting the Compressive Strength of Ultra-High-Performance Concrete: An Ensemble Machine Learning Approach and Actual Application. Asian J. Civ. Eng. 2024, 25, 3363–3377. [Google Scholar] [CrossRef]
- Zheng, D.; Wu, R.; Sufian, M.; Ben Kahla, N.; Atig, M.; Deifalla, A.F.; Accouche, O.; Azab, M. Flexural Strength Prediction of Steel Fiber-Reinforced Concrete Using Artificial Intelligence. Materials 2022, 15, 5194. [Google Scholar] [CrossRef]
- Ekanayake, I.U.; Meddage, D.P.P.; Rathnayake, U. A Novel Approach to Explain the Black-Box Nature of Machine Learning in Compressive Strength Predictions of Concrete Using Shapley Additive Explanations (SHAP). Case Stud. Constr. Mater. 2022, 16, e01059. [Google Scholar] [CrossRef]
- Abuodeh, O.R.; Abdalla, J.A.; Hawileh, R.A. Assessment of Compressive Strength of Ultra-High Performance Concrete Using Deep Machine Learning Techniques. Appl. Soft Comput. 2020, 95, 106552. [Google Scholar] [CrossRef]
- Su, N.; Guo, S.; Shi, C.; Zhu, D. Predictions of Mechanical Properties of Fiber Reinforced Concrete Using Ensemble Learning Models. J. Build. Eng. 2024, 98, 110990. [Google Scholar] [CrossRef]
- Sill, J.; Takacs, G.; Mackey, L.; Lin, D. Feature-Weighted Linear Stacking. arXiv 2009, arXiv:0911.0460. [Google Scholar] [CrossRef]
- Altman, N.S. An Introduction to Kernel and Nearest-Neighbor. Am. Stat. 1992, 46, 175–185. [Google Scholar] [CrossRef]
- Breiman, L. Random Forests. Mach. Learn. 2001, 45, 5–32. [Google Scholar] [CrossRef]
- Yuvaraj, P.; Ramachandra Murthy, A.; Iyer, N.R.; Sekar, S.K.; Samui, P. Support vector regression based models to predict fracture characteristics of high strength and ultra high strength concrete beams. Eng. Fract. Mech. 2013, 98, 29–43. [Google Scholar] [CrossRef]
- Ke, G.; Meng, Q.; Finley, T.; Wang, T.; Chen, W.; Ma, W.; Ye, Q.; Liu, T.Y. LightGBM: A Highly Efficient Gradient Boosting Decision Tree. In Proceedings of the 31st International Conference on Neural Information Processing Systems (NeurIPS), Long Beach, CA, USA, 4–9 December 2017; pp. 3146–3154. [Google Scholar]
- Chen, T.; Guestrin, C. XGBoost: A Scalable Tree Boosting System. In Proceedings of the 22nd ACM SIGKDD International Conference on Knowledge Discovery and Data Mining, San Francisco, CA, USA, 13–17 August 2016; pp. 785–794. [Google Scholar]
- Rumelhart, D.E.; Hinton, G.E.; Williams, R.J. Learning Representations by Back-Propagating Errors. Nature 1986, 323, 533–536. [Google Scholar] [CrossRef]
- Chicco, D.; Warrens, M.J.; Jurman, G. The Coefficient of Determination R-Squared Is More Informative than SMAPE, MAE, MAPE, MSE and RMSE in Regression Analysis Evaluation. PeerJ Comput. Sci. 2021, 7, e623. [Google Scholar] [CrossRef]
- Delobelle, P.; Attanasio, G.; Nozza, D.; Blodgett, S.L.; Talat, Z. Metrics for What, Metrics for Whom: Assessing Actionability of Bias Evaluation Metrics in NLP. In Proceedings of the 2024 Conference on Empirical Methods in Natural Language Processing, Miami, FL, USA, 12–16 November 2024; pp. 21669–21691. [Google Scholar] [CrossRef]
- Futagami, K.; Fukazawa, Y.; Kapoor, N.; Kito, T. Pairwise Acquisition Prediction with SHAP Value Interpretation. J. Financ. Data Sci. 2021, 7, 22–44. [Google Scholar] [CrossRef]
- Zafar, M.R.; Khan, N. Deterministic Local Interpretable Model-Agnostic Explanations for Stable Explainability. Mach. Learn. Knowl. Extr. 2021, 3, 525–541. [Google Scholar] [CrossRef]
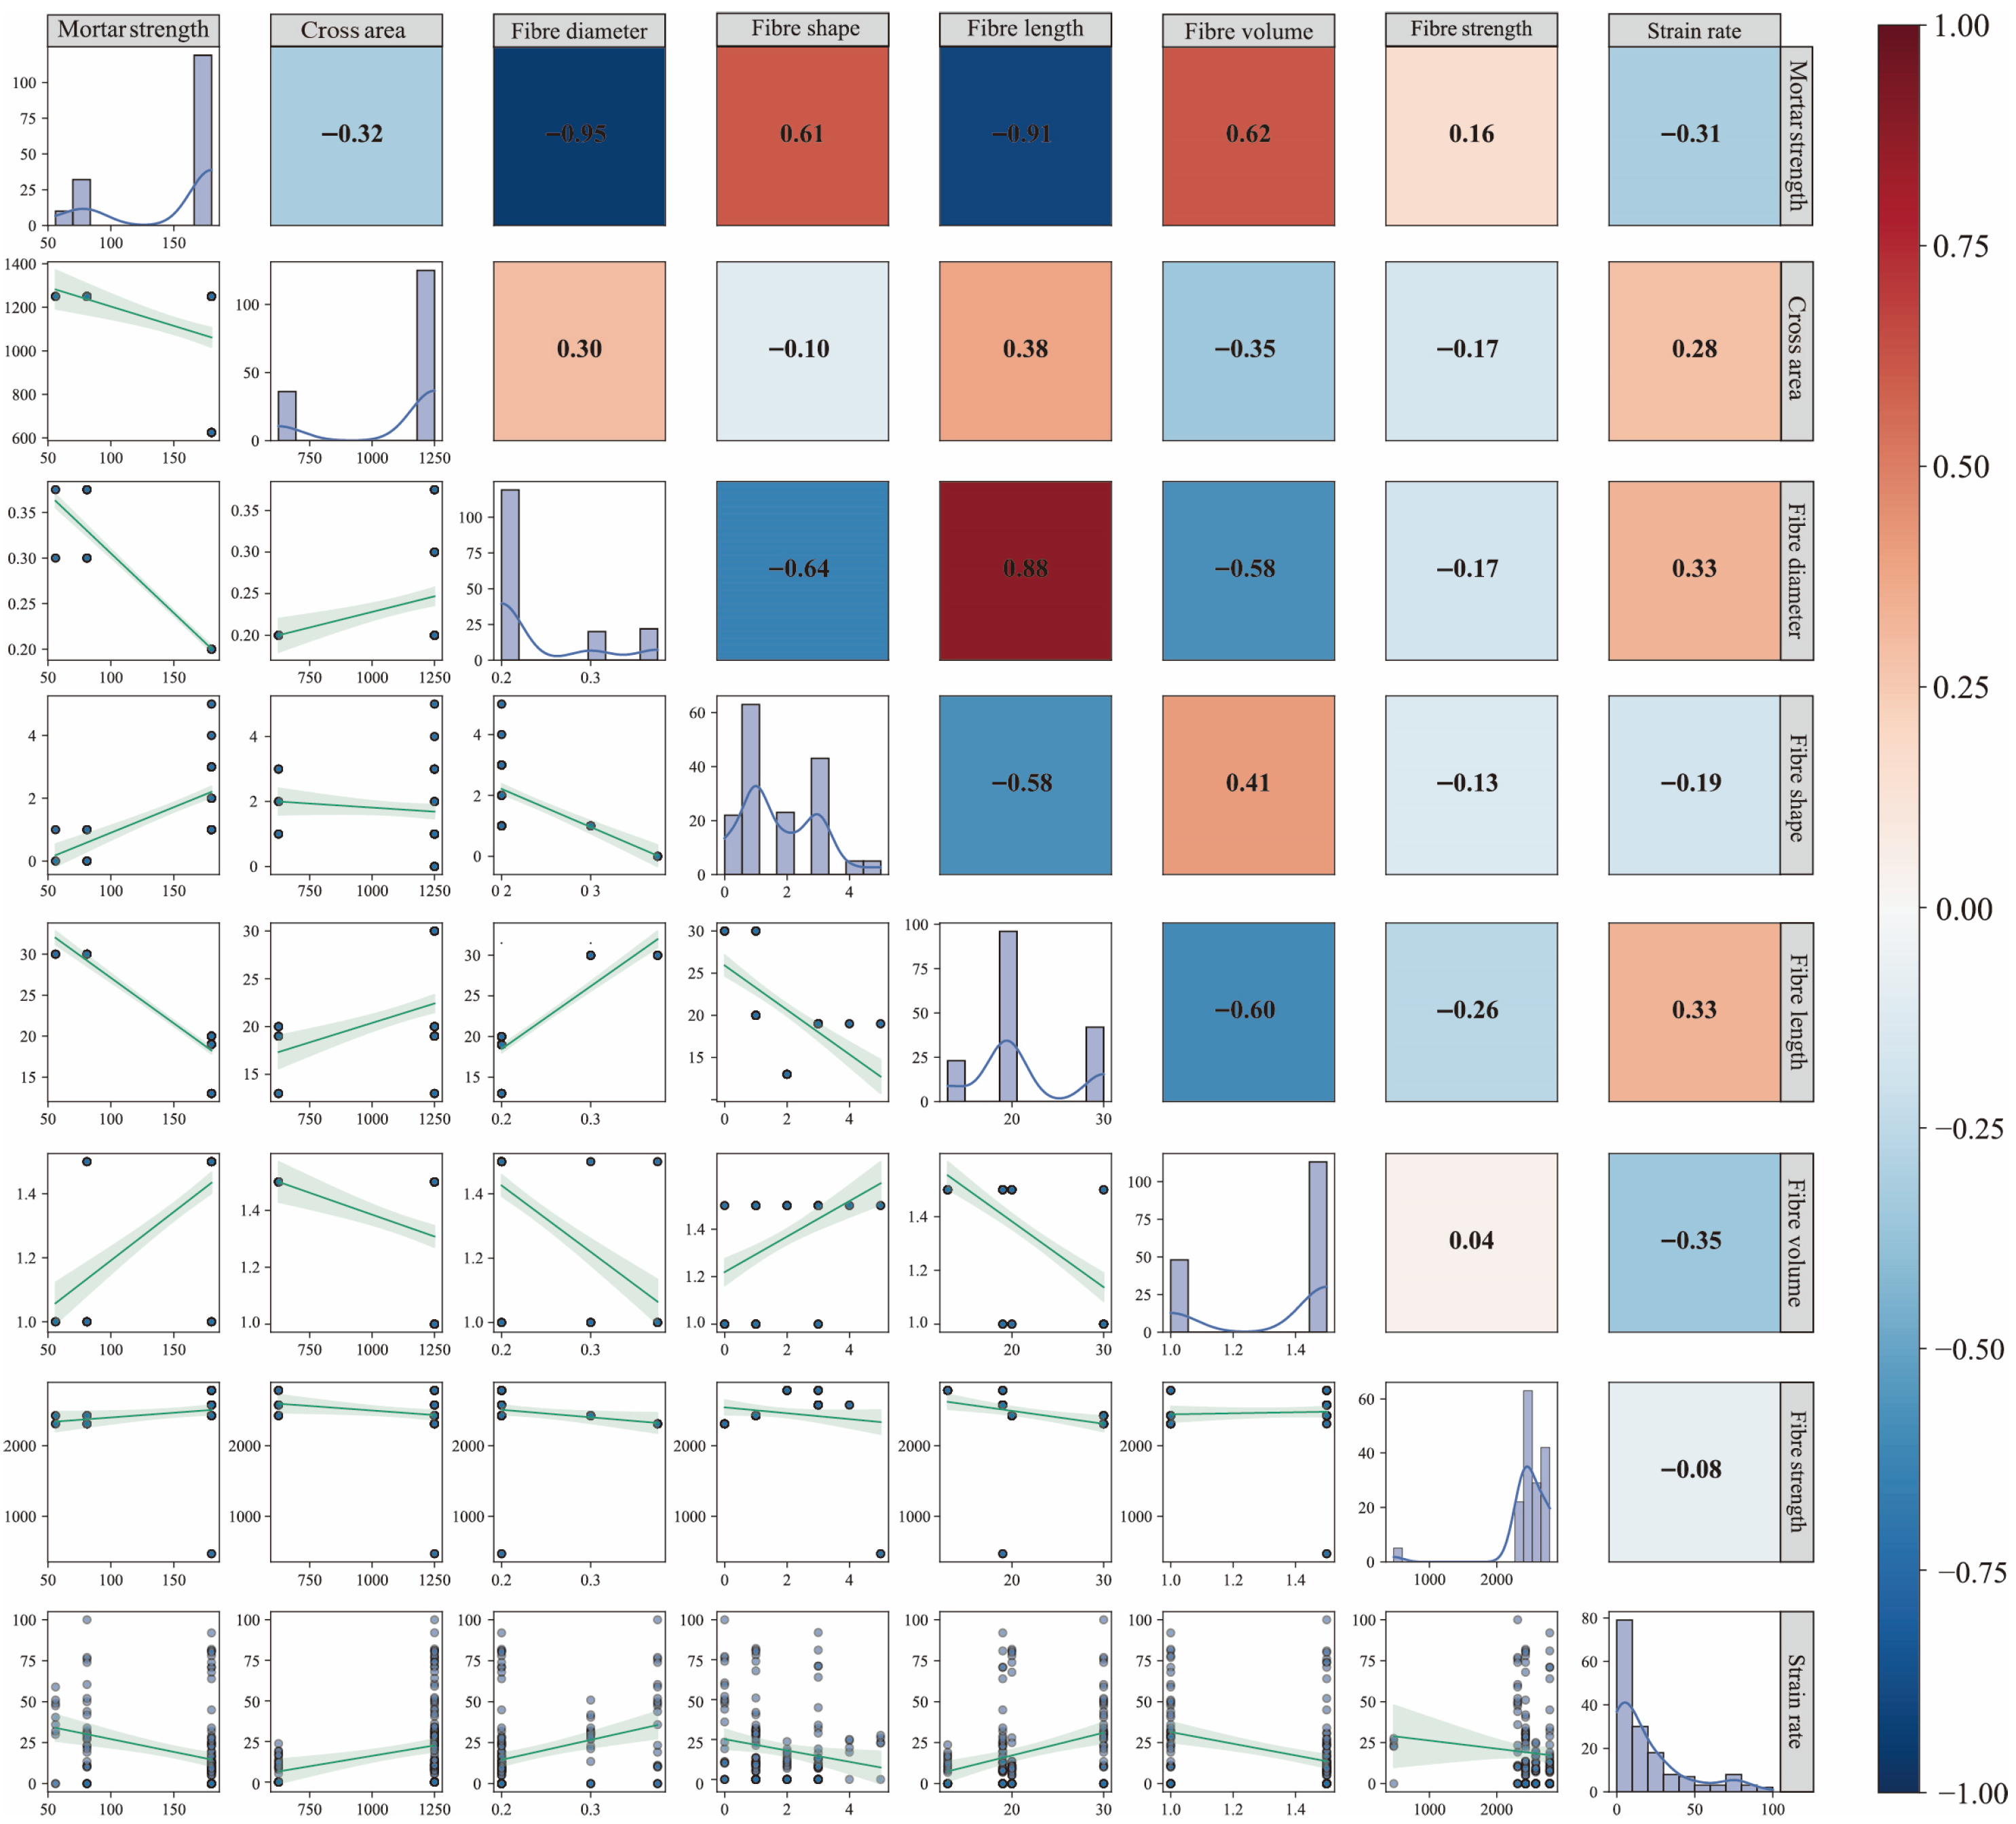


| Category | Variable | Unit | Min | Max | Mean |
|---|---|---|---|---|---|
| Input | Mortar compressive strength | MPa | 56.00 | 180.00 | 152.62 |
| Specimen cross-sectional area | mm2 | 625.00 | 1250.00 | 1110.25 | |
| Fiber diameter | mm | 0.20 | 0.38 | 0.24 | |
| Fiber shape | - | Hooked, twisted, long smooth, short smooth, Hybrid * | |||
| Fiber length | mm | 13.00 | 30.00 | 21.28 | |
| Fiber volume | % | 1.00 | 1.50 | 1.35 | |
| Fiber tensile strength | MPa | 470.00 | 2788.00 | 2472.50 | |
| Strain rate | s−1 | 0.000167 | 100.00 | 18.97 | |
| Output | Fracture strength | MPa | 6.00 | 45.00 | 20.66 |
Disclaimer/Publisher’s Note: The statements, opinions and data contained in all publications are solely those of the individual author(s) and contributor(s) and not of MDPI and/or the editor(s). MDPI and/or the editor(s) disclaim responsibility for any injury to people or property resulting from any ideas, methods, instructions or products referred to in the content. |
© 2025 by the authors. Licensee MDPI, Basel, Switzerland. This article is an open access article distributed under the terms and conditions of the Creative Commons Attribution (CC BY) license (https://creativecommons.org/licenses/by/4.0/).
Share and Cite
Cai, X.; Wang, Y.; Zhao, Y.; Chen, L.; Yuan, J. Dynamic Fracture Strength Prediction of HPFRC Using a Feature-Weighted Linear Ensemble Approach. Materials 2025, 18, 4097. https://doi.org/10.3390/ma18174097
Cai X, Wang Y, Zhao Y, Chen L, Yuan J. Dynamic Fracture Strength Prediction of HPFRC Using a Feature-Weighted Linear Ensemble Approach. Materials. 2025; 18(17):4097. https://doi.org/10.3390/ma18174097
Chicago/Turabian StyleCai, Xin, Yunmin Wang, Yihan Zhao, Liye Chen, and Jifeng Yuan. 2025. "Dynamic Fracture Strength Prediction of HPFRC Using a Feature-Weighted Linear Ensemble Approach" Materials 18, no. 17: 4097. https://doi.org/10.3390/ma18174097
APA StyleCai, X., Wang, Y., Zhao, Y., Chen, L., & Yuan, J. (2025). Dynamic Fracture Strength Prediction of HPFRC Using a Feature-Weighted Linear Ensemble Approach. Materials, 18(17), 4097. https://doi.org/10.3390/ma18174097


