3.1. Interaction Energy of γ–FeOOH/CSH Interface
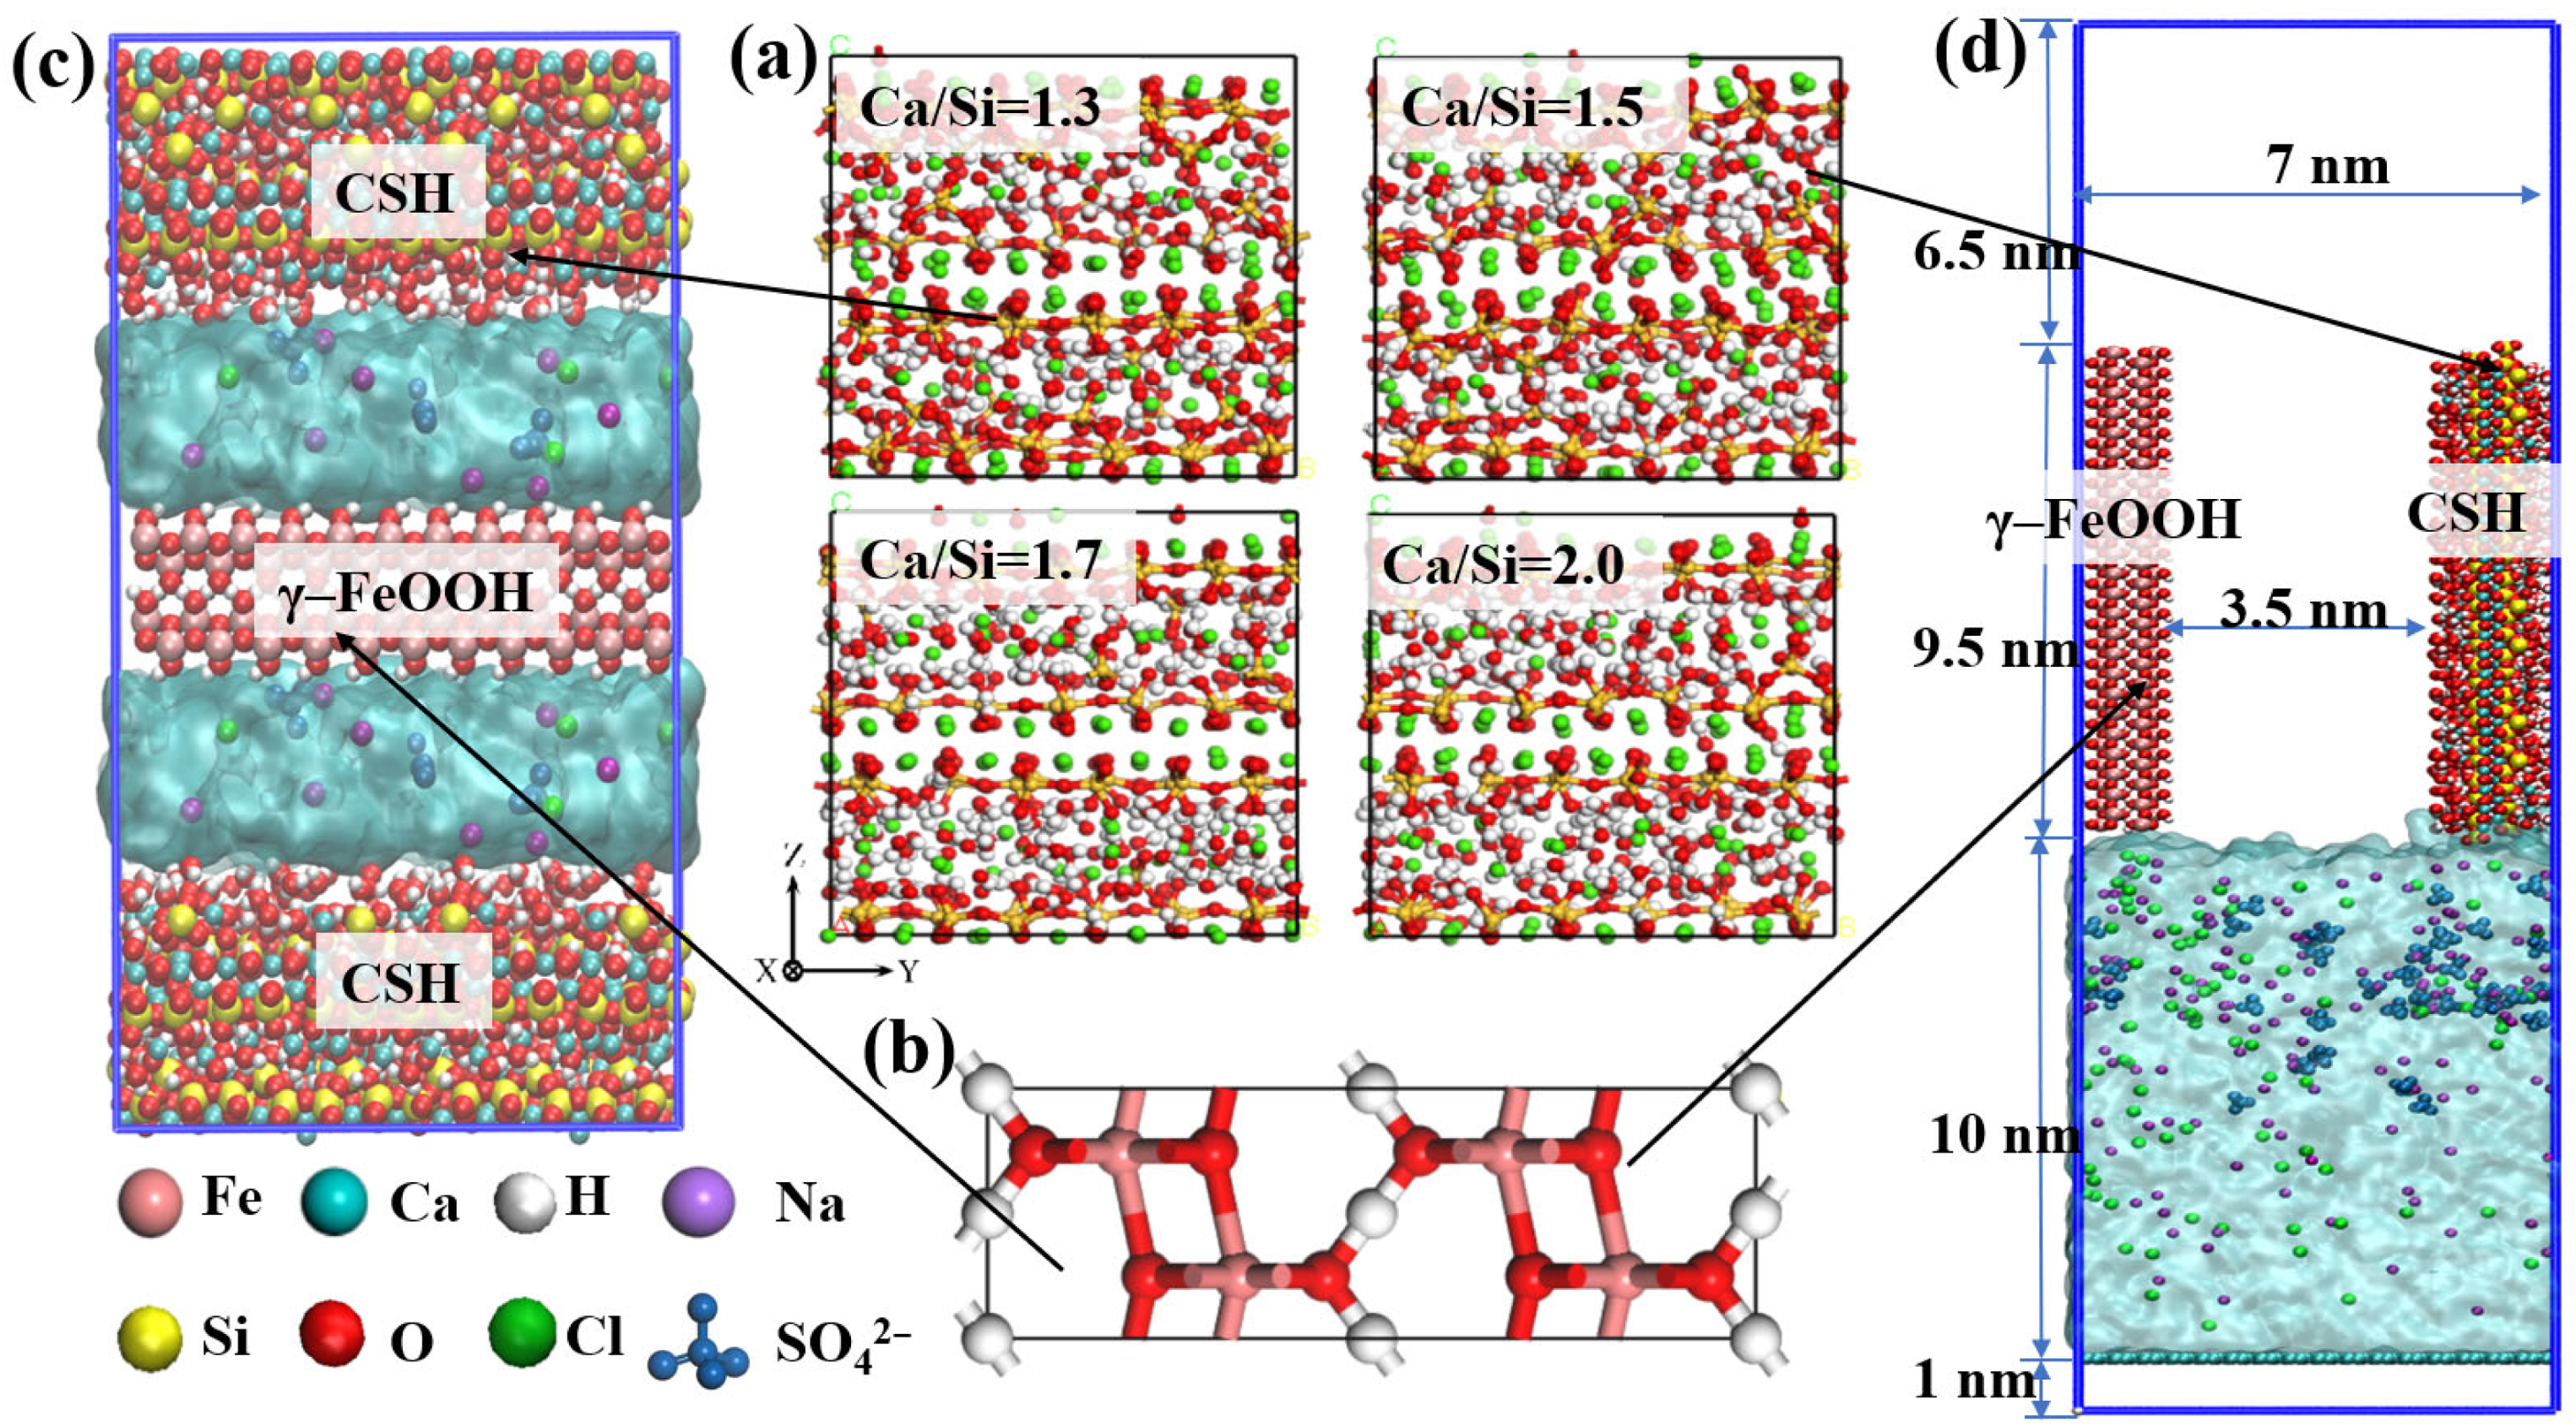
Interaction energy refers to the energy generated between molecules or atoms due to the interaction of various force fields (such as van der Waals forces, Coulomb forces, hydrogen bonds, etc.), and it is an important physical quantity that describes the strength of the interaction between molecules. To investigate interfacial adhesion properties of γ–FeOOH/CSH systems with varying Ca/Si ratios of 1.3, 1.5, 1.7, and 2.0, the unit area interaction energies between different components were calculated, using the following equation. The computational results are presented and analyzed below.
where
E1/2 denotes the interaction energy per unit area between components 1 and 2;
Etotal is the total energy of the system containing both components;
E1 and
E2 are the individual energies of components 1 and 2, respectively, and
A1/2 represents the cross-sectional area between components 1 and 2. The calculated interaction energies are shown in
Figure 2.
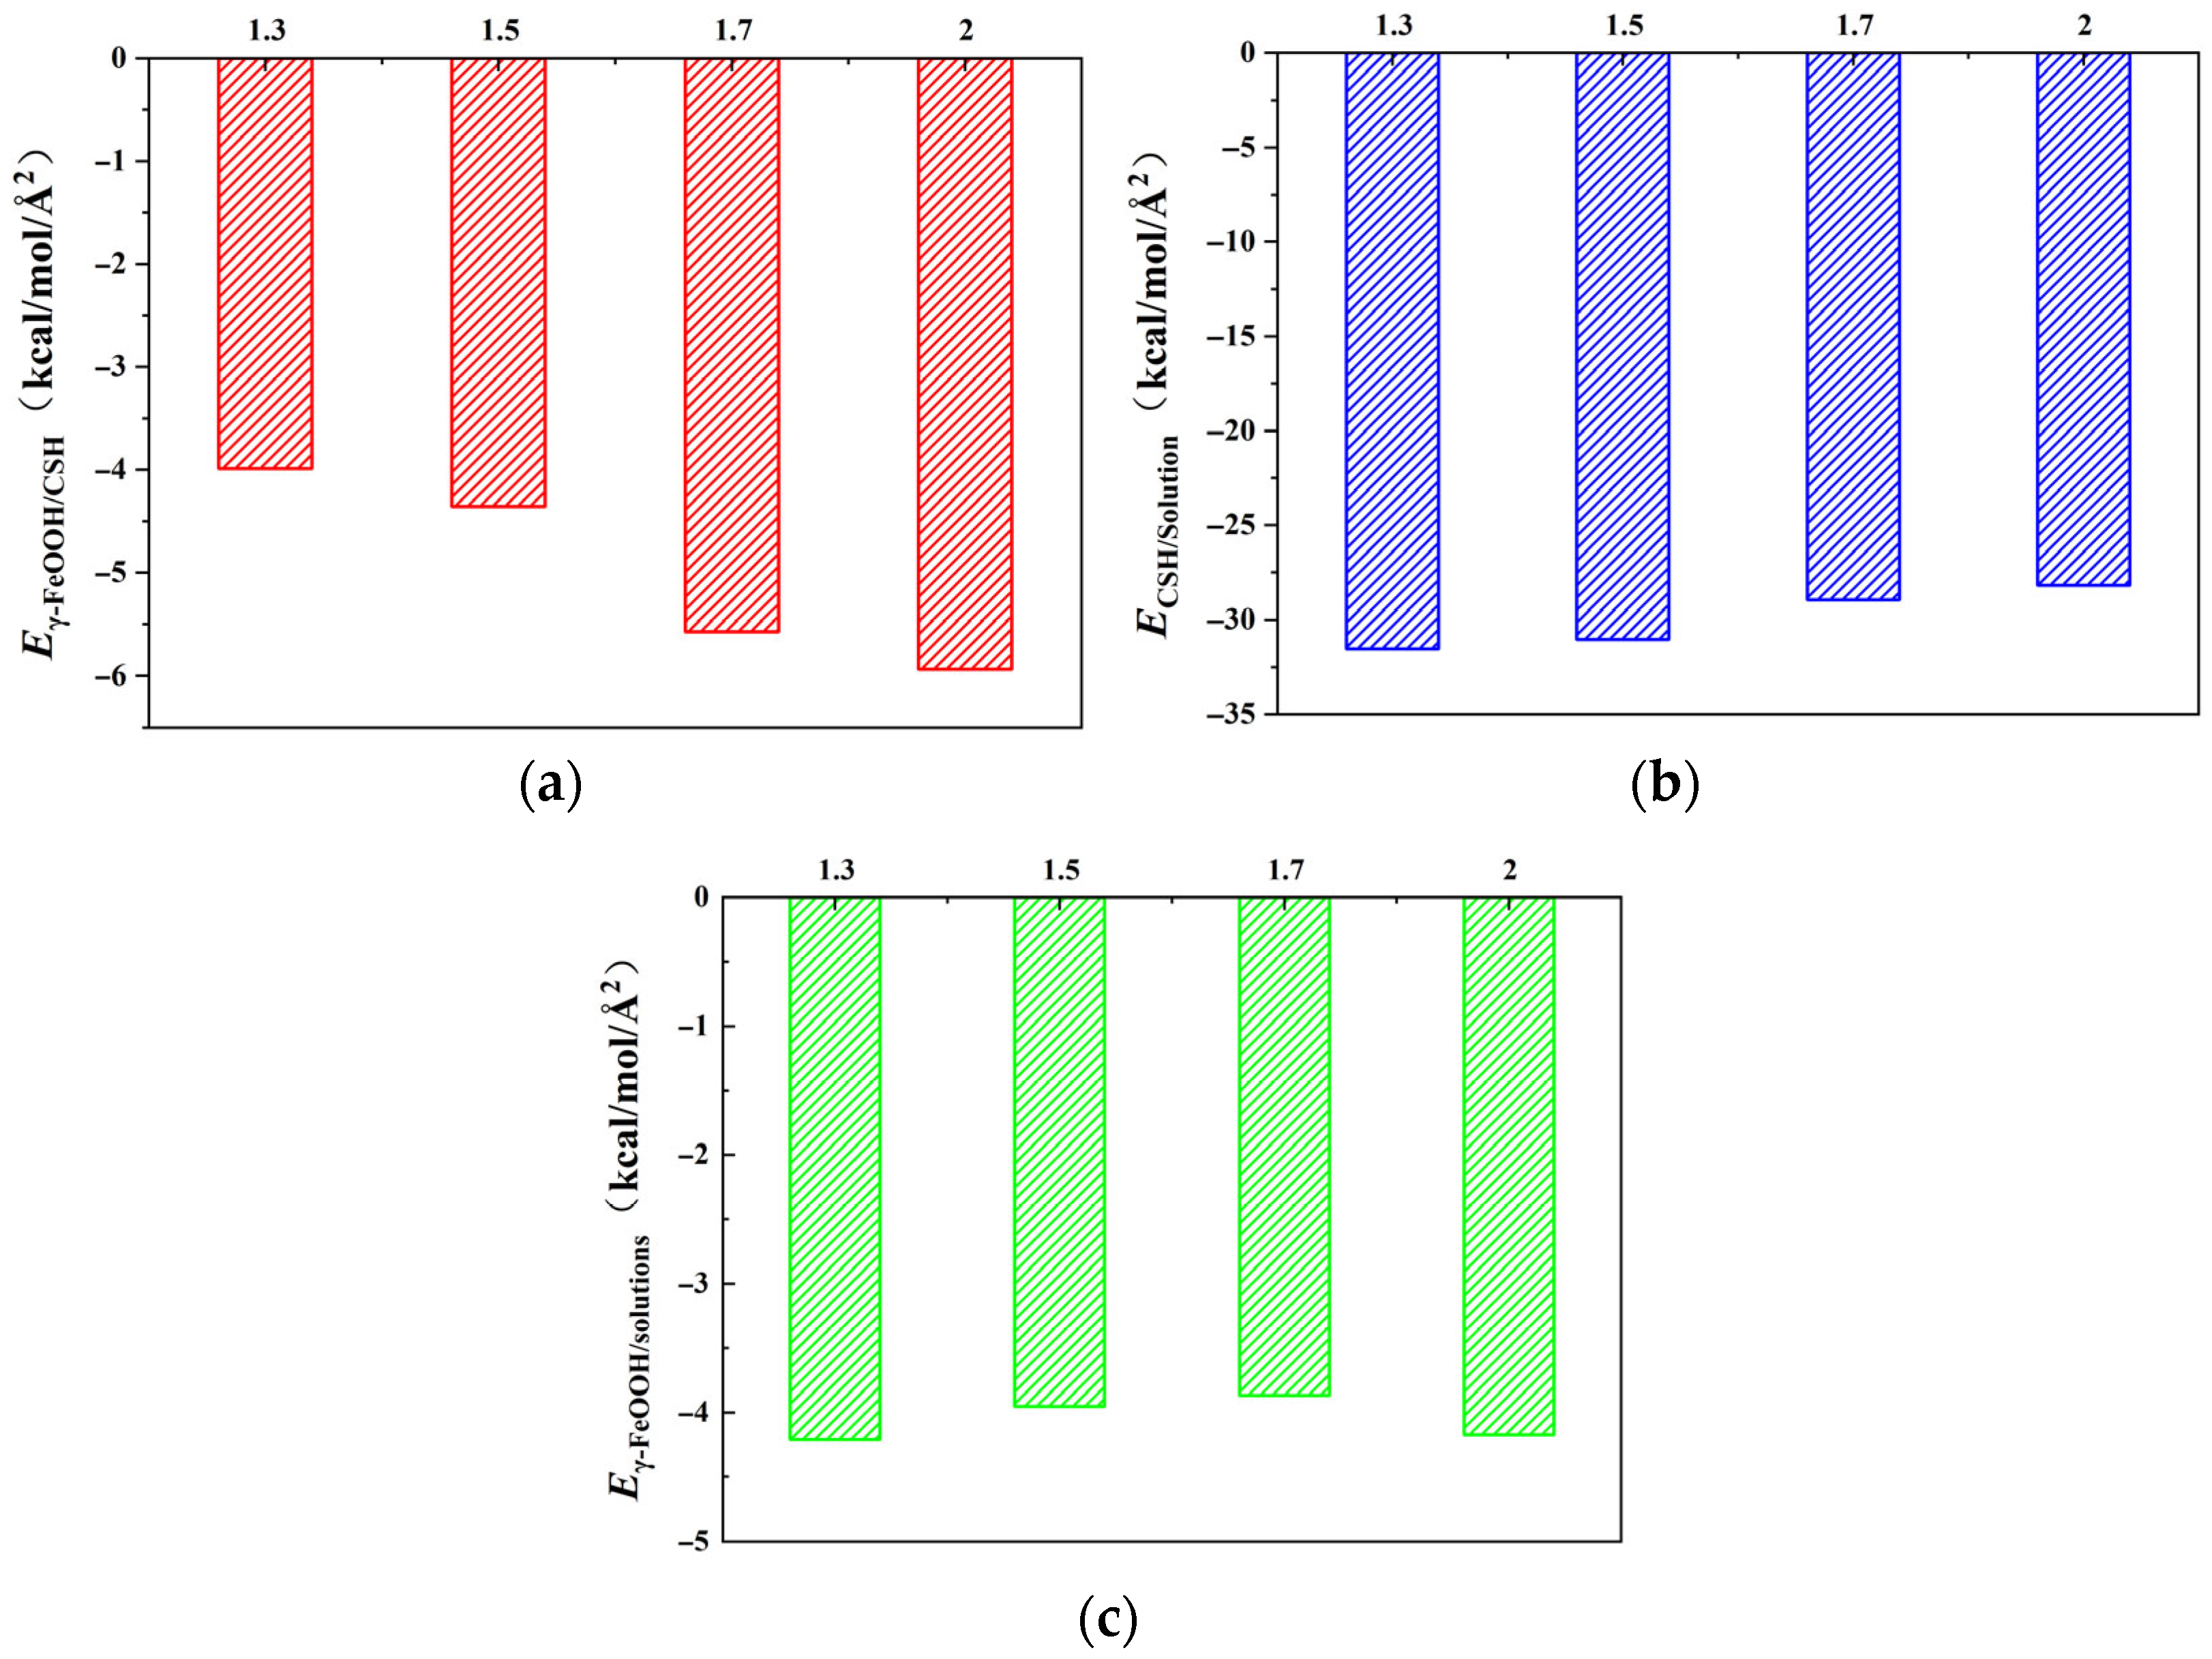
With the change of Ca/Si ratios, the interaction energies between each pair of components (γ–FeOOH/CSH, CSH/NaCl + Na2SO4 composite solution, and γ–FeOOH/solution) all exhibited a certain variation pattern. Eγ–FeOOH/CSH exhibited a gradual increase with increasing Ca/Si ratioe. When Ca/Si = 1.3, Eγ–FeOOH/CSH reached its minimum value of −3.987 kcal/mol·Å2. The negative value indicates mutual attraction between the two components. Eγ–FeOOH/CSH increased by 9.22%, 39.8%, and 48.7%, respectively, with increasing Ca/Si ratios. When Ca/Si = 2.0, Eγ–FeOOH/CSH reached a maximum of ECSH/solutions = −5.937 kcal/mol/Å2. Conversely, ECSH/solutions showed an opposite trend, with the maximum value of ECSH/solutions = −31.537 kcal/mol·Å2 observed at Ca/Si = 1.3. As the Ca/Si ratio increased, ECSH/solutions decreased by 1.56%, 8.15%, and 10.63%, respectively. Eγ–FeOOH/solutions remained relatively stable across different Ca/Si ratios, with values of −4.211, −3.952, −3.867, and −4.174 kcal/mol·Å2, indicating that structural variations in CSH had negligible effects on the interaction between γ–FeOOH and the corrosive solution.
The results above suggest that lower Ca/Si ratios in CSH promote stronger interactions with the NaCl + Na
2SO
4 composite solution, leading to increased adsorption of solution molecules on the CSH surface. This adsorption forms a solution barrier that hinders direct bonding between CSH and γ–FeOOH, consequently weakening their interfacial interaction [
42,
43]. In contrast, higher Ca/Si ratios facilitate stronger direct bonding between CSH and γ–FeOOH by reducing solution adsorption effects.
From the perspective of energy, the stronger attraction between CSH and γ–FeOOH in
Figure 2a promotes direct bonding at higher Ca/Si ratios, creating a denser interfacial zone that physically obstructs the penetration of water and ions. The energy barrier for solution molecules to disrupt this bonded interface is elevated, thereby reducing transport. In
Figure 2b, fewer solution molecules are adsorbed at higher Ca/Si ratios, diminishing the formation of a solution “barrier layer” near the interface. Consequently, the competitive effect of solution adsorption on CSH–γ–FeOOH bonding is suppressed, further favoring the direct CSH–γ–FeOOH interface. In
Figure 2c, the near-constant
Eγ–FeOOH/solutions values across Ca/Si ratios confirm that changes in transport properties are primarily governed by CSH’s structural evolution rather than γ–FeOOH’s affinity for the solution.
3.2. The Influence of Water Molecules on the Interfacial Adhesion Performance
The observed significant differences in interaction energy at γ–FeOOH/CSH interfaces with varying Ca/Si ratios under the same solution environment conditions warrant further mechanistic investigation. To elucidate the role of Ca/Si ratio in interfacial adhesion, CSH structures with different Ca/Si ratios were systematically analyzed through calculating the radial distribution function (RDF), coordination number (CN), and the number of hydrogen bond of Ca2+ ions and hydroxyl groups (Oh and Ho) in the exposed area of the CSH surface with water molecules in solution, and analyzing the bonding interactions of each component.
Firstly, the RDF and CN of Ca
2+ ions on the surface of CSH among the oxygen atoms (O
Water) in water molecules, the hydroxyl oxygen atoms in CSH, and oxygen atoms (O
h and O
s) in silicon chains were calculated, respectively. The bonding differences of Ca
2+ ions in the free regions of CSH structure surface under different Ca/Si ratios were characterized. The RDF curves between Ca
CSH and O
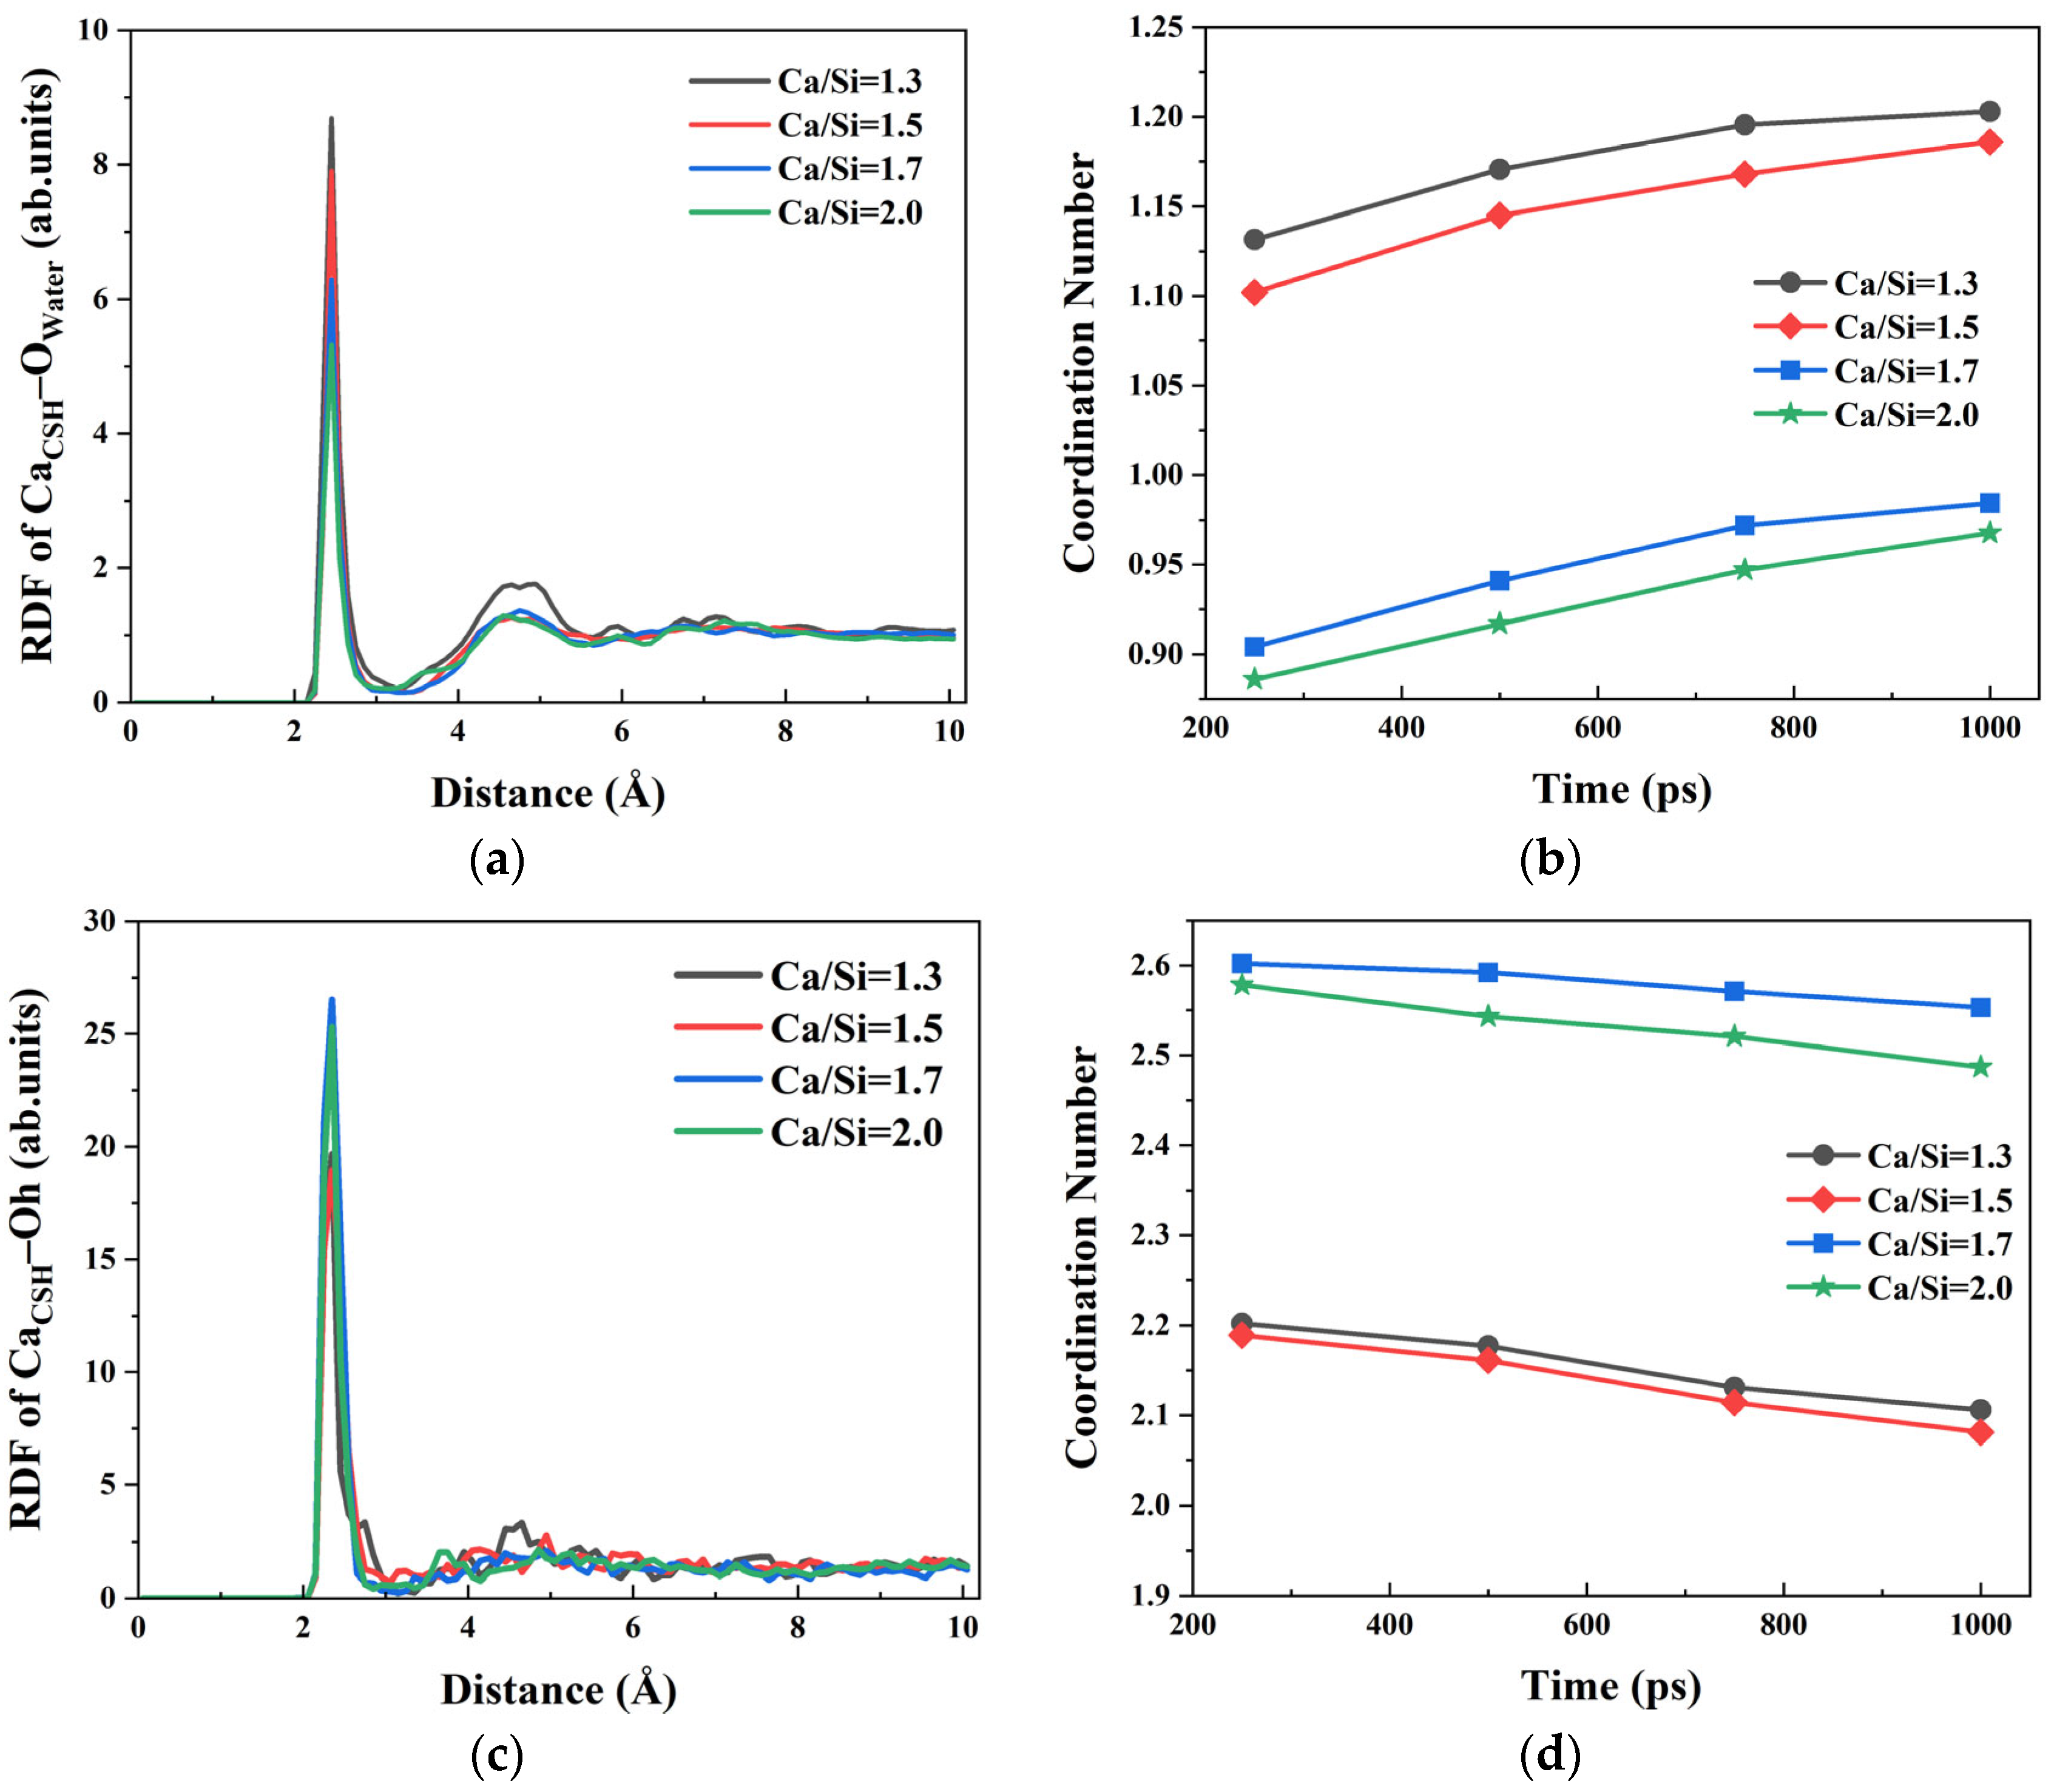
water under four different Ca/Si ratios revealed distinct bonding patterns, as shown in
Figure 3a. A primary peak appeared at 2.45 Å in RDF curve, indicating that free Ca
2+ ions on the CSH surface had a strong attraction effect on water molecules in the solution [
44]. RDF peak intensities of Ca
CSH–O
water decreased gradually from 8.688, 7.903, 6.288 to 5.315 as the Ca/Si ratio increased from 1.3, 1.5, 1.7 to 2.0. It denoted that the adsorption of Ca
2+ ions on water molecules was weakened at higher Ca/Si ratios, consistent with the variation trend of
ECSH/solutions mentioned in
Section 3.1. In addition, a secondary peak appeared at 4.55–4.95 Å near the primary peak of RDF curve, which demonstrates preserved long-range spatial correlations between Ca
2+ ions and O
water regardless of Ca/Si ratio variations.
To quantitatively characterize the Ca
CSH–O
water ionic bonding under varying Ca/Si ratios, the corresponding coordination numbers (CN) based on the RDF results were calculated (
Figure 3b). The temporal evolution of CN values reveals the following distinct phases. When
t = 0~800 ps, the CN value of Ca
CSH–O
water ion pairs exhibited a monotonic increase, indicating hydration of surface Ca
2+ ions progressively occurred. During the simulation process, the free Ca
2+ ions on the surface of CSH gradually absorbed water molecules and form Ca
CSH–O
water ionic bonds with water. When
t > 800 ps, the increase rate of the Ca
CSH–O
water CN value slowed down, reflecting the equilibrium state of the combination of CSH and water molecules in the solution. The four types of CSH with different Ca/Si ratios were compared. With the increase in the Ca/Si ratio, the CN value of Ca
CSH–O
water gradually decreased, indicating that the surface free Ca
2+ ions of the CSH structure with a high Ca/Si ratio had a weaker attraction to water, and the most pronounced reduction occurred when Ca/Si exceeded 1.5.
Although the variation trend of Ca
CSH–O
water exhibits a certain regularity, analysis of the original structural models of CSH with different Ca/Si ratios reveals that the higher Ca/Si ratios correspond to more hydroxyl groups in the structure. Therefore, in addition to bonding with oxygen atoms in the solution, the interaction between free Ca
2+ ions on CSH surface and hydroxyl oxygen atoms (O
h) within CSH warrants investigation. The RDF curve of Ca
CSH–O
h was calculated; results are presented in
Figure 3c. The primary peak for CSH appeared at 2.35 Å with different Ca/Si ratios and was more pronounced than the corresponding RDF peak of Ca
CSH–O
water. This indicates that Ca
2+ ions preferentially form Ca
CSH–O
h ionic bonds with O
h atoms rather than Ca
CSH–O
water bonds with water molecules. The CN values of Ca
CSH–O
h are shown in
Figure 3d. CSH with a higher Ca/Si ratio formed more Ca
CSH–O
h ion pairs. During the simulation, as water molecules accumulated towards the CSH surface, the number of Ca
CSH–O
h ion pairs decreased slightly. When the Ca/Si ratio was the same, the CN values of Ca
CSH–O
h consistently exceeded those of Ca
CSH–O
water, indicating that Ca
2+ ions were predominantly coordinated by O
h rather than O
water. This preference suggests stronger interactions between Ca
2+ ions and hydroxyl groups compared to water molecules in the CSH system.
Furthermore, as the Ca/Si ratio of CSH decreased, the number of silicon oxygen tetrahedra in the structure increased, enhancing the likelihood of Ca
2+ ions bonding with bridging oxygen atoms (O
s) in the tetrahedra, thereby impeding the formation of Ca
CSH–O
water ion pairs. The RDF curves of Ca
CSH–O
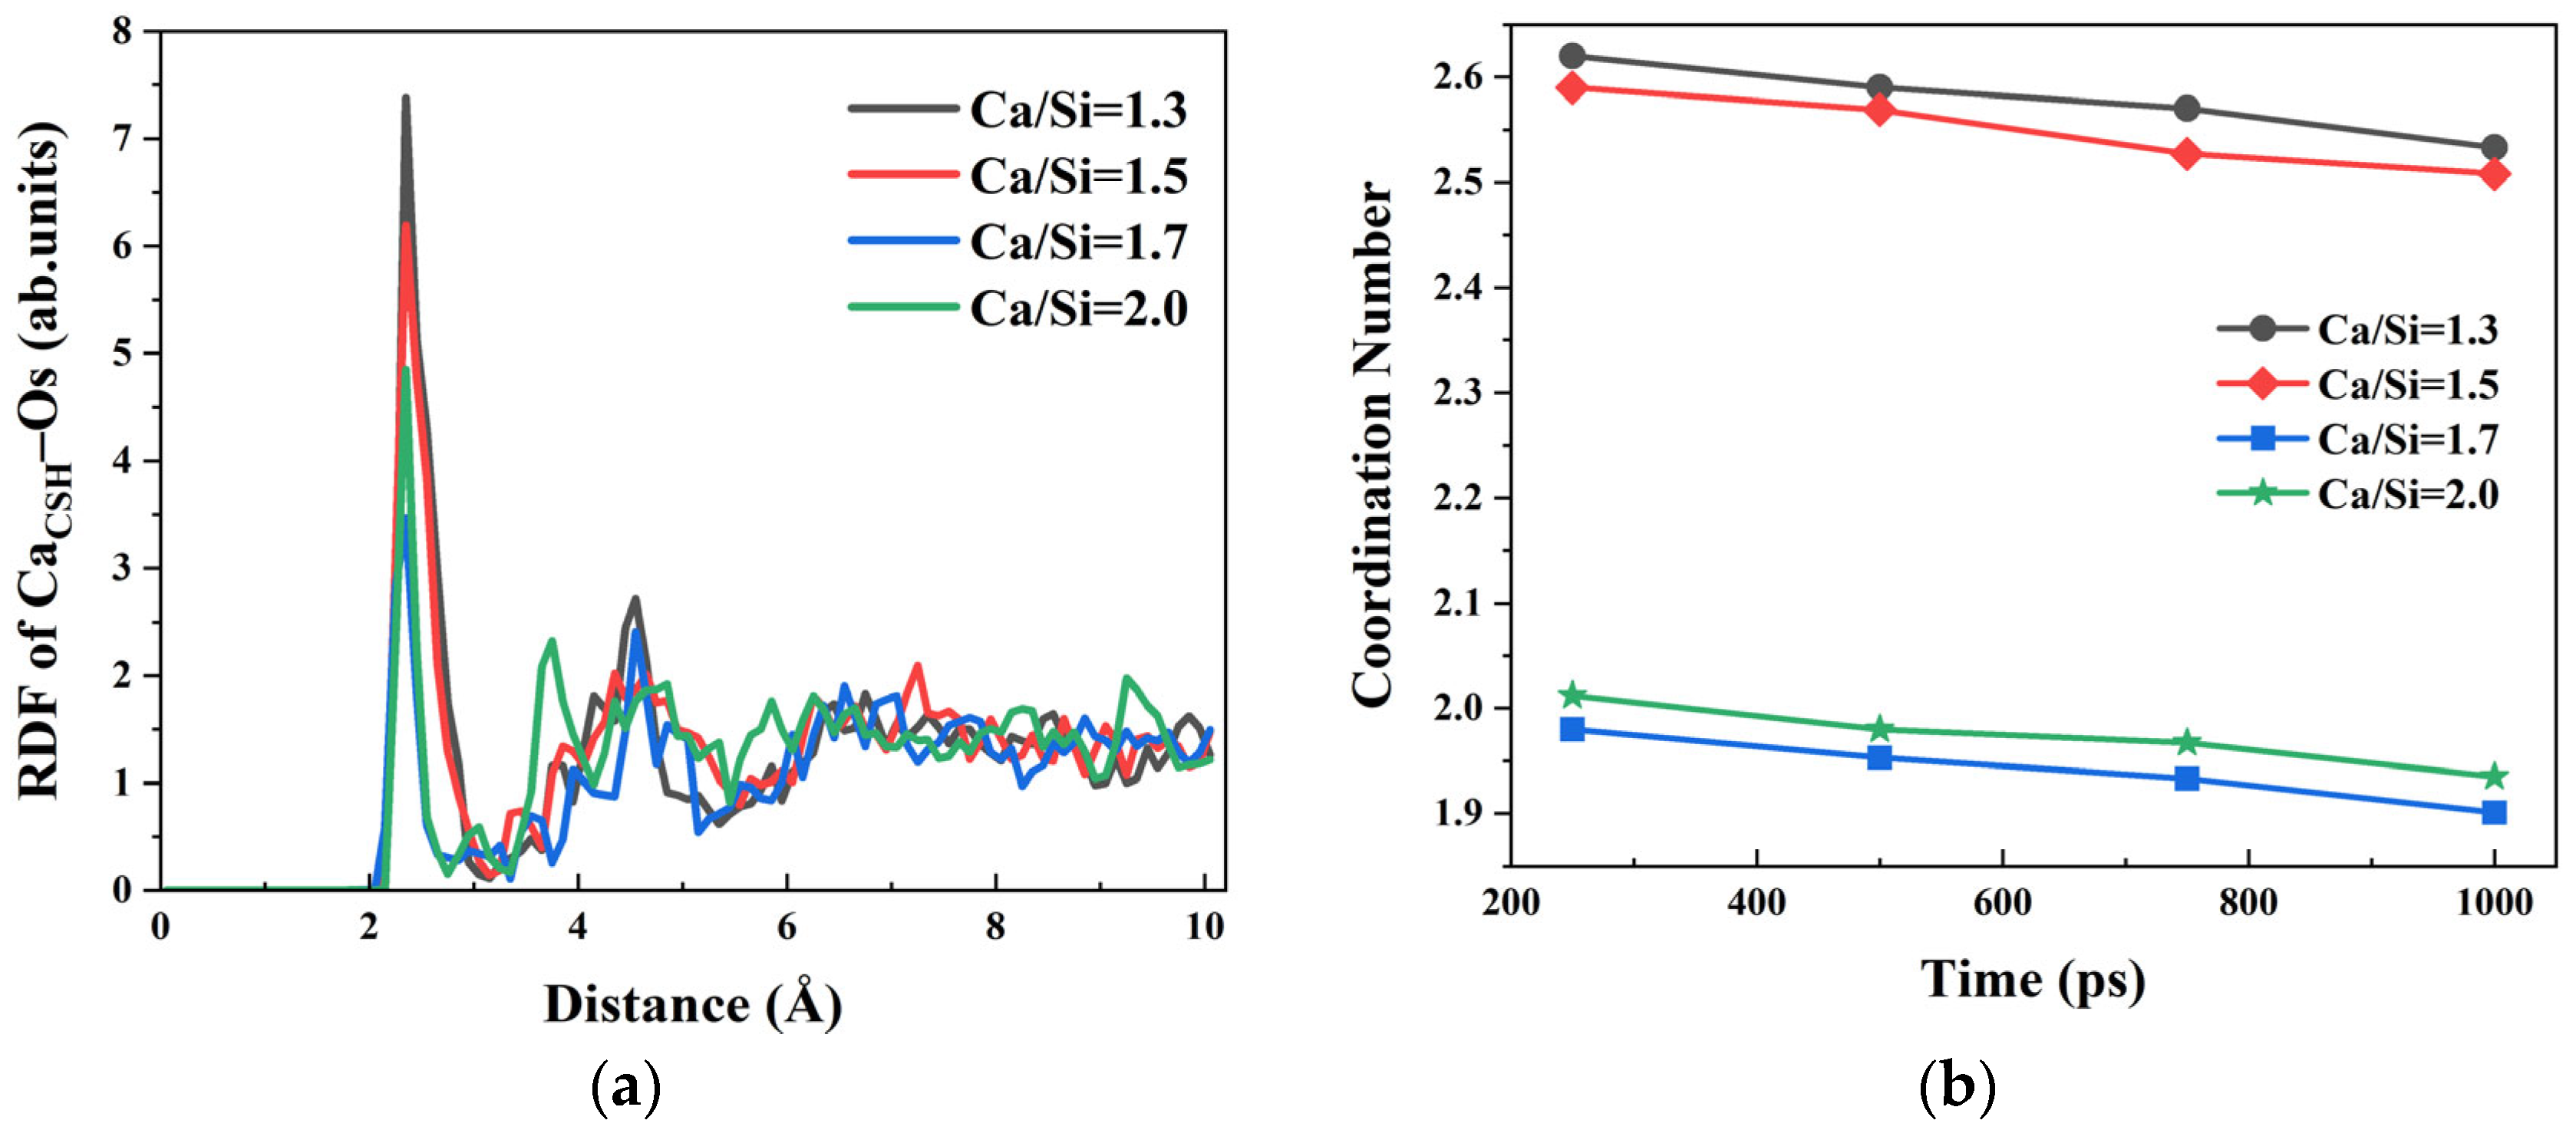
s shown in
Figure 4a exhibit a consistent peak at 2.35 Å across all Ca/Si ratios, indicating a stable bonding distance between Ca
2+ and O
s atoms. Notably, lower Ca/Si ratios yield higher RDF peak intensities, denoting that Ca
2+ preferentially coordinates with O
s in CSH structures with more silicon oxygen tetrahedra. The CN numbers of the Ca
CSH–O
s analysis at different simulation time points in
Figure 4b reveal a parallel trend between Ca
CSH–O
s and Ca
CSH–O
h, suggesting that the accumulation of water molecules on the CSH surface not only competes with O
h but also partially occupies the coordination sites of Ca
CSH–O
s ion pairs.
Based on the results mentioned above, the relative strength of ionic bonding between Ca2+ ions and the three oxygen species follows the order: CaCSH–Oh > CaCSH–Os > CaCSH–Owater. However, the variation trends of RDF peak intensities with Ca/Si ratio exhibit inconsistencies between CaCSH–Os and CaCSH–Oh systems. Specifically, in the CaCSH–Oh RDF profile, the peak intensity for Ca/Si = 2.0 is lower than that for Ca/Si = 1.7, while in the CaCSH–Os system, the peak intensity is 4.851 at Ca/Si = 2.0, which significantly exceeds the intensify of 3.466 at Ca/Si = 1.7. This apparent discrepancy primarily stems from distinct spatial configurations and distributions of silicon oxygen tetrahedra on CSH surfaces with different Ca/Si ratios. In the Ca/Si = 2.0 CSH structure, the silicon chain network adopts a more dispersed arrangement, which facilitates more migration of free Ca2+ ions into the structural interlayers, particularly into the first layer. Furthermore, Ca2+ ions in the first layer demonstrate preferential coordination with Os atoms, while Ca2+ ions in the second layer exhibit stronger affinity for Oh groups.
By analyzing the bonding interactions between Ca2+ ions in the free zone of CSH surface and oxygen atoms in other components, it was found that the crystal structure of CSH with varying Ca/Si ratios influenced the distribution of Ca2+ ions. As a result, it subsequently altered the hydration behavior of free Ca2+ ions on the CSH surface and ultimately led to differences in the adhesion performance between CSH and γ–FeOOH.
The results demonstrate that free Ca2+ ions on the surface of CSH with high Ca/Si ratio form fewer bonds with water molecules in the solution. Ca2+ ions preferentially interact with the free hydroxyl groups on the surface of CSH to form CaCSH–Oh bonds. During the simulation progress, the free CaCSH–Oh bonds exhibited higher mobility toward the surface of γ–FeOOH and formed Oh–CaCSH–Oγ–FeOOH with it, thereby effectively reducing the inhibitory effect of water molecules on the interfacial interaction between CSH and γ–FeOOH.
In addition to the free Ca
2+ ions, the exposed hydroxyl groups (H
CSH and O
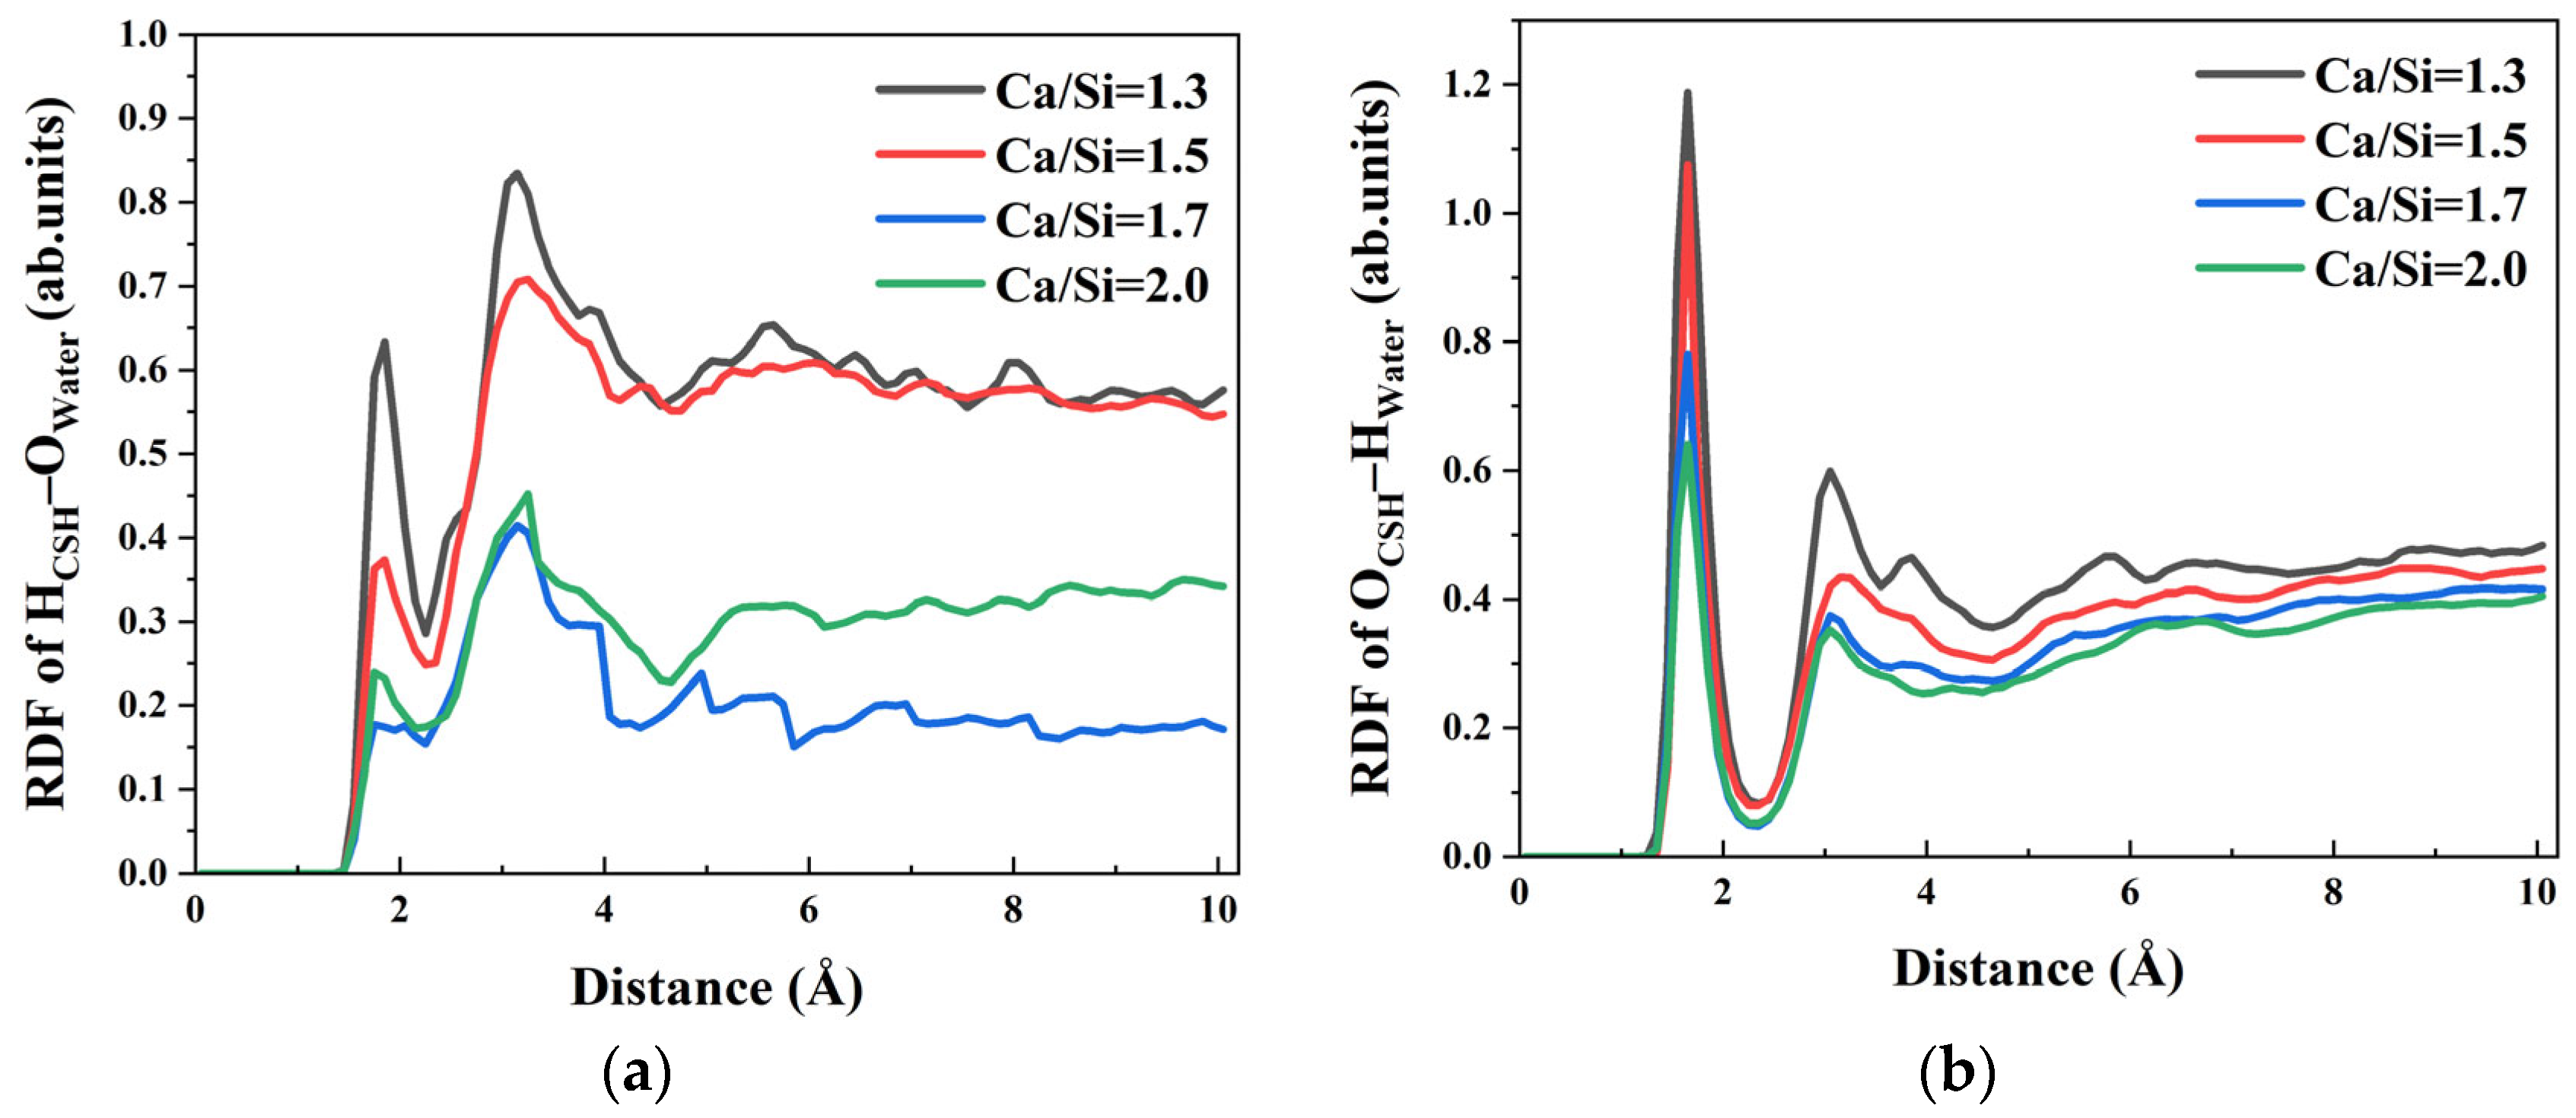
CSH) on the CSH surface with different Ca/Si ratios also formed chemical bonds with other components, thereby influencing the interfacial interaction between CSH and γ–FeOOH. The RDF curves between surface hydroxyl groups of CSH with different Ca/Si ratios and water molecules in the solution are shown in
Figure 5. As illustrated in
Figure 5a, the first peak of of H
CSH–O
water in RDF appeared at 1.95 Å, followed by a second peak at 3.15 Å. Meanwhile,
Figure 5b shows that O
CSH–H
water in RDF had its first peak at 1.65 Å and a second peak at 3.05 Å. The positions of the first peaks of both H
CSH–O
water and O
CSH–H
water, the most probable distance between the two atoms, are shorter than the typical hydrogen bond length (2.45 Å), indicating that CSH can act as both a hydrogen bond donor and acceptor with water molecules in solutions of varying Ca/Si ratios.
Comparing CSH with different Ca/Si ratios, the peak intensities of HCSH–Owater and OCSH–Hwater in RDF curves gradually increase with the decrease in Ca/Si ratio, suggesting stronger hydrogen bonding interactions between CSH with low–Ca/Si ratios and water molecules. For example, in OCSH–Hwater RDF curves, as the Ca/Si ratio increases from 1.3, 1.5, 1.7 to 2.0, the peak values decrease from 1.187, 1.075, 0.781 to 0.641, respectively. This trend demonstrates that a lower Ca/Si ratio enhances the hydrogen bond strength between CSH and water molecules.
Since the HCSH and OCSH groups on CSH surface preferentially form hydrogen bonds with Owater and Hwater (HCSH–Owater and OCSH–Hwater), the coordination sites that could originally bind to hydroxyl groups on the γ–FeOOH surface are occupied by water molecules. Consequently, the number and strength of hydrogen bonds (HCSH–Oγ–FeOOH and OCSH–Hγ–FeOOH) formed between CSH and γ–FeOOH are significantly reduced.
In summary, CSH with varying Ca/Si ratios forms CaCSH–Owater ionic bonds and hydrogen bonds (HCSH–Owater and OCSH–Hwater) with water molecules in solution. These bonding interactions occupy the coordination sites on the CSH surface, thereby weakening the interfacial interaction between γ–FeOOH and CSH. The comparative analysis of the RDF peak values for CaCSH–Owater, HCSH–Owater, and OCSH–Hwater under different Ca/Si ratios reveals an increasing trend in peak intensity with decreasing Ca/Si ratio. This phenomenon indicates that CSH with lower Ca/Si ratios exhibits stronger binding with water molecules, which more effectively inhibits the interfacial interaction between γ–FeOOH and CSH. Consequently, this competitive bonding mechanism ultimately leads to the deterioration of bonding performance at the γ–FeOOH/CSH interface.
3.3. The Influence of Erosive Ions on the Interfacial Adhesion Performance
In the molecular dynamics simulation of γ–FeOOH/CSH interfacial bonding under varying Ca/Si ratios, NaCl + Na2SO4 composite solution was employed to simulate the external corrosive environment. Beyond examining the interaction between water molecules and CSH with four distinct Ca/Si ratios, the effects of Na+, Cl−, and SO42− ions on interfacial bonding performance were systematically investigated. This section elucidates the degradation mechanisms induced by each ionic from a microscopic perspective.
Notably, Na
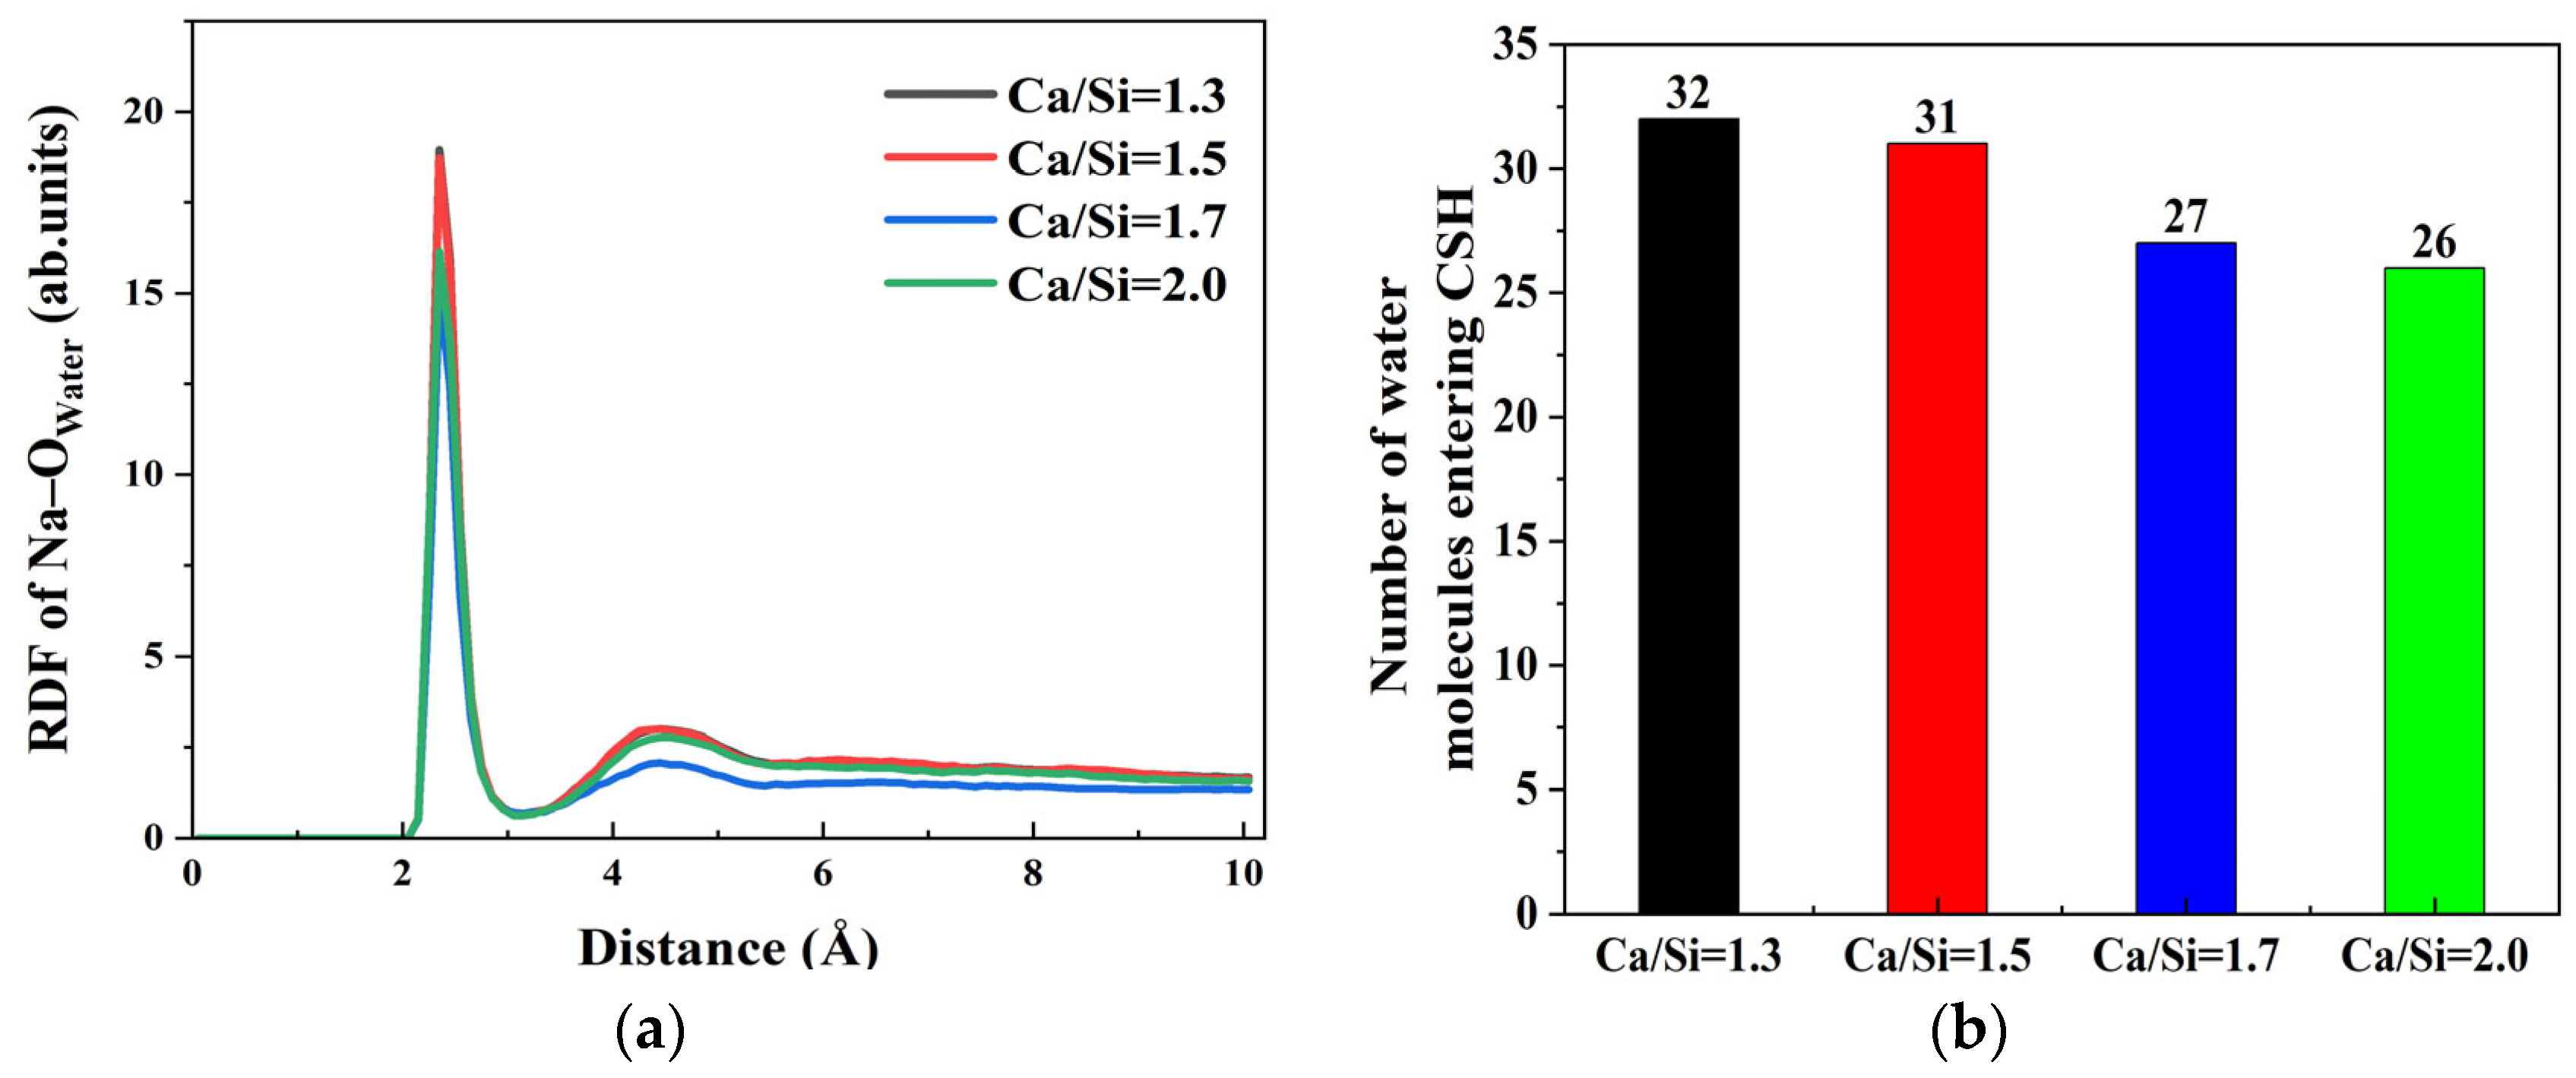
+ ions tend to accumulate on the CSH surface, promoting water molecule ingress into the CSH matrix. However, the adsorption characteristics under varying CSH crystal structures induced by different Ca/Si ratios require further exploration. Through the RDF results of Na–O
water at γ–FeOOH/CSH interfaces with different Ca/Si ratios, as shown in
Figure 6a, the influence of Na
+ ions on the interaction of γ–FeOOH/CSH interface with different Ca/Si ratios was evaluated. The RDF profiles exhibit a pronounced peak at 2.35 Å across all four Ca/Si ratios, indicating persistent strong Na
+–water interactions regardless of CSH composition. This peak corresponds to a well-defined hydration shell where water molecules coordinate Na
+ ions at this characteristic distance. Moreover, the peak intensity demonstrates an inverse relationship with Ca/Si ratio, revealing that higher Ca/Si ratios in CSH attenuate the secondary hydration effects of Na
+ ions in solution.
This trend is further corroborated by
Figure 6b, demonstrating an inverse correlation between Ca/Si ratio and water molecule penetration into the CSH surface. Quantitative analysis reveals that at Ca/Si = 2.0, approximately 26 water molecules access the CSH surface, while this number increases to 32 when Ca/Si decreases to 1.3. The findings prove that Ca/Si ratio modulates the hydration capability of Na
+ ions. Higher Ca/Si ratios attenuate the hydration strength of surface Na
+ ions, consequently reducing the possibility of water molecules bonding with CSH. The phenomenon promotes the migration of free Ca
2+ ions and hydroxyl groups (O
h and H
o) from CSH to γ–FeOOH surfaces for interfacial bonding. Ultimately, CSH with elevated Ca/Si ratios exhibits weaker solution interactions but stronger interfacial bonding with γ–FeOOH.
In addition to Na
+ ions, the interfacial behavior of Cl
− and SO
42− anions at varying Ca/Si ratios warrants systematic investigation. Owing to electrostatic attraction, Cl
− ions form Ca
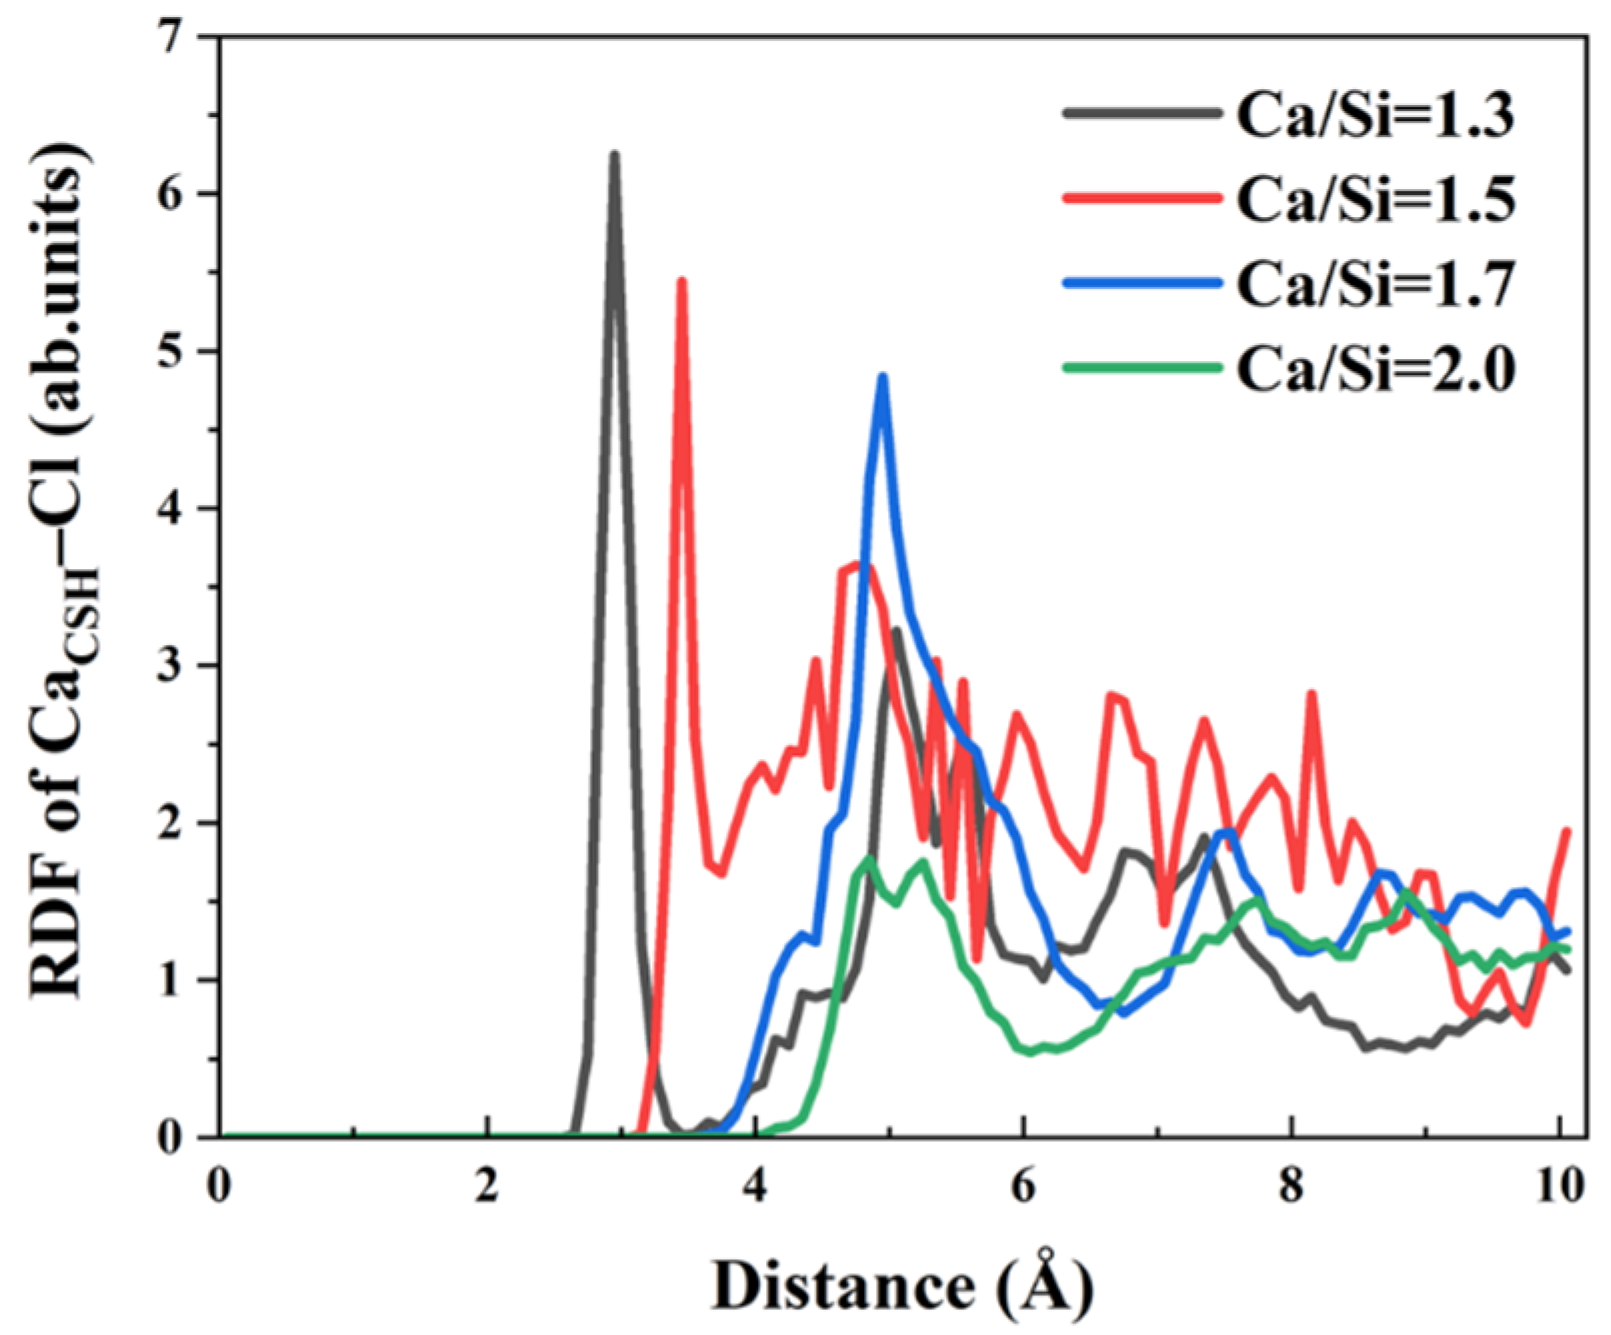
CSH–Cl ionic bonds with Ca
2+ ions in the free zone of CSH surface. To elucidate the effect of Ca/Si ratios on these interactions, RDF curves of Ca
CSH–Cl were calculated across four Ca/Si ratios in
Figure 7. The results reveal significant Ca/Si–dependent variations in bond characteristics. When Ca/Si = 1.3, 1.5, and 1.7, the peak position of RDF gradually increases from 2.95 Å, 3.45 Å to 4.95 Å. When Ca/Si = 2.0, no distinct peak appears. The peak position represents the distance of interaction between Ca
2+ ions on the CSH surface and Cl
− ions in the solution. Therefore, when Ca/Si = 1.3, Cl
− ions aggregate at a distance of 2.95 Å around Ca
2+ ions. As the Ca/Si ratio increases, Cl
− ions gradually aggregate at farther positions on the CSH surface until there is no significant aggregation. Peak intensity attenuates with increasing Ca/Si ratio, indicating that the bonding quantity and strength of the two ions gradually weaken. It can be concluded that lower Ca/Si ratios promote Cl
− coordinate to surface Ca
2+ ions, while higher ratios progressively weaken this interaction. Consequently, CSH surfaces with high Ca/Si ratio exhibit reduced Cl
− binding probability, liberating more Ca
2+ ions for γ–FeOOH interfacial bonding.
The chemical bonding mechanisms differ between Cl
− and SO
42− ions. Each SO
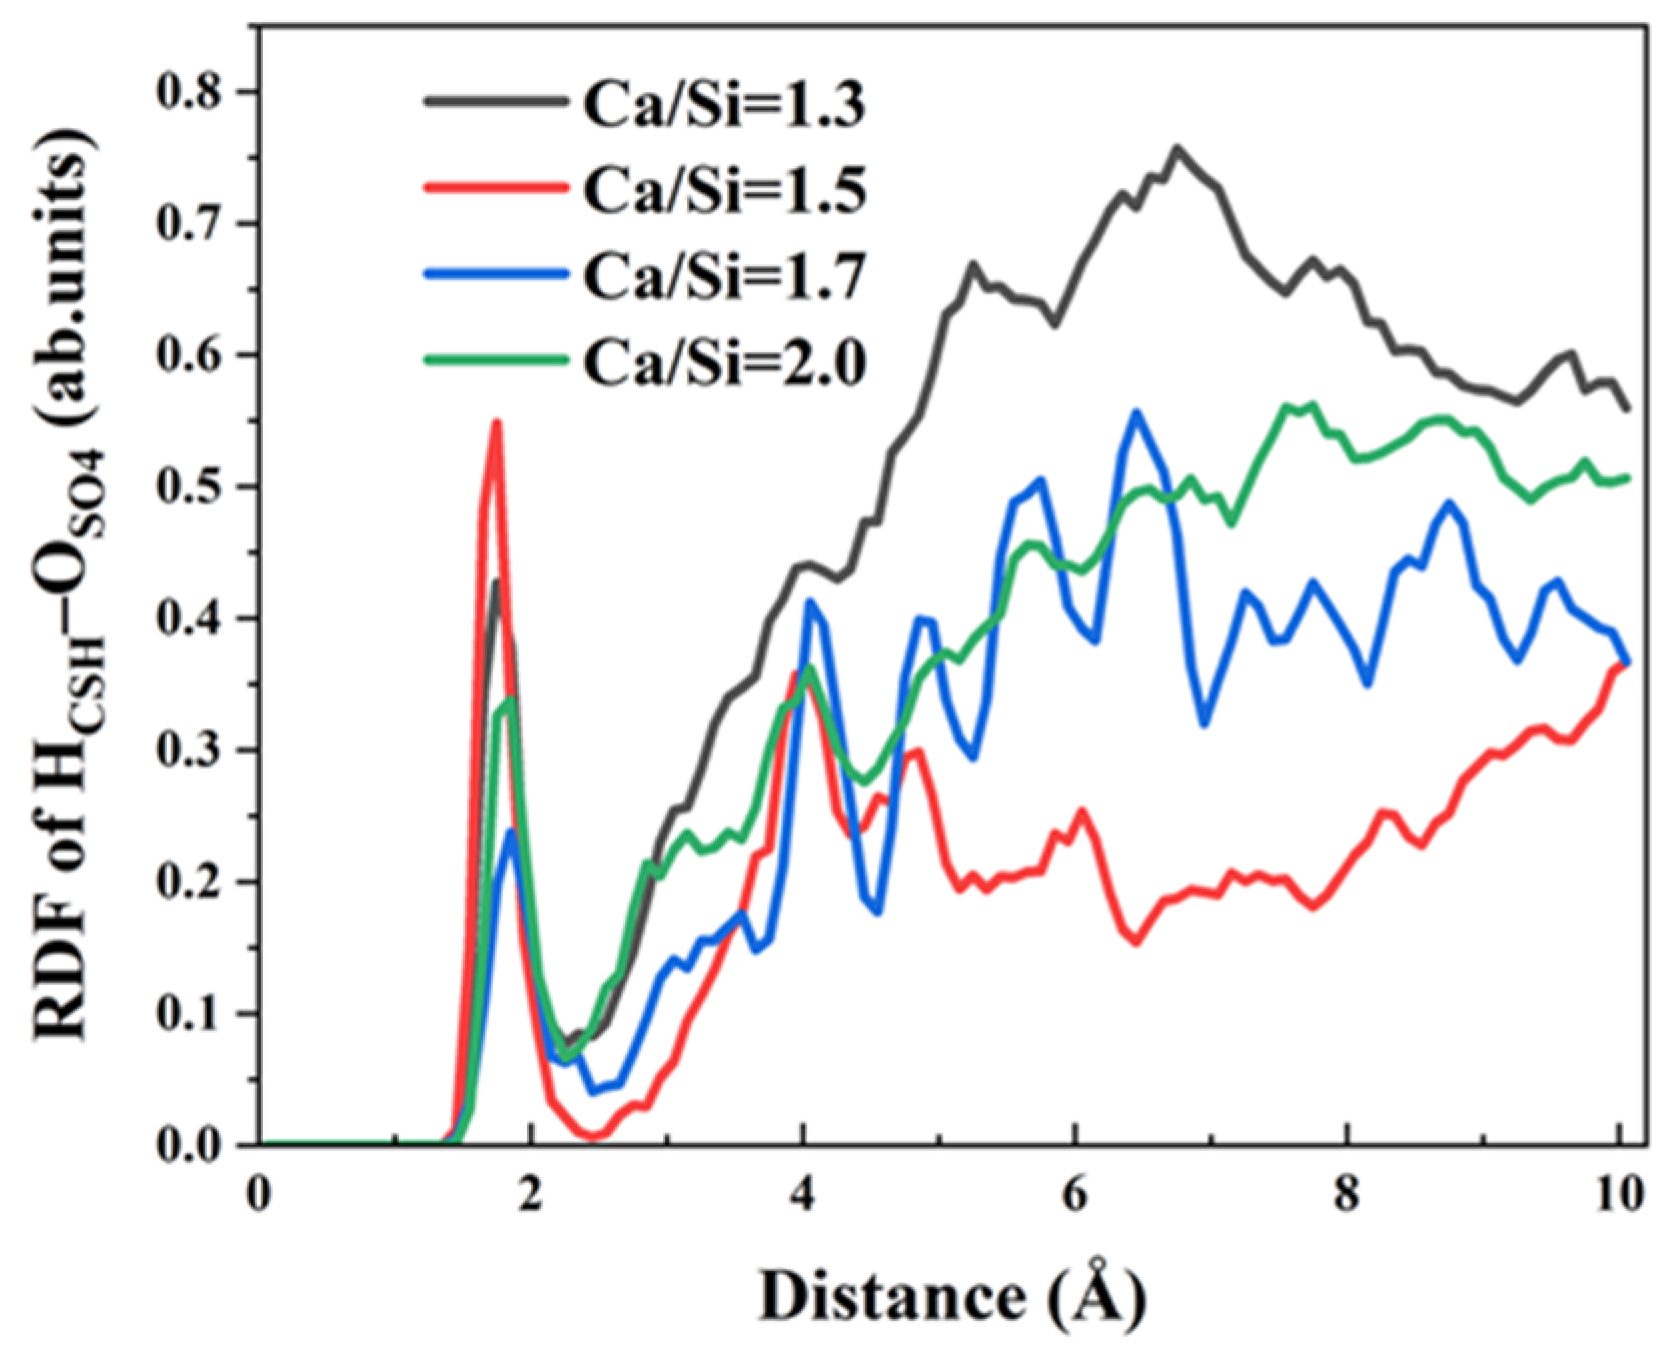
42− anion possesses four oxygen atoms, providing four potential coordination sites for hydrogen bond formation with CSH. To elucidate the influence of varying Ca/Si ratios on the hydrogen bonds formation between SO
42− and CSH, RDFs between O
SO4 and H
CSH were analyzed, as presented in
Figure 8. The key observations include the following points. Firstly, all Ca/Si ratios exhibit a distinct H
CSH–O
SO4 RDF peak at 1.85 Å, well within the typical hydrogen bonding distance threshold of 2.45 Å, confirming strong hydrogen bonding interactions. Secondly, comparative analysis reveals significantly higher peak intensities at lower Ca/Si ratios (1.3 and 1.5) compared to higher ratios (1.7 and 2.0), demonstrating that high Ca/Si ratios suppress H
CSH–O
SO4 hydrogen bond formation. It is hard for hydrogen atoms on a CSH surface with a high Ca/Si ratio to bind to SO
42− ions in solution and form hydrogen bonds. Thirdly, the suppression effect above liberates more H
CSH sites for interfacial bonding with γ–FeOOH, facilitating the formation of stronger H
CSH–O
γ–FeOOH hydrogen bonds that enhance overall CSH/γ–FeOOH interaction energy.
3.4. Transport Behaviour of Solutions in Pores with Varying Ca/Si Ratios
While the interfacial bonding behavior between CSH and γ–FeOOH elucidates the structural characteristics, the ion transport within the nanopore further reflects its dynamic functional performance.
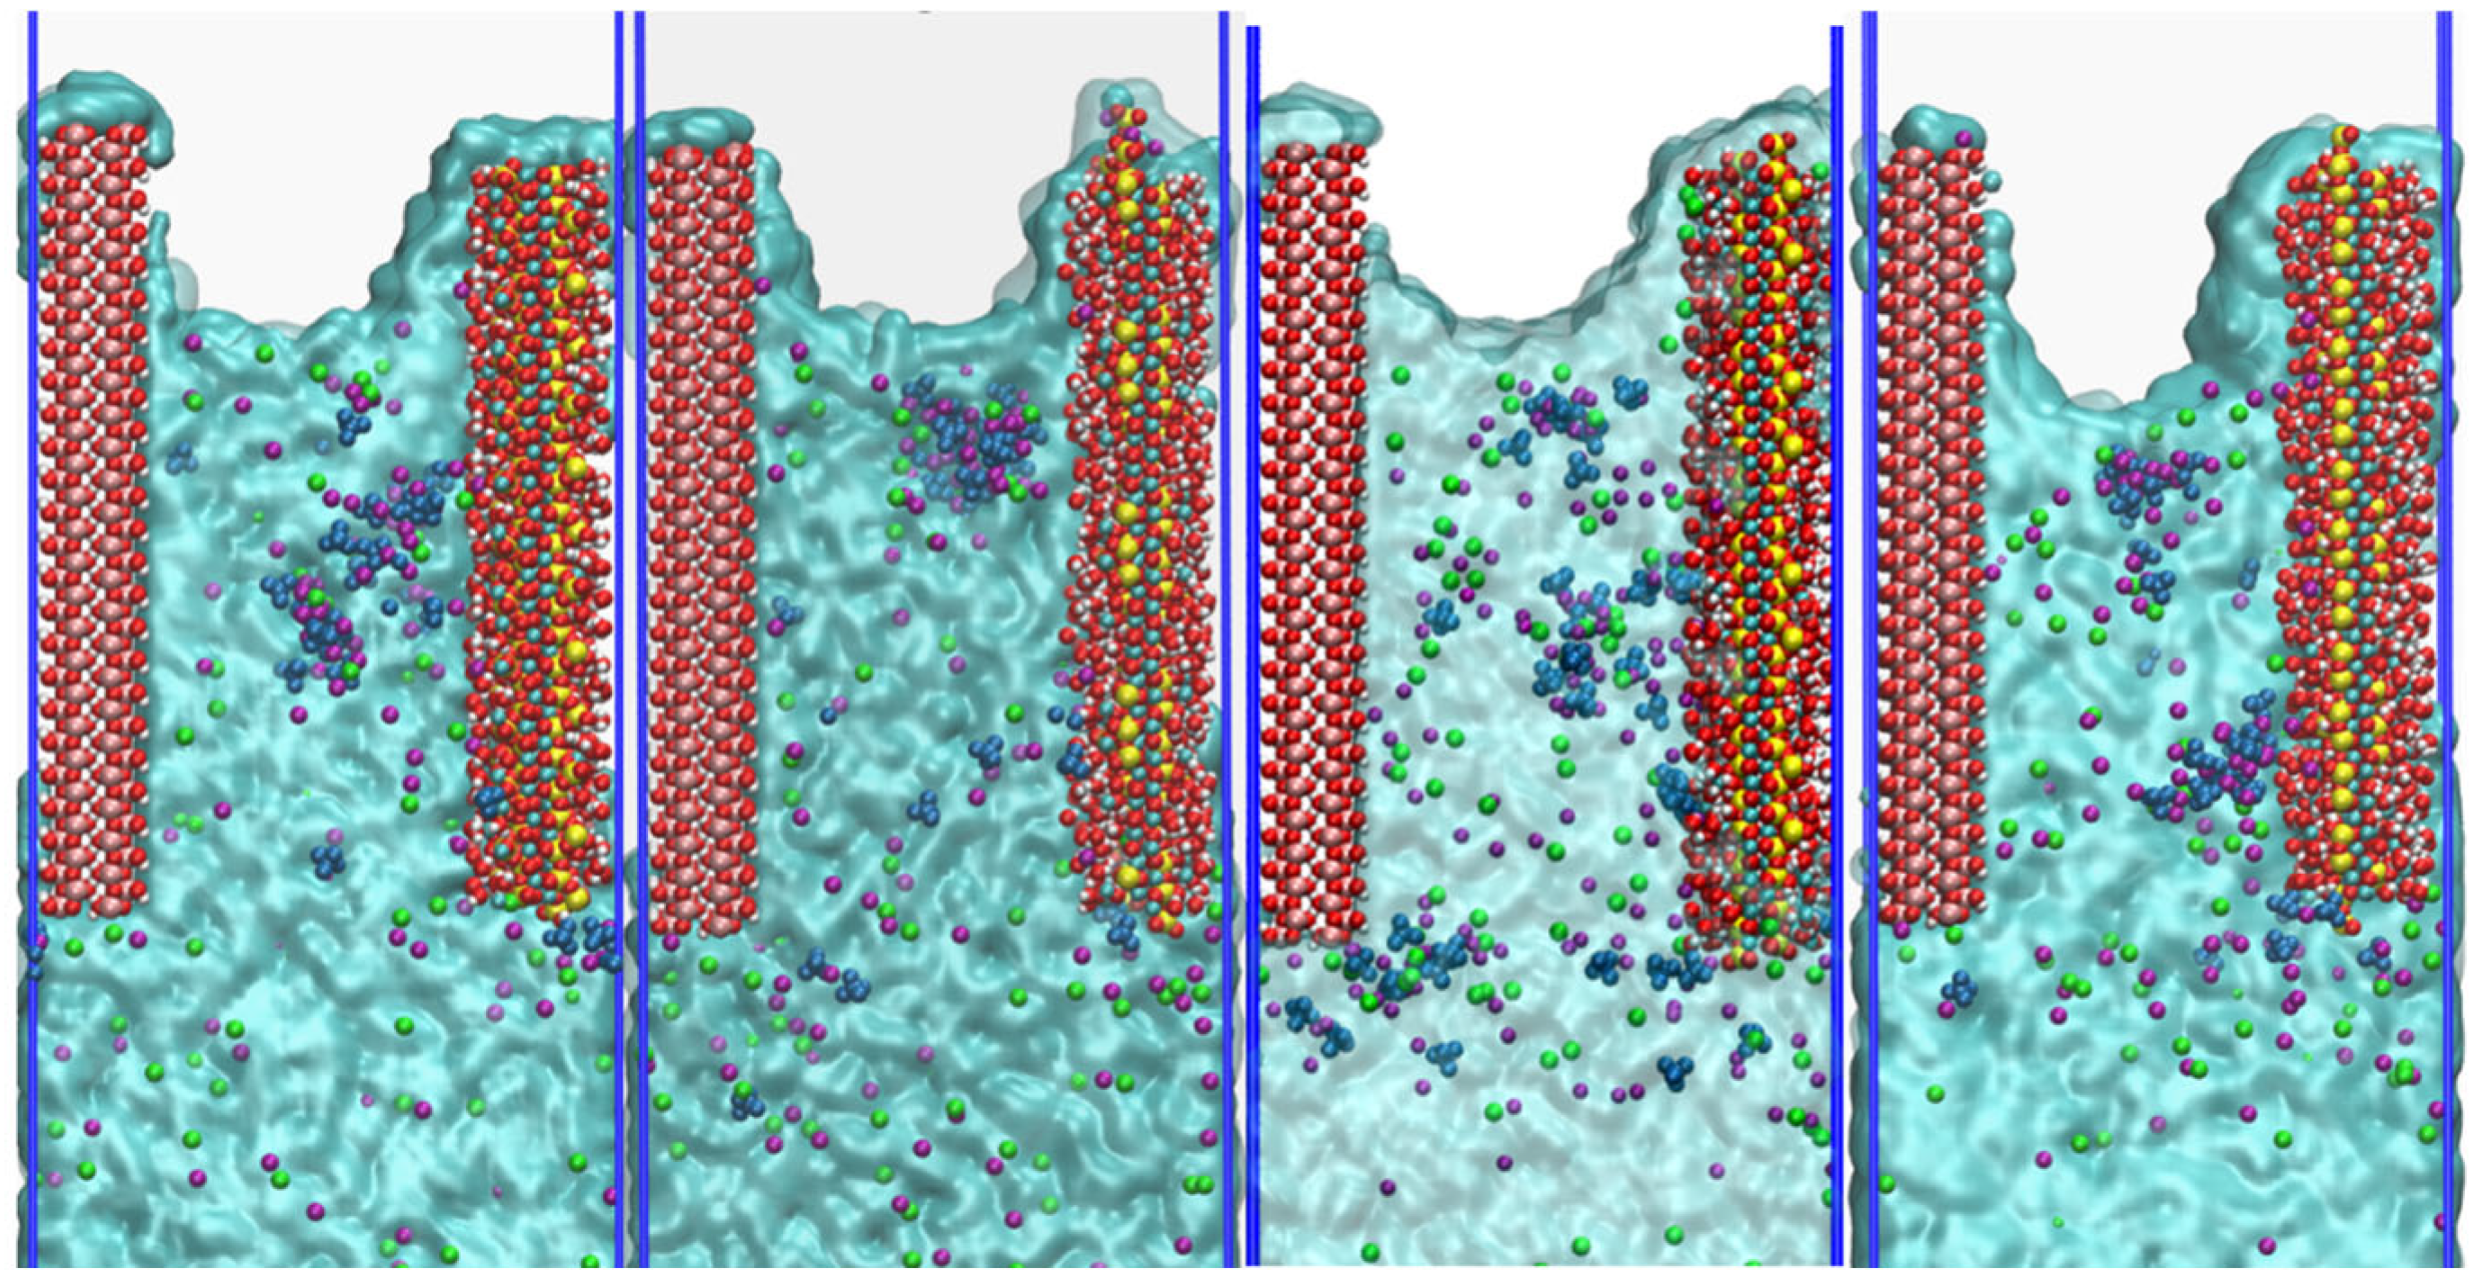
Figure 9 presents capillary transport snapshots of NaCl + Na
2SO
4 solution in CSH/γ–FeOOH nanopores with varying Ca/Si ratios of 1.3, 1.5, 1.7, and 2.0 when the simulation time
t = 2000 ps [
45]. From the aspect of the water transport dynamics, it is observed that complete surface coverage by water molecules occurs across all Ca/Si ratios, which indicates that strong hydrophilic attraction from CSH substrates with varying Ca/Si ratios drives water molecules’ migration. However, the specific impact of CSH with varying Ca/Si ratios on the transport velocity of water molecules still requires further investigation. Compared with water molecules, the movement velocity of Na
+, Cl
−, and SO
42− ions is much slower. This indicates that ion transport is partially dependent on water molecular driving force to move forward. Differences in ion invasion depths are also apparent. When CSH Ca/Si ratio = 1.3, 1.5, and 1.7, they occupy about 75% of the entire pore length. When CSH Ca/Si ratio increases to 2.0, the ion invasion depth decreases to about 70% of the entire pore. In terms of the interfacial distribution, ions showed pronounced ion accumulation preference for CSH over γ–FeOOH interfaces. Particularly, SO
42− exhibits significant clustering behavior, forming multiple large ion clusters and adsorbing on the CSH surface. The phenomena above indicate that the transport mechanism not only involves the diffusion of the solution itself, but is also affected by the matrix interface interaction, and the interaction with CSH is stronger than that with γ–FeOOH.
The preceding analysis demonstrates that variations in CSH crystal structure induced by different Ca/Si ratios influence the transport behavior of NaCl + Na2SO4 composite solution within the nanopores. To quantitatively characterize the transport differences, the temporal evolution of penetration depths for water molecules and ions (Na+, Cl−, and SO42−) along the pore surfaces was systematically recorded. Considering the invariant structure of γ–FeOOH substrates and their negligible ion adsorption capacity, the capillary transport behavior was quantified by analyzing ion penetration profiles along CSH surfaces with varying Ca/Si ratios.
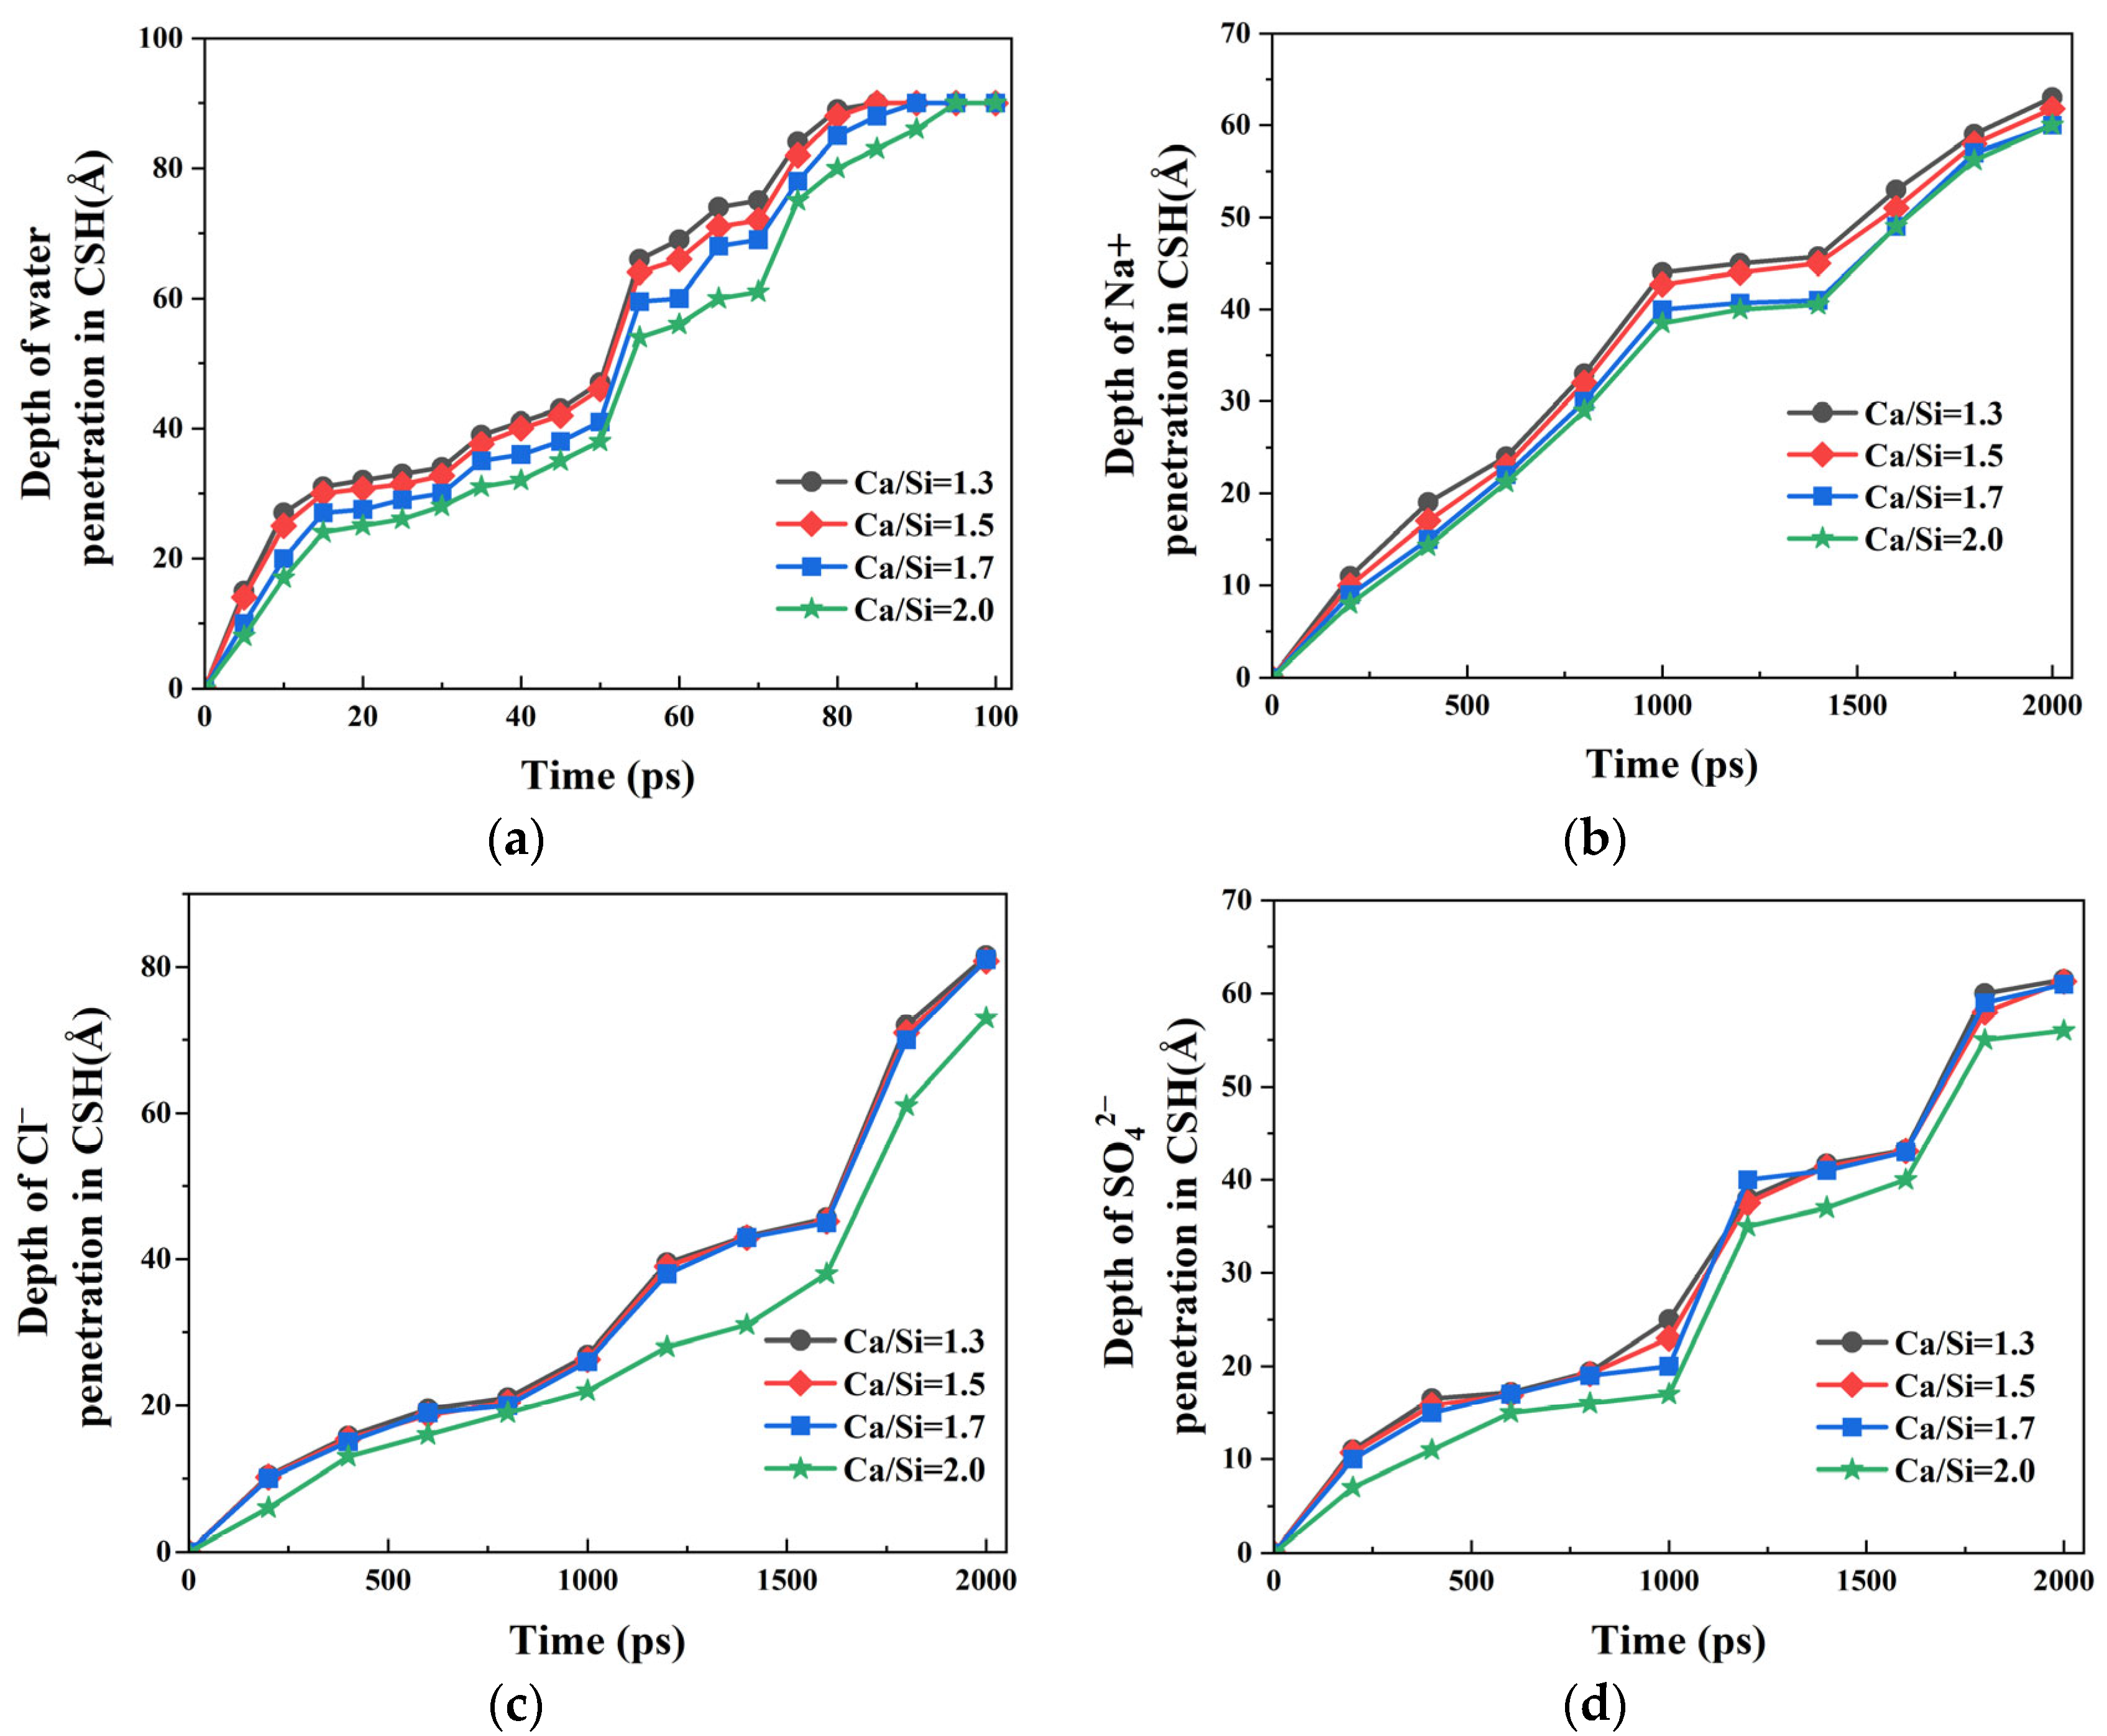
The penetration depth profiles of water molecules on CSH surfaces with different Ca/Si ratios is presented in
Figure 10a. Complete surface coverage was achieved by
t = 100 ps in all cases. It was observed that the higher the Ca/Si ratio, the smaller the penetration depth of water molecules on the CSH surface. When
t = 75 ps, the measured penetration depths were 84 Å, 82 Å, 78 Å, and 75 Å for CSH Ca/Si ratios of 1.3, 1.5, 1.7, and 2.0, respectively. The decrease in the penetration depth with the increase in the Ca/Si ratio indicates that in systems with a high Ca/Si ratio, the interaction at the water–CSH interface weakens, resulting in the slow transport of water molecules.
Figure 10b–d illustrate the penetration depths of Na
+, Cl
−, and SO
42− ions on CSH surfaces with varying Ca/Si ratios. It can be concluded that all ions exhibit significantly shallower penetration than water molecules at all timepoints, confirming preserved transport asynchronicity regardless of Ca/Si ratio variations. The ion penetration depths on the CSH surface keep decreasing as Ca/Si ratios increases. Compared with Na
+ ions, Cl
− and SO
42− show greater Ca/Si ratio dependence, particularly when Ca/Si = 2.0 where divergence was most significant. Quantitative analysis of the data at
t = 1600 ps reveals that when
t = 1600 ps, the penetration depth of Na
+ ions on CSH interface with Ca/Si = 1.3 was measured to be 53 Å. When the Ca/Si ratio increased to 2.0, the penetration depth decreased by 7.54%. Under identical conditions, Cl
− ions exhibited a more substantial reduction in penetration depth by 16.66%. These results demonstrate that increasing the Ca/Si ratio of CSH induces selective ion filtration, with enhanced filtration efficiency observed for Cl
− and SO
42− ions compared to Na
+ ions at Ca/Si = 2.0. The differential filtration effects suggest that the interfacial interactions are strongly influenced by both ionic charge and hydration characteristics [
46,
47].
The results presented in
Figure 10c demonstrate that the penetration rate of Cl
− ions is significantly reduced in CSH nanochannels with higher Ca/Si ratios, indicating an accumulation and prolonged retention of chloride ions within the nanopore. This observation is in good agreement with the experimental findings reported by Zhou et al. [
22]. Through systematic experimental investigations, Zhou examined the transport and adsorption behaviors of water molecules, Ca
2+ ions, and Cl
− ions in CSH nanochannels with varying Ca/Si ratios. Their immersion tests clearly showed that CSH specimens with higher Ca/Si ratios exhibit enhanced chloride ion adsorption capacity.
The NaCl + Na2SO4 composite solution exhibited significantly different transport behaviors in the γ–FeOOH/CSH nanopores with four different Ca/Si ratios. This correlation suggests that structural modifications in CSH directly influence both the quantity and strength of interfacial bonds formed with water molecules and ions. The results showed that systems with higher Ca/Si ratios demonstrated significantly reduced transport rates for both aqueous and ionic components. Although these observations clearly establish the Ca/Si ratio as a critical regulator of transport phenomena, the precise molecular-scale bonding mechanisms responsible for the blocking effect require further investigation.
3.5. Differences in Bonding Between Solutions and CSH with Different Ca/Si
In order to elucidate the influence mechanism of CSH with different Ca/Si ratios on solution transport behaviour, the RDFs between Ca
2+ ions and hydroxyl groups (O
h and H
o) in the exposed regions of CSH surface and the surrounding solution were assessed. Initial investigation focused on water–CSH interactions across different Ca/Si ratios. The RDF curves of O
water–Ca
CSH under four different Ca/Si ratios were shown in
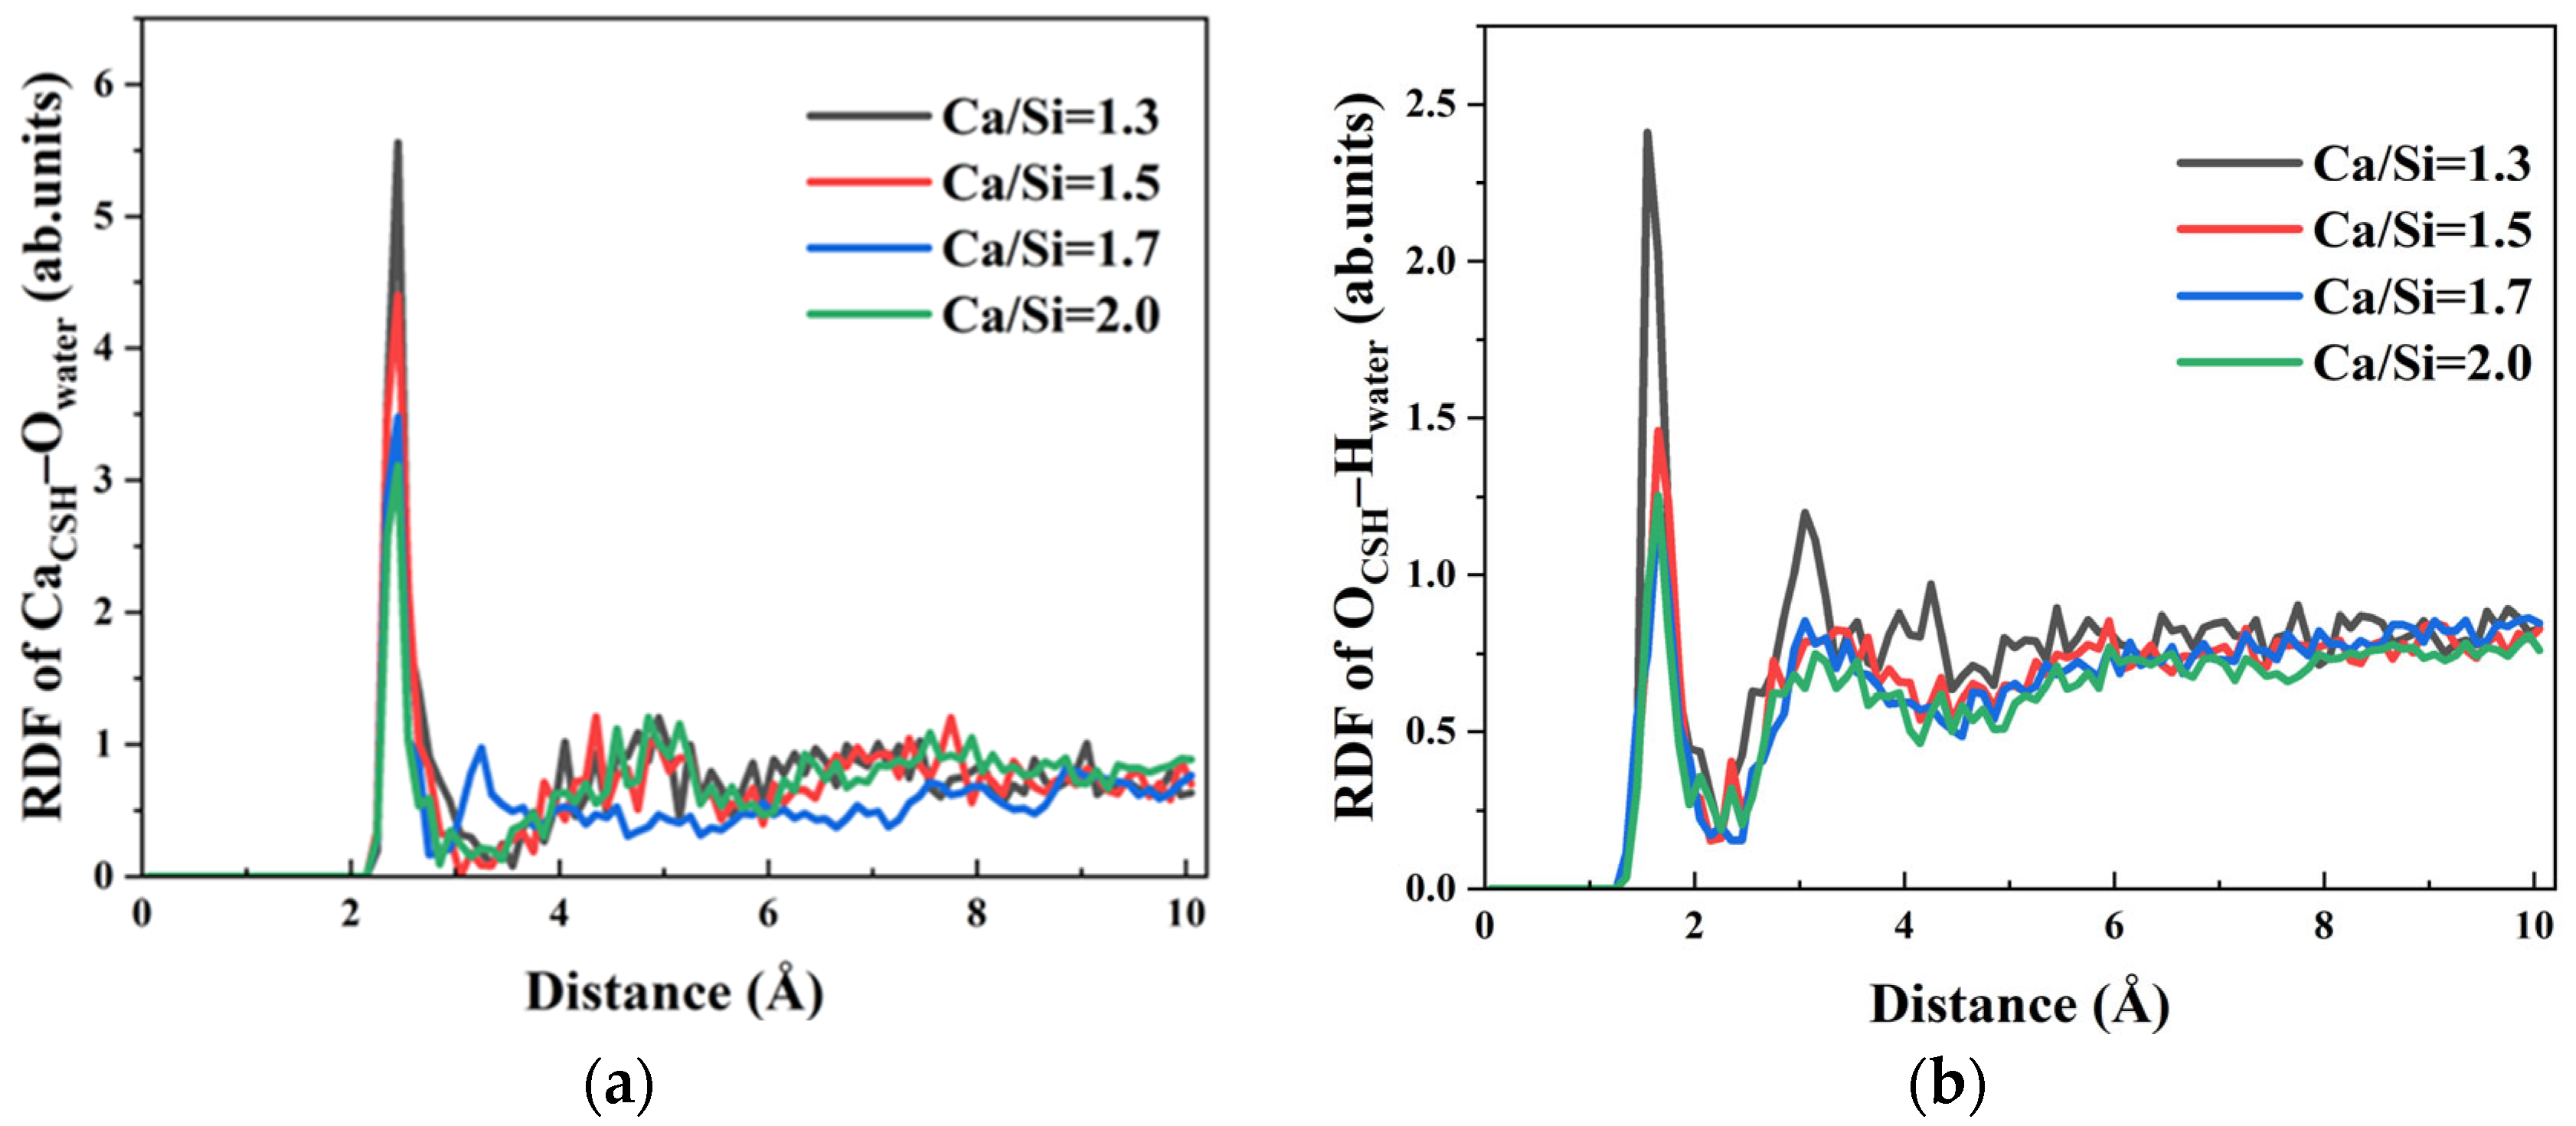
Figure 11a, revealing a characteristic first peak at 2.45 Å. The peak position confirms strong chemical bonding between O
water and Ca
2+ ions on CSH surfaces with varying Ca/Si. This bonding is also one of the primary driving forces for promoting the forward transport of water molecules within γ–FeOOH/CSH pores.
The peak intensity showed a progressive decrease from 5.558, 4.401, 3.478 to 3.10 as the Ca/Si ratio increased from 1.3 to 2.0. This indicates that the CSH structure with higher Ca/Si ratio attenuated both the quantity and strength of chemical bonds between Ca2+ ions on the surface and water molecules, consequently weakening the water–CSH interfacial attraction. The observed RDF variations originate fundamentally from structural differences in the initial CSH models. Specifically, CSH with higher Ca/Si ratios contains more hydroxyl groups within its molecular structure. The hydroxyl oxygen atoms (Oh) in CSH preferentially occupy coordination sites of Ca2+ ions, forming stable CaCSH–Oh ion pairs. When water molecules in the solution approach the CSH surface, the number of free Ca2+ ions that can bond with Owater on the surface is reduced, thereby decreasing CaCSH–Owater interactions.
Hydroxyl groups on CSH surfaces additionally participate in hydrogen bonding with water molecules, constituting another significant driving force for aqueous transport. The RDF curves of O
CSH–H
water under varying Ca/Si ratios were calculated, as shown in
Figure 11b. The first peak positions of the curves are distributed in the range of 1.55 Å~1.65 Å, which is shorter than the characteristic hydrogen bond distance of 2.45 Å. This indicates that CSH forms hydrogen bonds with water molecules in solution under all Ca/Si ratios. The Ca/Si ratio of CSH increases with the gradual RDF peak reduction in O
CSH–H
water, indicating a progressive weakening of hydrogen bond strength with increasing Ca/Si ratio. Particularly, when Ca/Si = 1.3, it exhibits much higher hydrogen bonding capacity compared to high Ca/Si ratio structure. Specifically speaking, peak intensity attenuates by 39.87%, 48.15%, and 49.73% with Ca/Si ratio increases from 1.3, 1.5, 1.7 to 2.0, respectively.
The analysis demonstrates that CSH with varying Ca/Si ratios facilitates water molecule transport through formation of CaCSH–Owater and OCSH–Hwater bonds, enabling complete substrate surface coverage by water. However, increasing Ca/Si ratio modifies the CSH crystal structure, leading to the strength weakening of CaCSH–Owater and OCSH–Hwater bonds formed on surface free regions. This attenuation reduces the driving force for water molecule transport, ultimately resulting in decreased penetration depths observed for high Ca/Si ratio CSH surfaces at equivalent timepoints.
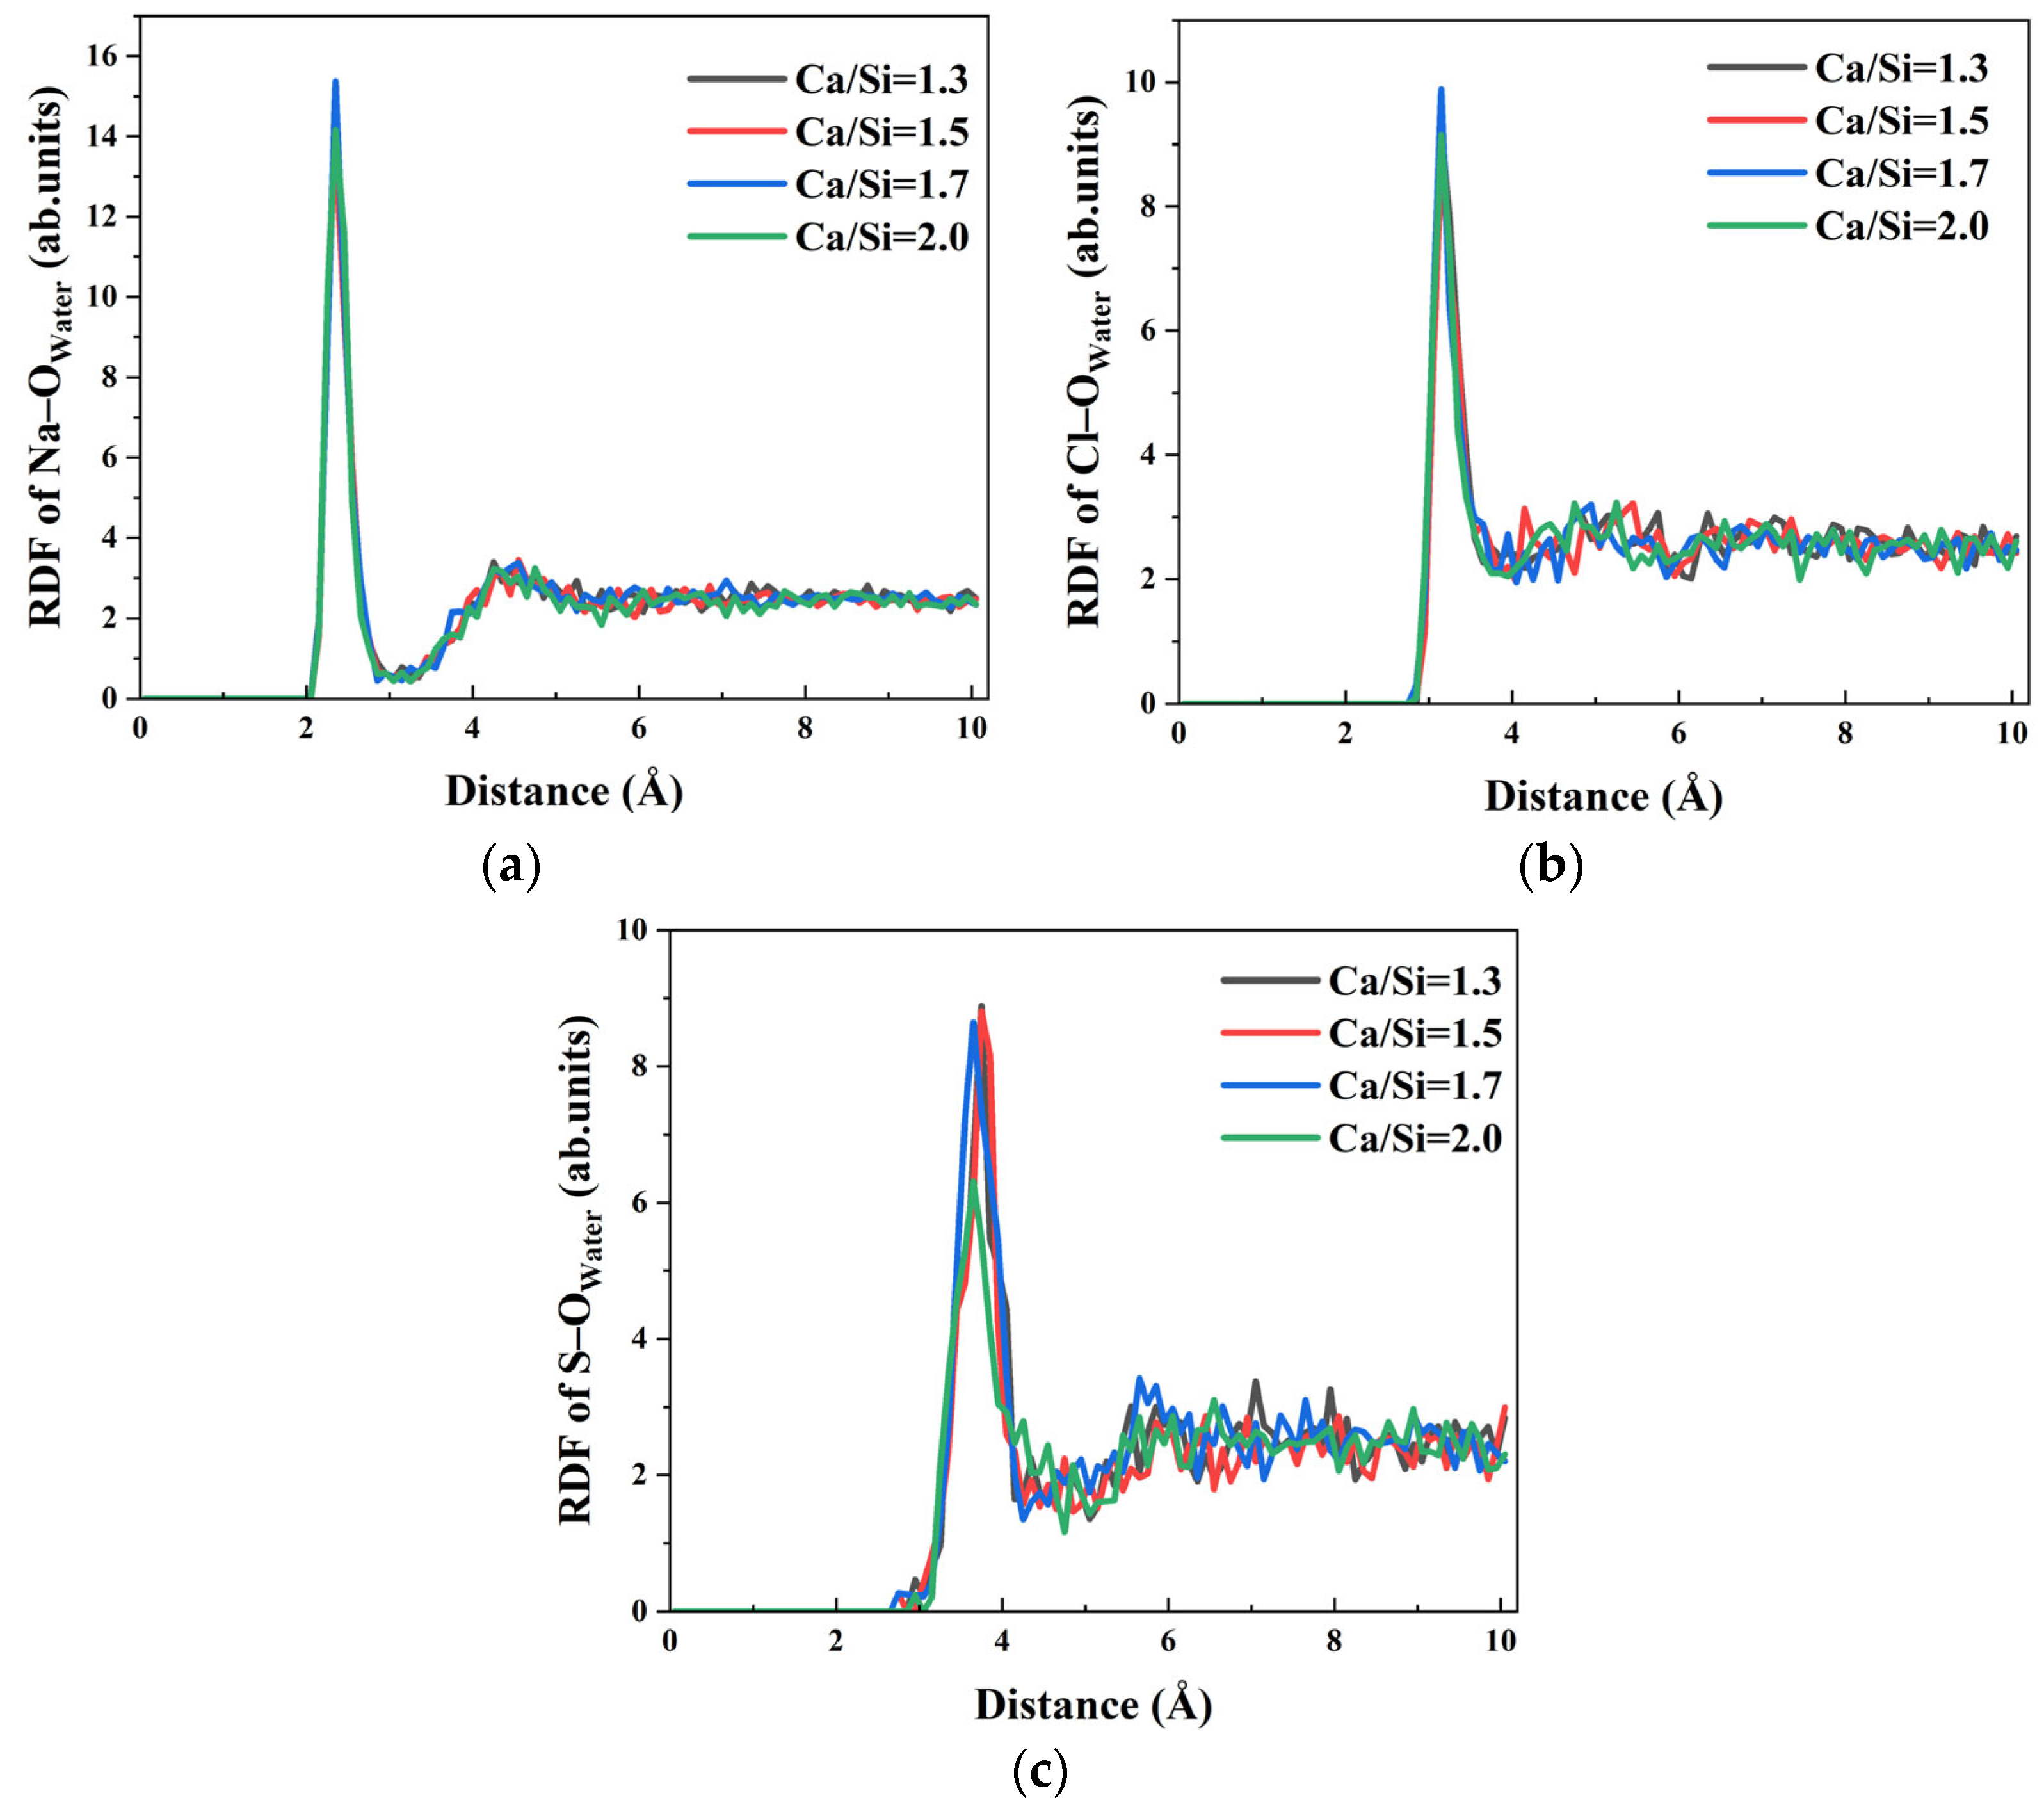
Ion transport within the capillary system derives partially from the driving effect of water molecules. RDF analysis of Na–O
water, Cl–O
water, and S–O
water interactions in
Figure 12 reveals that the first peaks appear at 2.35 Å, 3.15 Å, and 3.65 Å, respectively, confirming strong hydration effects for all ions across different Ca/Si ratios, while Na–O
water and Cl–O
water interactions show minimal Ca/Si ratio dependence, S–O
water bonding exhibits significant sensitivity. Specifically, the hydration of SO
42− remains consistent when Ca/Si ratios = 1.3, 1.5, and 1.7, but shows marked weakening at Ca/Si = 2.0 as evidenced by reduced RDF peak intensity. The decreased S–O
water interaction directly correlates with the observed block of SO
42− transport in systems with high Ca/Si ratio.
In addition to the water–ion bonding cooperation that facilitates ions transport through the pores, ion adsorption by the matrix on both interfaces of the pores promotes the continuous transport of ions. Given the invariant γ–FeOOH crystal structure with all Ca/Si ratio models and Na
+, Cl
−, and SO
42− ions, ions tend to accumulate on CSH surfaces. As demonstrated in
Section 3.4, the difference in ion adsorption primarily stems from variations in CSH–ion bonding characteristics.
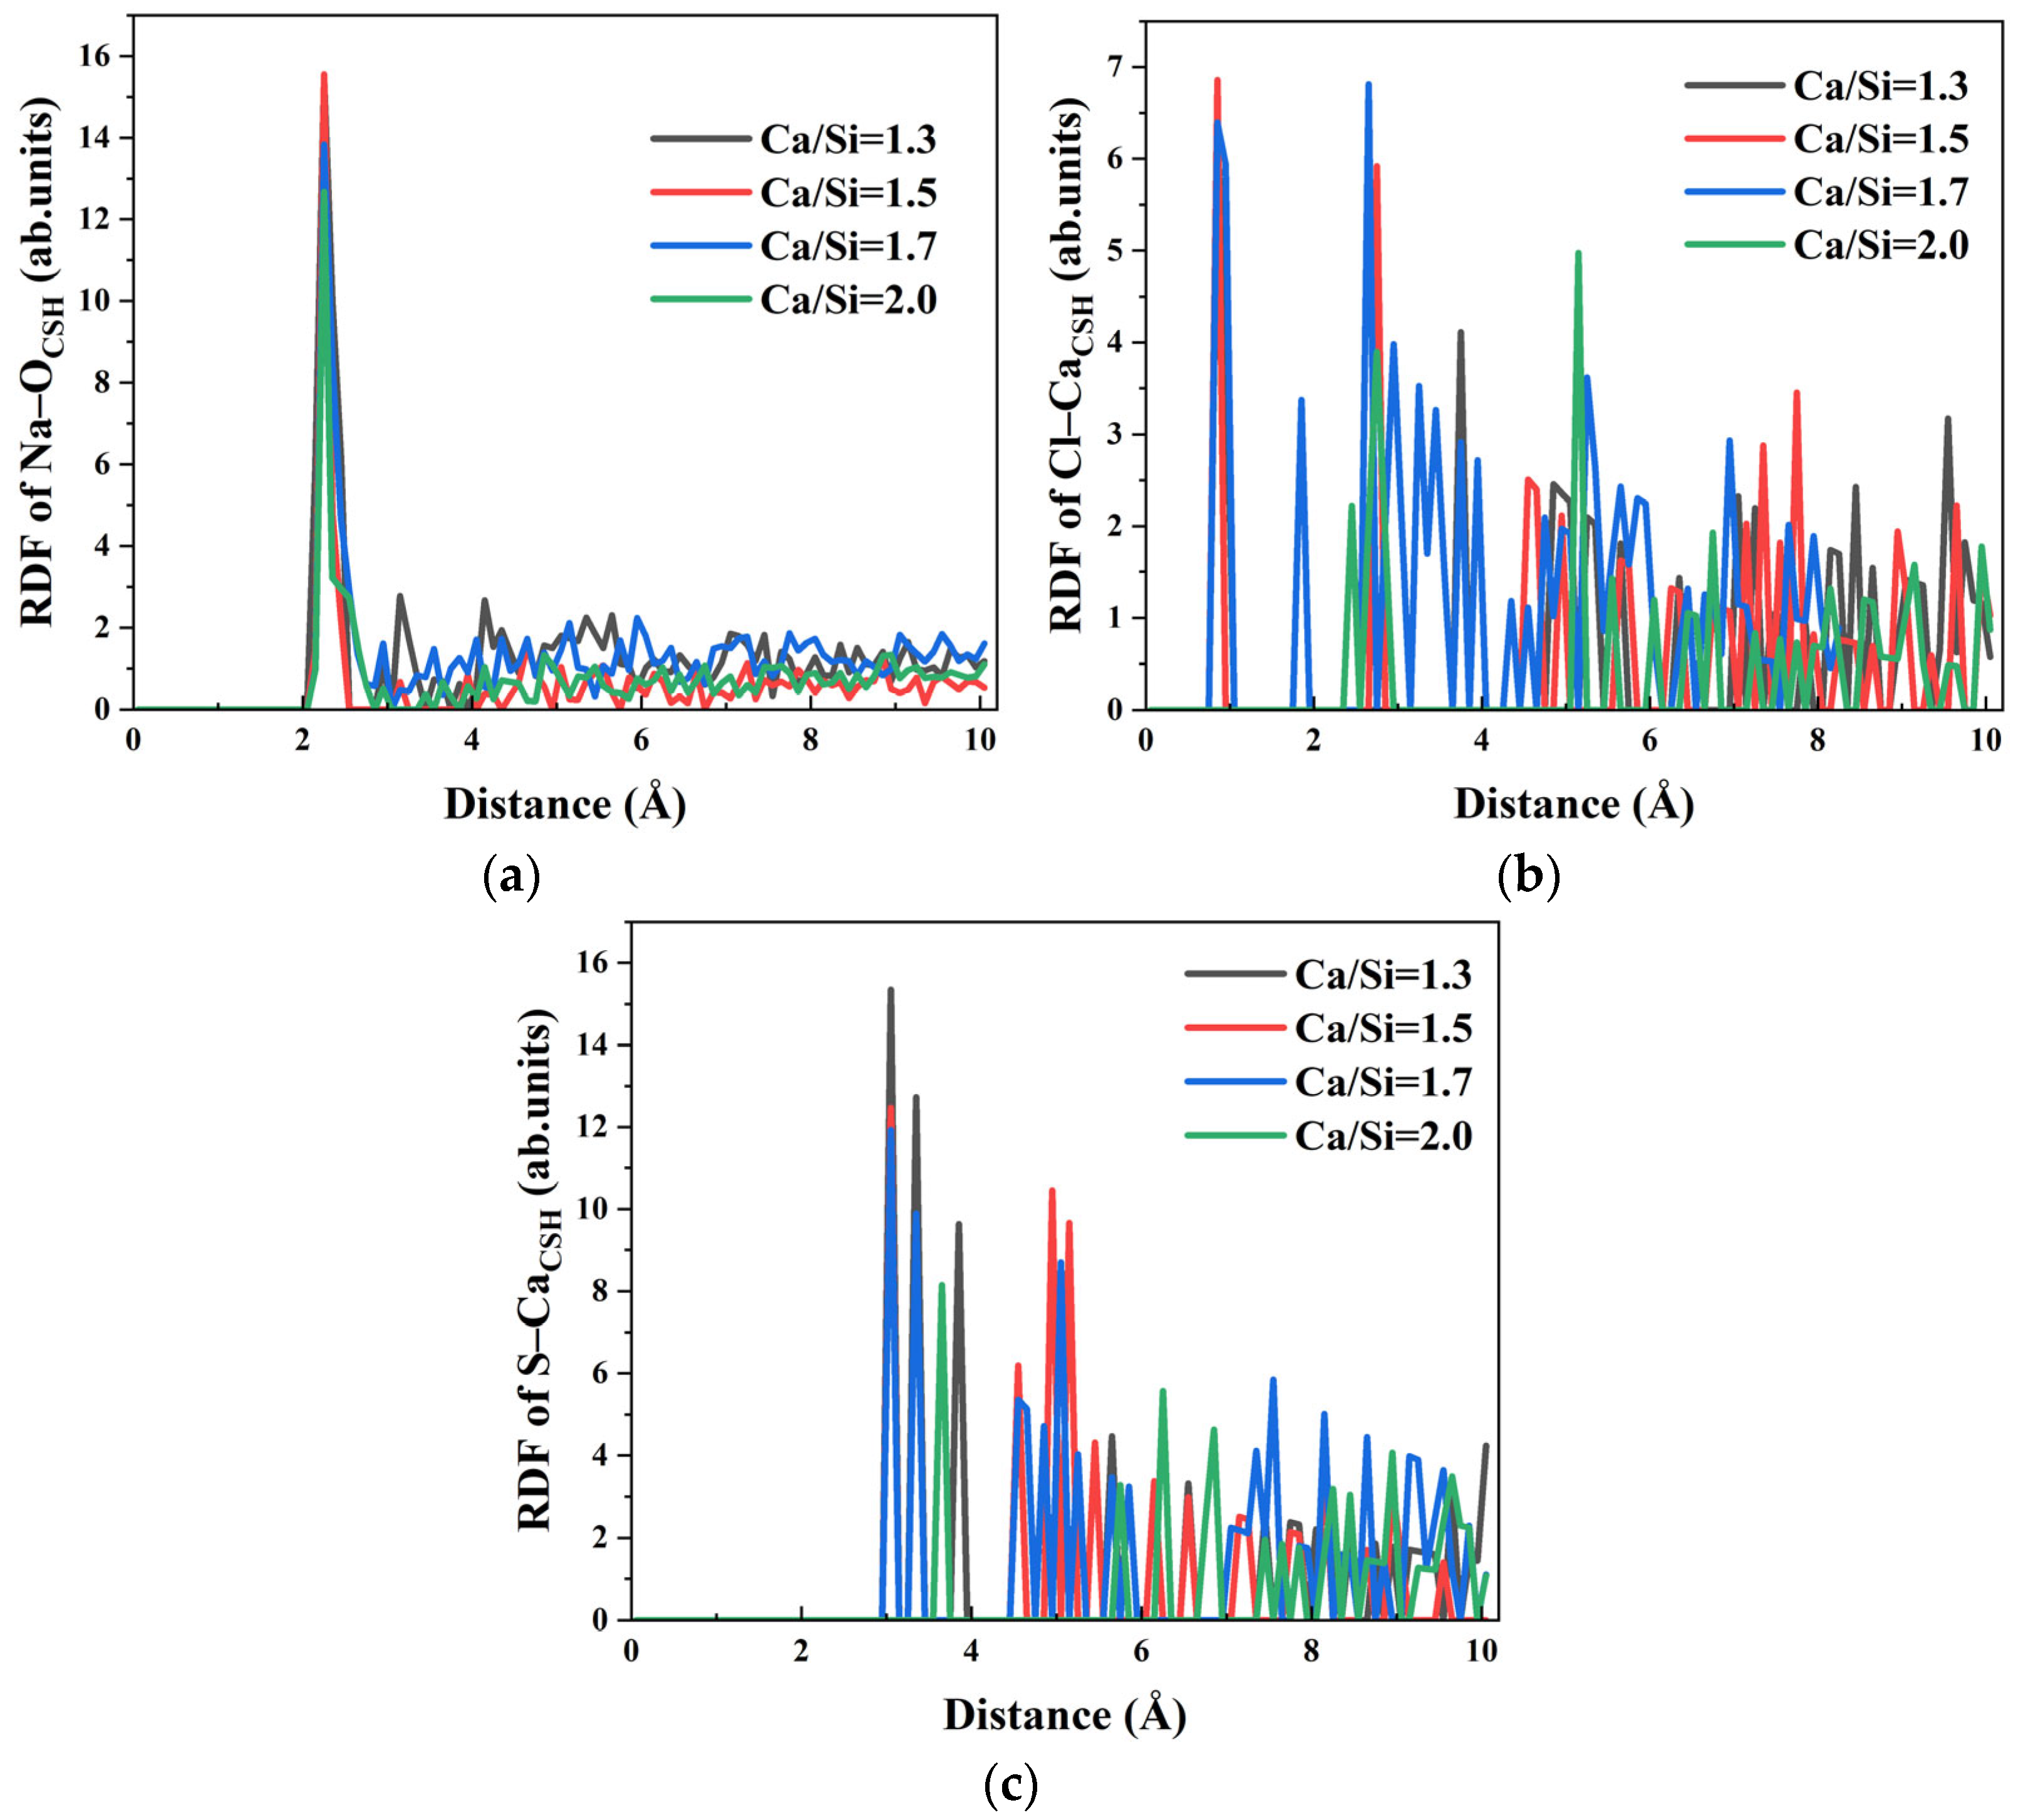
RDF analysis of Na–O
CSH, Cl–O
CSH, and S–O
CSH interactions in
Figure 13 reveals continuous attenuation of peak intensities with increasing Ca/Si ratios. This trend indicates progressively weaker bonding between various ions in the solution and the available surface sites (free hydroxyl groups and Ca
2+ ions) on CSH with high Ca/Si ratio. Notably, while the first peak in Na–O
CSH RDF remains constant at 2.25 Å at all Ca/Si ratios, both Cl–O
CSH and S–O
CSH exhibit significant Ca/Si–dependent peak shifts. Specifically, when Ca/Si ratios = 1.3, 1.5 and 1.7, the first peaks of Cl–O
CSH and S–O
CSH appear at 0.85 Å and 3.05 Å, respectively. When Ca/Si ratio = 2.0, the peak positions shift outward to 2.45 Å and 3.65 Å. The substantial increase in equilibrium bonding distances, coupled with reduced peak intensities, confirms weakened Cl–O
CSH and S–O
CSH interactions at high Ca/Si ratios. The phenomenon correlates with the penetration depth results in
Figure 10, explaining the enhanced filtration effect of Cl
− and SO
42− ions observed at Ca/Si = 2.0 through weakened interfacial bondings.
