Abstract
The incorporation of fly ash into concrete reduces cement consumption by 10–30%, lowers CO2 emissions by 30–50%, cuts costs by 15–25%, and enhances durability, thus reducing maintenance expenses. However, the predictive model for the elastic modulus of fly ash concrete subjected to calcium leaching is still lacking. Regarding the theoretical method, the content of calcium hydroxide and calcium silicate hydrate in fly ash–cement systems is quantitatively calculated according to the hydration reaction relationship between cement, fly ash, and water, and then the porosity of the fly ash–cement matrix and interface transition zone (ITZ) after calcium leaching can be obtained. Based on the theory of two-phase composite spheres and the non-uniform ITZ model, the prediction method for the elastic modulus of leached fly ash concrete can be constructed, which comprehensively considers key parameters such as fly ash content, non-uniform characteristics of the ITZ, and the water–binder ratio (w/b). Additionally, the corresponding experimental investigation is also designed to study the variation regulation of the leaching depth, leaching extent, and elastic modulus of fly ash concrete with leaching time. The prediction method for the elastic modulus of leached fly ash concrete is validated via self-designed experimental methods and third-party experiments. This study further delves into the specific effects of w/b, aggregate volume fraction (fa), fly ash content, and ITZ thickness (hITZ) on the elastic modulus of leached concrete (E). The research findings indicate that an appropriate amount of fly ash can effectively enhance the leaching resistance of concrete. For a leaching degree of 10.0%, 30.0%, and 50.0%, E at w/b = 0.40 exceeds that of w/b = 0.60 by 26.71%, 28.43%, and 30.28%, respectively; E at hITZ = 10 μm exceeds that of hITZ = 50 μm by 16.96%, 15.80%, and 15.11%, respectively; and E at fa = 65% is 39.82%, 43.15%, and 46.12% higher, respectively, than that of concrete with fa = 45%. Furthermore, a linear correlation exists between the elastic modulus and the degree of leaching. The prediction method for the elastic modulus offers a theoretical foundation for in-depth exploration of the durability of leached mineral admixture concrete and its scientific application in practical engineering.
1. Introduction
Concrete structures such as dams, nuclear power plants, underground tunnels, and harbors, subjected to long-term exposure to soft water immersion, face severe threats from calcium leaching [1,2], a complex and highly detrimental process. Under prolonged exposure to soft water, the solid-phase calcium within the hydration products of concrete gradually dissolves and leaches out. This process not only modifies the internal microstructure of concrete, leading to the expansion of the pore structure and an increase in porosity, but also significantly compromises the durability and mechanical properties of concrete structures [3,4]. From a mechanical perspective, the elastic modulus, serving as a critical indicator for evaluating the overall stiffness and deformation capacity of concrete structures, exhibits a significant reduction during calcium leaching. This reduction renders the structure more susceptible to deformation under load, thereby adversely affecting its safety and structural stability [5,6]. Regarding durability, calcium leaching accelerates concrete deterioration and diminishes its resistance to external environmental attacks. This elevates the risk of penetration by harmful ions, potentially triggering a cascade of issues such as reinforcement corrosion, consequently drastically shortening the service life of concrete structures [7,8,9].
To enhance concrete durability, fly ash, one of the most widely used mineral admixtures, is extensively incorporated into concrete mix designs. Characterized predominantly by spherical glassy particles and pozzolanic activity, its inclusion not only effectively reduces cement consumption and carbon emissions but also significantly improves the overall properties of concrete [10,11]. Specifically, the pozzolanic reaction of fly ash consumes calcium hydroxide (CH) formed during cement hydration, generating hydration products like calcium silicate hydrate (C-S-H). This process enhances concrete compactness and durability. Furthermore, through its micro-aggregate effect, fly ash fills internal pores, optimizes the microstructure, and reinforces erosion resistance [12,13]. Nevertheless, the mechanism by which calcium leaching influences the elastic modulus of fly ash concrete in leaching environments remains unclear, necessitating urgent in-depth investigation to improve engineering practice. In concrete materials, the volume fraction and particle size of aggregates exert significant influences on the elastic modulus of concrete. Relevant research results indicate that the aggregate volume fraction is positively correlated with the elastic modulus. Due to the higher elastic modulus of the aggregates, the deformation resistance of the concrete is significantly enhanced with the increase in the volume fraction of the aggregate, leading to an increase in elastic modulus. The influence of aggregate particle size on the elastic modulus is complex. An appropriate particle size can form a rational skeleton structure, facilitating stress transfer and thereby enhancing the elastic modulus, whereas excessively large or small particles can reduce the elastic modulus due to induced structural imperfections [14]. In comparison, the aggregate shape has a relatively minor influence on the mechanical properties and elastic modulus of concrete. It is noteworthy that the extent of this influence is significantly less pronounced than that of the aggregate volume fraction and particle size [15]. The influence of the cement paste matrix on the elastic modulus of concrete primarily depends on two factors: the water–cement ratio and the type of cement. Among these, the water–cement ratio is a key parameter affecting the microstructure of the cement paste. A lower water–cement ratio can markedly improve the paste’s microstructure. For instance, when the water–cement ratio drops from 0.5 to 0.4, the porosity of the paste is substantially reduced, its compactness is significantly enhanced, and the elastic modulus of the concrete increases correspondingly by approximately 20–30% [16]. Additionally, using high-grade cement or incorporating highly reactive mineral admixtures can optimize the structure of hydration products, making them denser and thereby further enhancing the stiffness of the cement paste [17]. The ITZ, the weak area between aggregates and cement paste in concrete, significantly impacts the elastic modulus through its microstructure and mechanical properties. The ITZ typically exhibits higher porosity and a lower hydration product density compared to the bulk paste, resulting in an elastic modulus notably lower than that of the cement paste matrix. This creates a “short board” effect during stress transfer [18]. Some studies have shown that factors such as the thickness and pore distribution within the ITZ diminish the effective stiffness, consequently reducing the overall elastic modulus of the concrete [19].
Concrete is regarded as a three-phase composite material, of which the elastic modulus is closely related to the aggregate, matrix, and interfacial transition zone (ITZ). The volume fraction of the aggregate, porosity of the matrix, and the thickness and porosity of the ITZ are thus the key variables affecting the elastic modulus of concrete. The ITZ in concrete is the weak region between aggregates and bulk paste, with the thickness of approximately 20–50 μm. It is characterized by a high water–cement ratio, high porosity, and oriented arrangement of calcium hydroxide crystals, resulting in inferior mechanical properties and durability compared to the bulk paste [20,21,22]. Scholars have conducted extensive research on predictive models for the elastic modulus of ordinary concrete. To study the multiphase composition characteristics of concrete, a three-phase spherical model theory to predict the effective elastic modulus of concrete was developed [23]. Based on the three-phase model, a four-phase spherical model theory was proposed to further assess the influence of maximum aggregate particle size and ITZ on the elastic modulus of concrete [24]. The study revealed that both the ITZ layer and the maximum aggregate particle size significantly impact the elastic modulus of concrete. Enhancing the elastic modulus of the ITZ by incorporating silica fumes or reducing the thickness of the ITZ by lowering the water–binder ratio can effectively increase the elastic modulus of concrete. However, in their theoretical study, the overlap with the ITZ was ignored, resulting in higher predicted values and affecting the accuracy of the prediction. Gao et al. [25] proposed a numerical model involving the effect of ITZ overlapping, deriving a numerical approach for concrete’s compression properties. Unfortunately, this model also has limitations as it did not consider the non-uniform characteristics of the ITZ. Jia et al. [26] established a novel model for assessing the elastic modulus of fly ash concrete based on the three-phase sphere model, for purpose of investigating the influence mechanism of sustained loading on concrete. The results indicate that the elastic modulus after loading exhibits a minor increment compared to unloaded conditions. It is worth noting that the model did not consider the influence of different particle sizes of aggregates. Hashmi et al. [27] experimentally and theoretically studied the compressive strength and elastic modulus of fly ash concrete specimens at different ages. The results demonstrate that fly ash concrete exhibits higher growth rates in both compressive strength and elastic modulus compared to ordinary concrete, with the increase in curing time. In addition, this enhancement effect is most significant at a 30% fly ash replacement level. It is noteworthy that this analytical model only modified empirical formulas and failed to fully consider the impact of multiple factors. Wang et al. [28,29] used Brownian motion algorithm to evaluate the impact of the ITZ on ionic diffusion and found that the non-uniformity of the interface transition zone has a significant impact on the chloride ion transport performance of concrete, which cannot be ignored. Additionally, Tian et al. [30] employed finite element simulations to evaluate the impact of the ITZ on ionic diffusion. The computational results revealed that the diffusivity of the ITZ is approximately 40 times that of the bulk paste, and increases in either ITZ diffusivity or thickness will accelerate ionic migration in concrete. Chen et al. [31] developed a novel meshing technique by discretizing concrete models with an arbitrary ITZ thickness. The results demonstrated that the aggregate shape has negligible influence on the elastic modulus of concrete, whereas ITZ thickness is the critical parameter. Song et al. [32] established a three-phase finite element model which comprises a homogeneous bulk cement paste, aggregates, and ITZ. Based on finite element calculations, they assessed the ITZ’s influence on concrete’s macroscopic properties, finding that the elastic modulus of the ITZ exerts a greater impact on effective performance than ITZ thickness does. Although using grid subdivision was beneficial for model processing, it could lead to a significant increase in computer running time. Ren et al. [33] used the discrete element method to study the influence of the ITZ on the micro-mechanical properties of concrete. The results indicate that with the increase in ITZ strength, the compressive strength shows a non-linear increasing trend. This study has certain limitations as it did not consider the impact of fly ash on the mechanical properties of concrete. Liang et al. [34] studied the effects of recycled aggregate and ITZ properties on the elastic modulus of concrete using a recycled concrete aggregate model. Specifically, to simplify the calculation process, this study also did not consider the non-uniform characteristics of the ITZ. It is worth noting that the above theoretical models are all based on the assumption of ITZ uniformity, which has a certain gap with the non-uniform characteristics of the actual ITZ [35,36]. In addition, there is still a lack of research on the elastic modulus degradation mechanism of fly ash concrete in leached environments. Considering the issues in the aforementioned research, this study has three merits: Firstly, the overlap and non-uniformity of the ITZs will be considered in the developed model. Secondly, the influence of fly ash content on the calcium leaching resistance of concrete will be studied and analyzed. Thirdly, through sensitivity analysis, the influence of various factors on the elastic modulus of dissolved fly ash concrete will be fully explored.
By repeatedly using the two-phase composite sphere model, this study will establish a predictive model for the elastic modulus of leached fly ash concrete, comprehensively considering key parameters such as fly ash content, heterogeneous characteristics of the ITZ, and water-to-binder ratio. Through systematic experimental validation, the model’s reliability and predictive accuracy will be confirmed. Based on that method, this study will analyze the influence patterns of critical factors (including water-to-binder ratio, aggregate volume fraction, fly ash content, and interfacial transition zone thickness) on the elastic modulus of leached fly ash concrete. The findings will provide a significant theoretical basis for accurately evaluating the degradation mechanisms of mechanical properties and predicting the durability of fly ash concrete in leaching environments.
2. Experimental Study on Elastic Modulus of Dissolved Fly Ash Concrete
2.1. Materials
These experiments utilize P.O 42.5 ordinary Portland cement with densities of ρc = 3150 kg/m3 for cement and ρFA = 2300 kg/m3 for fly ash. Key chemical compositions are detailed in Table 1. River sand serves as a fine aggregate (density: 2650 kg/m3), while crushed stone is used as a coarse aggregate (apparent density: 2700 kg/m3). Aggregate gradation follows the Fuller distribution, with largest and smallest particle sizes of Dmax = 16.0 mm and Dmin = 0.3 mm, respectively. Tap water (pH: 6.8) is used for specimen mixing and curing. According to previous research, the typically adopted fly ash replacement ratio ranges from 10% to 30% by mass of binder materials [37]. However, it should be noted that specialized concrete formulations incorporating high-volume fly ash at 40–50% replacement levels have been developed [38], primarily aimed at reducing cement consumption and lowering carbon emissions. In this experiment and simulation, the mix proportion of fly ash concrete is based on conventional conditions, consequently establishing the fly ash replacement range at 0% to 20%. Fly ash replacement levels (FA) are thus set at 0%, 10%, and 20% with a constant water-to-binder ratio (w/b) of 0.5 and aggregate volume fraction (fa) of 45%. Mixture proportions for each concrete group are presented in Table 2.

Table 1.
Chemical constituents of cement and fly ash.

Table 2.
Mixture proportions of concrete.
2.2. Accelerated Calcium Leaching Test
Under natural conditions, the leaching process is exceedingly slow. To accelerate that process, this experiment employed the chemical reagent acceleration method using NH4NO3 solution immersion [39]. First, fly ash concrete specimens are fabricated as cylinders measuring 100 mm × 500 mm. Additionally, seven specimens of the identical mix proportion are prepared: three designated for leaching depth measurement, three for elastic modulus testing, and one for mercury intrusion porosimetry (MIP) testing. After casting, the specimens are kept stewing for 24 h before demolding, and then subsequently placed in a standard curing room for 28 days. Following curing, a dual-blade numerical control v-strop cutter is used to section the specimens into 200 mm tall cylindrical test specimens. To ensure leaching occurred exclusively on the lateral surfaces, the upper and lower ends of the specimens are sealed with wax. The specimens are then immersed in a 6 mol/L NH4NO3 solution; the experimental setup is illustrated in Figure 1. Crucially, the pH value of the solution is monitored daily and replenished promptly to maintain it within the range of 8.5–9.2, thereby ensuring effective leaching.
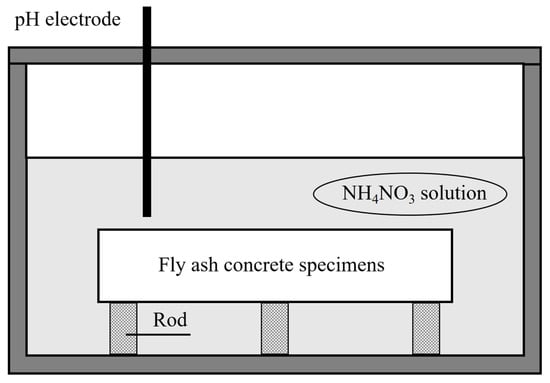
Figure 1.
Self-designed experimental setup.
At specified leaching durations (3, 14, 28, 45, and 90 d), specimens are removed from the container and air-dried. Before testing, a handheld cutter is used to perform the mid-height sectioning to expose the evaluation surface. The colorimetric method involved spraying phenolphthalein reagent onto the leached concrete surface. Regions unaffected by leaching exhibited a purple–red color due to alkalinity, while leached areas remained unchanged. The colorimetric test results for the specimen leached for 14 days are shown in Figure 2. Sixteen points are uniformly selected along the concrete leaching front. The digital vernier caliper is used to measure the distance from the specimen edge to the color boundary line at each point. The leaching depth was determined via weighted averaging of these measurements. Specimens of the same mix proportion and leaching duration are subjected to elastic modulus testing using a hydraulic servo universal testing machine.
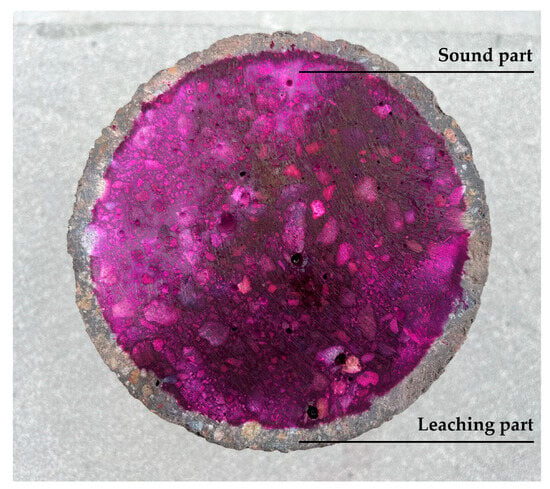
Figure 2.
Acid–base indication experiment at leaching time of 14 d.
2.3. Material Characterization of Mercury Intrusion Porosimetry (MIP)
The widely established techniques for pore structure analysis in porous media include Brunauer–Emmett–Teller (BET) gas adsorption and mercury intrusion porosimetry (MIP). The BET method quantifies the specific surface area and pore architecture through gas adsorption isotherms, recognized as a robust and validated characterization approach. Mercury intrusion porosimetry operates on the principle of pressurized mercury intrusion/extrusion, where pore parameters are derived from the equilibrium between applied pressure and mercury surface tension. It should be noted that this study exclusively employs MIP. For cement-based materials, MIP testing mainly consists of three steps:
- (1)
- Specimens are cut into 10 ± 2 mm cubes and dried at 105 °C for 24 h until achieving a constant mass (<0.1% variation). The sampling process can be seen in Figure 3, and six samples are selected from each specimen. After vacuum degassing (<10 Pa for 30 min), the geometric volume is measured with 0.1 mm precision. This stage eliminates moisture and entrapped air in accessible pores.
- (2)
- Mercury intrusion testing following ISO 15901-1 [40]: the test starts at 0.1 psi (detecting >360 μm pores) and progresses to 60,000 psi (3.6 nm pores). Each pressure step maintains 120 s equilibration, with 0.1 μL resolution capacitance measurements. Critical 10–100 μm pores are analyzed using 0.5 psi increments between 20 and 200 psi.
- (3)
- Total porosity = (intruded Hg volume/geometric volume) × 100%.
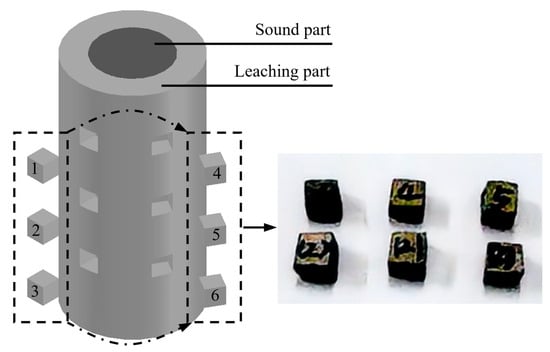
Figure 3.
Sampling process for MIP testing.
2.4. Material Characterization of Scanning Electron Microscope (SEM)
In this experiment, an SEM is used to detect the changes in porosity of fly ash concrete before and after calcium leaching. The testing process mainly includes two steps:
- (1)
- Sample preparation: Cut concrete specimens (10 mm × 10 mm × 5 mm) from representative areas, sequentially polish with 400–1500-grit abrasive papers, then coat with 10–15 nm silver film via ion sputtering. Dry at 60 °C and store airtight to prevent hydration interference, ensuring surface roughness < 1 μm.
- (2)
- SEM analysis: Place samples in SEM chamber (5 × 10⁻³ Pa vacuum), and then set accelerating voltage (15–30 kV) and working distance (8–10 mm). Acquire images via SE/BSE modes coupled with EDS elemental mapping. Initially scan at 500× to locate features, then switch to 2000–5000× for hydrate morphology and pore structure observation.
2.5. Results and Discussion
According to the above experimental method, the leaching depth l, leaching degree DC, and elastic modulus Efc of three groups of fly ash concrete specimens with different leaching times A0, A1, and A2 are measured. The leaching degree of the concrete specimens can be calculated as follows:
where S0, S1, and S2 represent the total cross-sectional area, leached cross-sectional area, and undissolved cross-sectional area of the specimen, respectively.
The changes in leaching depth, degree, and elastic modulus of each group of specimens with leaching time are shown in Table 3.

Table 3.
The depth of leaching, the degree of leaching, and elastic modulus of specimens with leaching time.
Based on the tabulated data, it is observed that at a constant water–binder ratio, the elastic modulus of fly ash-incorporated concrete exhibits a significantly lower rate of decline compared to ordinary concrete as the leaching degree increases. This indicates that incorporating an appropriate amount of fly ash can effectively enhance the resistance to dissolution leaching. This phenomenon may be attributed to the secondary hydration reaction of fly ash: the active SiO2 and Al2O3 in fly ash react with calcium hydroxide (CH) generated from cement hydration to form a dense calcium silicate hydrate (C-S-H) gel, which effectively reduces porosity and simultaneously blocks dissolution pathways. In contrast, for ordinary concrete, after the preferential leaching of the hydration product CH, the pore connectivity sharply increases, resulting in an accelerated deterioration of the elastic modulus.
The evolution of porosity in fly ash concrete specimen A2 under the leaching effect is measured using MIP testing, as shown in Figure 4, wherein after leaching, the number of pores larger than 200 nm and smaller than 200 nm within the specimen increases. Specifically, the dissolution of calcium hydroxide (CH) generates larger pores (typically >200 nm), while the decalcification of C-S-H gel produces smaller pores (generally <200 nm).
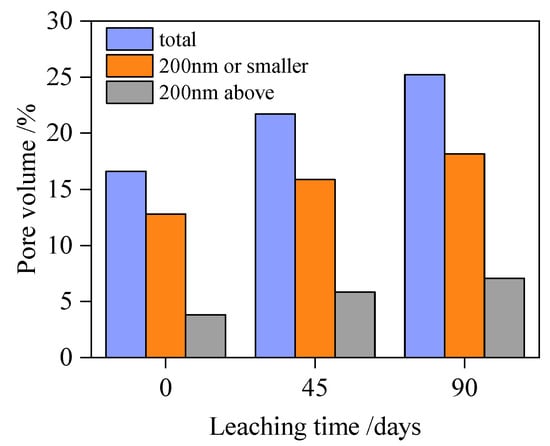
Figure 4.
The change in porosity of leached fly ash concrete.
For specimen A2, the results of SEM testing are shown in Figure 5, Figure 6 and Figure 7. Figure 5a and Figure 5b, respectively, show the hydration products and pore distribution before and after leaching in the matrix. The figures show that after leaching, there is a phenomenon of calcium hydroxide dissolution and a significant increase in porosity in the microstructure of the bulk paste. Figure 6a,b display the microstructure morphology of the ITZ before and after leaching, whose variation pattern is consistent with the case in the matrix. As Figure 7 shows, the surface of the leached aggregate becomes smooth, attributed to the hydration products accumulated on the surface of the aggregate being dissolved.
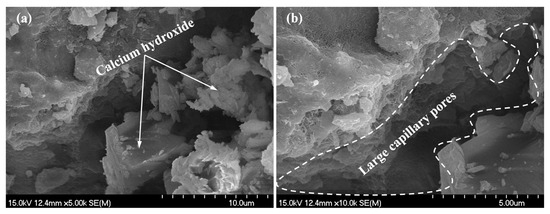
Figure 5.
SEM detection for matrix: (a) before leaching; (b) after leaching.
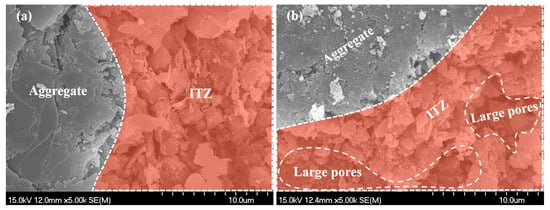
Figure 6.
SEM detection for ITZ: (a) before leaching; (b) after leaching.
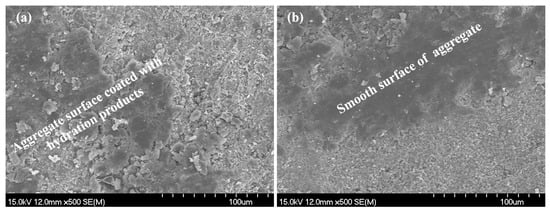
Figure 7.
SEM detection for aggregate surface: (a) before leaching; (b) after leaching.
3. Prediction Model for Elastic Modulus of Leached Fly Ash Concrete
Building upon the experimental findings (i.e., accelerated leaching test, MIP, and SEM) of leached fly ash concrete with 0–20% FA replacement, the change characteristics of the elastic modulus, porosity, and microstructure can be analyzed. These experimental results can provide a theoretical basis for subsequent theoretical modeling and data support for model validation.
3.1. Prediction Theory of Elastic Modulus of Two-Phase Composite Materials
At the macro level, the composition of the two-phase composite sphere consists of two major parts: the inclusion phase and the matrix phase, as shown in Figure 8. This section applies homogenization theory to calculate two-phase composite materials as equivalent spherical elements with an identical elastic modulus. It is noteworthy that the two-phase composite sphere theory establishes an effective analytical framework for probing composite material properties. This model assumes that the composite comprises numerous periodically distributed two-phase spherical units, each consisting of a core and a shell structure. The core represents the inclusion phase, while the shell corresponds to the matrix phase. Both core and shell materials are treated as isotropic and homogeneous, without accounting for microstructural orientation or spatial heterogeneity in material properties [41].
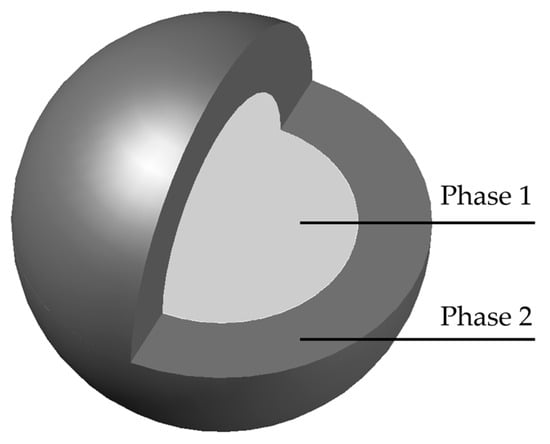
Figure 8.
Two-phase composite sphere model.
Macroscopically, homogenization methods enable the simulation of composites as equivalent media with effective elastic moduli. Using elasticity theory, the effective bulk modulus Ke and shear modulus Ge of the two-phase composite spheres depicted in Figure 8 can be determined by [41]
where K1 and K2 represent the effective bulk moduli of phases 1 and 2; G1 and G2 represent the effective shear moduli of phases 1 and 2; and f1 is the volume fraction of phase 1.
where v1 and v2 denote the Poisson’s ratios of phase 1 and phase 2; u1, u2, and u3 denote the functions of parameters G1, G2, v1, and v2; and ω1, ω2, and ω3 denote the functions of parameters (G1, G2, v1, and v2), volume fraction of phase 1 (f1), and functions (u1, u2, and u3).
Once Ge and Ke are known, Ee is solved by
where Ee represents the effective elastic modulus.
3.2. Inhomogeneous Model of ITZ
From the mesoscopic perspective, concrete is a three-phase composite material composed of cement bulk paste, ITZ, and aggregate [42,43]. The relative magnitudes of the elastic moduli for the various components of concrete are illustrated in Figure 9 [44]. This section adopts the concentric spheres model shown in Figure 10 to represent the three-phase fly ash concrete. Within this model, the aggregate has an equivalent radius of ra; the region between the inner radius ra and the outer radius rb represents the ITZ; and the region between the inner radius rb and the outer radius rc represents the fly ash–cement paste.
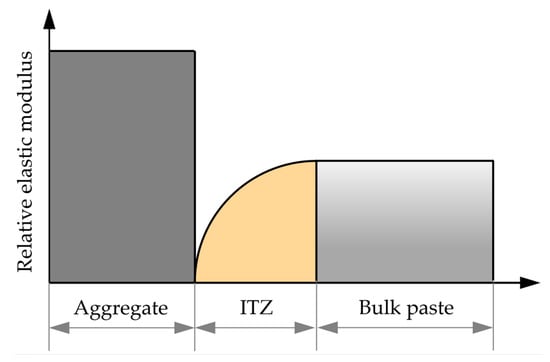
Figure 9.
Relative elastic modulus of each component of fly ash concrete.
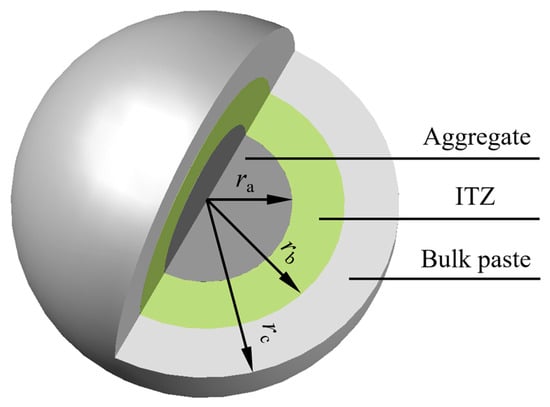
Figure 10.
Three-phase composite sphere model of fly ash concrete.
To determine the volume fraction of the interface fi and bulk cementitious paste fbulk, it is first necessary to analyze the size distribution of the aggregate. For Fuller grading, the cumulative distribution function of aggregate particles with respect to particle size can be expressed as
where n is the grading type coefficient of the aggregate. For the Fuller distribution of the aggregate, n is fixed at 2.5.
The fi can be expressed as the function of the ITZ thickness h, which can be expressed as [45]
where ρ is the number of aggregate particles per unit volume; <R> is the average radius of the aggregate; and <R2> is the average mean square radius of the aggregate.
The volume of bulk paste fbulk can thus be expressed as
Due to the edge wall effect on the surface of aggregates, the distribution of cementitious particles (cement and fly ash) in the interface transition zone exhibits a gradient distribution. According to Crumbie’s research [46], the initial distribution density of cementitious materials can be expressed as
where r is the distance from the ITZ or bulk paste to the center of the aggregate; and b0 = b1 + b2 + b3 + b4. The relationship between bj (j = 1, 2, 3, and 4) and the initial water–cement ratio (w/b)0 is expressed as follows:
Considering the non-uniformity of the ITZ, it is necessary to divide it into N concentric shell elements of equal thickness, as shown in Figure 11, to calculate the elastic modulus and shear modulus of each shell element using the two-phase composite sphere theory. Since the volume of cementitious material in the composite ball is equal to the actual volume of cementitious material in fly ash concrete, fb,bulk can be calculated as follows:
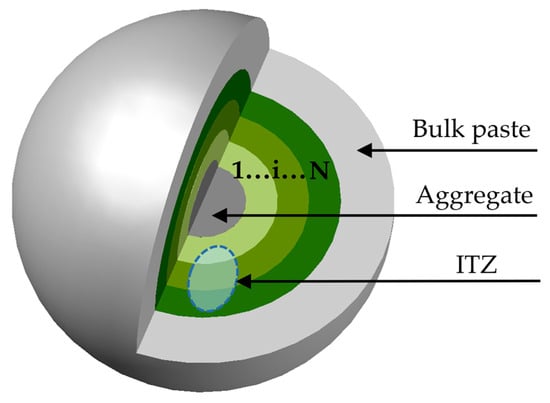
Figure 11.
Non-uniformity of ITZ divided into N layers.
The local water–cement ratio (w/b)r at any point in the ITZ region can be calculated as follows:
3.3. Porosity Calculation After Calcium Leaching
In the above ITZ uniformly divided into N layers, according to Powers’ model [47,48], the capillary pores of any layer of bulk paste can be expressed as follows:
where α represents the hydration degree; mc, mw, and mFA represent the mass of cement, water, and fly ash in the mixing proportion, respectively; αult is the ultimate degree of hydration; t is the curing time; τ and θ represent parameters related to the chemical composition of cement and fly ash; PC4AF, PNa2Oeq, PC3S, PC3A, and PNa2O denote the mass ratios of C4AF, Na2Oeq, C3S, C3A, and Na2O to the cement mass, respectively; Pcem and PFA are the mass ratios of cement and fly ash to the total binder mass, respectively; and PFA-CaO is the mass ratio of CaO to fly ash mass in fly ash.
The decalcification of C-S-H and CH after calcium leaching will lead to additional porosity, thereby reducing the elastic modulus of fly ash concrete. To quantify this impact, it is necessary to clarify the content of CH and C-S-H generated during cement hydration and secondary reaction of fly ash. According to existing research [49,50], the hydration reactions of cement and fly ash can be represented as follows:
where H, S, and C denote H2O, SiO2, and CaO, respectively; C1.7SH4 and C1.1SH3.9 represent the cement hydration product and pozzolanic reaction product; AS denotes Al2O3 + SiO2; x and y are parameters related to the chemical composition of fly ash; mCH denotes the mass of calcium hydroxide; PCaO, PSiO2, PAl2O3, and PFe2O3 are the mass ratios of CaO, SiO2, Al2O3, and Fe2O3 to cement mass, respectively; and PFA-SiO2 and PFA-Al2O3 are the mass ratios of SiO2 and Al2O3 to fly ash mass.
The increase in the porosity of the ITZ and bulk paste caused by C-S-H and CH decalcification can therefore be calculated as follows [51,52]:
where mCH-ITZ and mCH-bulk represent the CH mass generated by cement hydration in the ITZ and bulk paste, respectively; mC1.7SH4-ITZ and mC1.7SH4 represent the mass of hydrated calcium silicate generated by cement hydration in the ITZ and bulk paste, respectively; mC1.1SH3.9-ITZ and mC1.1SH3.9-bulk represent the mass of hydrated calcium silicate generated by the reaction of fly ash in the ITZ and bulk paste, respectively; and ρC1.7SH4, ρC1.1SH3.9, and ρCH are the corresponding densities.
To validate the effectiveness of the porosity calculation model for leached fly ash concrete established in this study, the calculated results are compared with the MIP test results. The comparison between the two is shown in Figure 12, wherein the experimental values are highly consistent with the calculated values, with a correlation coefficient of 0.971, thereby validating the effectiveness of the porosity calculation method.
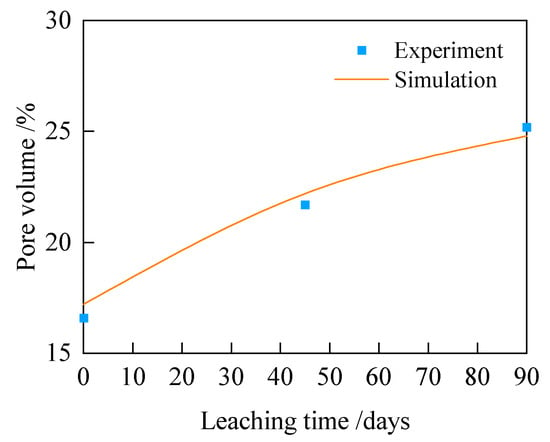
Figure 12.
Comparison between calculated and experimental values of porosity of leached fly ash concrete.
3.4. Prediction for Elastic Modulus of Leached Fly Ash Concrete
Regarding the proposed heterogeneous ITZ, the porosity can be assumed to be equal at the ITZ–matrix interface. Due to the wall effect adjacent to the aggregate surface, the porosity at the aggregate–ITZ boundary (i.e., the aggregate surface) approaches unity. Due to the radial variation in porosity in the ITZ, the region of the ITZ is discretized into N equally thick spherical shell elements when calculating the elastic modulus of leached fly ash concrete. Based on the aforementioned chemical reaction equation, the porosity at different leaching degrees can be determined. When treating pores as the inclusion phase and solid as the matrix phase, the bulk modulus and shear modulus of each leached ITZ and bulk paste are computed using the two-phase composite sphere formulation. The elastic modulus of leached fly ash concrete is then calculated via a sequential homogenization method:
- (1)
- Construct the initial composite sphere model: The aggregate and the primary ITZ shell unit constitute the first composite sphere, wherein the aggregate is treated as the inclusion phase and the primary interfacial shell as the matrix phase. Via the two-phase composite sphere formulation method, the effective bulk modulus and shear modulus of this composite sphere are calculated using the bulk moduli, shear moduli, and volume fractions of both the aggregate and primary interfacial shell.
- (2)
- Construct the 2nd to Nth composite spheres sequentially: The first composite sphere and secondary ITZ shell unit are combined to form the second composite sphere, wherein the first composite sphere serves as the inclusion phase and the secondary interfacial shell as the matrix phase. Following an identical computational procedure, the bulk modulus and shear modulus of the k-th composite sphere (k = 2, 3, ..., N) are calculated using the two-phase composite sphere formulation. This process is iterated by successively combining the preceding composite sphere with the next ITZ shell unit. After N − 1 computational steps, the effective bulk and shear moduli for composite spheres 2 through N are obtained.
- (3)
- Construct the (N + 1)-th composite sphere and derive the elastic modulus of leached concrete: Ultimately, the N-th composite sphere and cement paste matrix constitute the (N + 1)-th composite sphere, with the N-th composite sphere serving as the inclusion phase and the cement paste as the matrix phase. The bulk modulus K(N+1) and shear modulus G(N+1) of this composite sphere are calculated. Subsequently, the elastic modulus of leached concrete is obtained through the mathematical relationship between elastic modulus and the computed bulk/shear moduli.
Through analysis of computational results under varying N-values, this study establishes the variation pattern of elastic modulus with the number of spherical shell elements (N), as depicted in Figure 13. Significant solution oscillations occur at lower N-values, attributable to insufficient discretization refinement for accurately capturing radial variations in ITZ porosity, thereby compromising modulus calculation accuracy. As N increases, results progressively stabilize. Computational solutions are considered converged when N ≥ 3000, satisfying prescribed accuracy requirements. This convergence confirms that the discretized spherical shell elements sufficiently resolve interfacial porosity gradients, yielding reliable elastic modulus predictions for leached concrete. The complete computational workflow is illustrated in Figure 14.
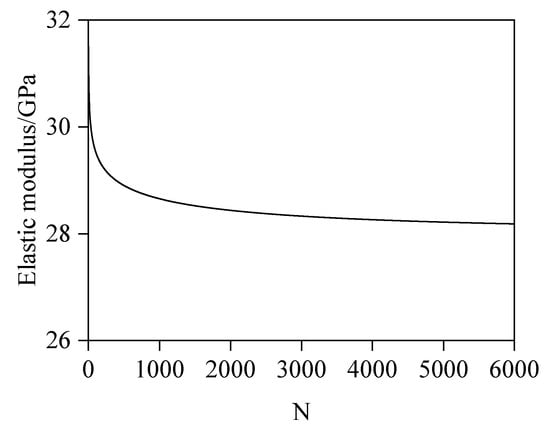
Figure 13.
Variation in E with N.
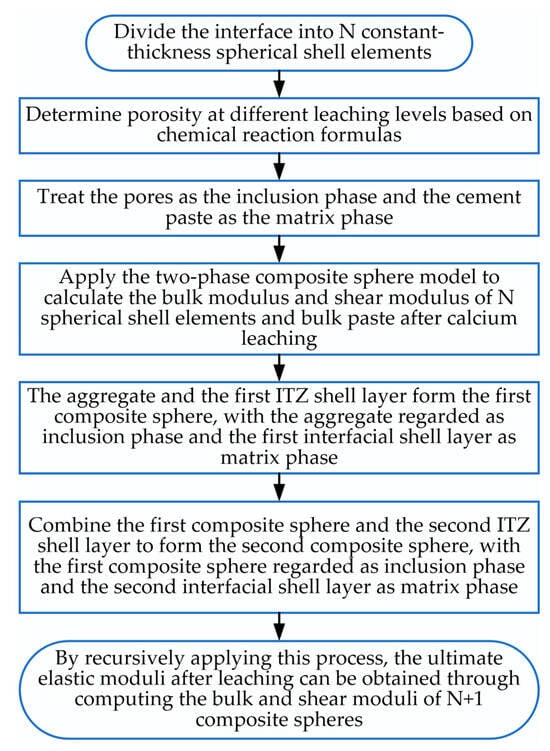
Figure 14.
Calculation flowchart of elastic modulus of fly ash concrete.
4. Validation and Parametric Analysis
4.1. Model Validation
To validate the effectiveness of the prediction method for the elastic modulus of fly ash concrete, the predicted values are compared with self-conducted experimental values derived from Section 2, and the mixture proportions of concrete are also detailed. The CTS-H600 hydraulic servo universal testing machine is employed to measure the elastic modulus of concrete specimens after leaching. In the corresponding theoretical calculations, the variables in the simulation calculation are consistent with the experimental variables. The morphology of the aggregate is assumed to be spherical. The range of aggregate particle size is 0.3–16 mm and follows the Fuller distribution. Some specific fixed parameters are assigned as follows, primarily referencing [53]: The bulk modulus and shear modulus of cement paste are fixed at 22.83 GPa and 11.77 GPa, respectively, with a Poisson’s ratio of 0.28. The bulk modulus and shear modulus of the aggregate are 43.79 GPa and 37.05 GPa, respectively, with a Poisson’s ratio of 0.17. The ITZ thickness is determined as 30 μm. As shown in Figure 15, the simulation results closely align with the experimental data, with correlation coefficients of 0.973, 0.975, and 0.910, respectively, validating the reliability of the predictive method. By calculating the relative error between the experimental and simulated values, as shown in Figure 15, the maximum relative error between the two is only 4.6%, further proving the effectiveness and rationality of the simulation method proposed in this study.
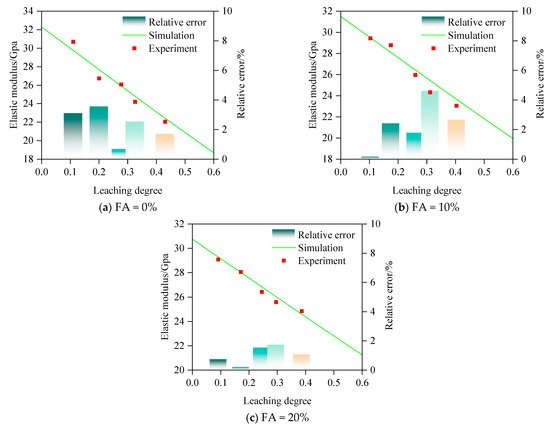
Figure 15.
Experimental validation of prediction model.
To verify the general applicability of the established model, we also selected third-party experimental results for validation. The test results from Huang et al. [54] are selected for validation. In their experiments, they employed Type I ordinary Portland cement (ASTM C150 Grade 42.5) with a water-to-cement ratio of 0.53. The concrete mix design incorporated continuously graded aggregates (0.15–20.0 mm) adhering to Fuller’s optimal curve, maintaining a 70% aggregate volume fraction. Specimens were demolded 24 h post-casting and subsequently cured under standard conditions (20 ± 2 °C, >95% RH) for 28 days. Following curing, samples underwent chemical leaching treatment via immersion in 6 mol/L ammonium nitrate solution. The elastic modulus of leached specimens was determined using the MTS810 hydraulic servo universal testing machine (MTS Industrial Systems (China) Co., Ltd., Beijing, China). The specific fixed parameters (e.g., the bulk modulus and shear modulus of the aggregate, the morphology of the aggregate, etc.) used in the simulation are the same as those in the first validation case. The comparison between the simulation and experimental results is illustrated in Figure 16, showing that the simulation results are in good agreement with the experimental data. The corresponding correlation coefficient is calculated as 0.988. This comparison result further validates the reliability of the methodology proposed in this study. The relative error between the simulated values and Huang’s experimental values is shown in Figure 16, where the relative error of both is within 8%, which once again verifies the reliability of the simulation method employed in this study.
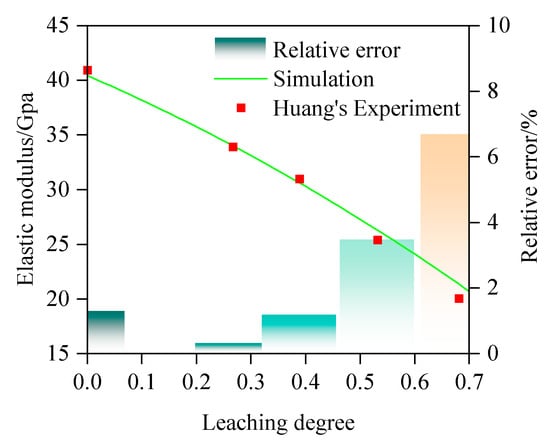
Figure 16.
Experimental validation of prediction model.
4.2. Parametric Analysis
4.2.1. The Influence of w/b on E
In the simulation analysis, the parameter values are shown in Table 4. It is noteworthy that the morphology of the aggregate is assumed to be spherical. The range of aggregate particle size is 0.3–16 mm and follows the Fuller distribution, and the aggregate adopts Fuller gradation. The relationship between E and Dc at different w/b values is shown in Figure 17, demonstrating that under identical Dc values, E decreases with an increasing w/b, primarily due to prominently elevated porosity induced by higher w/b values. Quantitative analysis reveals that the elastic modulus ratios (relative to the value at 60.0% leaching) at 10.0%, 30.0%, and 50.0% leaching degrees are 1.42, 1.25, and 1.08 for w/b = 0.4; 1.37, 1.22, and 1.07 for w/b = 0.5; and 1.47, 1.28, and 1.09 for w/b = 0.6. Notably, for Dc = 10.0%, 30.0%, and 50.0%, E at w/b = 0.40 exceeds that of w/b = 0.60 by 26.71%, 28.43%, and 30.28%, respectively, highlighting the pronounced impact of w/b on mechanical performance. Correspondingly, for a water–cement ratio of 0.4 and dissolution degrees of 0, 10%, 30%, 50%, and 60%, the porosity of concrete is 12.47%, 14.52%, 18.62%, 22.71%, and 24.76%, respectively; 16.63%, 18.34%, 21.77%, 25.21%, and 26.92% for w/b = 0.5; and 20.10%, 21.97%, 25.73%, 29.49%, and 31.37% w/b = 0.6. The mechanism of w/b on the elastic modulus of concrete can be explained as follows: The w/b governs porosity and hydration product density. Higher w/b values generate excess capillary pores from free water evaporation and less hydration products, reducing matrix compactness. In addition, these pores weaken aggregate–paste interfacial stiffness, diminishing load-transfer capacity and thus the elastic modulus of concrete. Conversely, lower w/b promotes dense hydration products (e.g., C-S-H gels), decreasing porosity and enhancing the modulus of concrete.

Table 4.
The values of variables.
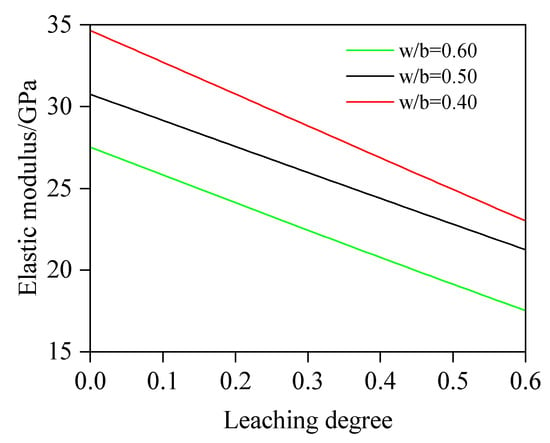
Figure 17.
Effect of w/b on E.
4.2.2. The Influence of FA on E
In this case, w/b is fixed at 0.5, and FA is 0, 20%, and 40%. The values of other variables are consistent with those in Section 4.2.1. Figure 18 shows the relationship between E and Dc at various FA values. The results show that fly ash concrete has a significantly slower reduction rate in the elastic modulus compared to plain concrete, which indicates that appropriate addition of fly ash will enhance the leaching resistance. With the elastic modulus at 60.0% leaching degree as the reference, the quantitative analysis yields a rate of 1.60, 1.35, and 1.11 times slower at 10.0%, 30.0%, and 50.0% leaching degrees, respectively, for FA = 0%; 1.37, 1.22, and 1.07 times slower, respectively, for FA = 20%; and 1.28, 1.16, and 1.05 times slower, respectively, for FA = 40%. Notably, for FA = 0%, 20%, and 40%, the decrease rates of elastic modulus are 22.7, 15.8, and 12.2 GPa.
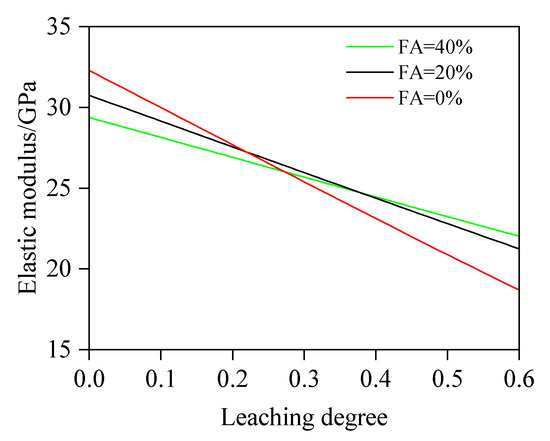
Figure 18.
Effect of FA on E.
4.2.3. The Influence of fa on E
Regarding the influence of fa on E, w/b is fixed at 0.5, and fa is 45%, 55%, and 65%. The values of other variables are consistent with those in Section 4.2.1. Figure 19 shows the relationship between E and Dc at various fa values, where for a given degree of leaching, the elastic modulus increases with the rise in fa. Quantitative analysis shows the following: at concrete leaching degrees of 10.0%, 30.0%, and 50.0%, the elastic modulus of concrete with fa = 65% is 18.58%, 19.99%, and 21.17% higher, respectively, than that of concrete with fa = 55%; the elastic modulus of concrete with fa = 55% is 17.91%, 19.30%, and 20.59% higher, respectively, than that of concrete with fa = 45%; and the elastic modulus of concrete with fa = 65% is 39.82%, 43.15%, and 46.12% higher, respectively, than that of concrete with fa = 45%. From the simulation results, the variation regulation of the elastic modulus is sensitive to the volume fraction of the aggregate and exhibits a similar linear variation pattern.
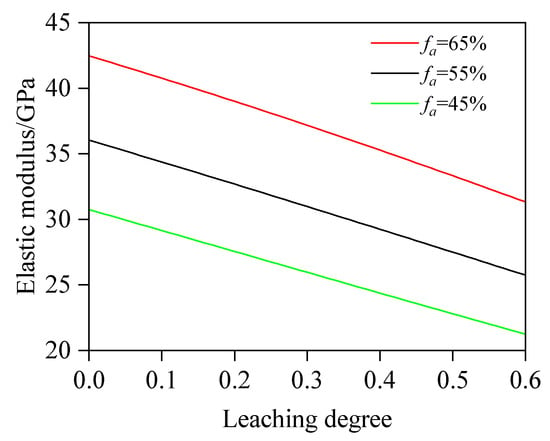
Figure 19.
Effect of fa on E.
4.2.4. The Influence of ITZ Thickness on E
In this case, w/b is fixed at 0.5, FA is 0%, and the ITZ thickness is 10, 30, and 50 μm. The values of other variables are consistent with those in Section 4.2.1. Figure 20 presents the relationship between E and Dc at different ITZ thicknesses. The results demonstrate that under identical leaching degrees, E decreases with an increasing ITZ thickness, primarily due to the higher porosity and lower elastic modulus in the ITZ. Quantitative analysis reveals that when hITZ decreases from 50 μm to 10 μm, E significantly increases by 16.96%, 15.80%, and 15.11% at 10.0%, 30.0%, and 50.0% leaching degrees, respectively. These findings highlight that reducing hITZ can effectively avoid the elastic modulus reduction induced by calcium leaching.
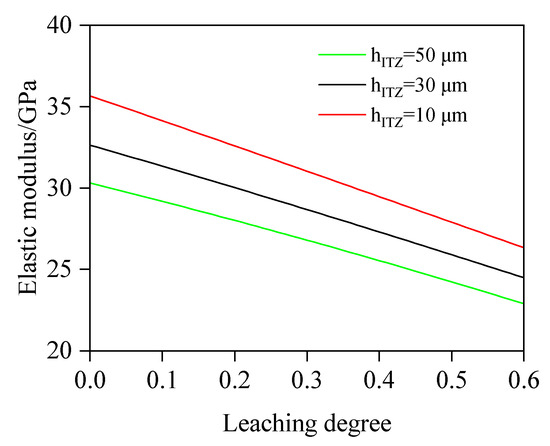
Figure 20.
Effect of ITZ thickness on E.
4.3. Suggestions for Practical Engineering
Based on the aforementioned analysis, four key strategies can be implemented in engineering practice to enhance concrete’s leaching resistance: optimizing the water-to-binder ratio, fly ash content, aggregate volume fraction, and ITZ compactness. First, a precisely controlled low water-to-binder ratio (recommended 0.35–0.45) significantly reduces capillary porosity by minimizing excess water, thereby densifying the microstructure and improving durability. Compared to the mix proportion with w/b = 0.5, when w/b is reduced to 0.3, the anti-leaching ability of fly ash concrete will increase by about 1.95 times. Second, increasing the volume fraction of well-graded aggregates (optimally 65–75%) while maintaining workability through a proper sand-to-aggregate ratio and particle size distribution enhances both the elastic modulus and leaching resistance. Compared to the mix proportion with fa = 45%, when fa is increased to 75%, the elastic modulus will increase by 58%. Third, incorporating 20–40% fly ash creates synergistic effects; their uniform dispersion during mixing fills micropores, refines the pore structure, and slows the degradation rate of C-S-H gels. Finally, ITZ optimization may be achieved by combining with 5–10% silica fumes to improve bonding, coupled with polycarboxylate-based superplasticizers to reduce water demand and ensure complete paste coating—collectively minimizing ITZ porosity and creating a more homogeneous composite matrix with superior leaching resistance.
5. Conclusions and Discussion
5.1. Conclusions
- (1)
- This study proposes an elastic modulus prediction method for leached fly ash concrete considering the non-uniform model of the ITZ. By discretizing the ITZ into N equally thick spherical shell elements and combining chemical reaction equations to calculate porosity variations in these shells and the fly ash–cement bulk paste under different leaching degrees, the elastic modulus of leached cement paste and the N spherical shells is progressively computed based on the two-phase composite sphere model. Ultimately, the predictive model for the elastic modulus of leached fly ash concrete is established. The reliability of this model is validated through comprehensive comparisons with self-designed experimental data and third-party test results.
- (2)
- Based on the developed computational model, quantitative analysis is conducted on the influence of key parameters (w/b, FA, fa, and hITZ) on the elastic modulus. The results indicate the following: At leaching degrees of 10.0%, 30.0%, and 50.0%, specimens with w/b = 0.40 exhibit a 26.71%, 28.43%, and 30.28% higher elastic modulus, respectively, than those with w/b = 0.60, primarily due to a prominently elevated porosity induced by a higher w/b value. Quantitatively, at a leaching degree of 10.0%, the porosity of w/b = 0.60 is calculated as 21.97%, whereas that of w/b = 0.40 concrete is 14.52%. When leaching progresses to 30.0%, the porosities increase to 25.73% and 18.62%, respectively. At 50.0% leaching, porosity further climbs to 29.49% (w/b = 0.60) and 22.71% (w/b = 0.40). For FA = 0%, 20%, and 40%, the decrease rates of elastic modulus are 22.7, 15.8, and 12.2 GPa, respectively. The results show that fly ash concrete exhibits a significantly slower reduction rate in elastic modulus compared to plain concrete, which indicates that an appropriate addition of fly ash will enhance the leaching resistance. This is because pozzolanic reaction products exhibit superior resistance to calcium leaching compared to CH. The elastic modulus of concrete with fa = 65% is 39.82%, 43.15%, and 46.12% higher, respectively, than that of concrete with fa = 45%. From the simulation results, it can be found that the variation regulation of elastic modulus is sensitive to the volume fraction of the aggregate and exhibits a similar linear variation pattern. Regarding the impact of hITZ, when hITZ decreases from 50 μm to 10 μm, E is significantly increased by 16.96%, 15.80%, and 15.11% at 10.0%, 30.0%, and 50.0% leaching degrees, respectively. These findings highlight that reducing hITZ can effectively avoid the elastic modulus reduction induced by calcium leaching.
5.2. Discussion About This Study and Future Work
The elastic modulus prediction model developed in this study is currently validated primarily for fly ash concrete systems. Its applicability remains constrained when multiple supplementary cementitious materials (e.g., slag) are incorporated concurrently. Moreover, the simulation methodology neglects the aggregate shape morphology. It should be noted that laboratory-accelerated leaching conditions diverge from actual field environments; indeed, natural leaching processes exhibit extreme slowness (typically several orders of magnitude slower than accelerated tests), modulated by temperature fluctuations and water chemistry. While the adopted accelerated leaching protocol enables the efficient simulation of degradation kinetics, it cannot fully replicate the complex natural exposure conditions or long-term degradation mechanisms. Consequently, model predictions require calibration against in situ monitoring data for engineering applications. Nevertheless, accelerated leaching research retains significant value due to the prohibitive time requirements for field validation. Finally, further research will focus on the limitations of predictive models, providing a scientific basis for structural maintenance and reinforcement.
Author Contributions
Conceptualization, X.Z. and W.S.; methodology, M.Z. and J.Z.; software, Q.L. and W.S.; validation, X.Z.; formal analysis, Z.C.; investigation, M.Z.; writing and editing, X.Z. and W.S.; visualization, M.Z.; project administration, X.Z. and Q.L.; funding acquisition, X.Z., Z.C. and J.Z. All authors have read and agreed to the published version of the manuscript.
Funding
This research was funded by the National Natural Science Foundation, grant number 52079123, and the Production and Construction Group’s Programs for Science and Technology Development, grant number 019AB016, of the People’s Republic of China.
Institutional Review Board Statement
Not applicable.
Informed Consent Statement
Not applicable.
Data Availability Statement
The original contributions presented in the study are included in the article, further inquiries can be directed to the corresponding authors.
Conflicts of Interest
The authors declare no conflicts of interest.
References
- Bae, J.H.; Jang, D.; Kim, N.; Park, J.; Choi, S.; Kim, S.; Seo, J. Microstructural Changes in Carbonation-cured Slag-blended Calcium Sulfoaluminate Cements under Electrically Accelerated Leaching. Dev. Built Environ. 2025, 22, 100664. [Google Scholar] [CrossRef]
- Jiang, Y.J.; Zheng, Y.; Yu, L.M.; Liao, L.X.; Su, Y.K. Mechanism and Effectiveness of Glass Powder Effect on Calcium Leaching Resistance of Primary Support Concrete in Tunnels. Constr. Build. Mater. 2025, 474, 141190. [Google Scholar] [CrossRef]
- An, S.H.; Jiang, C.M.; Li, S.X.; Shi, C. Experimental Study on the Effect of Ion Transmission Mode on the Calcium Leaching Rate of Cementitious Materials. Case Stud. Constr. Mat. 2025, 22, e04215. [Google Scholar] [CrossRef]
- Zhang, Z.W.; Niu, M.D.; Liu, Z.T.; Li, G.X. The Mechanism of Accelerator Types on Calcium Leaching in Shotcrete. Constr. Build. Mater. 2024, 457, 139353. [Google Scholar] [CrossRef]
- Di, H.F.; Guan, X.M.; Liu, S.H. Changes in Mechanical Performance and Pore Structure of Hardened Cement Paste under the Combined Effect of Calcium Leaching and Dry/wet Cycles. Constr. Build. Mater. 2023, 407, 133519. [Google Scholar] [CrossRef]
- Qi, F.Y.; Song, W.B.; Chen, Z.W.; Zhang, J. Analytical Solution for Predicting Elastic Modulus of Cement Slurry System with Effect of Calcium Dissolution. Materials 2024, 17, 3927. [Google Scholar] [CrossRef]
- Liu, Q.F.; Shen, X.H.; Šavija, B.; Meng, Z.Z.; Tsang, D.C.W.; Sepasgozar, S.; Schlangen, E. Numerical Study of Interactive Ingress of Calcium Leaching, Chloride Transport and Multi-ions Coupling in Concrete. Cem. Concr. Res. 2023, 165, 107072. [Google Scholar] [CrossRef]
- Chen, Z.W.; Gao, Y.; Zhang, J.; Liu, Q.F.; Wang, H.L.; Zheng, J.J. Numerical Modeling of Microstructure Development and Chloride Diffusion Coefficient of Cement Paste with Ellipsoidal Particles. Constr. Build. Mater. 2023, 408, 133819. [Google Scholar] [CrossRef]
- Xu, Y.D.; Song, Y.F. Chemical-mechanical Transformation of the Expansion Effect for Nonuniform Steel Corrosion and its Application in Predicting the Concrete Cover Cracking Time. Cem. Concr. Res. 2022, 127, 104376. [Google Scholar] [CrossRef]
- Park, J.Y.; Cho, S.M.; Suh, H.W.; Her, S.W.; Yang, J.H.; Bae, S.C. Immobilization and Leaching Behavior of Cobalt in Alkali-Activated Fly Ash/dehydrated Cement Paste Fine Blends. Cem. Concr. Res. 2025, 195, 107921. [Google Scholar] [CrossRef]
- Zhou, Y.T.; Zhang, H.G.; Li, S.Y.; He, S. Environmental Stability and Leaching Behavior of Alkali-activated Cement Mortar with High-temperature Sintered MSWI Fly Ash Exposed to Extreme Environmental Conditions. Constr. Build. Mater. 2025, 481, 141555. [Google Scholar] [CrossRef]
- Ariyadasa, P.W.; Manalo, A.C.; Lokuge, W.; Aravienthan, V.; Gerdes, A.; Kaltenbach, J. Degradation mechanisms of low-calcium fly ash-based geopolymer mortar in simulated aggressive sewer conditions. Cem. Concr. Res. 2025, 194, 107882. [Google Scholar] [CrossRef]
- Mahfoud, E.; Maherzi, W.; Ndiaye, K.; Abriak, N.E.; Aggoun, S.; Benzerzour, M. One-part Geopolymer Based on Micronized Sediments and Fly Ash Mix: Mechanical, Microstructural and Leaching Assessment. J. Build. Eng. 2024, 96, 110426. [Google Scholar] [CrossRef]
- Zhao, H.Y.; Zhang, L.C.; Wu, Z.H.; Liu, A.; Imran, M. Aggregate Effect on the Mechanical and Fracture Behaviours of Concrete. Int. J. Mech. Sci. 2023, 243, 108067. [Google Scholar] [CrossRef]
- Rocco, C.G.; Elices, M. Effect of Aggregate Shape on the Mechanical Properties of a Simple Concrete. Eng. Fract. Mech. 2009, 76, 286–298. [Google Scholar] [CrossRef]
- Sun, Q.R.; Gupta, R.S.; Zhu, Z.Y.; Sharma, A.; Qiang, S. A New Mathematical Model for Elastic Modulus Prediction in Mortar and Concrete. J. Build. Eng. 2025, 100, 111761. [Google Scholar] [CrossRef]
- Agwa, I.S.; Mostafa, S.A.; Abd-Elrahman, M.H.; Amiri, M. Effect of Recycled Aggregate Treatment Using Fly Ash, Palm Leaf Ash, and Silica Fume Slurries on the Mechanical and Transport Properties of High-Strength Concrete. J. Build. Eng. 2025, 111, 113292. [Google Scholar] [CrossRef]
- Kamboj, R.; Debbarma, S. Nano-Indentation and SEM Analysis of the Interfacial Transition Zone in RAP-Concrete. Constr. Build. Mater. 2025, 429, 142854. [Google Scholar] [CrossRef]
- Chen, C.F.; Dong, B.Q.; Dai, J.G.; Ahmad, M.R.; Wang, Y.S. Microstructure and Micromechanical Properties of the Interfacial Transition Zone in Concrete Incorporating Lime Mud-Based Artificial Aggregates. J. Build. Eng. 2025, 108, 112979. [Google Scholar] [CrossRef]
- Xu, L.; Wang, J.J.; Huang, R.; Li, B.W.; Ran, B.; Hu, X.C. Investigations on micro-mechanical properties of the ITZs between recycled aggregates and recycled cement paste. Constr. Build. Mater. 2024, 450, 138640. [Google Scholar] [CrossRef]
- Lu, C.G.; Yu, Q.J.; Wei, J.X.; Niu, Y.F.; Zhang, Y.F.; Lin, C.; Chen, P.X.; Shi, C.; Yang, P.F. Influence of Interface Transition Zones (ITZ) and Pore Structure on the Compressive Strength of Recycled Aggregate Concrete. Constr. Build. Mater. 2024, 456, 139299. [Google Scholar] [CrossRef]
- Song, Y.F.; Wang, J.Z.; Huang, Y.J.; Wang, J.W.; Weng, Y.T.; Ma, R.; Pang, K.S.H.; Ruan, S.Q. Effects of Varying Grades/Pretreatments of Recycled Aggregates on the Development of Pore Structures and ITZs within Reactive Magnesia Cement (RMC) Concrete. Cem. Concr. Res. 2025, 190, 107782. [Google Scholar] [CrossRef]
- Xu, F.; Wu, Y.M.; Liu, C.W.; Wang, Q.H.; Ruan, D.; Guo, H. Dual Nonlinear Characteristics and its Modelling of Porous Fiber Material Waveform Generators under Shock Loading Conditions. Measurement 2025, 256, 118098. [Google Scholar] [CrossRef]
- Lu, L.; Pan, J.; Li, G.Q. Recyclable High-Performance Epoxy based on Transesterification Reaction. J. Mater. Chem. A 2017, 40, 21505–21513. [Google Scholar] [CrossRef]
- Gao, W.Q.; Yu, H.F.; Ma, H.Y.; Guo, J.B.; Mei, Q.Q.; Da, B.; Zeng, X.C. Mechanical Properties and Mesoscopic Failure Mechanism of Concrete under Impact Compressive Loading: Effects of Cement and Aggregate Types. Constr. Build. Mater. 2025, 490, 142448. [Google Scholar] [CrossRef]
- Jia, S.Y.; Liu, M.H.; Han, B.; Xie, H.B. An Elastic Modulus Developing Model of Fly Ash Concrete under Sustained Load. KSCE J. Civ. Eng. 2018, 22, 2417–2424. [Google Scholar] [CrossRef]
- Hashmi, A.F.; Shariq, M.; Baqi, A. An investigation into age-dependent strength, elastic modulus and deflection of low calcium fly ash concrete for sustainable construction. Constr. Build. Mater. 2021, 283, 122772. [Google Scholar] [CrossRef]
- Wang, H.L.; Chen, Z.W.; Zhang, J.; Li, J.H. Numerical Scheme for Predicting Chloride Diffusivity of Concrete. J. Mater. Civ. Eng. 2021, 33, 04021237. [Google Scholar] [CrossRef]
- Wang, H.L.; Chen, Z.W.; Sun, X.Y.; Zhang, J.; Zheng, J.J. New Numerical Method for Predicting Chloride Diffusivity of Concrete Considering the Profiles of Practical Aggregates. Constr. Build. Mater. 2021, 290, 123245. [Google Scholar] [CrossRef]
- Tian, Y.; Tian, Z.S.; Jin, X.Y.; Yu, W. A Multiphase Numerical Simulation of Chloride Ions Diffusion in Concrete Using Electron Microprobe Analysis for Characterizing Properties of ITZ. Constr. Build. Mater. 2018, 178, 432–444. [Google Scholar] [CrossRef]
- Chen, T.; Xiao, S.Y. Three-Dimensional Numerical Prediction of Elastic Modulus of Concrete as a Three-Phase Composite with Asymptotic Homogenization. Constr. Build. Mater. 2022, 348, 128640. [Google Scholar] [CrossRef]
- Song, G.F.; Zou, N.Y.; Wei, Y.; Aili, A.; Liang, S.M. Numerical Investigation into the Influence of Interfacial Transition Zone on Elastic Modulus, Creep, Shrinkage of Concrete. Constr. Build. Mater. 2024, 447, 1381112. [Google Scholar] [CrossRef]
- Ren, X.; Tang, C.; Xie, Y.J.; Long, G.C.; Ma, G.; Wang, H.X.; Tang, Z. 3D Mesoscale Study on the Effect of ITZ and Aggregate Properties on the Fracture Behaviors of Concrete Based on Discrete Element Method. J. Build. Eng. 2024, 83, 108450. [Google Scholar] [CrossRef]
- Liang, C.F.; Bao, J.N.; Gu, F.; Lu, J.Y.; Ma, Z.M.; Hou, S.D.; Duan, Z.H. Determining the Importance of Recycled Aggregate Characteristics Affecting the Elastic Modulus of Concrete by Modeled Recycled Aggregate Concrete: Experiment and Numerical Simulation. Cem. Concr. Compos. 2025, 162, 106118. [Google Scholar] [CrossRef]
- Yin, D.S.; Zhang, M.K.; Xiong, B.B.; Zhang, S.H. Study on the Physical and Mechanical Properties of Concrete Interfacial Transition Zones (ITZ) with Consideration of Positional Effects. Constr. Build. Mater. 2025, 486, 141985. [Google Scholar] [CrossRef]
- Yuan, H.Q.; Zhu, L.H.; Wang, X.P. Long-Term Performance of Steel Fiber Reinforced Recycled Concrete: Creep Calculation Model based on Eecycled Aggregate Attached Mortar and the Interfacial Transition Zone of Steel Fiber. Constr. Build. Mater. 2025, 474, 141163. [Google Scholar] [CrossRef]
- Wu, J.F.; Qi, F.Y.; Zhang, J.; Chen, Z.W.; Wang, H.L.; Liu, Q.F. Modeling of Effect of Fly Ash Amount on Microstructure and Chloride Diffusivity of Blended Fly Ash-Cement Systems. Constr. Build. Mater. 2024, 443, 137711. [Google Scholar] [CrossRef]
- Hu, D.K.; Hu, N.; Ben, S.J.; Zhao, H.T.; Chen, S.; Xiang, Y. Multiscale prediction model for autogenous shrinkage of early-age concrete incorporating high volume fly ash. Constr. Build. Mater. 2024, 98, 111281. [Google Scholar] [CrossRef]
- Kargari, A.; Akhaveissy, A.H.; Pietruszczak, S. An Experimental Assessment of Fracture Parameters and Microstructure of Concrete Exposed to Calcium Leaching. Constr. Build. Mater. 2024, 451, 138856. [Google Scholar] [CrossRef]
- Yang, Z.X.; Dong, S.L.; Zhang, Y. Particle packing optimization and pore structure assessment of ternary cementitious system based on X-ray computed tomography and mercury intrusion po-rosimetry. Constr. Build. Mater. 2024, 413, 134913. [Google Scholar] [CrossRef]
- Lee, K.M.; Park, J.H. A Numerical Model for Elastic Modulus of Concrete Considering Interfacial Transition Zone. Cem. Concr. Res. 2008, 38, 396–402. [Google Scholar] [CrossRef]
- Yang, H.X.; Chen, H.N.; Xu, Y.J.; Wu, Z.H.; Shen, H.; Bai, J.J. Fracture Characteristics of Manufactured Sand Recycled Coarse Aggregate Concrete using Semi-Circular Bending Specimens. J. Build. Eng. 2025, 111, 113257. [Google Scholar] [CrossRef]
- Ge, L.; Chen, J.F. Meso-Scale Fracture Analysis of Concrete based on Phase-Field Theory and Cohesive Zone Method. Eng. Fail. Anal. 2025, 179, 109684. [Google Scholar] [CrossRef]
- Mazzucco, G.; Pomaro, B.; Xotta, G.; Garbin, E.; Majorana, C.E.; Marchi, N.D.; Concheri, G. Meso-Scale XCT-Based Modeling of Ordinary Concrete. Constr. Build. Mater. 2021, 286, 122850. [Google Scholar] [CrossRef]
- Lu, B.L.; Torquato, S. Nearest-Surface Distribution Functions for Polydispersed Systems. Phys. Rev. A 1992, 45, 5530–5544. [Google Scholar] [CrossRef]
- Crumbie, A.K. Characterisation of the Microstructure of Concrete. Ph.D. Thesis, Imperial College London, London, UK, 1994. [Google Scholar]
- Shafikhani, M.; Chidiac, S.E. Quantification of Concrete Chloride Diffusion Coefficient-A Critical Review. Cem. Concr. Compos. 2019, 99, 225–250. [Google Scholar] [CrossRef]
- Liu, J.H.; Zuo, X.B.; Chen, S.; Li, L.; Zhang, H.L. Experimental Study on Leaching-Abrasion Behavior of Cement-Mortar Specimen in Water Environment. Constr. Build. Mater. 2025, 489, 142385. [Google Scholar] [CrossRef]
- Bentz, D.P. Influence of Silica Fume on Diffusivity in Cement-Based Materials: II. Multi-Scale Modeling of Concrete Diffusivity. Cem. Concr. Res. 2000, 30, 1121–1129. [Google Scholar] [CrossRef]
- Deng, F.Q.; Cao, C.; Chi, Y.; Xu, L.H. Effect of Cellulose Nanofiber addition on the Microstructure Characterization and Nano-Mechanical Behavior of Interfacial Transition Zones in Recycled Concrete. J. Mater. Res. Technol. 2024, 33, 7572–7585. [Google Scholar] [CrossRef]
- Li, Y.B.; Liu, M.; Chen, Y.R.; Li, Y.S.; Liang, R. Multi-Scale Mechanical Properties of Cementitious Materials Modified by in-situ Polymerization of Acrylamide. Constr. Build. Mater. 2025, 490, 142558. [Google Scholar] [CrossRef]
- Constantinides, G.; Ulm, F.J. The Nanogranular Nature of C-S-H. J. Mech. Phys. Solids 2007, 55, 64–90. [Google Scholar] [CrossRef]
- Wang, J.A.; Lubliner, J.; Monteiro, P.J.M. Effect of Ice Formation on the Elastic Moduli of Cement Paste and Mortar. Cem. Concr. Res. 1988, 18, 874–885. [Google Scholar] [CrossRef]
- Huang, B.; Qian, C.X. Experiment Study of Chemo-Mechanical Coupling Behavior of Leached Concrete. Constr. Build. Mater. 2011, 25, 2649–2654. [Google Scholar] [CrossRef]
Disclaimer/Publisher’s Note: The statements, opinions and data contained in all publications are solely those of the individual author(s) and contributor(s) and not of MDPI and/or the editor(s). MDPI and/or the editor(s) disclaim responsibility for any injury to people or property resulting from any ideas, methods, instructions or products referred to in the content. |
© 2025 by the authors. Licensee MDPI, Basel, Switzerland. This article is an open access article distributed under the terms and conditions of the Creative Commons Attribution (CC BY) license (https://creativecommons.org/licenses/by/4.0/).