

Optimization of Ultrasonic Dispersion of Single-Walled SWCNT Inks for Improvement of Thermoelectric Performance in SWCNT Films Using Heat Source-Free Water-Floating SWCNT Thermoelectric Generators


Highlights
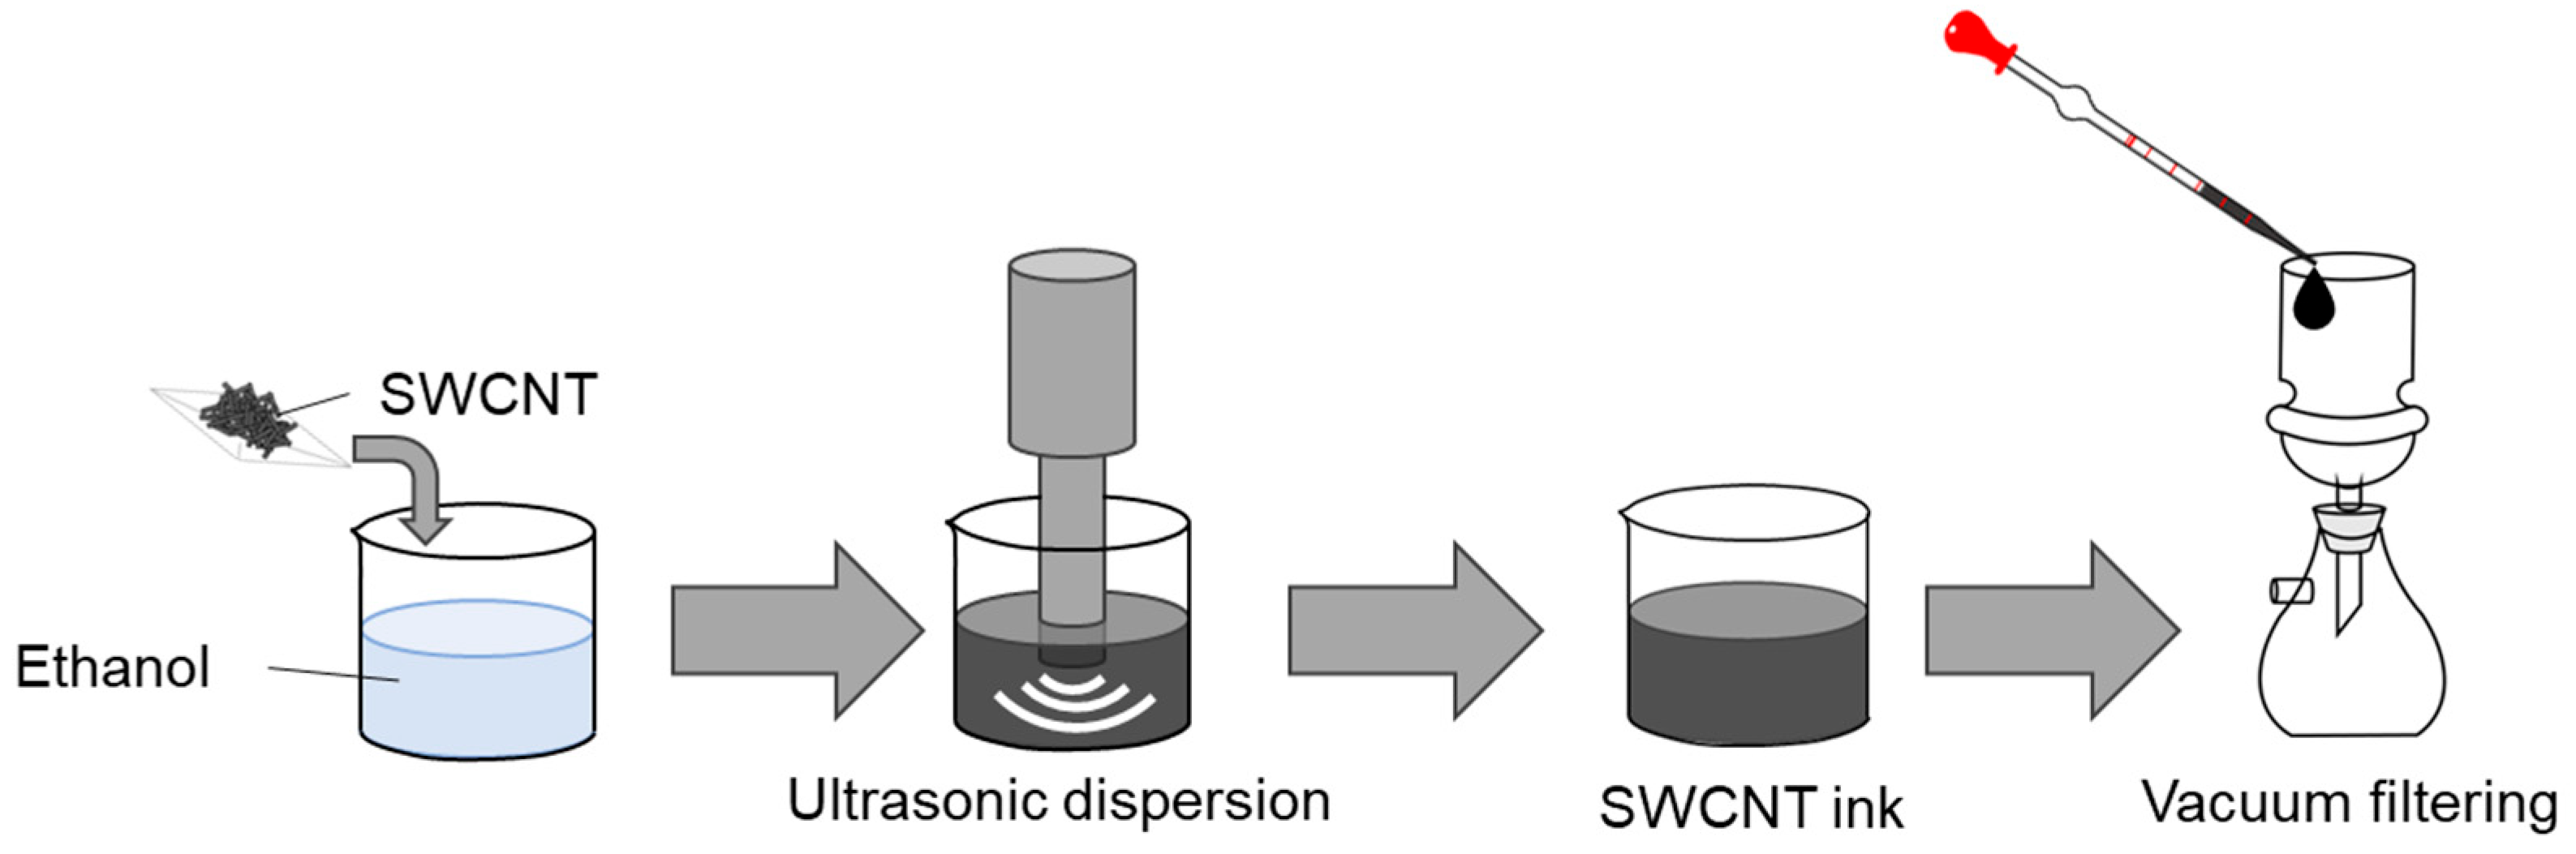
- SWCNT inks were prepared by mixing SWCNTs with ethanol using a homogenizer.
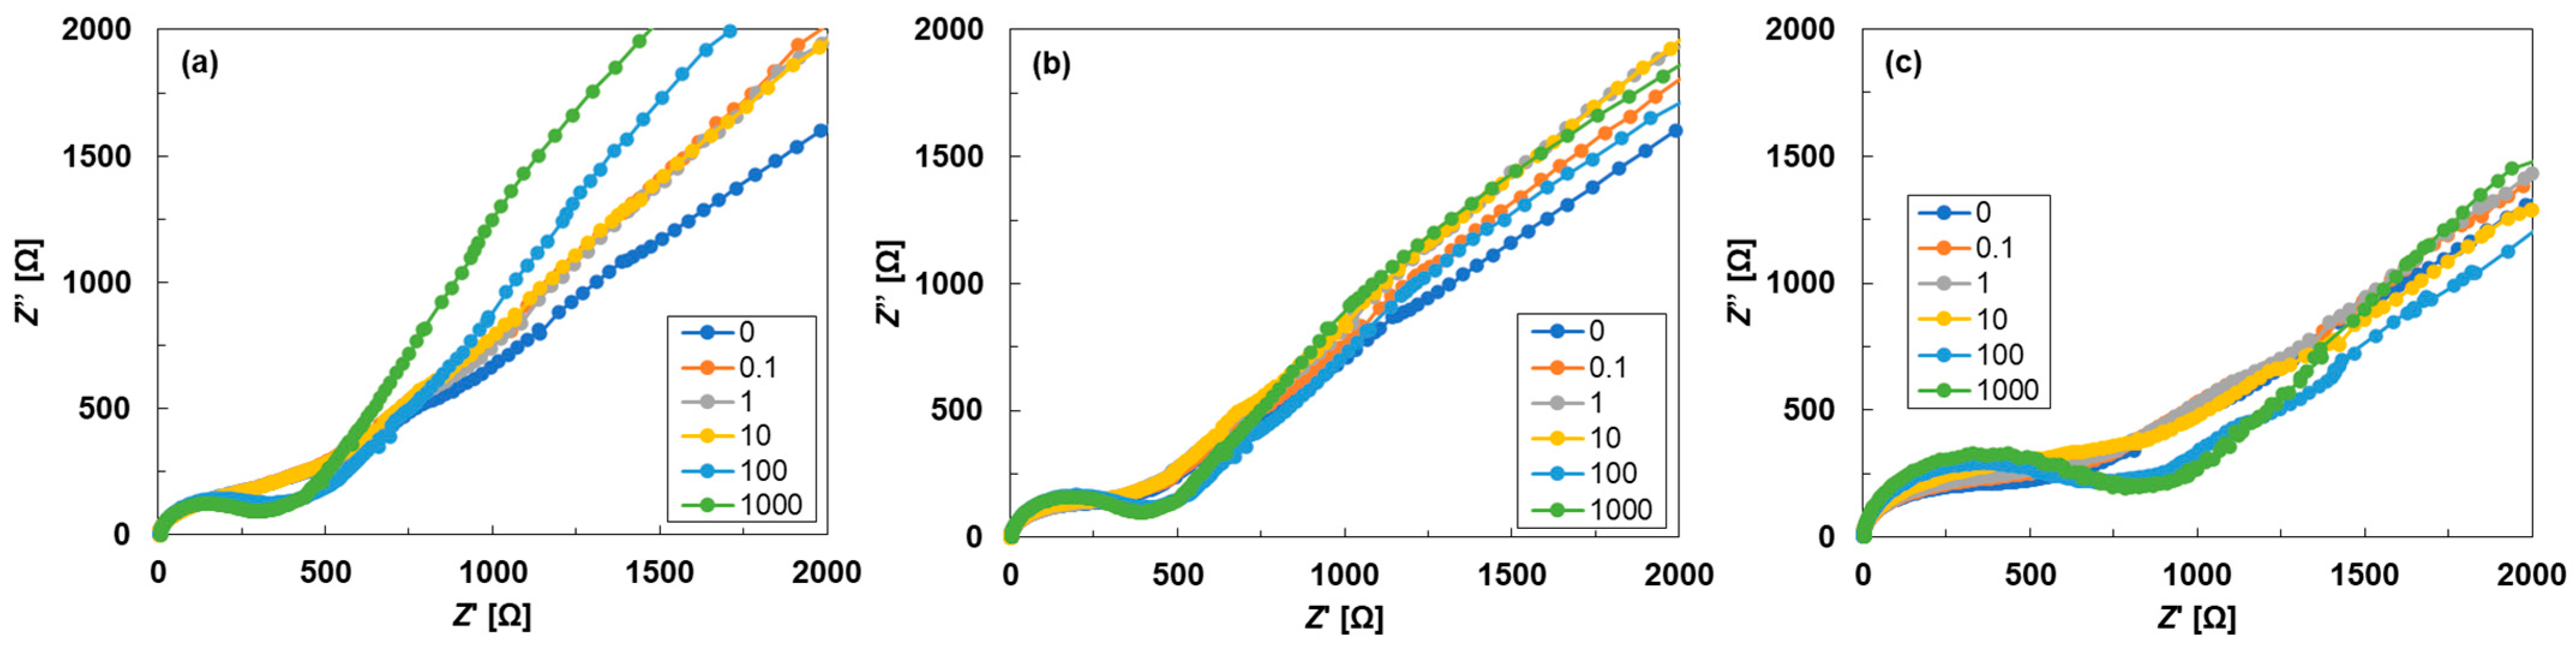
- SWCNT inks were investigated using a rotational rheometer with an LCR meter.
- SWCNT films were prepared using SWCNT inks via vacuum filtering.
- Optimized SWCNT ink increased the thermoelectric performance of SWCNT films.
- SWCNT films were applied to heat-source-free water-floating SWCNT-TEGs.
Abstract
1. Introduction
2. Materials and Methods
3. Results and Discussion
3.1. Characteristics of SWCNT Inks
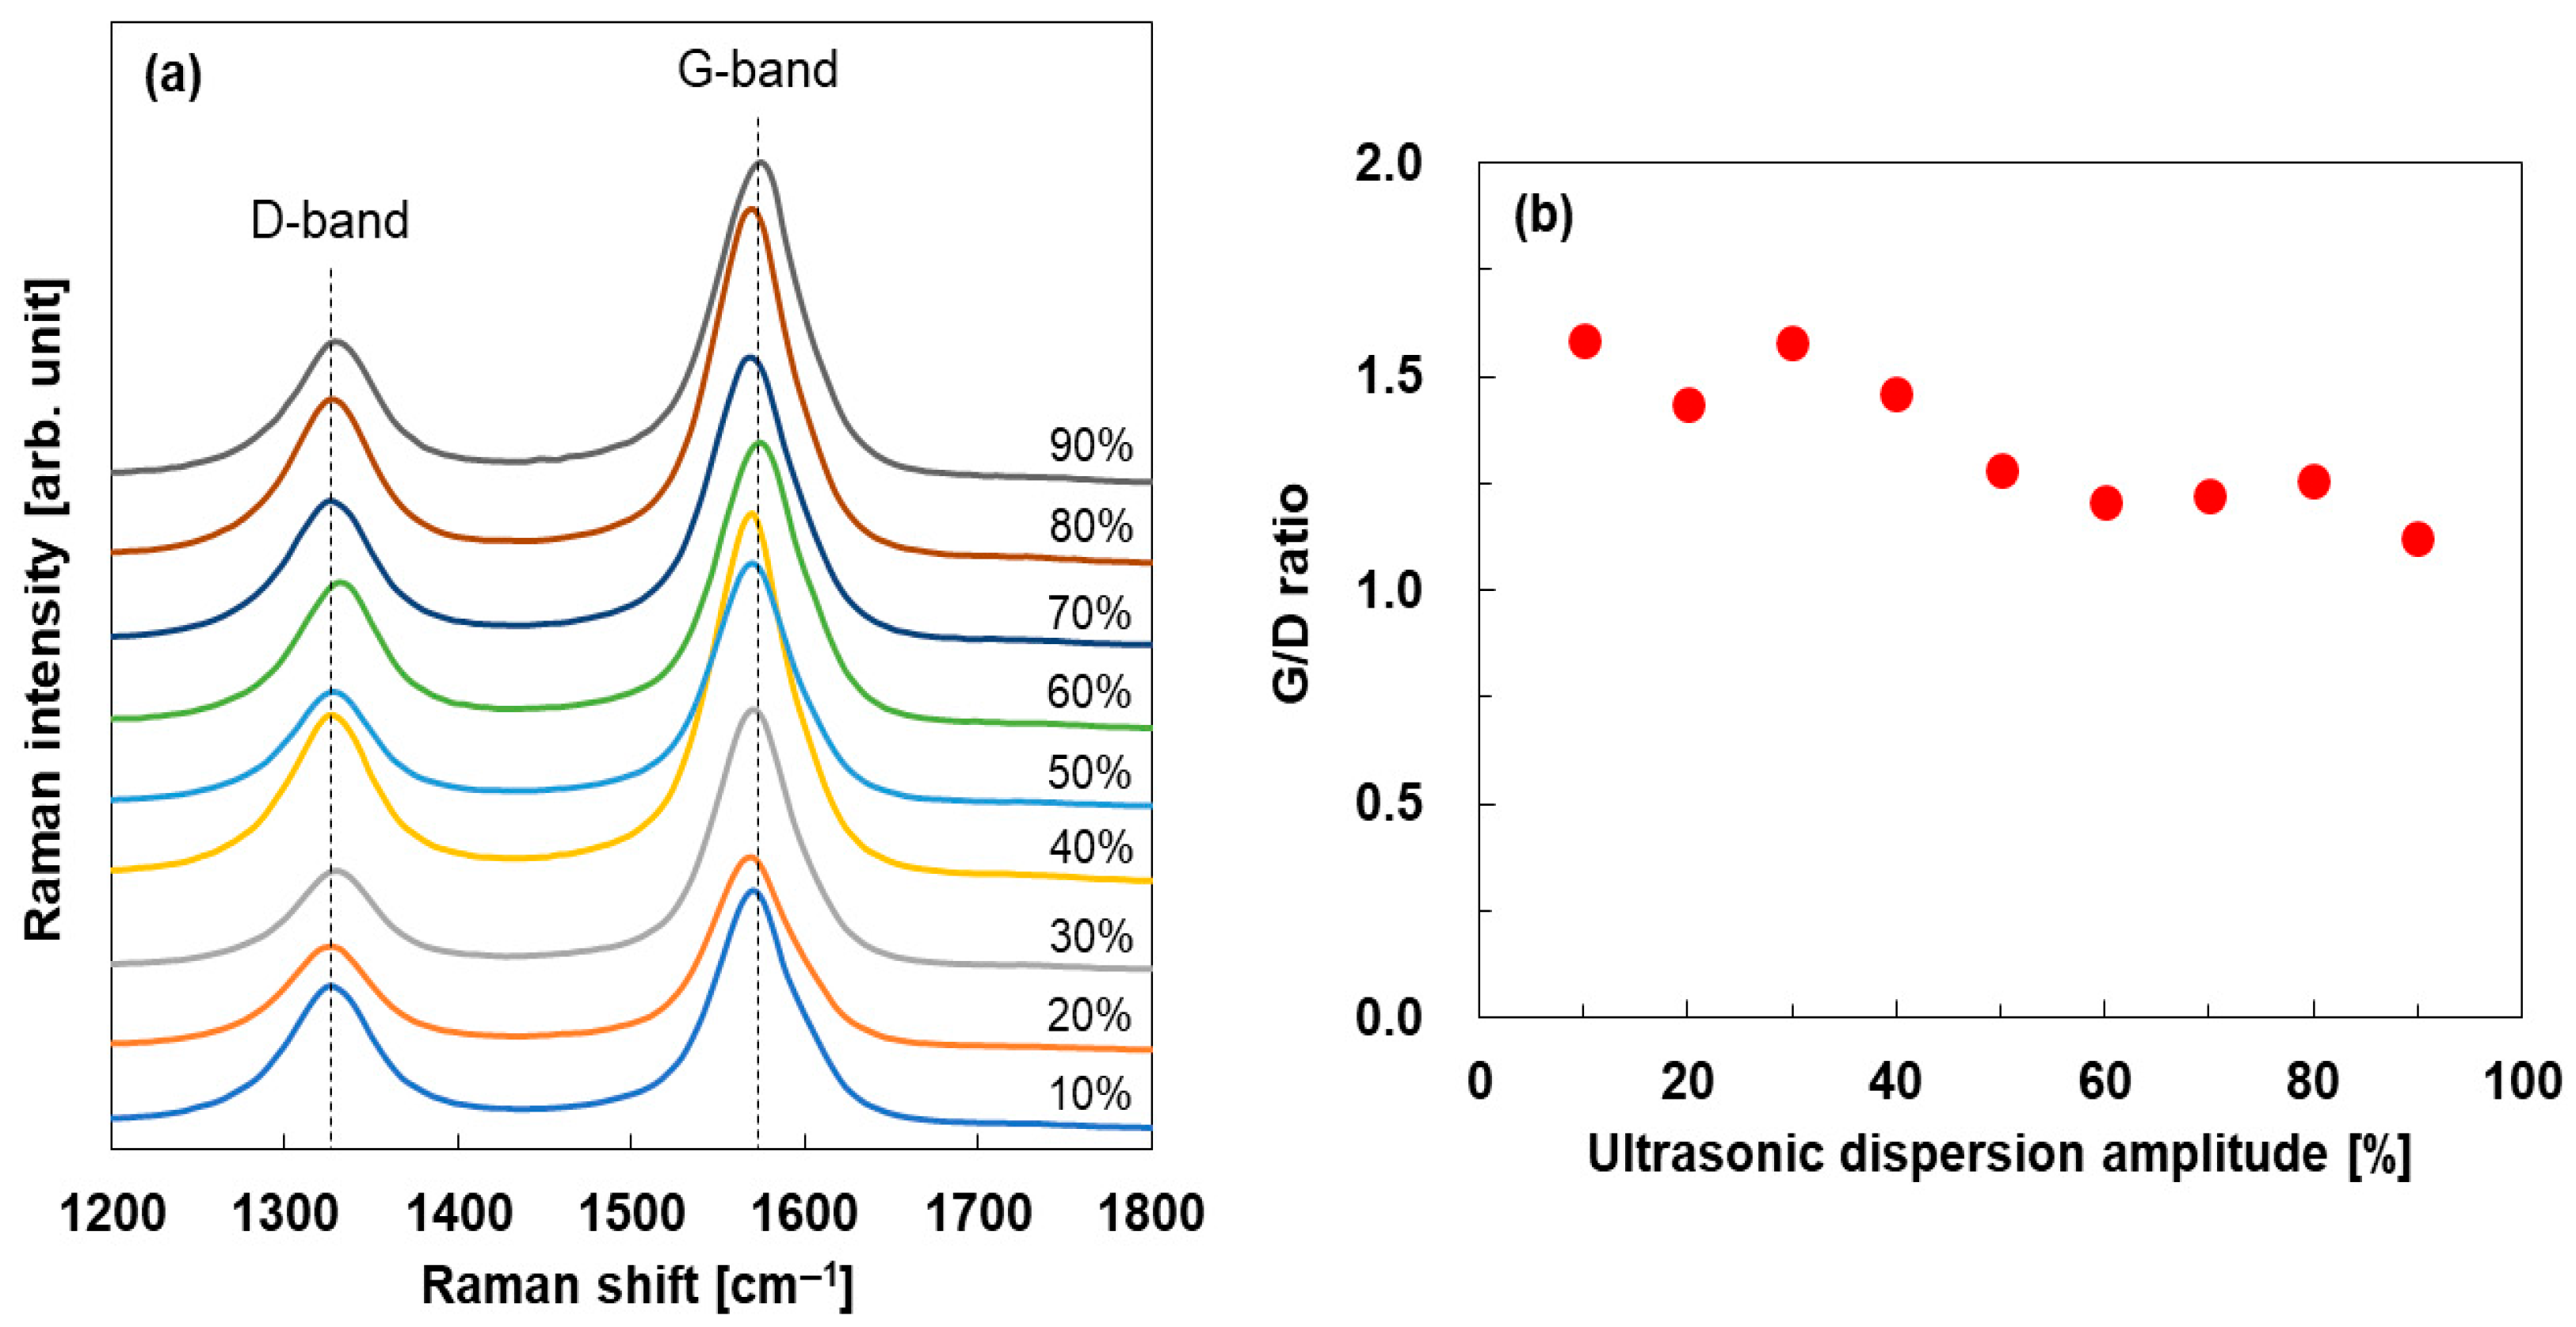
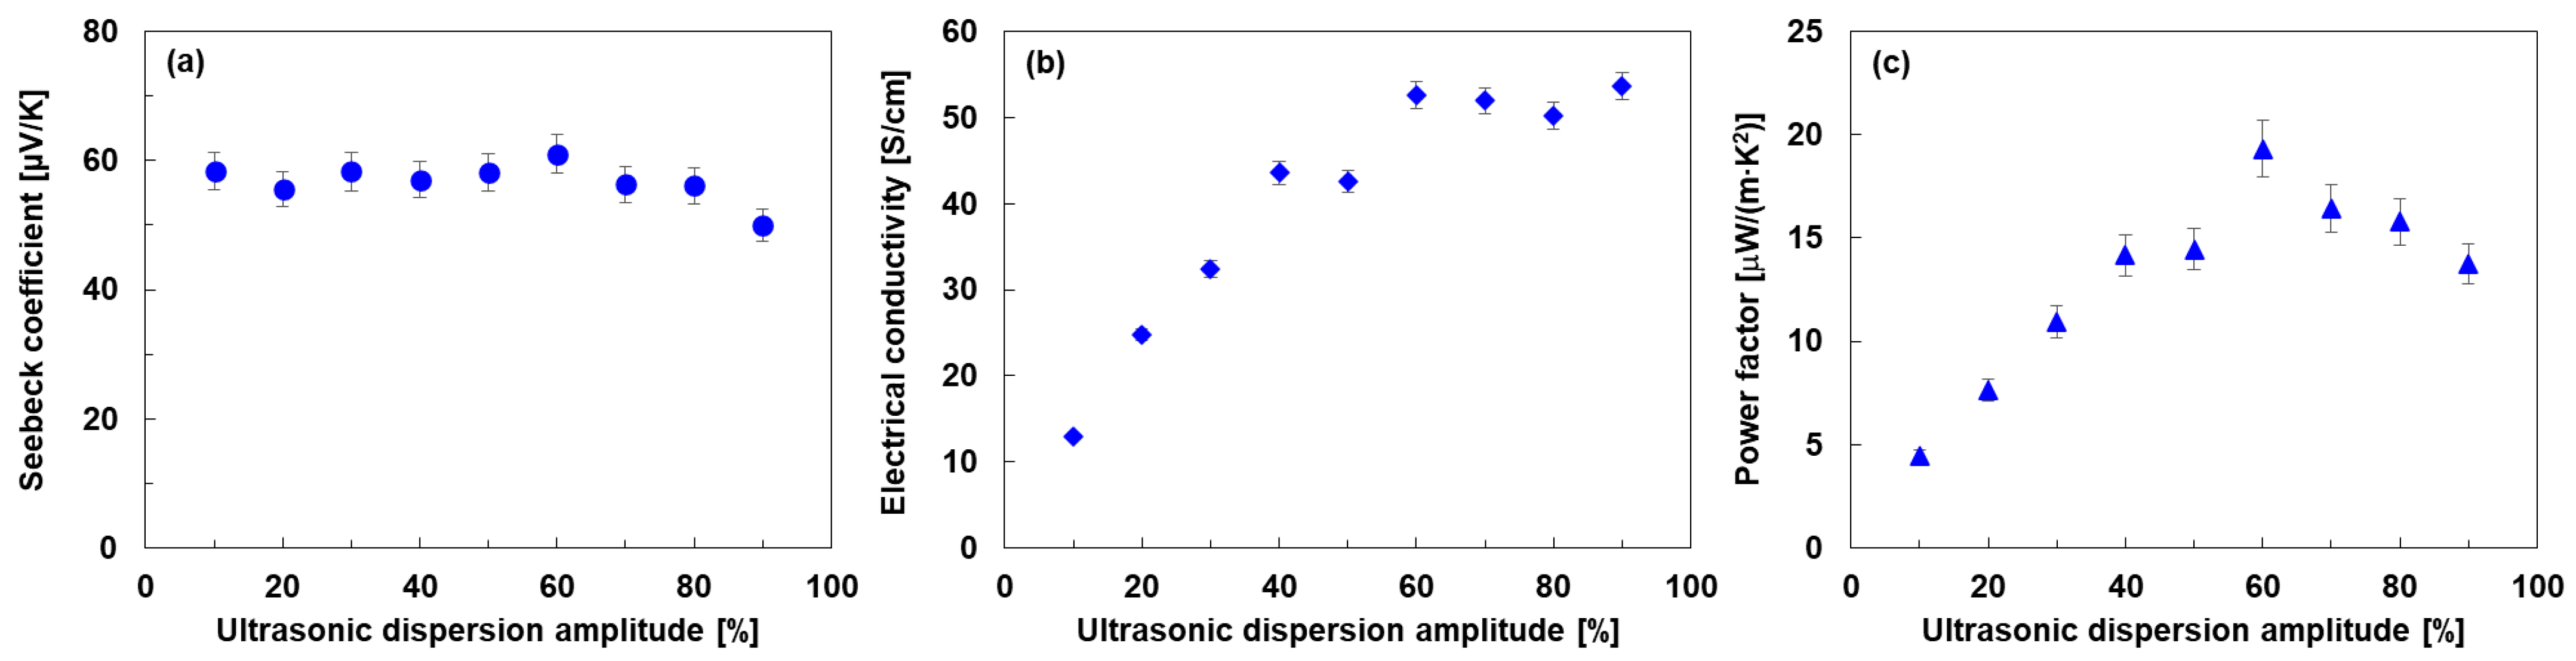
3.2. Structural and Thermoelectric Properties of SWCNT Films
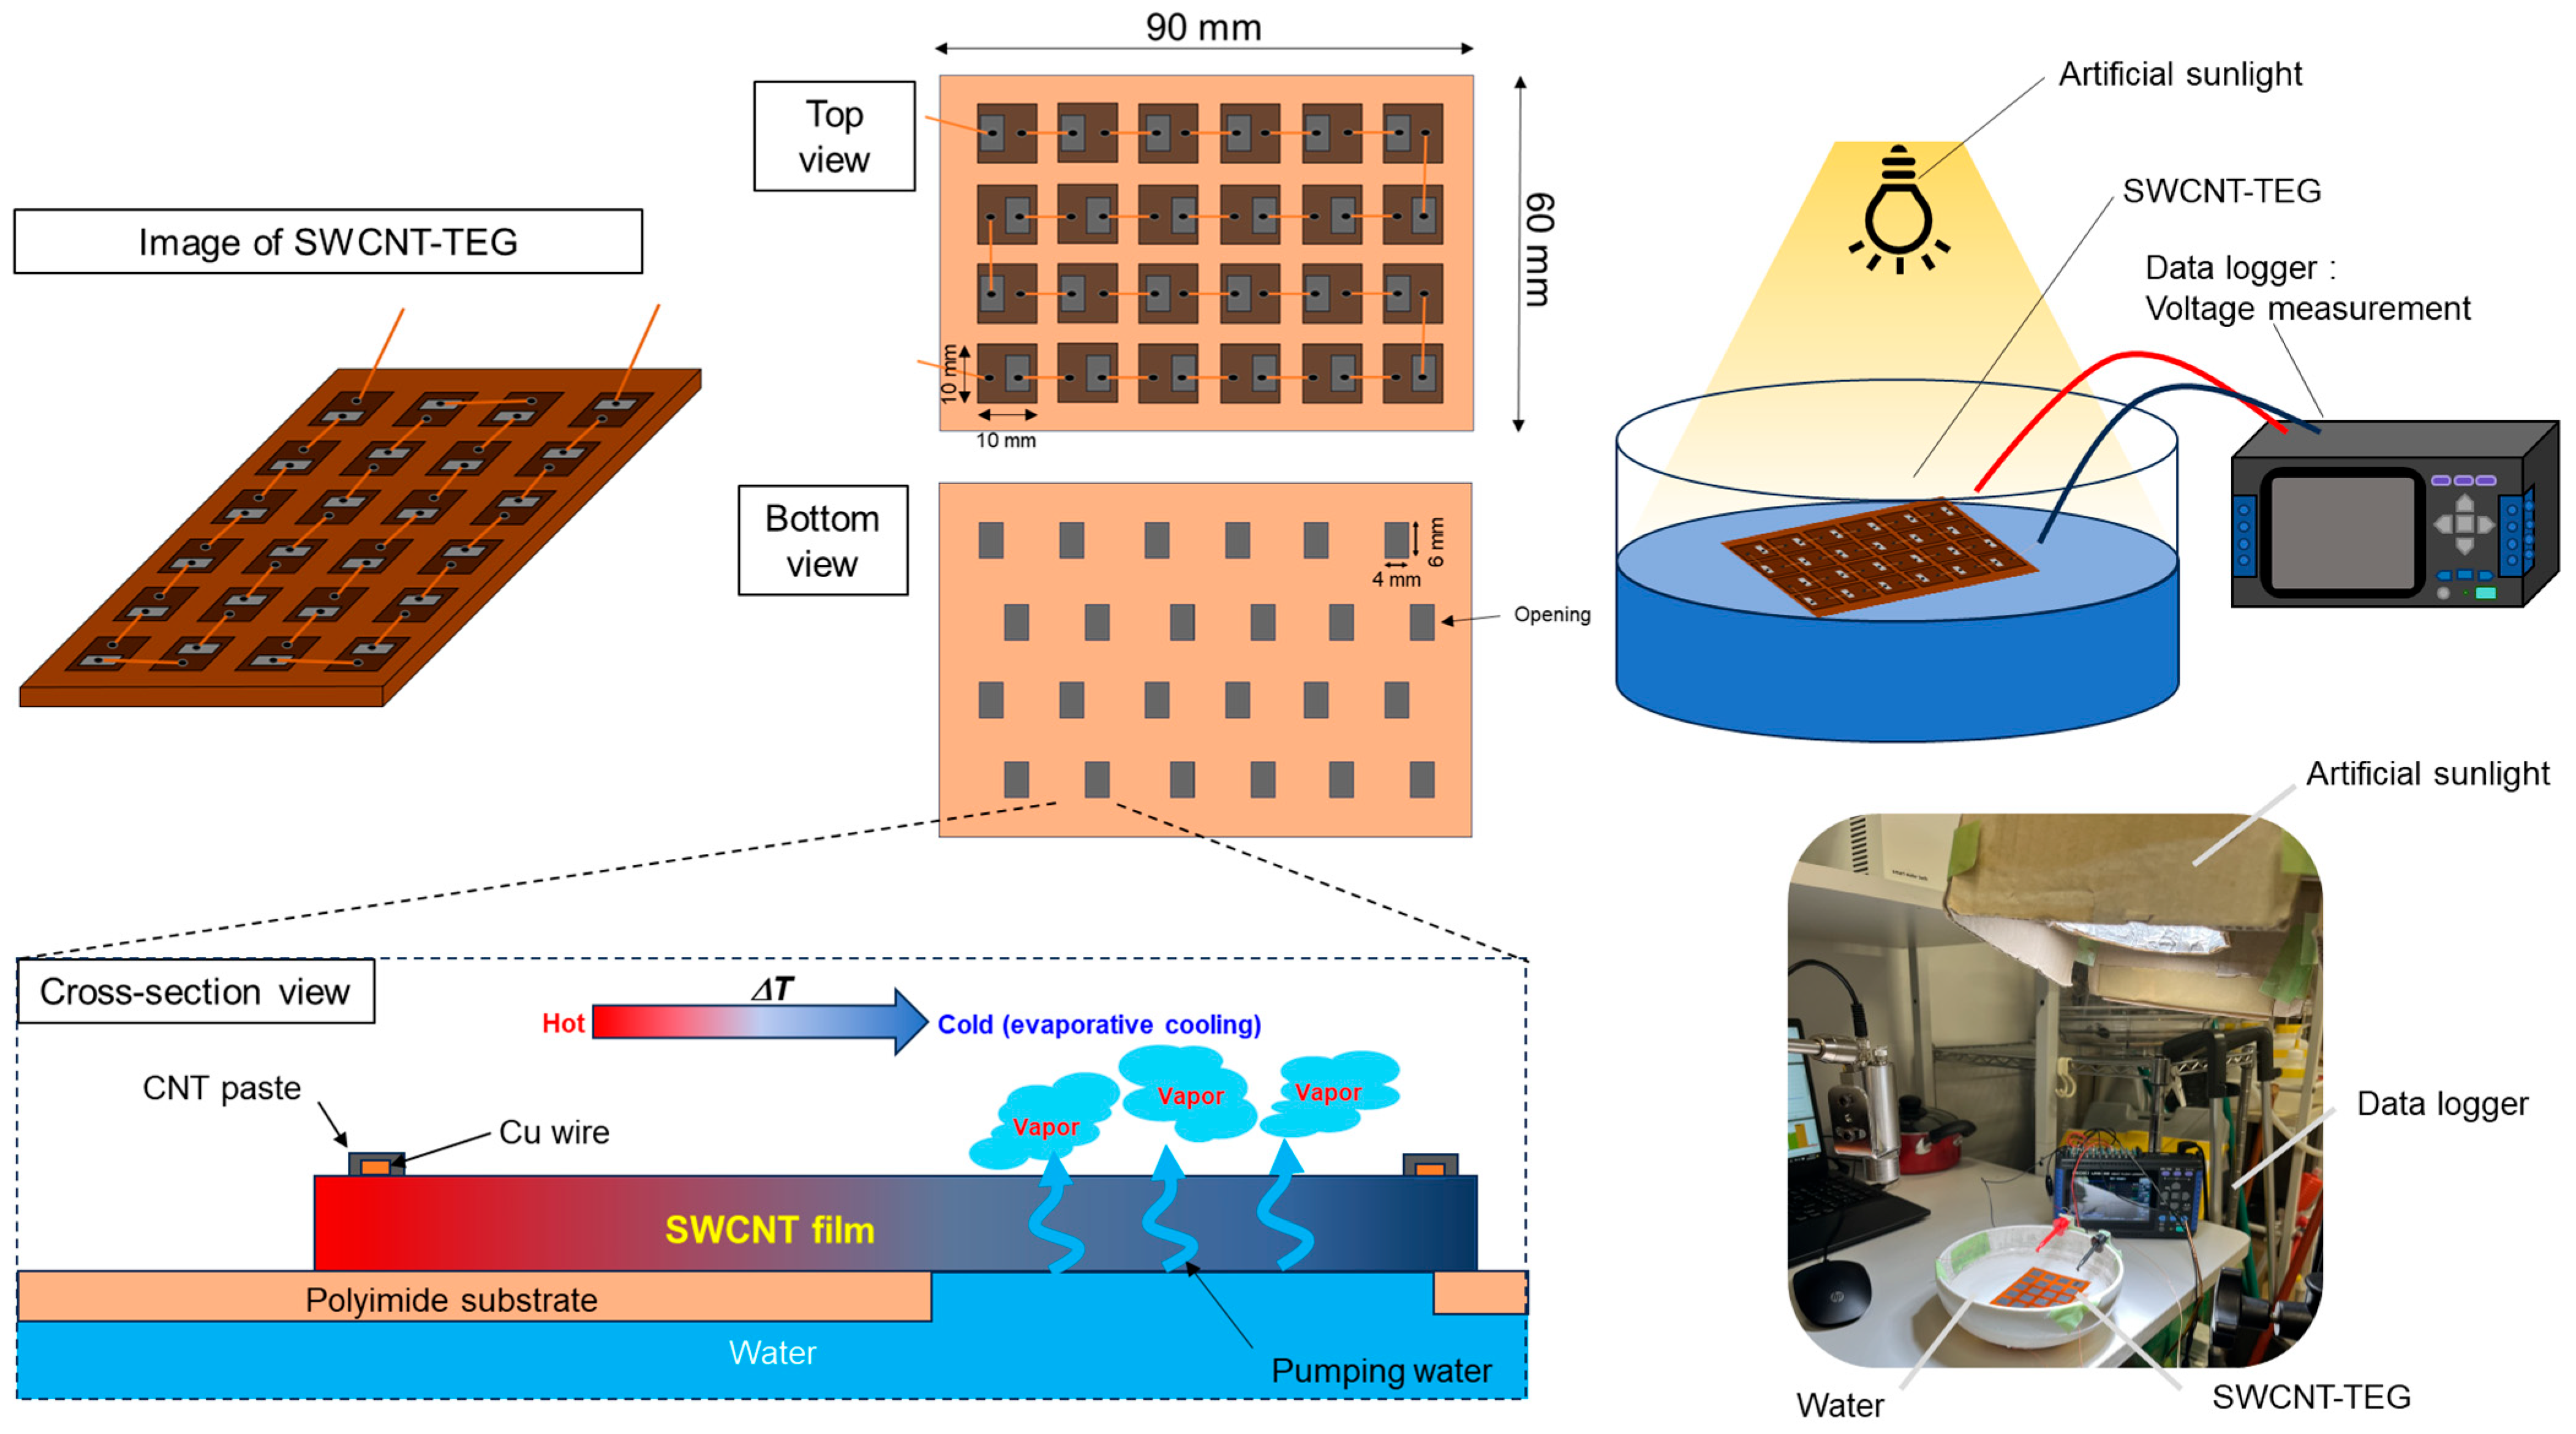
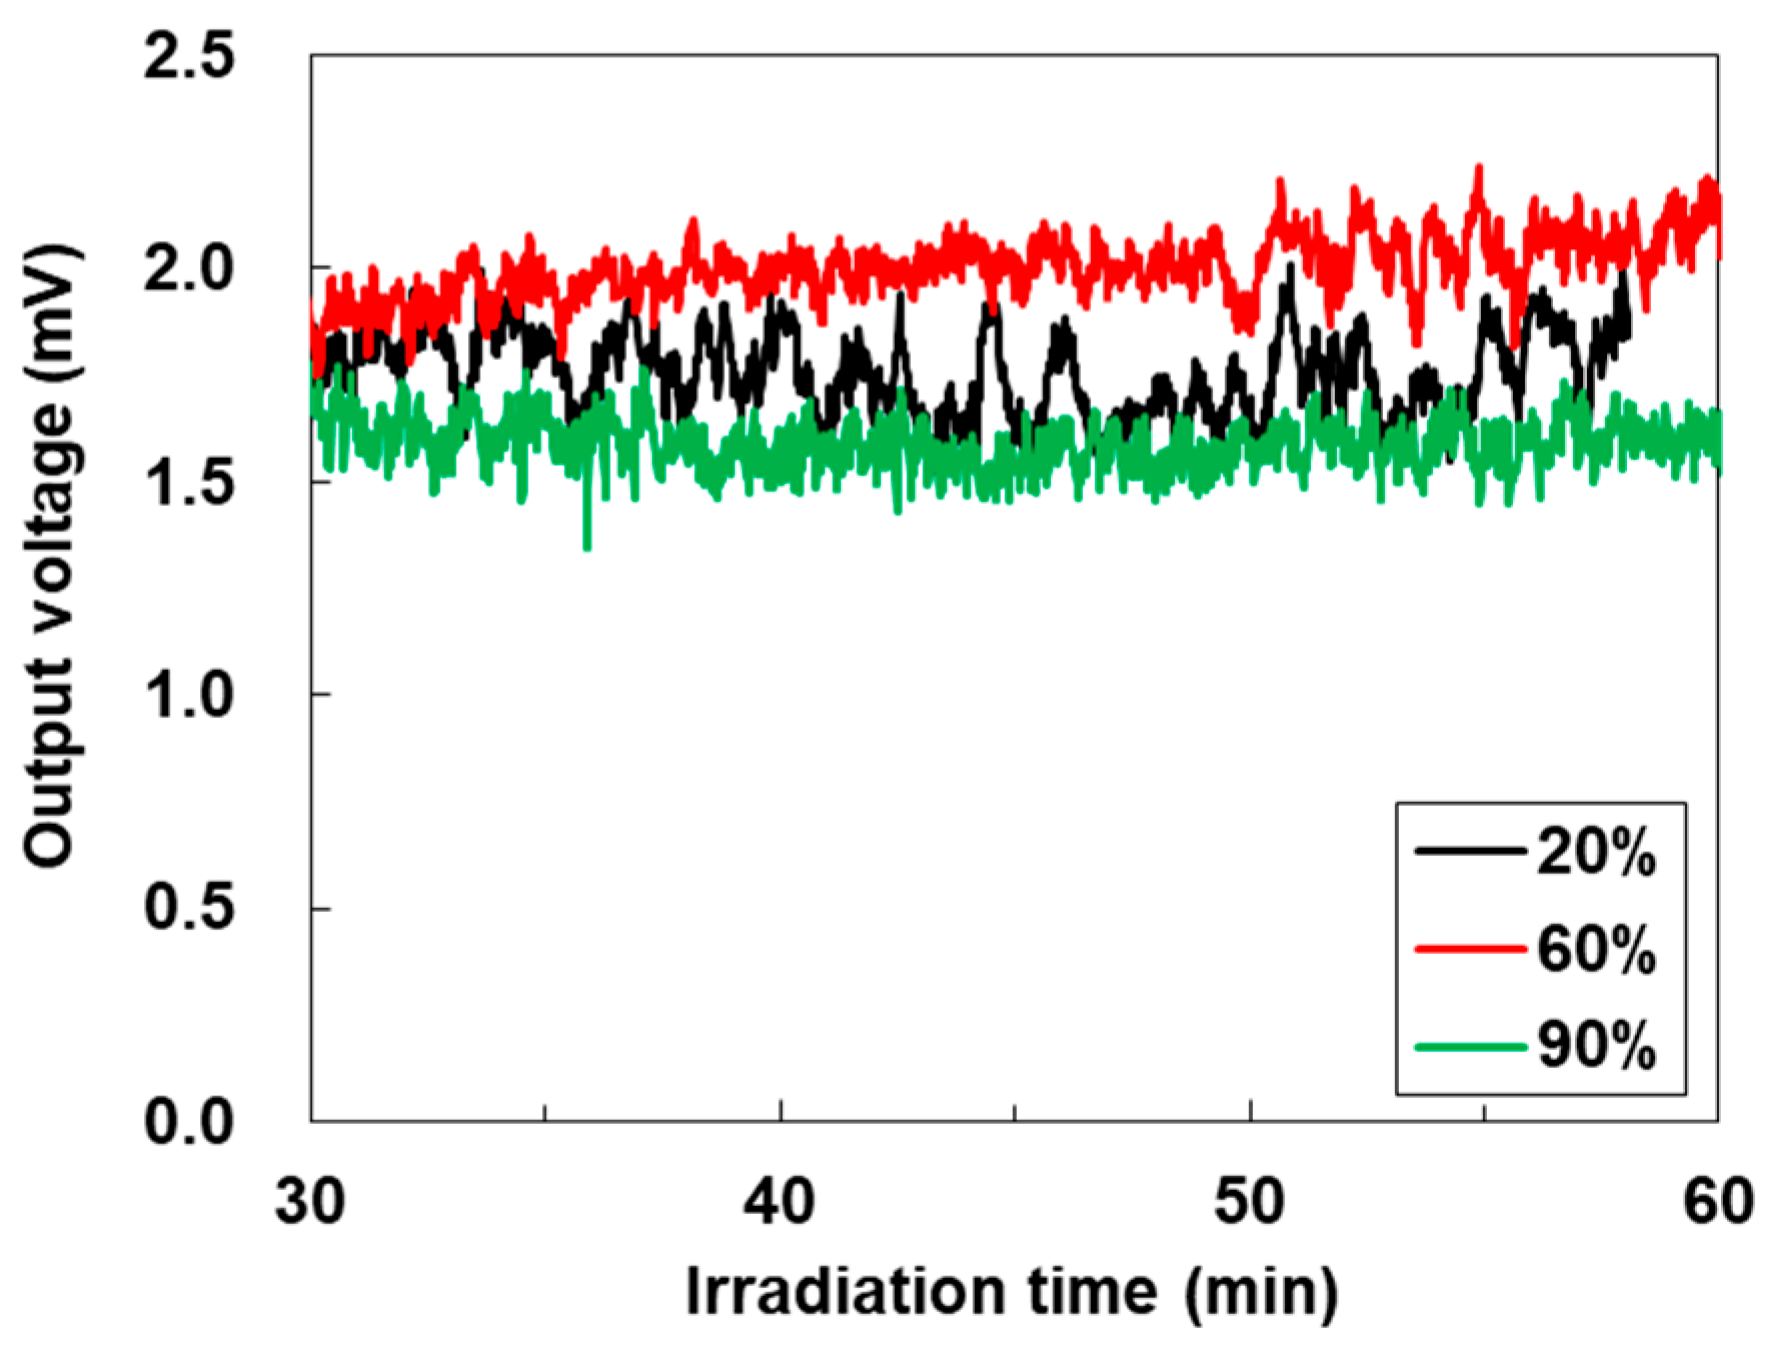
3.3. Performance of Water-Floating SWCNT-TEGs
4. Conclusions
Supplementary Materials
Author Contributions
Funding
Institutional Review Board Statement
Informed Consent Statement
Data Availability Statement
Acknowledgments
Conflicts of Interest
References
- Guo, C.F.; Sun, T.; Cao, F.; Liu, Q.; Ren, Z. Metallic nanostructures for light trapping in energy-harvesting devices. Light Sci. Appl. 2014, 3, 161. [Google Scholar]
- Matiko, J.W.; Grabham, N.J.; Beeby, S.P.; Tudor, M.J. Review of the application of energy harvesting in buildings. Meas. Sci. Technol. 2014, 25, 012002. [Google Scholar] [CrossRef]
- Beeby, S.P.; Tudor, M.J.; White, N.M. Energy harvesting vibration sources for microsystems applications. Meas. Sci. Technol. 2006, 17, 175–195. [Google Scholar] [CrossRef]
- Wei, C.; Jing, X. A comprehensive review on vibration energy harvesting: Modelling and realization. Renew. Sustain. Energy Rev. 2017, 74, 1–18. [Google Scholar] [CrossRef]
- Leonov, V. Thermoelectric energy harvesting of human body heat for wearable sensors. IEEE Sens. J. 2013, 13, 2284–2291. [Google Scholar] [CrossRef]
- Zhou, M.; A-Furjan, M.S.H.; Zou, J.; Liu, W. A review on heat and mechanical energy harvesting from human—Principles, prototypes and perspectives. Renew. Sustain. Energy Rev. 2018, 82, 3582–3609. [Google Scholar] [CrossRef]
- Akinaga, H. Recent advances and future prospects in energy harvesting technologies. J. Appl. Phys. 2020, 59, 110201. [Google Scholar] [CrossRef]
- Almoneef, T.S.; Erkmen, F.; Ramahi, O.M. Harvesting the energy of multi-polarized electromagnetic waves. Sci. Rep. 2017, 7, 14656. [Google Scholar] [CrossRef] [PubMed]
- Hidalgo-Leon, R.; Urquizo, J.; Silva, C.E.; Silva-Leon, J.; Wu, J.; Singh, P.; Soriano, G. Powering nodes of wireless sensor networks with energy harvesters for intelligent buildings: A review. Energy Rep. 2022, 8, 3809–3826. [Google Scholar] [CrossRef]
- Zeadally, S.; Shaikh, F.K.; Talpur, A.; Sheng, Q.Z. Design architectures for energy harvesting in the Internet of Things. Renew. Sustain. Energy Rev. 2020, 128, 109901. [Google Scholar] [CrossRef]
- Lee, B.M.; Yang, H. Massive MIMO for industrial internet of things in cyber-physical systems. IEEE Trans. Ind. Inf. 2017, 14, 2641–2652. [Google Scholar] [CrossRef]
- Tohidi, F.; Holagh, S.G.; Chitsaz, A. Thermoelectric generators: A comprehensive review of characteristics and applications. Appl. Therm. Eng. 2022, 201, 117793. [Google Scholar] [CrossRef]
- Feng, M.; Lv, S.; Deng, J.; Guo, Y.; Wu, Y.; Shi, G.; Zhang, M. An overview of environmental energy harvesting by thermoelectric generators. Renew. Sustain. Energy Rev. 2023, 187, 113723. [Google Scholar] [CrossRef]
- Zhang, L.; Shi, X.-L.; Yang, Y.-L.; Chen, Z.-G. Flexible thermoelectric materials and devices: From materials to applications. Mater. Today 2021, 46, 62–108. [Google Scholar] [CrossRef]
- Lu, Y.; Zhou, Y.; Wang, W.; Hu, M.; Huang, X.; Mao, D.; Huang, S.; Xie, L.; Lin, P.; Jiang, B.; et al. Staggered-layer-boosted flexible Bi2Te3 films with high thermoelectric performance. Nat. Nanotechnol. 2023, 18, 1281–1288. [Google Scholar] [CrossRef] [PubMed]
- Zang, J.; Chen, J.; Chen, Z.; Li, Y.; Zhang, J.; Song, T.; Sun, B. Printed flexible thermoelectric materials and devices. J. Mater. Chem. A 2021, 9, 19439–19464. [Google Scholar] [CrossRef]
- Norimasa, O.; Chiba, T.; Hase, M.; Komori, T.; Takashiri, M. Improvement of thermoelectric properties of flexible Bi2Te3 thin films in bent states during sputtering deposition and post-thermal annealing. J. Alloys Compd. 2022, 898, 162889. [Google Scholar] [CrossRef]
- Venkatasubramanian, R.; Siivola, E.; Colpitts, T.; O’Quinn, B. Thin-film thermoelectric devices with high room-temperature figures of merit. Nature 2001, 413, 597–602. [Google Scholar] [CrossRef] [PubMed]
- Zheng, Z.H.; Fan, P.; Chen, T.B.; Cai, Z.K.; Liu, P.J.; Liang, G.X.; Zhang, D.P.; Cai, X.M. Optimization in fabricating bismuth telluride thin films by ion beam sputtering deposition. Thin Solid Film 2012, 520, 5245–5248. [Google Scholar] [CrossRef]
- Hokazono, M.; Anno, H.; Toshima, N. Thermoelectric properties and thermal stability of PEDOT:PSS films on a polyimide substrate and application in flexible energy conversion devices. J. Electron. Mater. 2014, 43, 2196–2201. [Google Scholar] [CrossRef]
- Zhang, Q.; Huang, J.-Q.; Qian, W.-Z.; Zhang, Y.-Y.; Wei, F. The road for nanomaterials industry: A review of carbon nanotube production, post-treatment, and bulk applications for composites and energy storage. Small 2013, 9, 1237–1265. [Google Scholar] [CrossRef] [PubMed]
- Cardenas, J.A.; Andrews, J.B.; Noyce, S.G.; Franklin, A.D. Carbon nanotube electronics for IoT sensors. Nano Futures 2020, 4, 012001. [Google Scholar] [CrossRef]
- Kato, K.; Hagino, H.; Miyazaki, K. Fabrication of bismuth telluride thermoelectric films containing conductive polymers using a printing method. J. Electron. Mater. 2013, 42, 1313–1318. [Google Scholar] [CrossRef]
- Dahiya, A.S.; Thireau, J.; Boudaden, J.; Lal, S.; Gulzar, U.; Zhang, Y.; Gil, T.; Azemard, N.; Ramm, P.; Kiessling, T. Review—Energy autonomous wearable sensors for smart healthcare: A review. J. Electrochem. Soc. 2020, 167, 037516. [Google Scholar] [CrossRef]
- Amma, Y.; Miura, K.; Nagata, S.; Nishi, T.; Miyake, S.; Miyazaki, K.; Takashiri, M. Ultra-long air-stability of n-type carbon nanotube films with low thermal conductivity and all-carbon thermoelectric generators. Sci. Rep. 2022, 12, 21603. [Google Scholar] [CrossRef] [PubMed]
- Chiba, T.; Yabuki, H.; Takashiri, M. High thermoelectric performance of flexible nanocomposite films based on Bi2Te3 nanoplates and carbon nanotubes selected using ultracentrifugation. Sci. Rep. 2023, 13, 3010. [Google Scholar] [CrossRef] [PubMed]
- Norimasa, O.; Tamai, R.; Nakayama, H.; Shinozaki, Y.; Takashiri, M. Self-generated temperature gradient under uniform heating in p–i–n junction carbon nanotube thermoelectric generators. Sci. Rep. 2025, 15, 15956. [Google Scholar] [CrossRef] [PubMed]
- Nakashima, Y.; Yamaguchi, R.; Toshimitsu, F.; Matsumoto, M.; Borah, A.; Staykov, A.; Islam, M.S.; Hayami, S.; Fujigaya, T. Air-stable n-type single-walled carbon nanotubes doped with benzimidazole derivatives for thermoelectric conversion and their air-stable mechanism. ACS Appl. Nano Mater. 2019, 2, 4703–4710. [Google Scholar] [CrossRef]
- Nonoguchi, Y.; Nakano, M.; Murayama, T.; Hagino, H.; Hama, S.; Miyazaki, K.; Matsubara, R.; Nakamura, M.; Kawai, T. Simple alt-coordinated n-type nanocarbon materials stable in air. Adv. Funct. Mater. 2016, 26, 3021–3028. [Google Scholar] [CrossRef]
- Hata, S.; Yanagawa, Y.; Oshima, K.; Tomotsu, J.; Du, Y.; Shiraishi, Y.; Toshima, N. Highly-stable n-type carbon nanotube material under accelerated aging conditions: Conjunctive effect of hydrazine derivatives and commodity polymers. Chem. Lett. 2019, 48, 1109–1111. [Google Scholar] [CrossRef]
- Iijima, S.; Ichihashi, T. Single-shell carbon nanotubes of 1-nm diameter. Nature 1993, 363, 603–605. [Google Scholar] [CrossRef]
- Sanchez-Valencia, J.R.; Dienel, T.; Gröning, O.; Shorubalko, I.; Mueller, A.; Jansen, M.; Amsharov, K.; Ruffieux, P.; Fasel, R. Controlled synthesis of single-chirality carbon nanotubes. Nature 2014, 512, 61–64. [Google Scholar] [CrossRef] [PubMed]
- Yanagi, K.; Udoguchi, H.; Sagitani, S.; Oshima, Y.; Takenobu, T.; Kataura, H.; Ishida, T.; Matsuda, K.; Maniwa, Y. Transport mechanisms in metallic and semiconducting single-wall carbon nanotube networks. ACS Nano 2010, 4, 4027–4032. [Google Scholar] [CrossRef] [PubMed]
- McClain, D.; Thomas, N.; Youkey, S.; Schaller, R.; Jiao, J.; O’Brien, K.P. Impact of oxygen adsorption on a population of mass produced carbon nanotube field effect transistors. Carbon 2009, 47, 1493–1500. [Google Scholar] [CrossRef]
- Dai, R.; Xie, D.; Xu, J.; Sun, Y.; Sun, M.; Zhang, C.; Li, X. Adjustable hydrazine modulation of single-wall carbon nanotube network field effect transistors from p-type to n-type. Nanotechnology 2016, 27, 445203. [Google Scholar] [CrossRef] [PubMed]
- Kang, D.; Park, N.; Ko, J.-H.; Bae, E.; Park, W. Oxygen-induced p-type doping of a long individual single-walled carbon nanotube. Nanotechnology 2005, 16, 1048. [Google Scholar] [CrossRef]
- Seki, Y.; Nagata, K.; Takashiri, M. Facile preparation of air-stable n-type thermoelectric single-wall carbon nanotube films with anionic surfactants. Sci. Rep. 2020, 10, 8104. [Google Scholar] [CrossRef] [PubMed]
- Yonezawa, S.; Chiba, T.; Seki, Y.; Takashiri, M. Origin of n-type properties in single wall carbon nanotube films with anionic surfactants investigated by experimental and theoretical analyses. Sci. Rep. 2021, 11, 5758. [Google Scholar] [CrossRef] [PubMed]
- Lu, S.; Zuo, T.; Wang, Z.; Yan, S. Effects of CNTs/PVA on concrete performance: Strength, drying shrinkage, and microstructure. Materials 2025, 18, 2535. [Google Scholar] [CrossRef] [PubMed]
- D’Angelo, A.; Paineau, E.; Rouzière, S.; Elkaim, É.; Goldmann, C.; Toquer, D.; Rols, S.; Launois, P. The atomic structure of imogolite nanotubes: A 50 years old issue reinvestigated by X-ray scattering experiments and molecular dynamics simulations. Appl. Clay Sci. 2023, 242, 107043. [Google Scholar] [CrossRef]
- Lisuzzo, L.; Guercio, L.; Cavallaro, G.; Duca, D.; Ferrante, F. Halloysite clay nanotubes for catalytic conversion of biomass: Synergy between computational modeling and experimental studies. ACS Catal. 2024, 14, 18167–18203. [Google Scholar] [CrossRef]
- Rennhofer, H.; Zanghellini, B. Dispersion state and damage of carbon nanotubes and carbon nanofibers by ultrasonic dispersion: A review. Nano Mater. 2021, 11, 1469. [Google Scholar] [CrossRef] [PubMed]
- Sabet, S.M.; Mahfuz, H.; Hashemi, J.; Nezakat, M.; Szpunar, J.A. Effects of sonication energy on the dispersion of carbon nanotubes in a vinyl ester matrix and associated thermo-mechanical properties. J. Mater. Sci. 2015, 50, 4729–4740. [Google Scholar] [CrossRef]
- Chen, S.J.; Zou, B.; Collins, F.; Zhao, X.L.; Majumber, M.; Duan, W.H. Predicting the influence of ultrasonication energy on the reinforcing efficiency of carbon nanotubes. Carbon 2014, 77, 1–10. [Google Scholar] [CrossRef]
- Kim, S.Y.; Hwangbo, M.; Hwangbo, S.; Jeong, Y.G. Research on optimizing ultrasonic frequencies for efficient single-walled carbon nanotube dispersion in water using a focused ultrasonic system. Diam. Relat. Mater. 2024, 147, 111284. [Google Scholar] [CrossRef]
- Shitanda, I.; Sugaya, K.; Baba, C.; Loew, N.; Yamagata, Y.; Miyamoto, K.; Niinobe, S.; Komatsuki, K.; Watanabe, H.; Itagaki, M. Rheo-impedance measurements for the dispersibility evaluation of electrode slurries. ACS Appl. Electron. Mater. 2023, 5, 4394–4400. [Google Scholar] [CrossRef]
- Chiba, T.; Amma, Y.; Takashiri, M. Heat source free water floating carbon nanotube thermoelectric generators. Sci. Rep. 2024, 11, 14707. [Google Scholar] [CrossRef] [PubMed]
- Nakajima, T.; Hoshino, K.; Yamamoto, H.; Kaneko, K.; Okano, Y.; M.; Takashiri, M. Stretchable and flexible painted thermoelectric generators on Japanese paper using inks dispersed with p- and n-type single-walled carbon nanotubes. Sensors 2024, 24, 2946. [Google Scholar] [CrossRef] [PubMed]
- De Boer, G.B.J.; De Weerd, C.; Thoenes, D.; Goossene, H.W.J. Laser diffraction spectrometry: Fraunhofer diffraction versus Mie scattering. Part. Part. Syst. Char. 1987, 4, 14–19. [Google Scholar] [CrossRef]
- Matsuyama, T.; Yamamoto, H. Particle shape and laser diffraction: A discussion of the particle shape problem. J. Dispers. Sci. Technol. 2005, 25, 409–416. [Google Scholar] [CrossRef]
- Caruso, M.R.; Calvino, M.M.; Šiler, P.; Cába, L.; Milioto, S.; Lisuzzo, L.; Lazzara, G.; Cavallaro, G. Self-standing biohybrid xerogels incorporating nanotubular clays for sustainable removal of pollutants. Small 2025, 21, 2405215. [Google Scholar] [CrossRef] [PubMed]
- Basat, M.B.; Lachman, N. Development of quality control methods for dispersibility and stability of single-wall carbon nanotubes in an aqueous medium. Nanomaterials 2021, 11, 2618. [Google Scholar] [CrossRef] [PubMed]
- Ariyoshi, K.; Siroma, Z.; Mineshige, A.; Takeno, M.; Fukutsuka, T.; Abe, T.; Uchida, S. Electrochemical impedance spectroscopy part 1: Fundamentals. Electrochemistry 2022, 90, 102007. [Google Scholar] [CrossRef]
- Park, C.M.; Al-Hamadani, Y.A.J.; Heo, J.; Her, N.; Chu, K.H.; Jang, M.; Lee, S.; Yoon, Y. Aggregation kinetics of single walled carbon nanotubes influenced by the frequency of ultrasound irradiation in the aquatic environment. Ultrason. Sonochem. 2017, 39, 750–757. [Google Scholar] [CrossRef] [PubMed]
- Yu, L.; Lin, Y.; Li, L.; Zong, H.; Zhou, Y.; Zhao, S.; Zhang, Z.; Grobert, N.; Maciejewska, B.M.; Qin, L. Understanding interfacial dynamics: Hydrostatic pressure-induced sono-dispersion of carbon nanotubes. Surf. Interfaces 2024, 51, 104740. [Google Scholar] [CrossRef]
- Doorn, S.K.; Heller, D.; Usrey, M.; Barone, P.; Strano, M.S. Raman spectroscopy of single-walled carbon nanotubes: Probing electronic and chemical behavior. In Carbon Nanotubes Properties and Applications; O’Connell, M.J., Ed.; Taylor and Francis Group, LLC: Boca Raton, FL, USA, 2006; pp. 153–186. [Google Scholar]
- Baig, Z.; Mamat, O.; Mustapha, M.; Mumtaz, A.; Munir, K.S.; Sarfraz, M. Investigation of tip sonication effects on structural quality of graphene nanoplatelets (GNPs) for superior solvent dispersion. Ultrason. Sonochem. 2018, 45, 133–149. [Google Scholar] [CrossRef] [PubMed]
- Cutler, M.; Leavy, J.F.; Fitzpatrick, R.L. Electronic transport in semimetallic cerium sulfide. Phys. Rev. 1964, 133, A1143. [Google Scholar] [CrossRef]
- Snyder, G.J.; Toberer, E.S. Complex thermoelectric materials. Nat. Mater. 2008, 7, 105–114. [Google Scholar] [CrossRef] [PubMed]
- Lu, K.L.; Lago, R.M.; Chen, Y.K.; Green, M.L.H.; Harris, P.J.F.; Tsang, S.C. Mechanical damage of carbon nanotubes by ultrasound. Carbon 1996, 34, 814–816. [Google Scholar] [CrossRef]
- Hilding, J.; Grulke, E.A.; Zhang, Z.G.; Lockwood, F. Dispersion of carbon nanotubes in liquids. J. Dispers. Sci. Technol. 2003, 24, 1–41. [Google Scholar] [CrossRef]
- Ma, W.K.A.; Chinesta, F.; Ammar, A.; Mackley, M.R. Rheological modeling of carbon nanotube aggregate suspensions. J. Rheol. 2008, 52, 1311–1330. [Google Scholar] [CrossRef]
- Wu, B.; Guo, Y.; Hou, C.; Zhang, Q.; Li, Y.; Wang, H. From carbon nanotubes to highly adaptive and flexible high-performance thermoelectric generators. Nano Energy 2021, 89, 106487. [Google Scholar] [CrossRef]
- Choi, J.; Jung, Y.; Yang, S.J.; Oh, J.Y.; Oh, J.; Jo, K.; Son, J.G.; Moon, S.E.; Park, C.R.; Kim, H. Flexible and robust thermoelectric generators based on all-carbon nanotube yarn without metal electrodes. ACS Nano 2017, 11, 7608–7614. [Google Scholar] [CrossRef] [PubMed]
- Terashima, S.; Iwasa, Y.; Tanaka, N.; Fujigaya, T.; Iwase, E. Output characteristics of carbon nanotube thermoelectric generator with slitted kirigami structure. Materials 2025, 18, 656. [Google Scholar] [CrossRef] [PubMed]
- Mytafides, K.C.; Tzounis, L.; Karalis, G.; Formanek, P.; Paipetis, S.A. Fully printed and flexible carbon nanotube-based thermoelectric generator capable for high-temperature applications. J. Power Sources 2021, 507, 230323. [Google Scholar] [CrossRef]
- Kim, S.; Mo, J.-H.; Jang, K.-S. Solution-processed carbon nanotube buckypapers for foldable thermoelectric generators. ACS Appl. Mater. Interfaces 2019, 11, 35675–35682. [Google Scholar] [CrossRef] [PubMed]
- Miura, K.; Amezawa, T.; Tanaka, S.; Takashiri, M. Improved heat dissipation of dip-coated single-walled carbon nanotube/Mesh sheets with high flexibility and free-standing strength for thermoelectric generators. Coatings 2024, 14, 126. [Google Scholar] [CrossRef]
- Yamamoto, H.; Amezawa, T.; Okano, Y.; Hoshino, K.; Ochiai, S.; Sunaga, K.; Miyake, S.; Takashiri, M. High thermal durability and thermoelectric performance with ultra-low thermal conductivity in n-type single-walled carbon nanotube films by controlling dopant concentration with cationic surfactant. Appl. Phys. Lett. 2025, 126, 063902. [Google Scholar] [CrossRef]


| Characteristic of SWCNT-TEGs | Heat Source | Output Voltage [mV] | Output Current [mA] | ΔT [K] | Number of Sheets | Normalized Output Voltage [μV/(K·sheet)] | Ref. |
|---|---|---|---|---|---|---|---|
| Water-floating SWCNT-TEGs | No-use | 2.0 | 1.4 | 24 | 60 | This work | |
| All-solid-state flexible material-based TEGs | Use | 850 | 2.6 | 34 | [63] | ||
| All-CNT yarns-based TEGs | Use | 12 | 5 | 120 | 20 | [64] | |
| Slitted Kirigami Structured SWCNT TEGs | Use | 9.9 | 6 | [65] | |||
| Fully printed and flexible SWCNT TEGs | Use | 1110 | 1.7 | 300 | 84 | 44 | [66] |
| Foldable SWCNT TEGs | Use | 20 | 0.25 | 10 | 75 | 27 | [67] |
| Painted SWCNT-TEGs on Japanese paper | Use | 10.4 | 65 | 6 | 27 | [48] | |
| Dip-coated SWCNT/mesh sheet TEGs | Use | 31.5 | 62 | 8 | 64 | [68] | |
| Flexible SWCNT TEGs on polyimide | Use | 24.0 | 80 | 8 | 38 | [69] |
Disclaimer/Publisher’s Note: The statements, opinions and data contained in all publications are solely those of the individual author(s) and contributor(s) and not of MDPI and/or the editor(s). MDPI and/or the editor(s) disclaim responsibility for any injury to people or property resulting from any ideas, methods, instructions or products referred to in the content. |
© 2025 by the authors. Licensee MDPI, Basel, Switzerland. This article is an open access article distributed under the terms and conditions of the Creative Commons Attribution (CC BY) license (https://creativecommons.org/licenses/by/4.0/).
Share and Cite
Okano, Y.; Ochiai, S.; Nakayama, H.; Nagai, K.; Takashiri, M. Optimization of Ultrasonic Dispersion of Single-Walled SWCNT Inks for Improvement of Thermoelectric Performance in SWCNT Films Using Heat Source-Free Water-Floating SWCNT Thermoelectric Generators. Materials 2025, 18, 3339. https://doi.org/10.3390/ma18143339
Okano Y, Ochiai S, Nakayama H, Nagai K, Takashiri M. Optimization of Ultrasonic Dispersion of Single-Walled SWCNT Inks for Improvement of Thermoelectric Performance in SWCNT Films Using Heat Source-Free Water-Floating SWCNT Thermoelectric Generators. Materials. 2025; 18(14):3339. https://doi.org/10.3390/ma18143339
Chicago/Turabian StyleOkano, Yutaro, Shuya Ochiai, Hiroto Nakayama, Kiyofumi Nagai, and Masayuki Takashiri. 2025. "Optimization of Ultrasonic Dispersion of Single-Walled SWCNT Inks for Improvement of Thermoelectric Performance in SWCNT Films Using Heat Source-Free Water-Floating SWCNT Thermoelectric Generators" Materials 18, no. 14: 3339. https://doi.org/10.3390/ma18143339
APA StyleOkano, Y., Ochiai, S., Nakayama, H., Nagai, K., & Takashiri, M. (2025). Optimization of Ultrasonic Dispersion of Single-Walled SWCNT Inks for Improvement of Thermoelectric Performance in SWCNT Films Using Heat Source-Free Water-Floating SWCNT Thermoelectric Generators. Materials, 18(14), 3339. https://doi.org/10.3390/ma18143339