Article

Strength Enhancement of Clay Through Lime–Sand Stabilization at Various Remolding Water Contents

1
School of Civil and Transportation Engineering, Beijing University of Civil Engineering and Architecture, Beijing 102616, China
2
Beijing Urban Transportation Infrastructure Engineering Technology Research Center, Beijing 102616, China
*
Author to whom correspondence should be addressed.
Materials 2025, 18(14), 3282; https://doi.org/10.3390/ma18143282
Submission received: 25 May 2025 / Revised: 8 July 2025 / Accepted: 10 July 2025 / Published: 11 July 2025
(This article belongs to the Section Construction and Building Materials)

Abstract

During the construction of subgrade, the remolding water content w of lime–sand-stabilized clay usually varies in a wide range, leading to inconsistent effectiveness in strength enhancement. Until now, this aspect has not been investigated. In this study, an unconfined compression test and microscopic observation were carried out on clay and stabilized clay (adding 4% lime by mass and 50% sand by volume). The results show the following: (1) remolding water content w had a strong effect on the soil fabrics of pure clay and lime-stabilized clay. An increase in the w from the dry to wet side of optimum reduced matric suction, which diminished the aggregation effect among fine-grained particles in both clay and lime-stabilized clay. Correspondingly, fine-grained aggregate progressively disintegrated, and dispersed fine-grained particles increased. As a result, the w increment at wwcha made the dispersed fine-grained particles successively fill the large pores between aggregates, densifying the soil fabric. In contrast, at w > wcha, the ongoing disintegration of aggregate resulted in progressive structural weakening. Herein, wcha was defined as the characteristic water content at which the soil fabric transitioned from structural densification to weakening. (2) The UCS of both pure clay and lime–sand-stabilized clay followed a bell-shaped pattern as the w increased, with wcha acting as the turning point. For pure clay soils, the UCS increased with increasing w up to wcha because of structural densification, but decreased beyond wcha due to structural weakening. In lime–sand-stabilized clay, where a sand grain skeleton developed, the compression of lime-stabilized clay induced by the movement of sand grains during shearing activated its contribution to the overall strength. The compressive capacity of the lime-stabilized clay varied in a bell-shaped manner with w, and this trend was mirrored in the UCS of lime–sand-stabilized clay. (3) At a low w, the fact that the clay aggregate exhibited sand-like mechanical behavior reduced the effectiveness of incorporating sand and lime for enhancing the UCS. As the w increased at wwcha, the breakdown of aggregates enlarged the distinction between pure clay and sand, resulting in a more pronounced improvement in the UCS with the addition of sand and lime. At w > wcha, the lubrication effect occurring at the contact between sand grains diminished the interlocking between the sand grains. Consequently, the effectiveness of the UCS enhancement decreased.

1. Introduction

Subgrade is a critical structural component of road infrastructure, serving to support overlying pavement systems and distribute traffic loadings to the underlying ground. During the construction of subgrade, clay soils are usually utilized as filling materials, owing to their economic benefits and their strength property, playing an important role in ensuring the stable and safe operation of road infrastructure. Currently, with the continuous increase in demands for transportation efficiency and load-bearing capacity, subgrade is subjected to progressively higher levels of traffic loading stress. This has led to more stringent requirements for the strength property of subgrade filling materials. However, untreated clay soils typically exhibit low shear strength, which may cause severe engineering problems (such as excessive settlement) when directly employed as filling materials. In response to this challenge, many soil stabilization techniques have been introduced, among which the combined use of lime and sand has proven to be effective in improving the strength property of pure clay soils in engineering practice [1].
According to specification [2], lime–sand-stabilized clay soils should be compacted at optimum water content wopt. However, in field construction, the remolding water content w is difficult to control precisely due to complex in situ conditions and may vary across a wide range. This variability in the w may lead to fluctuations in the effectiveness of lime–sand stabilization in enhancing clay strength. Therefore, from a practical point of view, it is important to investigate how remolding water content w affects the effectiveness of lime–sand stabilization in terms of strength.
Until now, extensive investigations have been carried out focusing on the utilization of sand or lime as individual additives for improving the mechanical behavior of clay soils. These investigations were commonly carried out under a fixed w value. Numerous studies have shown that the incorporation of sand into fine-grained soils can significantly improve their engineering properties. Dong et al. [3] found that at optimum water content wopt = 17.8%, the addition of sand to red clay with a high liquid limit could minimize volume expansion upon hydration and enhance mechanical strength. In a study by Liu et al. [4], it was observed that adding sands to red clay would increase its California Bearing Ratio (CBR) value, thereby meeting the requirements of subgrade materials in highway construction. Alnmr et al. [5] observed that incorporating more than 30% sand (by mass) into expansive soils results in a significant change in soil fabric, which effectively suppresses both compressibility and swelling properties. Dafalla et al. [6] reported that the contraction behavior of clay soils was reduced due to the inclusion of sand grains. Similarly to the effect of sands, lime stabilization at a fixed w value has been shown to significantly enhance the engineering properties of clay soils. Bessaim et al. [7] reported that lime addition reduced the plasticity index of clay soils from 21% to 15%, indicating a significant improvement in workability. Nejib Ghazouani et al. [8] demonstrated that the addition of 4% lime (by mass) significantly enhanced the stability and bearing capacity of tuff. Wang et al. [9,10,11] also reported that lime improved the stiffness of clay soils, as evidenced by the increase in shear modulus. Additionally, Shi et al. [12] reported that increasing the lime content led to higher cohesion, with little change in friction angle. In a study by Wang et al. [13] of clay soils, it was found that after being stabilized with lime, their durability under freeze–thaw cycles became enhanced. A similar phenomenon was observed in the study of Li et al. [14] with silty clay. When investigating lime-stabilized clay under thermal cycles, Tunono et al. [15] reported that lime stabilization enhanced the soil’s resistance. Note that lime stabilization can significantly alter the microstructure of fine-grained soils, often leading to shrinkage due to pore size redistribution and particle aggregation. Studies by Rosone et al. have shown that water consumption during stabilization increases matric suction, promoting internal contraction even under static conditions. This moisture-driven shrinkage may induce stress and cracking in subgrades, even in the absence of direct traffic loading.
Despite these extensive studies, most existing studies have focused on either sand or lime modification alone, and were primarily conducted under fixed water content condition. To date, only Yang et al. [16] have reported that at low water content, the incorporation of sand significantly inhibited the swelling behavior of expansive soils, and this inhibiting effect was reduced as the w increased. When the w exceeded 12%, the variation in swelling behavior became negligible. Muawia Dafalla et al. [17] found that adding 8% lime (by mass) to expansive soil at optimum water content wopt would significantly enhance its unconfined compressive strength (UCS). But as the water content w exceeded wopt, the UCS would decrease. To the author’s knowledge, there is a lack of investigation into the strength behavior of clay soils stabilized with a combined application of lime and sand under varying remolding water contents. The effectiveness of this composite modification method across a wide range of w, particularly in terms of enhancing strength properties, has remained largely unexplored.
To address this gap, a systematic experimental study was designed to evaluate the effectiveness of combined lime–sand stabilization in improving the strength properties of clay soils under varying remolding water contents. Unconfined compression tests were carried out on untreated and lime–sand-stabilized clay soils under seven different remolding water contents (w = 14%, 16%, 20%, 25%, 28%, 30%, and 35%), covering both the optimum moisture content wopt as well as on the dry and wet sides. In addition, microstructural observations were made on representative samples, aiming to elucidate the underlying mechanisms contributing to the observed mechanical behavior.

2. Materials and Methods

2.1. Testing Materials

The clay soil used for stabilization in this study was a typical clay filling encountered in subgrade construction (see its grain size distribution in Figure 1a). This clay filling had a liquid limit wL = 63% and a plasticity index Ip = 26%. According to the Unified Soil Classification System (USCS) detailed by ASTM D422-63 [18], it is classified as CH. The chemical composition of the clay soil was determined through X-ray fluorescence (XRF) (see the results in Table 1). The results indicated that SiO2 accounted for 47% by mass and Al2O3 accounted for 38%, with the remaining constituents classified as minor impurities. A standard compaction test was carried out to determine the compaction characteristic of the clay soil. The test yielded an optimum water content wopt of 28% and a maximum dry density ρdmax of 1.50 g/cm3. The resulting compaction curve is presented in Figure 2.
To enhance the strength of the clay, a combined stabilization approach using lime and sand was applied. For the sand grains, a typical quartz sand was used, with its grain size distribution presented in Figure 1b. The sands had a median grain size of 4.95 mm and a uniformity coefficient Cu = 1.72 (summarized in Table 2). Regarding lime, a quicklime commonly used in subgrade construction was employed. The chemical composition of the quicklime is provided in Table 1. As can be seen, the content of CaO exceeded 97.3%, indicating a high content of active ingredients.

2.2. Experimental Methods

2.2.1. Sample Preparation

This study used a cylindrical sample with a diameter D of 39.1 mm and a height H of 80 mm. The dimension of the sample was compatible with the equipment used for the unconfined compression test. The maximum grain size contained in a sample was 5 mm. The ratio of the sample diameter to the maximum grain size exceeded 5, suggesting that the grain size effect had a negligible impact on the testing results (ASTM D2850) [19].
The tested samples used in this study can be divided into two kinds: pure clay soils and clay stabilized with 4% lime (by mass) and 50% sand (by volume). Note that the sand content in the sample was evaluated in terms of volume rather than mass because volume provides a more accurate representation of the sand’s contribution to the formation of the sand skeleton. These additive ratios were selected based on commonly used values in the field. The fine-grained matrix in each group was compacted to achieve two target compaction degrees, Dc = 0.85 and 0.90 (corresponding to dry densities ρd of 1.26 g/cm3 and 1.34 g/cm3), which were consistent with the in situ conditions reported by Liu et al. [20]. Seven remolding water contents (w = 14%, 16%, 20%, 25%, 28%, 30%, and 35%) were selected for the fine-grained soils (clay and lime-stabilized clay) to cover the optimum water content wopt = 28%, as well as on the dry and wet sides.
The sample was prepared through the following procedure. Firstly, the oven-dried lime was dry-mixed with the oven-dried clay using an electric mixer. This dry-mixing approach was adopted to promote uniform dispersion and effective blending of the lime and clay particles prior to the addition of water. Then, water corresponding to the target remolding water content was uniformly sprayed onto the blended fine-grained soils. The moistened soils were subsequently sealed in an airtight container and equilibrated for 24 h. Prior to compaction, the equilibrated fine-grained soils were either re-mixed thoroughly or blended with sand grains. Compaction was performed in five layers using a static compaction method. To guarantee the integration between adjacent layers, the top surface of each layer was scarified before the placement of the soils of the subsequent layer. After the completion of compaction, each sample was carefully demolded.
Following this procedure, all samples were carefully covered with a plastic membrane, placed into a hermetic box, and subjected to a curing period of 24 h in a temperature-controlled chamber maintained at 20 ± 2 °C. The selection of a 24 h curing period was primarily motivated by the need to simulate field conditions where rapid stabilization is essential, such as in emergency road construction or fast-track infrastructure projects. In these scenarios, early strength development is a critical design consideration. The UCS increment during this short period can be primarily attributed to two mechanisms: (1) the increase in matric suction due to water consumption during lime hydration, and (2) the flocculation of clay particles, which promote the formation of edge-to-surface contacts (Prusinski and Bhattacharja, 1999) [21].

2.2.2. Unconfined Compression Test

A strain-controlled unconfined compression apparatus was used for the unconfined compression test. Prior to testing, careful alignment of the lower and upper plates was conducted with a vernier caliper to ensure uniform stress distribution in the sample during loading. During the test, the sample was placed at the center of the lower plate, which was then raised until the sample was fully in contact with the upper plate. Afterwards, strain-controlled compression was applied at a rate of 1 mm/min [22] until the sample failed. Throughout the loading, axial load and displacement were continuously recorded.

2.2.3. Microscopic Tests

The microscopic tests included the mercury intrusion porosimetry (MIP) test and Micro-CT (μCT) test. It should be emphasized that the presence of moisture can significantly affect the reliability of µCT and MIP results. To mitigate this interference, each tested sample was subjected to a freeze-drying process before testing. This process effectively removed water through rapid freezing with liquid nitrogen, followed by vacuum sublimation drying, while preserving the original microstructure of the soil.
MIP tests were carried out using an AutoPore IV 9500 porosimeter (Micrometritics Corporate, Norcross, GA, USA) to investigate the pore size distribution in both pure clay and lime-stabilized clay. For the clay soils, three typical remolding water contents were selected, namely wopt = 28%, a dry side (w = 20%), and a wet side (w = 35%), while for the lime-stabilized clay, the remolding water contents on the dry side (w = 20%) and wet side (w = 35%) were considered. In the mercury intrusion test, pressure was gradually increased to progressively drive mercury into soil pores, starting from large ones at low pressure to small ones at high pressure. For each pressure step, both the volume of intruded mercury and the corresponding pore diameter (calculated according to Delage et al. [23]) were obtained. μCT testing was conducted using a μCT scanner to observe the sand grain distribution. The scanning parameters included an accelerating voltage of 150 kV and a tube current of 150 μA, with a minimum pixel resolution of 44 μm. The μCT tests were performed on a sample with optimum water wopt = 28%.

3. Results

3.1. Mechanical Behavior of Clay Soils

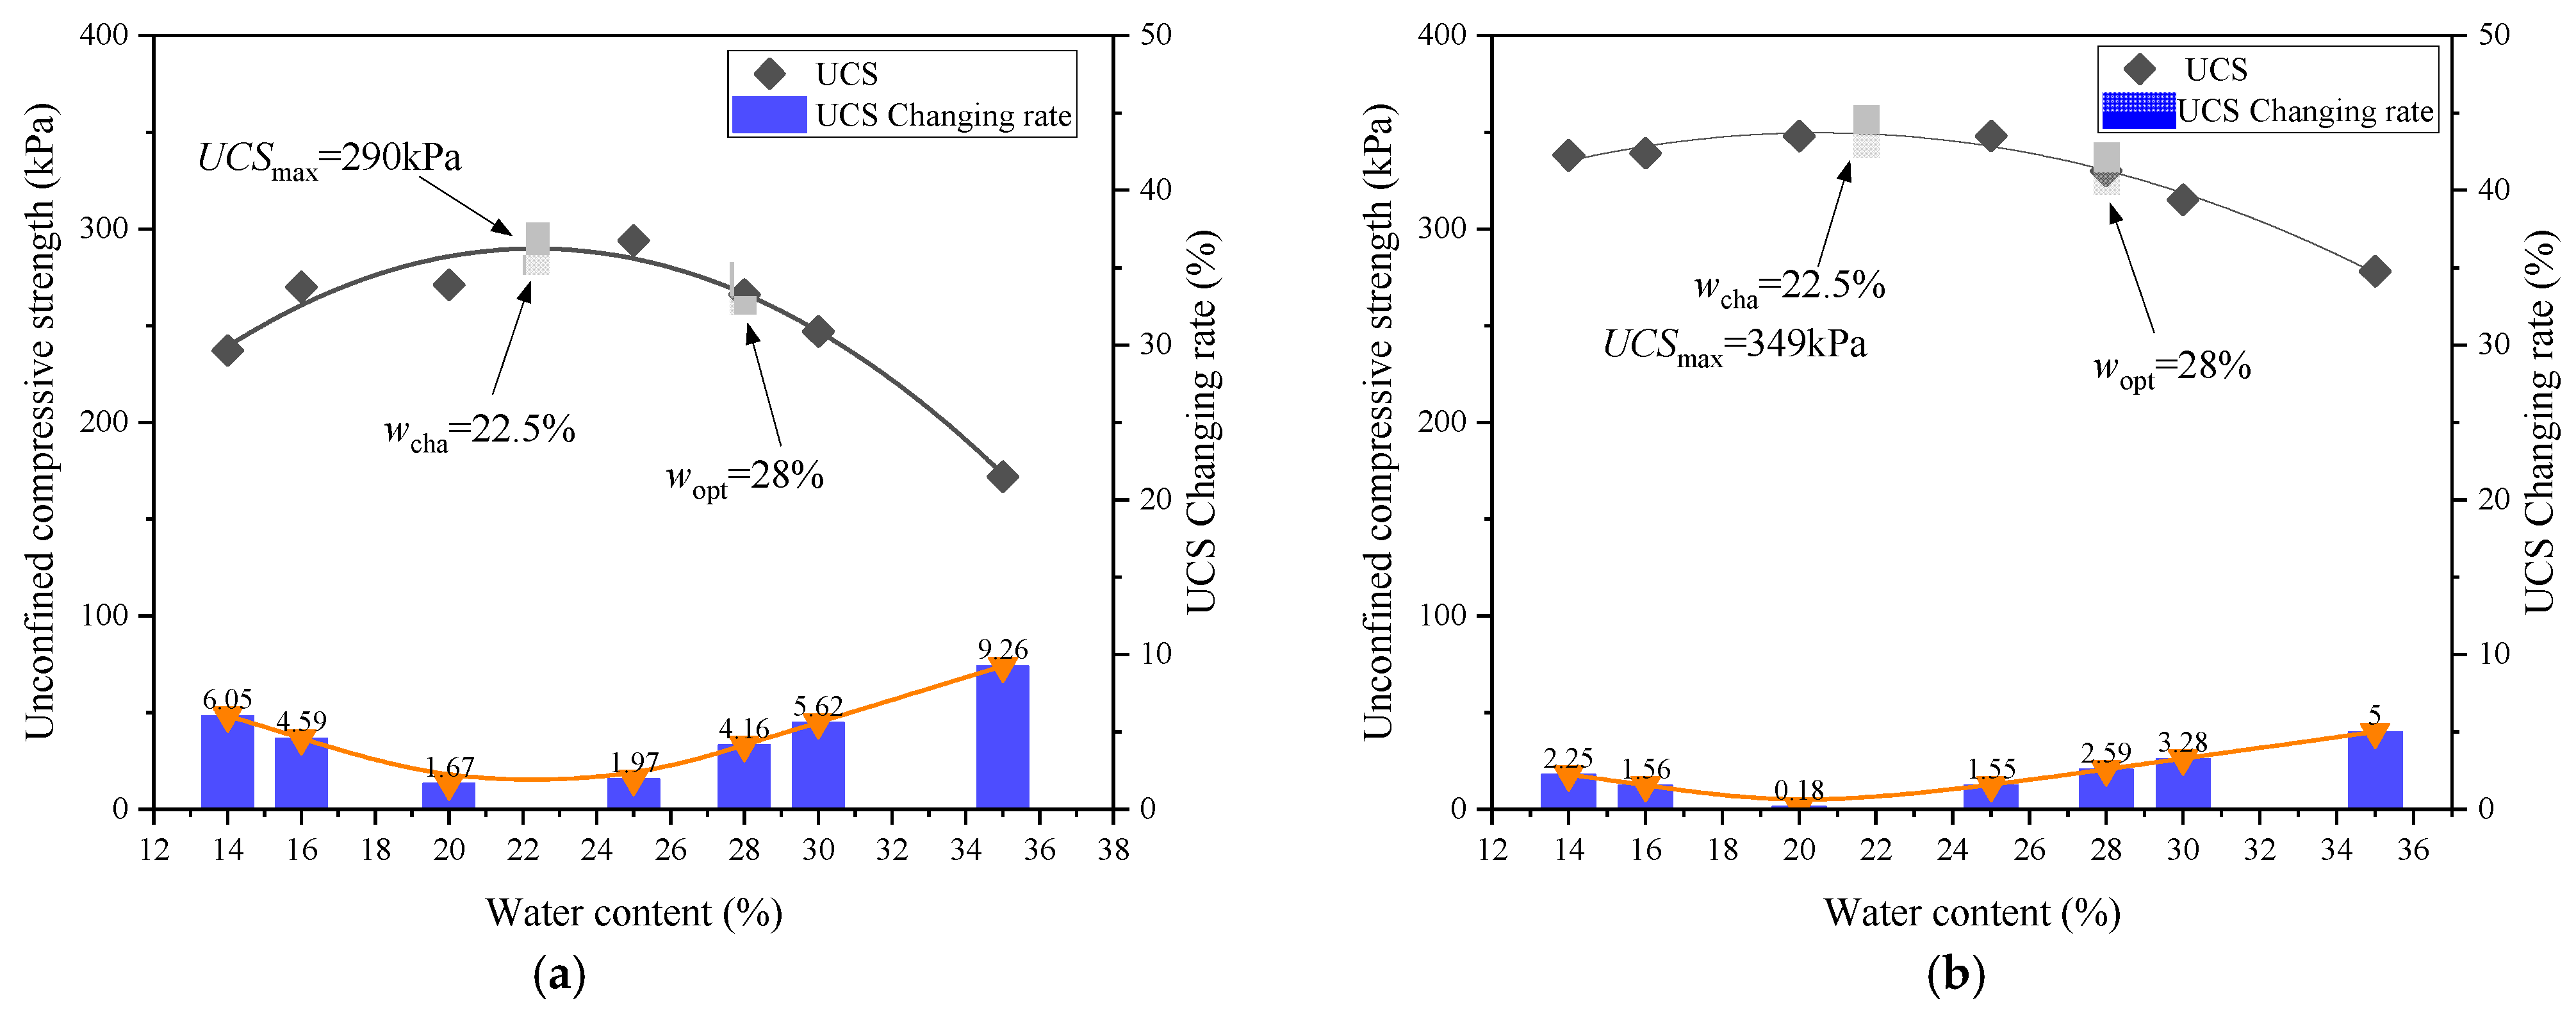
Figure 3 illustrates the stress–strain responses of the clay soils at different remolding water contents under two compaction levels (Dc = 0.85 and 0.90). A strain-softening pattern was identified for each stress–strain relationship, characterized by an initial increase in axial stress q with increasing axial strain ε1, reaching the unconfined compression strength UCS, followed by a gradual decline in q during further deformation.
As can be seen from Figure 3, the remolding water content w had a significant effect on the UCS. Overall, the relationship between the UCS and w was non-monotonic. To further investigate this w effect, Figure 4 depicts the variation in the UCS with w under two compaction degrees. It was obvious that at each Dc level, the UCS first increased and then decreased with increasing w, exhibiting a “bell-shaped” trend. In the study of Zhang et al. [24] focusing on the stiffness of silty clay with various w values, the variation in stiffness exhibited the same trend. At the peak point of UCS, a characteristic water content wcha can be defined, which separates the w effect into two distinct regions: when the wwcha, the w increment enhanced the UCS, while when the w > wcha, the UCS decreased with a further increase in w. Moreover, the wcha values were identical for two Dc levels (wcha = 22.5%), and this value was lower than the optimum water content, wopt = 28%.
This variation in the UCS with w was closely related to the microstructure evolution of the compacted clay soils. The pore size distributions at wopt = 28%, as well as on the dry side (w = 20%) and wet side (w = 35%), obtained from the MIP tests are depicted in Figure 5. It can be observed that at wopt and on the dry side, the pore distribution exhibited a bimodal distribution, with a boundary at pore diameter d = 300 μm, consisting of a large-pore group (d > 300 μm) and a small-pore group (d ≤ 300 μm). In addition, compared with the case on the dry side, there existed more small pores and fewer large pores at wopt. When the water content w was on the wet side, the pore structure displayed a unimodal distribution characteristic, dominated by small pores (d ≤ 300 μm). Similar observations were made by Li and Zhang [25] and Delage [23].
This pore structure evolution reflected the relative proportion of dispersed clay particle and clay aggregate (Figure 5a–c). When on the dry side, the high matrix suction exerted a strong aggregation effect between clay particles [26], forming an aggregate–aggregate structure (Figure 5a). At wopt = 28%, the reduced suction weakened the aggregation effect, resulting in smaller aggregates and more dispersed particles, thus forming an aggregate-dispersed structure (Figure 5b). When w exceeded wopt, the aggregation effect nearly disappeared since the matrix reached a pretty low level, leading to a fully dispersed structure (Figure 5c).
When clay was on the dry side, numerous large pores between aggregates resulted in a loose structure and low UCS value. As w increased, the dispersed clay particles gradually filled these large pores, densifying the soil structure. At wcha = 22.5%, the large pores were well filled, resulting in the highest structural stability and peak UCS (UCSmax). Beyond wcha = 22.5%, the aggregates gradually diminished and eventually disappeared, while the reduced matric suction weakened the bonding effect on the adjacent clay particles. Consequently, the soil structure became progressively weaker and the UCS showed a decreasing trend.

3.2. Mechanical Behavior of Lime–Sand-Stabilized Clay

The stress–strain curves of lime–sand-stabilized clay at various remolding water contents are plotted in Figure 6. Similarly to the clay sample, each stabilized clay sample exhibited strain-softening behavior, and it seemed that the UCS varied non-monotonically with increasing w. The UCS-w relationship curve depicted in Figure 7 displays the w effect on the UCS more clearly. It can be observed that the UCS of the stabilized clay also exhibited a typical “bell-shaped” pattern in response to variation in w. At the point of peak UCS (UCSmax), a characteristic water content wcha can be identified, separating the w effect into two distinct zones: the UCS increased when wwcha, but decreased when w > wcha. Notably, the characteristic water content of wcha = 22.5% of the lime–sand-stabilized clay is identical to that of the pure clay, which remained below the wopt = 28%. This indicates that compaction can be effectively carried out on the dry side of wopt. Indeed, compaction at lower water contents can sometimes lead to volumetric problems. Future studies should consider these volumetric behaviors to better assess the field applicability of lime–sand stabilization and ensure long-term performance under field conditions.
This UCS variation with w for sand–lime-stabilized clay was highly related to the soil fabric evolution. The entire sample can be regarded to be consist of two parts: sand grains and the lime-stabilized clay. For the lime-stabilized clay part, the MIP results (see Figure 8) show that the pore size distribution exhibited a bimodal characteristic on the dry side (w = 20%), while on the wet side (w = 35%), a unimodal distribution was observed. This variation is consistent with that of pure clay, indicating that the addition of lime did not alter the fundamental pattern of pore size distribution. The pore structure variation in lime-stabilized clay also illustrates the varying ratio between the dispersed fine-grained particle and the fine-grained aggregate, which was the same as the case of pure clay. Under dry conditions, an aggregate–aggregate structure was formed due to the aggregate formation induced by the high matric suction. When the remolding water content increased, the diminishing matric suction weakened the aggregation process, leading to the formation of more dispersed fine-grained particles. On the wet side, the aggregation process almost disappeared due to the negligible matric suction, and the fabric of the fine-grained soil became dominated by dispersed fine-grained particles.
Consistent with this varying ratio between the dispersed fine-grained particle and fine-grained aggregate, the UCS variation in the lime-mixed clay also exhibited a “bell-shaped” characteristic (see Figure 7). At a low water content, large pores formed between aggregates, leading to a loose structure and small UCS value. As the w rose, increased quantities of dispersed particles gradually filled the large pores between aggregates, leading to fabric densification. At wcha, pore filling reached the optimal state, which yielded the maximum UCS (UCSmax). Beyond this, aggregates successively disappeared and the reduced matric suction weakened the bonding, causing the UCS to decline.
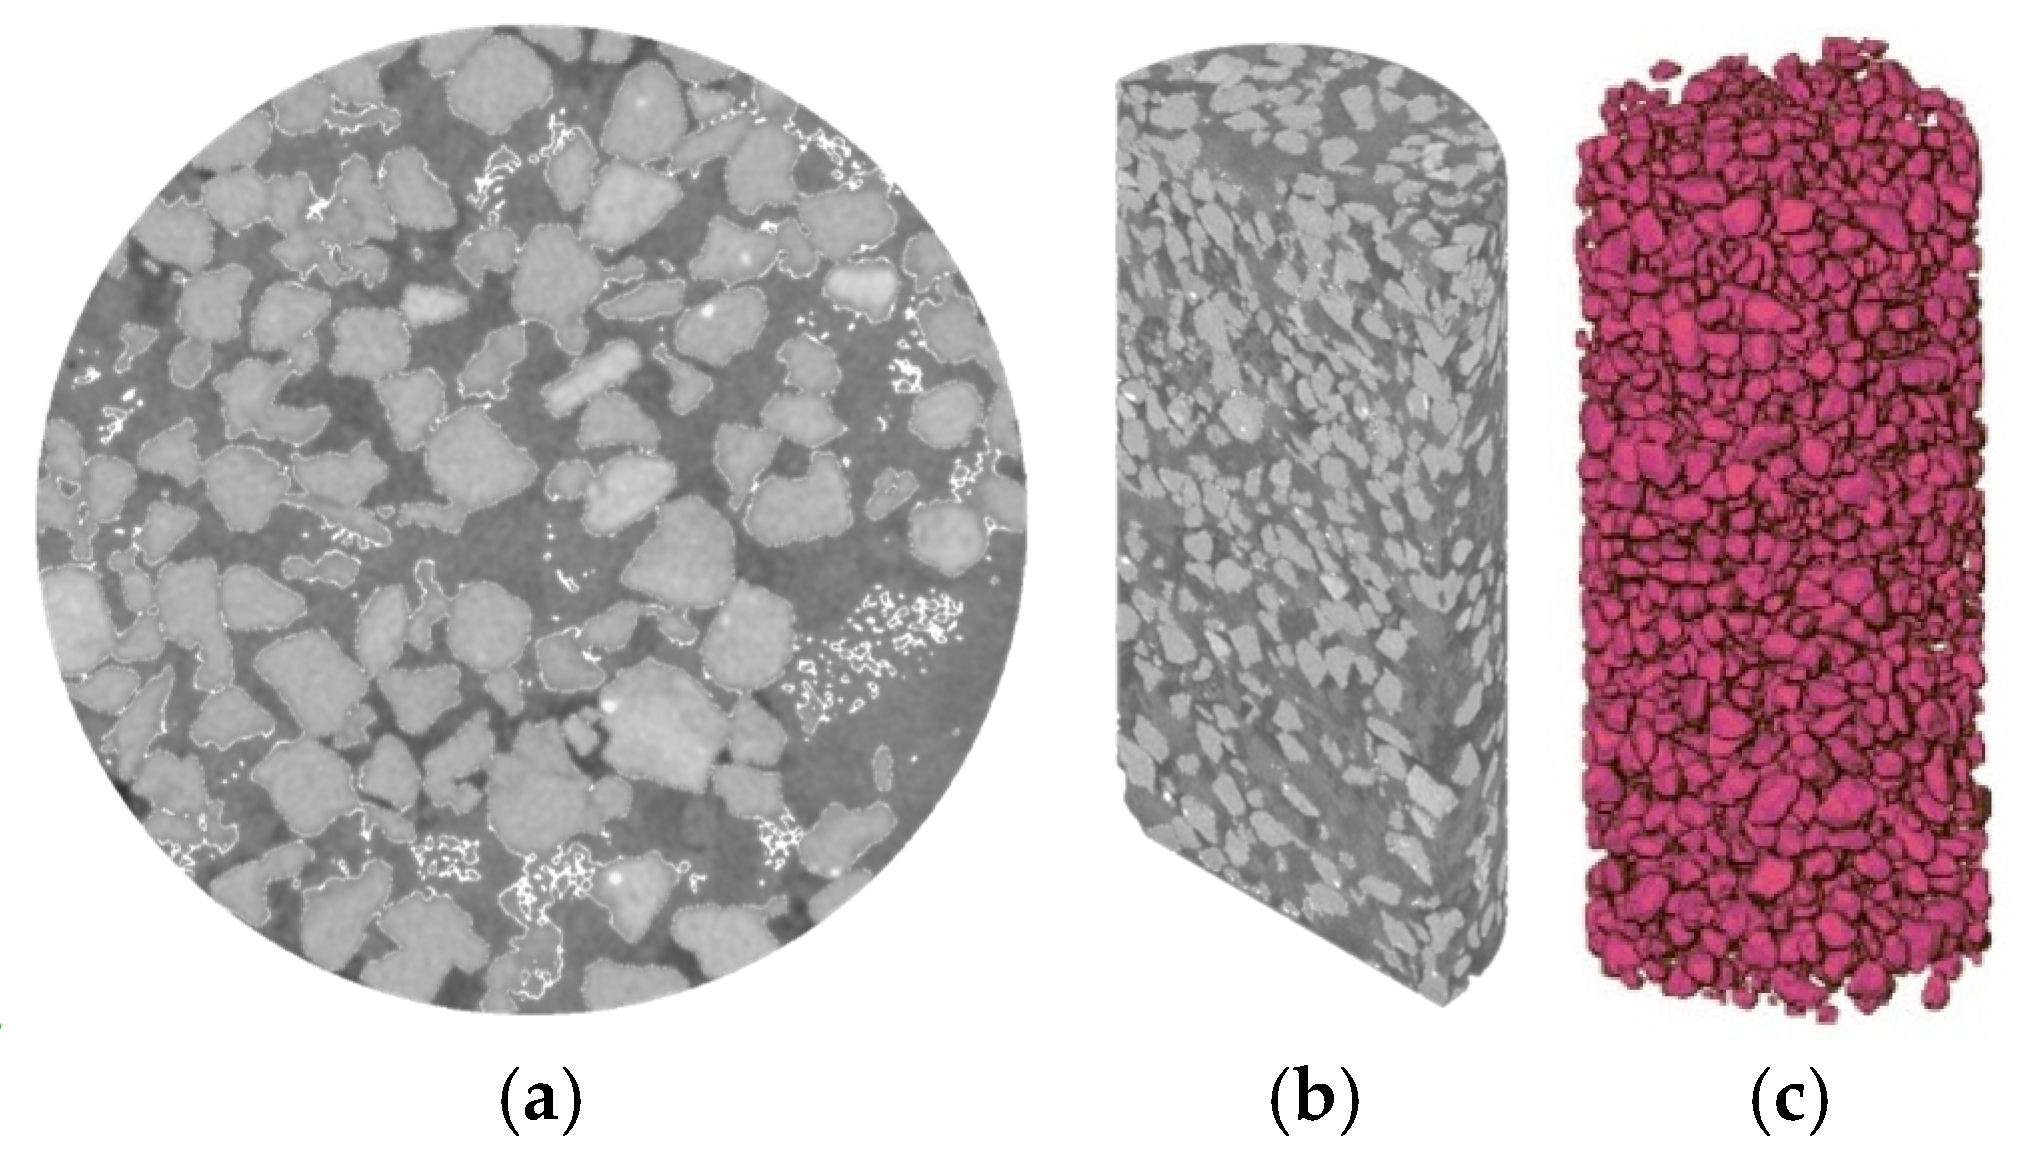
Regarding the sand grain, its three-dimensional distribution inside the sample (μCT scanning results) shows that the sand grains were inter-connected with each other, with a sand grain skeleton formed (see Figure 9). Indeed, following the method proposed by Monkul and Ozden 2007 [27], in the sand used in this study, when volumetric sand content reached 49.2%, a sand grain skeleton started to be formed. In this case, most of the fine-grained matrix (namely, lime-stabilized clay) was located within the large pores formed by the sand skeleton. Under shear loading, the movement of the sand grains exerted compressive stress on the lime-mixed clay within these pores, thereby activating its contribution to the overall strength of the entire sand–lime stabilized clay. As mentioned above, as the remolding water content w of the fine-grained matrix (lime-stabilized clay) increased from the dry side to wcha, the amount of dispersed fine-grained particles gradually increased and filled the pores between the aggregates, leading to the densification of the fine-grained matrix structure. This process enhanced the compressive stiffness of the fine-grained matrix within the macropores between sand grains, resulting in a continuous increase in the UCS with rising w. When the w exceeded wcha and continued to increase, the progressive disintegration of fine-grained aggregates further increased the proportion of dispersed particles, which weakened the compressive stiffness of the fine-grained matrix. Consequently, the UCS began to decrease.

3.3. Comparison of Mechanical Behavior Between Clay and Lime–Sand-Stabilized Clay

Figure 10 presents a comparison of the stress–strain relationship between clay and lime–sand-stabilized clay. As can be clearly observed, at each remolding water content w, the addition of lime and sand led to a significant improvement in the UCS of the clay.
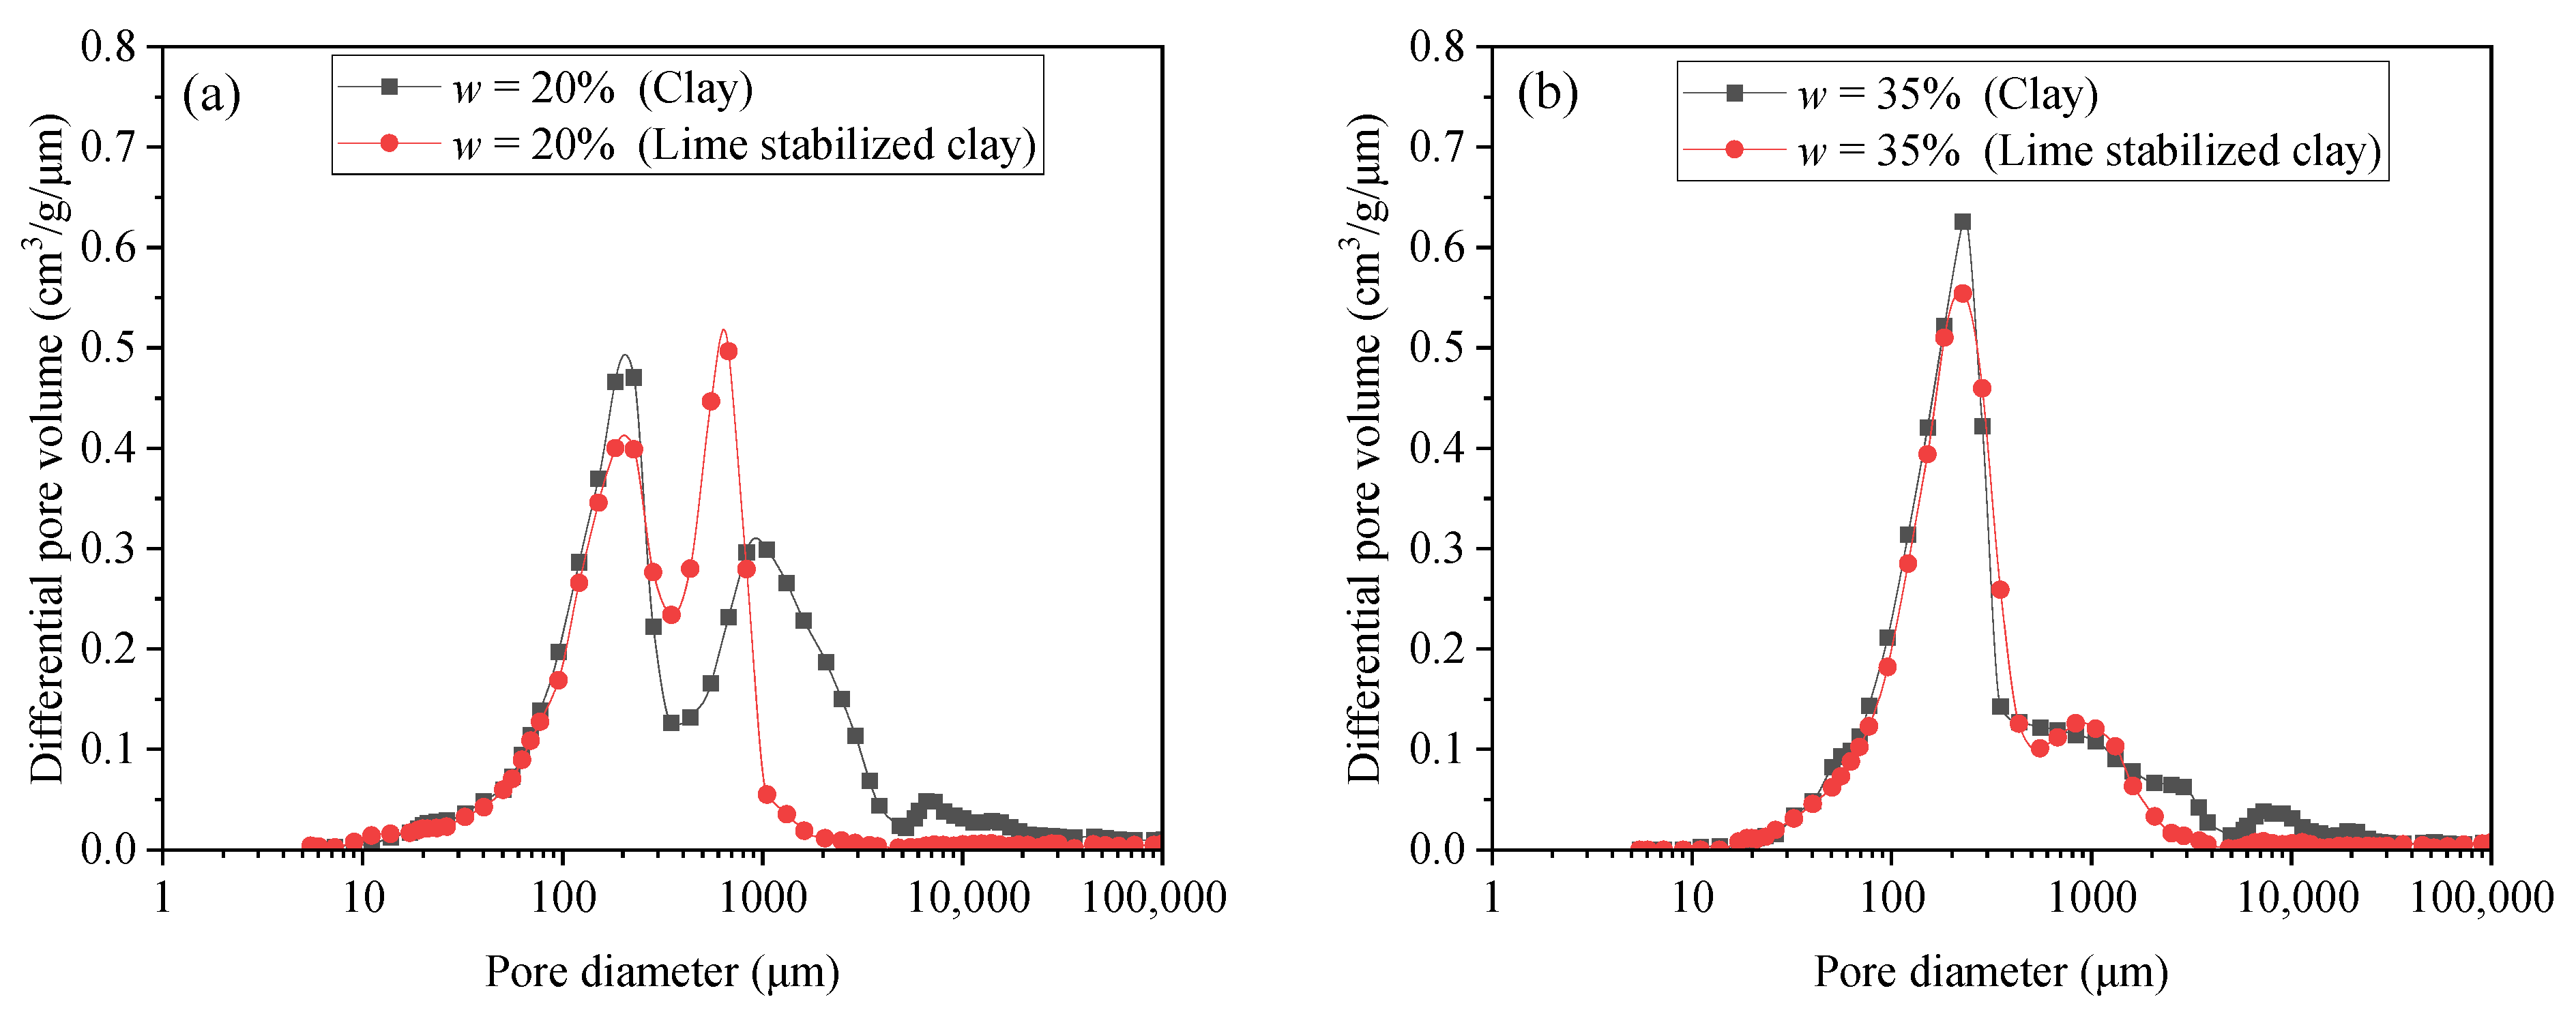
This phenomenon was strongly supported by the μCT results and the MIP results. As shown in the μCT results (Figure 9), the addition of sand grains caused the formation of a sand grain skeleton with interlocking contacts between adjacent grains, which significantly improved the frictional resistance relative to the pure clay. In the MIP results, when on the dry side (w = 20%) (see Figure 11a), adding lime shifted the modal pore diameter of the large-pore group (d > 300 μm) from 936 μm to 653 μm, while the total volume of large pores remained relatively unchanged (0.19 cm3/g before liming and 0.18 cm3/g after liming). When on the wet side (w = 35%), lime addition resulted in an overall reduction in the pores (see Figure 11b). It is worth noting that given the short curing time (24 h), this observed pore structure variation was predominantly driven by flocculation and agglomeration within the clay particles, which led to the formation of edge–surface contacts among them (Prusinski and Bhattacharja, 1999) [21]. Under the combined effects of these structural changes, the UCS exhibited an increasing trend. It is important to note that among the two stabilizing agents (sand and lime), the improvement in the UCS is primarily attributed to the addition of sand. The substantial quantity of sand added fundamentally altered the soil structure, transitioning it from a clay-dominated matrix to a sand skeleton structure. In contrast, lime played a secondary role, mainly influencing the soil fabric through its effects on clay particle flocculation and aggregation.
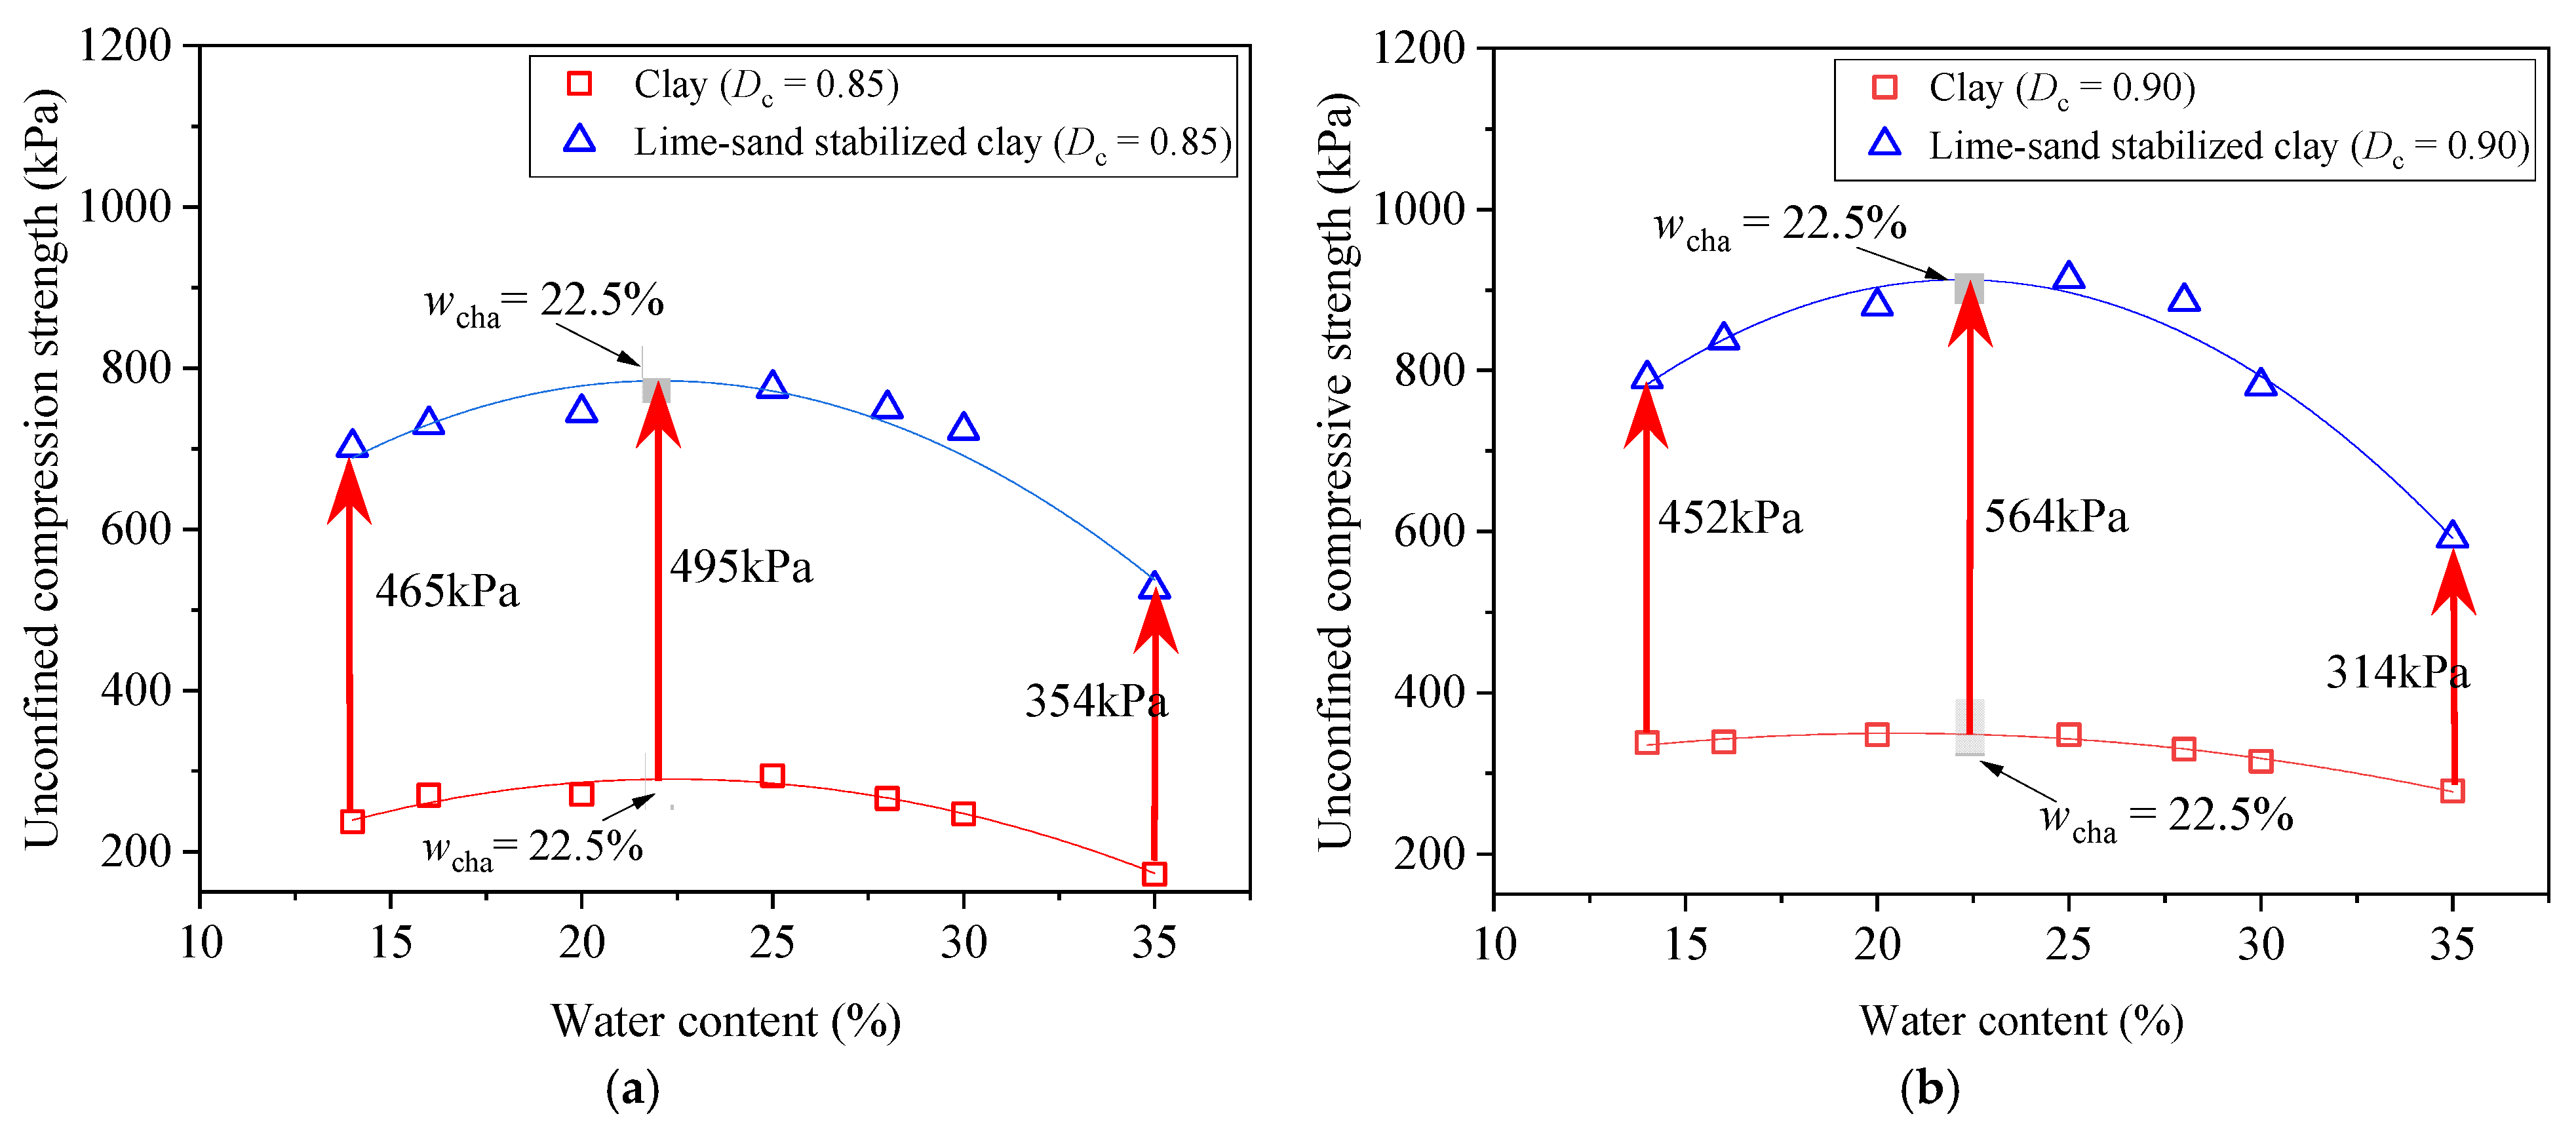
To better understand the effect of the addition of lime and sand on the UCS under different remolding water contents w, Figure 12 presents a comparison of the UCS-w relationships between the pure clay and the lime–sand-stabilized clay. These relationships are described using a quadratic function. The coefficient of determination (R2) values were calculated for both clay and lime–sand-stabilized clay at two compaction degrees (Dc = 0.85 and Dc = 0.90). Specifically, the R2 values were 0.96 and 0.98 for clay, and 0.93 and 0.96 for lime–sand-stabilized clay at Dc = 0.85 and Dc = 0.90, respectively. These high R2 values indicate that the quadratic model fitted the experimental data well.
It can be observed that at each compaction degree Dc, when at w = 14%, the increment in the UCS (ΔUCS) exhibited a relatively small level: ΔUCS = 465 kPa at Dc = 0.85, ΔUCS = 452 kPa at Dc = 0.90. When the w increased within the rage wwcha, ΔUCS gradually increased, reaching the maximum level at wcha = 22.5% (ΔUCS = 495 kPa at Dc = 0.85, ΔUCS = 564 kPa at Dc = 0.90). Beyond wcha, ΔUCS started to decrease and at w = 35%, ΔUCS reduced to 354 kPa at Dc = 0.85 and 314 kPa at Dc = 0.90. This variation in UCS enhancement with varying w can be explained as follows.
At w = 14%, the soil fabric was dominated by fine-grained soil aggregate. Due to the pretty high matric suction within the aggregate, the aggregate possessed high resistance to breakdown under external loading. Compared to the dispersed fine-grained particles, these aggregates were more similar to sand grains [28]. Consequently, the addition of sand and lime had minimal effect on the overall soil fabric, resulting in the smallest improvement in the UCS (ΔUCS).
As the w gradually increased towards wcha, the quantity of clay aggregates decreased while the proportion of dispersed fine-grained particles increased. This shift enhanced the contrast between the pure clay and the added sand grains, thereby amplifying the enhancement effect of the addition of sand and lime on soil properties. As a result, the UCS enhancement (ΔUCS) became progressively more significant.
When w exceeded wcha and continued to increase, the number of aggregates further declined, and the amount of dispersed particles kept rising. Meanwhile, the increased presence of fine particles at the contact interfaces between the sand grains enhanced the lubrication effects, which weakened the inter-grain interlocking. Therefore, in this w range, the UCS enhancement (ΔUCS) began to decline slightly with w increasing.
Note that the maximum UCS enhancement was achieved at a remolding water content of wcha = 22.5%, which lies on the dry side of the optimum water content (wopt = 28%). Although lime–sand stabilization proved most effective in improving clay strength under a low water level, field compaction under such conditions typically required greater effort due to the enhanced particle friction and bonding, potentially leading to higher energy consumption and construction costs. Therefore, in practical applications, it is essential to consider a balance between achieving favorable mechanical performance and maintaining compaction efficiency.

3.4. Comparison with Previous Studies

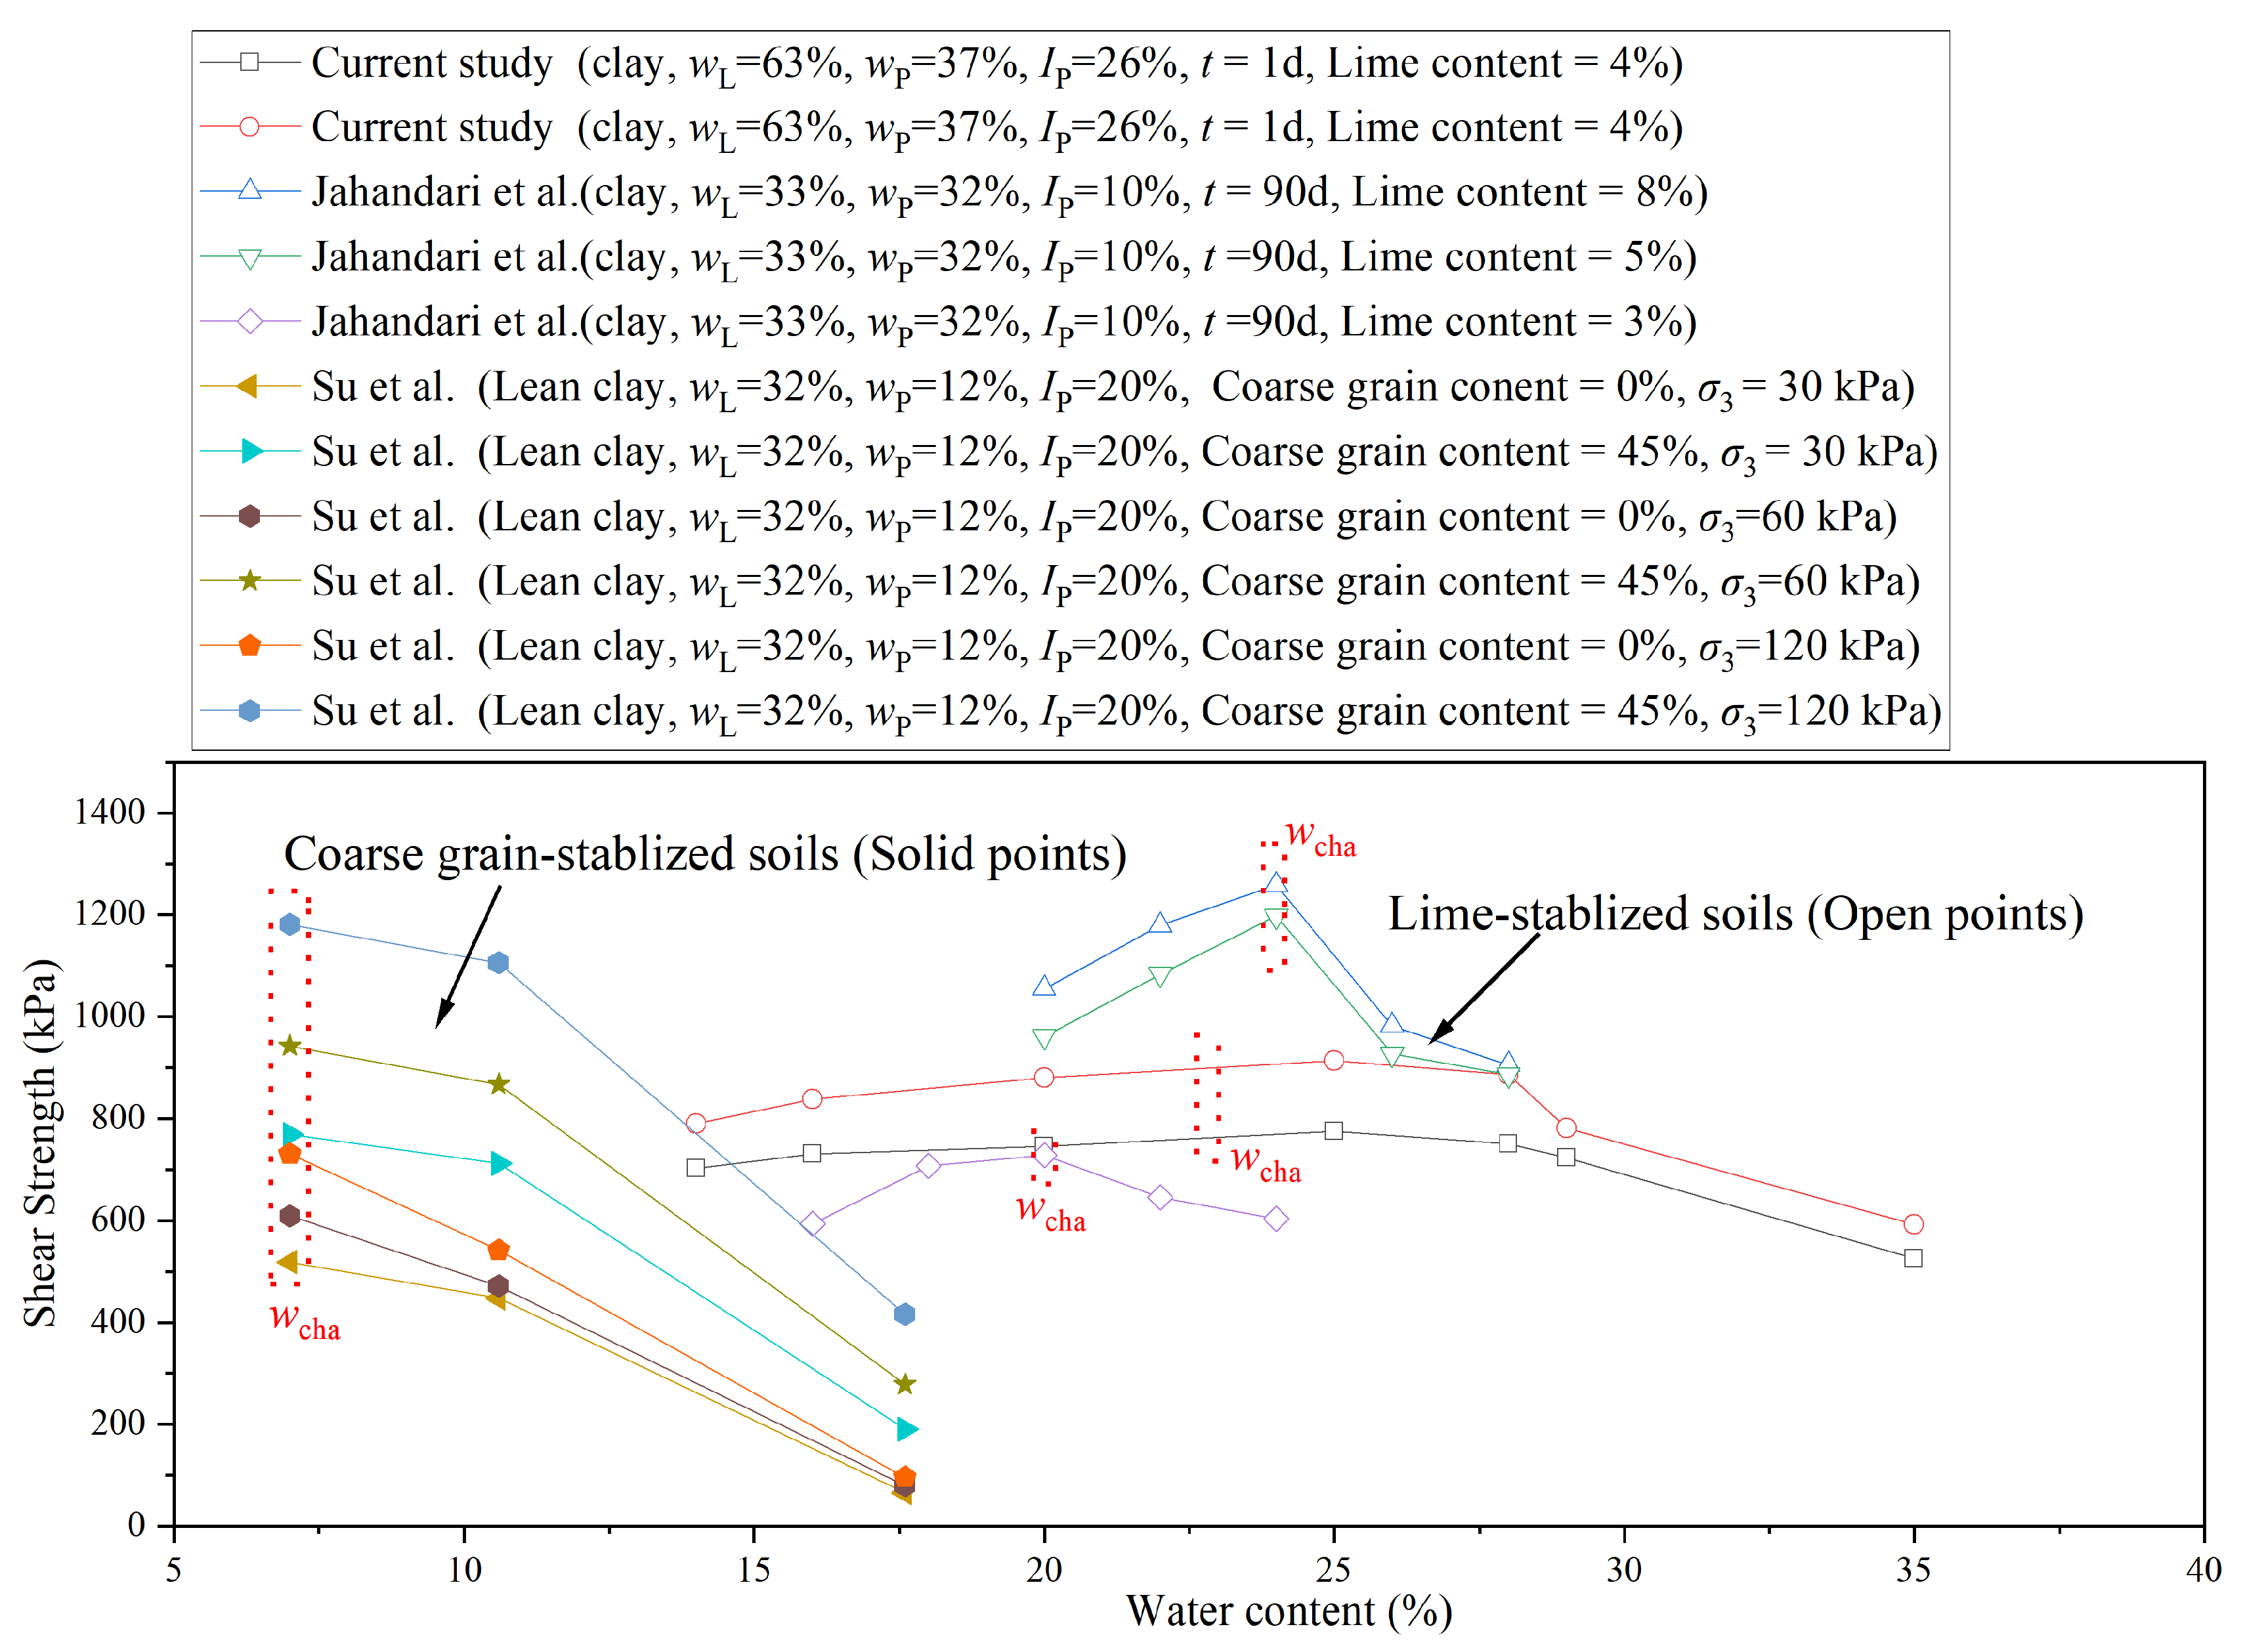
The relevant data from the literature were extracted and are plotted in Figure 13. Su et al. [29] investigated the effect of incorporating coarse grains into fine-grained soils and observed that the strength of the stabilized clay generally decreased with increasing water content, although an initial increase may occur at low water levels. This led to the definition of a characteristic water content wcha, which delineates the two distinct behavioral regimes. Jahandari et al. [30] reported a clear transition in strength development when lime was used for soil stabilization. Their findings also support the existence of a characteristic water content wcha that separates the mechanical response into two distinct stages. In our study on lime–sand stabilization, we identified a comparable characteristic water content wcha, which effectively divided the strength behavior into two phases: an initial strengthening phase at lower water contents and a weakening phase beyond wcha. This observation is highly consistent with the previous studies cited above, which used lime or sand as an individual stabilizing agent.

4. Conclusions

This study carried out unconfined compression tests on clay and lime–sand-stabilized clay (adding 4% lime by mass and 50% sand by volume) at seven remolding water contents (w = 14%, 16%, 20%, 25%, 28%, 30%, and 35%). In addition, typical samples were selected for μCT and MIP observations. Based on the obtained results, the effectiveness of combined lime–sand stabilization in improving the strength properties of clay soils under varying remolding water contents could be evaluated, and the following conclusions were drawn.
(1)
The soil fabrics of both pure clay and lime-mixed clay were significantly influenced by the remolding water content w. As the w increased from the dry side of optimum to the wet side, the reduction in matric suction led to a weakening of the aggregation effect among fine-grained particles, resulting in progressive disintegration of fine-grained aggregate and an increase in dispersed fine-grained particles. Consequently, when the w increased to wwcha, the dispersed fine-grained particles gradually filled the large pores between aggregates, leading to continuous densification of the soil fabric. In contrast, at w > wcha, the ongoing disintegration of the aggregate resulted in progressive structural weakening.
(2)
As the w increased, both the pure clay and lime–sand-stabilized clay exhibited a bell-shaped UCS variation with wcha as the threshold. In pure clay soils, the increase in the UCS with increasing w at wwcha was due to structural densification, while the UCS decrement at w > wcha resulted from structural weakening. For lime–sand-stabilized clay in which a sand grain skeleton had formed, the shearing-induced compression of lime-mixed clay by the sand grains activated its contribution to the overall strength. As the compressive capacity of the lime-mixed clay exhibited a bell-shaped response to w, with wcha serving as the threshold, the overall UCS of the lime–sand-stabilized clay followed a similar pattern.
(3)
At a low w value, the dominance of the clay aggregate with sand-like mechanical behavior limited the effectiveness of adding sand and lime in improving the UCS. As the w approached wcha, the disintegration of the aggregate enlarged the contrast between pure clay and sand, leading to a greater improvement in the UCS. Beyond wcha, the lubrication effect in sand–sand contact areas reduced the grain interlocking effect, slightly decreasing the effectiveness of UCS enhancement.
The above findings indicate that the maximum UCS enhancement was achieved at a remolding water content of wcha = 22.5%. Both higher and lower water contents resulted in a reduction in the effectiveness of lime–sand stabilization. Therefore, in engineering practice, it is recommended to control the remolding water content around wcha. However, it should be noted that this wcha value lies on the dry side of the optimum water content (wopt = 28%). Compaction under such low water levels generally demands more effort due to increased interparticle resistance, which may result in higher energy consumption and elevated construction costs. Hence, a balance between achieving favorable mechanical performance and maintaining compaction efficiency should be considered in practical application.
It is important to note that this study was focused on a single type of clay with specific plasticity characteristics. Therefore, the findings may not be directly applicable to other fines-grained soils with different plasticity properties. Further investigations involving soils with other plasticity indexes are recommended.

Author Contributions

Conceptualization, S.Q.; methodology, S.Q., J.L. and W.M.; validation, J.L., W.M. and J.W.; formal analysis, S.Q., J.L. and W.M.; investigation, J.L. and J.W.; data curation, J.L. and J.W.; writing—original draft preparation, S.Q., J.L. and W.M.; writing—review and editing, S.Q., J.L. and J.W.; supervision, S.Q., J.L., J.W. and W.M.; funding acquisition, S.Q. All authors have read and agreed to the published version of the manuscript.

Funding

This work was financially supported by National Natural Science Foundation Youth Fund of China (52108295), Young Teacher Training Program of Beijing University of Civil Engineering and Architecture (Grant X24023), and Pyramid Talent Training Project of Beijing University of Civil Engineering and Architecture (Grant JDYC20220811).

Institutional Review Board Statement

Not applicable.

Informed Consent Statement

Not applicable.

Data Availability Statement

The original contributions presented in this study are included in the article. Further inquiries can be directed to the corresponding author.

Conflicts of Interest

The authors declare no conflicts of interest.

Abbreviations

The following abbreviations are used in this manuscript:
Cucoefficient of uniformity
dpore diameter
Dsample diameter
Dccompaction degree
Gsspecific gravity
Hsample height
Ipplasticity index
qaxial stress
UCSunconfined compression strength
UCSmaxmaximum value of unconfined compression strength
wremolding water content
wchacharacteristic water content
wLliquid limit
woptoptimum water content
wpplastic limit
ρddry density
ρdmaxmaximum dry density
ε1axial strain
ΔUCSvariation value of UCS

References

  1. Chen, W.; Hou, Y.Z.; Chen, J. Study on physical and mechanical properties and micro-mechanism of modified expansive soil with disintegrated sandstone-cement. Water Resour. Hydropower Eng. 2021, 52, 132–140. [Google Scholar]
  2. JTG D30-2015; Specifications for Design of Highway Subgrade. Ministry of Communications, People’s Republic of China: Beijing, China, 2015.
  3. Dong, W.; Huang, D.W.; Wang, H.Y. Experimental studies on red clay improved with sand. China Energy Environ. Prot. 2018, 40, 157–162. [Google Scholar]
  4. Liu, A.M.; Fu, J.B. Research on the improvement methods of using high liquid limit red clay as subgrade filler. J. Ground Improv. 2024, 6 (Suppl. S1), 15–21. [Google Scholar]
  5. Alnmr, A.; Alsirawan, R.; Ray, R.; Alzawi, M.O. Compressibility of expansive soil mixed with sand and its correlation to index properties. Heliyon 2024, 10, 35711. [Google Scholar] [CrossRef] [PubMed]
  6. Dafalla, M.; Shaker, A.; Elkady, T.; Almajed, A.; Al-Shamrani, M. Shear strength characteristics of a sand clay liner. Sci. Rep. 2020, 10, 18226. [Google Scholar] [CrossRef]
  7. Bessaim, M.M.; Bessaim, A.; Missoum, H.; Bendani, K. Effect of quick lime on physicochemical properties of clay soil. MATEC Web Conf. EDP Sci. 2018, 149, 02065. [Google Scholar] [CrossRef]
  8. Ghazouani, N. Quicklime-stabilized Tuff and Clayey Soils for Highway A3 Construction in Northern Tunisia. Eng. Technol. Appl. Sci. Res. 2024, 14, 13511–13516. [Google Scholar] [CrossRef]
  9. Wang, Y.; Cui, Y.J.; Tang, A.M.; Tang, C.S.; Benahmed, N. Changes in thermal conductivity, suction and microstructure of a compacted lime-treated silty soil during curing. Eng. Geol. 2016, 202, 114–121. [Google Scholar] [CrossRef]
  10. Wang, Y.; Duc, M.; Cui, Y.J.; Tang, A.M.; Benahmed, N.; Sun, W.J.; Ye, W.M. Aggregate size effect on the development of cementitious compounds in a lime-treated soil during curing. Appl. Clay Sci. 2017, 136, 58–66. [Google Scholar] [CrossRef]
  11. Wang, Y.; Cui, Y.J.; Tang, A.M.; Benahmed, N.; Duc, M. Effects of aggregate size on the compressibility and air permeability of lime-treated fine-grained soil. Eng. Geol. 2017, 228, 167–172. [Google Scholar] [CrossRef]
  12. Shi, Y.; Li, S.; Zhang, T.; Liu, J.; Zhang, J. Compaction and shear performance of lime-modified high moisture content silty clay. Case Stud. Constr. Mater. 2024, 21, 03529. [Google Scholar] [CrossRef]
  13. Wang, Y.H.; Yang, C.Y.; Wang, Y.N. Durability of Lime-Stabilized Clay Subgrade in Seasonal Frozen Region. Sci. Technol. Eng. 2024, 24, 14787–14795. [Google Scholar]
  14. Li, S.G.; Liu, S.S.; Zhang, T.B.; Wang, Z.G.; Zhao, W. Experimental study on the durability and microstructural characteristics of lime-stabilized silty clay in seasonally frozen region. Constr. Build. Mater. 2025, 463, 140158. [Google Scholar] [CrossRef]
  15. Tunono, C.; Fall, M. THMC Behavior of Lime-Stabilized Clay Subgrade Under Daily Thermal Cycles: Column Experiments. Geotech. Geol. Eng. 2024, 42, 915–944. [Google Scholar] [CrossRef]
  16. Yang, J.; Tong, L.; Zhang, G.D.; Zhang, G.; Tang, Y. Impact of Initial Water Content and Weathered Sandon Load-free Swelling of Expansive Soil. Water Resour. Power 2014, 32, 162–166. [Google Scholar]
  17. Dafalla, M.; Mutaz, E.; Al-Shamrani, M. Compressive strength variations of lime-treated expansive soils. In Proceedings of the International Foundations Congress and Equipment Expo (IFCEE 2015), San Antonio, TX, USA, 17–21 March 2015; pp. 1402–1409. [Google Scholar]
  18. ASTM D422–63; Standard Test Method for Particle-Size Analysis of Soils. ASTM: West Conshohocken, PA, USA, 2007.
  19. ASTM D2850-15; Standard Test Method for Unconsolidated-Undrained Triaxial Compression Test on Cohesive Soils. ASTM: West Conshohocken, PA, USA, 2019.
  20. Liu, J.; Xiao, J. Experimental study on the stability of railroad silt subgrade with increasing train speed. J. Geotech. Geoenviron. Eng. 2010, 136, 833–841. [Google Scholar] [CrossRef]
  21. Prusinski, J.R.; Bhattacharja, S. Effectiveness of Portland cement and lime in stabilizing clay soils. Transp. Res. Rec. 1999, 1652, 215–227. [Google Scholar] [CrossRef]
  22. AASHTO T208-15; Standard Method of Test for Unconfined Compressive Strength of Cohesive Soil. American Association of State Highway and Transportation: Washington, DC, USA, 2019.
  23. Delage, P.; Audiguier, M.; Cui, Y.J.; Howat, M.D. Microstructure of a compacted silt. Can. Geotech. J. 1996, 33, 150–158. [Google Scholar] [CrossRef]
  24. Zhang, T.W.; Cui, Y.J.; Lamas-Lopez, F.; Calon, N.; Costa D’Aguiar, S. Compacted soil behaviour through changes of density, suction, and stiffness of soils with remoulding water content. Can. Geotech. J. 2018, 55, 182–190. [Google Scholar] [CrossRef]
  25. Li, X.; Zhang, L.M. Characterization of dual-structure pore-size distribution of soil. Can. Geotech. J. 2009, 46, 129–141. [Google Scholar] [CrossRef]
  26. Su, Y.; Cui, Y.J.; Dupla, J.C.; Canou, J.; Qi, S. Developing a sample preparation approach to study the mechanical behavior of unsaturated fine/coarse soil mixture. Geotech. Test. J. 2021, 44, 912–928. [Google Scholar] [CrossRef]
  27. Monkul, M.M.; Ozden, G. Compressional behavior of clayey sand and transition fines content. Eng. Geol. 2007, 89, 195–205. [Google Scholar] [CrossRef]
  28. Tang, C.S.; Pei, X.J.; Wang, D.Y.; Shi, B.; Li, J. Tensile strength of compacted clayey soil. J. Geotech. Geoenviron. Eng. 2015, 141, 04014122. [Google Scholar] [CrossRef]
  29. Su, Y.; Cui, Y.J.; Dupla, J.C.; Canou, J. Investigation of the effect of water content on the mechanical behavior of track-bed materials under various coarse grain contents. Constr. Build. Mater. 2020, 263, 120206. [Google Scholar] [CrossRef]
  30. Jahandari, S.; Tao, Z.; Saberian, M.; Shariati, M.; Li, J.; Abolhasani, M.; Kazemi, M.; Rahmani, A.; Rashidi, M. Geotechnical properties of lime-geogrid improved clayey subgrade under various moisture conditions. Road Mater. Pavement Des. 2021, 23, 2057–2075. [Google Scholar] [CrossRef]
Figure 1. Grain size distribution curve: (a) clay soils; (b) sand grains.
Materials 18 03282 g001
Figure 2. Compaction curve of tested clay soils.
Materials 18 03282 g002
Figure 3. Stress–strain curves of clay at various remolding water content w values under two compaction degree Dc levels: (a) Dc = 0.85; (b) Dc = 0.90.
Materials 18 03282 g003
Figure 4. Variations in unconfined compression strength (UCS) and UCS changing rate with remolding water content w for clay soils under two compaction degree Dc levels: (a) Dc = 0.85; (b) Dc = 0.90.
Materials 18 03282 g004
Figure 5. Pore size distributions of clay soils with typical w values and the corresponding soil fabric: (a) aggregate–aggregate structure (w = 20%); (b) aggregate-dispersed structure (w = 28%); (c) dispersed structure (w = 35%).
Materials 18 03282 g005
Figure 6. Stress–strain curves for lime–sand-stabilized clay at various w values under two compaction degree Dc levels: (a) Dc = 0.85; (b) Dc = 0.90.
Materials 18 03282 g006
Figure 7. Variations in unconfined compression strength (UCS) and UCS changing rate with w for lime–sand-stabilized clay at two compaction degree Dc levels: (a) Dc = 0.85; (b) Dc = 0.90.
Materials 18 03282 g007
Figure 8. Pore size distributions of lime-stabilized clay at Dc = 0.85 under two remolding water content w levels.
Materials 18 03282 g008
Figure 9. μCT scanning results in as-compacted sample: (a) cross-section view; (b) vertical section view; (c) three-dimensional view of sand grain distribution.
Materials 18 03282 g009
Figure 10. Comparison of stress–strain curve between clay and lime–sand-stabilized clay at various w values: (a) w = 14%; (b) w = 16%; (c) w = 20%; (d) w = 25%; (e) w = 28%; (f) w = 30%; (g) w = 35%.
Materials 18 03282 g010
Figure 11. Comparison of pore size distribution between clay and lime-stabilized clay at compaction degree Dc = 0.85 under two remolding water content w levels: (a) w = 20%; (b) w = 35%.
Materials 18 03282 g011
Figure 12. Comparison of UCS-w relationship between clay and lime–sand-stabilized clay at two compaction degree Dc levels: (a) Dc = 0.85; (b) Dc = 0.90.
Materials 18 03282 g012
Figure 13. Comparison of testing data between current study and previous studies [29,30].
Materials 18 03282 g013
Table 1. Chemical composition of clay and lime.
Chemical CompositionQuicklimeClay
CaO>97.3%None
SiO2None47%
Al2O3None38%
Table 2. Soil properties.
Soil TypeIndex PropertyValue
Clay soilsSpecific gravity, Gs2.60
Clay content (<2 μm)85%
Liquid limit, wL63%
Plastic limit, wP37%
Plasticity index, Ip26%
USCS classificationCH
Optimum water content, wopt28%
Maximum dry density, ρdmax1.50
SandMean grain size4.95 mm
Coefficient of uniformity, Cu1.72
Water absorption0.3%
Specific gravity, Gs2.66
Plasticity index, IpNon-plastic
Disclaimer/Publisher’s Note: The statements, opinions and data contained in all publications are solely those of the individual author(s) and contributor(s) and not of MDPI and/or the editor(s). MDPI and/or the editor(s) disclaim responsibility for any injury to people or property resulting from any ideas, methods, instructions or products referred to in the content.