
Time-Domain Impedance Analysis on Passivation Quality of 316L Stainless Steel with Portable-Probe-Measured Potential Step Transient

Abstract
1. Introduction
2. Materials and Methods
2.1. Testing Method
2.2. Experimental Materials and Methods
3. Results and Discussion
4. Conclusions
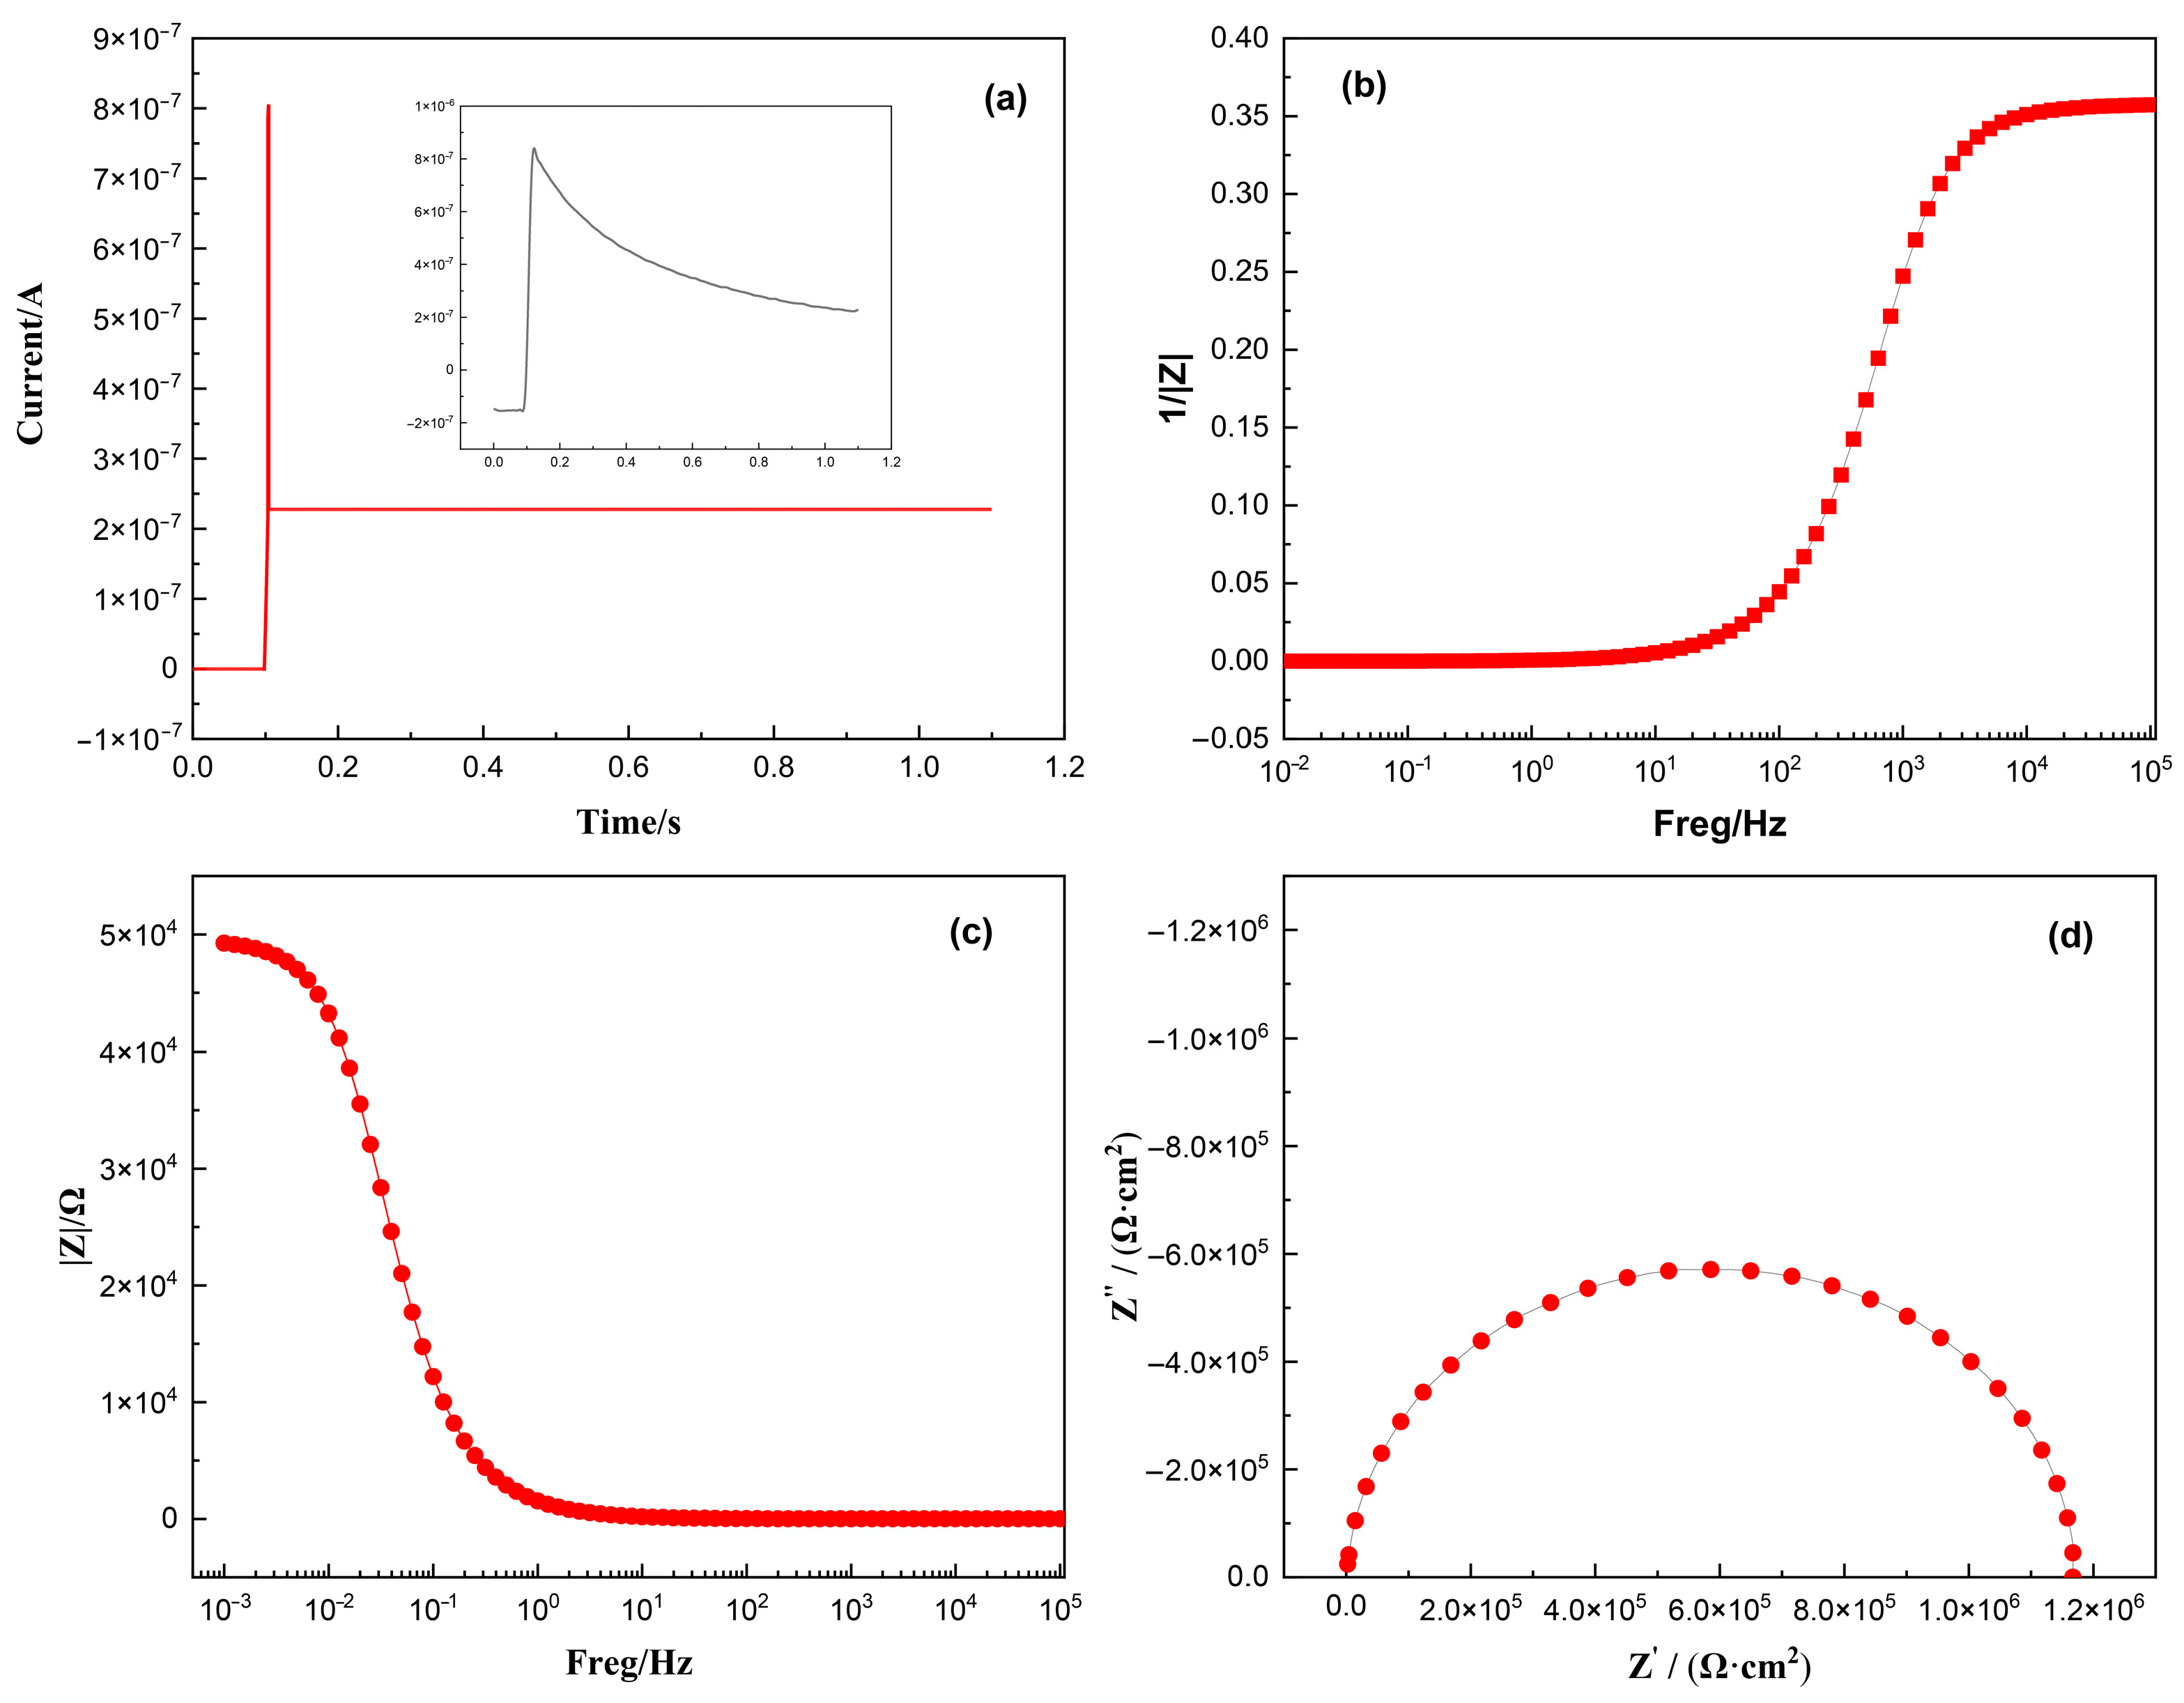
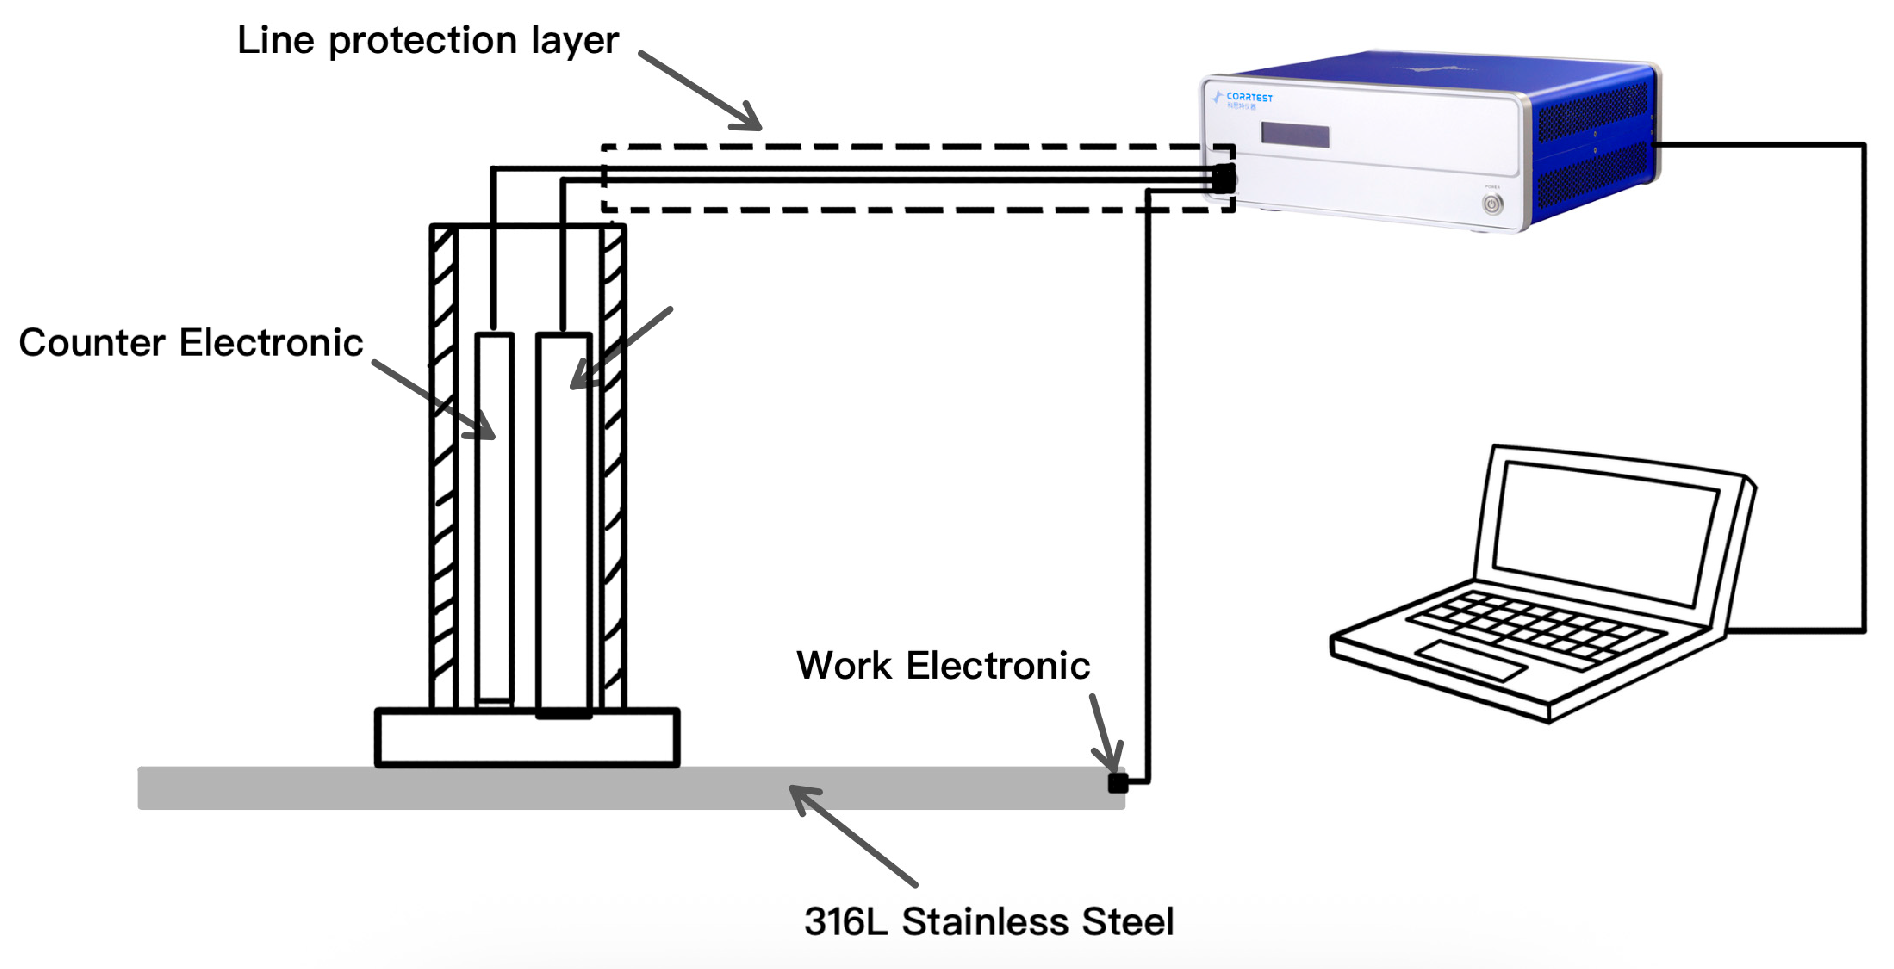
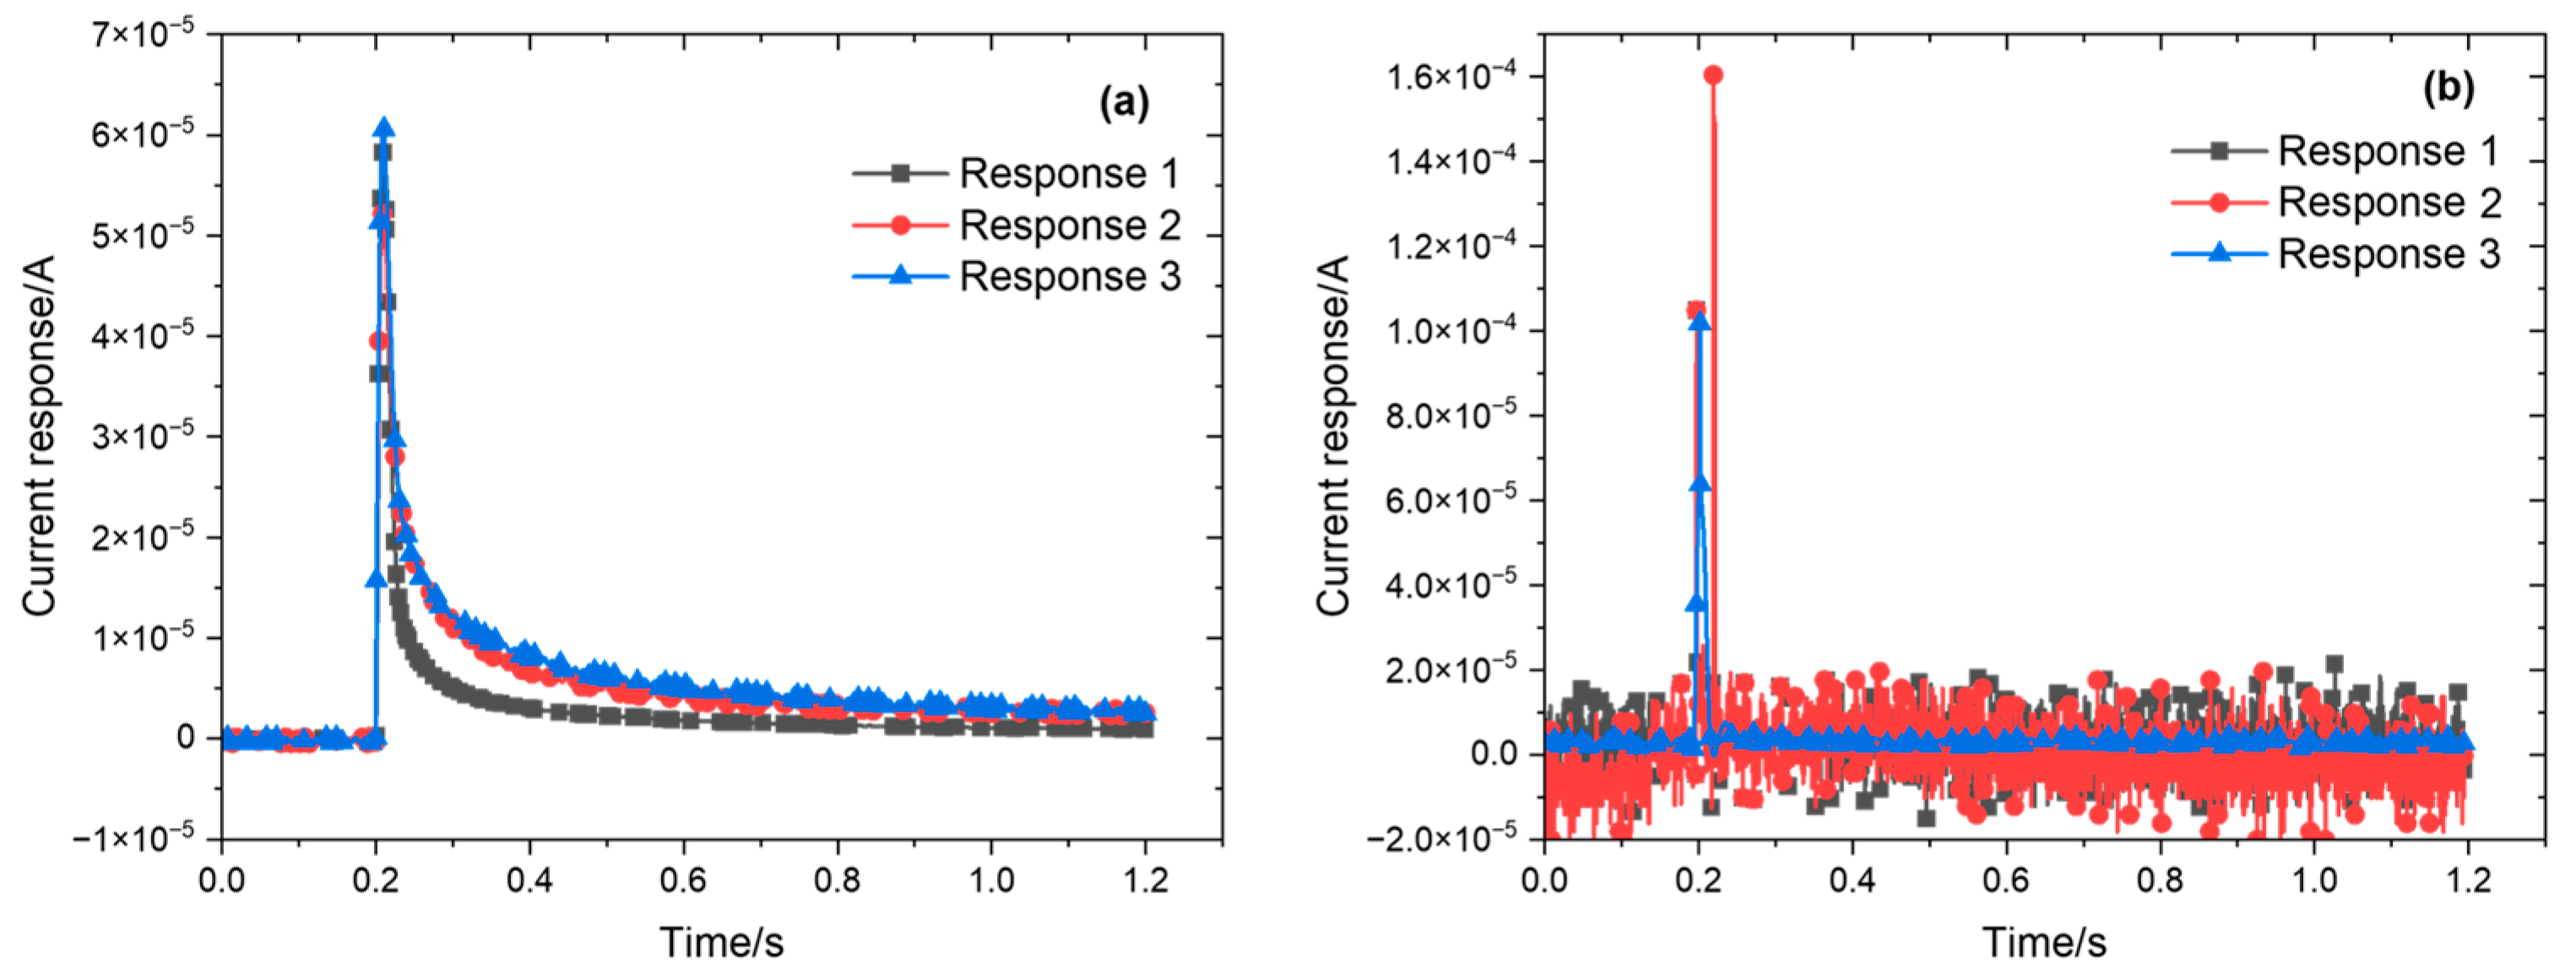
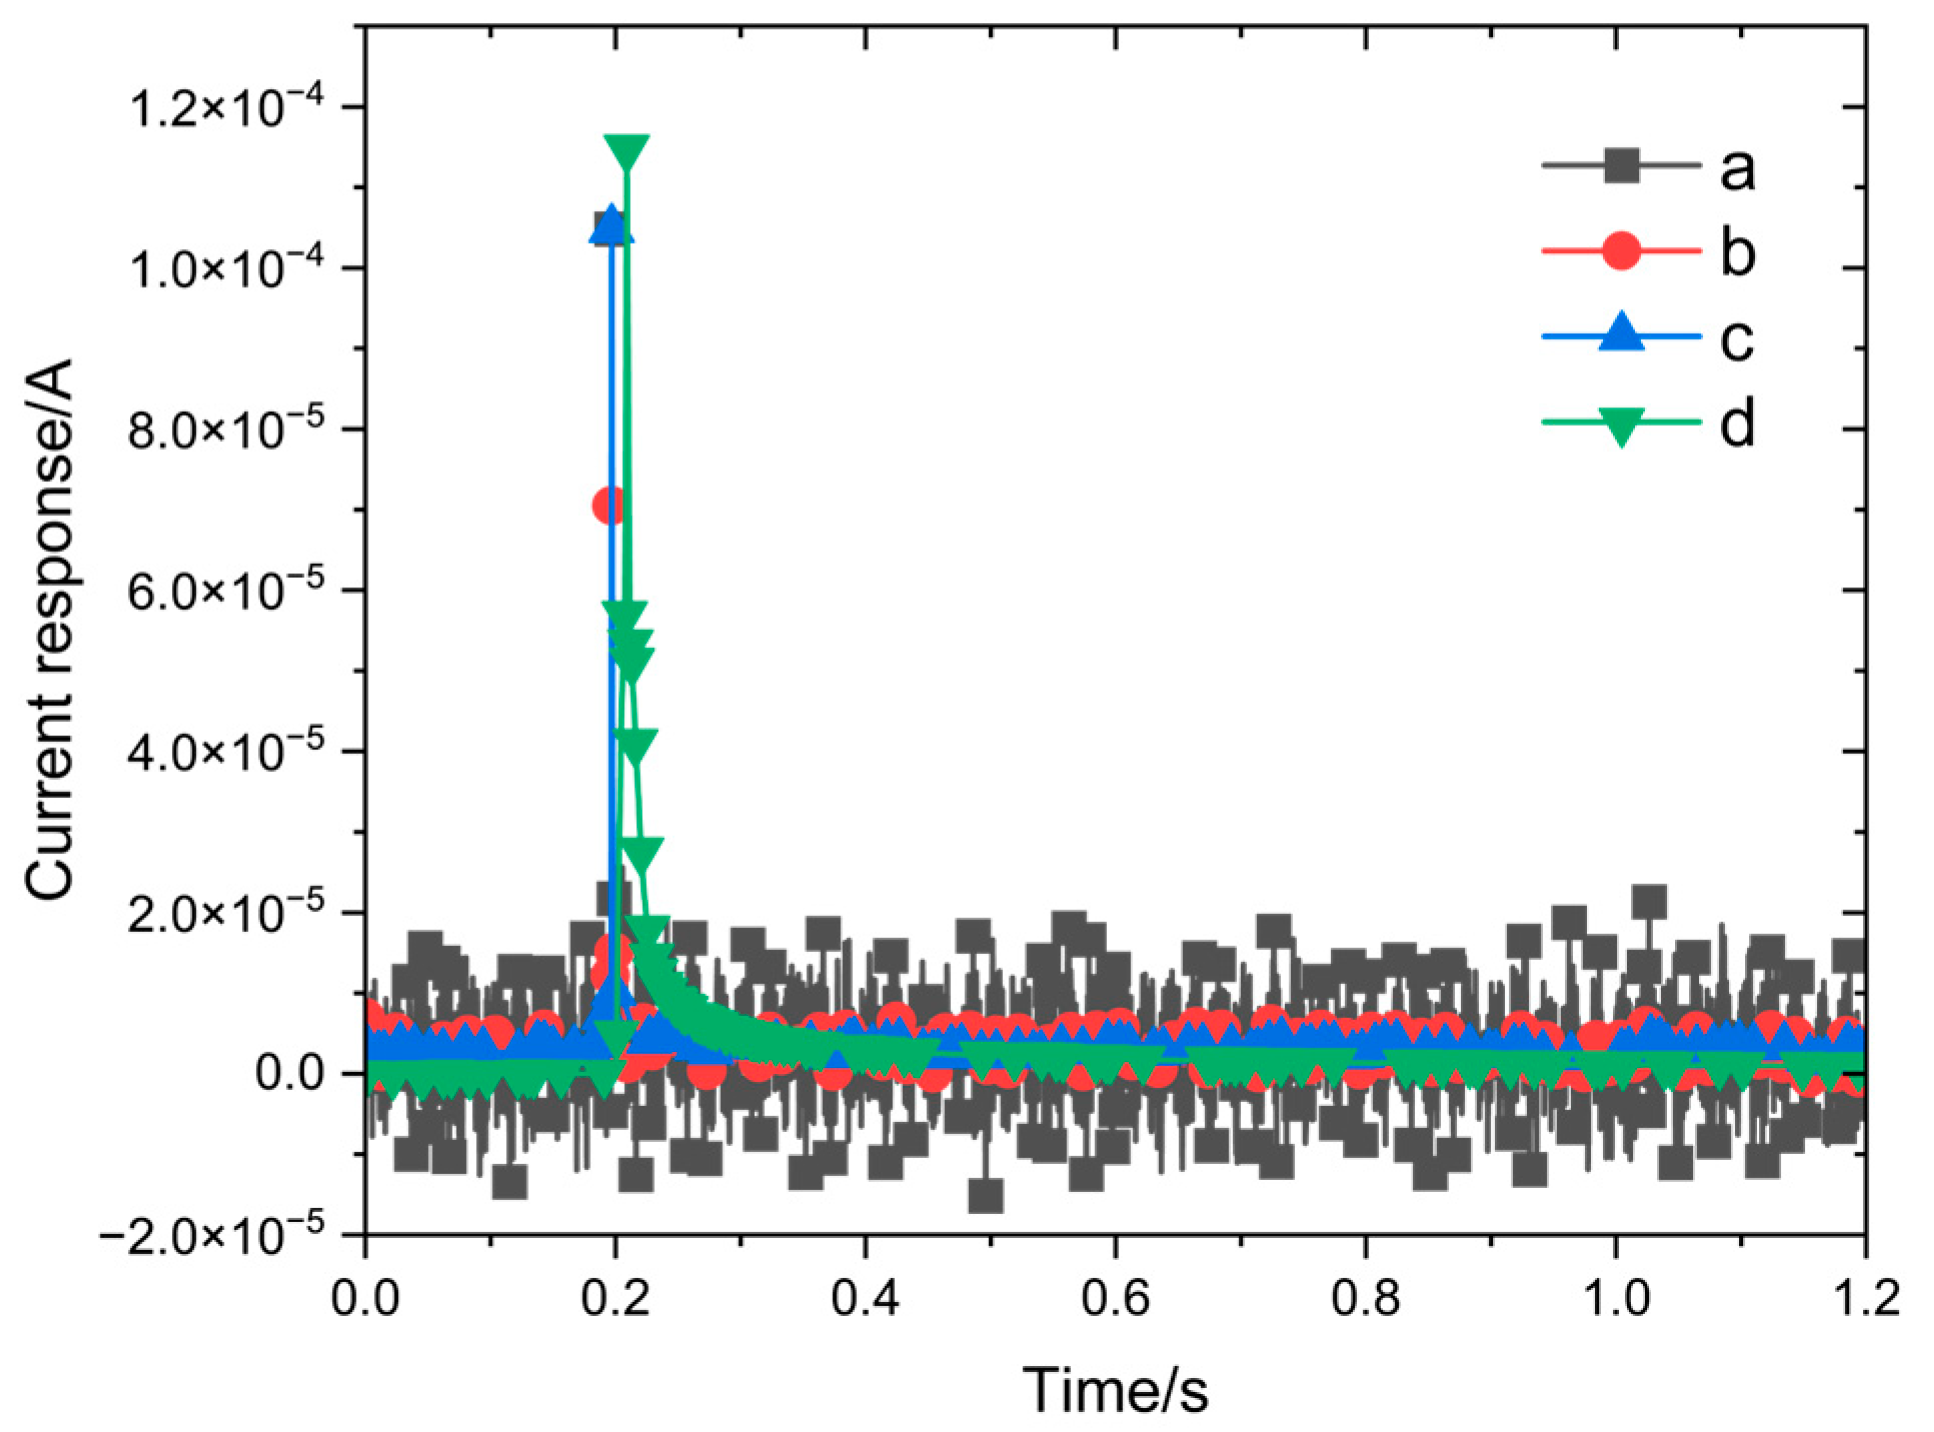
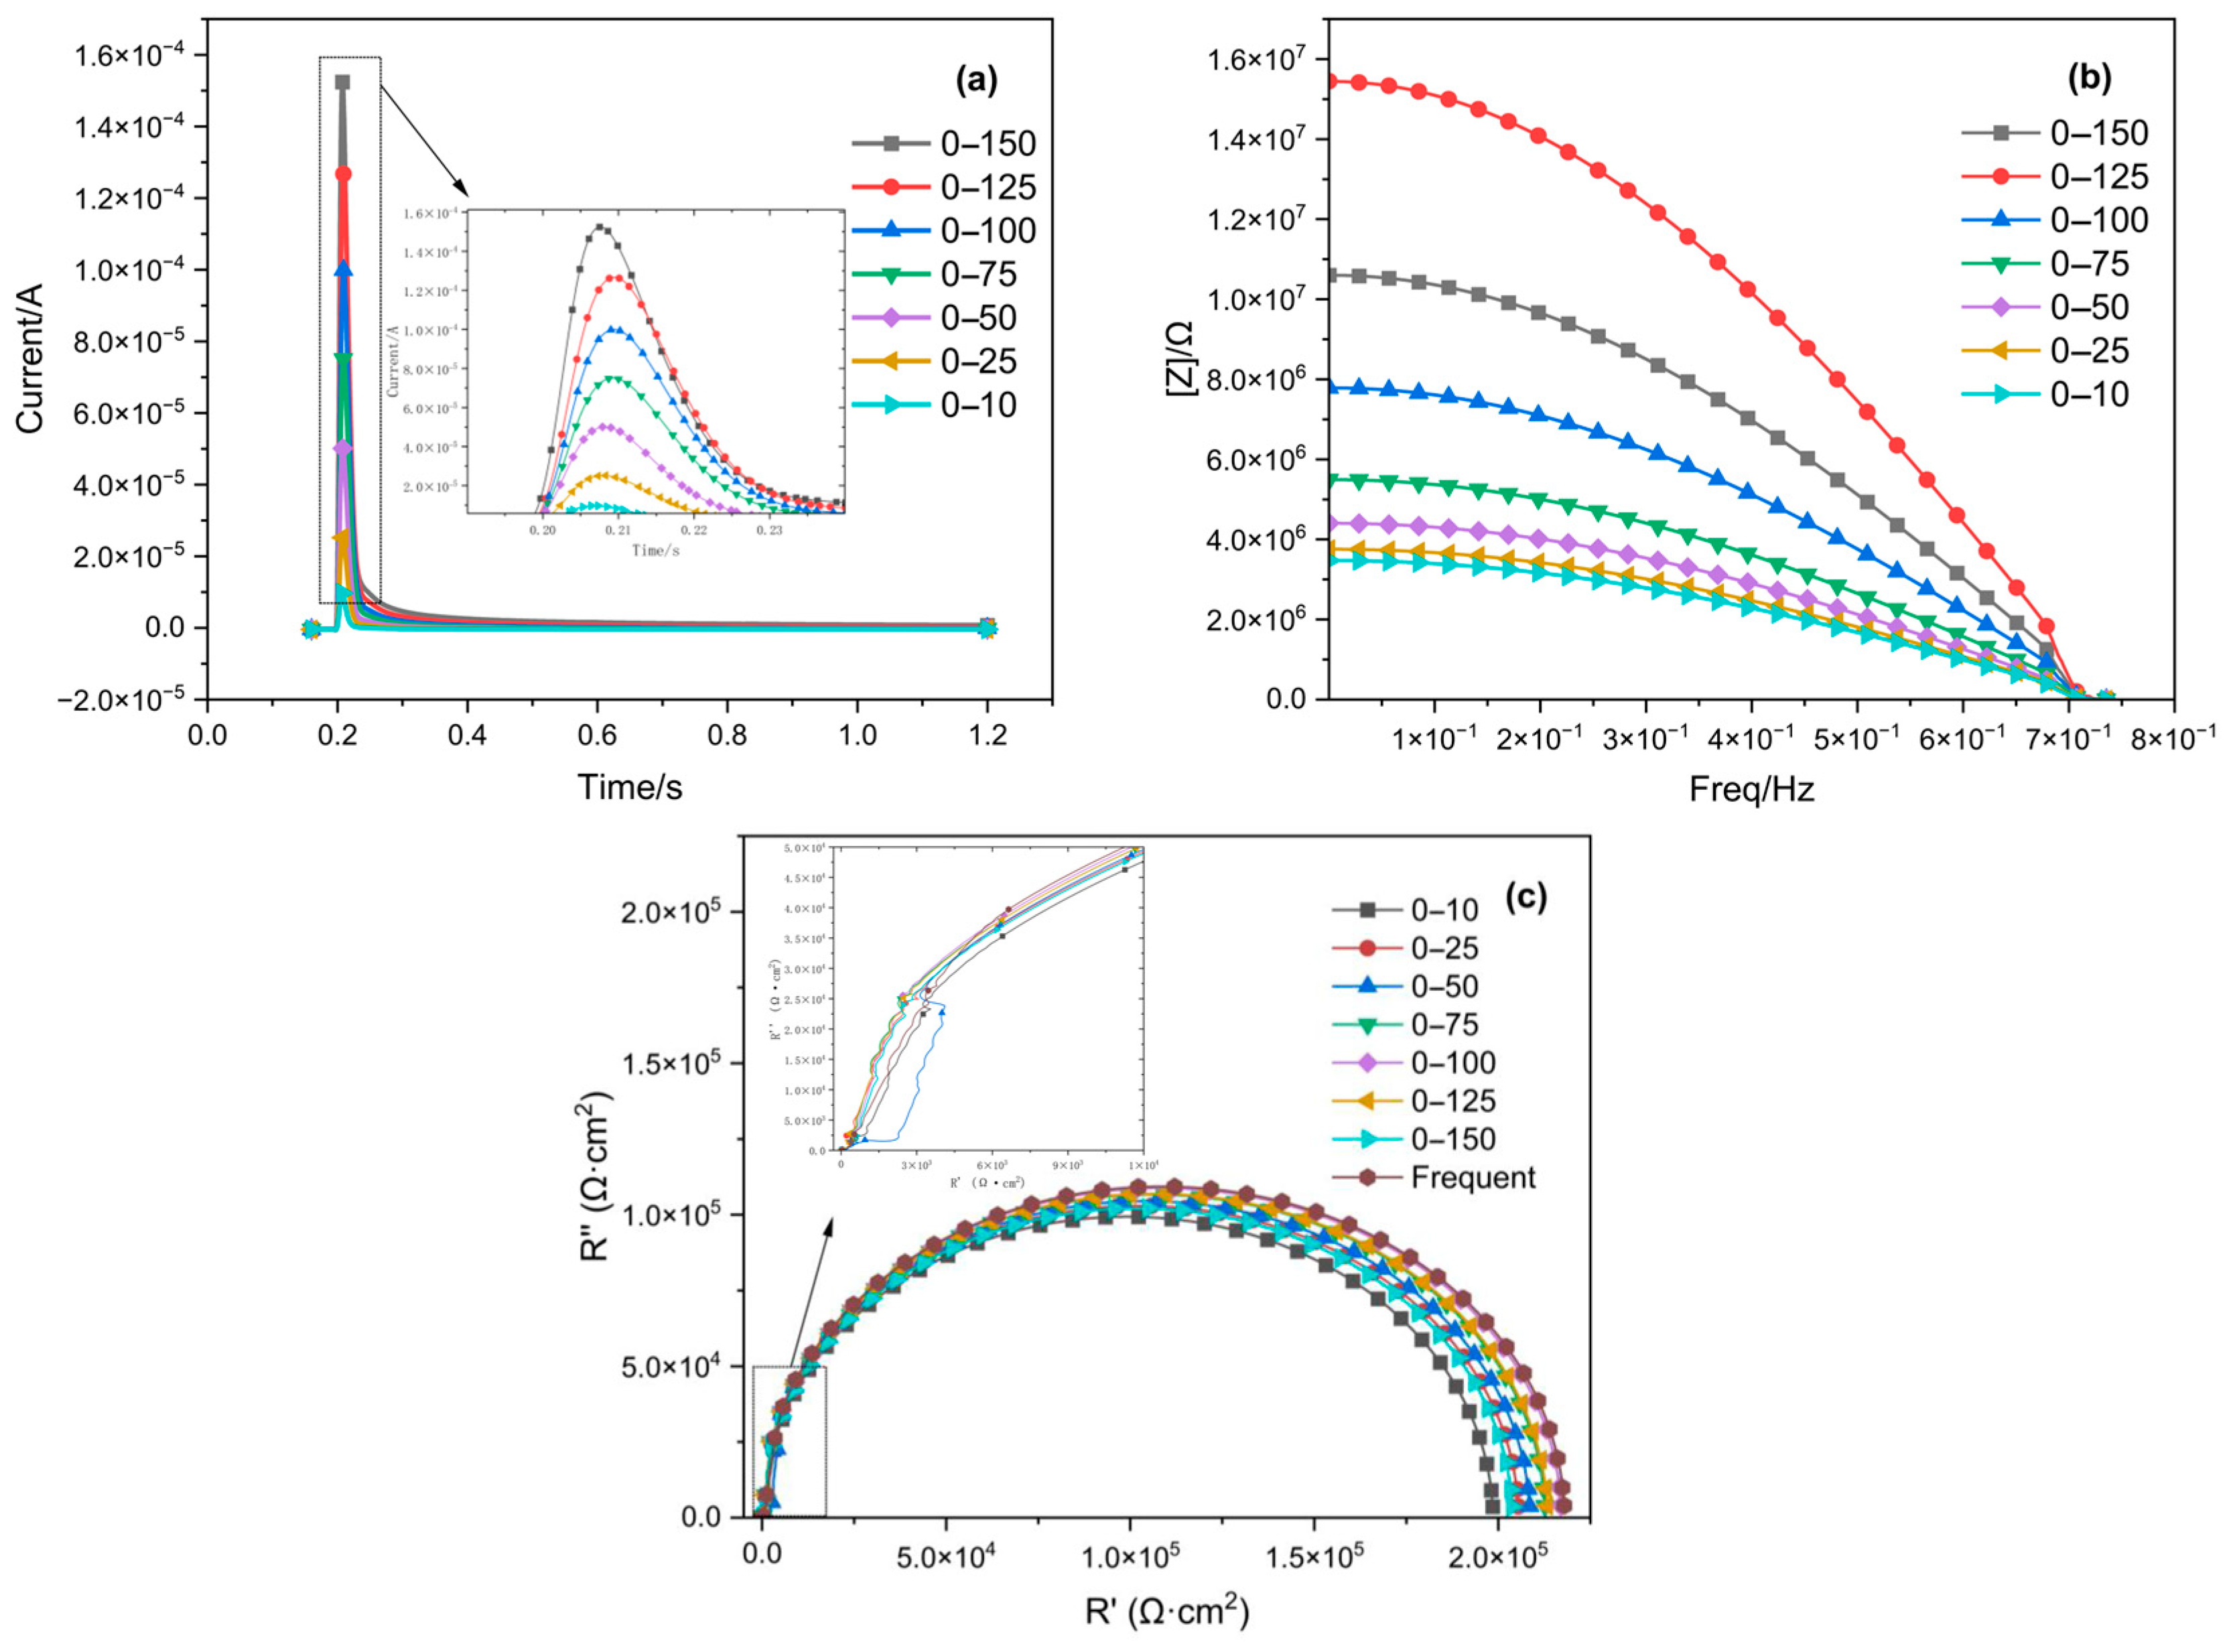
- Compared to the traditional three-electrode system in bulk solution, the three-electrode probe system features a more integrated design, a more stable testing architecture, and fewer influencing factors. It requires a smaller volume of electrolyte, reducing external interference with the measurement results, thereby significantly improving the signal-to-noise ratio of the current response. When the potential step amplitude was maintained within a range of 0–100 mV, the deviation between time-domain and frequency-domain impedance measurements was minimized, ensuring greater measurement accuracy. Pitting corrosion will initiate when the potential step amplitude surpasses 100 mV.
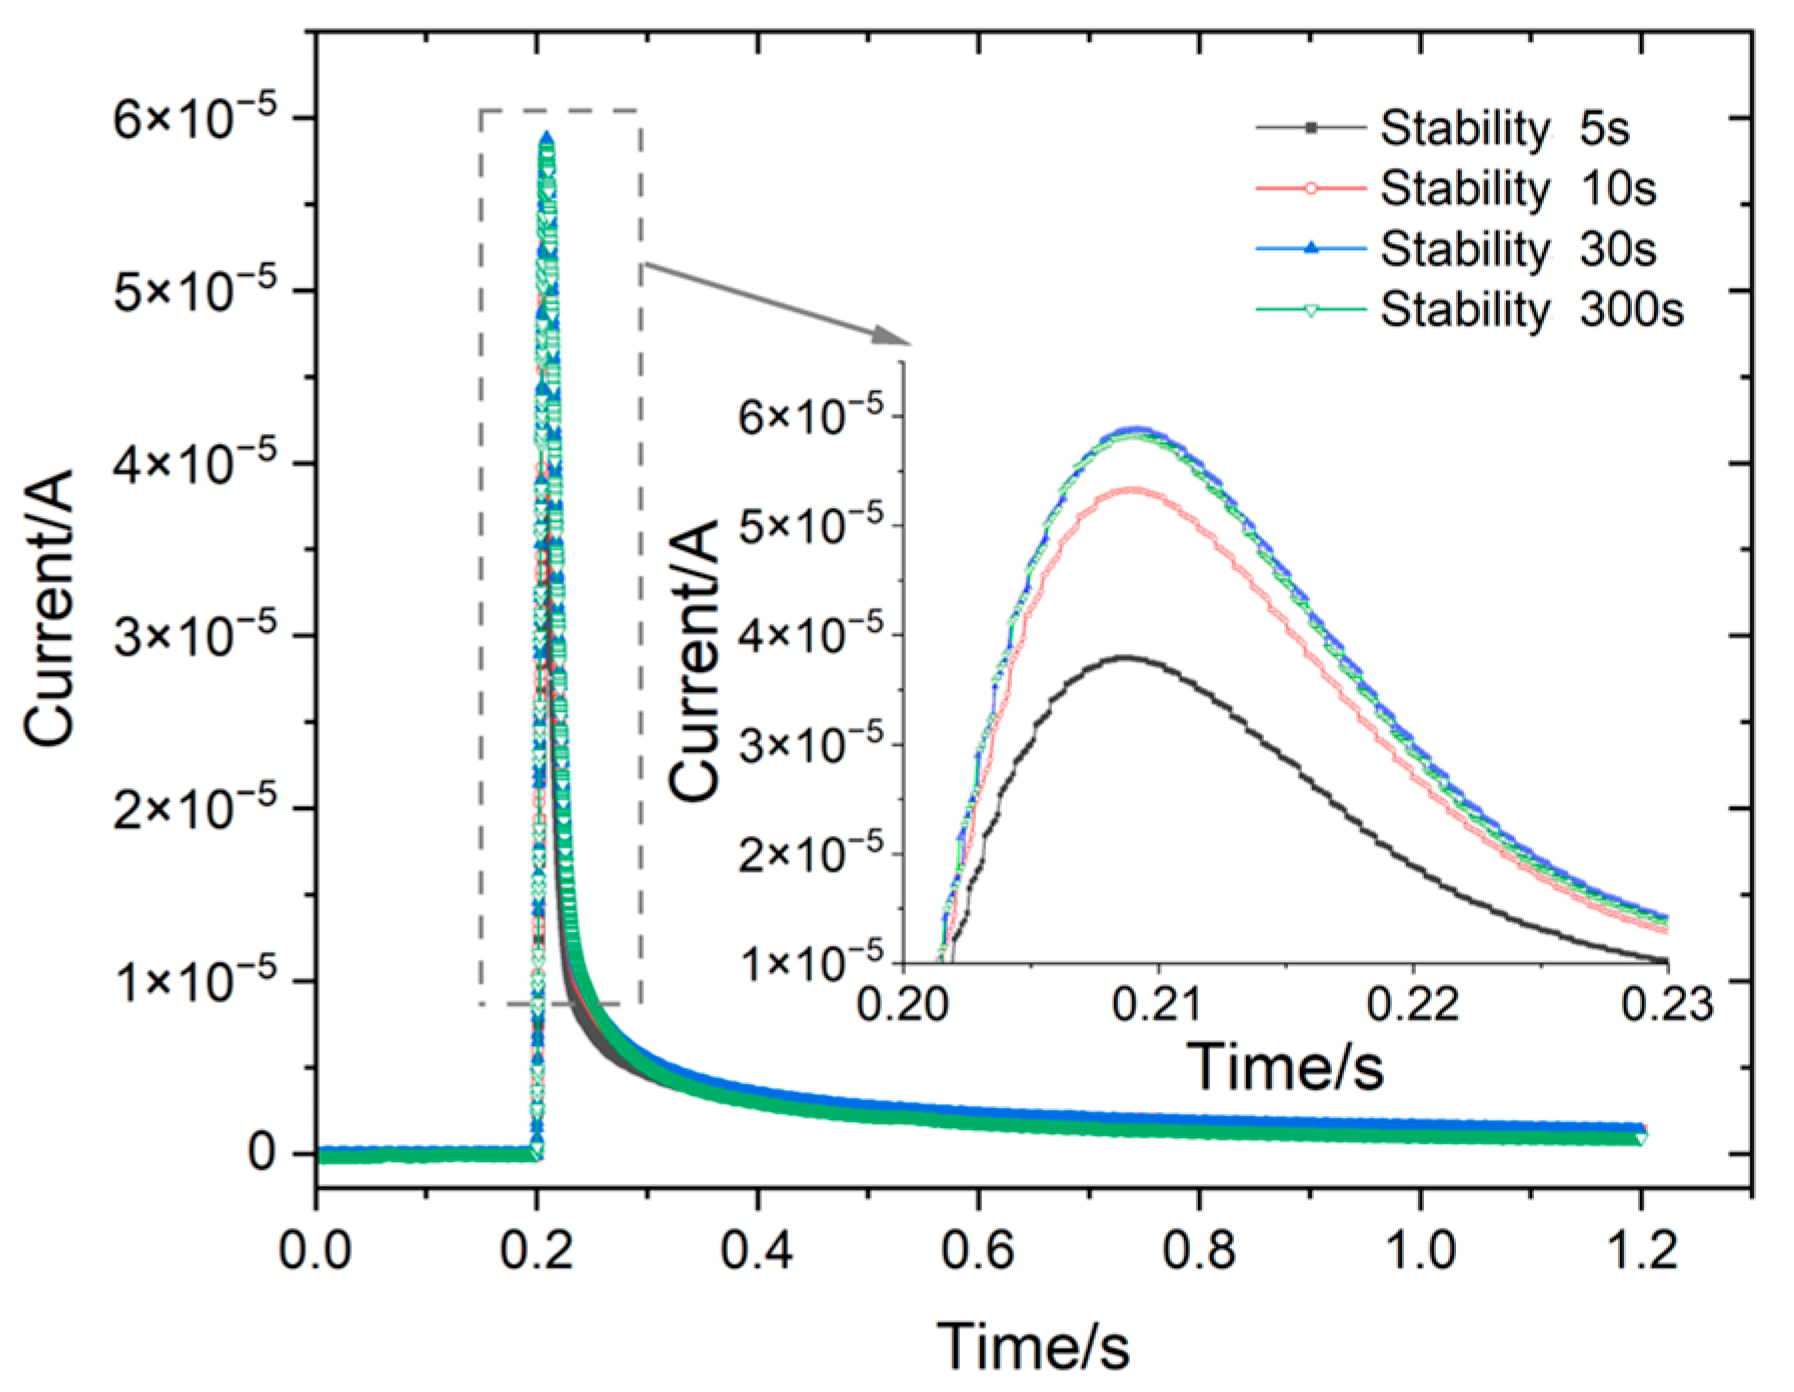
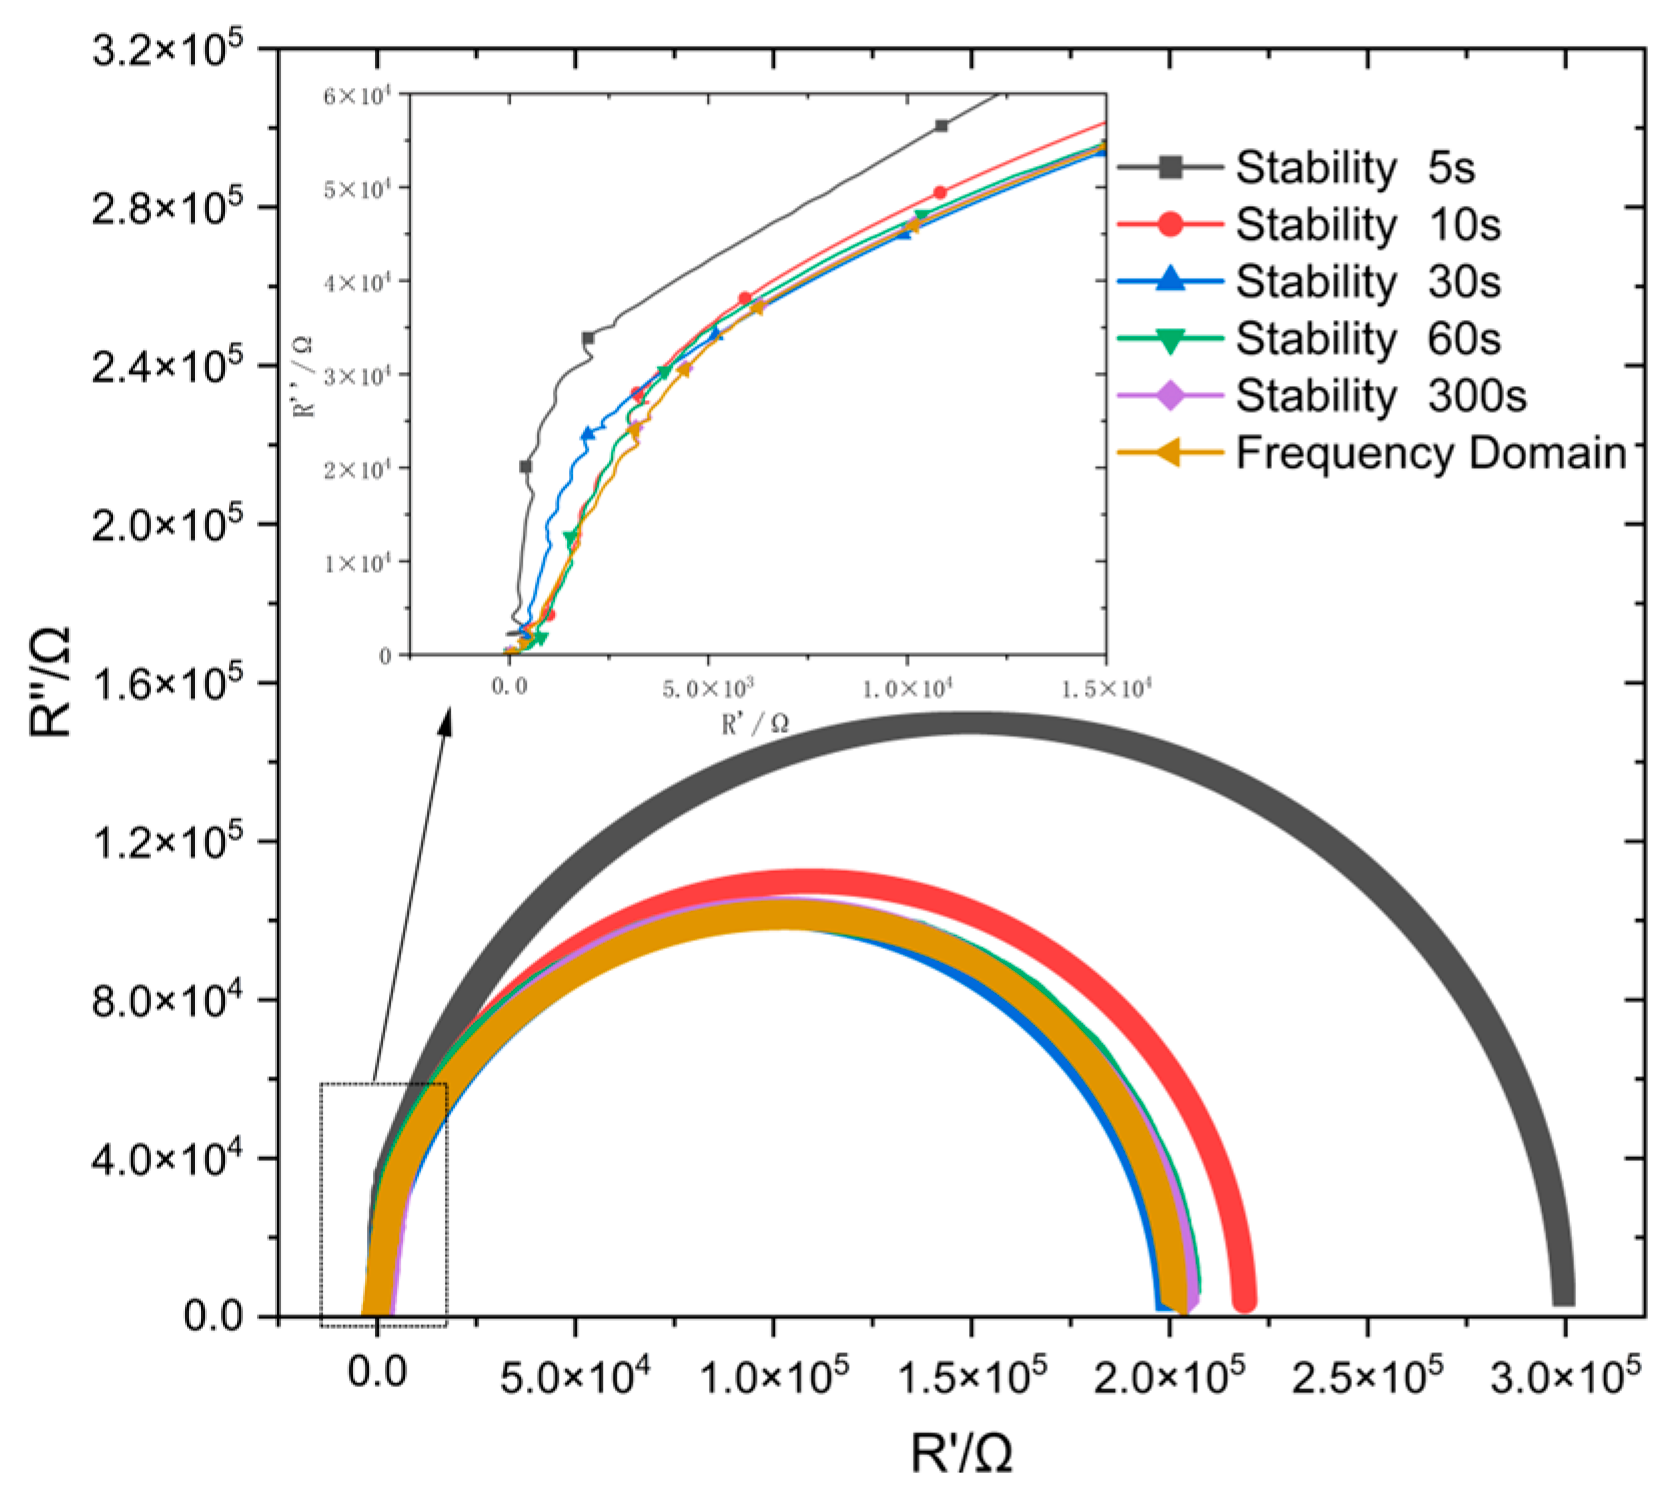
- The influence of stabilization time on the impedance value in the three-electrode probe test system was studied. Notably, a high similarity was observed between the time-domain impedance spectrum fitted from the measured response and the frequency-domain impedance spectrum when the stabilization time exceeded 30 s. This demonstrates that the time-domain impedance spectra can accurately measure the charge transfer impedance of passivated film, and the variation range of charge transfer impedance is small. With the extension of the stabilization time, the stability of the three-electrode probe system was further improved, and the measured time-domain impedance was closer to the frequency-domain impedance.
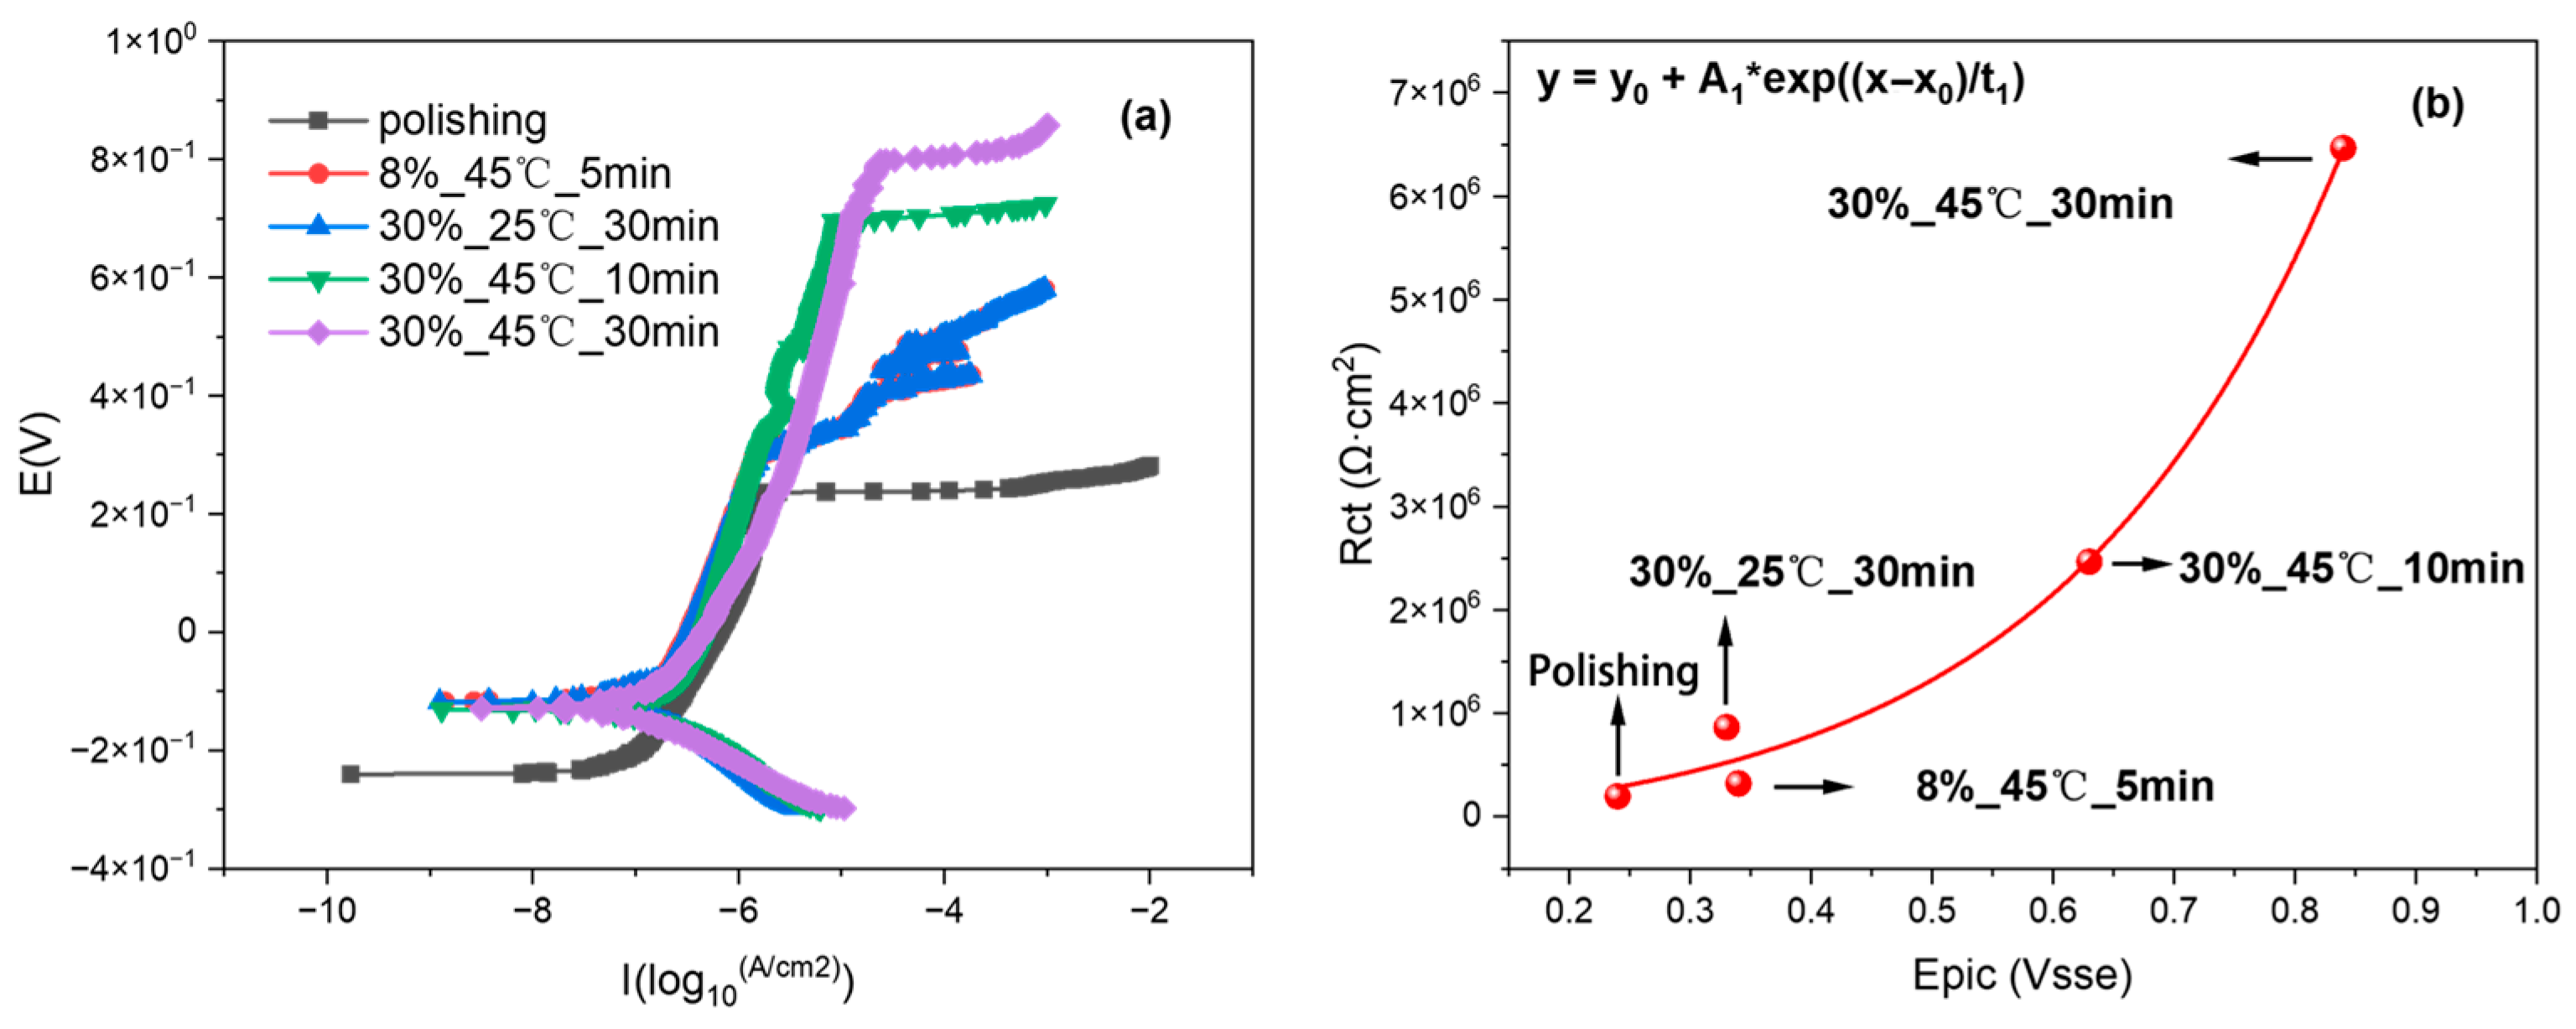
- The influence of different surface qualities on the impedance value in the three-electrode probe test system was investigated. Under optimized test conditions of potential step (0–100 mV), measurement time (1 s), frequency (10 kHz), and stabilization time (≥30 s), the three-electrode probe system can effectively measure the impedance value and distinguish the different surface passivation qualities. Simultaneously, a clear positive correlation was observed between charge-transfer resistance and pitting potential, confirming that higher resistance values indicate improved corrosion resistance.
Author Contributions
Funding
Institutional Review Board Statement
Informed Consent Statement
Data Availability Statement
Conflicts of Interest
References
- Liang, S.; Wang, X.X.; Chen, Y.H.; Ni, H.J.; Zhu, Y. Research status and application of 304/Q235 stainless steel clad plate. J. Phys. Conf. Ser. 2024, 2819, 012005. [Google Scholar] [CrossRef]
- Song, Z.G.; Feng, H.; Hu, S.M. Development of Chinese duplex stainless steel in recent years. J. Iron Steel Res. Int. 2017, 24, 121–130. [Google Scholar] [CrossRef]
- Zheng, Z.J.; Sun, B.; Mao, L.Y. Effect of scanning strategy on the manufacturing quality and performance of printed 316L stainless steel using SLM process. Materials 2024, 17, 1189. [Google Scholar] [CrossRef] [PubMed]
- Olsson, C.-O.; Landolt, D. Passive films on stainless steels-chemistry, structure and growth. Electrochim. Acta 2003, 48, 1093–1104. [Google Scholar] [CrossRef]
- Kityk, A.A.; Pavlik, V.; Boča, M.; Pangallo, D.; Kapustova, M.; Halahovets, Y. Electrochemical surface treatment to enhance corrosion resistance and bioresistance of medical-grade stainless steels. J. Mater. Eng. Perform. 2020, 29, 5985–5994. [Google Scholar] [CrossRef]
- Shahryari, A.; Omanovic, S. Improvement of pitting corrosion resistance of a biomedical grade 316LVM stainless steel by electrochemical modification of the passive film semiconducting properties. Electrochem. Commun. 2007, 9, 76–82. [Google Scholar] [CrossRef]
- Weirich, T.D.; Srinivasan, J.; Taylor, J.M.; Melia, M.A.; Noe, P.J.; Bryan, C.R.; Frankel, G.S.; Locke, J.S.; Schindelholz, E.J. Humidity effects on pitting of ground stainless steel exposed to sea salt particles. J. Electrochem. Soc. 2019, 166, C3477–C3487. [Google Scholar] [CrossRef]
- Liu, B.J.; Cheng, C.Q.; Cao, T.S.; Yang, S.K.; Meng, X.M.; Zhao, J. Color rendering study of effect of heterogeneous pollution on weld structure and corrosion resistance of 316L stainless steel. Surf. Technol. 2021, 50, 347–356. [Google Scholar]
- GB/T 25150-2010; Test Method for Passive Film Quality of Austenitic Stainless Steel in Chemical Cleaning of Industrial Equipment-Blue Dot Method. Standards Press of China: Beijing, China, 2010.
- Cheng, C.Q.; Cao, T.S.; Song, G.Y.; Zhao, J.; Deng, D.W. Use of change indicators to quantify iron contamination on stainless steel. Corros. Eng. Sci. Technol. 2015, 50, 346–354. [Google Scholar] [CrossRef]
- Cheng, C.Q.; Yang, S.K.; Zhao, J. Use of color-change indicators to quantify passive films on the stainless steel valves of nuclear power plants. Nucl. Eng. Des. 2016, 297, 267–275. [Google Scholar] [CrossRef]
- DIN EN 62660-1-2012; Secondary Lithium-Ion Batteries for Electric Road Vehicle Propulsion-Part 1: Performance Testing (IEC 62660-1-2010). German version EN 62660-1-2011. International Electrotechnical Commission (IEC): Geneva, Switzerland, 2012.
- Arai, J.; Yamaki, T.; Yamauchi, S.; Yuasa, T.; Maeshima, T.; Sakai, T.; Koseki, M.; Horiba, T. Development of a high power lithium secondary battery for hybrid electric vehicles. J. Power Sources 2005, 146, 788–792. [Google Scholar] [CrossRef]
- Chen, H.L. Impedance Analysis Method Based on Potential Step and Research on Fourier Transform Large Amplitude Square Wave Voltammetry; South China University of Technology: Guangzhou, China, 2010. [Google Scholar]
- Martínez-Ibernón, A.; Ramón, J.E.; Gandía-Romero, I.; Gasch, I.; Valcuende, M.; Alcañiz, M.; Soto, J. Characterization of electrochemical systems using potential step voltammetry. Part II: Modeling of reversible systems. Chem. Chem. 2019, 328, 135111. [Google Scholar] [CrossRef]
- Liu, W.; Wang, D.; Chen, X.; Wang, C.; Liu, H. Electrochemical noise monitoring of Sulphur corrosion for nickel alloy 718. Corros. Eng. Sci. Technol. 2016, 51, 545–549. [Google Scholar] [CrossRef]
- Xia, D.-H.; Song, S.; Behnamian, Y.; Hu, W.; Cheng, Y.F.; Luo, J.-L.; Huet, F. Review-electrochemical noise applied in corrosion science: Theoretical and mathematical models towards quantitative analysis. J. Electrochem. Soc. 2020, 167, 081507. [Google Scholar] [CrossRef]
- Guo, J.G.; Chen, H.; Li, J.R.; Tang, Z.L.; Chen, Q.M. Study on corrosion resistance characteristics of 316L stainless steel bipolar plate element enrichment. Mater. Rep. 2021, 35, 391–394. [Google Scholar]
- Komary, M.; Komarizadehasl, S.; Tošić, N.; Segura, I.; Lozano-Galant, J.A.; Turmo, J. Low-cost technologies used in corrosion monitoring. Sensors 2023, 23, 1309. [Google Scholar] [CrossRef]
- Padha, B.; Verma, S.; Mahajan, P.; Arya, S. Electrochemical impedance spectroscopy (EIS) performance analysis and challenges in fuel cell applications. J. Electrochem. Sci. Technol. 2022, 13, 167–176. [Google Scholar] [CrossRef]
- Zhang, M.; Liu, Y.S.; Li, D.Z.; Cui, X.L.; Wang, L.C.; Li, L.W.; Wang, K. Electrochemical impedance spectroscopy: A new chapter in the fast and accurate estimation of the state of health for lithium-ion batteries. Energies 2023, 16, 1599. [Google Scholar] [CrossRef]
- Leo, W.; Philipp, G.; Alexander, K. Combining the Distribution of Relaxation Times from EIS and Time-Domain Data for Parameterizing Equivalent Circuit Models of Lithium-Ion Batteries. Batteries 2021, 7, 52. [Google Scholar]
- Song, L.; Liu, J.L.; Liu, R.; Sun, H.S.; Yu, Z.W. Unification and calibration of steel corrosion models based on long-term natural corrosion. Constr. Build. Mater. 2024, 411, 134611. [Google Scholar] [CrossRef]
- PetroChina Company Limited. A Three-Electrode Potential Difference Detection Method for Internal Coating of Downhole Oil Casing. 201510621495.4. 2 February 2018. [Google Scholar]
- Gualdrón, A.G.; Ortiz, M.R.; Mejía, R.V. Use of polynomial approximation in the electrochemical frequency modulation technique for determination of corrosion rates in activation-controlled systems. Corrosion 2022, 78, 1250–1262. [Google Scholar] [CrossRef] [PubMed]
- Wu, L.; Lv, T.L.; Chen, Q.Z. Overview of electrochemical impedance spectroscopy measurement and application research. Power Supply Technol. 2021, 45, 1227–1230. [Google Scholar]
- Jamil, D.M.; Aljibori, H.S.; Alamiery, A. Electrochemical analysis of 5-Nitro-2-furaldehyde semicarbazone as a mild steel corrosion inhibitor in corrosive solution: An EIS, adsorption and SEM study. Results Chem. 2025, 15, 15102193. [Google Scholar] [CrossRef]
- Dalian University of Technology. A Time Domain Impedance Method for Rapid Detection of Passivation Quality of Stainless Steel and Its Portable Three Electrode Probe. 202311527147.1. 20 February 2024. [Google Scholar]
- Altynbekov, A.A.; Borisov, A.V.; Skiba, V.E.; Kistenev, Y.V. The possibility of increasing the efficiency of terahertz absorption spectra noise reduction using a sliding window variant of Savitzky-Golay filter. Proc. SPIE 2023, 1292013. [Google Scholar]
- Ochieng, P.J.; Maróti, Z.; Dombi, J.; Krész, M.; Békési, J.; Kalmár, T. Adaptive Savitzky-Golay filters for analysis of copy number variation peaks from whole-exome sequencing data. Information 2023, 14, 128. [Google Scholar] [CrossRef]
- Yang, X.T.; Zou, A.K.; Cao, J.D.; Lai, Y.Z.; Zhang, J.L. Systemic risk prediction based on Savitzky-Golay smoothing and temporal convolutional networks. Electron. Res. Arch. 2023, 31, 2667–2688. [Google Scholar] [CrossRef]
- ASTM A380/A380M-17; Standard Practice for Cleaning, Descaling, and Passivation of Stainless Steel Parts, Equipment, and Systems. ASTM International: West Conshohocken, PA, USA, 2017.
- Makuch, M.; Kovacevic, S.; Wenman, R.M.; Martínez-Pañeda, E. A nonlinear phase-field model of corrosion with charging kinetics of electric double layer. Model. Simul. Mater. Sci. Eng. 2024, 32, 075012. [Google Scholar] [CrossRef]
- Aoki, K.J.; Chen, J.; He, R. Potential step for double-layer capacitances obeying the power law. ACS Omega 2020, 5, 7497–7502. [Google Scholar] [CrossRef]


| Three-electrode Probe Measurement | Bulk Solution | ||||
|---|---|---|---|---|---|
| Test Methods | Impedance (Ω·cm2) | Deviation | Test Methods | Impedance (Ω cm2) | Error |
| Frequency-domain impedance | 2.19 × 10⁵ | / | Frequency-domain impedance | 2.01 × 10⁵ | / |
| 10 mV | 1.99 × 10⁵ | 9.1% | 10 mV | 1.00 × 10⁵ | 50.1% |
| 25 mV | 2.05 × 10⁵ | 6.1% | 20 mV | 1.44 × 10⁵ | 28.3% |
| 50 mV | 2.08 × 10⁵ | 4.8% | 30 mV | 1.59 × 10⁵ | 21.0% |
| 75 mV | 2.13 × 10⁵ | 2.8% | 40 mV | 1.71 × 10⁵ | 15.1% |
| 100 mV | 2.17 × 10⁵ | 0.8% | 50 mV | 1.94 × 10⁵ | 3.6% |
| 125 mV | 2.13 × 10⁵ | 2.5% | 100 mV | 2.04 × 10⁵ | 1.2% |
| 150 mV | 2.04 × 10⁵ | 6.6% | 150 mV | 2.06 × 10⁵ | 2.2% |
| Test Methods | Impedance (Ω·cm2) | Deviation |
|---|---|---|
| Frequency-domain impedance | 2.02 × 10⁵ | / |
| Stability 5 s | 3.00 × 10⁵ | 48.2% |
| Stability 10 s | 2.19 × 10⁵ | 8.3% |
| Stability 30 s | 2.00 × 10⁵ | 0.9% |
| Stability 60 s | 2.04 × 10⁵ | 1.0% |
| Stability 300 s | 2.04 × 10⁵ | 0.7% |
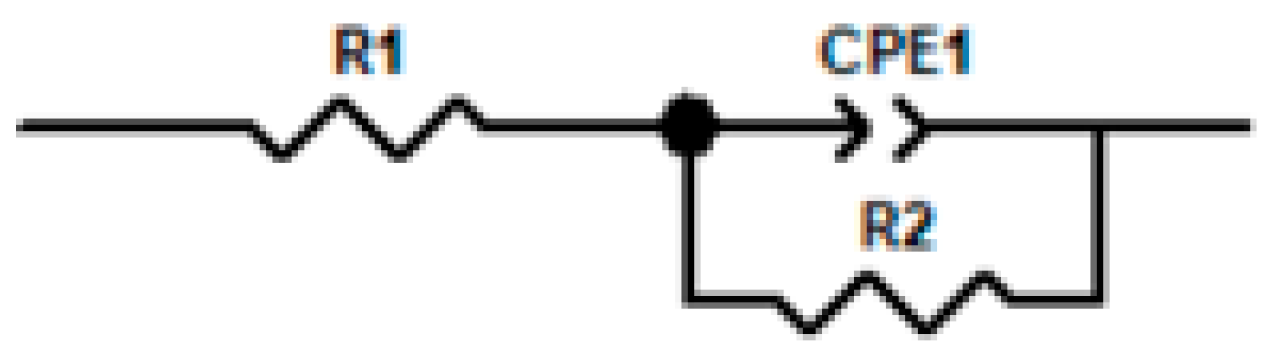
| Sample Treatment Method | Measurement Method | R1 (Ω·cm2) | Q (μF cm−2sα−1) | α | R2 (100 K Ω·cm2) |
|---|---|---|---|---|---|
| Not passed | Frequency-domain impedance method | 10.63 | 118.6 | 0.92 | 0.5 |
| Potential step method | 10.80 | 120.4 | 1.0 | 0.5 | |
| 45 °C nitric acid passivation 5 min | Frequency-domain impedance method | 11.82 | 76.3 | 0.86 | 3.2 |
| Potential step method | 11.49 | 79.6 | 0.95 | 3.2 | |
| 45 °C nitric acid passivation 10 min | Frequency-domain impedance method | 10.84 | 72.4 | 0.79 | 3.9 |
| Potential step method | 10.59 | 79.5 | 0.82 | 3.9 | |
| 45 °C nitric acid passivation 30 min | Frequency-domain impedance method | 9.35 | 27.3 | 1.04 | 14.2 |
| Potential step method | 9.47 | 25.7 | 1.06 | 14.3 |
Disclaimer/Publisher’s Note: The statements, opinions and data contained in all publications are solely those of the individual author(s) and contributor(s) and not of MDPI and/or the editor(s). MDPI and/or the editor(s) disclaim responsibility for any injury to people or property resulting from any ideas, methods, instructions or products referred to in the content. |
© 2025 by the authors. Licensee MDPI, Basel, Switzerland. This article is an open access article distributed under the terms and conditions of the Creative Commons Attribution (CC BY) license (https://creativecommons.org/licenses/by/4.0/).
Share and Cite
Li, H.; Jiang, B.; Cheng, C.; Cheng, C.; Wang, Q.; Cao, T.; Zhao, J. Time-Domain Impedance Analysis on Passivation Quality of 316L Stainless Steel with Portable-Probe-Measured Potential Step Transient. Materials 2025, 18, 3276. https://doi.org/10.3390/ma18143276
Li H, Jiang B, Cheng C, Cheng C, Wang Q, Cao T, Zhao J. Time-Domain Impedance Analysis on Passivation Quality of 316L Stainless Steel with Portable-Probe-Measured Potential Step Transient. Materials. 2025; 18(14):3276. https://doi.org/10.3390/ma18143276
Chicago/Turabian StyleLi, Haobin, Bufan Jiang, Chi Cheng, Congqian Cheng, Qibo Wang, Tieshan Cao, and Jie Zhao. 2025. "Time-Domain Impedance Analysis on Passivation Quality of 316L Stainless Steel with Portable-Probe-Measured Potential Step Transient" Materials 18, no. 14: 3276. https://doi.org/10.3390/ma18143276
APA StyleLi, H., Jiang, B., Cheng, C., Cheng, C., Wang, Q., Cao, T., & Zhao, J. (2025). Time-Domain Impedance Analysis on Passivation Quality of 316L Stainless Steel with Portable-Probe-Measured Potential Step Transient. Materials, 18(14), 3276. https://doi.org/10.3390/ma18143276