

Mechanical Characteristics of 26H2MF and St12T Steels Under Torsion at Elevated Temperatures


Abstract
1. Introduction

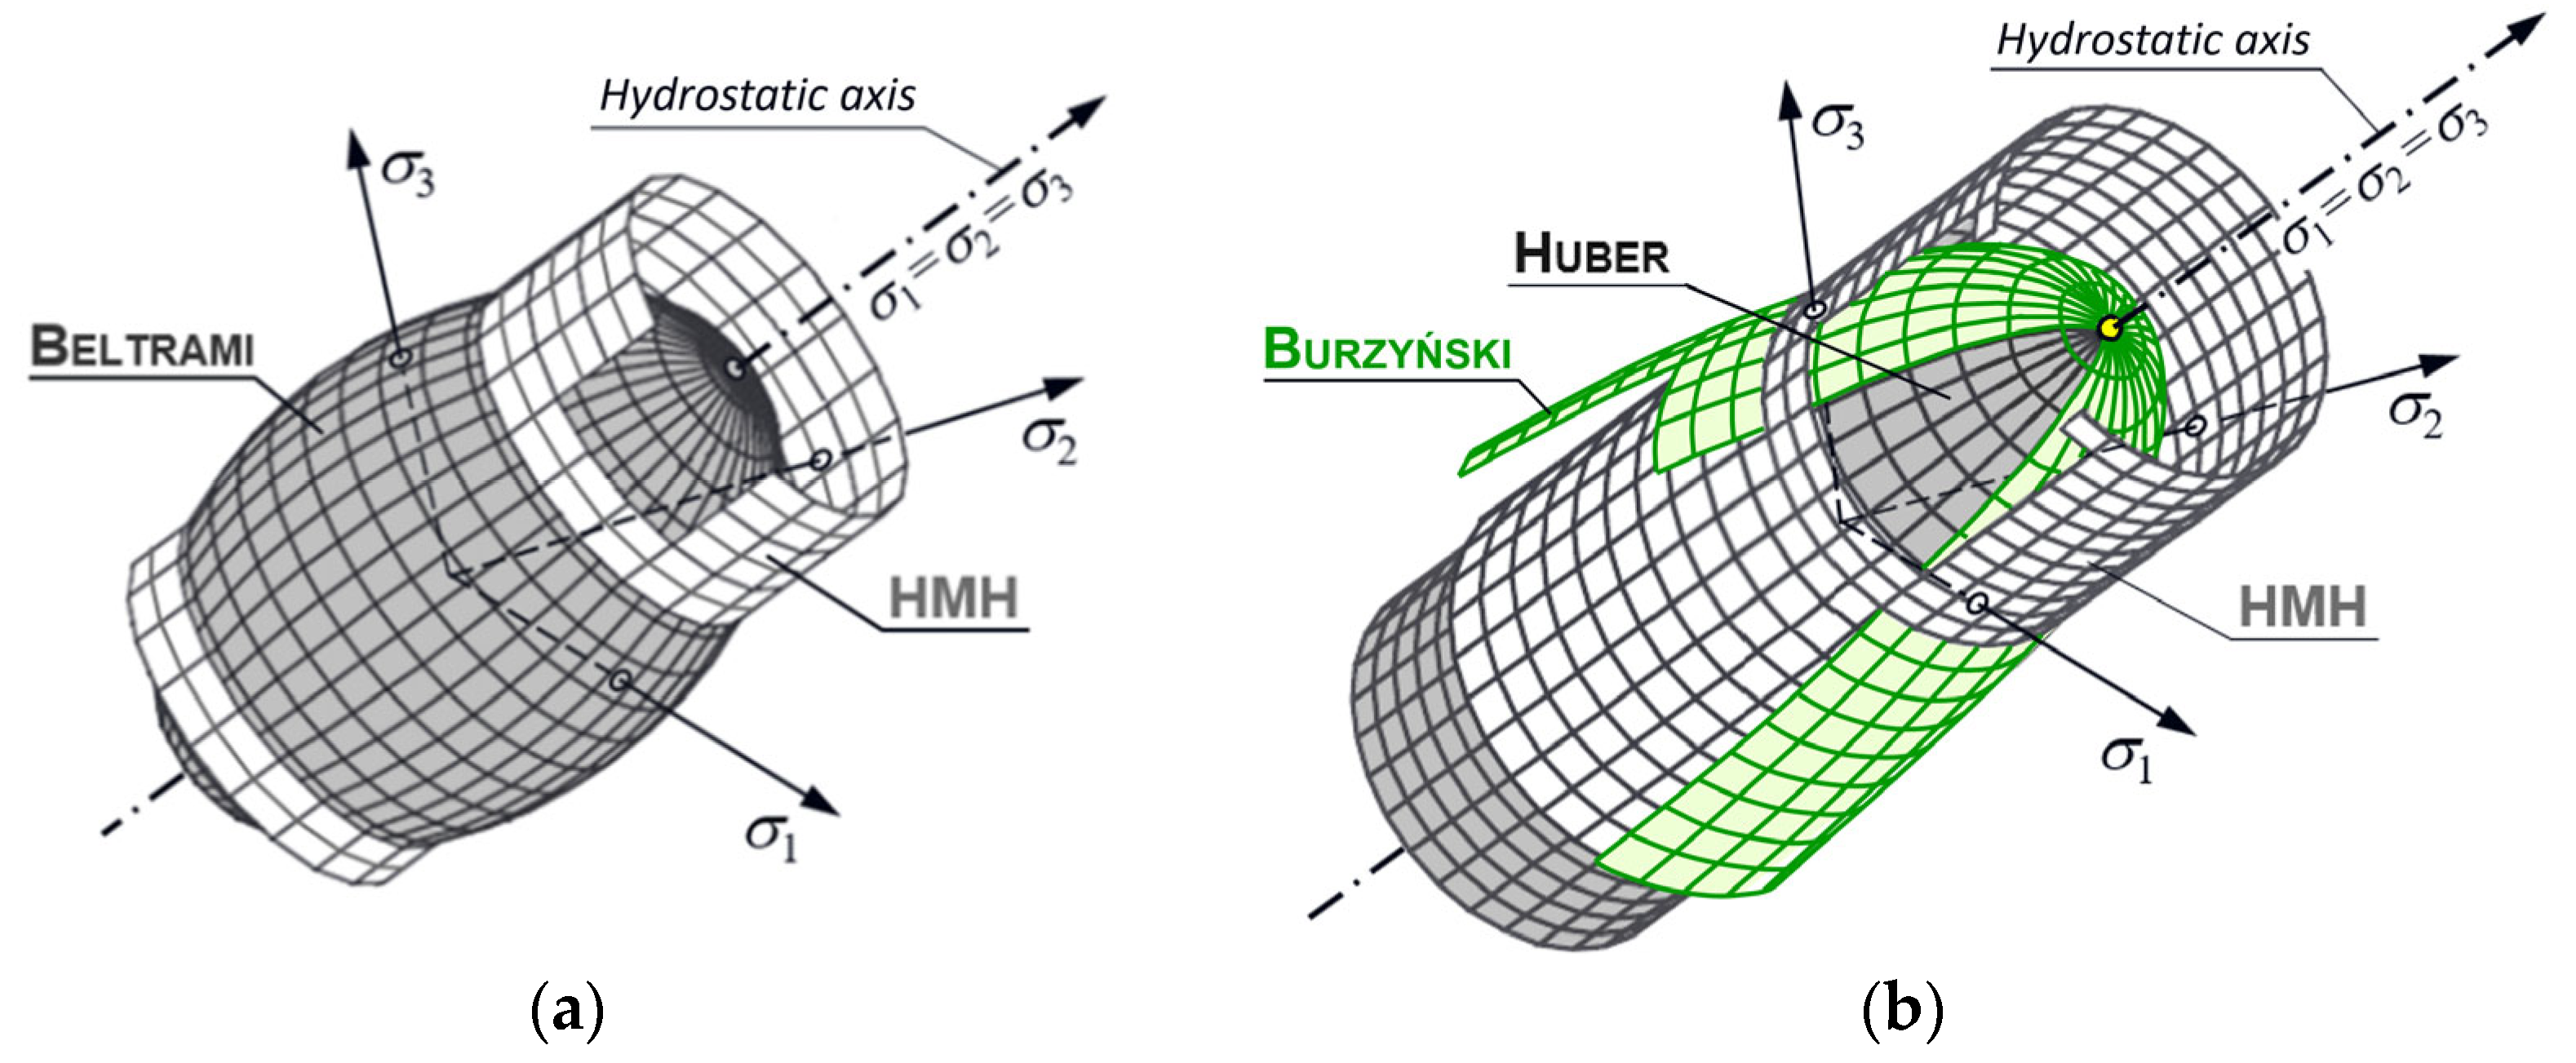
| Author, Date of Hypothesis | Hypothesis Condition | Figure |
|---|---|---|
| Beltrami, 1885 | always | Figure 1a |
| Huber, 1904 | when when | Figure 1b |
| Mises, 1913 HMH, 1930 | always | Figure 1a,b |
| —critical energy value determined experimentally | ||
2. Tested Materials
| Steel | Chemical Composition (%) | ||||||||
|---|---|---|---|---|---|---|---|---|---|
| Grade | Signature | C | Si | V | Cr | Mn | Ni | Cu | Mo |
| 26H2MF | 24CrMoV55 | 0.23 | 0.52 | 0.25 | 1.54 | 0.30 | 0.12 | 0.17 | 0.60 |
| St12T | X22CrMoV12-1 | 0.16 | 0.37 | 0.24 | 11.10 | 0.44 | 0.42 | 0.13 | 0.96 |
| Steel | Temperature [°C] | ||||
|---|---|---|---|---|---|
| St12T | 20 | 200 | 400 | 600 | 800 |
| 26H2MF | 20 | 200 | 400 | 550 | 800 |
3. Experimental Method
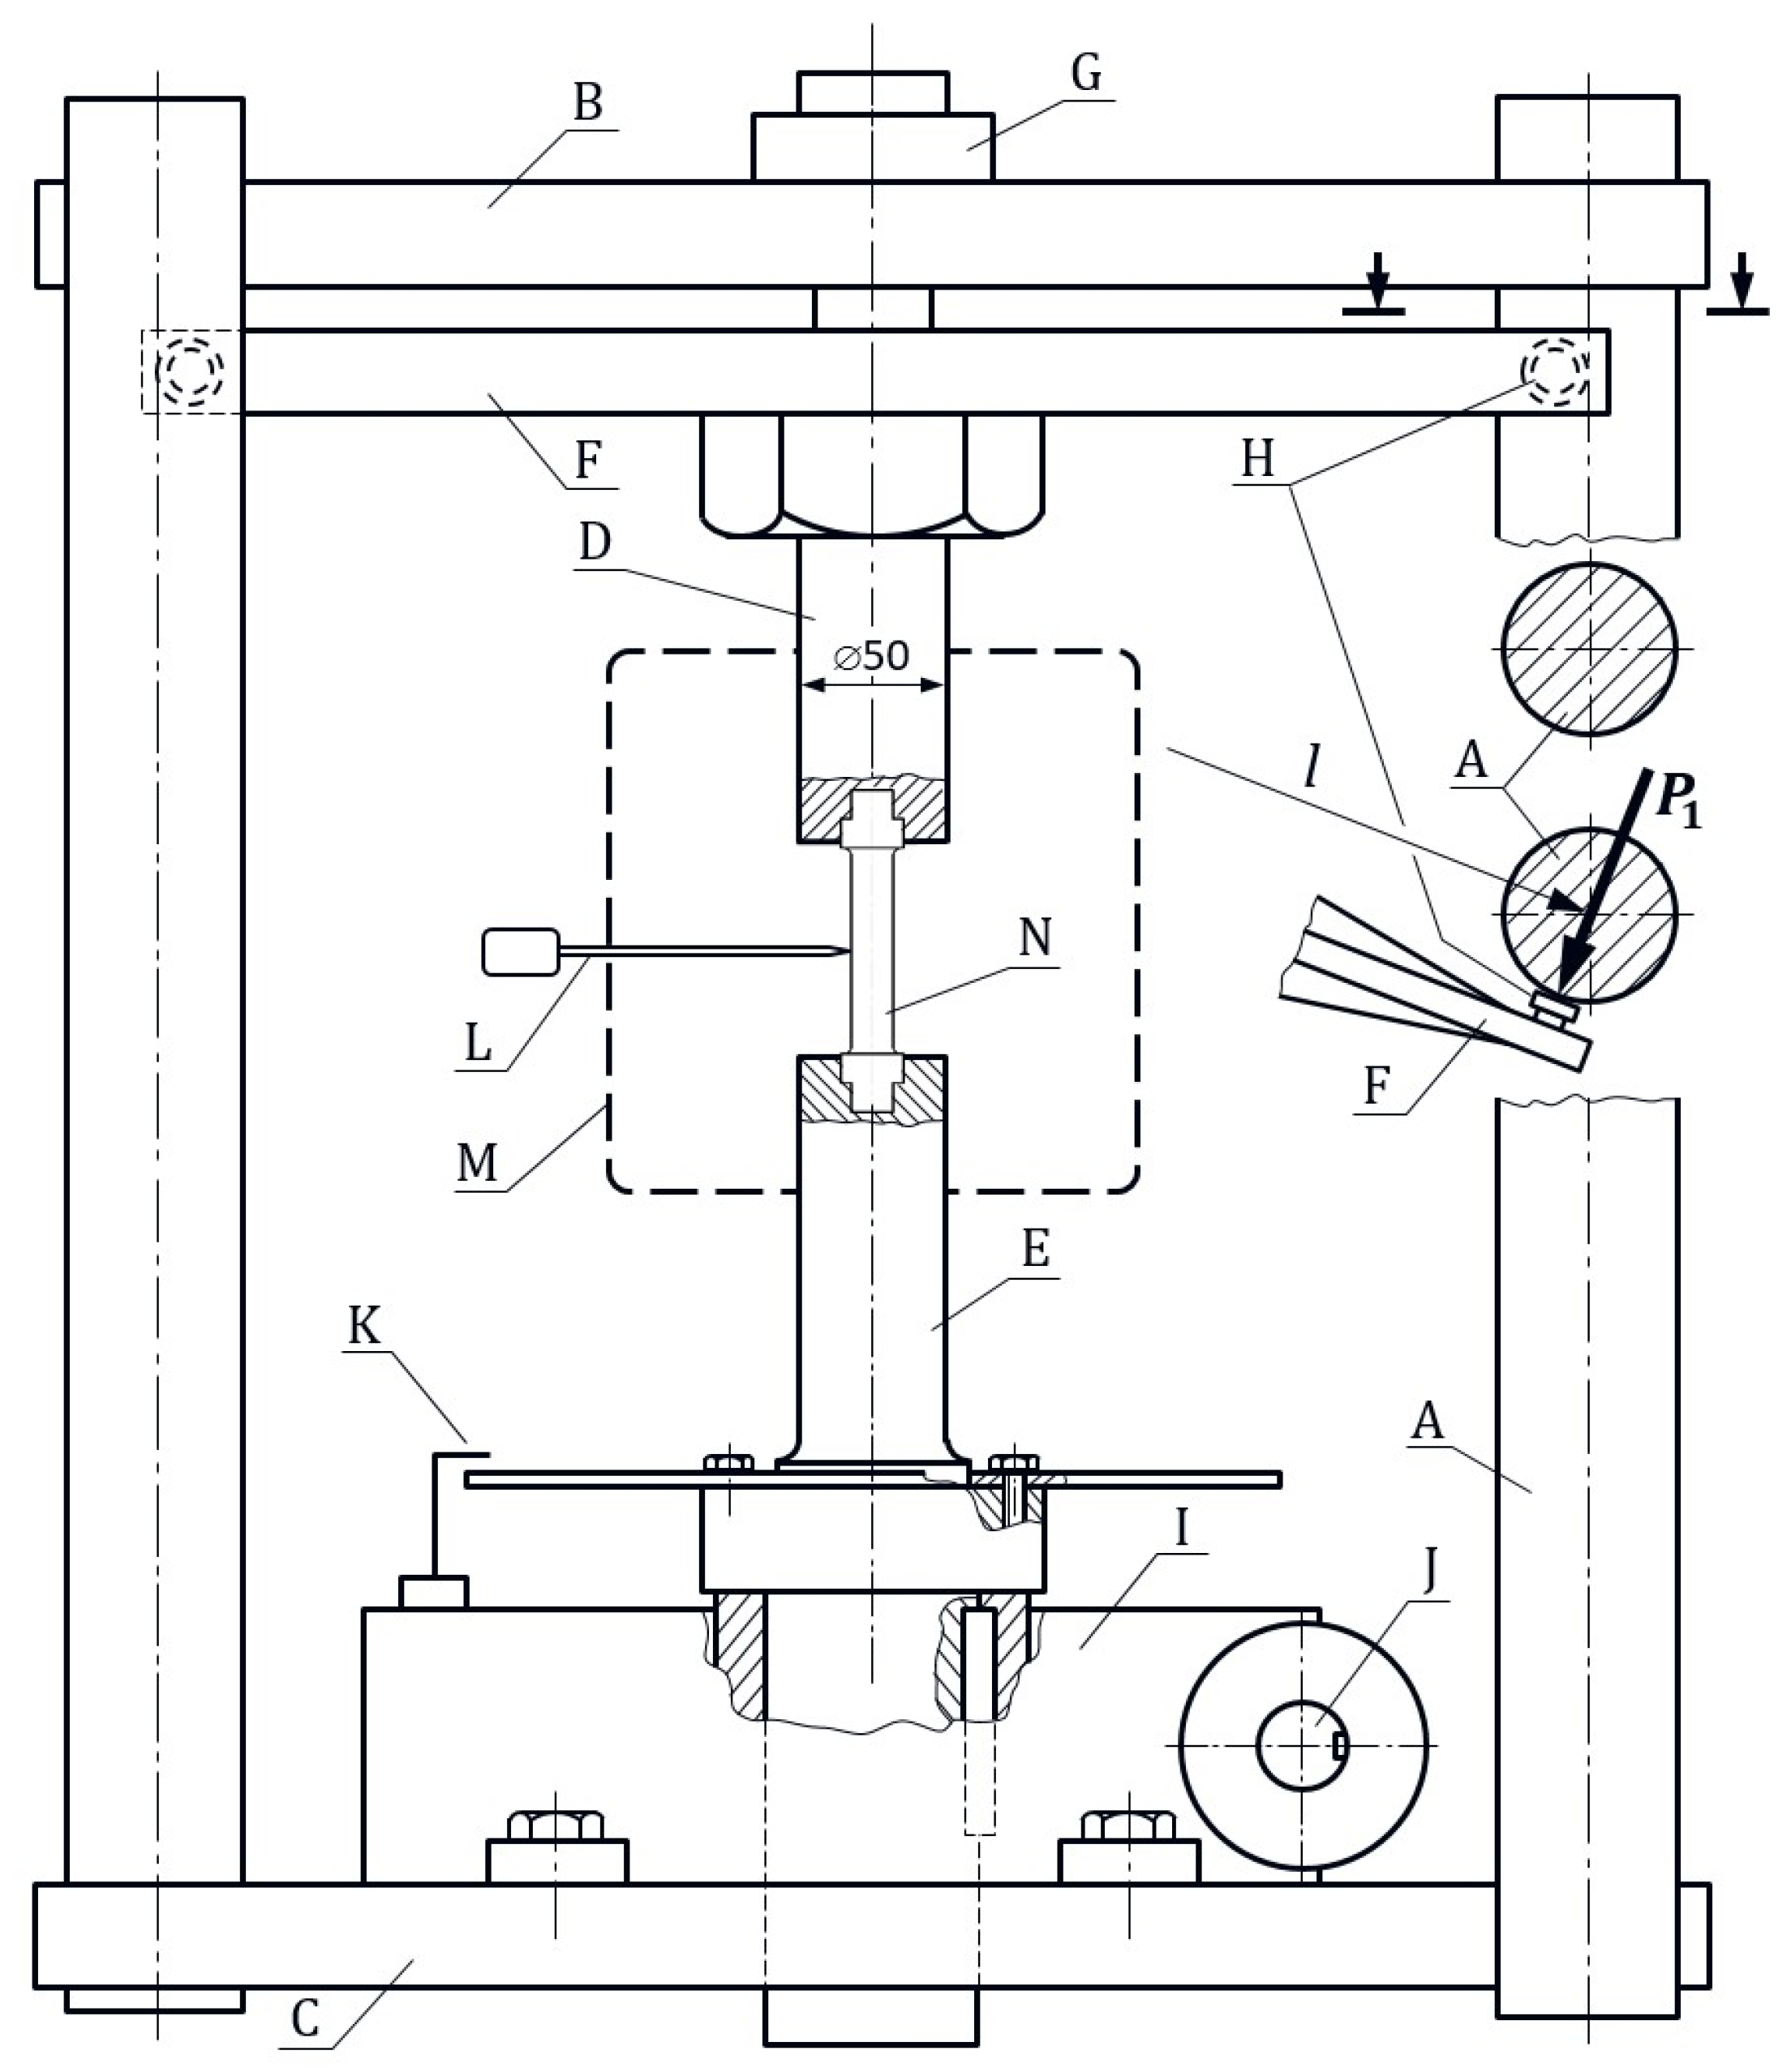
3.1. Sample Shape and Test Procedure

| St12T | 26H2MF | ||||
|---|---|---|---|---|---|
| Sample No. | Diameter d0 [mm] | Temperature [°C] | Sample No. | Diameter d0 [mm] | Temperature [°C] |
| 01 | 9.94 | 20 | 01 | 10.13 | 20 |
| 03 | 9.93 | 03 | 10.01 | ||
| 04 | 10.05 | 04 | 10.02 | ||
| 31 | 9.98 | 200 | 31 | 9.91 | 200 |
| 33 | 9.87 | 33 | 10.04 | ||
| 34 | 9.95 | 34 | 9.92 | ||
| 41 | 10.01 | 400 | 41 | 10.02 | 400 |
| 43 | 10.06 | 43 | 10.02 | ||
| 44 | 10.00 | 44 | 10.16 | ||
| 61 | 10.05 | 600 | 61 | 10.07 | 550 |
| 63 | 10.01 | 63 | 10.03 | ||
| 64 | 9.88 | 64 | 10.04 | ||
| 81 | 9.93 | 800 | 81 | 10.06 | 800 |
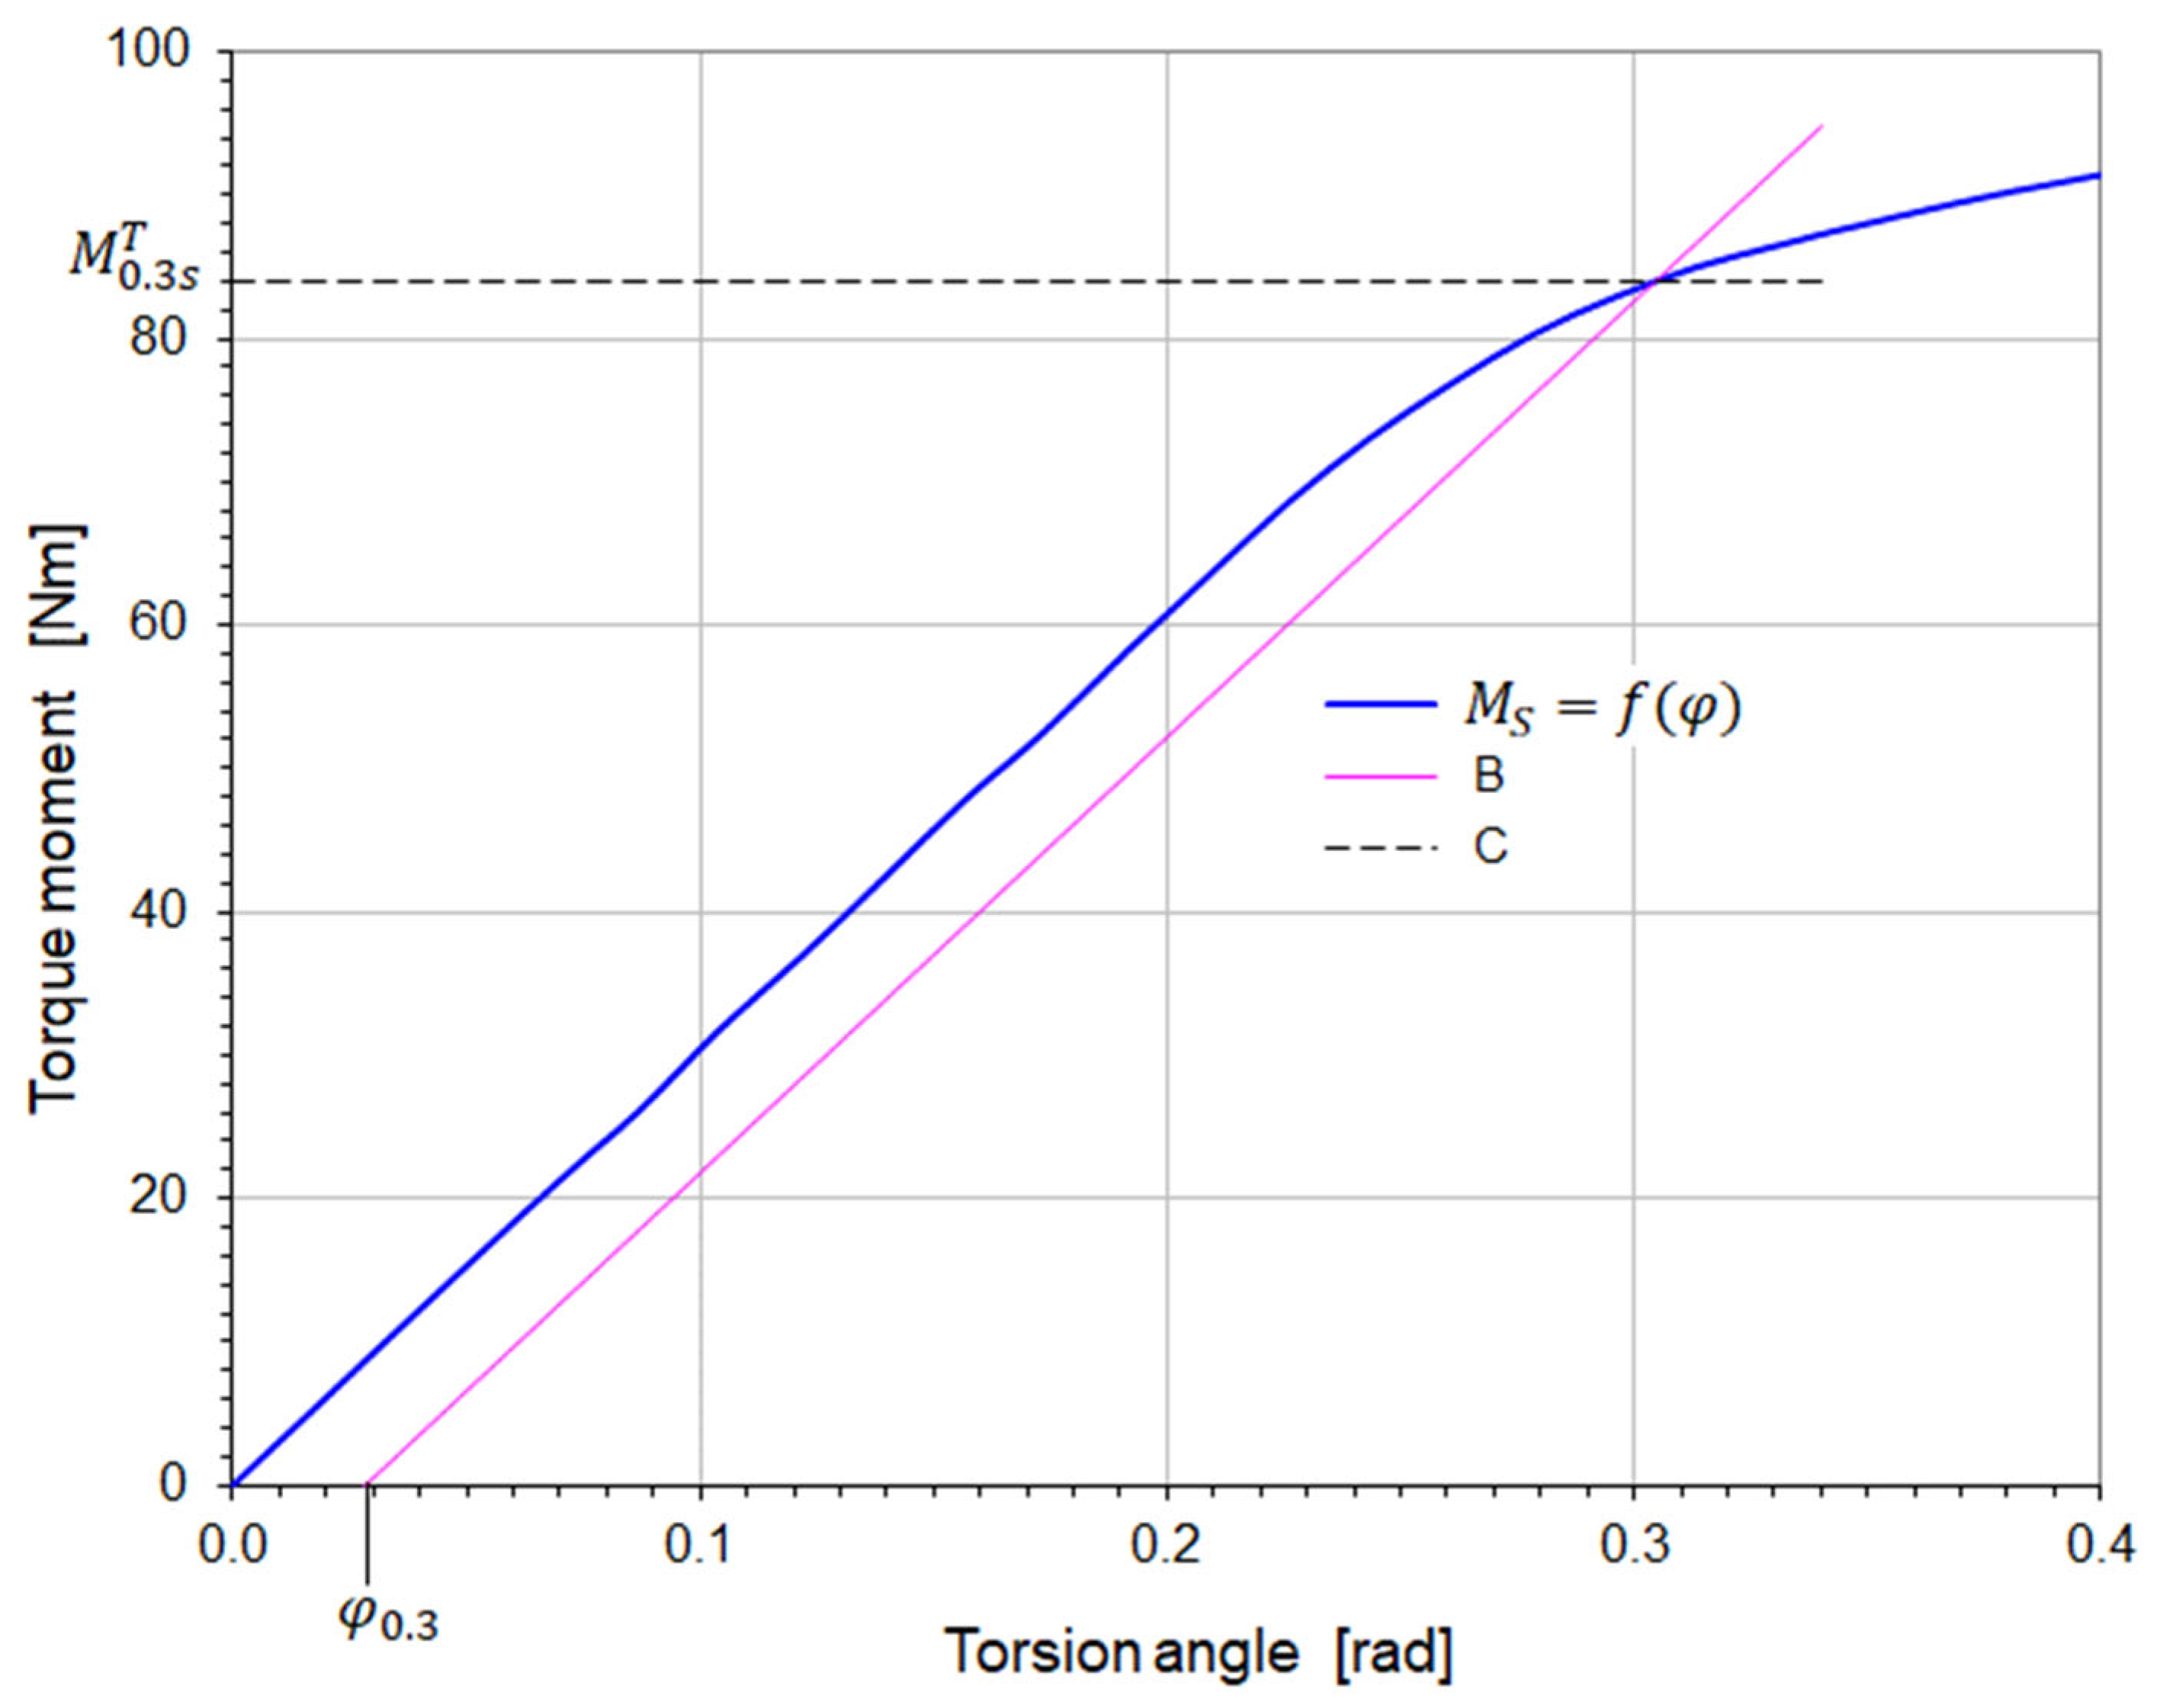
3.2. Method of Determining the Yield Stress and Torsional Strength
4. Experimental Results
4.1. Torsion Diagrams for Heat-Resistant Steels St12T and 26H2MF

4.2. Torsion Strength Properties of Heat-Resistant Steels St12T and 26H2MF
| Temperature [°C] | Sample No. | [MPa] | [MPa] | ||
|---|---|---|---|---|---|
| Samples | Average Value | Samples | Average Value | ||
| 20 | 01 | 435.6 | 436.4 | 476.4 | 473.0 |
| 03 | 439.5 | 472.4 | |||
| 04 | 434.0 | 470.0 | |||
| 200 | 31 | 404.8 | 401.8 | 442.7 | 454.1 |
| 33 | 397.3 | 466.8 | |||
| 34 | 403.3 | 452.9 | |||
| 400 | 41 | 368.1 | 367.5 | 412.4 | 425.9 |
| 43 | 365.2 | 421.2 | |||
| 44 | 369.3 | 444.0 | |||
| 600 | 61 | 321.1 | 319.3 | 392.1 | 394.4 |
| 63 | 319.9 | 390.3 | |||
| 64 | 316.9 | 400.8 | |||
| 800 | 81 | 197.7 | 197.7 | - | - |
| Temperature [°C] | Sample No. | [MPa] | [MPa] | ||
|---|---|---|---|---|---|
| Samples | Average Value | Samples | Average Value | ||
| 20 | 01 | 421.4 | 417.6 | 457.5 | 458.5 |
| 03 | 416.4 | 453.2 | |||
| 04 | 415.1 | 464.7 | |||
| 200 | 31 | 376.8 | 377.5 | 451.3 | 448.7 |
| 33 | 377.5 | 441.6 | |||
| 34 | 378.3 | 453.1 | |||
| 400 | 41 | 342.3 | 346.1 | 416.1 | 414.8 |
| 43 | 346.3 | 419.9 | |||
| 44 | 349.6 | 408.3 | |||
| 550 | 61 | 314.2 | 311.4 | 386.0 | 382.8 |
| 63 | 307.9 | 384.2 | |||
| 64 | 312.0 | 378.2 | |||
| 800 | 81 | 190.1 | 190.1 | - | - |

5. Using Torsion Test Results to Determine the Yield Surface
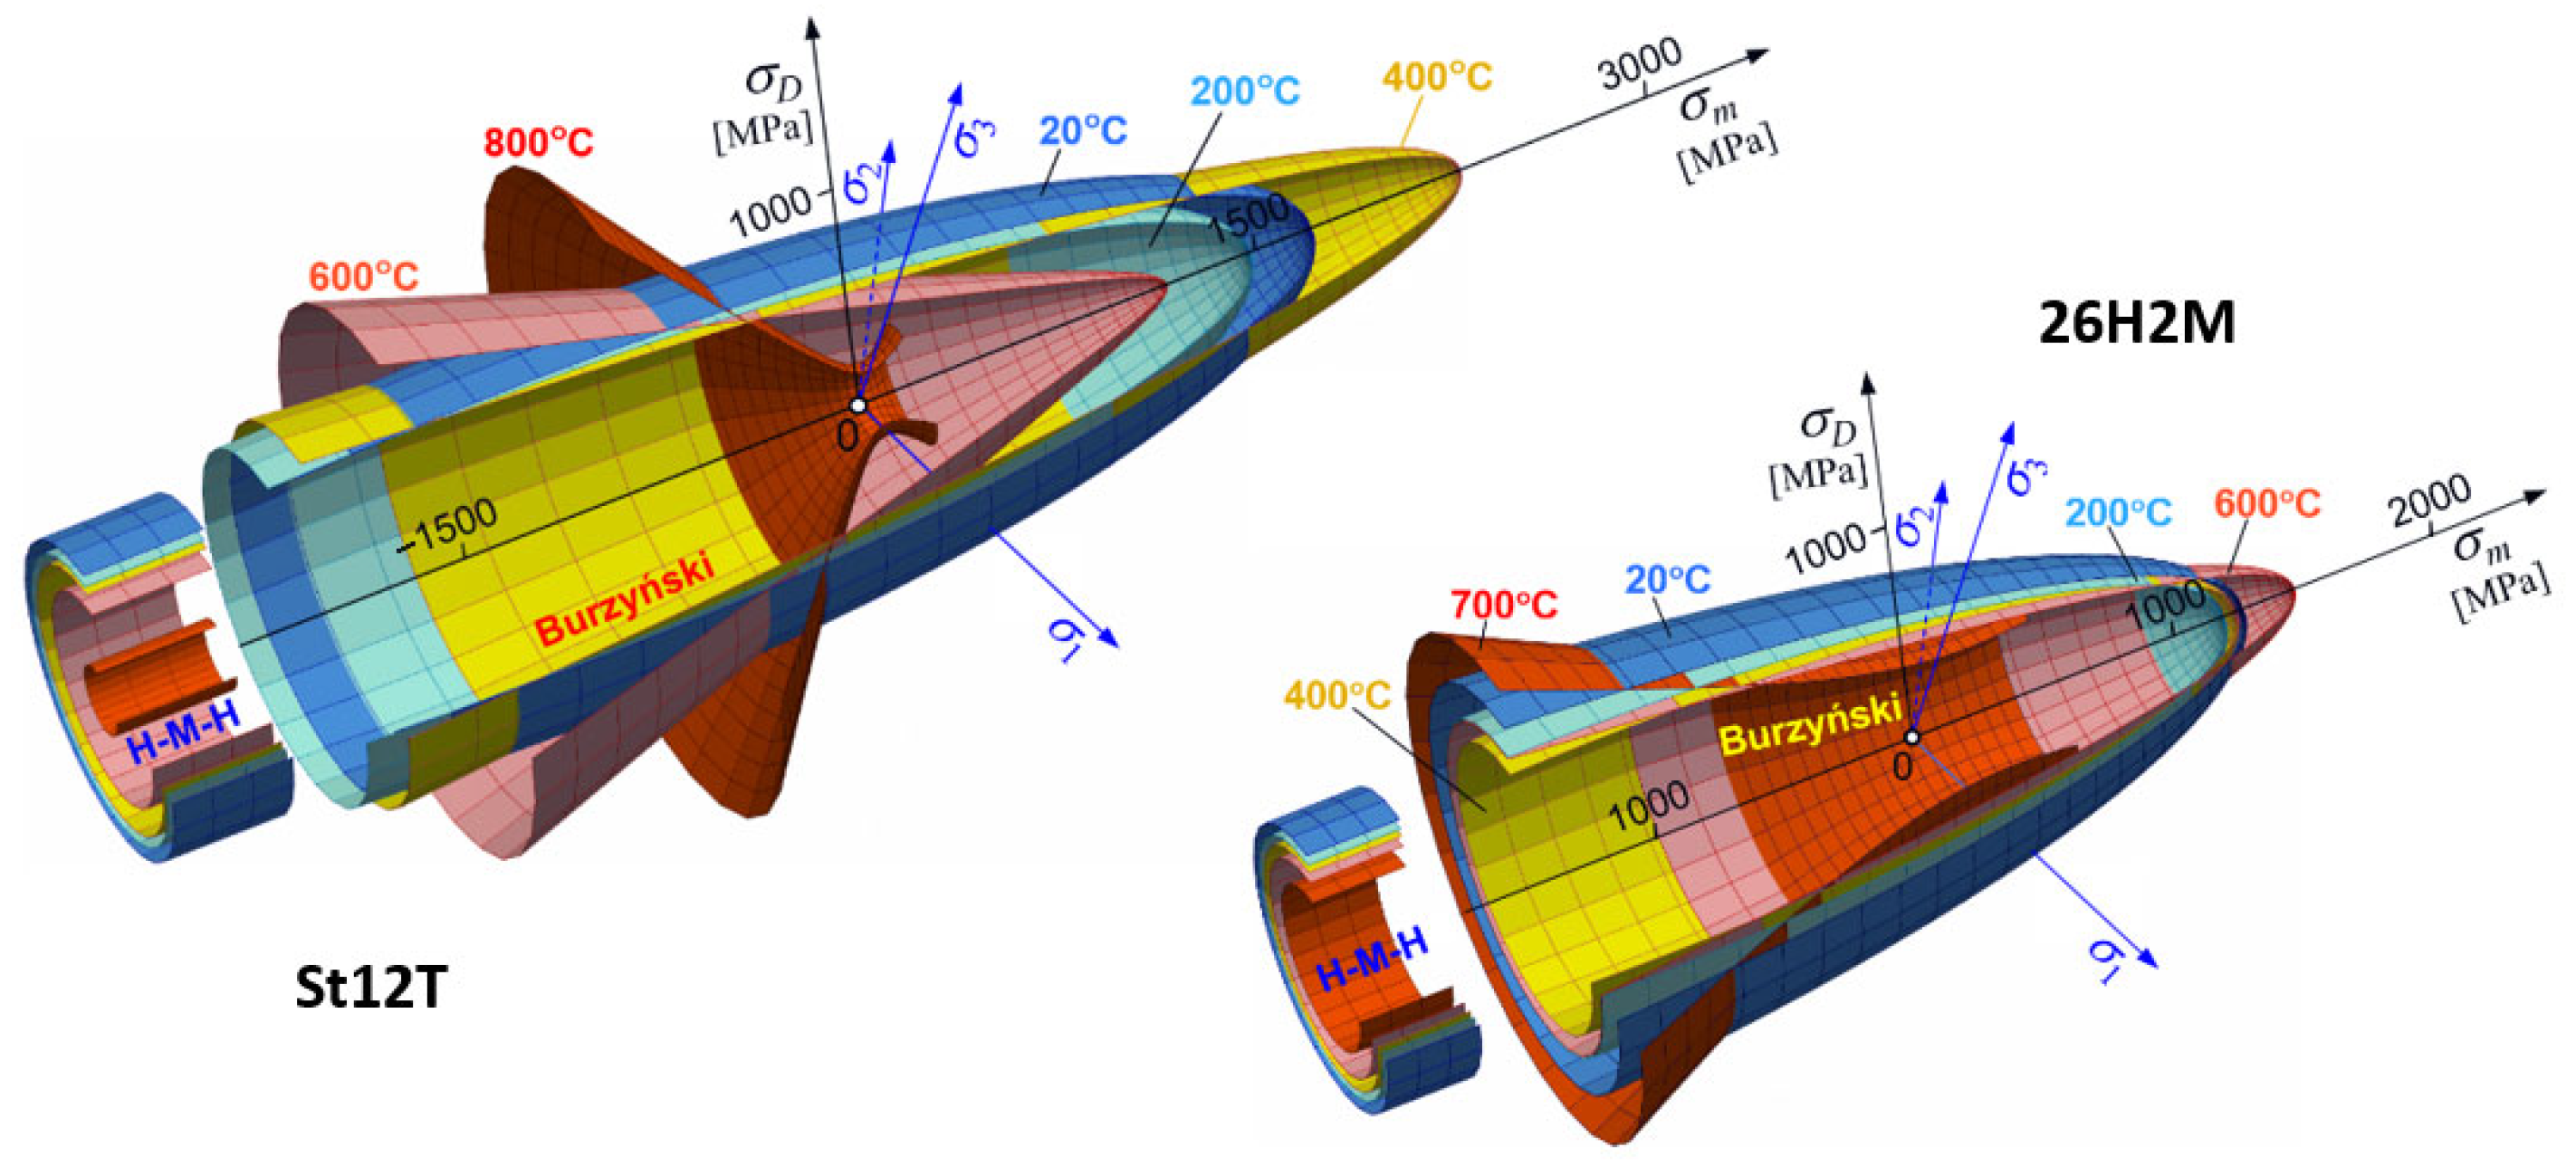
5.1. Burzynski’s Criterion
| Steel | Temperature [°C] | Yield Strength [MPa] | Coefficient [-] | |||
|---|---|---|---|---|---|---|
| St12T | 20 | 720.3 | 786.0 | 436.37 | 1.091 | 0.4866 |
| 200 | 656.7 | 731.7 | 401.76 | 1.114 | 0.4883 | |
| 400 | 608.0 | 666.3 | 367.51 | 1.108 | 0.4997 | |
| 600 | 487.0 | 639.3 | 319.28 | 1.313 | 0.5271 | |
| 800 | 160.0 | 290.0 | 197.65 | 1.813 | 1.1033 | |
| 26H2MF | 20 | 667.3 | 779.0 | 417.60 | 1.167 | 0.4905 |
| 200 | 610.7 | 693.3 | 377.50 | 1.135 | 0.4855 | |
| 400 | 567.0 | 628.0 | 346.06 | 1.108 | 0.4866 | |
| 550 | 507.3 | 573.3 | 311.37 | 1.130 | 0.5001 | |
| 700 | 388.5 | 460.0 | 238.60 * | 1.184 | 0.5696 | |
5.2. Drucker-Prager Model
5.3. Willam-Warnke and Menetrey-Willam Models
6. Summary and Conclusions
- 1.
- The increase in temperature from 20 to 600 °C for St12T steel caused a decrease in the yield strength from 436.4 MPa to 319.3 MPa, while the torsional strength decreased from 473.0 MPa to 394.4 MPa.
- 2.
- The increase in temperature from 20 to 550 °C for 26H2MF steel caused a decrease in the yield strength from 417.6 MPa to 311.4 MPa, while the torsional strength decreased from 458.5 MPa to 382.8 MPa.
- 3.
- At 800 °C, St12T steel showed a yield strength of 197.7 MPa, while 26H2MF steel showed this limit at the level of 190.1 MPa.
- 4.
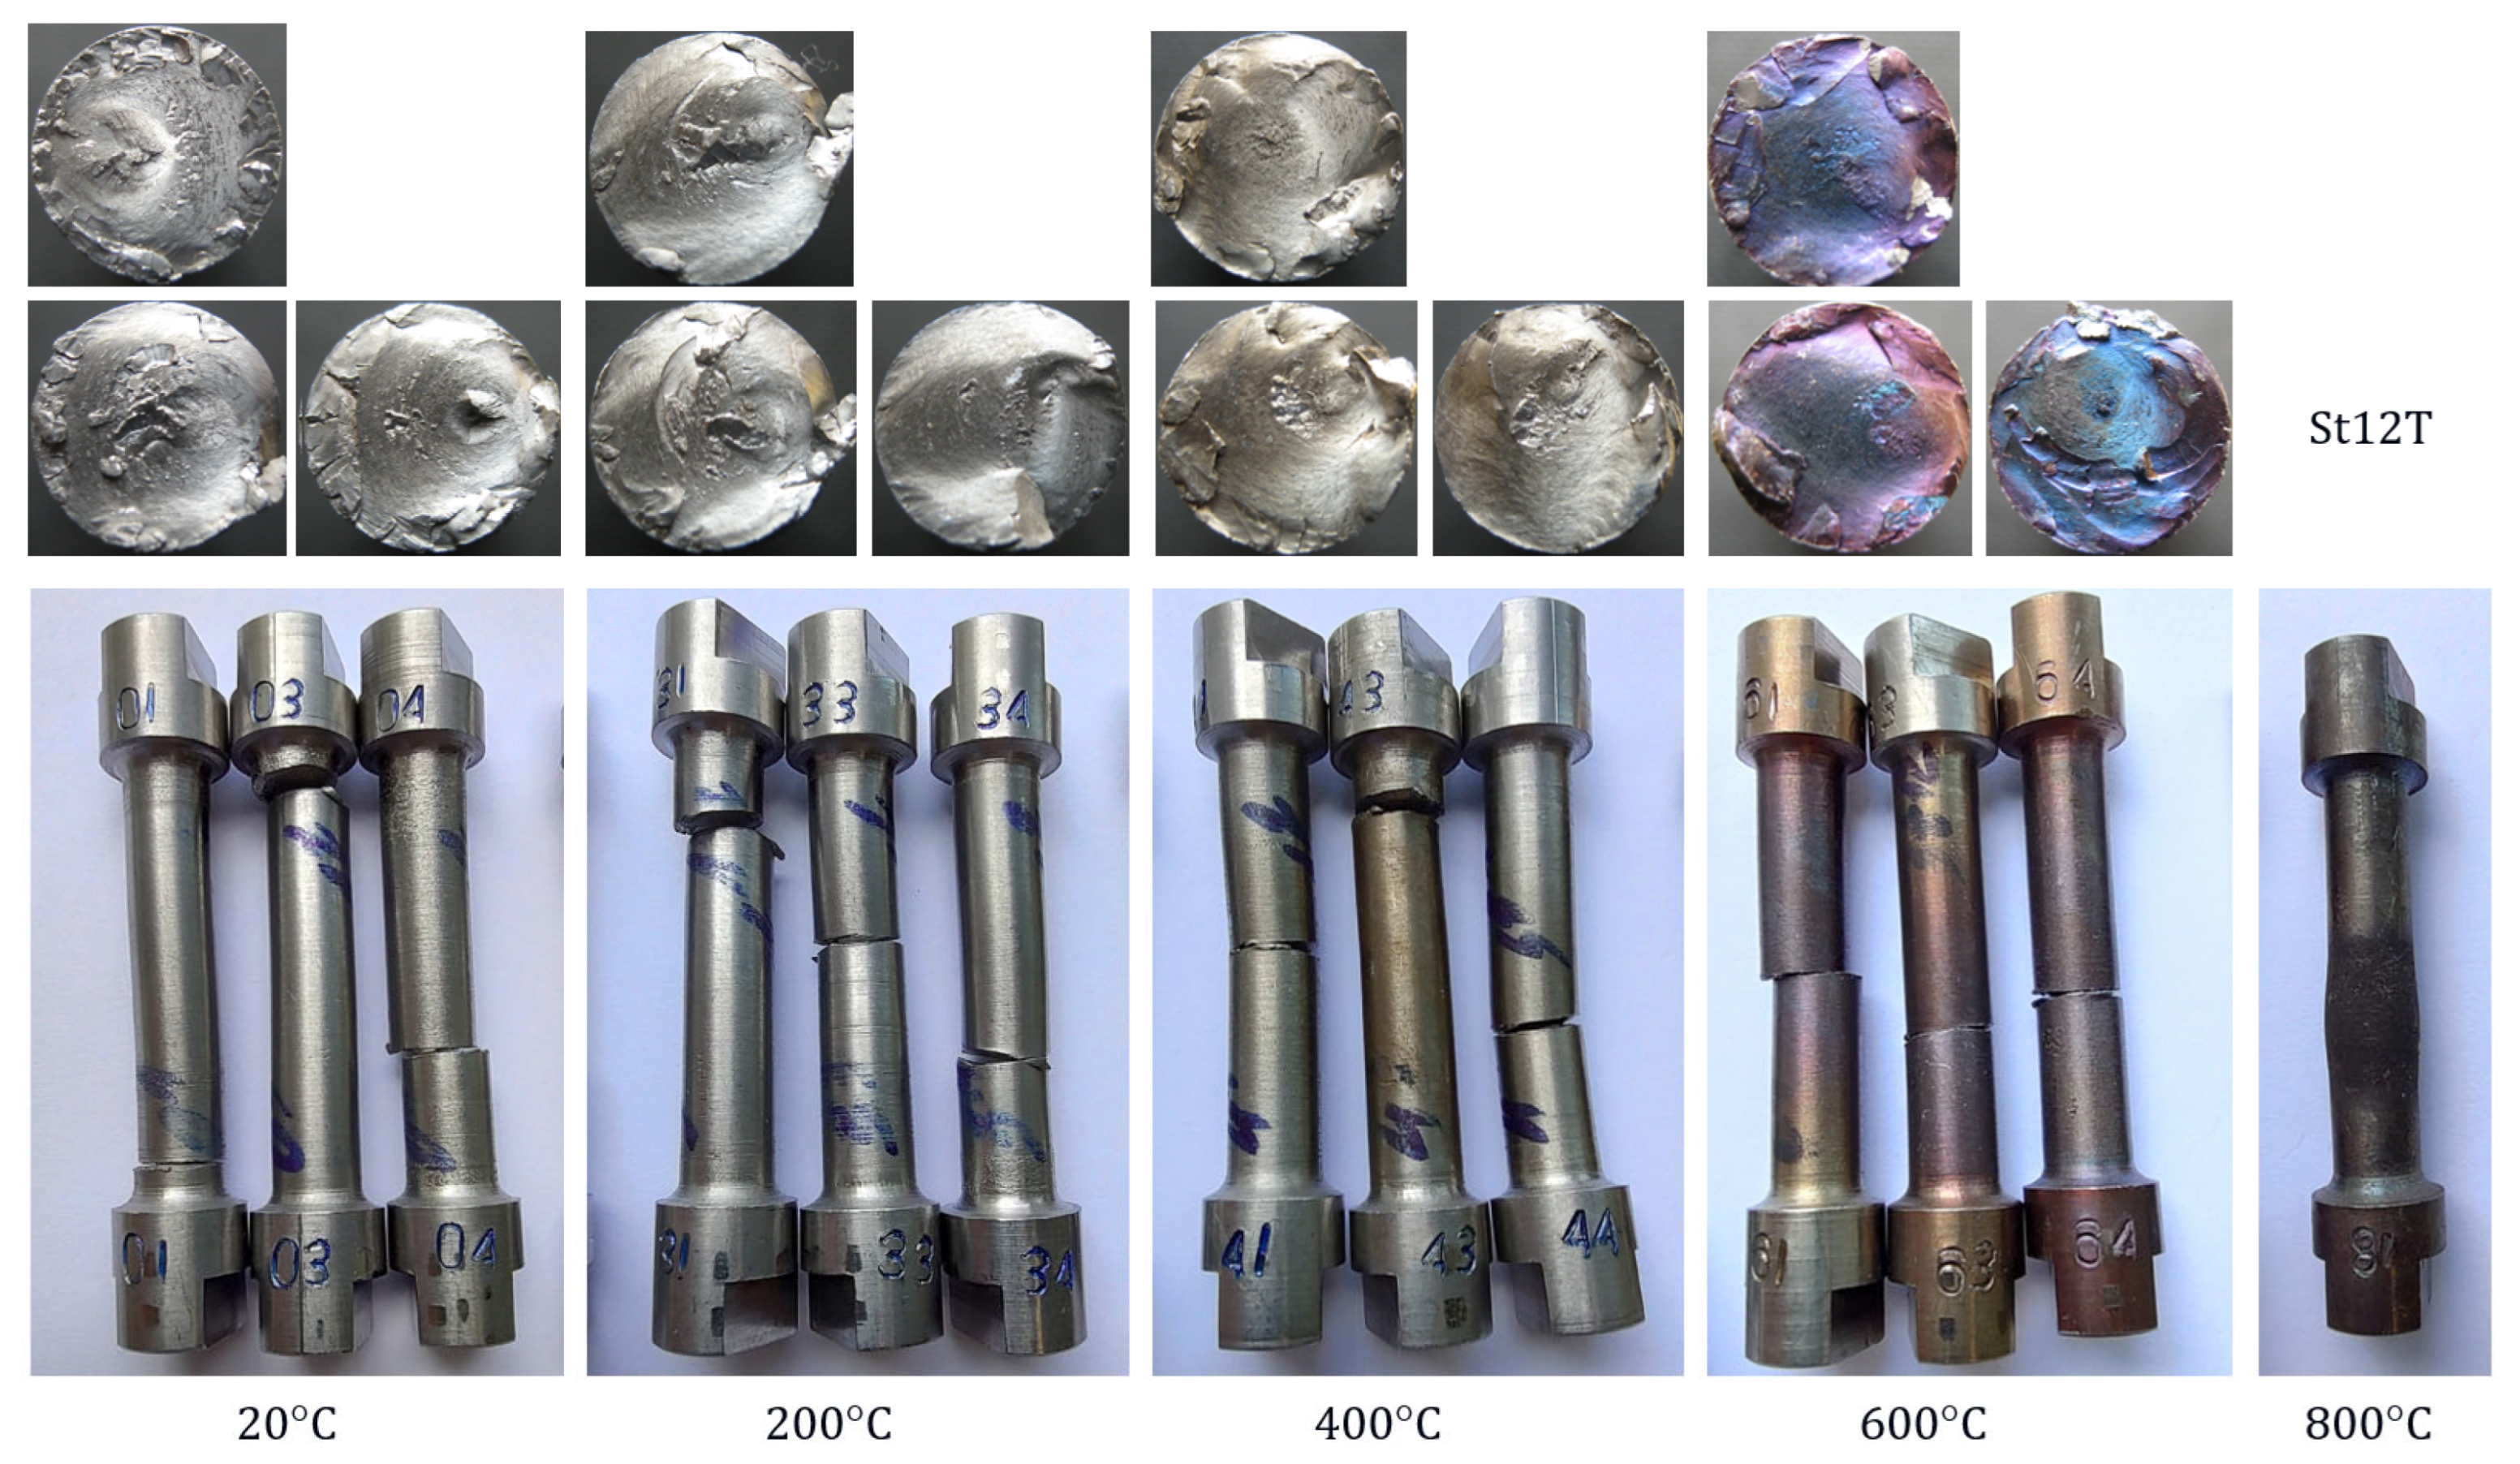
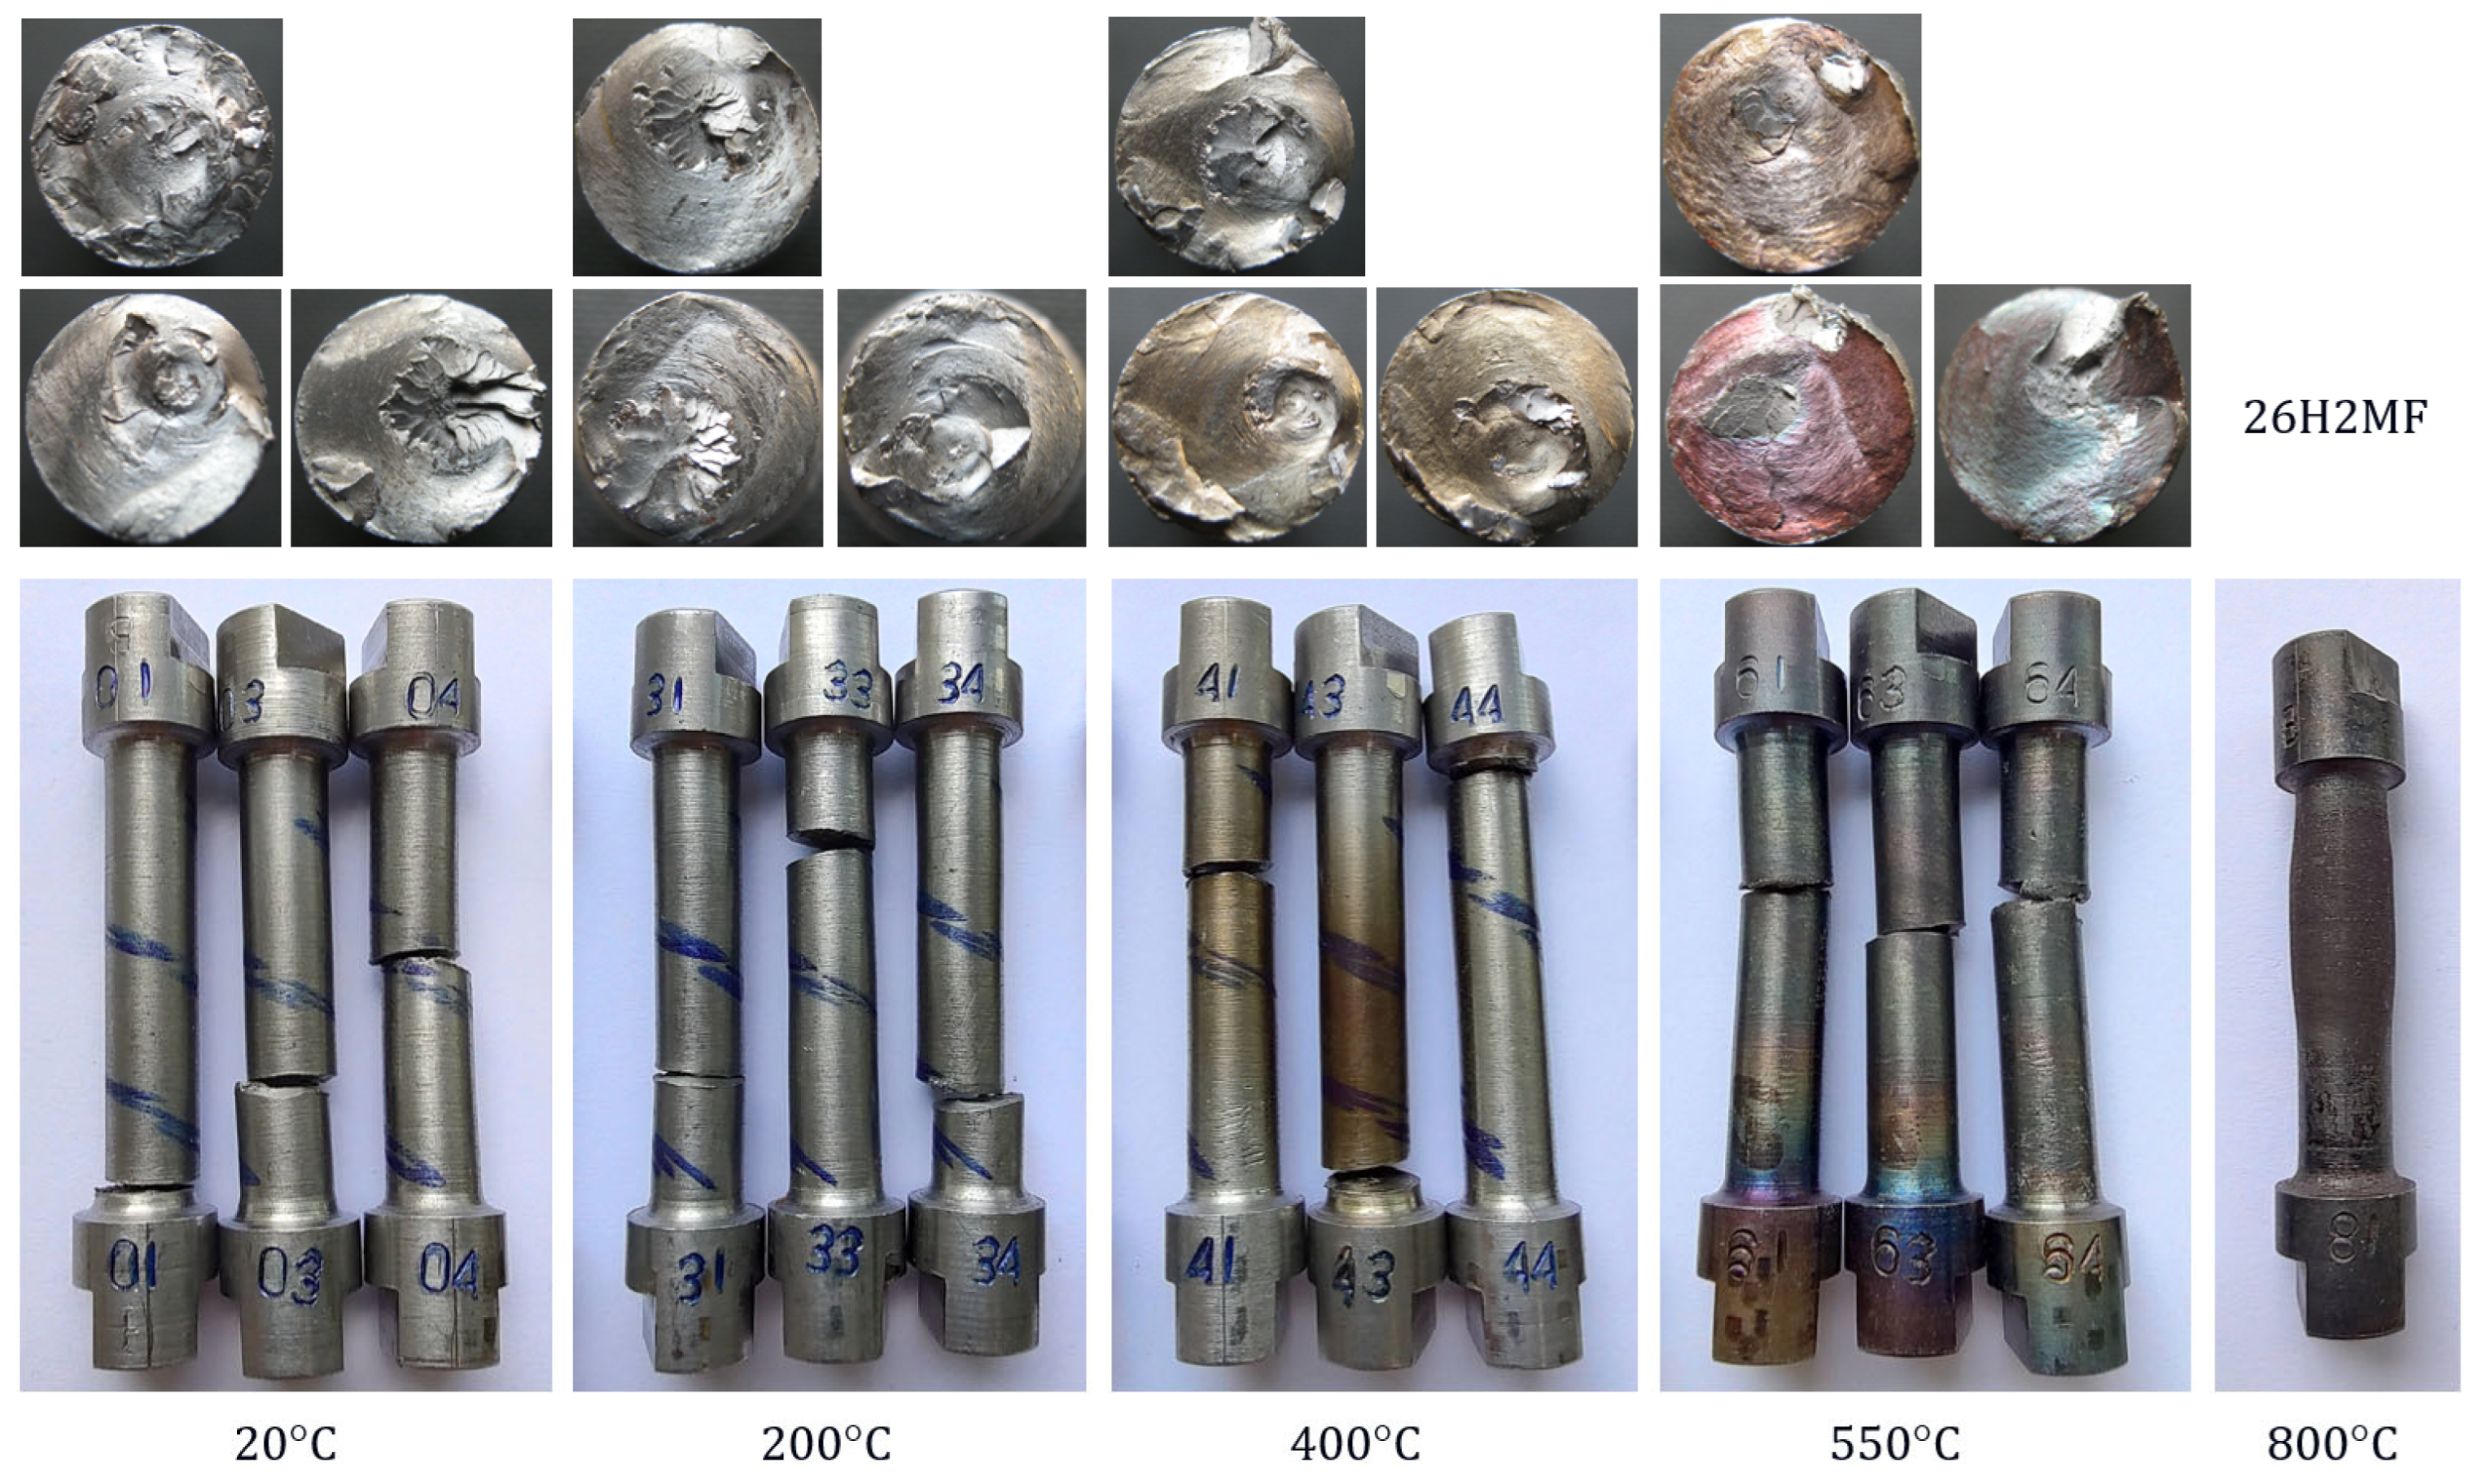
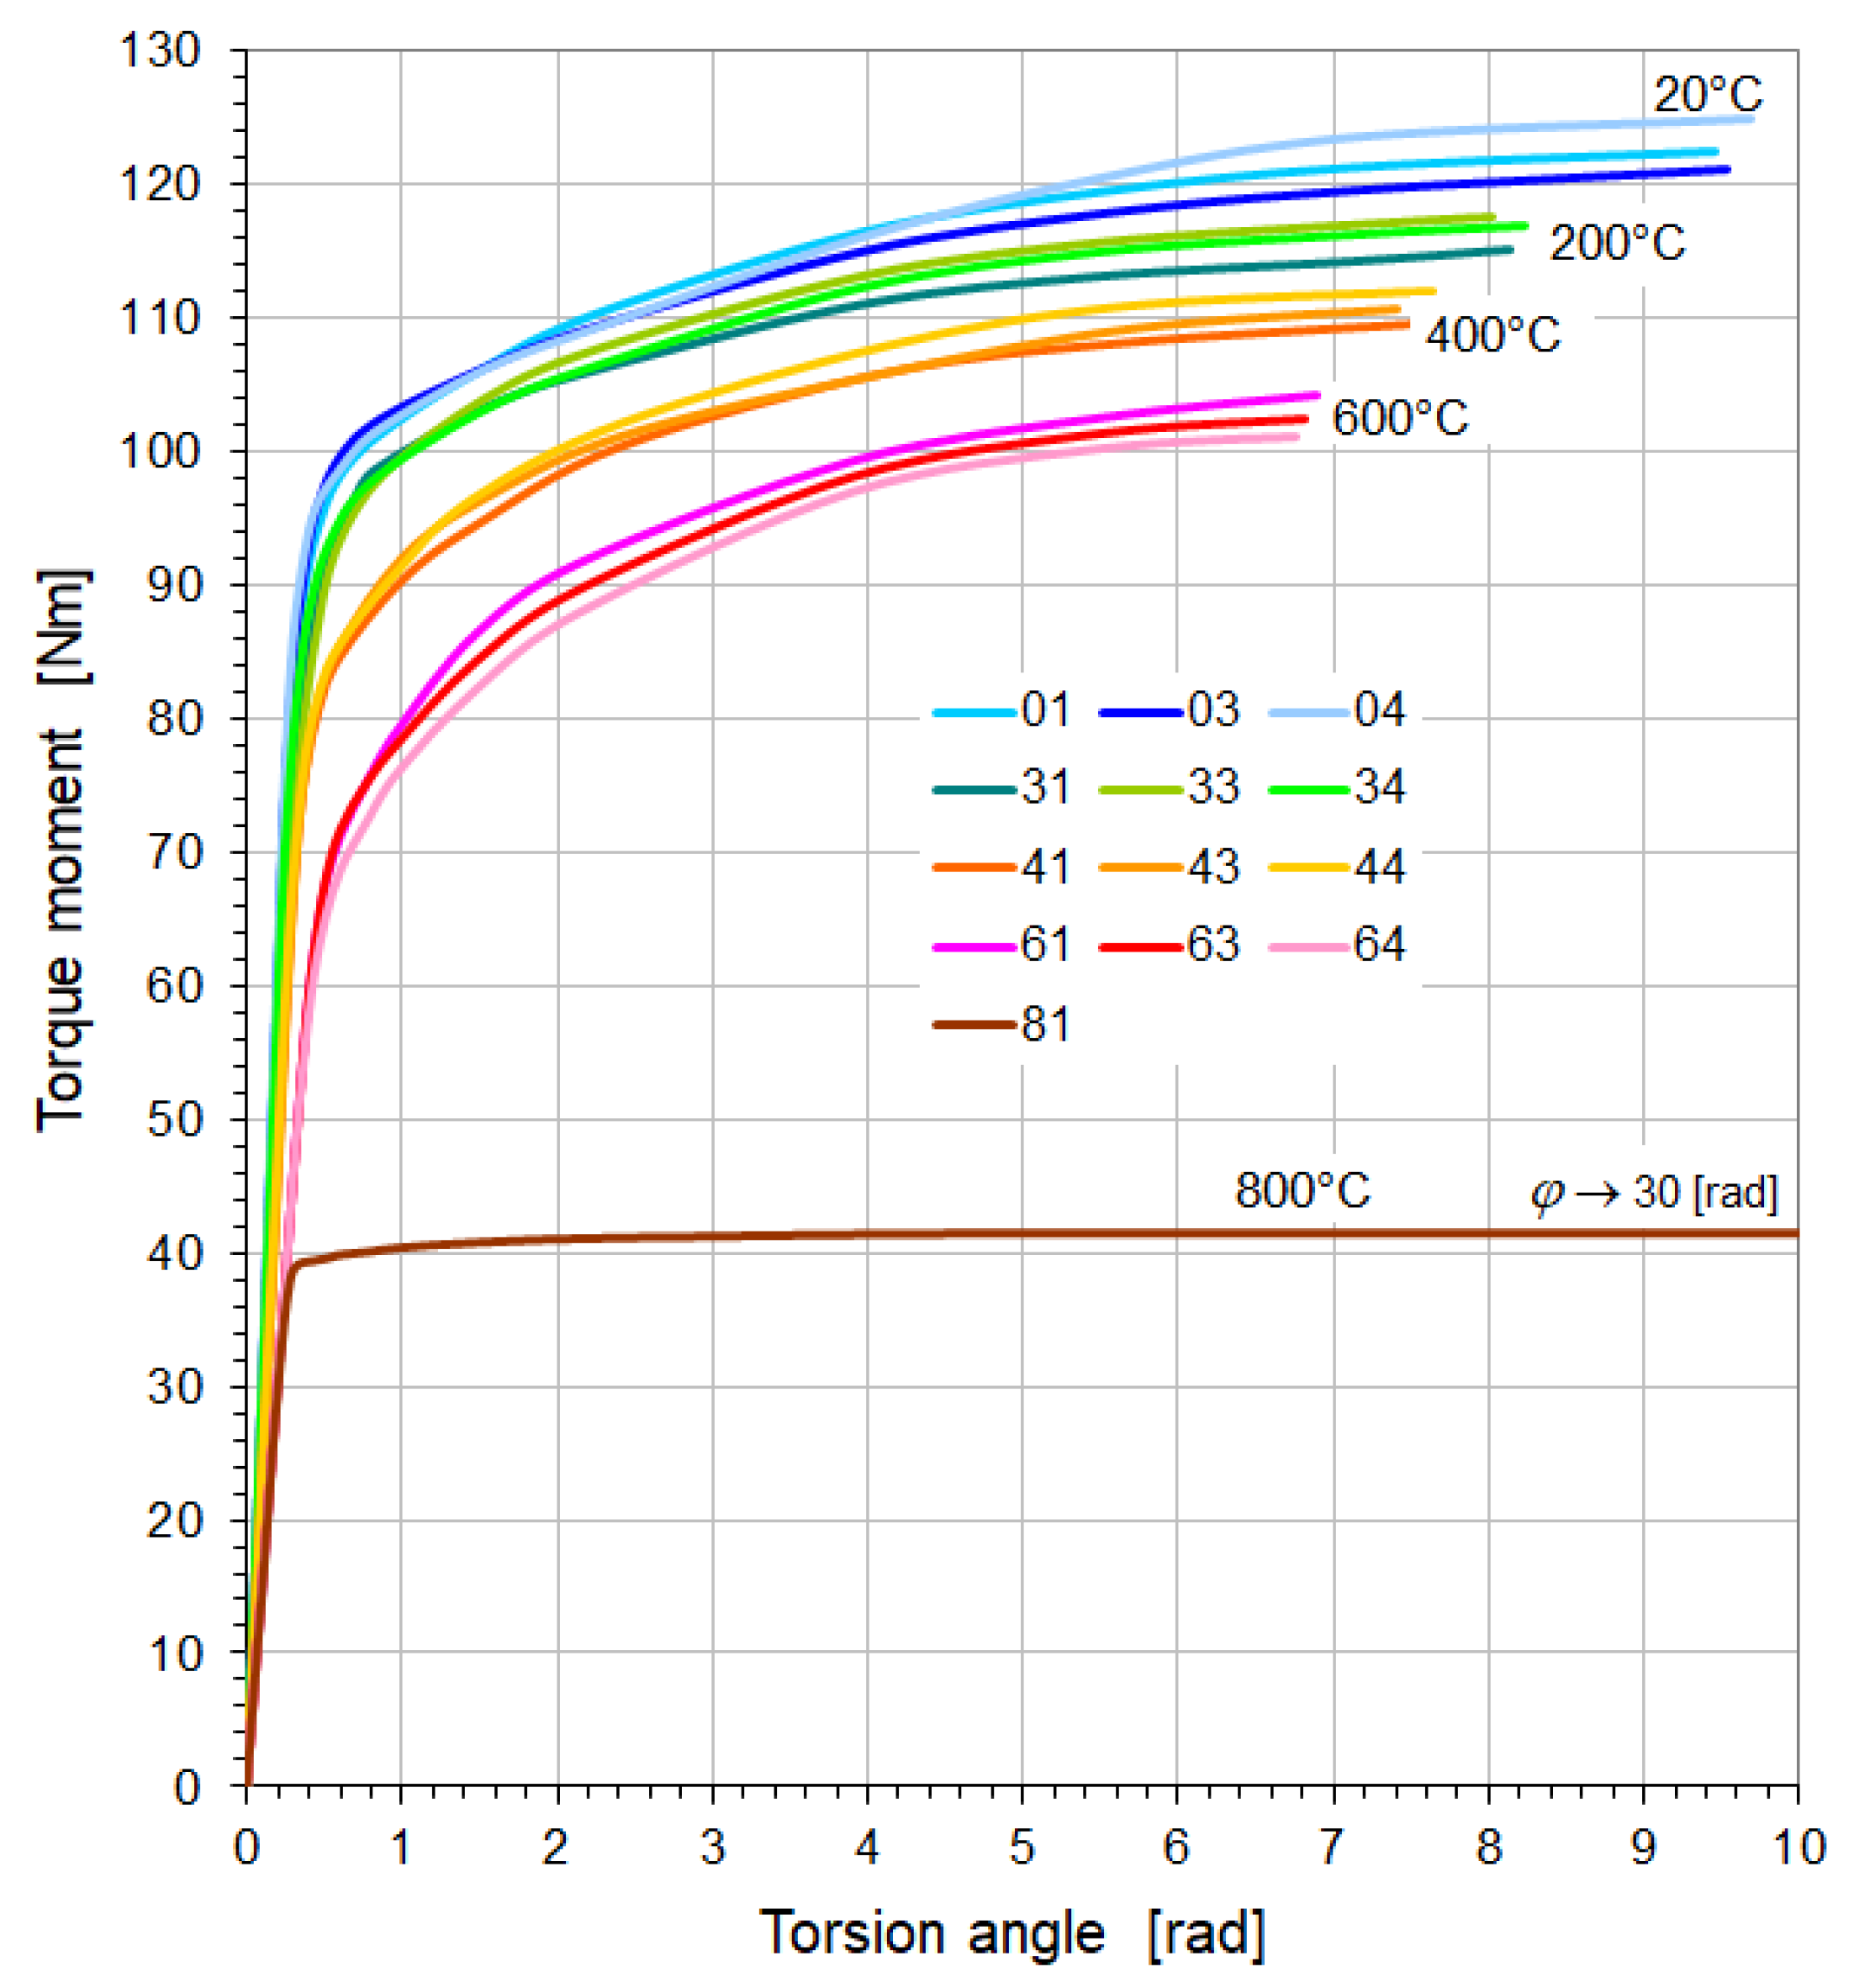
- Both steels tested at 800 °C were not destroyed despite the twisting of the samples to 30 radians, but they were shortened and swollen (Figure 5 and Figure 6), and after exceeding the yield point, the materials of these steels showed features of ideal plasticity in torsion (no hardening—Figure 7 and Figure 8).
- 5.
- St12T steel has higher resistance to torsion at high temperatures than 26H2MF steel. Both its yield point of 394.4 MPa and torsional strength of 394.4 MPa at temperatures of 600 °C are higher than the yield point of 311.4 MPa and torsional strength of 382.8 MPa of 26H2MF steel determined at a temperature of 550 °C.
Funding
Institutional Review Board Statement
Informed Consent Statement
Data Availability Statement
Conflicts of Interest
References
- Huber, M.T. Specific work of strain as a measure of material effort. Arch. Mech. 2004, 56, 173–190. [Google Scholar]
- Beltrami, E. Sulle condizioni di resistenza dei corpi elastici. Il Nuovo C. 1885, 18, 145–155. [Google Scholar] [CrossRef]
- Mises, R. Mechanik der festen Korper im Plastisch Deformablen Zustand. Nachr. Ges. Wiss. Gott. 1913, 232, 582–620. [Google Scholar]
- Altenbach, H.; Bolchoun, A.; Kolupaev, V.A. Phenomenological Yield and Failure Criteria. In Plasticity of Pressure-Sensitive Materials; Altenbach, H., Öchsner, A., Eds.; Springer: Berlin/Heidelberg, Germany, 2014; pp. 49–152. [Google Scholar]
- Altenbach, H.; Eremeyev, V.A.; Lebedev, L.P. On the existence of solution in the linear elasticity with surface stresses. ZAMM 2010, 90, 231–240. [Google Scholar] [CrossRef]
- Kolupaev, V.A.; Altenbach, H.; Bolchoun, A. Comparison of strength criteria based on the measurements on concrete. J. Eng. Mech. 2018, 144, 04018028. [Google Scholar] [CrossRef]
- Kolupaev, V.A. Equivalent Stress Concept for Limit State Analysis; Springer International Publishing: Berlin/Heidelberg, Germany, 2018. [Google Scholar]
- Altenbach, H. Strength hypotheses—A never ending story. Czas. Tech. Politech. Krak. 2010, 107, 5–15. [Google Scholar]
- Dudda, W.; Ziółkowski, P.J.; Ziółkowski, P.; Bryk, M.; Badur, J. A Concept of Thermal Effort for Heat-Induced Metal Plasticity. Materials 2024, 17, 4824. [Google Scholar] [CrossRef]
- Ochrymiuk, T.; Dudda, W.; Froissart, F.; Badur, J. Principles of Stress-Strength Modelling of the Highly Thermally Loaded Materials—The Influence of an Effect of Strength Differential on the Material Effort. Materials 2021, 14, 7449. [Google Scholar] [CrossRef]
- Bryk, M.; Banaszkiewicz, M.; Kowalczyk, T.; Dudda, W.; Ziółkowski, P. Slowly-closing valve behaviour during steam machine accelerated start-up. Case Stud. Therm. Eng. 2022, 39, 102457. [Google Scholar] [CrossRef]
- Dudda, W.; Kraszewski, B. A theoretical validation of Burzyński hypothesis for a stress-strain analysis of heat-resistant steel. Case Stud. Therm. Eng. 2021, 23, 100806. [Google Scholar] [CrossRef]
- Drucker, D.C.; Prager, W. Soil mechanics and plastic analysis for limit design. Q. Appl. Math. 1952, 10, 157–165. [Google Scholar] [CrossRef]
- Willam, K.J.; Warnke, E.P. Constitutive models for the triaxial behavior of concrete. Proc. Int. Assoc. Bridge Struct. Eng. 1975, 19, 1–30. [Google Scholar]
- Menetrey, P.; Willam, K.J. Triaxial failure criterion for concrete and its generalization. ACI Struct. J. 1995, 92, 311–318. [Google Scholar]
- Dmitriev, A.; Novozhilov, Y.; Mikhalyuk, D.; Lalin, V. Calibration and validation of the Menetrey-Willam constitutive model for concrete. Constr. Unique Build. Struct. 2020, 88, 8804. [Google Scholar]
- Życzkowski, M. Combined Loadings in the Theory of Plasticity; PWN: Warszawa, Poland, 1981. [Google Scholar]
- Życzkowski, M. Discontinuous bifurcations in the case of the Burzyński-Torre yield condition. Acta Mech. 1999, 132, 19–35. [Google Scholar] [CrossRef]
- Nowak, M.; Ostrowska–Maciejewska, J.; Pęcherski, R.B.; Szeptyński, P. Yeld condition accounting for third invariant of stress tensor deviator. Eng. Trans. 2011, 59, 273–281. [Google Scholar]
- Khoddam, S.; Hodgson, P. Post processing of the hot torsion test results using a multi-dimensional modelling approach. Mater. Des. 2010, 31, 2578–2584. [Google Scholar] [CrossRef]
- Zhang, J.; Yao, K.; Chen, H.; Zhu, G.; Li, F. Microstructure evolution of SAF2205 duplex stainless steel during torsion deformation at elevated temperature. Rare Met. Mater. Eng. 2018, 47, 1689–1694. [Google Scholar]
- Bhanuse, M.M.; Jankar, P.D. Behavior of Steel under Elevated Temperature—Experimental work. Int. J. Adv. Sci. Tech. Res. 2013, 6, 700–705. [Google Scholar]
- Mirzakhani, B.; Salehi, M.T.; Arabi, H.; Khoddam, S.; Seyedein, S.H.; Aboutalebi, M.R. Predication of temperaturę distribution in the hot torsion test specimen. Int. J. Eng. Sci. 2008, 19, 45–50. [Google Scholar]
- Carreño, F.; Cepeda-Jiménez, C.M.; Peñalba, F.; Carsí, M.; Ruano, O.A. Simulation of hot rolling processing of an Al-Cu-Mg alloy by torsion tests. Mater. Sci. Forum 2012, 706–709, 277–282. [Google Scholar] [CrossRef]
- Martins, F.H.; Machado, M.L. Estudo do comportamento termomecânico do aço API 5L X80 microligado ao Nb-Ti através de ensaios de torção a quente. Rev. Esc. Minas 2015, 68, 195–200. [Google Scholar] [CrossRef]
- Ebrahimi, G.R.; Keshmiri, H.; Arabshahi, H. Mechanical Characteristics of Superaustenitic Stainless Steel Type 30Cr25Ni32Mo3 at Elevated Temperatures. Mater. Sci. Appl. 2010, 1, 323–328. [Google Scholar]
- Gusel, L. Obtaining the stress-strain behaviour of stainless steel at elevated temperatures. Mater. Sci. 2019, 2, 47–50. [Google Scholar]
- Aiello, G.; Caes, C.; Lamagnere, P.; Martin, A.; Sauzay, M. Tension–torsion ratcheting tests on 9Cr steel at high temperature. Nucl. Eng. Des. 2015, 284, 207–214. [Google Scholar]
- Vuppala, A.; Brüggemann, H.; Bailly, D.; Scharifi, E. An Inverse Piecewise Flow Curve Determination Method for Torsion Tests at Elevated Temperature. Metals 2025, 15, 219. [Google Scholar] [CrossRef]
- Ballard, T.J.; Speer, J.G.; Findley, K.O.; De Moor, E. Double twist torsion testing to determine the non recrystallization temperature. Sci. Rep. 2021, 11, 1495. [Google Scholar] [CrossRef]
- Hjorth, A. The Effect of Deformation by Torsion and Subsequent Heat Treatment on the Microstructure of AA6082. Mater. Sci. Eng. 2018, 3–4, 1–48. [Google Scholar]
- Zhou, M.; Clode, M.P. Thermal analysis of the torsion test under hot-working conditions. Comput. Mater. Sci. 1998, 9, 411–419. [Google Scholar] [CrossRef]
- Li, L.; Wang, Z.; Ma, W. Experimental Study on the High Temperature Impact Torsional Behavior of Ti-1023 Alloy. Materials 2022, 15, 3847. [Google Scholar] [CrossRef]
- Dudda, W. Influence of High Temperatures on the Mechanical Characteristics of 26H2MF and ST12T STEELS. Mater. Sci. 2019, 55, 435–439. [Google Scholar] [CrossRef]
- Dudda, W. Mechanical Characteristics of 26H2MF and St12T steels under compression at elevated temperatures. Strength Mater. 2020, 52, 325–328. [Google Scholar] [CrossRef]
- Ennis, P.J.; Czyrska-Filemonowicz, A. Recent advances in creep-resistant steels for power plant applications. Sadhana 2003, 28, 709–730. [Google Scholar] [CrossRef]
- Klotz, U.E.; Solenthaler, C.; Uggowitzer, P.J. Martensitic-austenitic 9–12% Cr steels—Alloy design, microstructural stability, and mechanical properties. Mater. Sci. Eng. A 2008, 476, 186–194. [Google Scholar] [CrossRef]
- Burzyński, W. Selected passages from Wodzimierz Burzyński´s doctoral dissertation: Study on material effort hypotheses. Eng. Trans. 2009, 57, 185–215. [Google Scholar]
Disclaimer/Publisher’s Note: The statements, opinions and data contained in all publications are solely those of the individual author(s) and contributor(s) and not of MDPI and/or the editor(s). MDPI and/or the editor(s) disclaim responsibility for any injury to people or property resulting from any ideas, methods, instructions or products referred to in the content. |
© 2025 by the author. Licensee MDPI, Basel, Switzerland. This article is an open access article distributed under the terms and conditions of the Creative Commons Attribution (CC BY) license (https://creativecommons.org/licenses/by/4.0/).
Share and Cite
Dudda, W. Mechanical Characteristics of 26H2MF and St12T Steels Under Torsion at Elevated Temperatures. Materials 2025, 18, 3204. https://doi.org/10.3390/ma18133204
Dudda W. Mechanical Characteristics of 26H2MF and St12T Steels Under Torsion at Elevated Temperatures. Materials. 2025; 18(13):3204. https://doi.org/10.3390/ma18133204
Chicago/Turabian StyleDudda, Waldemar. 2025. "Mechanical Characteristics of 26H2MF and St12T Steels Under Torsion at Elevated Temperatures" Materials 18, no. 13: 3204. https://doi.org/10.3390/ma18133204
APA StyleDudda, W. (2025). Mechanical Characteristics of 26H2MF and St12T Steels Under Torsion at Elevated Temperatures. Materials, 18(13), 3204. https://doi.org/10.3390/ma18133204