
Innovative Cross-Shaped SRC Column–RC Slab Connection: Experimental Investigation and Finite Element Analysis of Punching Shear Behavior


Abstract
1. Introduction
2. Experimental Research
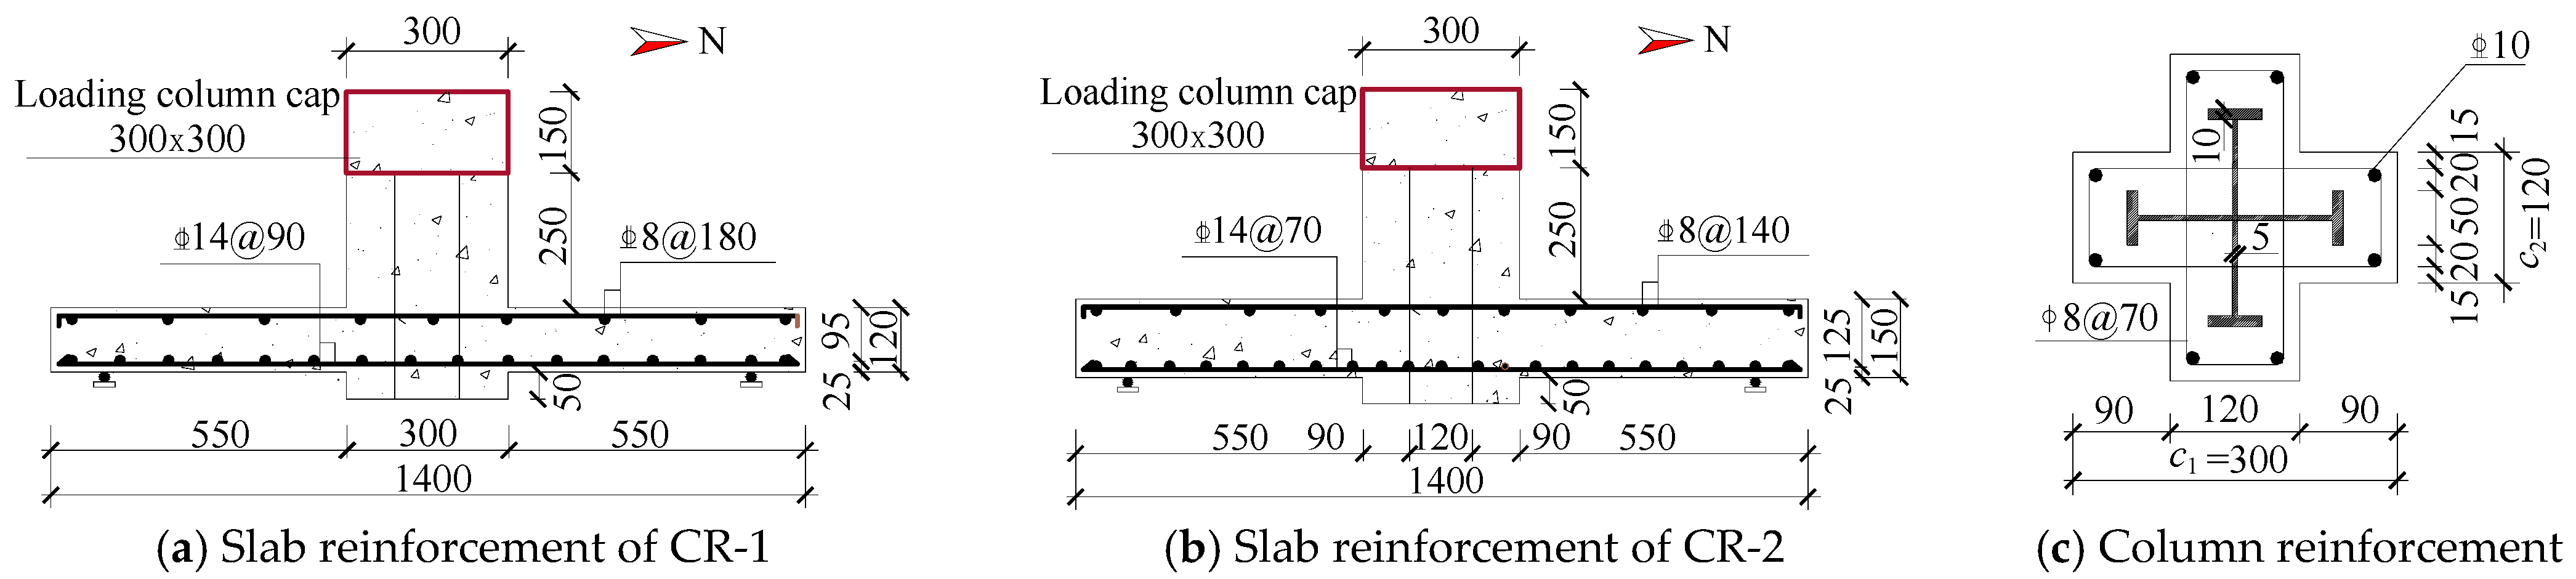
2.1. Materials Properties
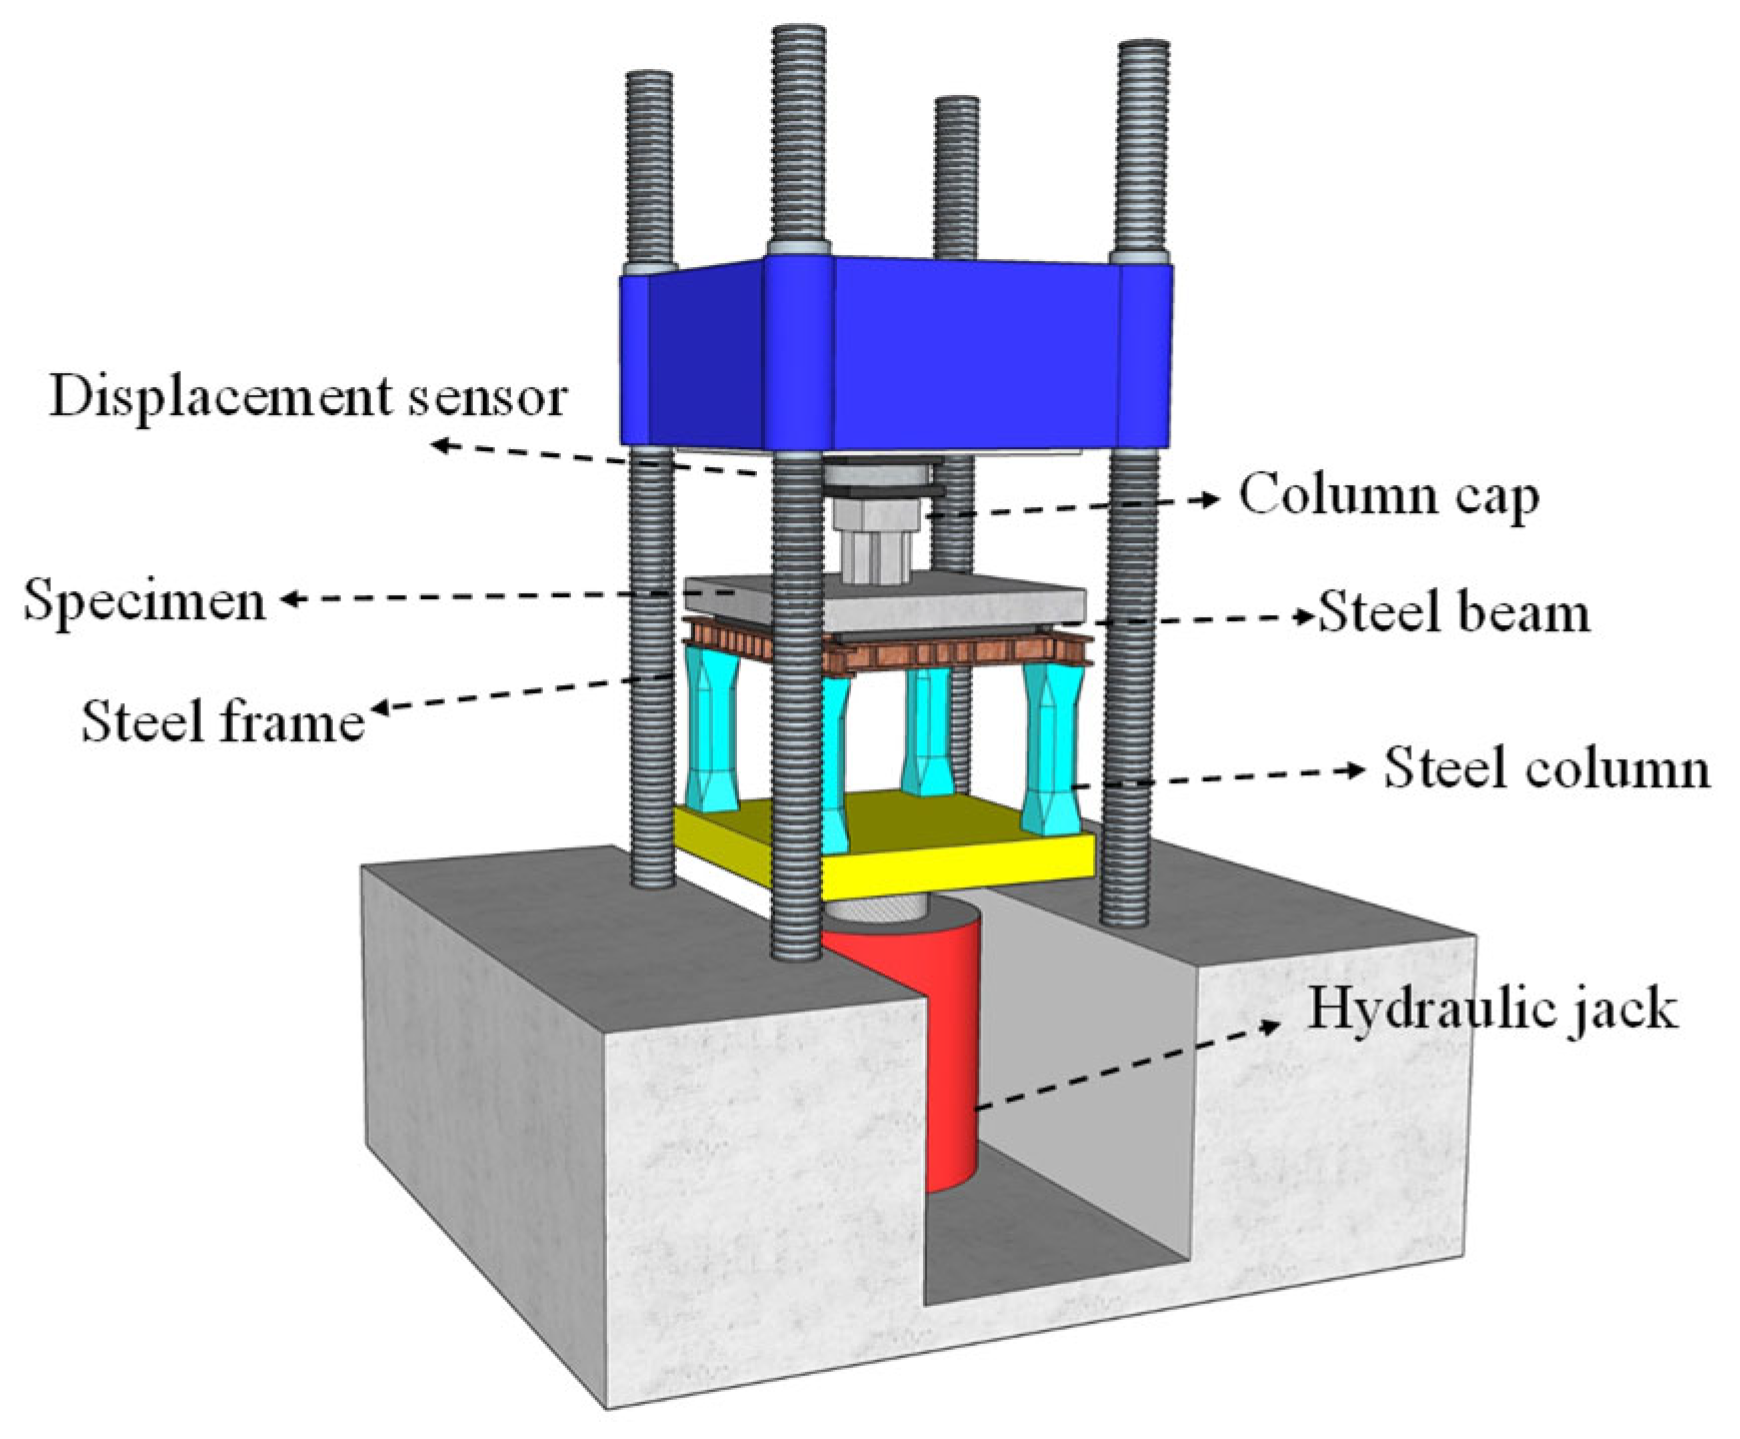
2.2. Testing Device
2.3. Measurement Scheme
3. Finite Element Simulations
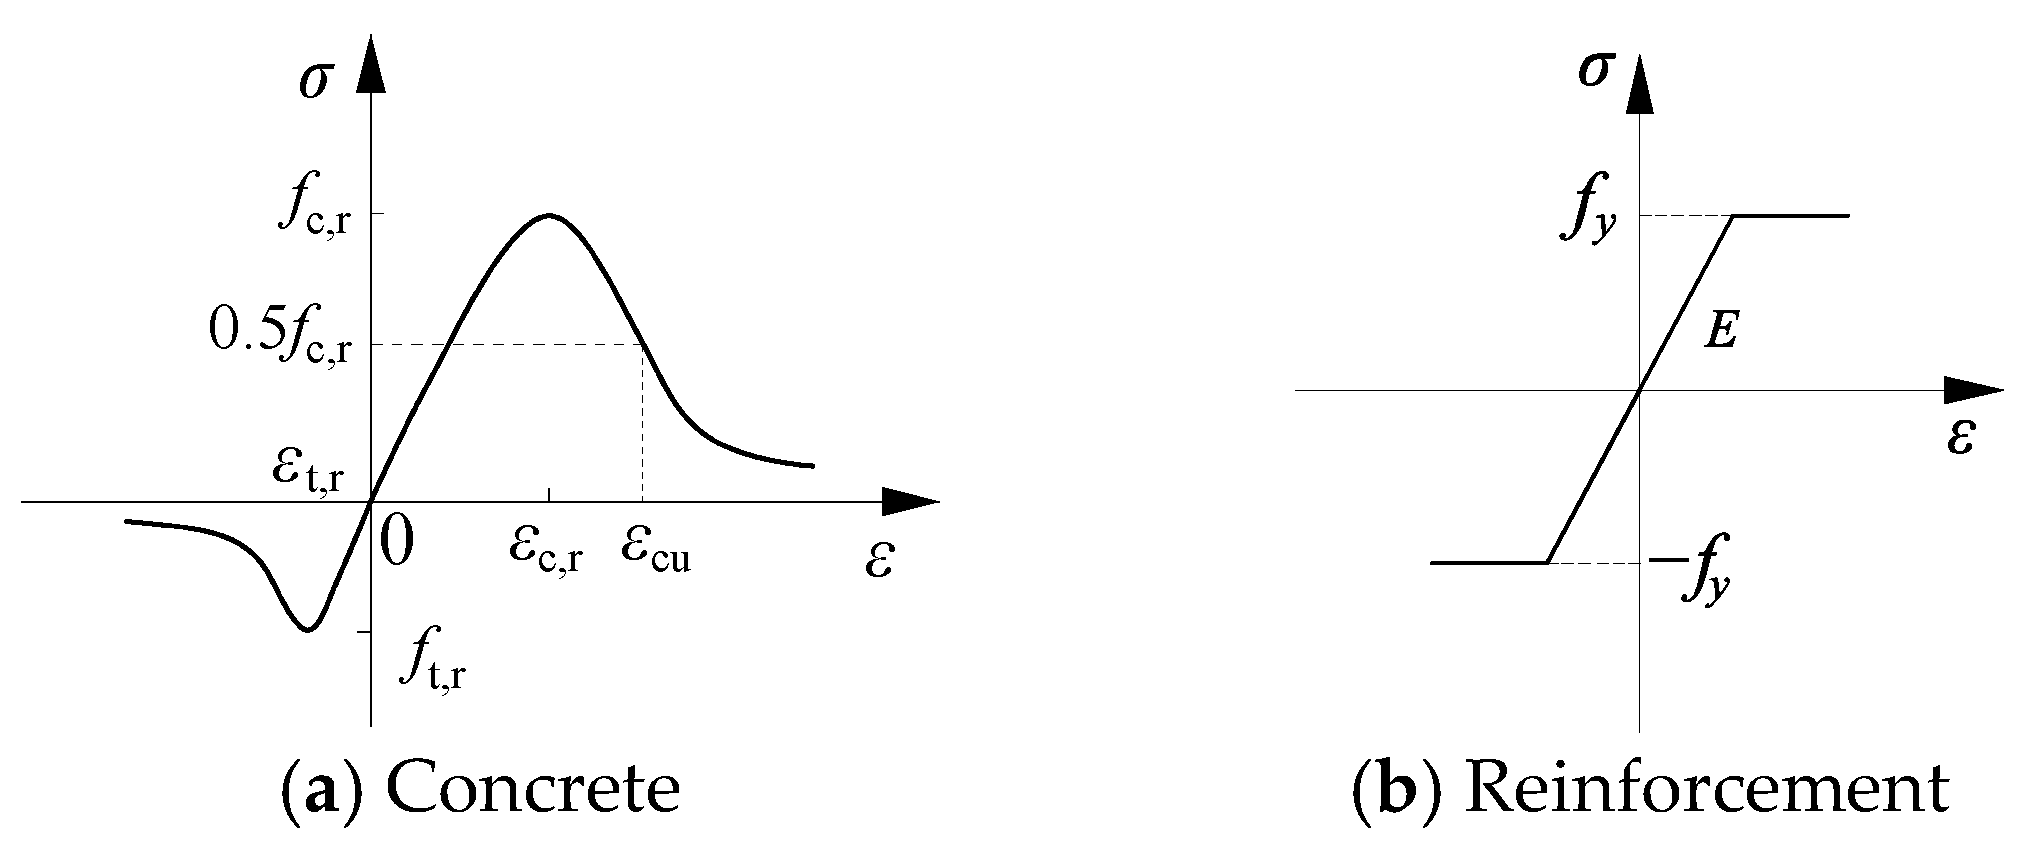
3.1. Material Constitutive Model
3.2. Unit Type and Grid Division
3.3. Interaction
3.4. Boundary Conditions and Loading
4. Comparison of Finite Element and Test Results
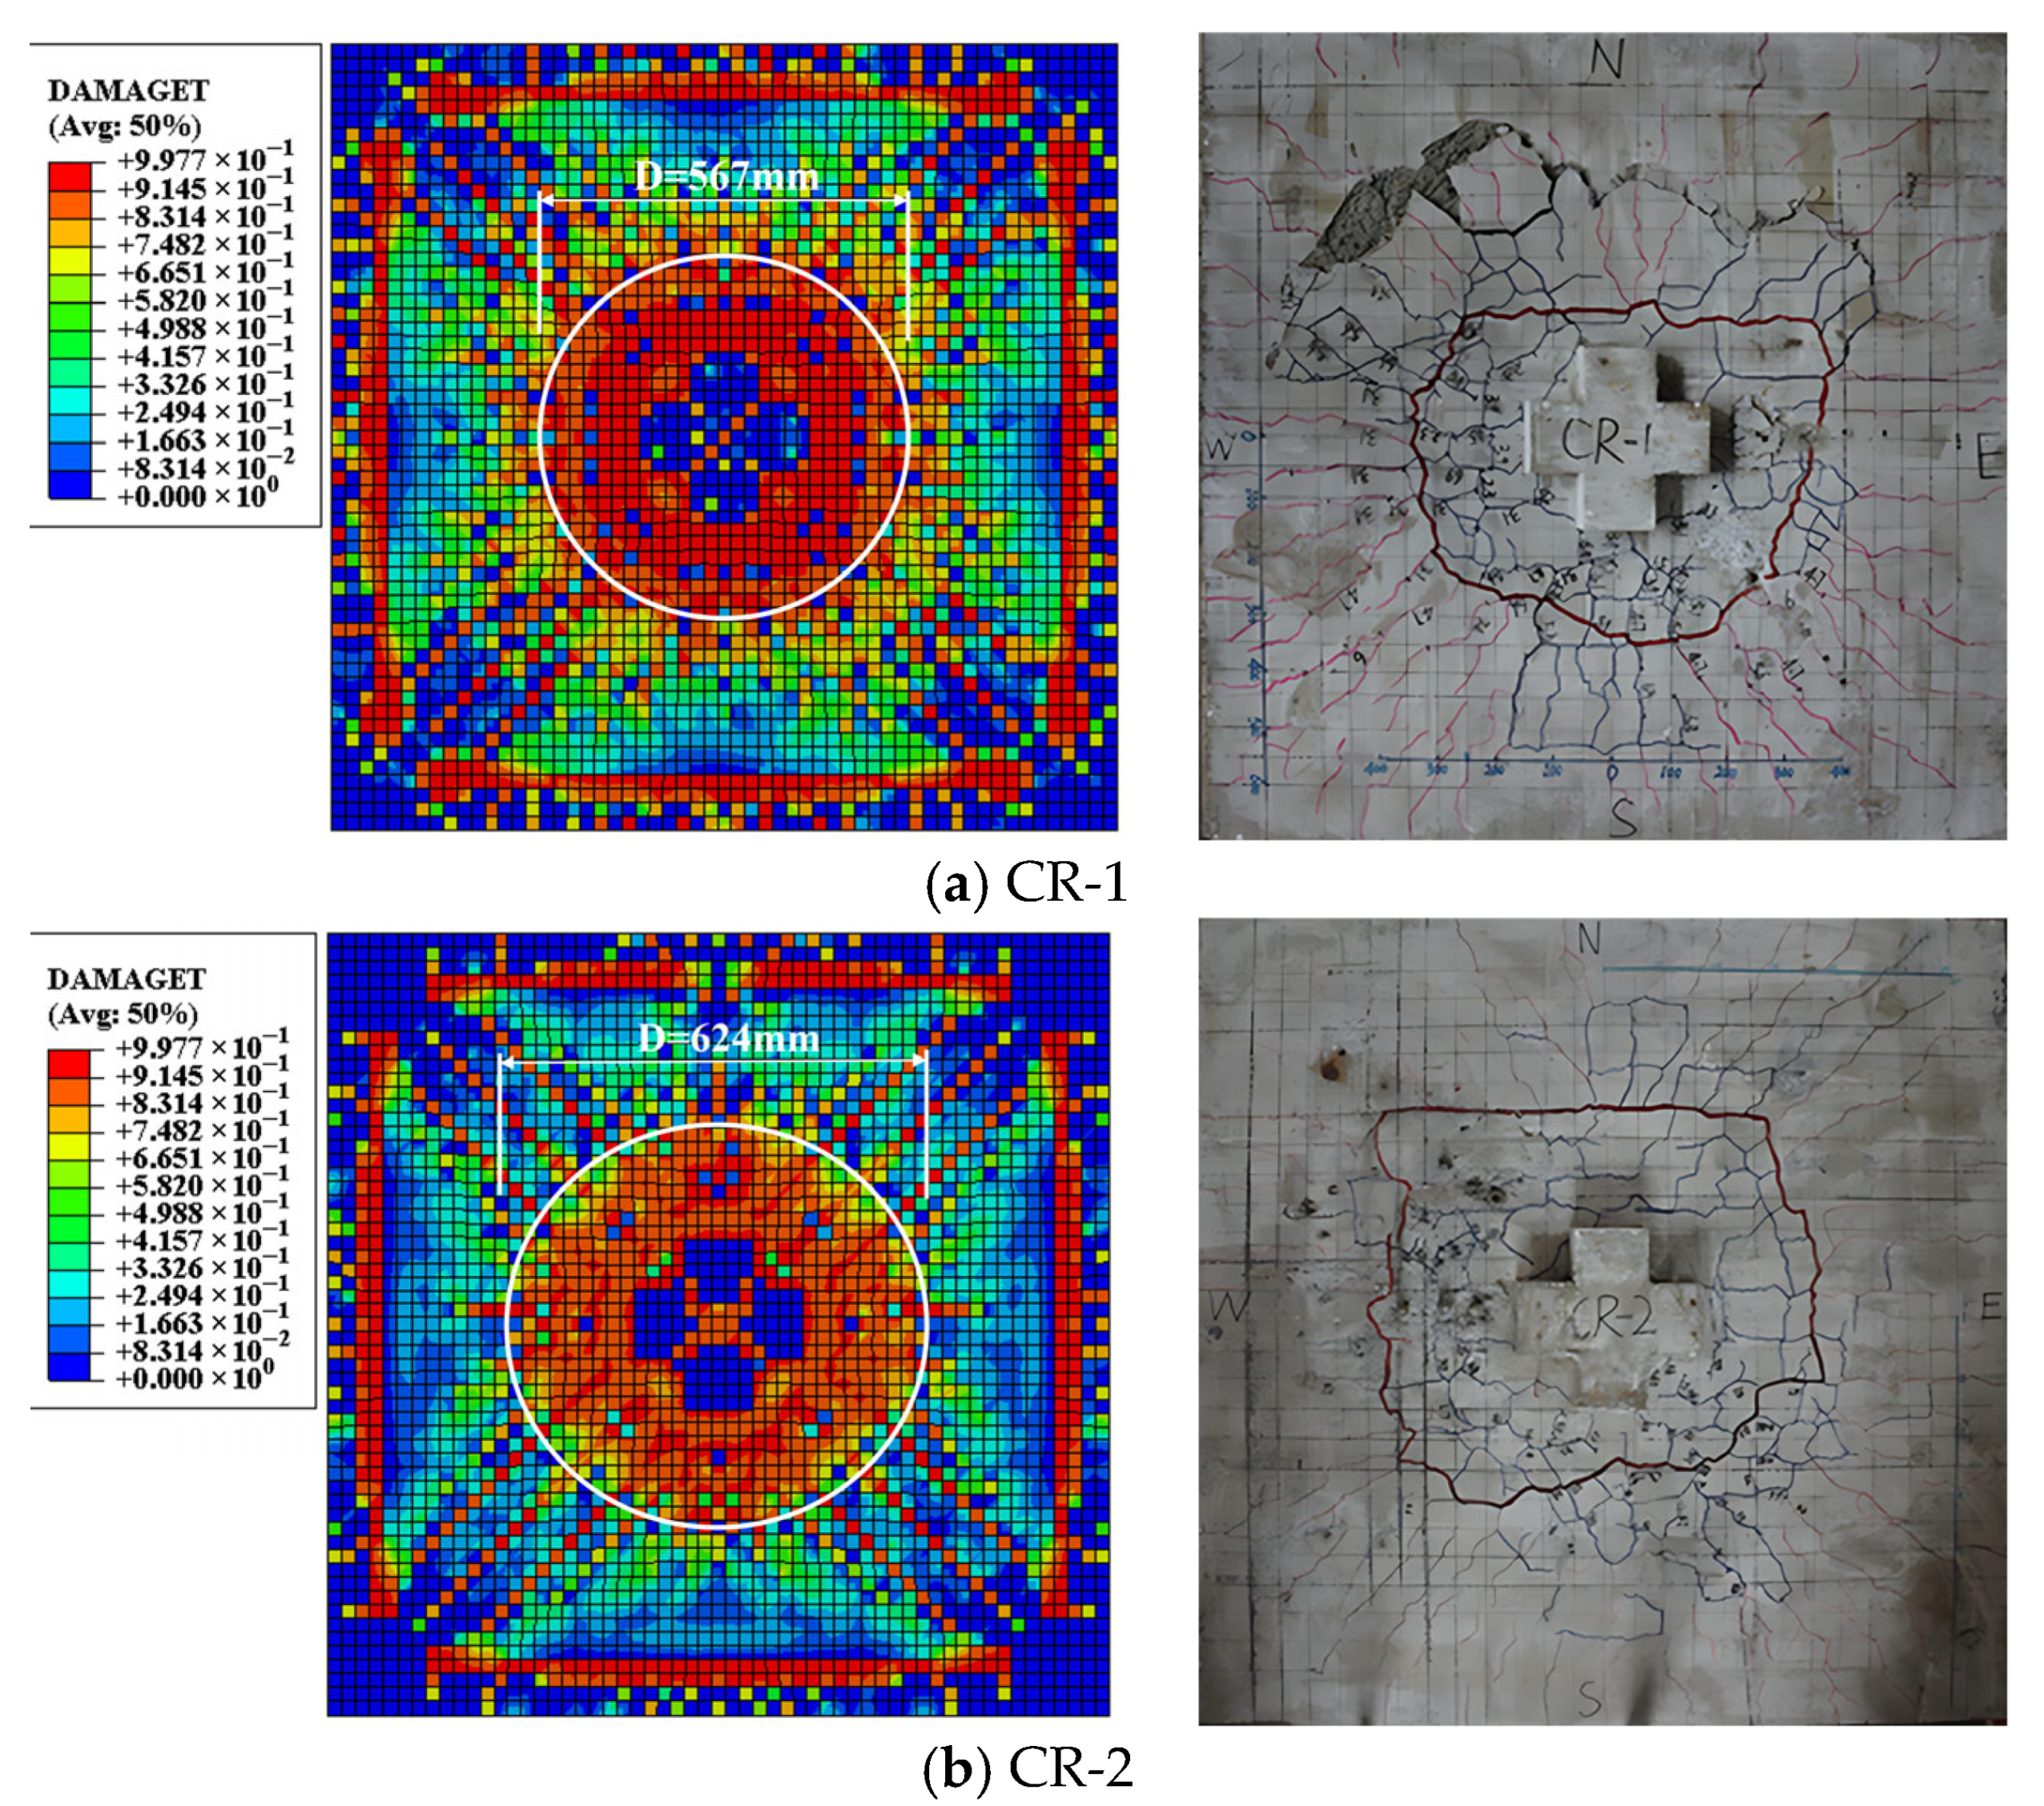
4.1. Failure Mode and Cracking Mode
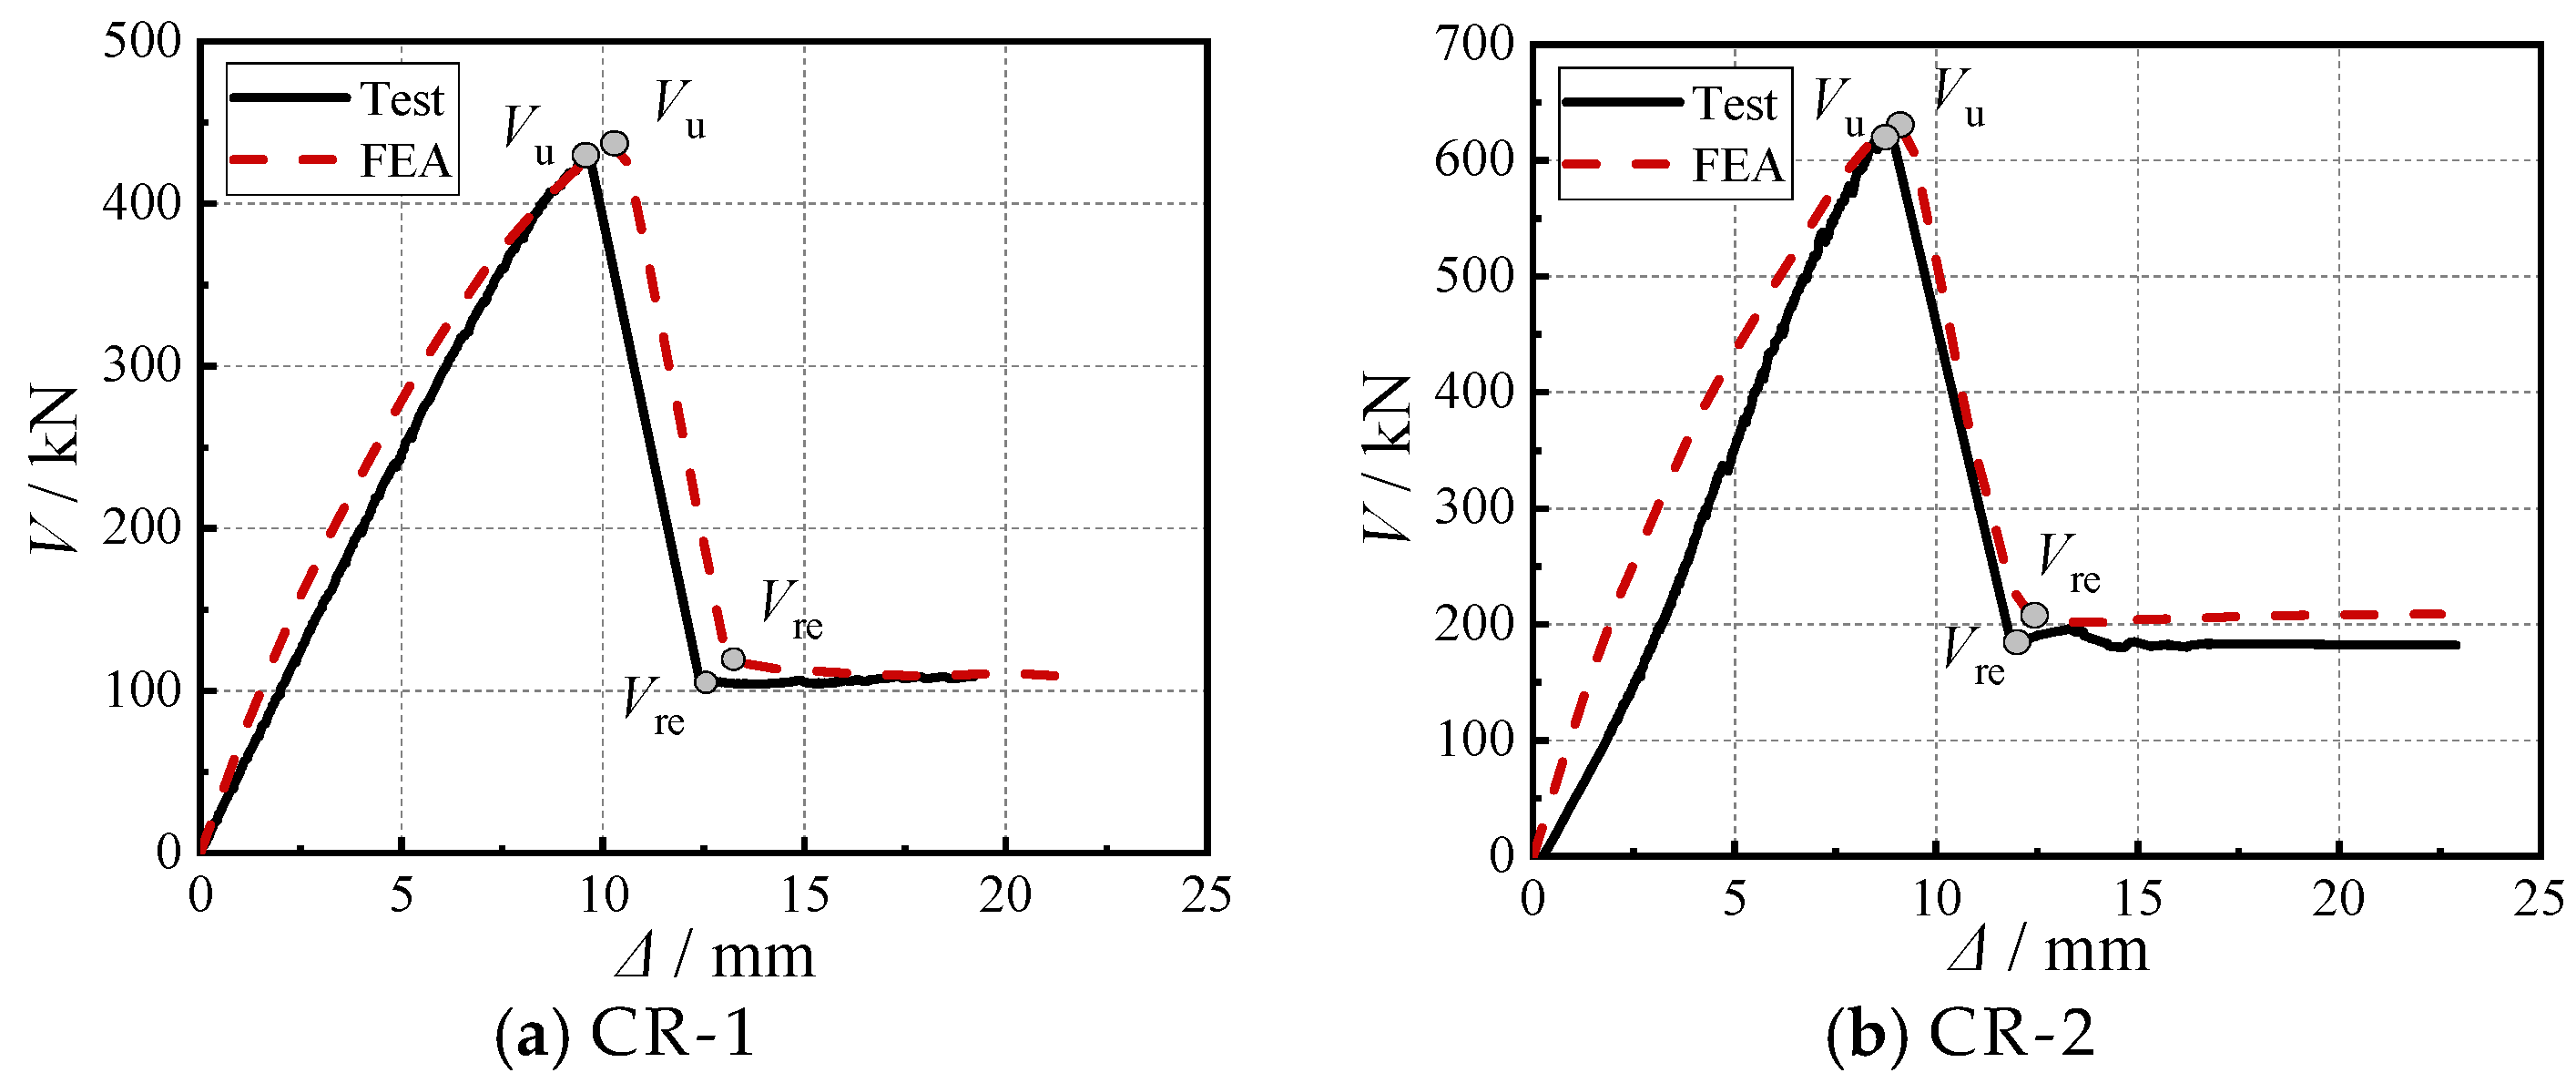
4.2. Comparative Analysis of Load–Displacement Curves
5. Parameter Analysis
5.1. Parameter Setting
5.2. Concrete Strength
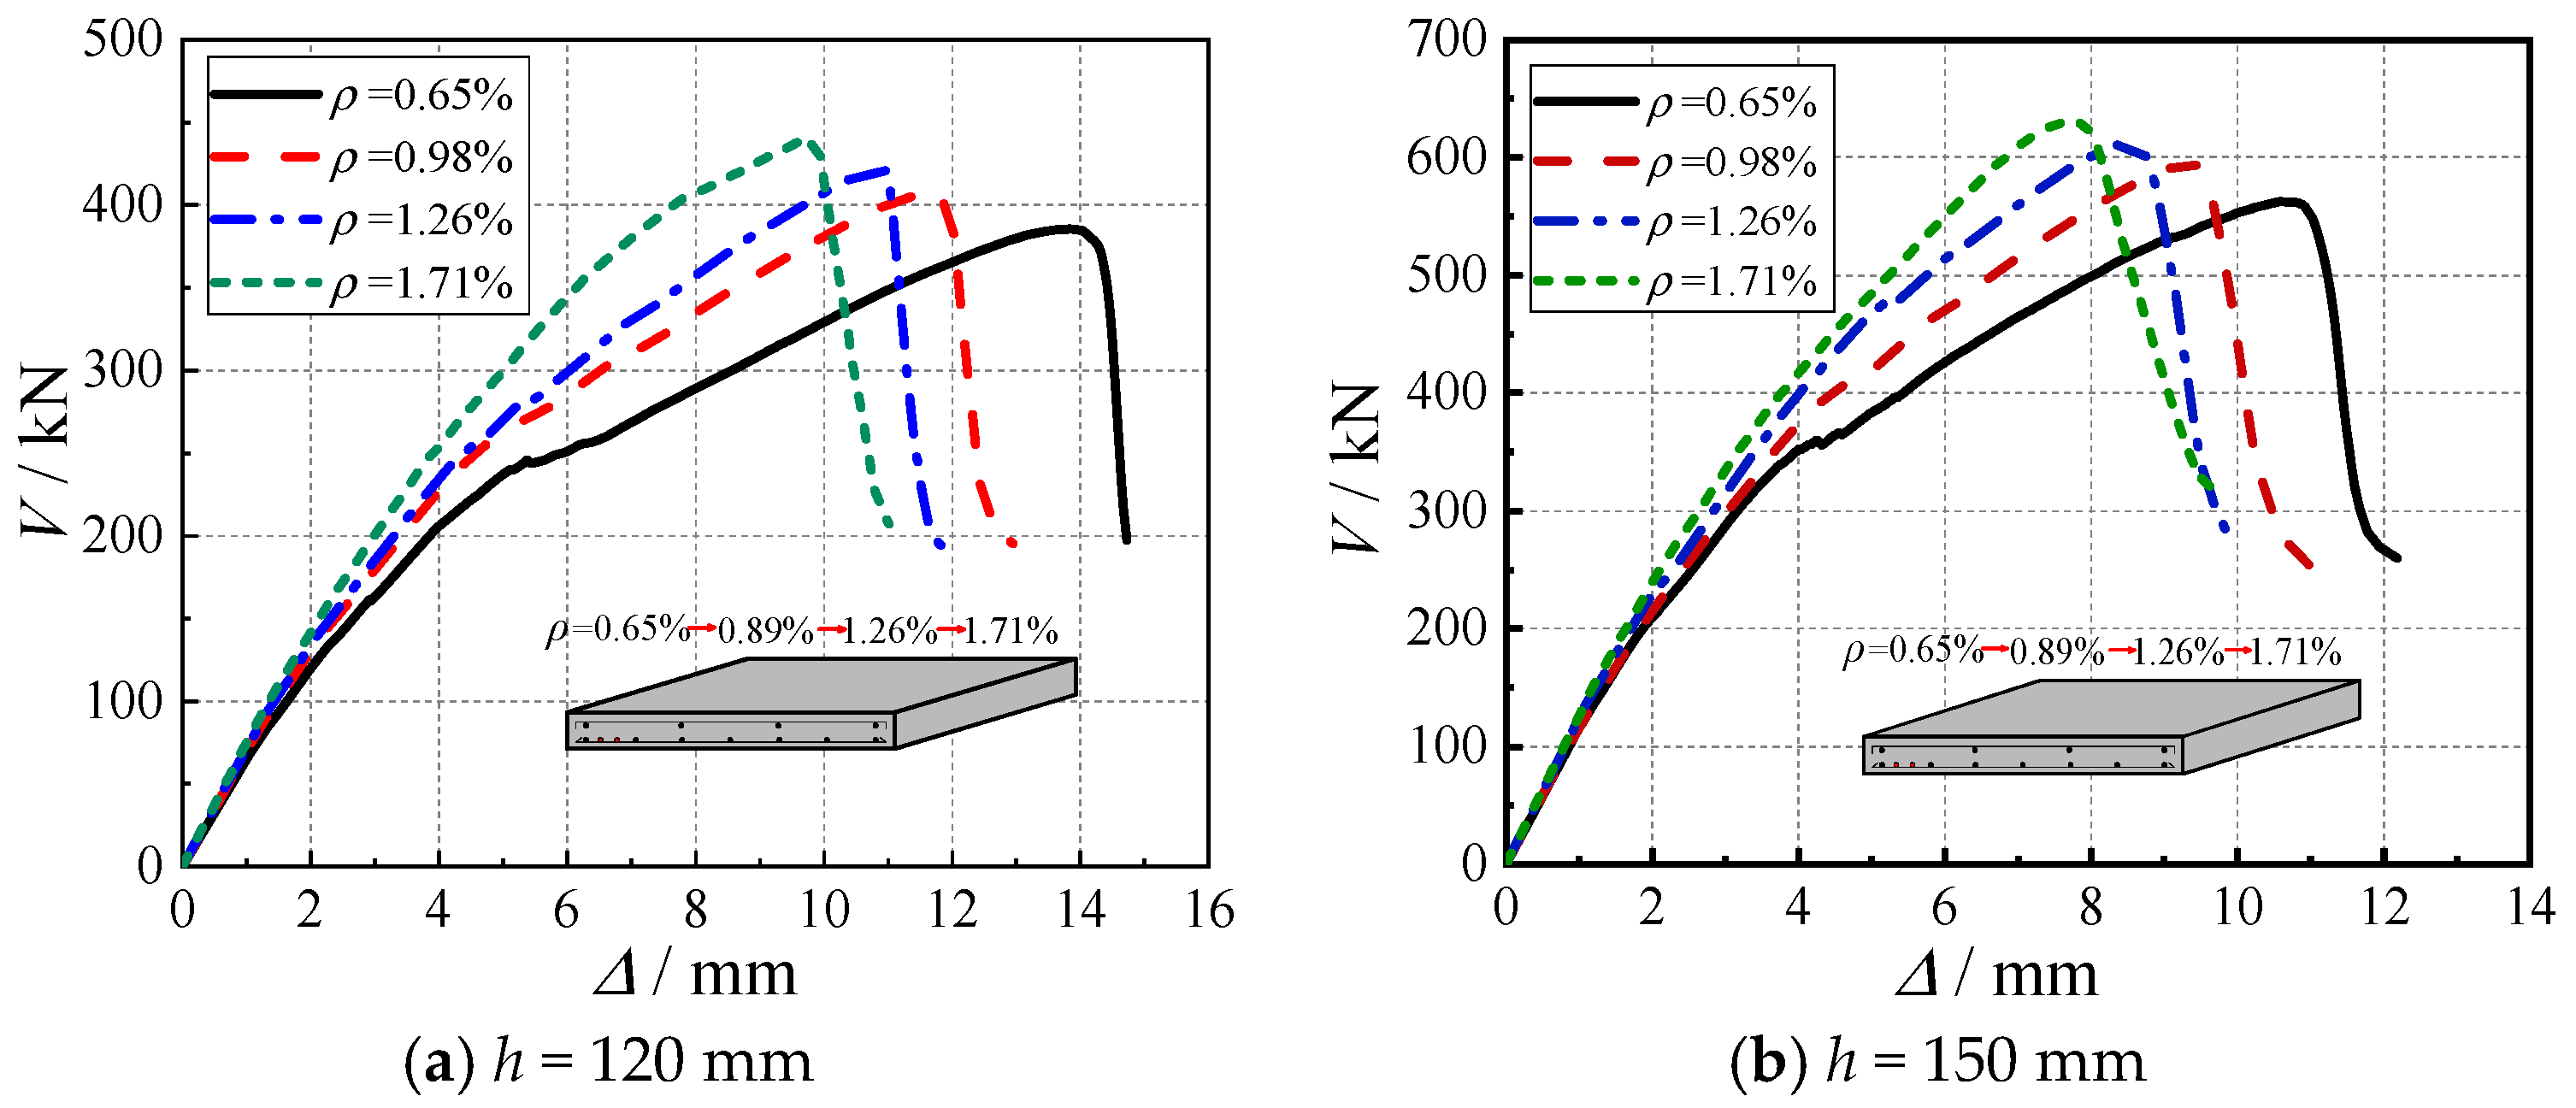
5.3. Flexural Reinforcement Ratio
5.4. Shear Span–Depth Ratio
5.5. Limb Height-to-Thickness Ratio
6. Comparison with Code Predictions
7. Conclusions
- (1)
- The connections exhibit characteristic punching shear failure mechanisms: initial radial tensile cracks develop at the slab bottom, followed by progressive tensile damage propagation along 45° inclined planes toward the top surface, concurrent with compressive damage evolution from the slab mid-depth upward. Catastrophic punching failure occurs once tensile damage reaches the top surface and the compressive concrete attains its ultimate strain.
- (2)
- Increasing concrete strength (C30 to C60) significantly enhances connection performance, yielding a 49% cumulative increase in ultimate capacity, a 33% increase in ductility coefficient, and an 18–22% improvement in stiffness. These benefits originate from improved crack resistance, optimized steel–concrete composite action, and more uniform stress distribution, providing scientific justification for selecting higher concrete grades in engineering applications.
- (3)
- The reinforcement ratio (ρ = 0.65–1.77%) demonstrates only marginal effects on punching shear capacity (maximum 12% increase) but substantially reduces ductility (34% deterioration). An optimal range of 0.8–1.2% is recommended to balance strength and ductility, while avoiding anchorage performance degradation and loss of stress redistribution capacity associated with higher reinforcement ratios.
- (4)
- Larger shear span–depth ratios (λ = 3–6) reduce ultimate capacity (24% reduction) while remarkably enhancing displacement capacity (133% increase) and ductility (33% higher coefficient). This behavior reflects a transition from brittle punching shear to a combined flexure–shear failure mode, driven by changes in moment-to-shear capacity ratios, offering valuable insights for ductile connection design.
- (5)
- Under constant cross-sectional area conditions, increasing the limb height-to-thickness ratio (c1/c2 = 2–4) improves both the ultimate load capacity (with a cumulative increase of 14%) and displacement capability (6%), with these effects being governed by the dual mechanisms of effective calculated sectional area and stress concentration. However, excessively high height-to-thickness ratios may induce stress concentration effects due to geometric discontinuities in column limbs, thereby diminishing the performance gains.
Author Contributions
Funding
Institutional Review Board Statement
Informed Consent Statement
Data Availability Statement
Conflicts of Interest
References
- Mahmoud, A.; Mostafa, H.; Mostafa, T.; Khater, A. Enhancement of punching shear behavior of reinforced concrete flat slabs using GFRP grating. Frat. Ed. Integrità Strutt. 2024, 18, 19–44. [Google Scholar] [CrossRef]
- Schmidt, P.; Kueres, D.; Hegger, J. Punching shear behavior of reinforced concrete flat slabs with a varying amount of shear reinforcement. Struct. Concr. 2020, 21, 235–246. [Google Scholar] [CrossRef]
- Xue, J.; Zhang, W.; Zhang, C.; Zhao, F. Analysis on punching shear behavior of an innovative connection between steel reinforced concrete T-shaped column and flat-concrete slab. Chin. Civ. Eng. J. 2022, 56, 1–13. (In Chinese) [Google Scholar]
- Isufi, B.; Almeida, A.; Marreiros, R.; Ramos, A.P.; Lúcio, V. Slab–column connection punching and ductility improvement methods for seismic response of buildings with flat slabs. Struct. Concr. 2022, 23, 1385–1398. [Google Scholar] [CrossRef]
- Vargas, D.; Lantsoght, E.O.L.; Genikomsou, A.S. Flat slabs in eccentric punching shear: Experimental database and code analysis. Buildings 2022, 12, 2092. [Google Scholar] [CrossRef]
- Xu, Q.Y.; Liu, Y.; Wang, J.F. Seismic performance of cross-shaped partially encased steel–concrete composite columns: Experimental and numerical investigations. Buildings 2024, 14, 1932. [Google Scholar] [CrossRef]
- Wang, J.M.; Zhu, Z.Y.; Wang, K. Study on seismic behavior of cross-shaped-steel-reinforced RPC columns. Buildings 2024, 14, 2310. [Google Scholar] [CrossRef]
- Sun, L.; Wei, Z.; Li, W.; Xiang, J. Seismic behaviour of cross-shaped steel fibre reinforced concrete columns. Arch. Civ. Mech. Eng. 2020, 20, 126. [Google Scholar] [CrossRef]
- Lin, R.K.; Jiang, Y.; Li, Y.; Yi, W.W. Experimental study on punching-shear resistance of reinforced concrete slab-column joints reinforced with SSF. Eng. Mech. 2024, 41, 156–168. [Google Scholar]
- Gomaa, A.M.; Lotfy, E.M.; Khafaga, S.A.; Hosny, S.; Ahmed, M.A. Experimental, numerical, and theoretical study of punching shear capacity of corroded reinforced concrete slab-column joints. Eng. Struct. 2023, 289, 116280. [Google Scholar] [CrossRef]
- Wu, Y.F.; Chen, H.; Peng, F.; Yi, W.J. Experimental investigation on punching shear mechanism of concrete interior slab-column connections without shear reinforcement. J. Struct. Eng. 2022, 148, 04021250. [Google Scholar] [CrossRef]
- ACI 318-14; Building Code Requirements for Structural Concrete and Commentary. American Concrete Institute: Farmington Hills, MI, USA, 2014.
- GB 50010-2015; Code for Design of Concrete Structures. China Construction Industry Press: Beijing, China, 2015. (In Chinese)
- Shen, L.; Shen, Y.; Liang, S. Reliability analysis of RC slab-column joints under punching shear load using a machine learning-based surrogate model. Buildings 2022, 12, 1750. [Google Scholar] [CrossRef]
- Jia, Y.; Chiang, J.C.L. Finite element analysis of punching shear of reinforced concrete slab–column connections with shear reinforcement. Appl. Sci. 2022, 12, 9584. [Google Scholar] [CrossRef]
- Yang, Y.Z.; Li, Y.; Zhou, D.X.; Lu, X.Z.; Sun, H.L. Fine finite element analysis of slab-column joints after punching shear. Eng. Mech. 2020, 37, 206–215. [Google Scholar]
- Setiawan, A.; Vollum, R.L.; Macorini, L.; Izzuddin, B.A. Numerical modelling of punching shear failure of reinforced concrete flat slabs with shear reinforcement. Mag. Concr. Res. 2021, 73, 3–17. [Google Scholar] [CrossRef]
- Choi, H.; Kim, D.J.; Shin, M. Finite element analysis of punching shear behavior of RC flat slabs using concrete damaged plasticity model. Comput. Concr. 2020, 25, 127–138. [Google Scholar]
- Wang, L.; Zhang, X.; Li, Y.; Li, Q. Punching shear behavior of slab-column connections reinforced with steel profiles: Experimental and numerical study. Structures 2023, 52, 784–798. [Google Scholar]
- Zhang, H.H.; Fan, Z.H.; Chen, R.S. Marching-on-in-degree solver of time-domain finite element-boundary integral method for transient electromagnetic analysis. IEEE Trans. Antennas Propag. 2013, 62, 319–326. [Google Scholar] [CrossRef]
- Baskaran, D.; Chockkalingam, U.; Senthil Muthalvan, R. Assessment of Sustainable Hybrid Formwork Systems Using Life Cycle Assessment and the Wear-Out Coefficient—A Case Study. Buildings 2025, 15, 1630. [Google Scholar] [CrossRef]
- Salama, A.E.; Hassan, M.; Benmokrane, B.; Ferrier, E. Modified strip model for punching-shear strength of FRP-reinforced concrete edge–column slab connections. Eng. Struct. 2020, 216, 110769. [Google Scholar] [CrossRef]
- GB50010-2010; China Code for Concrete Design of Structures. China Architecture & Building Press: Beijing, China, 2010.
- Oleiwi, M. Columns Cross-Section Shape Effect on Punching Shear in Reinforced Concrete Flat Slabs. J. Tech. 2023, 5, 148–155. [Google Scholar] [CrossRef]
- Jia, Y.; Luin, J.C.C. Finite Element Analysis of Reinforced Concrete Slab-Rectangular Column Connections Using ABAQUS. In Advances in Frontier Research on Engineering Structures; Springer: Singapore, 2023; pp. 33–44. [Google Scholar]
- EN 1992-1-1; Eurocode 2: Design of Concrete Structures, Part 1: General Rules and Rules for Buildings. Comité Européen de Normalisation: Bruxelles, Belgium, 2004.
- ACI 318-19; Building Code Requirements for Structural Concrete and Commentary. American Concrete Institute: Farmington Hills, MI, USA, 2019.


| Specimens | Limb Height | Limb Thickness | Reinforcement Ratio | Slab Thickness |
|---|---|---|---|---|
| c1 (mm) | c2 (mm) | ρ (%) | h (mm) | |
| CR-1 | 300 | 120 | 1.77 | 120 |
| CR-2 | 300 | 120 | 1.77 | 150 |
| fcu/MPa | Ec | u | ψ | e | σb1/σb2 | Kc | v |
|---|---|---|---|---|---|---|---|
| 35.6 | 31498.8 | 0.2 | 38 | 0.1 | 1.16 | 2/3 | 0.00001 |
| Specimens | Failure Area A/mm2 | Failure Perimeter Lp/mm | ||
|---|---|---|---|---|
| Test | FEA | Test | FEA | |
| CR-1 | 245,280 | 252,368 | 1667 | 1780 |
| CR-2 | 290,211 | 305,660 | 1854 | 1960 |
| Specimens | Ultimate Load Vu/kN | Residual Load Vre/kN | Vu | Vre | ||
|---|---|---|---|---|---|---|
| Test | FEA | Test | FEA | VTest/VFEA | VTest/VFEA | |
| CR-1 | 430.75 | 439.66 | 109.37 | 122.47 | 0.98 | 0.89 |
| CR-2 | 625.64 | 630.34 | 185.88 | 209.13 | 0.99 | 0.89 |
| Design Parameters | Specimens | Grades | h/mm | l0/mm | ρ/% | c1/c2 | |
|---|---|---|---|---|---|---|---|
| Concrete strength | C30 | C30 | 120 | 150 | 1200 | 1.77 | 2.5 |
| C40 | C40 | ||||||
| C50 | C50 | ||||||
| C60 | C60 | ||||||
| Reinforcement ratio | ρ = 0.65% | C40 | 120 | 150 | 1200 | 0.65 | 2.5 |
| ρ = 0.98% | 0.98 | ||||||
| ρ = 1.26% | 1.26 | ||||||
| ρ = 1.77% | 1.77 | ||||||
| Shear span–depth ratio | λ = 3 | C40 | 120 | 150 | 1200 | 1.77 | 2.5 |
| λ = 4 | 1500 | ||||||
| λ = 5 | 1800 | ||||||
| λ = 6 | 2100 | ||||||
| Limb height-to-thickness ratio | c1/c2 = 2 | C40 | 120 | 150 | 1200 | 1.77 | 2.0 |
| c1/c2 = 2.5 | 2.5 | ||||||
| c1/c2 = 3 | 3.0 | ||||||
| c1/c2 = 4 | 4.0 | ||||||
| Design Model | Punching Shear Equation (Vc) |
|---|---|
| GB50010-2015 | Vc = vcu0h0; ; βh is section height influence factor, for βh ≤ 800 mm, βh = 1.0, for βh > 2000 mm, βh = 0.8, with linear interpolation used for intermediate values; ft is concrete axial tensile strength; u0 is critical perimeter; h0 is effective slab thickness; η is size effect and section shape influence factor. |
| ACI 318-19 [27] | Vc = vcu0h0; ; f′c is concrete cylinder compressive strength; β is aspect ratio of the column; λ is lightweight concrete modification factor; αs is column position constant, with values 40 for middle columns, 30 for edge columns, 20 for corner columns. |
| Eurocode 2 (EC2 2004) | Vc = vcu0h0; ; CRd,C = 0.18; k is size effect factor, k = 1 + (200/d)1/2 ≤ 2.0; fck is concrete cylinder compressive strength; ρl is longitudinal reinforcement ratio, ρl = (ρlxρly)1/2 ≤ 0.02. |
| Design Codes | GB50010-2015 | ACI 318 | Eurocode 2 (EC2 2004) |
|---|---|---|---|
| Square column | 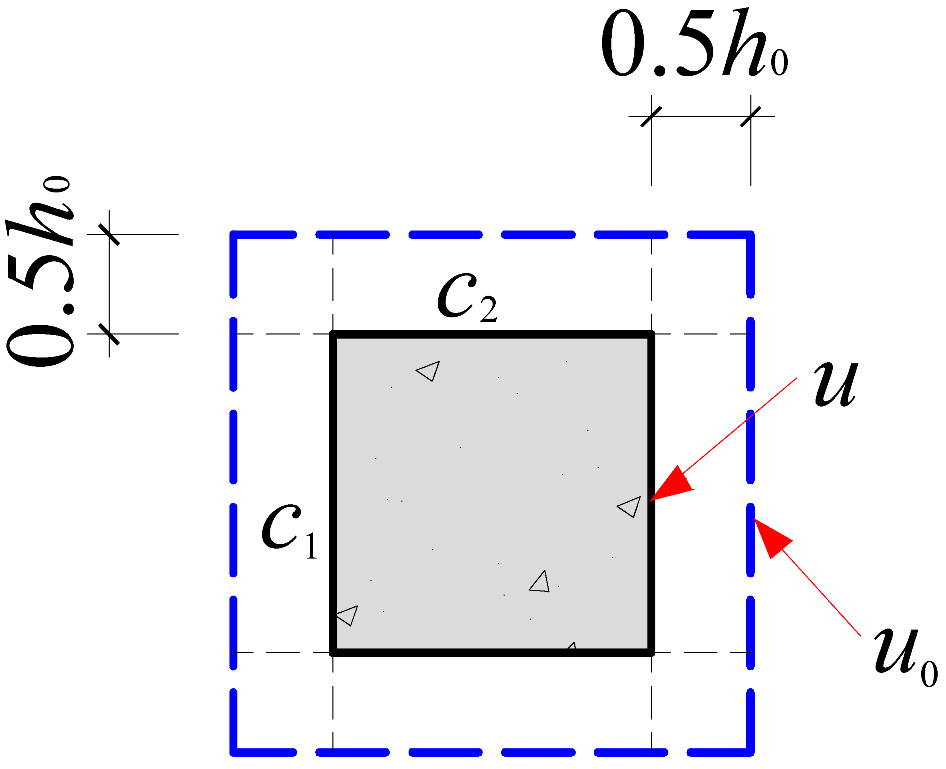 | 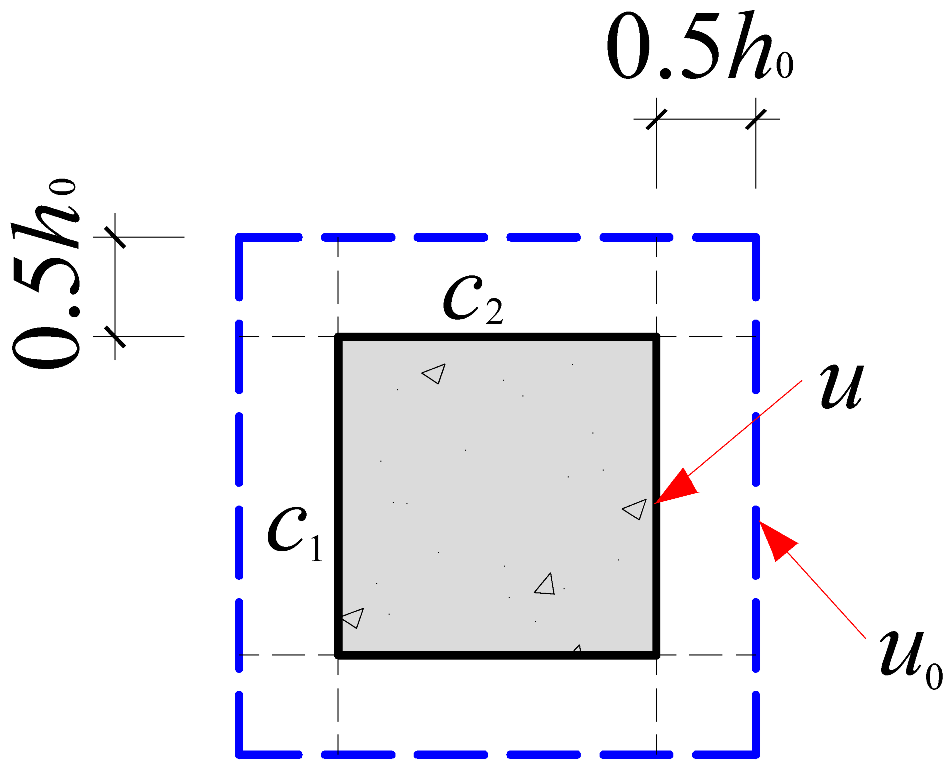 |  |
| Critical perimeter | u0 = 2(c1 + c2) + 4h0 | u0 = 2(c1 + c2) + 4h0 | u0 = 2(c1 + c2) + 4πh0 |
| Cross-shaped column | 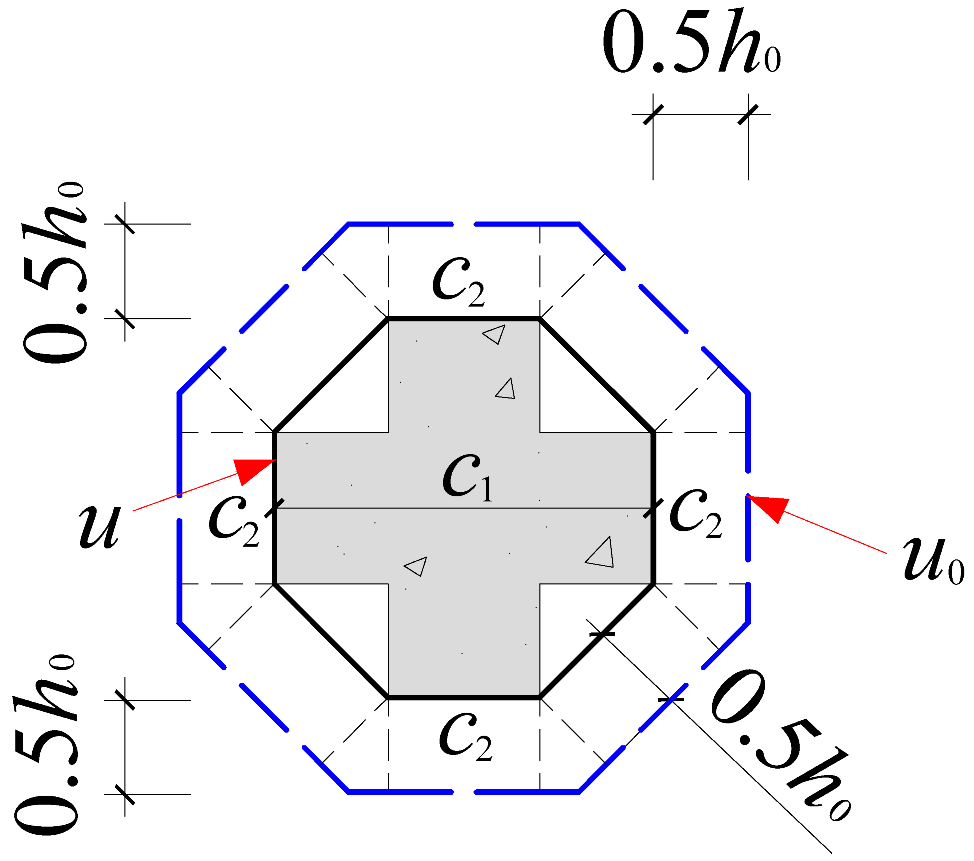 |  |  |
| Critical perimeter |
| Specimen No. | Section Dimensions | Slab Thickness | Compressive Strength | VTest/VFEA | VTest/VGB | VTest/VACI | VTest/VEC2 | |
|---|---|---|---|---|---|---|---|---|
| c1/mm | c2/mm | h0/mm | f′c/Mpa | |||||
| CR-1 | 300 | 120 | 95 | 26.4 | 0.98 | 1.84 | 1.97 | 1.54 |
| CR-2 | 300 | 120 | 125 | 26.4 | 0.99 | 1.89 | 2.02 | 1.45 |
| Mean | 0.99 | 1.86 | 2.00 | 1.50 | ||||
| SD | 0.01 | 0.03 | 0.04 | 0.06 | ||||
| COV% | 0.01 | 0.02 | 0.02 | 0.04 | ||||
Disclaimer/Publisher’s Note: The statements, opinions and data contained in all publications are solely those of the individual author(s) and contributor(s) and not of MDPI and/or the editor(s). MDPI and/or the editor(s) disclaim responsibility for any injury to people or property resulting from any ideas, methods, instructions or products referred to in the content. |
© 2025 by the authors. Licensee MDPI, Basel, Switzerland. This article is an open access article distributed under the terms and conditions of the Creative Commons Attribution (CC BY) license (https://creativecommons.org/licenses/by/4.0/).
Share and Cite
Zhang, W.; Xue, J.; Xu, J.; Li, B. Innovative Cross-Shaped SRC Column–RC Slab Connection: Experimental Investigation and Finite Element Analysis of Punching Shear Behavior. Materials 2025, 18, 3159. https://doi.org/10.3390/ma18133159
Zhang W, Xue J, Xu J, Li B. Innovative Cross-Shaped SRC Column–RC Slab Connection: Experimental Investigation and Finite Element Analysis of Punching Shear Behavior. Materials. 2025; 18(13):3159. https://doi.org/10.3390/ma18133159
Chicago/Turabian StyleZhang, Wei, Jianyang Xue, Jinjun Xu, and Baoxin Li. 2025. "Innovative Cross-Shaped SRC Column–RC Slab Connection: Experimental Investigation and Finite Element Analysis of Punching Shear Behavior" Materials 18, no. 13: 3159. https://doi.org/10.3390/ma18133159
APA StyleZhang, W., Xue, J., Xu, J., & Li, B. (2025). Innovative Cross-Shaped SRC Column–RC Slab Connection: Experimental Investigation and Finite Element Analysis of Punching Shear Behavior. Materials, 18(13), 3159. https://doi.org/10.3390/ma18133159