
Composition Design of a Novel High-Temperature Titanium Alloy Based on Data Augmentation Machine Learning


Abstract

1. Introduction
2. Material Design and Experiment
2.1. Alloy Design Framework
2.2. Dataset Establishment
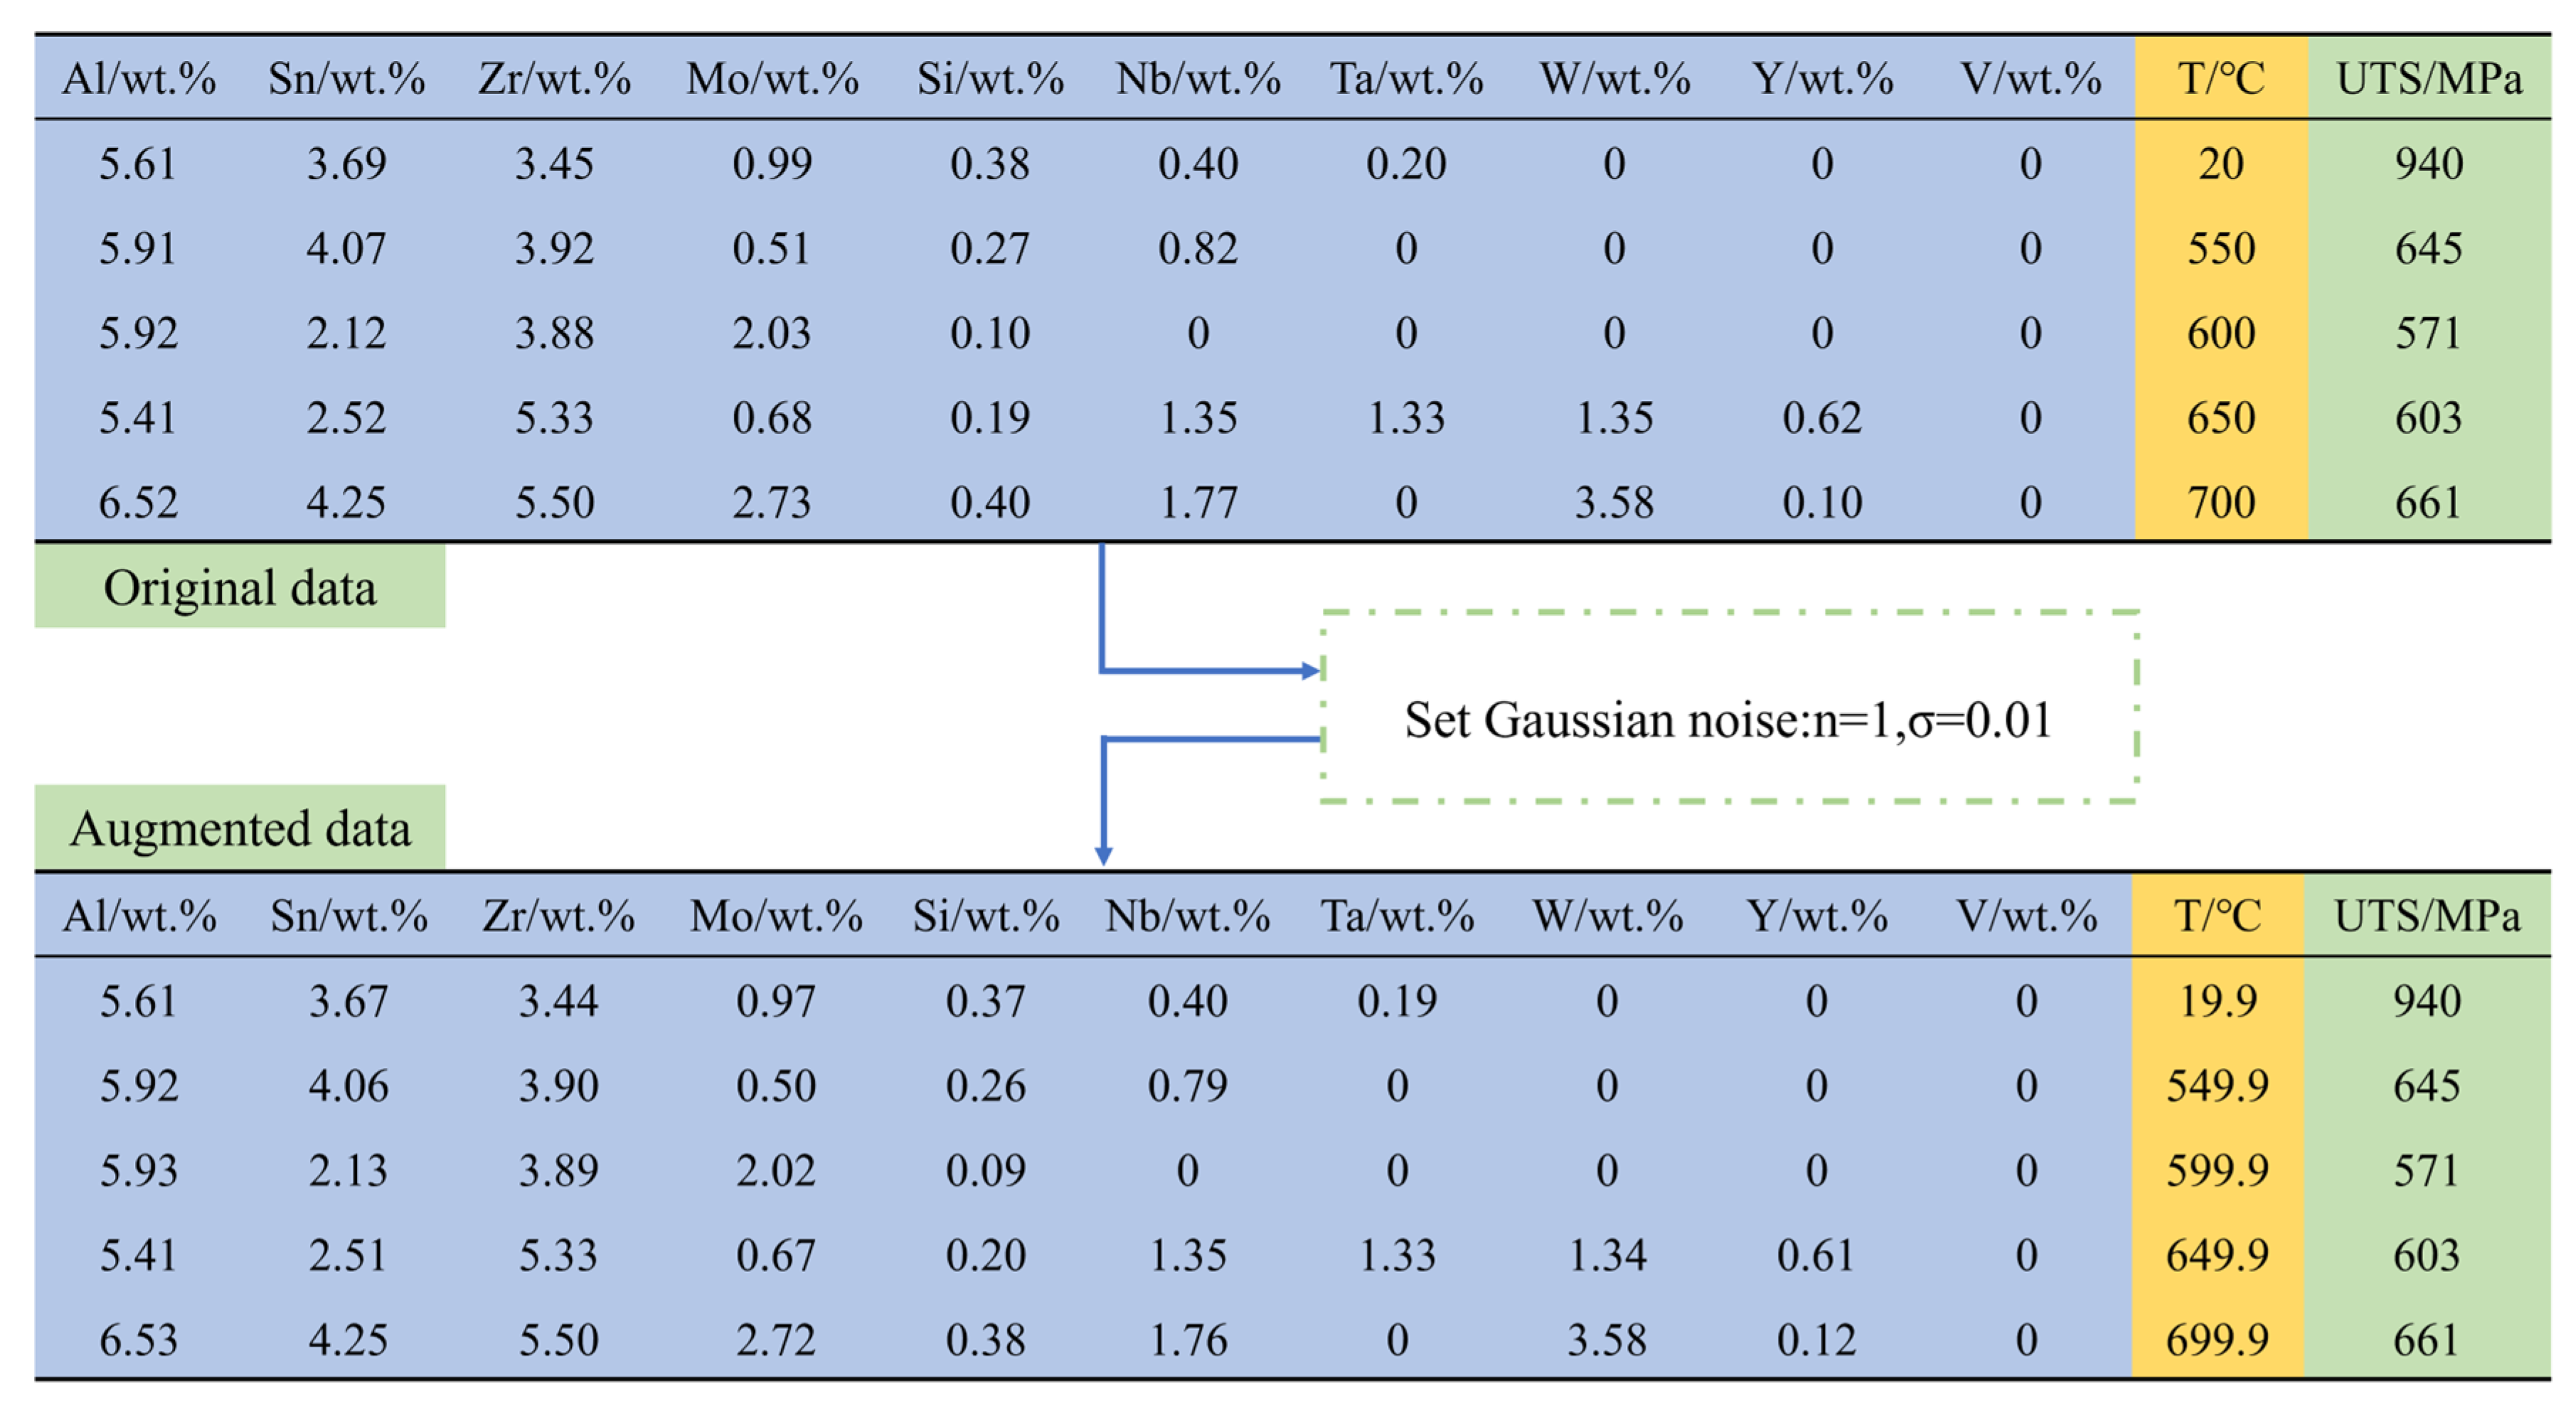
2.3. Data Augmentation
2.4. Model Establishment and Evaluation
2.5. Alloy Design
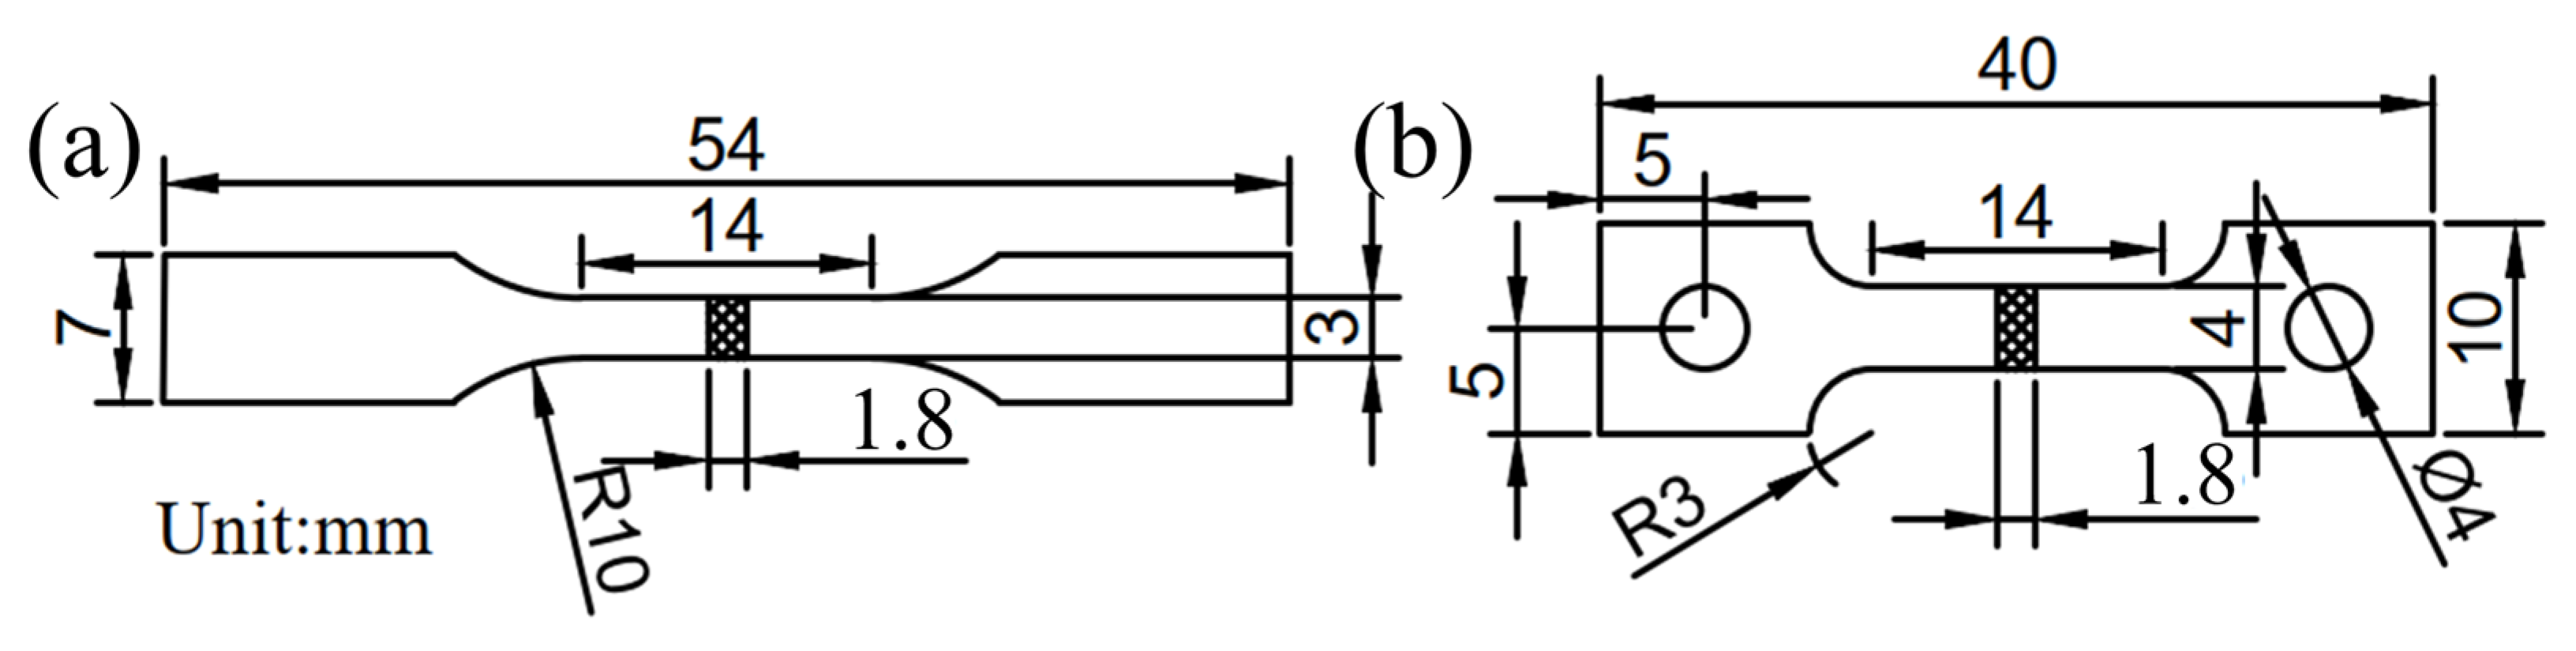
2.6. Experiment
3. Results and Discussion
3.1. Gaussian Enhancement
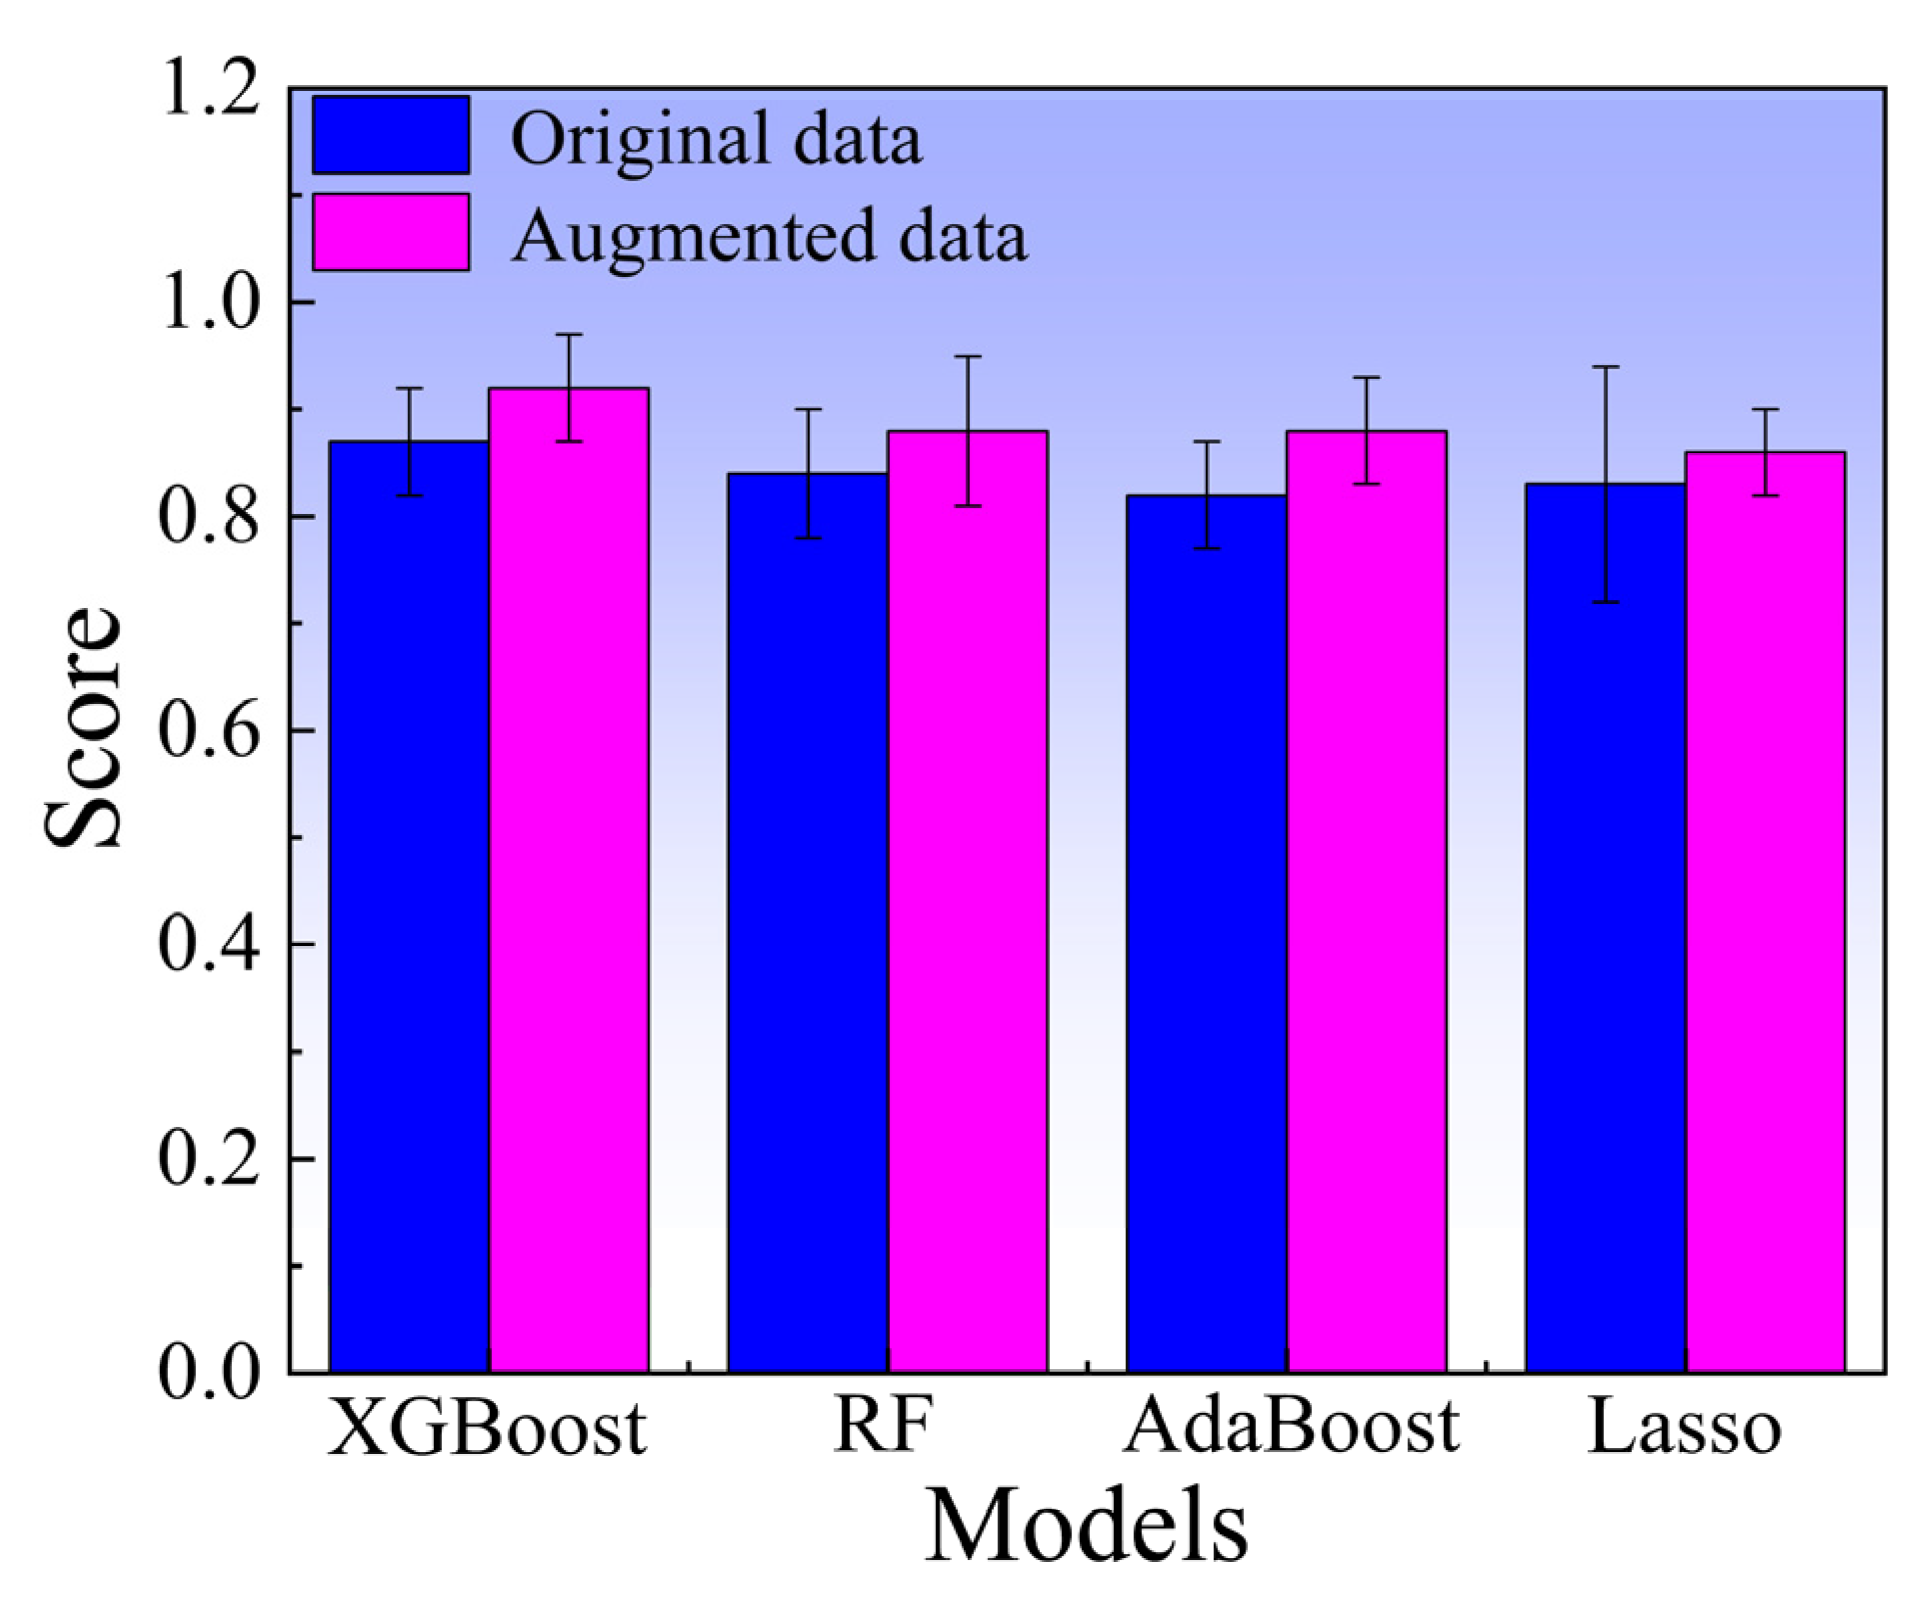
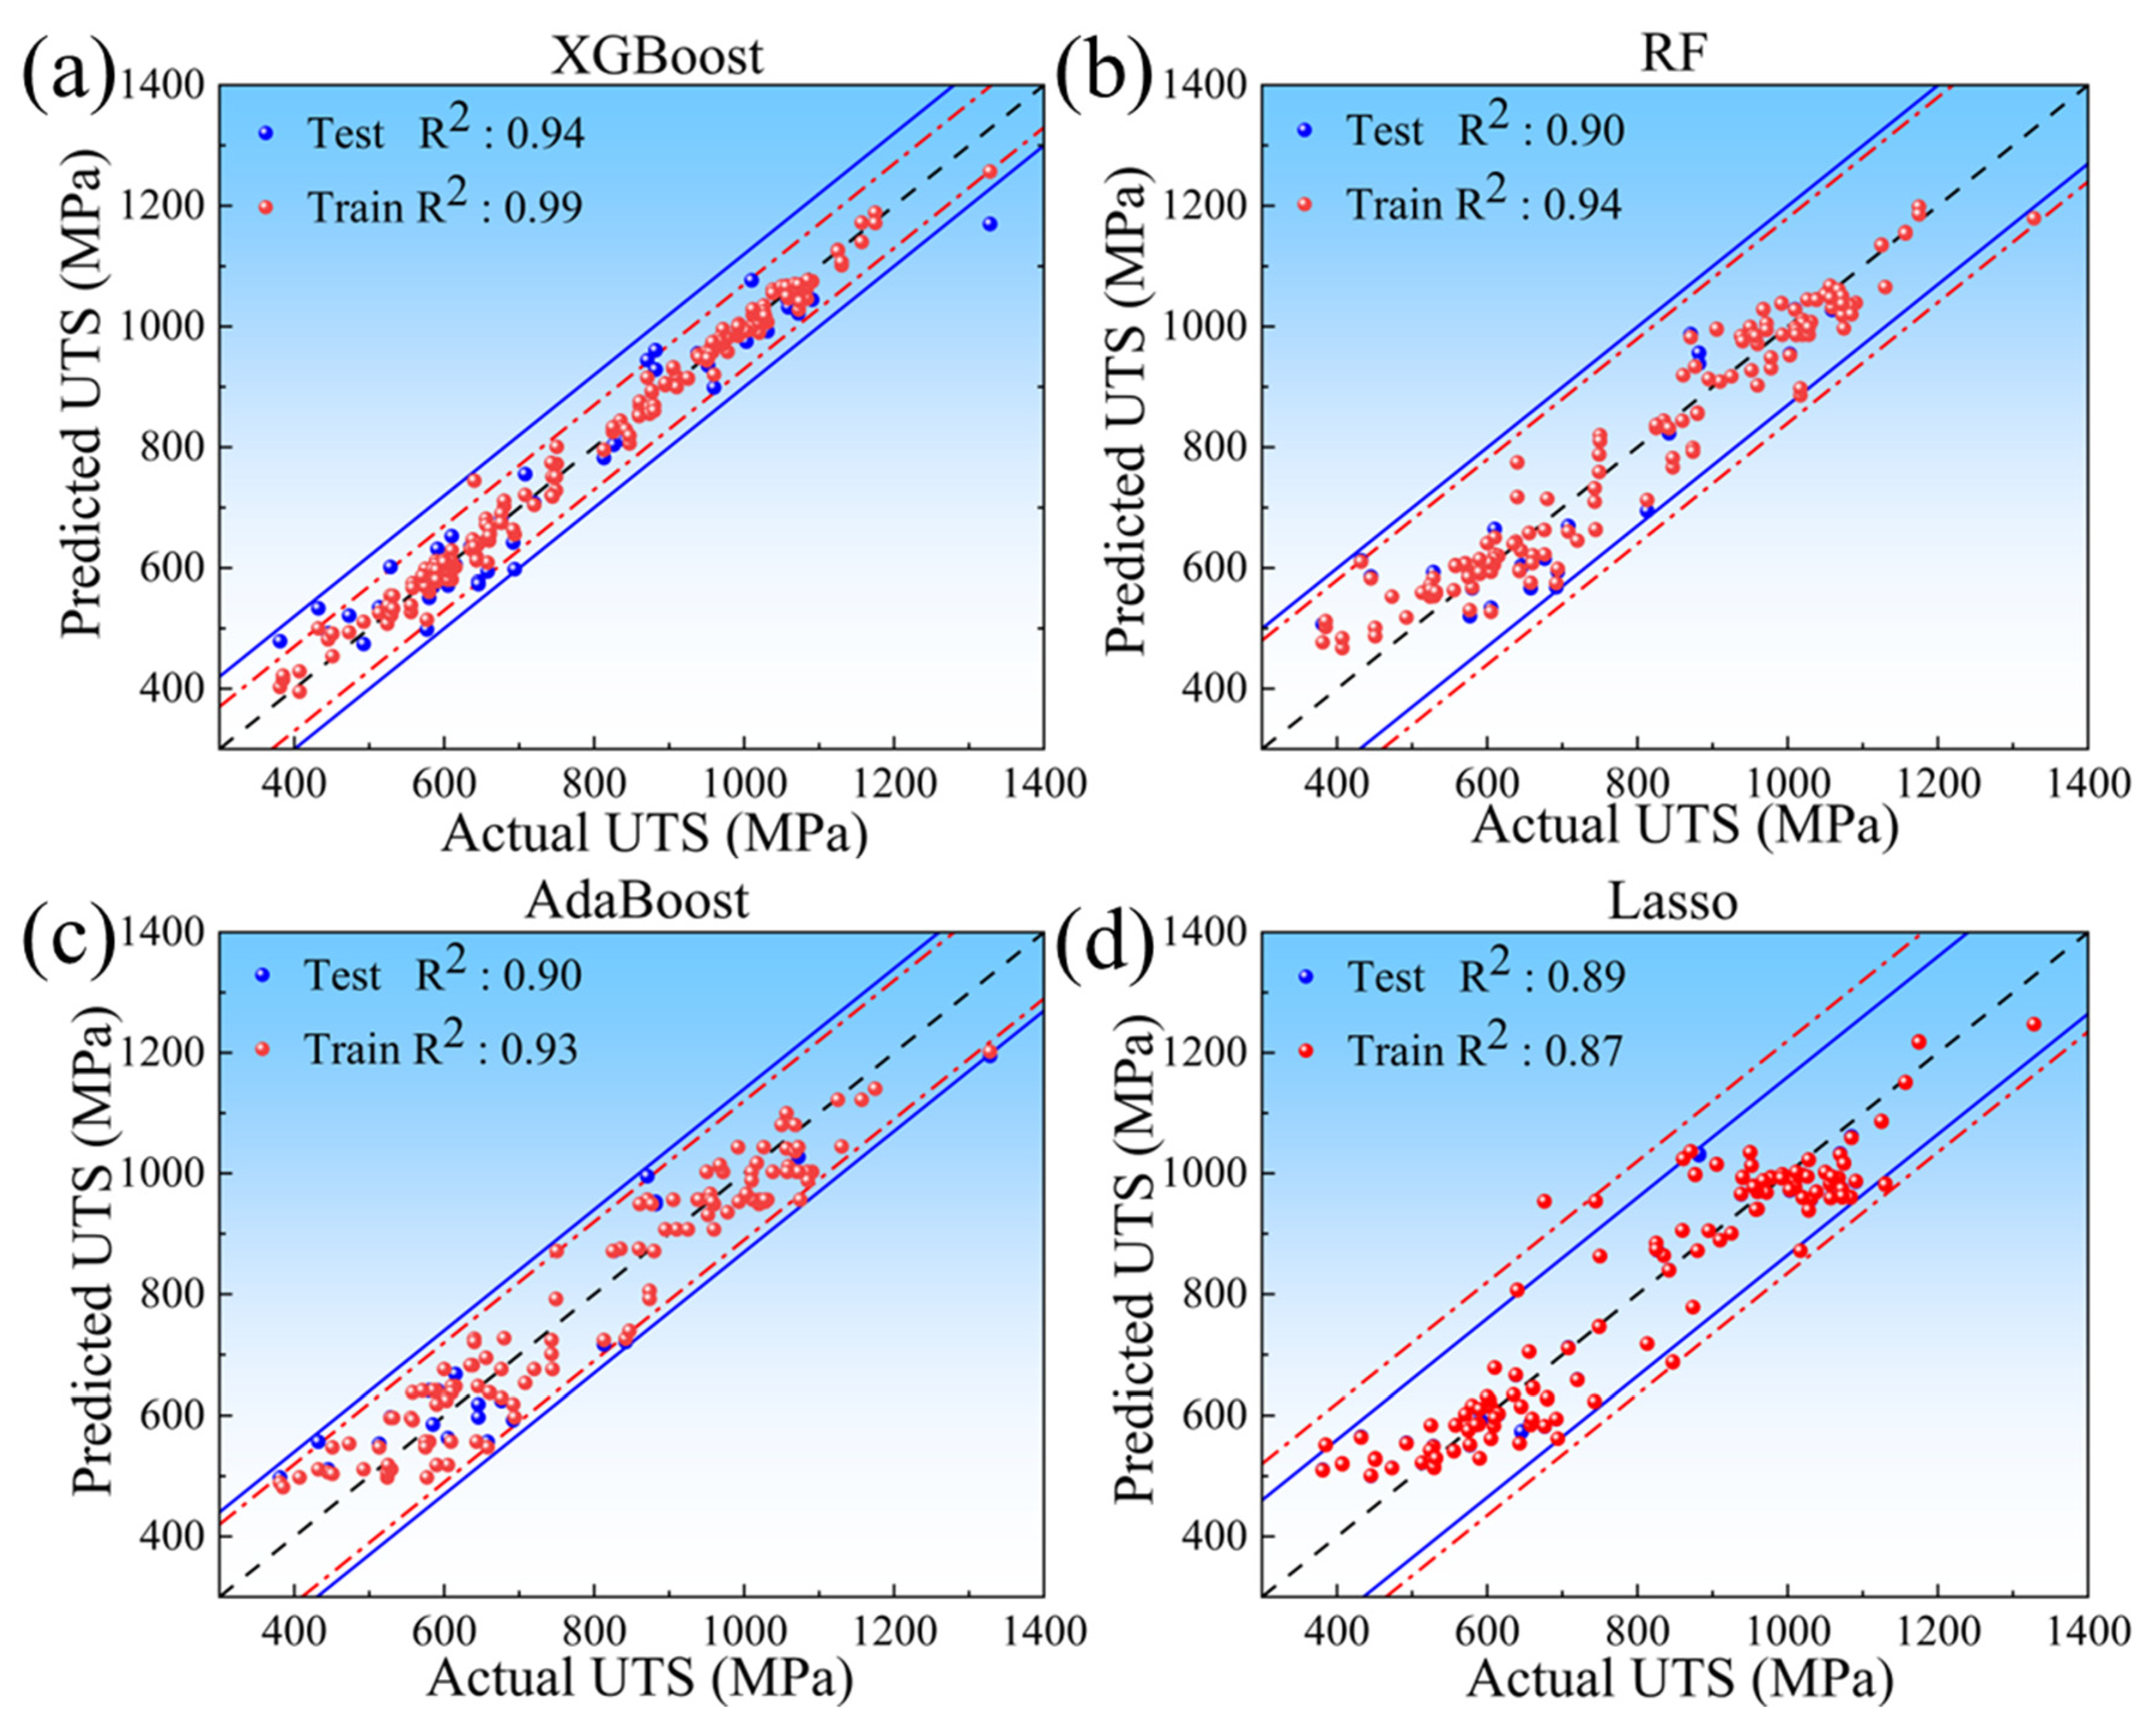
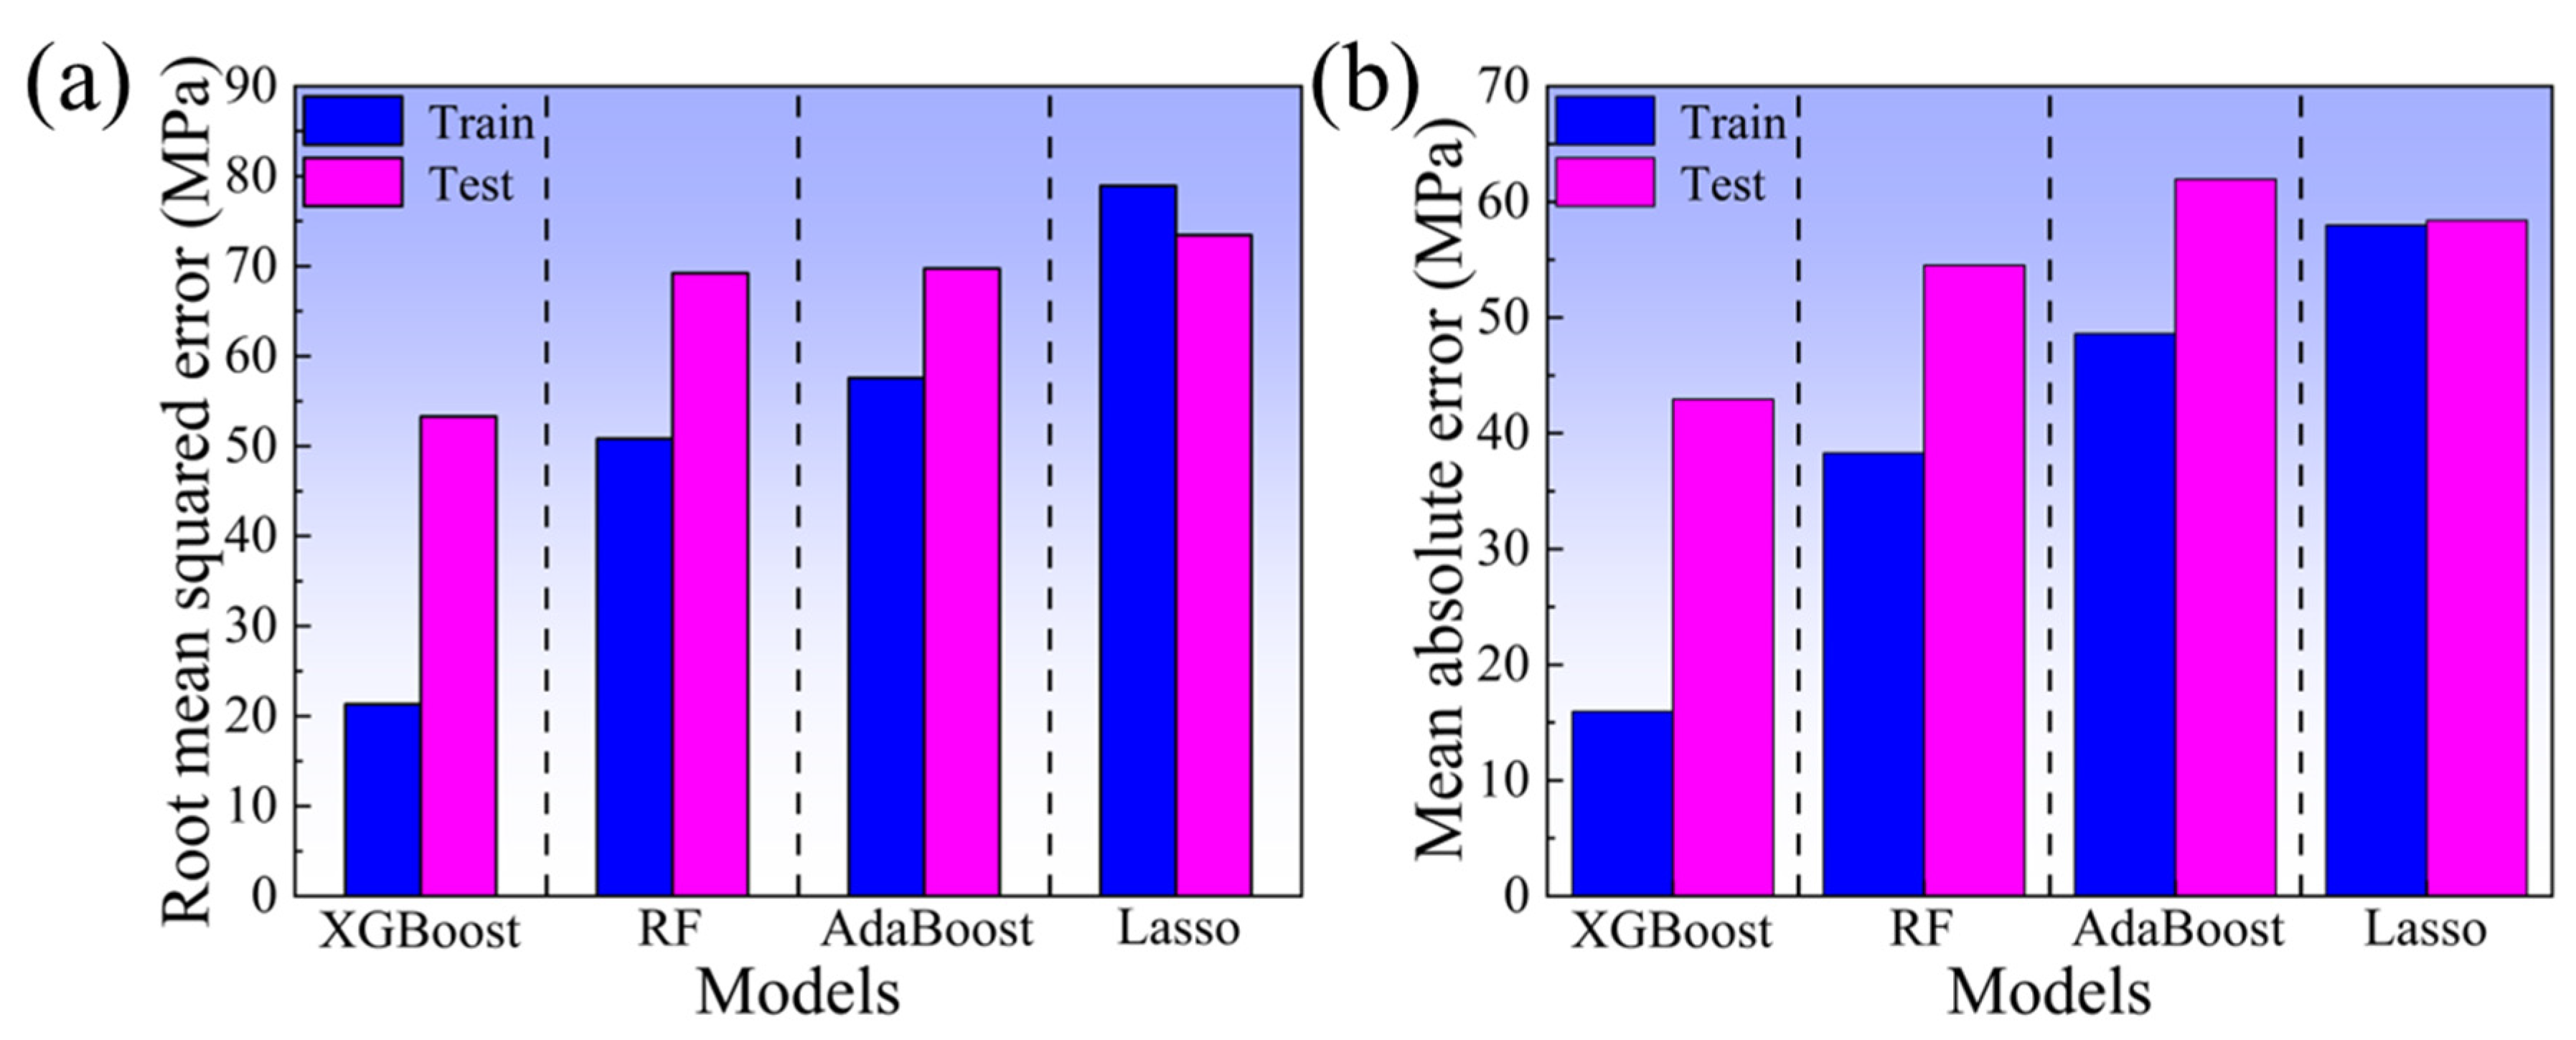
3.2. Selection of Optimal ML Model
3.3. Optimal Alloy Composition Design
+ (V/1.4)% + (Fe/0.6)% + (Co/0.9)% + (Ni/0.8)%
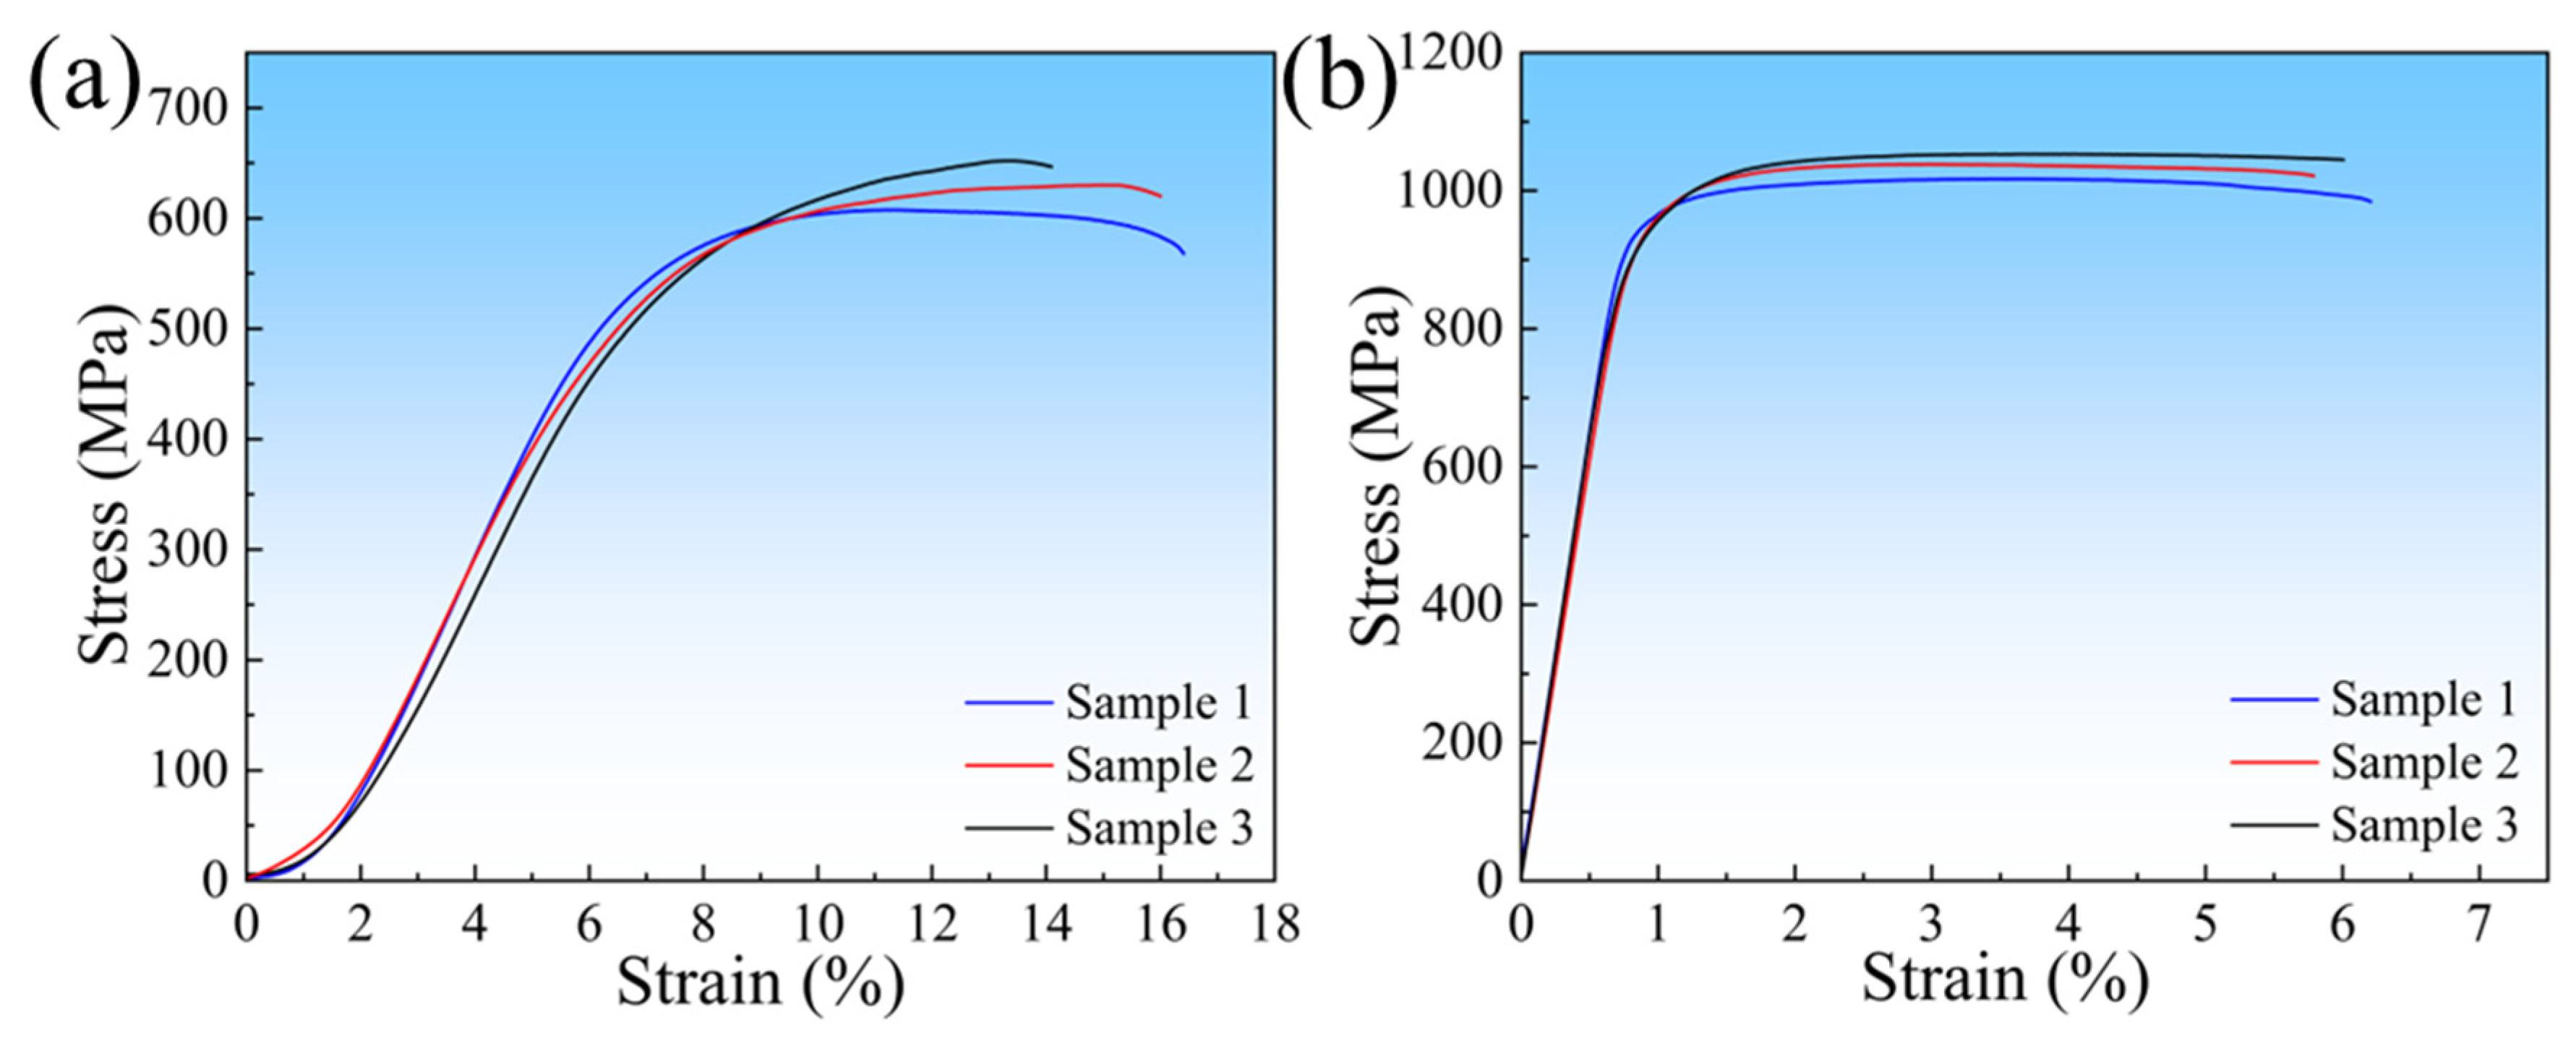
3.4. Experimental Verification and Analysis
3.4.1. Validation of Prediction Results
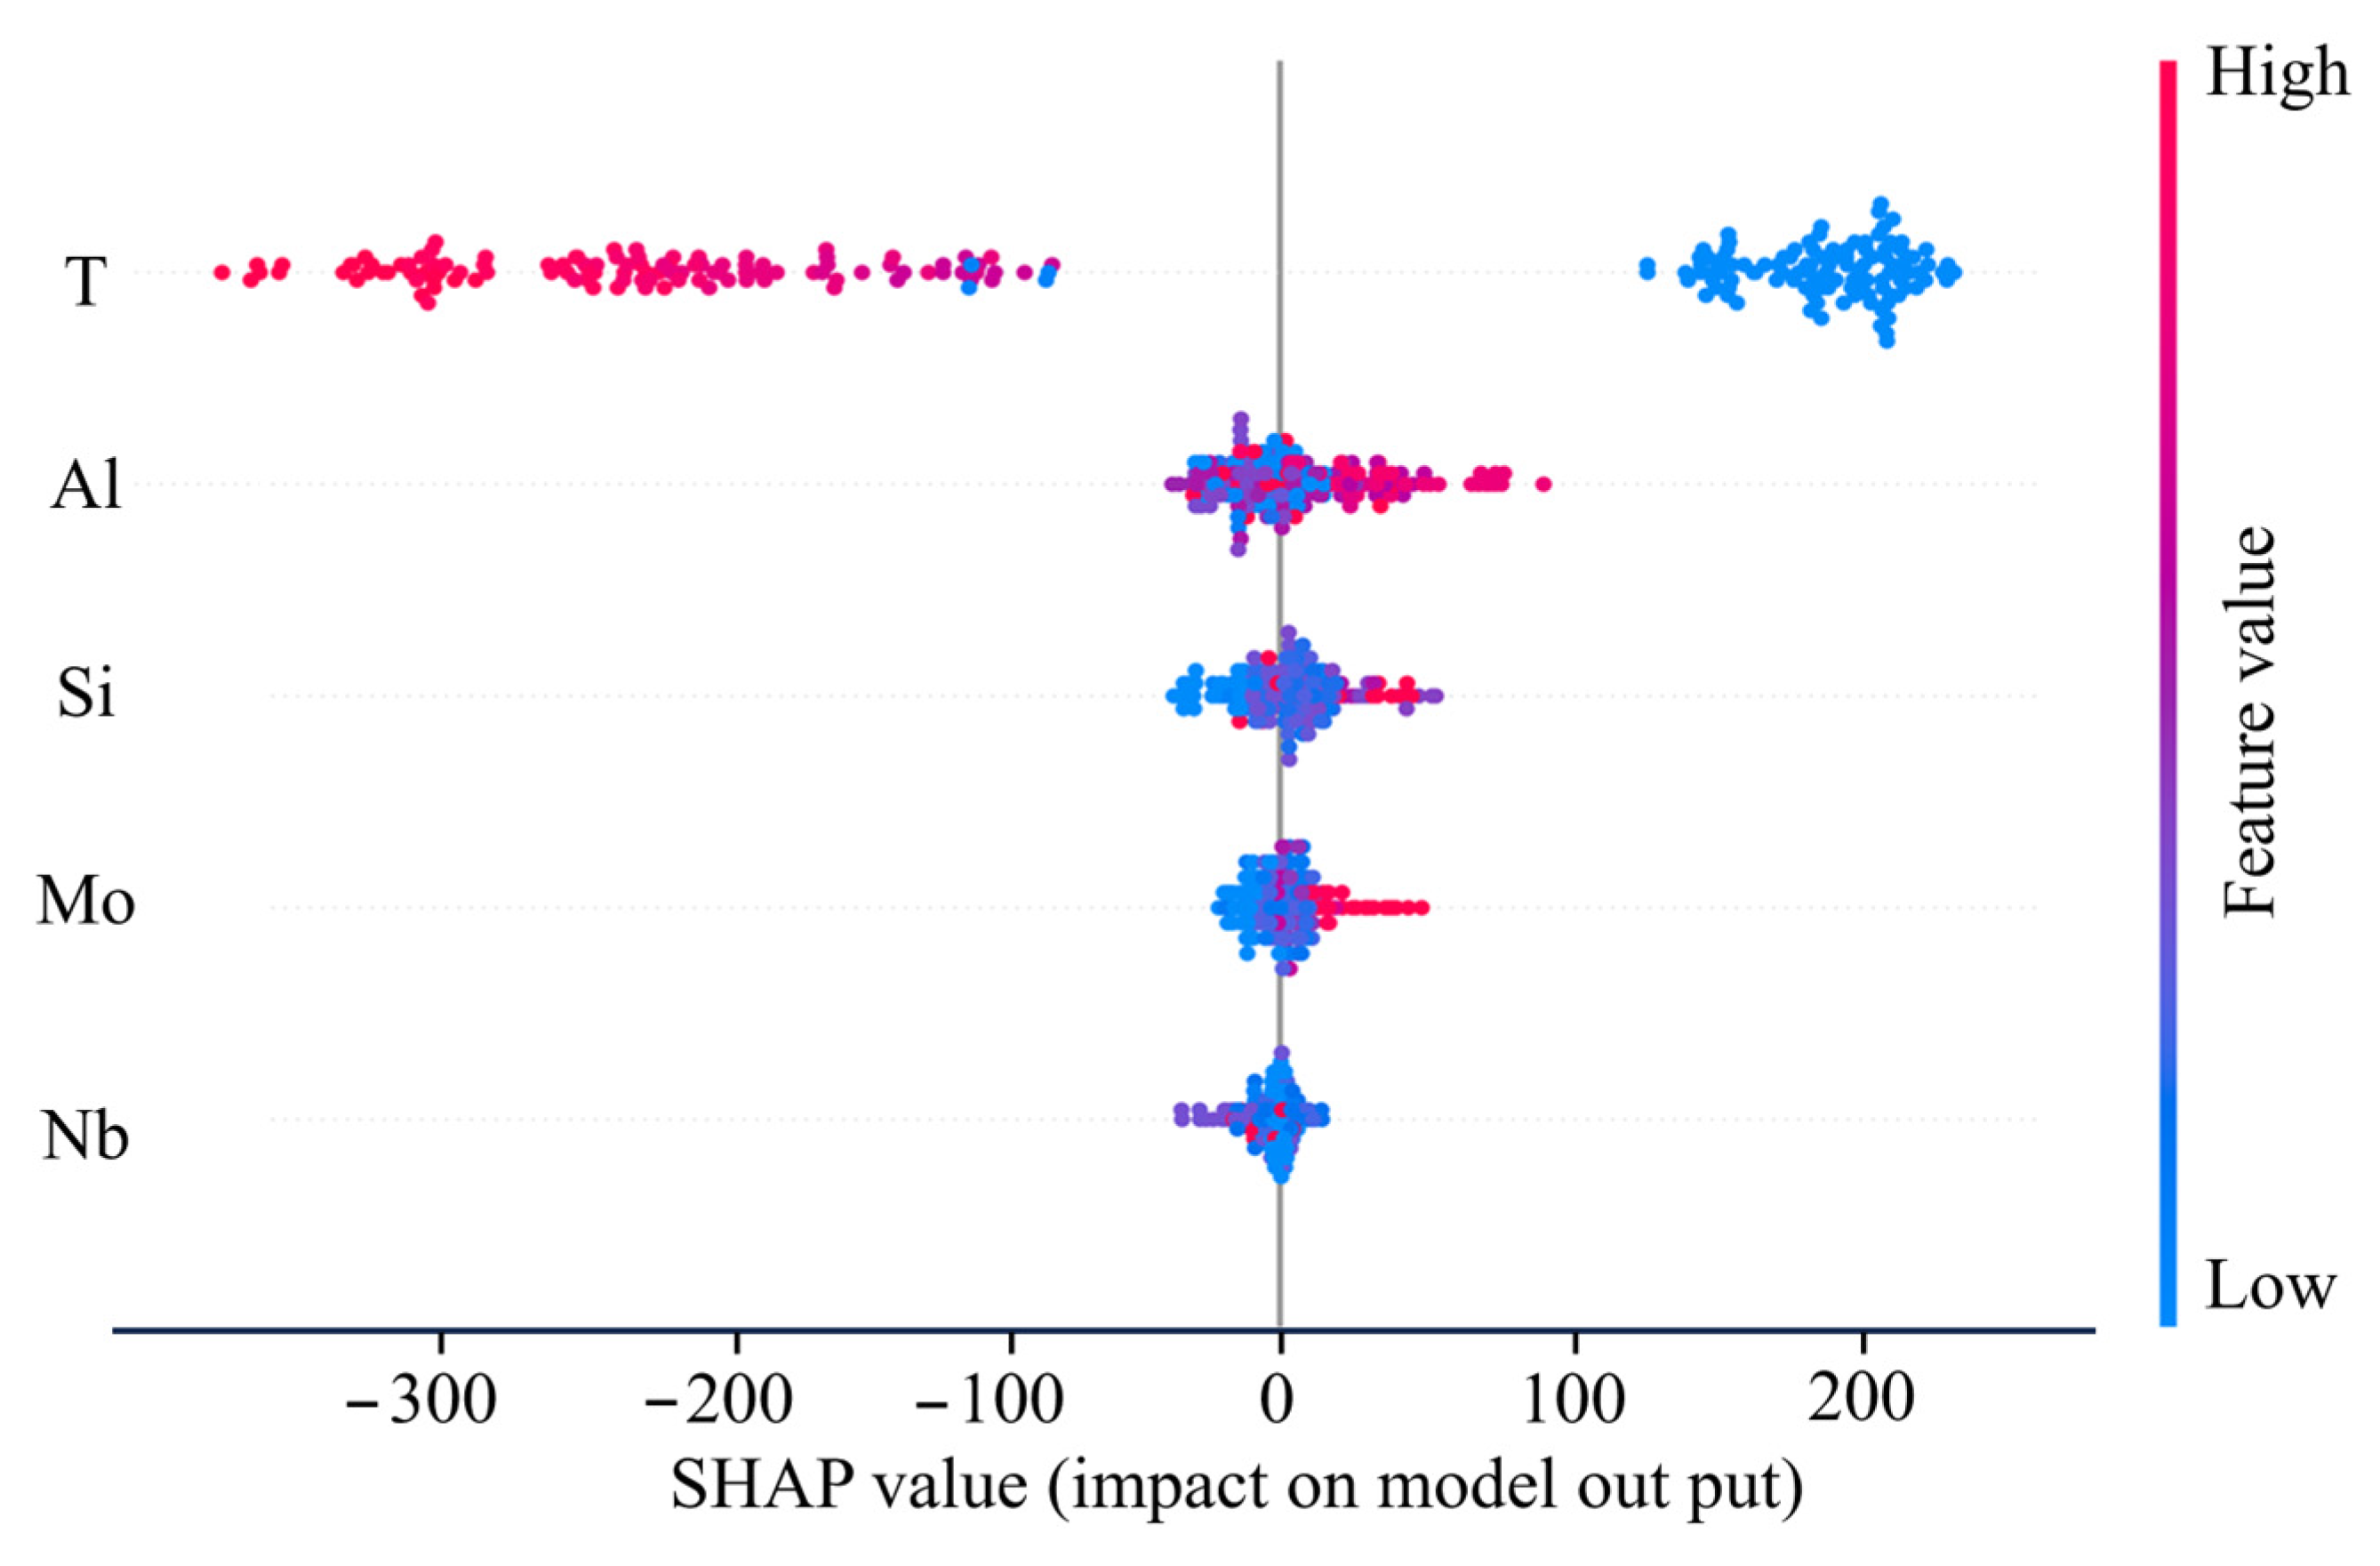
3.4.2. Feature Importance Analysis
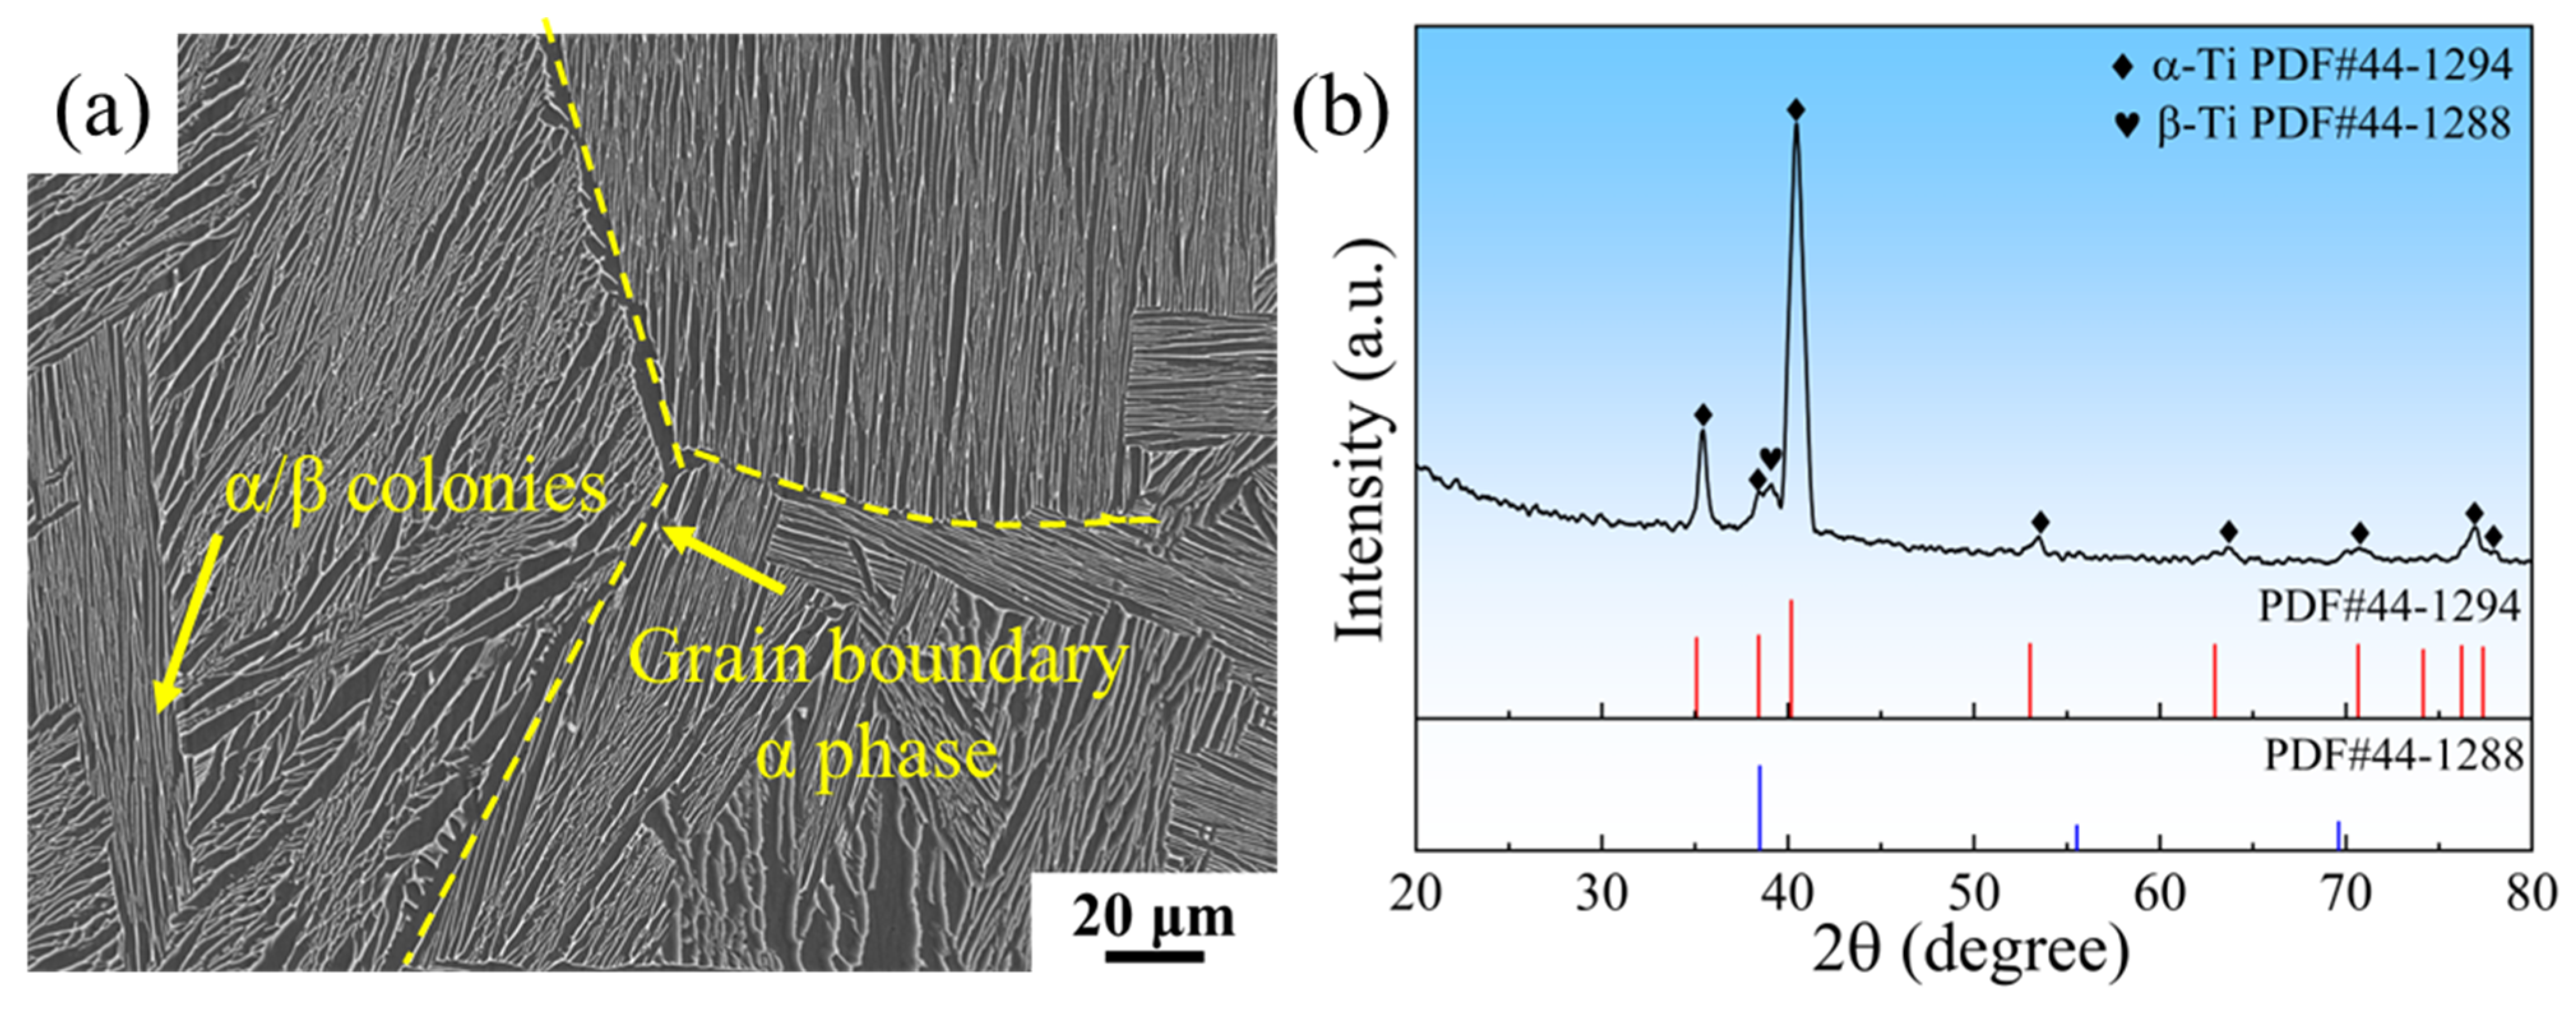
3.4.3. Microstructure Characterization
3.4.4. Fracture Mechanism Analysis
4. Conclusions
Supplementary Materials
Author Contributions
Funding
Institutional Review Board Statement
Informed Consent Statement
Data Availability Statement
Conflicts of Interest
References
- Qu, B.L.; Zhang, C.J.; Lian, Q.H.; Deng, Y.L.; Zhang, S.Z.; Du, Z.X.; Han, J.C.; Wang, B.; Wang, T.; Zhang, X.Y. A novel near-α high temperature titanium alloy with trimodal microstructure and submicron-nanosilicides for superior mechanical properties at both room and elevated temperatures. Compos. Part B 2025, 299, 112411. [Google Scholar] [CrossRef]
- Li, J.; Xu, Y.Q.; Xiao, W.L.; Ma, C.L.; Huang, X. Development of Ti-Al-Ta-Nb-(Re) near-α high temperature titanium alloy: Microstructure, thermal stability and mechanical properties. J. Mater. Sci. Technol. 2022, 109, 1–11. [Google Scholar] [CrossRef]
- Li, T.Y.; Zhu, Z.H.; Zhang, S.; Min, X.H.; Dong, C. Effect of processing parameters on formability, microstructure, and micro-hardness of a novel laser additive manufactured Ti-6.38Al-3.87V-2.43Mo alloy. China Foundry 2022, 19, 158–168. [Google Scholar] [CrossRef]
- Sun, P.; Su, B.L.; Tan, C.S.; Tang, B.; Li, J.H.; Yuan, R.H. The influence of heat treatment on the high temperature tensile properties of a near-α as-cast titanium alloy. J. Alloys Compd. 2025, 1010, 178148. [Google Scholar] [CrossRef]
- Liu, T.Y.; Shi, K.; Zhao, J.; Liu, S.B.; Zhang, Y.W.; Liu, H.Y.; Chen, X.M.; Mei, X.M. Effect of hot isostatic pressing processing parameters on microstructure and properties of Ti60 high temperature titanium alloy. China Foundry 2023, 20, 49–56. [Google Scholar] [CrossRef]
- Song, Y.J.; Fu, B.G.; Dong, T.S.; Li, G.L.; Wang, F.; Zhao, X.B.; Liu, J.H. Effect of Nb content on cyclic oxidation behavior of as-cast Ti-1100 alloys. Materials 2020, 13, 1082. [Google Scholar] [CrossRef]
- Shen, J.F.; Fu, B.G.; Wang, Y.F.; Dong, T.S.; Li, J.K.; Li, G.L.; Liu, J.H. Effect of Y content on precipitation behavior, oxidation and mechanical properties of as-cast high-temperature titanium alloys. Materials 2023, 16, 4784. [Google Scholar] [CrossRef]
- Ma, X.Z.; Chen, Z.Y.; Xiang, Z.L.; Zhang, S.W.; Liu, Y.Y.; Ding, X.X. Influence of quenching plus aging on microstructures and mechanical properties evolutions for Ti-Al-Sn-Zr-Mo-Si-Nb-Ta-Er-C near-α high temperature titanium alloys. Mater. Today Commun. 2024, 38, 108457. [Google Scholar] [CrossRef]
- Yan, W.G.; Wang, H.M.; Tang, H.B.; Cheng, X.; Zhu, Y.Y. Effect of Nd addition on microstructure and tensile properties of laser additive manufactured TC11 titanium alloy. Trans. Nonferrous Met. Soc. China 2022, 32, 1501–1512. [Google Scholar] [CrossRef]
- Li, C.Z.; Fu, B.G.; Dong, T.S.; Liu, J.H.; Song, Y.J.; Zhao, X.B.; Li, G.L. Microstructure and dry sliding wear behavior of as-cast TiCp/Ti-1100-0.5Nb titanium matrix composite at elevated temperatures. China Foundry 2020, 17, 455–463. [Google Scholar] [CrossRef]
- Bodunrin, M.O.; Chown, L.H.; Omotoyinbo, J.A. Development of low-cost titanium alloys: A chronicle of challenges and opportunities. Mater. Today Proc. 2021, 38, 564–569. [Google Scholar] [CrossRef]
- Sengupta, B.; Shekhar, S.; Kulkarni, K.N. A novel ultra-high strength and low-cost as-cast titanium alloy. Mater. Sci. Eng. A 2017, 696, 478–481. [Google Scholar] [CrossRef]
- Huang, S.X.; Zhao, Q.Y.; Yang, Z.; Lin, C.; Zhao, Y.Q.; Yu, J.S. Strengthening effects of Al element on strength and impact toughness in titanium alloy. J. Mater. Res. Technol. 2023, 26, 504–516. [Google Scholar] [CrossRef]
- Lu, J.W.; Ge, P.; Zhao, Y.Q. Recent Development of effect mechanism of alloying elements in titanium alloy design. Rare Metal Mat. Eng. 2014, 43, 775–779. [Google Scholar] [CrossRef]
- Kotov, A.D.; Postnikova, M.N.; Mosleh, A.O.; Mikhaylovskaya, A.V. Effect of Mo content on the microstructure, superplastic behavior, and mechanical properties of Ni and Fe-modified titanium alloys. Mater. Sci. Eng. A 2023, 877, 145166. [Google Scholar] [CrossRef]
- Huang, S.X.; Zhao, Q.Y.; Zhao, Y.Q.; Lin, C.; Wu, C.; Jia, W.J.; Mao, C.L.; Ji, V. Toughening effects of Mo and Nb addition on impact toughness and crack resistance of titanium alloys. J. Mater. Sci. Technol. 2021, 79, 147–164. [Google Scholar] [CrossRef]
- Cui, Y.J.; Aoyagi, K.; Koizumi, Y.; Yang, C.; Bian, H.K.; Hayasaka, Y.; Fujieda, T.; Chiba, A. Effect of niobium addition on tensile properties and oxidation resistance of a titanium-based alloy. Corros. Sci. 2021, 180, 109198. [Google Scholar] [CrossRef]
- Marker, C.; Shang, S.L.; Zhao, J.C.; Liu, Z.K. Thermodynamic description of the Ti-Mo-Nb-Ta-Zr system and its implications for phase stability of Ti bio-implant materials. Calphad-Comput. Coupling Ph. Diagrams Thermochem. 2018, 61, 72–84. [Google Scholar] [CrossRef]
- Fu, B.G.; Wang, H.W.; Zou, C.M.; Wei, Z.J. The effects of Nb content on microstructure and fracture behavior of near α titanium alloys. Mater. Des. 2015, 66, 367–373. [Google Scholar] [CrossRef]
- Liu, Z.M.; Zhu, P.L.; Mao, X.N.; Zhao, Y.Q.; Xin, S.W. Effect of Si addition on the microstructure and creep properties of the forged titanium alloy. Mater. Chem. Phys. 2024, 317, 129212. [Google Scholar] [CrossRef]
- Guo, R.; Liu, B.; Xu, R.J.; Cao, Y.K.; Qiu, J.W.; Chen, F.; Yan, Z.Q.; Liu, Y. Microstructure and mechanical properties of powder metallurgy high temperature titanium alloy with high Si content. Mater. Sci. Eng. A 2020, 777, 138993. [Google Scholar] [CrossRef]
- Fu, B.G.; Wang, H.W.; Zou, C.M.; Wei, Z.J. The influence of Zr content on microstructure and precipitation of silicide in as-cast near α titanium alloys. Mater. Charact. 2015, 99, 17–24. [Google Scholar] [CrossRef]
- Zhuo, L.C.; Ji, K.L.; Lu, J.W.; Sun, J.C.; Huo, W.T.; Shao, H.; Chen, B.Q.; Zhao, Y.Q. Microstructure characterization and tensile performance of a high-strength titanium alloy with in-situ precipitates of Ti5Si3. J. Alloys Compd. 2023, 968, 171867. [Google Scholar] [CrossRef]
- Kishida, K.; Fujiwara, M.; Adachi, H.; Tanaka, K.; Inui, H. Plastic deformation of single crystals of Ti5Si3 with the hexagonal D88 structure. Acta Mater. 2010, 58, 846–857. [Google Scholar] [CrossRef]
- Gao, X.Y.; Wang, H.Y.; Tan, H.J.; Xing, L.; Hu, Z.Y. Data-driven machine learning for alloy research: Recent applications and prospects. Mater. Today Commun. 2023, 36, 106697. [Google Scholar] [CrossRef]
- Liu, X.J.; Xu, P.C.; Zhao, J.J.; Lu, W.C.; Li, M.J.; Wang, G. Material machine learning for alloys: Applications, challenges and perspectives. J. Alloys Compd. 2022, 921, 165984. [Google Scholar] [CrossRef]
- Hu, M.W.; Tan, Q.Y.; Knibbe, R.; Xu, M.; Jiang, B.; Wang, S.; Li, X.; Zhang, M.X. Recent applications of machine learning in alloy design: A review. Mater. Sci. Eng. R-Rep. 2023, 155, 100746. [Google Scholar] [CrossRef]
- Liu, Z.D.; Zhang, H.Y.; Zhang, S.; Cheng, J.; He, Y.X.; Zhou, G.; Liu, J.W.; Song, S.P.; Chen, J.J. A machine learning method approach for designing novel high strength and plasticity metastable β titanium alloys. Prog. Nat. Sci. Mater. Int. 2025, 35, 156–165. [Google Scholar] [CrossRef]
- Wu, C.T.; Chang, H.T.; Wu, C.Y.; Chen, S.W.; Huang, S.Y.; Huang, M.X.; Pan, Y.T.; Bradbury, P.; Chou, J.; Yen, H.W. Machine learning recommends affordable new Ti alloy with bone-like modulus. Mater. Today. 2020, 34, 41–50. [Google Scholar] [CrossRef]
- Oh, J.K.; Narayana, P.L.; Hong, J.K.; Yeom, J.T.; Reddy, N.S.; Kang, N.; Park, C.H. Property optimization of TRIP Ti alloys based on artificial neural network. J. Alloys Compd. 2021, 884, 161029. [Google Scholar] [CrossRef]
- Nawa, K.; Hagiwara, K.; Nakamura, K. Prediction-accuracy improvement of neural network to ferromagnetic multilayers by Gaussian data augmentation and ensemble learning. Comput. Mater. Sci. 2023, 219, 112032. [Google Scholar] [CrossRef]
- Ye, Y.C.; Li, Y.H.; Ouyang, R.L.; Zhang, Z.R.; Tang, Y.; Bai, S.X. Improving machine learning based phase and hardness prediction of high-entropy alloys by using Gaussian noise augmented data. Comput. Mater. Sci. 2023, 223, 112140. [Google Scholar] [CrossRef]
- Vela, B.; Khatamsaz, D.; Acemi, C.; Karaman, I.; Arróyave, R. Data-augmented modeling for yield strength of refractory high entropy alloys: A Bayesian approach. Acta Mater. 2023, 261, 119351. [Google Scholar] [CrossRef]
- Wolpert, D.H.; Macready, W.G. No free lunch theorems for optimization. IEEE Trans. Evol. Comput. 1997, 1, 67–82. [Google Scholar] [CrossRef]
- Chai, C.R.; Wang, Y.; Zhao, S.; Zhang, Y.X.; Fang, F.; Peng, L.; Zhang, X.M. Machine learning-assisted design of low elastic modulus β-type medical titanium alloys and experimental validation. Comput. Mater. Sci. 2024, 238, 112902. [Google Scholar] [CrossRef]
- GB/T 228.2-2015; Metallic Materials—Tensile Testing—Part 2: Method of Test at Elevated Temperature. The National Standards of the People’s Republic of China: Beijing, China, 2015.
- ASTM E8/E8M-16; Standard Test Methods for Tension Testing of Metallic Materials. ASTM International: West Conshohocken, PA, USA, 2020.
- Zhang, Y.; Li, D.S.; Li, X.Q.; Liu, X.C.; Zhao, S.T.; Li, Y. Creep deformation and strength evolution mechanisms of a Ti-6Al-4V alloy during stress relaxation at elevated temperatures from elastic to plastic loading. J. Mater. Sci. Technol. 2022, 126, 93–105. [Google Scholar] [CrossRef]
- Liu, Z.Y.; Wang, T.Y.; Jin, L.; Zeng, J.; Dong, S.; Wang, F.H.; Wang, F.L.; Dong, J. Towards high stiffness and ductility-The Mg-Al-Y alloy design through machine learning. J. Mater. Sci. Technol. 2025, 221, 194–203. [Google Scholar] [CrossRef]
- Wang, Z.; Zhang, H.Y.; Wang, S.Y.; Cheng, J.; Wang, C.; Zhou, G.; Zhang, S.Q.; Chen, L.J. A machine learning method based on TPE-XGBoost model for TRIP/TWIP near-β titanium alloy design. Mater. Today Commun. 2024, 41, 110309. [Google Scholar] [CrossRef]
- Wang, H.N.; Sun, Q.Z.; Wu, J.; Zhang, X.X.; Liu, W.P.; Peng, T.; Tang, R.Z. Self-training-based approach with improved XGBoost for aluminum alloy casting quality prediction. Robot. Comput. Integr. Manuf. 2025, 92, 102890. [Google Scholar] [CrossRef]
- Gysler, A.; Weissmann, S. Effect of order in Ti3Al particles and of temperature on the deformation behavior of age-hardened Ti-Al alloys. Mater. Sci. Eng. 1977, 27, 181–193. [Google Scholar] [CrossRef]
- Li, J.; Cai, J.M.; Xu, Y.Q.; Xiao, W.L.; Huang, X.; Ma, C.L. Influences of thermal exposure on the microstructural evolution and subsequent mechanical properties of a near-α high temperature titanium alloy. Mater. Sci. Eng. A 2020, 774, 138934. [Google Scholar] [CrossRef]
- Cao, S.; Zhang, S.Z.; Liu, J.R.; Li, S.J.; Sun, T.; Li, J.P.; Gao, Y.; Yang, R.; Hu, Q.M. Interaction between Al and other alloying atoms in α-Ti for designing high temperature titanium alloy. Comput. Mater. Sci. 2021, 197, 110620. [Google Scholar] [CrossRef]
- Li, Y.L.; Fang, H.Z.; Chen, R.R.; Sun, S.C.; Xue, X.; Guo, J.J. Optimization of (α+β) microstructure and trade-off between strength and toughness: Based on Mo[eq] and d electron theory in β-Ti alloy. Mater. Des. 2023, 231, 112022. [Google Scholar] [CrossRef]
- Zhao, E.T.; Sun, S.C.; Zhang, Y. Recent advances in silicon containing high temperature titanium alloys. J. Mater. Res. Technol. 2021, 14, 3029–3042. [Google Scholar] [CrossRef]
- Bania, P.J. Next generation titanium alloys for elevated temperature service. ISIJ Int. 1991, 31, 840–847. [Google Scholar] [CrossRef]
- Huang, J.X.; Ando, D.; Sutou, Y. Heat-resistant aluminum alloy design using explainable machine learning. Mater. Des. 2024, 243, 113057. [Google Scholar] [CrossRef]
- Dong, Z.Q.; Zhou, C.; Huang, Q.L.; Mou, Z.K.; Li, M.; Zhou, H.Y.; Zheng, W.Y. Design of high temperature oxidation-resistant high-entropy alloys via machine learning and natural mixing process. Corros. Sci. 2025, 225, 113047. [Google Scholar] [CrossRef]
- Zhang, J.Y.; Zhang, Y.S.; Mompiou, F.; Zhang, W.Z. Structures and migrations of interfaces between β precipitates and α′ matrix in a Ti-2.6 wt% Mo alloy. Acta Mater. 2024, 281, 120429. [Google Scholar] [CrossRef]


| Variable | Unit | Data Range | ||
|---|---|---|---|---|
| Input | Composition | wt.% | Al | 3.2~10.0 |
| Sn | 0~6.2 | |||
| Zr | 0~11.0 | |||
| Mo | 0~4.05 | |||
| Si | 0~1.5 | |||
| Nb | 0~6.5 | |||
| Ta | 0~4.0 | |||
| W | 0~3.6 | |||
| Y | 0~0.62 | |||
| V | 0~4.5 | |||
| Testing temperature | °C | T | 20~750 | |
| Output | Ultimate tensile strength | MPa | UTS | 381~1328 |
| Alloy | Test Temperature (°C) | UTS (MPa) |
|---|---|---|
| Ti-7.2Al-1.8Mo-2.0Nb-0.4Si | 600 | 649 |
| 600 °C | Room Temperature | |||||
|---|---|---|---|---|---|---|
| UTS (MPa) | YS (MPa) | EL (%) | UTS (MPa) | YS (MPa) | EL (%) | |
| Sample 1 | 607 | 465 | 16.3 | 1016 | 954 | 6.2 |
| Sample 2 | 628 | 472 | 16.0 | 1037 | 968 | 5.7 |
| Sample 3 | 652 | 498 | 14.1 | 1052 | 975 | 6.0 |
| Average value | 629 | 478 | 15.5 | 1035 | 965 | 5.9 |
| Standard deviation σ | 18.38 | 14.19 | 0.97 | 14.76 | 9.71 | 0.21 |
Disclaimer/Publisher’s Note: The statements, opinions and data contained in all publications are solely those of the individual author(s) and contributor(s) and not of MDPI and/or the editor(s). MDPI and/or the editor(s) disclaim responsibility for any injury to people or property resulting from any ideas, methods, instructions or products referred to in the content. |
© 2025 by the authors. Licensee MDPI, Basel, Switzerland. This article is an open access article distributed under the terms and conditions of the Creative Commons Attribution (CC BY) license (https://creativecommons.org/licenses/by/4.0/).
Share and Cite
Fu, X.; Li, B.; Fu, B.; Dong, T.; Li, J. Composition Design of a Novel High-Temperature Titanium Alloy Based on Data Augmentation Machine Learning. Materials 2025, 18, 3099. https://doi.org/10.3390/ma18133099
Fu X, Li B, Fu B, Dong T, Li J. Composition Design of a Novel High-Temperature Titanium Alloy Based on Data Augmentation Machine Learning. Materials. 2025; 18(13):3099. https://doi.org/10.3390/ma18133099
Chicago/Turabian StyleFu, Xinpeng, Boya Li, Binguo Fu, Tianshun Dong, and Jingkun Li. 2025. "Composition Design of a Novel High-Temperature Titanium Alloy Based on Data Augmentation Machine Learning" Materials 18, no. 13: 3099. https://doi.org/10.3390/ma18133099
APA StyleFu, X., Li, B., Fu, B., Dong, T., & Li, J. (2025). Composition Design of a Novel High-Temperature Titanium Alloy Based on Data Augmentation Machine Learning. Materials, 18(13), 3099. https://doi.org/10.3390/ma18133099