Abstract
The poor magnetic and magneto-optical properties of BiFeO3, along with its significant lattice mismatch with silicon, have limited its application in silicon-based integrated magneto-optical devices. In this study, co-doping with Sr2+ and Ti4+ ions effectively transformed the trigonal structure of BiFeO3 into a cubic phase, thereby reducing the lattice mismatch with silicon to 2.8%. High-quality, highly oriented, silicon-based cubic Sr,Ti:BiFeO3 thin films were successfully fabricated using radio frequency magnetron sputtering. Due to the induced lattice distortion, the characteristic periodic spiral spin antiferromagnetic structure of BiFeO3 was suppressed, resulting in a significant enhancement of the saturation magnetization of cubic Bi0.5Sr0.5Fe0.5Ti0.5O3 (48.0 emu/cm3), compared to that of pristine BiFeO3 (5.0 emu/cm3). Furthermore, the incorporation of Sr2+ and Ti4+ ions eliminated the birefringence effect inherent in trigonal BiFeO3, thereby inducing a pronounced magneto-optical effect in the cubic Sr,Ti:BiFeO3 thin film. The magnetic circular dichroic ellipticity (ψF) of Bi0.5Sr0.5Fe0.5Ti0.5O3 reached an impressive 2300 degrees/cm.
1. Introduction
With the rapid advancement of optical communication and information technology, the demands for large-scale data storage, analysis, and transmission are continuously increasing, imposing higher performance requirements on magneto-optical devices such as optical isolators, optical storage, and optical modulators, all of which rely on magneto-optical materials at their core [1,2,3]. In addition, silicon-based optoelectronic integration technology represents one of the most important and actively pursued research directions. Alongside this, electronic components are increasingly evolving toward miniaturization and monolithic integration. Consequently, the development of magneto-optical thin-film materials exhibiting superior magneto-optical performance, high stability, low transmission loss, and strong compatibility with silicon substrates has become an urgent requirement for the progress of modern communication technologies.
Previous studies have shown that doping an appropriate amount of Bi3+ ions into garnet-type rare-earth ferrite magneto-optical materials such as RIG (R3Fe5O12, where R denotes rare earth elements) can significantly enhance the magneto-optical effect of these crystals. This enhancement is primarily attributed to the hybridization between the excited 6p orbitals of Bi3+ and the 3d orbitals of Fe3+, as well as the superexchange correction effect that leads to strong mixing between crystal field states of different energies, thereby greatly improving the magneto-optical properties. For example, Bi:YIG [4,5], Bi:TbIG [6], and Bi:GdIG [7] all exhibit excellent magneto-optical performance and large Faraday rotation angles. However, a significant lattice mismatch exists between garnet ferrites and silicon (YIG: 12.376 Å; Si: 5.431 Å), which often results in the cracking of garnet thin films grown on silicon substrates. This mismatch increases light scattering and transmission loss, thus limiting their potential application in integrated devices [8].
In contrast to RIG, perovskite-type ferrites such as RFeO3 provide a much better lattice match with silicon substrates and offer several advantages, including high sensitivity, superior magneto-optical performance, rapid response, and a high Curie temperature (620–760 K) [9,10,11]. As a typical perovskite multiferroic material, BiFeO3 is considered one of the most promising candidates for spintronic devices, magnetoelectric sensors, and high-density ferroelectric memory applications [12,13,14,15,16]. Given that Bi3+ can significantly enhance the magneto-optical effect in ferrites, BiFeO3, with its high Bi3+ concentration, should theoretically exhibit excellent magneto-optical properties. However, limited research on the magneto-optical characteristics and device applications of BiFeO3 thin films and single crystals has been reported. This is largely because BiFeO3 crystallizes in a trigonal system with an R3c rhombohedral space group and exhibits a unique helical G-type antiferromagnetic structure, resulting in very weak macroscopic magnetism [17,18]. Moreover, the birefringence effect inherent in trigonal crystals severely diminishes the magneto-optical performance. Additionally, impurity phases such as Bi25FeO40 and Bi2Fe4O9 are easily formed during BiFeO3 thin-film fabrication [19,20,21], hindering epitaxial growth on silicon substrates and degrading film quality.
It has been reported that ion doping can effectively tune the structure of ABO3 perovskites. According to the tolerance factor relation, when tolerance factor t falls within the range of 0.9–1.0, the formation of a cubic phase without birefringence becomes possible [21,22,23]. Furthermore, B-site ion doping helps disrupt the helical G-type antiferromagnetic structure in BiFeO3, potentially resulting in enhanced macroscopic magnetism. The cubic-phase BiFeO3 also possesses lattice parameters close to those of silicon, ensuring minimal lattice mismatch. Therefore, highly oriented, high-performance cubic-phase BiFeO3 magneto-optical films are expected to be achievable through ion doping and silicon substrate induction.
In this study, the structure of trigonal BiFeO3 was successfully modified by co-doping with Sr2+ and Ti4+ ions. A series of Bi1−xSrxFe1−xTixO3 (x = 0, 0.2, and 0.5) thin films was fabricated on (100)-oriented Si and SrTiO3 (STO) wafers, as well as on SiO2 quartz glass substrates, via radio frequency magnetron sputtering. The effects of Sr2+ and Ti4+ co-doping on the structure, magnetic properties, magneto-optical performance, growth orientation, film-forming quality, and permeability of BiFeO3 thin films were systematically investigated.
2. Materials and Methods
Bi1−xSrxFe1−xTixO3 (x = 0, 0.2, and 0.5) polycrystalline targets were synthesized using the high-temperature solid-state reaction method. First, the starting materials (Bi2O3, Fe2O3, SrCO3, and TiO2, Shanghai Aladdin Biochemical Technology Co., Ltd., Shanghai, China) were precisely weighed according to the stoichiometric ratios, thoroughly mixed, and pre-sintered at 700 °C for 4 h in an air atmosphere. Subsequently, a PVA ((CH2CHOH)n) binder (Shanghai Aladdin Biochemical Technology Co., Ltd., Shanghai, China) was added to the pre-sintered powder at a ratio of 0.05 mL/g. After complete grinding, the mixture was pressed into pellets under a pressure of 30 MPa and sintered at 820 °C for 4 h to obtain high-density polycrystalline targets.
Thin films of BiFeO3, Bi0.8Sr0.2Fe0.8Ti0.2O3, and Bi0.5Sr0.5Fe0.5Ti0.5O3 were deposited on SiO2 quartz glass, <100>-oriented silicon, and SrTiO3 (STO) wafers (Hefei Crystal Technical Material Co., Ltd., Hefei, China) using the RF magnetron sputtering technique. The detailed sputtering parameters are listed in Table 1. As the as-deposited thin films were amorphous, post-deposition annealing was necessary. To minimize the influence of oxygen vacancy defects on the optical and magnetic properties, the films were annealed at 600 °C for 3 h in a sufficient oxygen atmosphere to promote crystallization. The heating and cooling rates were carefully controlled at 1 °C/min and 0.7 °C/min, respectively.

Table 1.
Radio frequency magnetron sputtering parameters for depositing thin films.
The crystal phases of the thin films were analyzed using an X-ray diffractometer (XRD) (D/max-3C, Rigaku, Akishima, Japan) with a Cu Kα radiation source (λ = 1.5406 Å) operating at 30 kV and 15 mA. The grazing-incidence X-ray diffraction (GIXRD) spectra of the thin films were measured using the MPA-U4 thin-film platform. The thickness and surface morphology of the films were examined by scanning electron microscopy (SEM) (SU8000, Hitachi, Chiyoda, Japan) at a magnification of 70,000×, an accelerating voltage of 10 kV, and a working distance of 8–9 mm. The valence states and surface chemical composition were analyzed using X-ray photoelectron spectroscopy (XPS) (Escalab 250Xi, Thermo Scientific, Waltham, MA, USA), while the surface topography was characterized by atomic force microscopy (AFM) (Dimension Icon, Bruker, Manning Park Billerica, MA, USA). The transmittance spectra of the thin films, covering the wavelength range of 200–3000 nm, were measured using a UV-Vis-IR spectrometer (PerkinElmer Lambda 900, Waltham, MA, USA). The magnetic properties were evaluated with a vibrating sample magnetometer (LakeShore-7407, Westerville, OH, USA) at room temperature. To investigate the magnetic circular dichroism (MCD) effect, measurements were conducted using a circular dichroism spectrometer (MOS-450, Bio-Logic, Seyssinet-Pariset, France), with a magnetic field of 2500 Oe applied parallel to the light propagation direction and perpendicular to the film surface.
3. Results and Discussion
3.1. Crystalline Phase and Structure
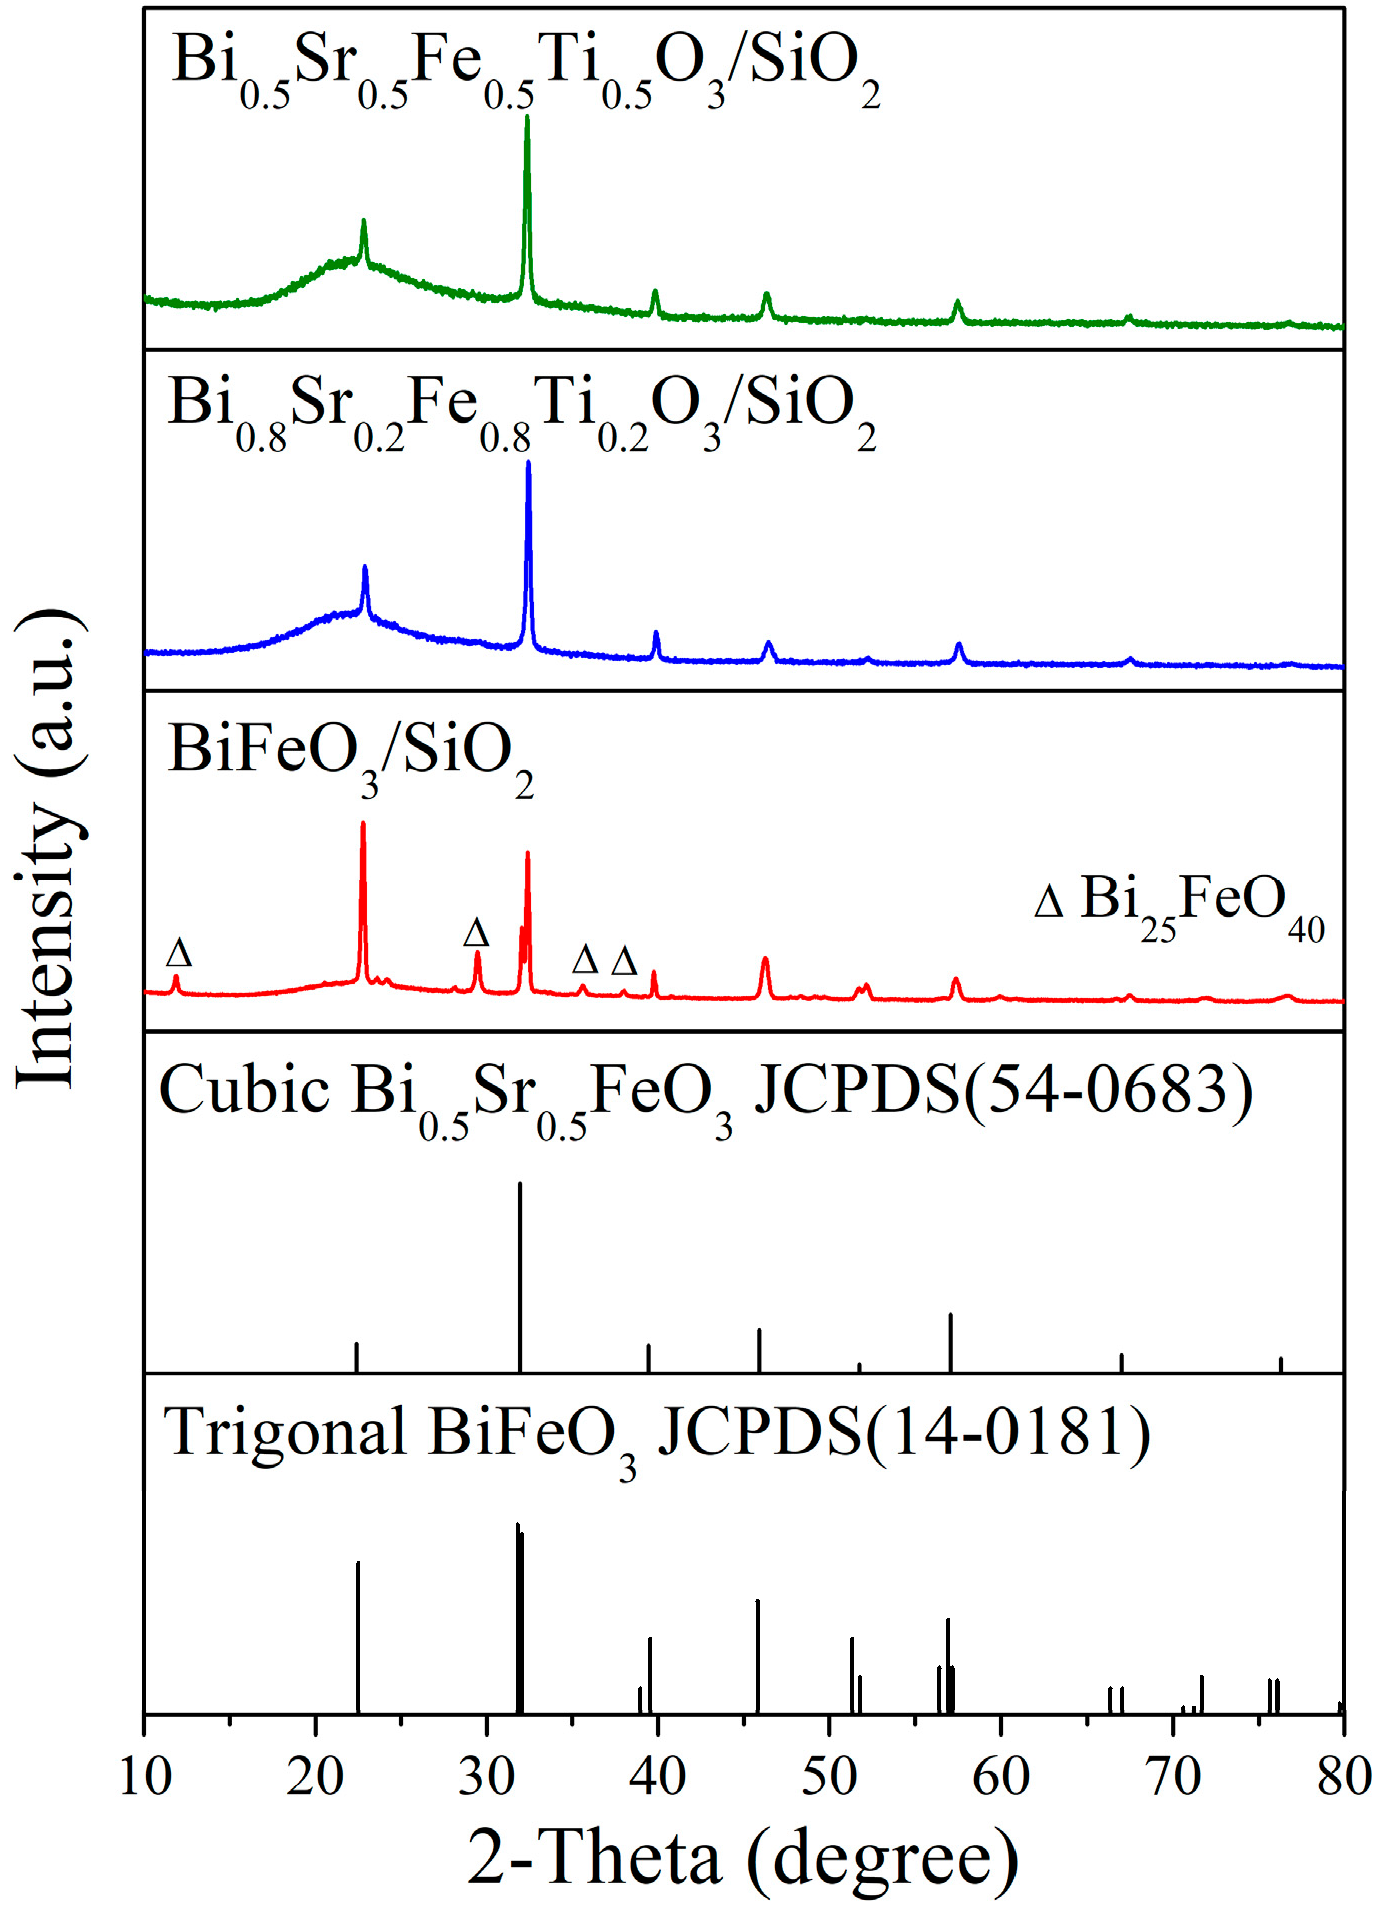
According to the tolerance factor equation, the tolerance factor (t) of BiFeO3 was calculated to be 0.887. When the co-doping concentration of Sr2+ and Ti4+ ions exceeded 0.2, the t value increased above 0.9, suggesting the formation of a cubic phase BiFeO3. The XRD patterns of the annealed Bi1−xSrxFe1−xTixO3/SiO2 (x = 0, 0.2, and 0.5) thin films are presented in Figure 1. As shown in Figure 1, the undoped BiFeO3/SiO2 thin film exhibited a trigonal phase structure (JCPDS 54-0683) after annealing, along with the presence of a Bi25FeO40 impurity phase. In contrast, the Bi0.8Sr0.2Fe0.8Ti0.2O3/SiO2 thin film demonstrated good crystallinity without detectable Bi25FeO40 impurities. Notably, the two distinct peaks near 31.8° and 32° characteristic of the trigonal BiFeO3 phase merged into a single peak at 31.9° for the Bi0.8Sr0.2Fe0.8Ti0.2O3 thin film. All observed diffraction peaks could be attributed to the cubic phase (JCPDS 54-0683), indicating a phase transition from trigonal to cubic structure.

Figure 1.
XRD patterns of Bi1−xSrxFe1−xTixO3/SiO2 thin films annealed at 600 °C.
The XRD pattern of the Bi0.5Sr0.5Fe0.5Ti0.5O3/SiO2 thin film was similar to that of Bi0.8Sr0.2Fe0.8Ti0.2O3/SiO2; however, the diffraction peak near 51.7° was absent in the Bi0.5Sr0.5Fe0.5Ti0.5O3/SiO2 sample. This discrepancy may be attributed to compositional differences between the two films, resulting in slightly different crystallization behaviors under identical annealing conditions. Overall, the diffraction peaks observed for both Bi0.5Sr0.5Fe0.5Ti0.5O3/SiO2 and Bi0.8Sr0.2Fe0.8Ti0.2O3/SiO2 corresponded to the cubic phase of BiFeO3, confirming that co-doping with Sr2+ and Ti4+ ions induced a phase transformation from the trigonal to the cubic structure. Furthermore, the cubic-phase BiFeO3 appeared to possess enhanced phase stability, making it less susceptible to decomposition.
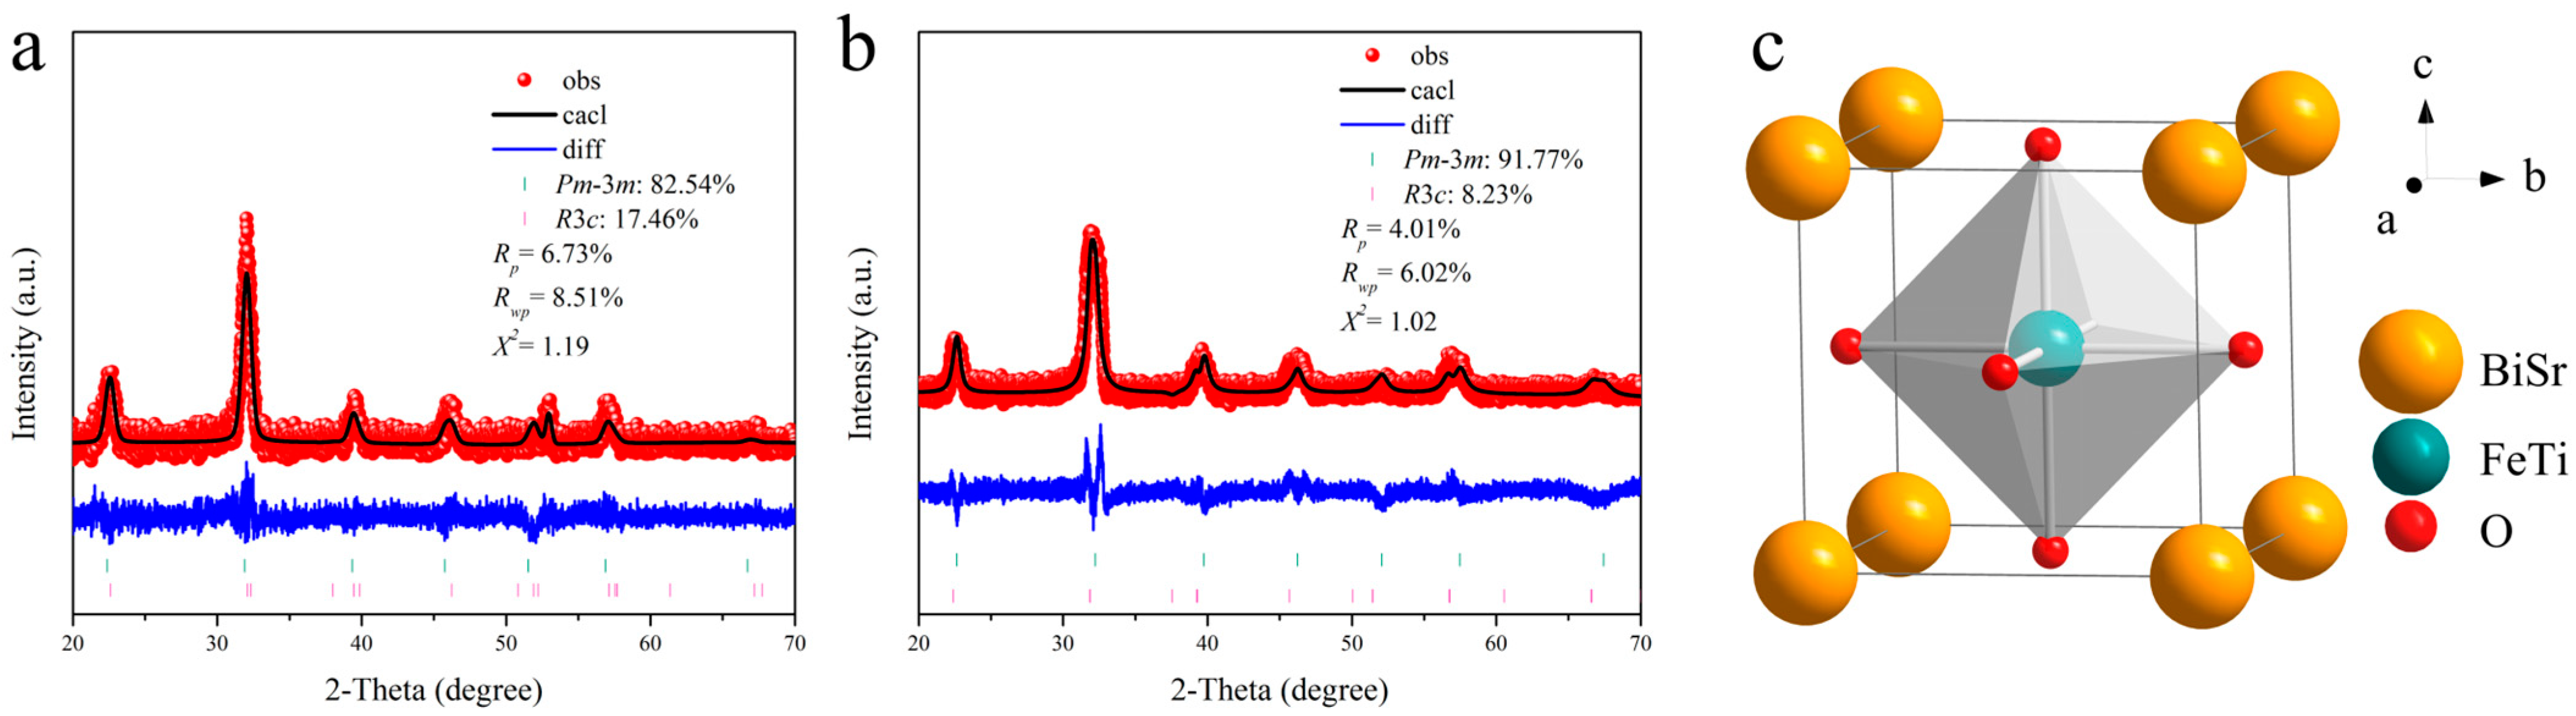
To determine the unit cell structure of cubic Sr,Ti:BiFeO3, the GIXRD patterns of Bi0.8Sr0.2Fe0.8Ti0.2O3/SiO2 and Bi0.5Sr0.5Fe0.5Ti0.5O3/SiO2 thin films were measured using a slow-scan mode with a scanning speed of 0.5°/min. Rietveld structure refinement was performed on the GIXRD patterns using cubic Bi0.8Sr0.2FeO2.9 and trigonal BiFeO3 crystal structure models, as shown in Figure 2a,b. The fitting spectra obtained from Rietveld refinement exhibited a high degree of agreement with the experimental diffraction patterns. The results revealed that the Bi0.8Sr0.2Fe0.8Ti0.2O3 thin film contained 82.54% of the cubic Pm-3m phase and 17.46% of the trigonal R3c phase. With increased doping content, the cubic Pm-3m phase fraction in Bi0.5Sr0.5Fe0.5Ti0.5O3 further rose to 91.77%. This enhancement was attributed to the higher Sr and Ti ion concentrations, which increased the tolerance factor (t) of Bi1−xSrxFe1−xTixO3, thereby promoting a higher cubic phase content [24]. Additionally, for the Bi0.8Sr0.2Fe0.8Ti0.2O3 thin film, the reliability factors, confidence factor (Rp), weighted profile R-factor (Rwp), and goodness-of-fit indicator (χ2), were 6.73%, 8.51%, and 1.19, respectively. For the Bi0.5Sr0.5Fe0.5Ti0.5O3 thin film, these values were 4.01%, 6.02%, and 1.02, respectively. These low error values suggest that the Rietveld refinement results were highly reliable for thin-film structural analysis. Table 2 presents the structural parameters obtained from Rietveld refinement, including the atomic positions and occupancy factors. The data show that Bi3+ and Sr2+ ions co-occupied the 1a site, Fe3+ and Ti4+ ions co-occupied the 1b site, and O2− ions occupied the 3c site. Based on the Rietveld refinement results, the unit cell structure of cubic Bi1−xSrxFe1−xTixO3 was illustrated, as shown in Figure 2c.
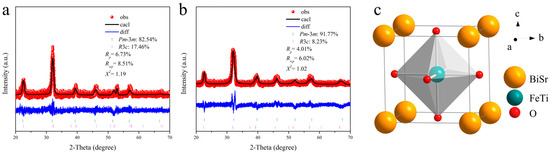
Figure 2.
Fitted GIXRD spectra based on the Rietveld refinement of (a) Bi0.8Sr0.2Fe0.8Ti0.2O3/SiO2 and (b) Bi0.5Sr0.5Fe0.5Ti0.5O3/SiO2 thin films, and (c) unit cell structure diagram of cubic Bi1−xSrxFe1−xTixO3.
Table 2.
The Rietveld refinement data of a cubic Bi1−xSrxFe1−xTixO3/SiO2 thin film.
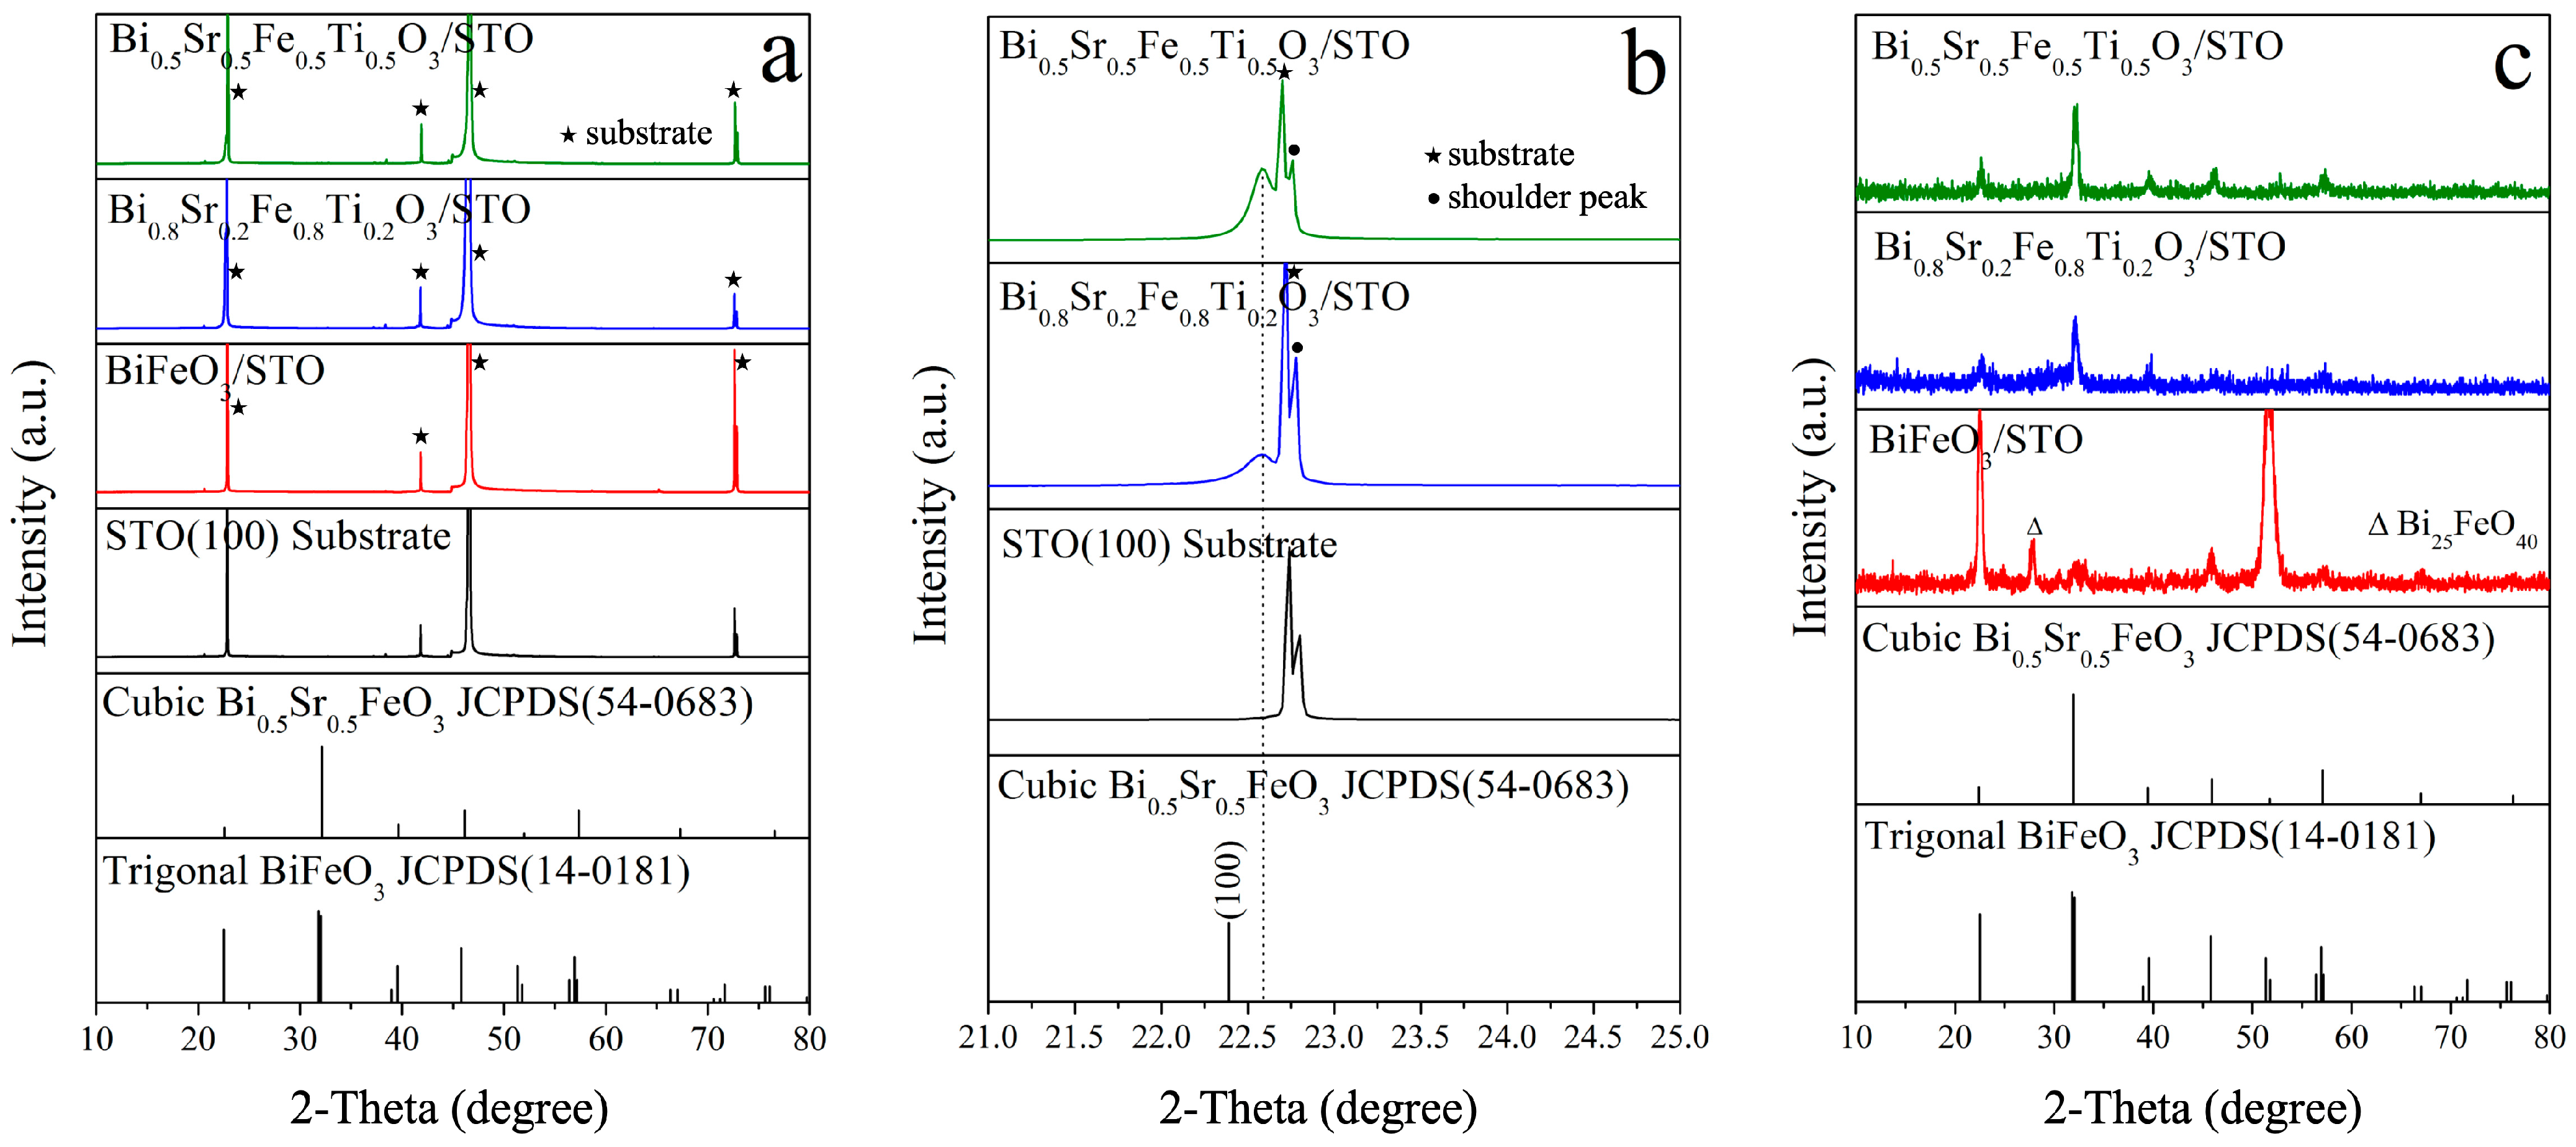
Figure 3a presents the XRD patterns of the Bi1−xSrxFe1−xTixO3/STO thin films. Due to the strong diffraction effect of the single-crystal STO substrate, most of the thin-film diffraction peaks were obscured by the substrate peaks. However, the (100) diffraction peaks of the Bi0.8Sr0.2Fe0.8Ti0.2O3/STO and Bi0.5Sr0.5Fe0.5Ti0.5O3/STO thin films could be clearly observed at 22.6°, as shown in Figure 3b, indicating that the films deposited on the STO substrate exhibited a preferred (100) orientation. Compared to the standard cubic Bi0.5Sr0.5FeO3 reference card (JCPDS 54-0683), the (100) diffraction peak of the Bi0.5Sr0.5Fe0.5Ti0.5O3/STO film was shifted by 0.2° toward a higher angle. This shift was likely due to the lattice constant of the STO(001) substrate (a = 3.905 Å) being slightly smaller than that of the Sr,Ti:BiFeO3 film (a = 3.95 Å), which generated compressive strain in the in-plane direction of the film. This strain caused the film lattice to contract in-plane, reducing the lattice constant and resulting in a shift of the XRD peaks to higher angles [25]. Simultaneously, according to the Poisson effect [26], the out-of-plane lattice constant tended to elongate to compensate for this in-plane compression, leading to the formation of a tetragonal phase.
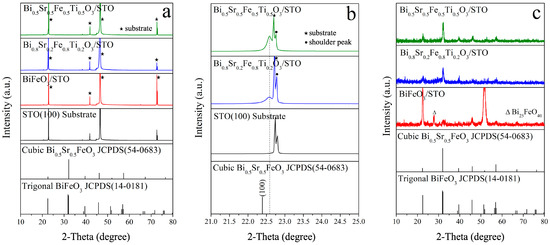
Figure 3.
XRD patterns of (a) Bi1−xSrxFe1−xTixO3/STO thin films, (b) the cubic Bi1−xSrxFe1−xTixO3/STO thin films, and (c) the GIXRD patterns of Bi1−xSrxFe1−xTixO3/STO thin films.
To minimize substrate interference and obtain more detailed information on the thin-film diffraction peaks, GIXRD patterns of the Bi1−xSrxFe1−xTixO3/STO thin films were also recorded, as shown in Figure 3c. It can be seen that all the diffraction peaks in the GIXRD patterns of the Bi0.8Sr0.2Fe0.8Ti0.2O3/STO and Bi0.5Sr0.5Fe0.5Ti0.5O3/STO thin films corresponded to the perovskite cubic phase. In contrast, most of the diffraction peaks of the BiFeO3/STO thin film corresponded to the perovskite trigonal phase, with fewer impurity phases compared to the BiFeO3/SiO2 film. This may be attributed to the fact that the SrTiO3 single-crystal substrate also possessed a perovskite structure, which may have stabilized the perovskite phase of BiFeO3 to some extent.
Furthermore, as shown in Figure 3a,b, the XRD and GIXRD diffraction peak intensities of the Bi0.5Sr0.5Fe0.5Ti0.5O3/STO thin film were stronger than those of the Bi0.8Sr0.2Fe0.8Ti0.2O3/STO thin film, indicating a higher degree of crystallization. This result differed from that in Figure 1 and may have been due to the higher Sr2+ and Ti4+ ion doping concentration in Bi0.5Sr0.5Fe0.5Ti0.5O3, which improved lattice compatibility with the STO substrate and promoted thin-film growth.
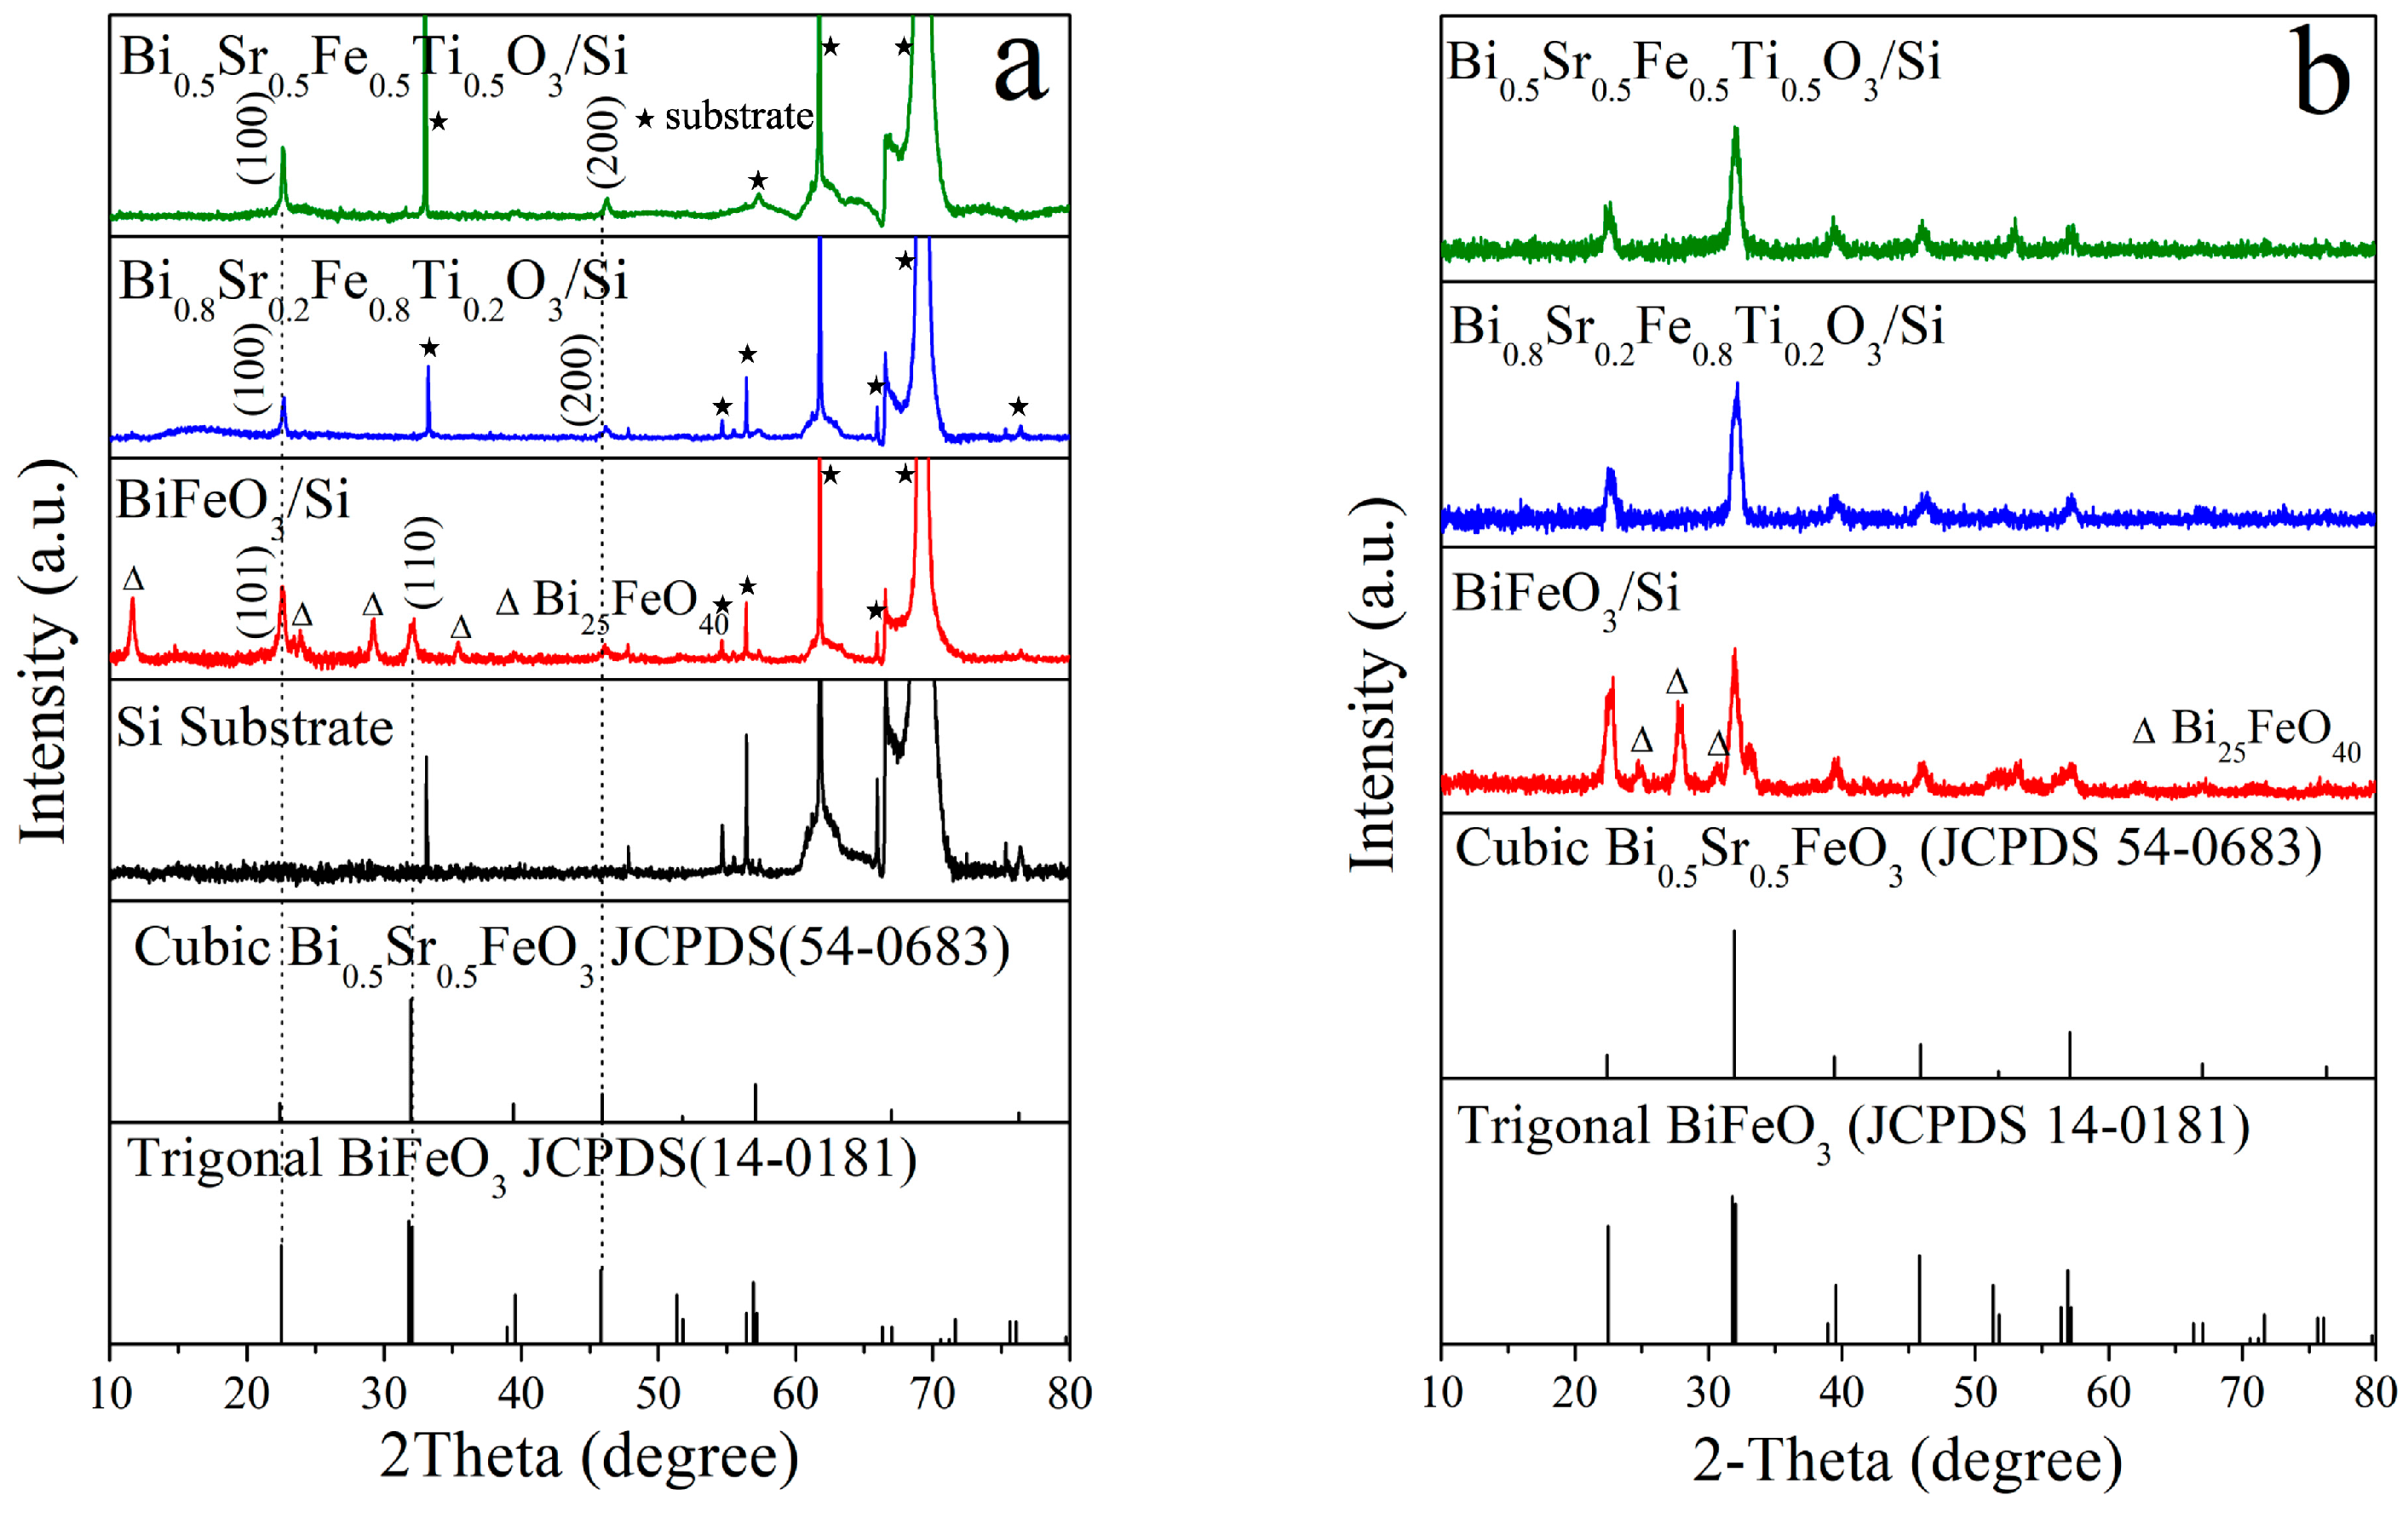
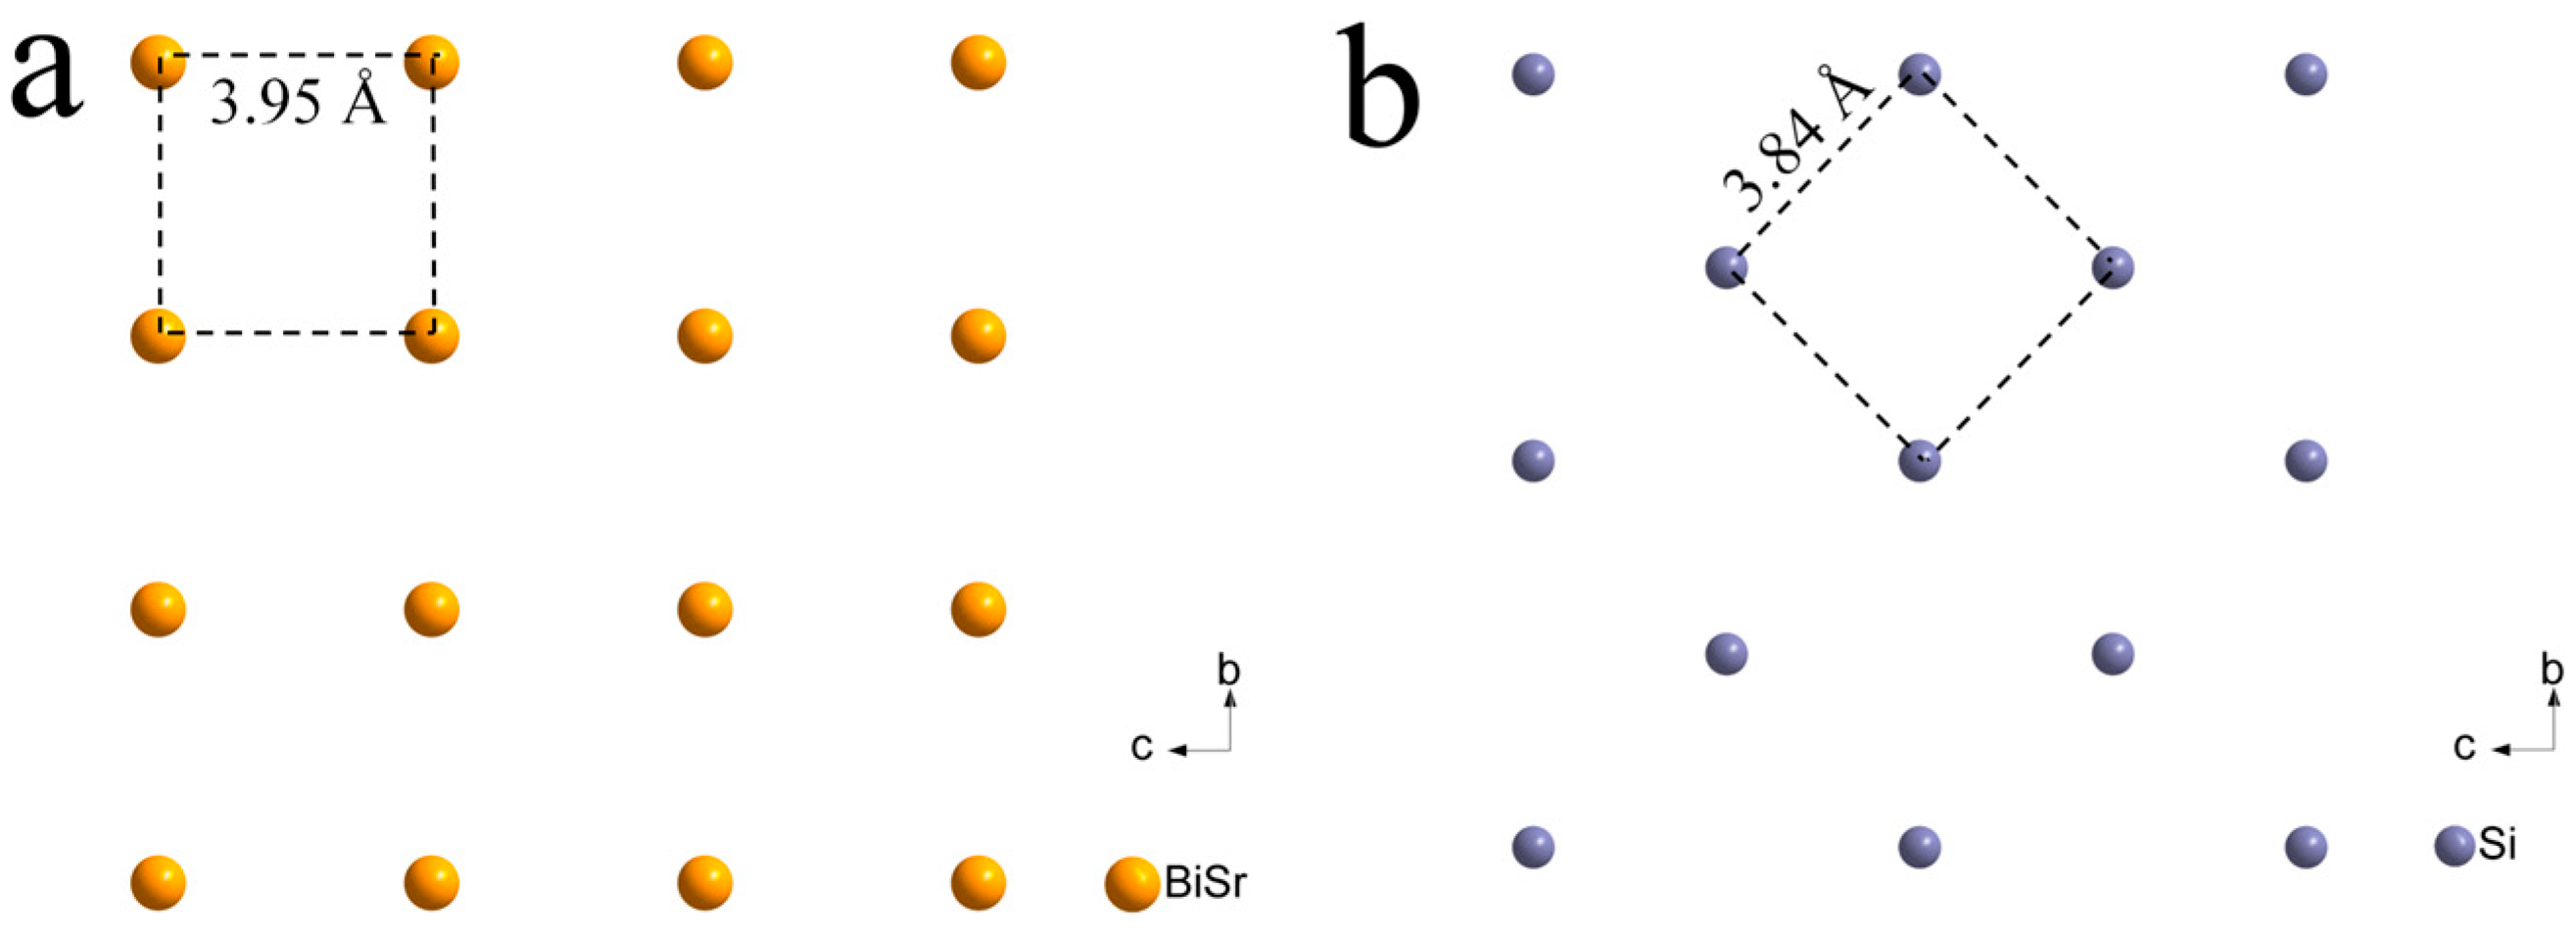
The XRD and GIXRD patterns of Bi1−xSrxFe1−xTixO3/Si thin films are shown in Figure 4a,b. According to the XRD patterns, apart from the diffraction peaks from the silicon substrate, only the (100) and (200) plane diffraction peaks of the Bi0.8Sr0.2Fe0.8Ti0.2O3/Si and Bi0.5Sr0.5Fe0.5Ti0.5O3/Si thin films were observed. This indicated that the cubic phase Bi1−xSrxFe1−xTixO3 films grown on Si(100) substrates exhibited a distinct (100) plane preferred orientation. This preferred orientation was primarily due to the low lattice mismatch between the cubic Sr,Ti:BiFeO3 thin films and the silicon substrate. Figure 5 illustrates the lattice structure of cubic Sr,Ti:BiFeO3(100) and Si(100). Based on the lattice mismatch formula, the mismatch between Sr,Ti:BiFeO3(100) and Si(100) was calculated to be only 2.8%. The GIXRD patterns of Bi1−xSrxFe1−xTixO3/Si thin films provided additional diffraction information. All diffraction peaks for the Bi0.8Sr0.2Fe0.8Ti0.2O3/Si and Bi0.5Sr0.5Fe0.5Ti0.5O3/Si thin films corresponded to the perovskite cubic phase. Overall, while the cubic phase Bi1-xSrxFe1-xTixO3/Si thin films remained polycrystalline, they exhibited a clear (100) plane preferred orientation. In contrast, the BiFeO3/Si thin film showed diffraction peaks corresponding to the (101) and (110) planes of the trigonal phase in the XRD pattern (Figure 4a). Moreover, additional peaks matching the standard reference card (JCPDS 14-0181) were visible in the GIXRD pattern (Figure 4b), confirming that the film retained a trigonal crystal structure with a minor presence of the secondary Bi25FeO40 phase.
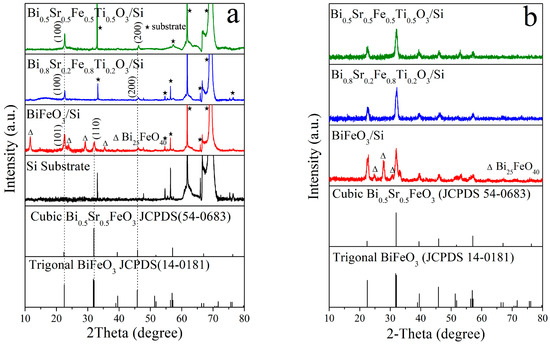
Figure 4.
(a) XRD and (b) GIXRD patterns of Bi1−xSrxFe1−xTixO3/Si thin films.

Figure 5.
Lattice diagram of (a) cubic Bi1−xSrxFe1−xTixO3(100) and (b) Si(100).
In summary, Sr2+ and Ti4+ ion co-doping effectively modulated the crystal structure of BiFeO3 from the trigonal to the cubic phase, significantly improving lattice matching with silicon. This represents a promising strategy for the fabrication of high-quality, silicon-based cubic Sr,Ti:BiFeO3 thin films suitable for integration into silicon-based devices.
3.2. Surface Morphology and Thickness
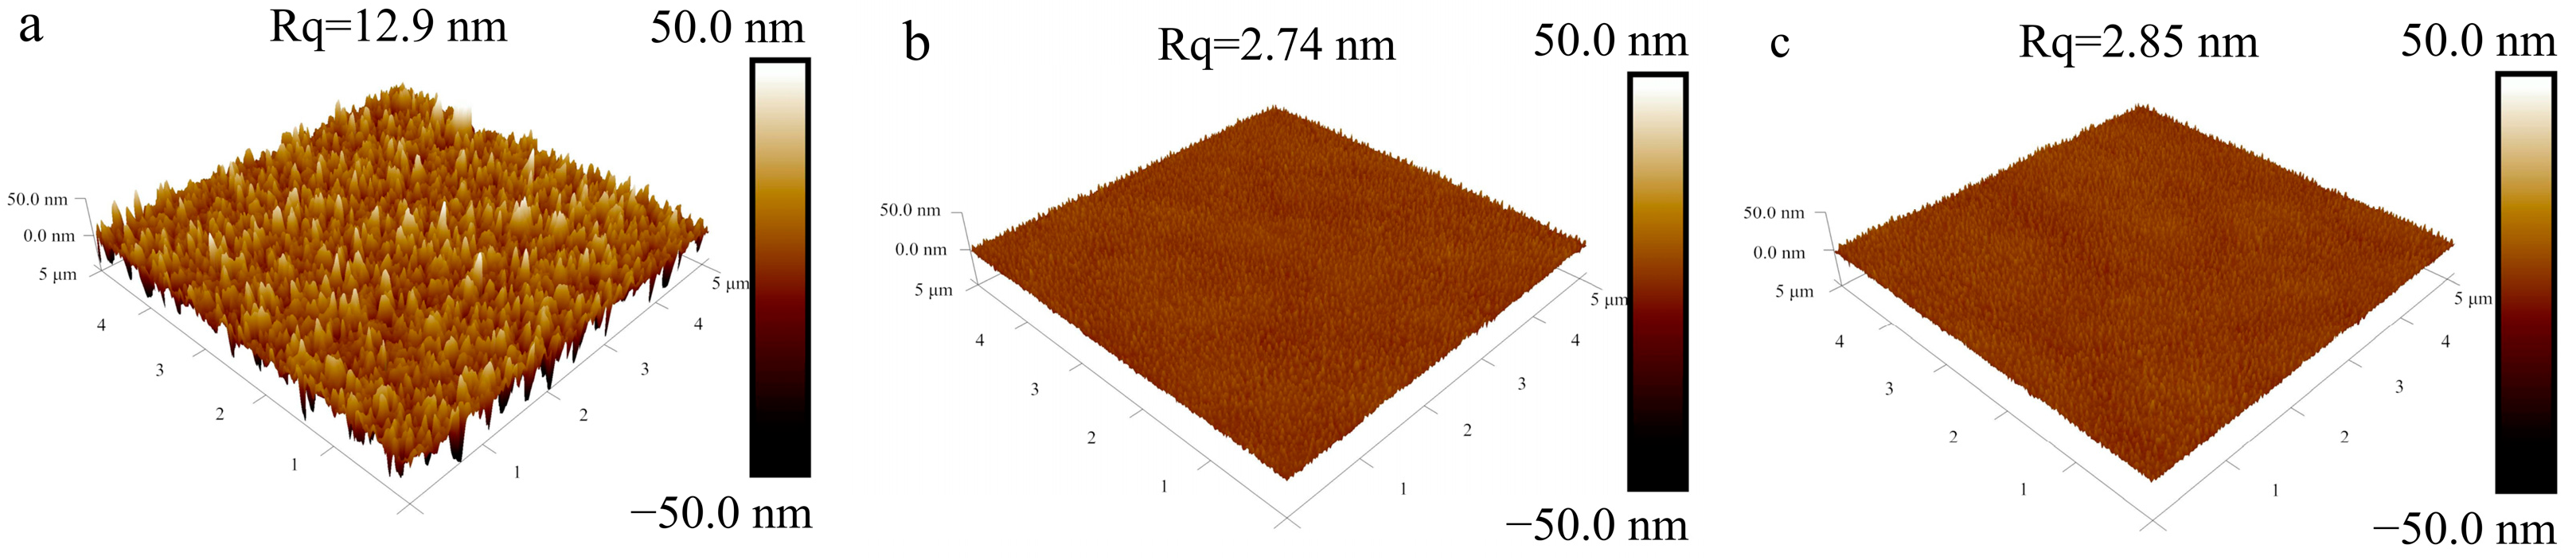
The film-forming quality of the samples was evaluated using AFM, as shown in Figure 6. The AFM images revealed that the surfaces of the Bi1−xSrxFe1−xTixO3/Si films exhibited well-developed crystallization with uniformly distributed particles and no visible cracks. The root mean square (RMS) roughness (Rq) values for the Bi0.8Sr0.2Fe0.8Ti0.2O3/Si and Bi0.5Sr0.5Fe0.5Ti0.5O3/Si films were measured to be 2.74 nm and 2.85 nm, respectively, i.e., significantly lower than the 12.9 nm roughness of the BiFeO3/Si thin film prepared under identical conditions.

Figure 6.
AFM 3D images of (a) annealed BiFeO3/Si, (b) Bi0.8Sr0.2Fe0.8Ti0.2O3/Si, and (c) Bi0.5Sr0.5Fe0.5Ti0.5O3/Si thin films.
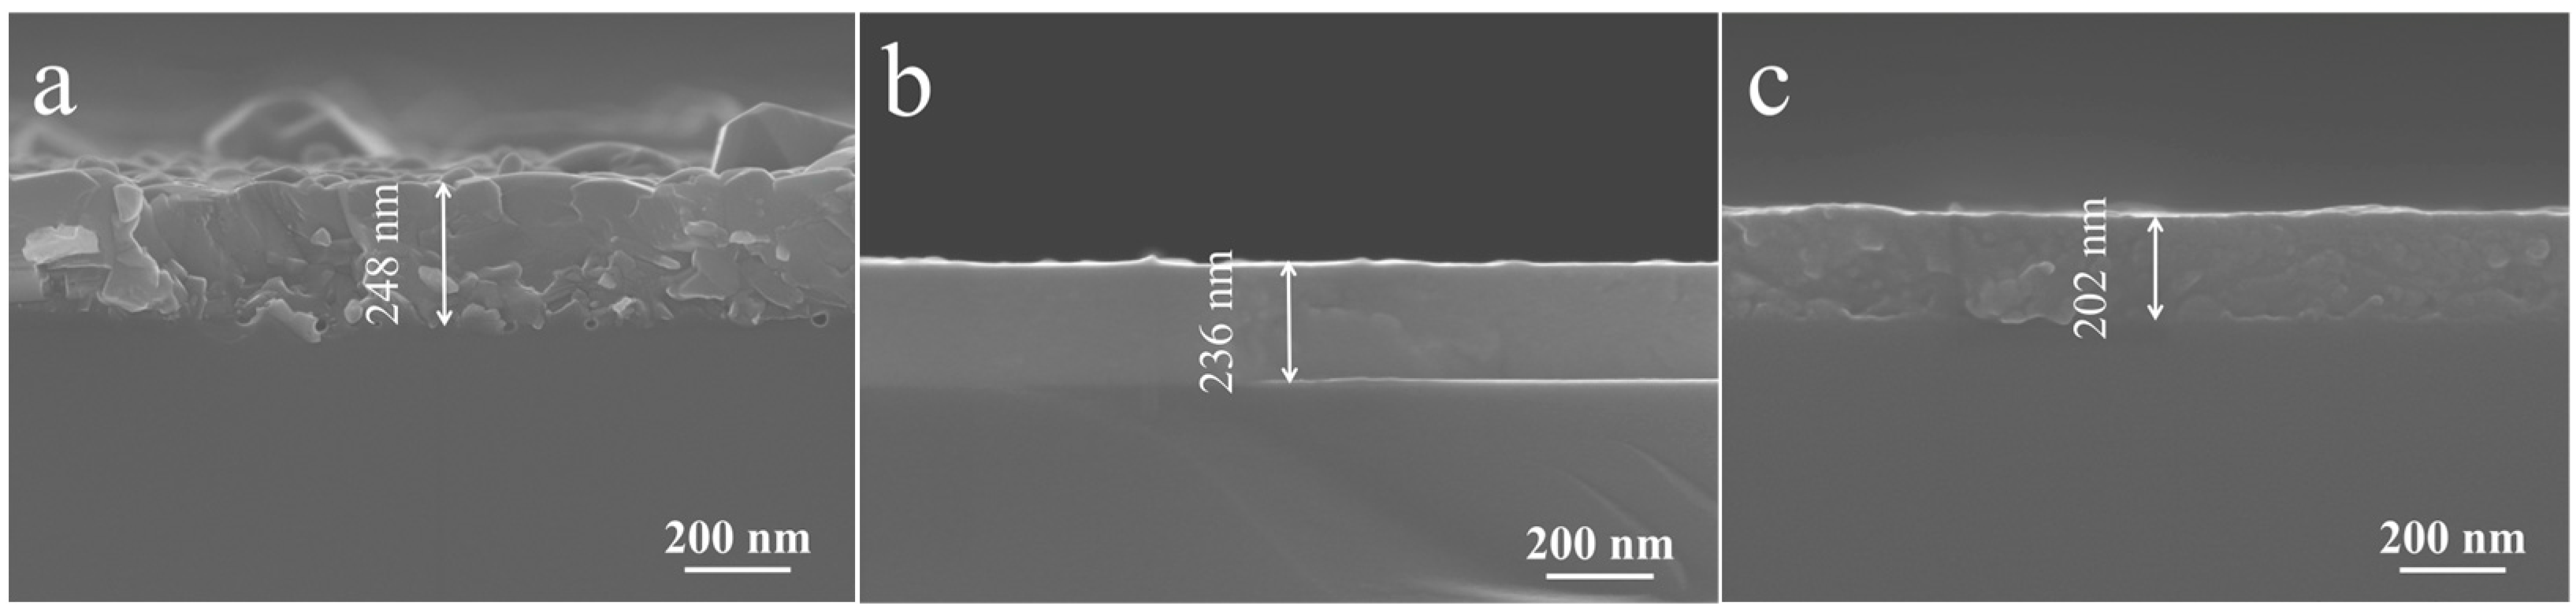
The surface morphology and thickness of the films were analyzed using SEM, as shown in Figure 7. The measured thicknesses of the BiFeO3/Si, Bi0.8Sr0.2Fe0.8Ti0.2O3/Si, and Bi0.5Sr0.5Fe0.5Ti0.5O3/Si thin films after 1.5 h of sputtering were 248 nm, 236 nm, and 202 nm, respectively. The SEM images also revealed that the BiFeO3/Si thin film exhibited a rough surface with uneven grain sizes, which could be attributed to the large lattice mismatch between BiFeO3 and the silicon substrate. This mismatch led to strong optical scattering at the grain boundaries and negatively affected the optical transmission properties of the thin film. In contrast, the Bi0.8Sr0.2Fe0.8Ti0.2O3/Si and Bi0.5Sr0.5Fe0.5Ti0.5O3/Si thin films exhibited significantly improved film-forming quality, with fewer grain boundaries and smoother surfaces. This enhancement was due to the reduced lattice mismatch between the cubic-phase Sr,Ti:BiFeO3 and the silicon substrate, which strengthened the film-substrate adhesion and promoted superior film formation.
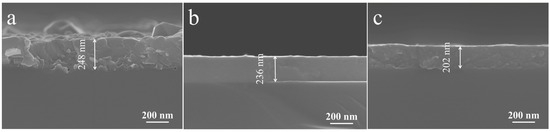
Figure 7.
Cross-section SEM images of annealed (a) BiFeO3/Si, (b) Bi0.8Sr0.2Fe0.8Ti0.2O3/Si, and (c) Bi0.5Sr0.5Fe0.5Ti0.5O3/Si thin films.
3.3. Valence State
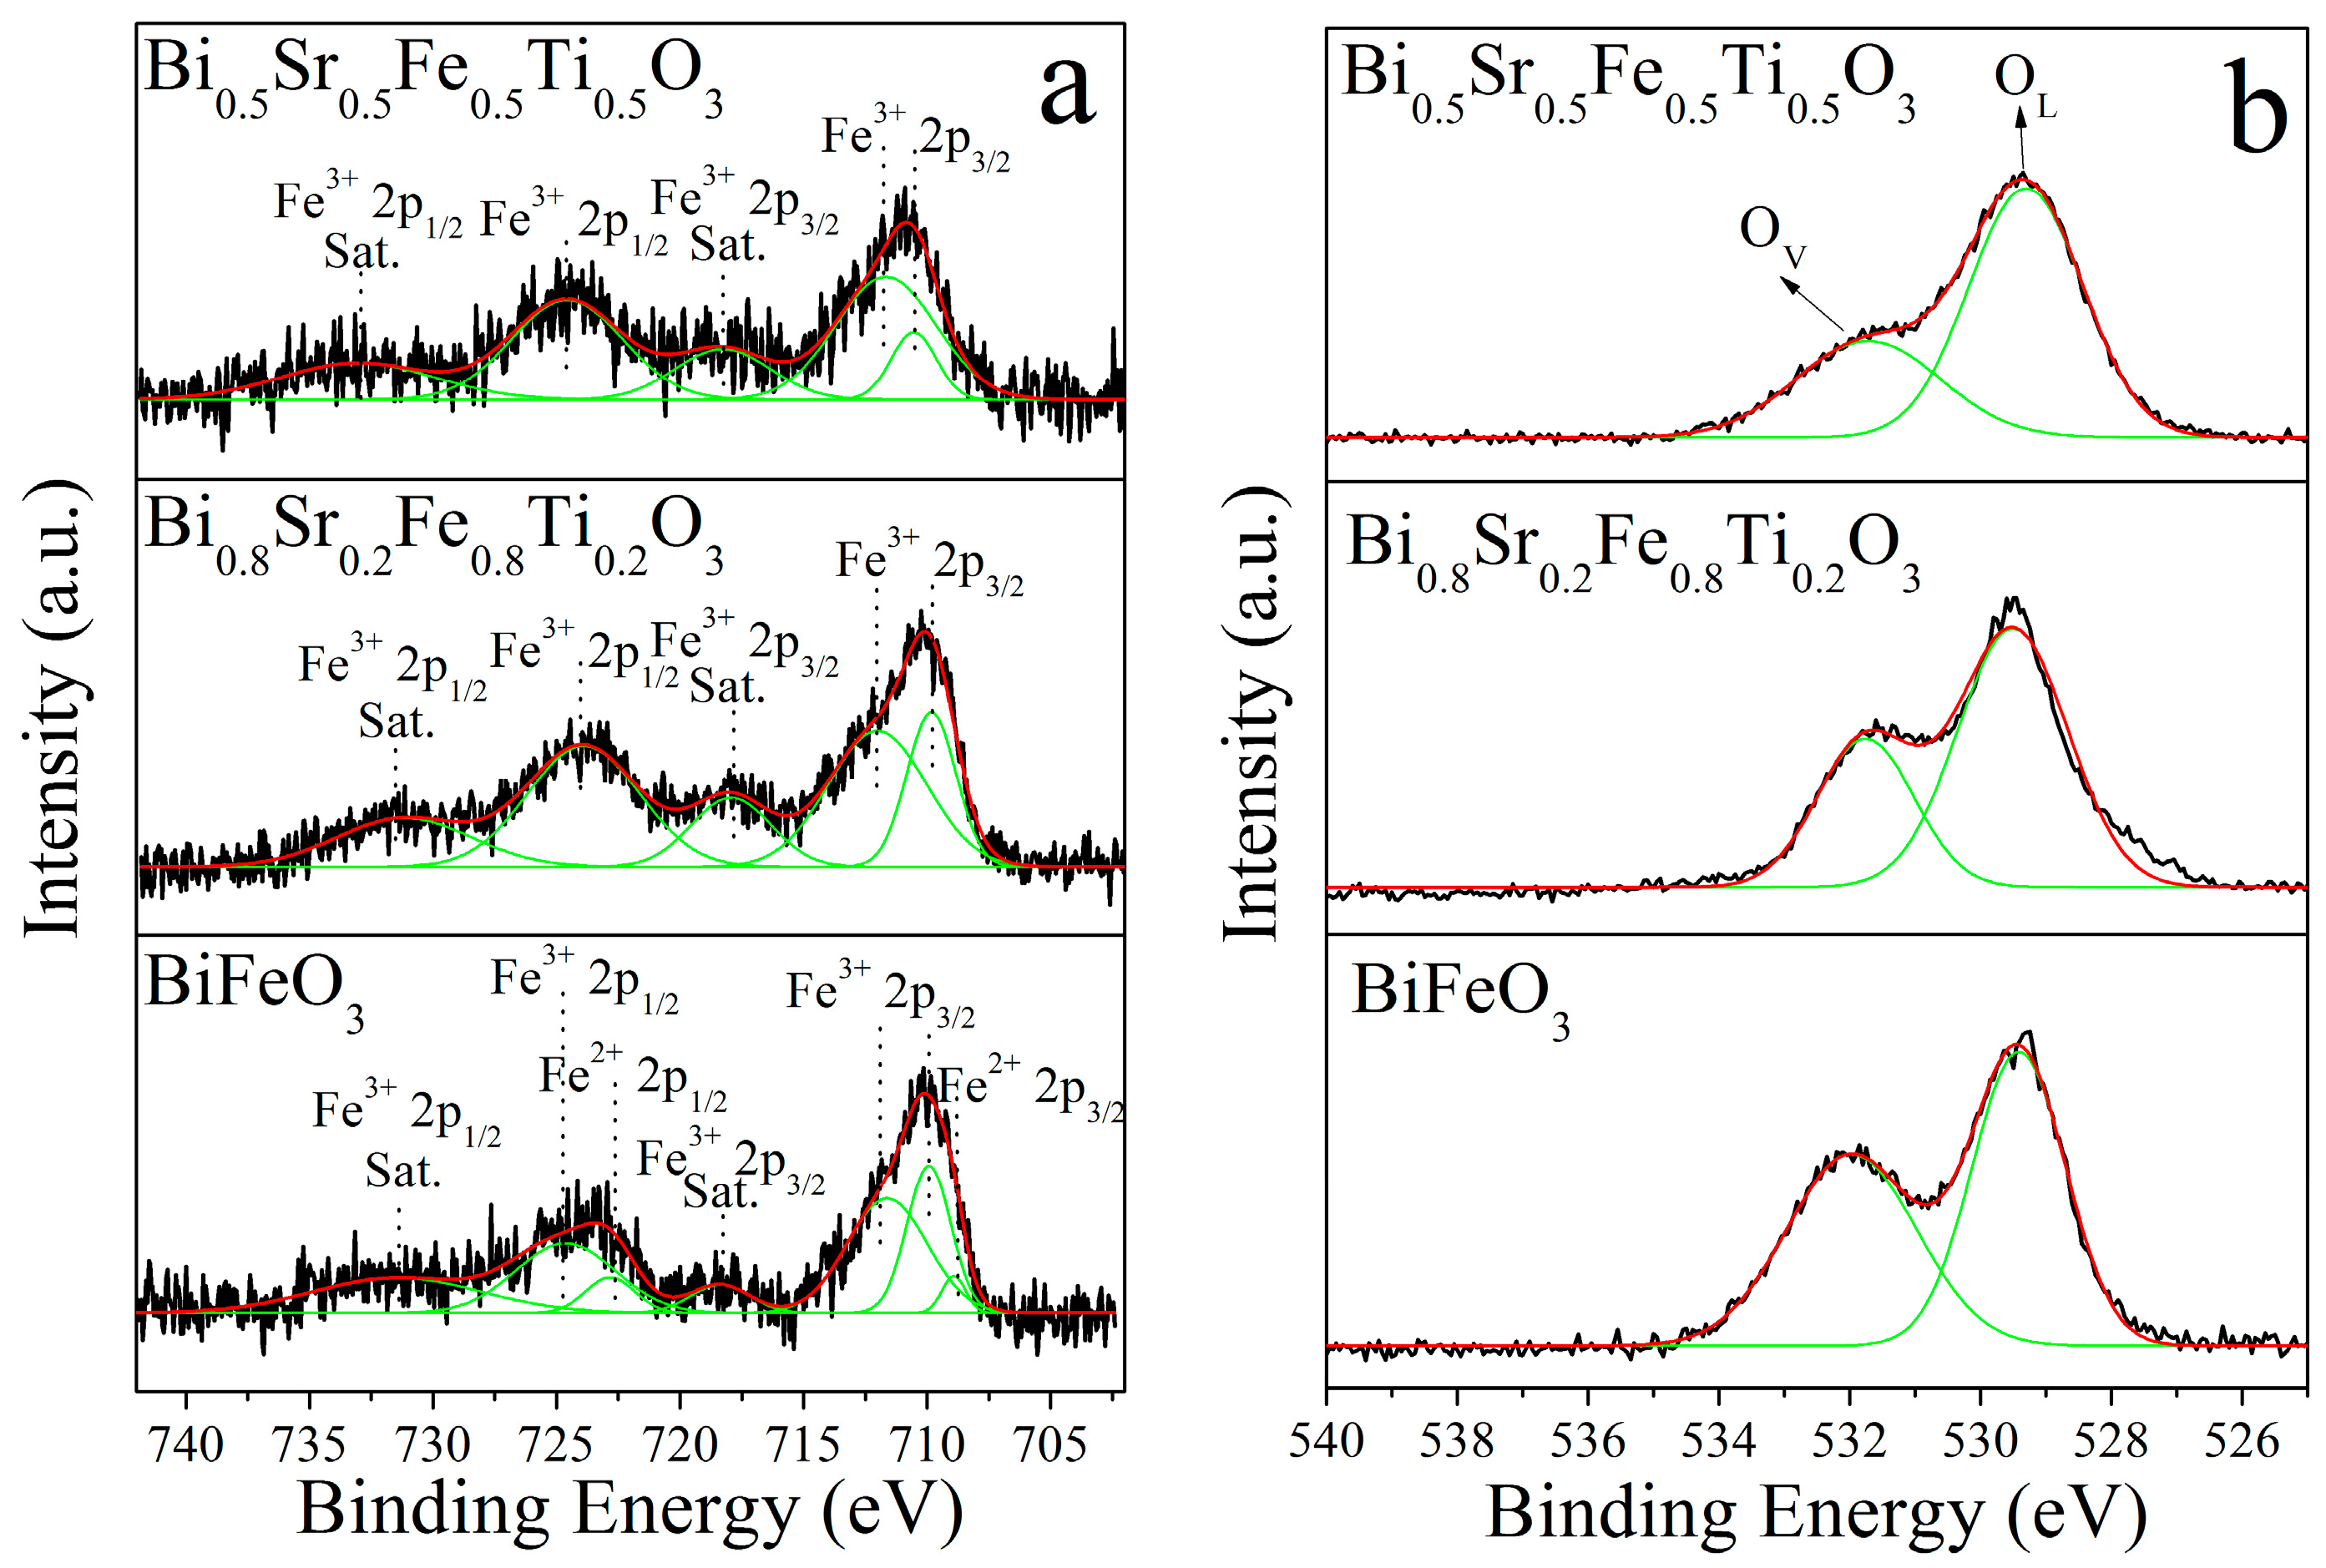
The presence of Fe2+ ions and oxygen vacancies can influence the optical transmittance of a film, while the valence state of Fe ions also affects its magnetic properties. Figure 8a shows the Fe 2p XPS spectra of Bi1−xSrxFe1−xTixO3/Si thin films. According to the relevant literature, the Fe3+ 2p1/2 characteristic peak and its satellite peak were located at 724 eV and 733 eV, respectively [27]. The Fe3+ 2p3/2 characteristic peak appeared within the range of 710–713 eV, with its corresponding satellite peak at 718 eV [27,28]. Thus, the Fe ions in the cubic Bi0.8Sr0.2Fe0.8Ti0.2O3/Si and Bi0.5Sr0.5Fe0.5Ti0.5O3/Si thin films were confirmed to be entirely in the trivalent state. In contrast, the Fe 2p XPS spectrum of the BiFeO3/Si thin film displayed not only the Fe3+ peaks but also characteristic peaks corresponding to Fe2+ 2p1/2 and Fe2+ 2p3/2 states, indicating the partial presence of Fe2+ ions. The fitting peak area ratio (Fe2+/(Fe3+ + Fe2+)) of the lowest binding energy states was used to estimate the relative Fe2+ content in the BiFeO3/Si film, calculated to be approximately 5.3%. This may have been due to the tendency of BiFeO3 films to form the Bi25FeO40 impurity phase during preparation, leading to the partial reduction of Fe3+ to Fe2+ ions. The O 1s XPS spectra of Bi1−xSrxFe1−xTixO3/Si thin films are shown in Figure 8b. According to the literature, the peak at 529.7 eV (OL) corresponded to lattice oxygen, while the peak at 531.7 eV (OV) was associated with low-valence oxygen species and oxygen vacancy defects [29,30]. As observed in the spectra, all films, including BiFeO3/Si, Bi0.8Sr0.2Fe0.8Ti0.2O3/Si, and Bi0.5Sr0.5Fe0.5Ti0.5O3/Si, exhibited both lattice oxygen and oxygen vacancy-related peaks. However, with increasing Sr2+ and Ti4+ co-doping content, the intensity of the 531.7 eV peak decreased significantly. This indicated that co-doping with Sr2+ and Ti4+ effectively reduced the concentration of low-valence oxygen states and oxygen vacancy defects in BiFeO3.
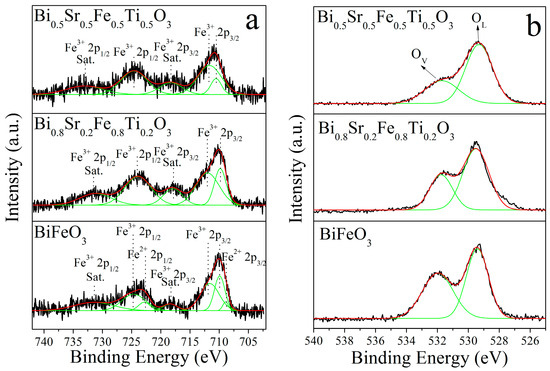
Figure 8.
(a) Fe 2p, (b) O 1s XPS spectra and fitting curves of Bi1−xSrxFe1−xTixO3/Si thin films.
3.4. Transmittance
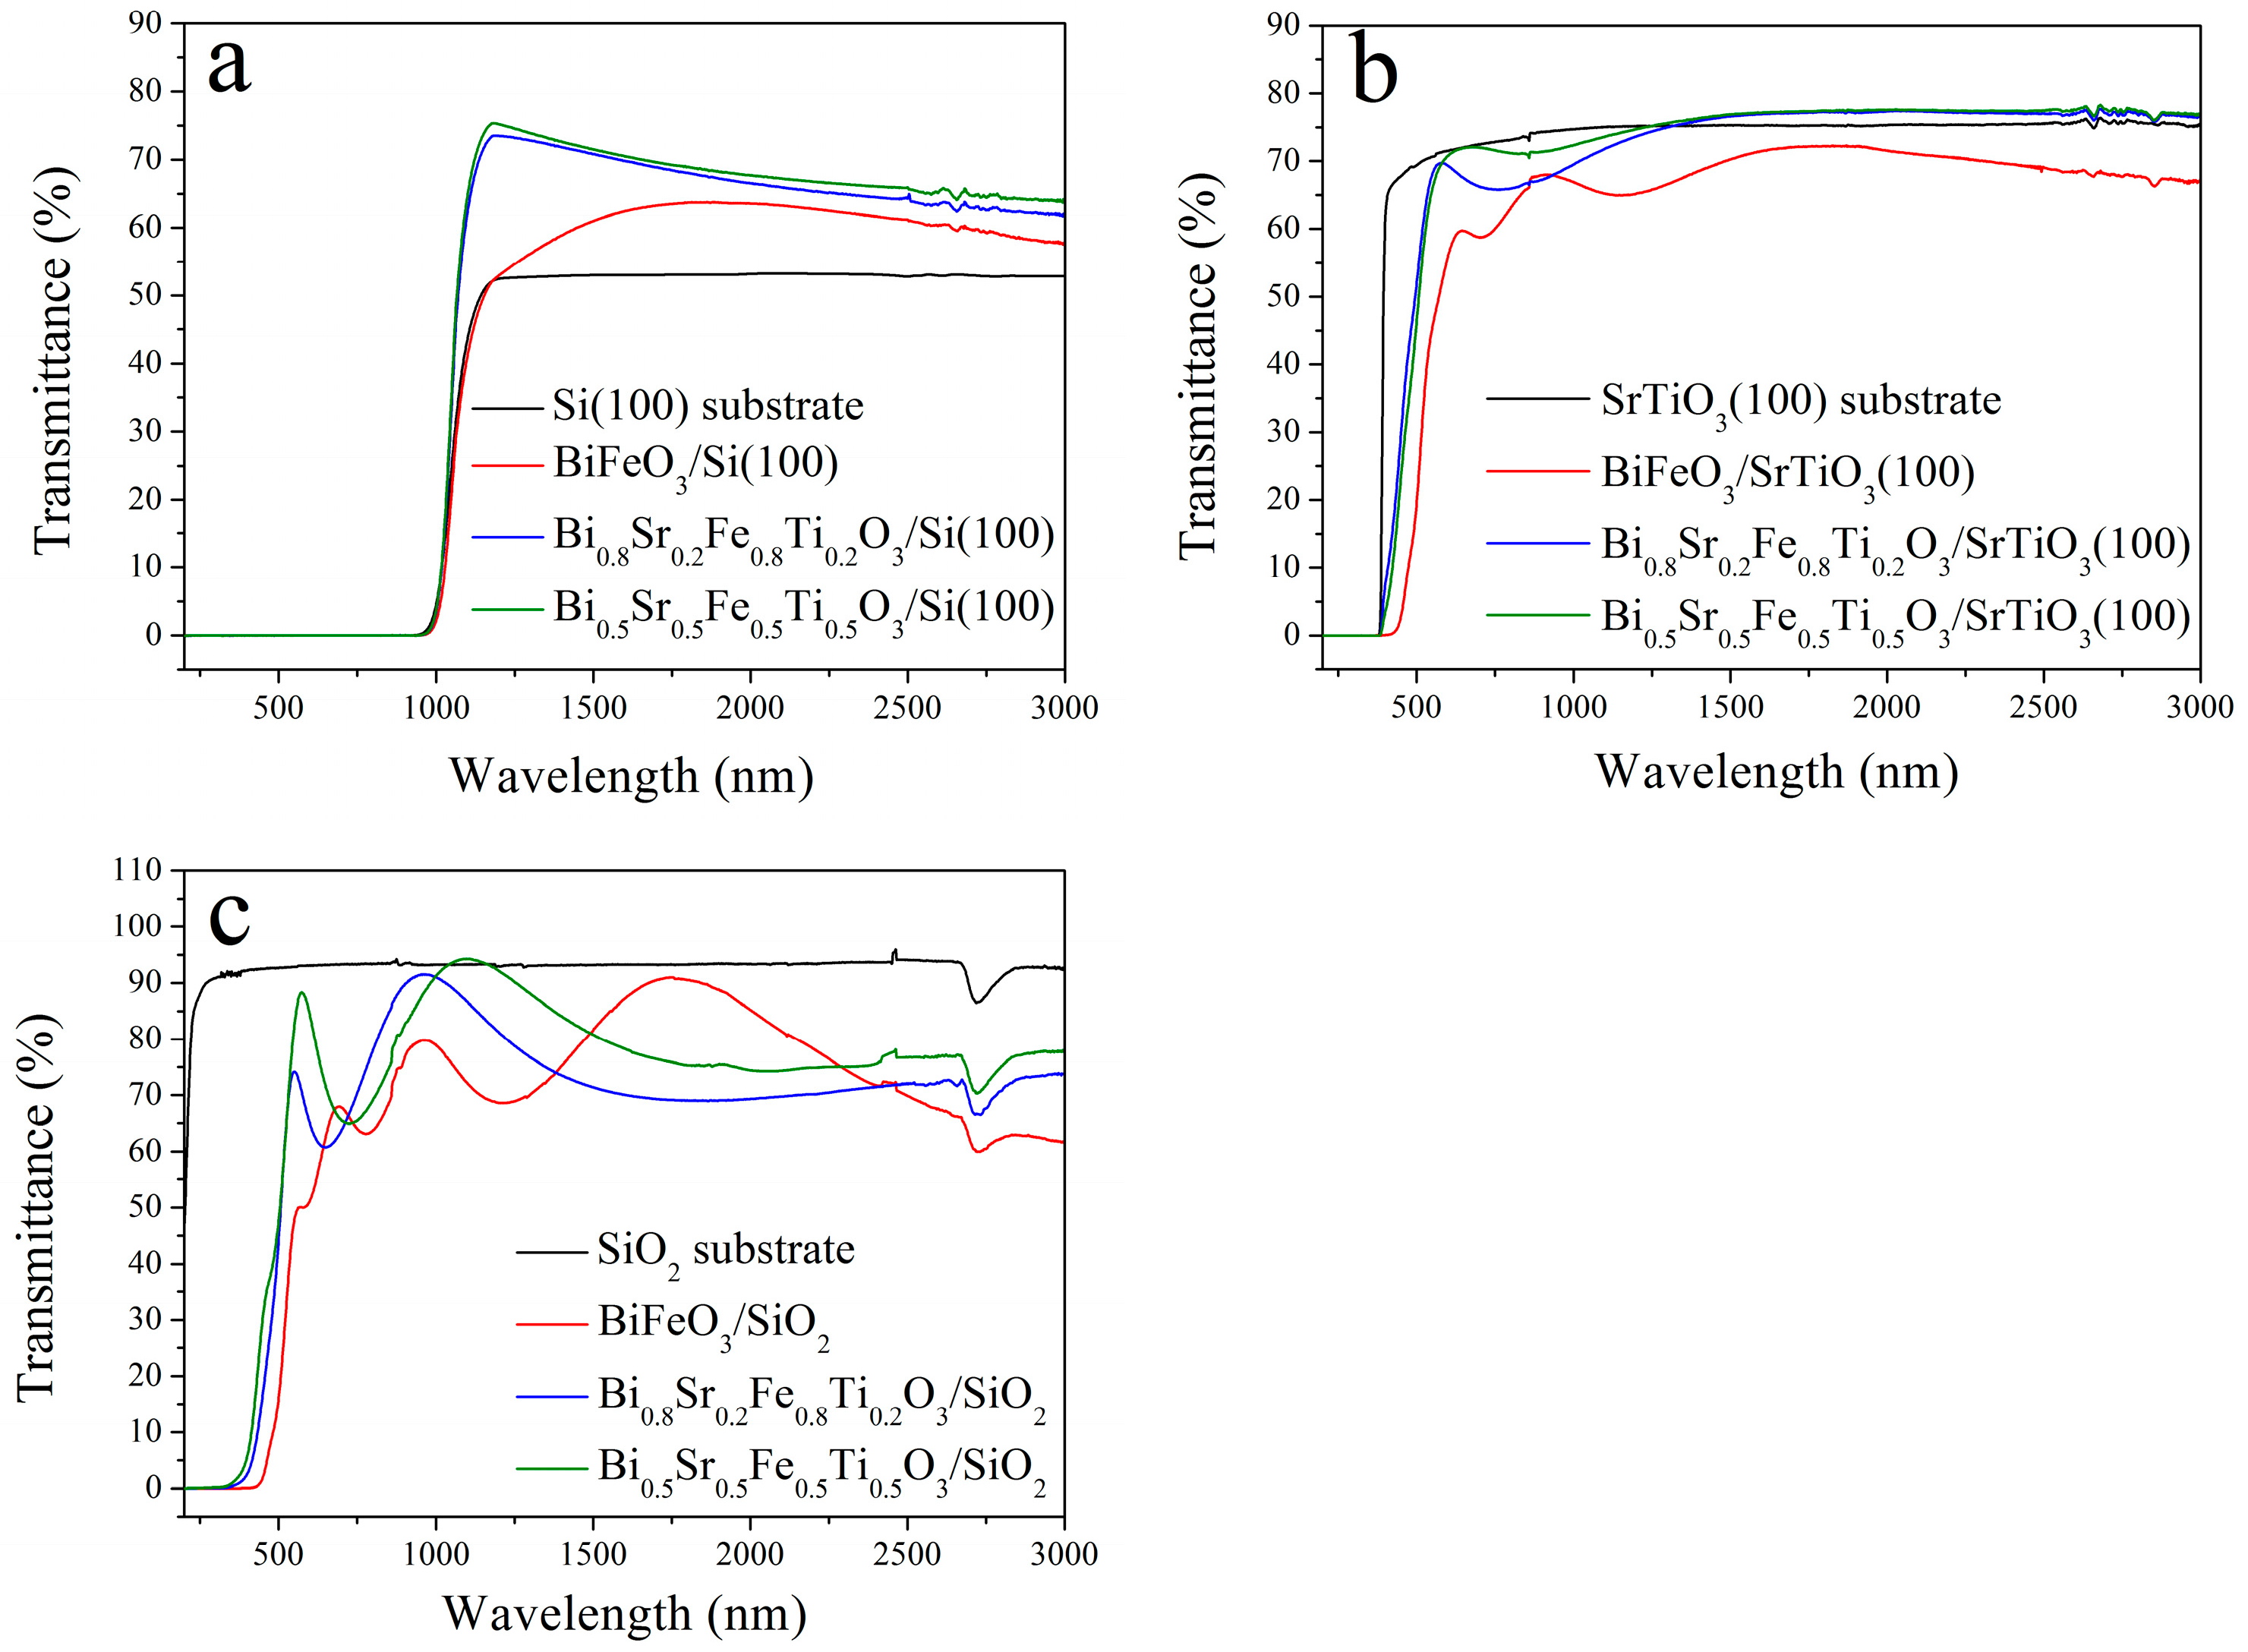
Studying the optical loss mechanisms of thin films is essential for improving the magneto-optical performance of materials and for developing low-loss, silicon-based optical isolation devices. Figure 9a shows the transmittance spectra of annealed Bi1−xSrxFe1−xTixO3/Si thin films in the UV-VIS and near-infrared regions. As shown, the transmittance curves of Bi0.8Sr0.2Fe0.8Ti0.2O3/Si (236 nm) and Bi0.5Sr0.5Fe0.5Ti0.5O3/Si (202 nm) were very similar, indicating that film thickness had little influence on the transmittance. In contrast, the lower transmittance of the BiFeO3/Si film could be mainly attributed to its greater surface roughness, as evidenced in Figure 6a and Figure 7a, which led to increased optical scattering and higher transmission losses.
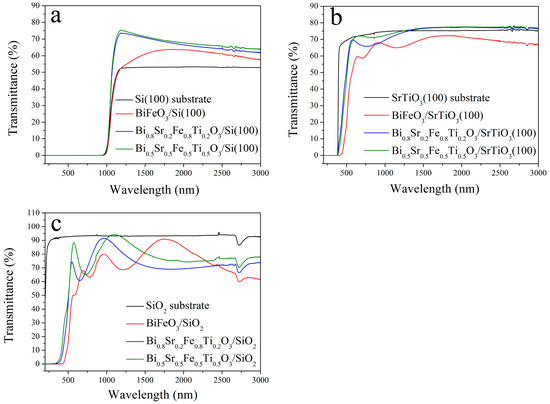
Figure 9.
Transmittance spectra of the Bi1−xSrxFe1−xTixO3 thin films deposited on (a) Si, (b) STO and (c) Si substrates.
The Bi0.8Sr0.2Fe0.8Ti0.2O3/Si and Bi0.5Sr0.5Fe0.5Ti0.5O3/Si films exhibited transmittance values ranging from 60% to 75% in the 1000–3000 nm wavelength range, i.e., significantly higher than that of the silicon substrate. This improvement was mainly due to the large absorption of the bare silicon wafer; when coated with high-quality thin films, an anti-reflection effect occurred, enhancing transmittance. Moreover, the transmittance curves of the Bi0.8Sr0.2Fe0.8Ti0.2O3/Si and Bi0.5Sr0.5Fe0.5Ti0.5O3/Si films were smooth, owing to the similar refractive indices of the Si substrate and the perovskite ferrite films, which weakened the light interference effect between them. Additionally, the absence of discernible absorption peaks in the transmittance spectra of the cubic Bi1−xSrxFe1−xTixO3/Si films suggested high film quality and low optical loss, rendering these films suitable for integration into silicon-based magneto-optical devices.
In contrast, the trigonal BiFeO3/Si film showed significantly lower transmittance compared to the cubic Bi1−xSrxFe1−xTixO3/Si films. This could be attributed to its higher surface roughness, stronger grain boundary scattering, and higher concentration of oxygen vacancies, all of which contributed to greater optical loss and reduced transmission performance. Furthermore, the transmittance curve of the BiFeO3/Si film showed a pronounced decline below 1800 nm, likely due to the presence of Fe2+ ions that exhibited absorption near 1200 nm [31].
Overall, the superior film quality and improved lattice matching between the cubic Bi1−xSrxFe1−xTixO3 films and the silicon substrate resulted in excellent optical properties and much higher transmittance compared to the BiFeO3/Si film. Similarly, as shown in Figure 9b, the Bi0.8Sr0.2Fe0.8Ti0.2O3/STO and Bi0.5Sr0.5Fe0.5Ti0.5O3/STO thin films also exhibited good transmittance, ranging from 70% to 80% in the visible and near-infrared regions. However, due to the presence of minor impurity phases, the transmittance of the BiFeO3/STO film was reduced to approximately 60–70%.
Since the absorption edges of Si and STO were located near 1000 nm and 380 nm, respectively, the absorption edges of the Bi1-xSrxFe1-xTixO3/Si and Bi1−xSrxFe1−xTixO3/STO films were influenced by those of the respective substrates. To obtain the intrinsic absorption edge of the Bi1−xSrxFe1−xTixO3 films, their transmittance spectra were also measured on SiO2 substrates, as shown in Figure 9c. The transmittance curves displayed periodic oscillations caused by optical interference effects resulting from the refractive index differences between the substrate and the film [32].
Moreover, Sr2+ and Ti4+ co-doping caused a significant blue shift in the absorption edge of the cubic Bi1−xSrxFe1−xTixO3 thin films compared to the trigonal BiFeO3 film. The absorption edges for BiFeO3, Bi0.8Sr0.2Fe0.8Ti0.2O3, and Bi0.5Sr0.5Fe0.5Ti0.5O3 films were 423 nm, 319 nm, and 312 nm, respectively. This shift was primarily attributed to the smaller grain sizes of the cubic-phase Bi1−xSrxFe1−xTixO3 films compared to the trigonal-phase BiFeO3 film. The resulting quantum confinement effect increased the energy level separation as the grain size decreased, causing a blue shift in the absorption edge [33].
3.5. Magnetism
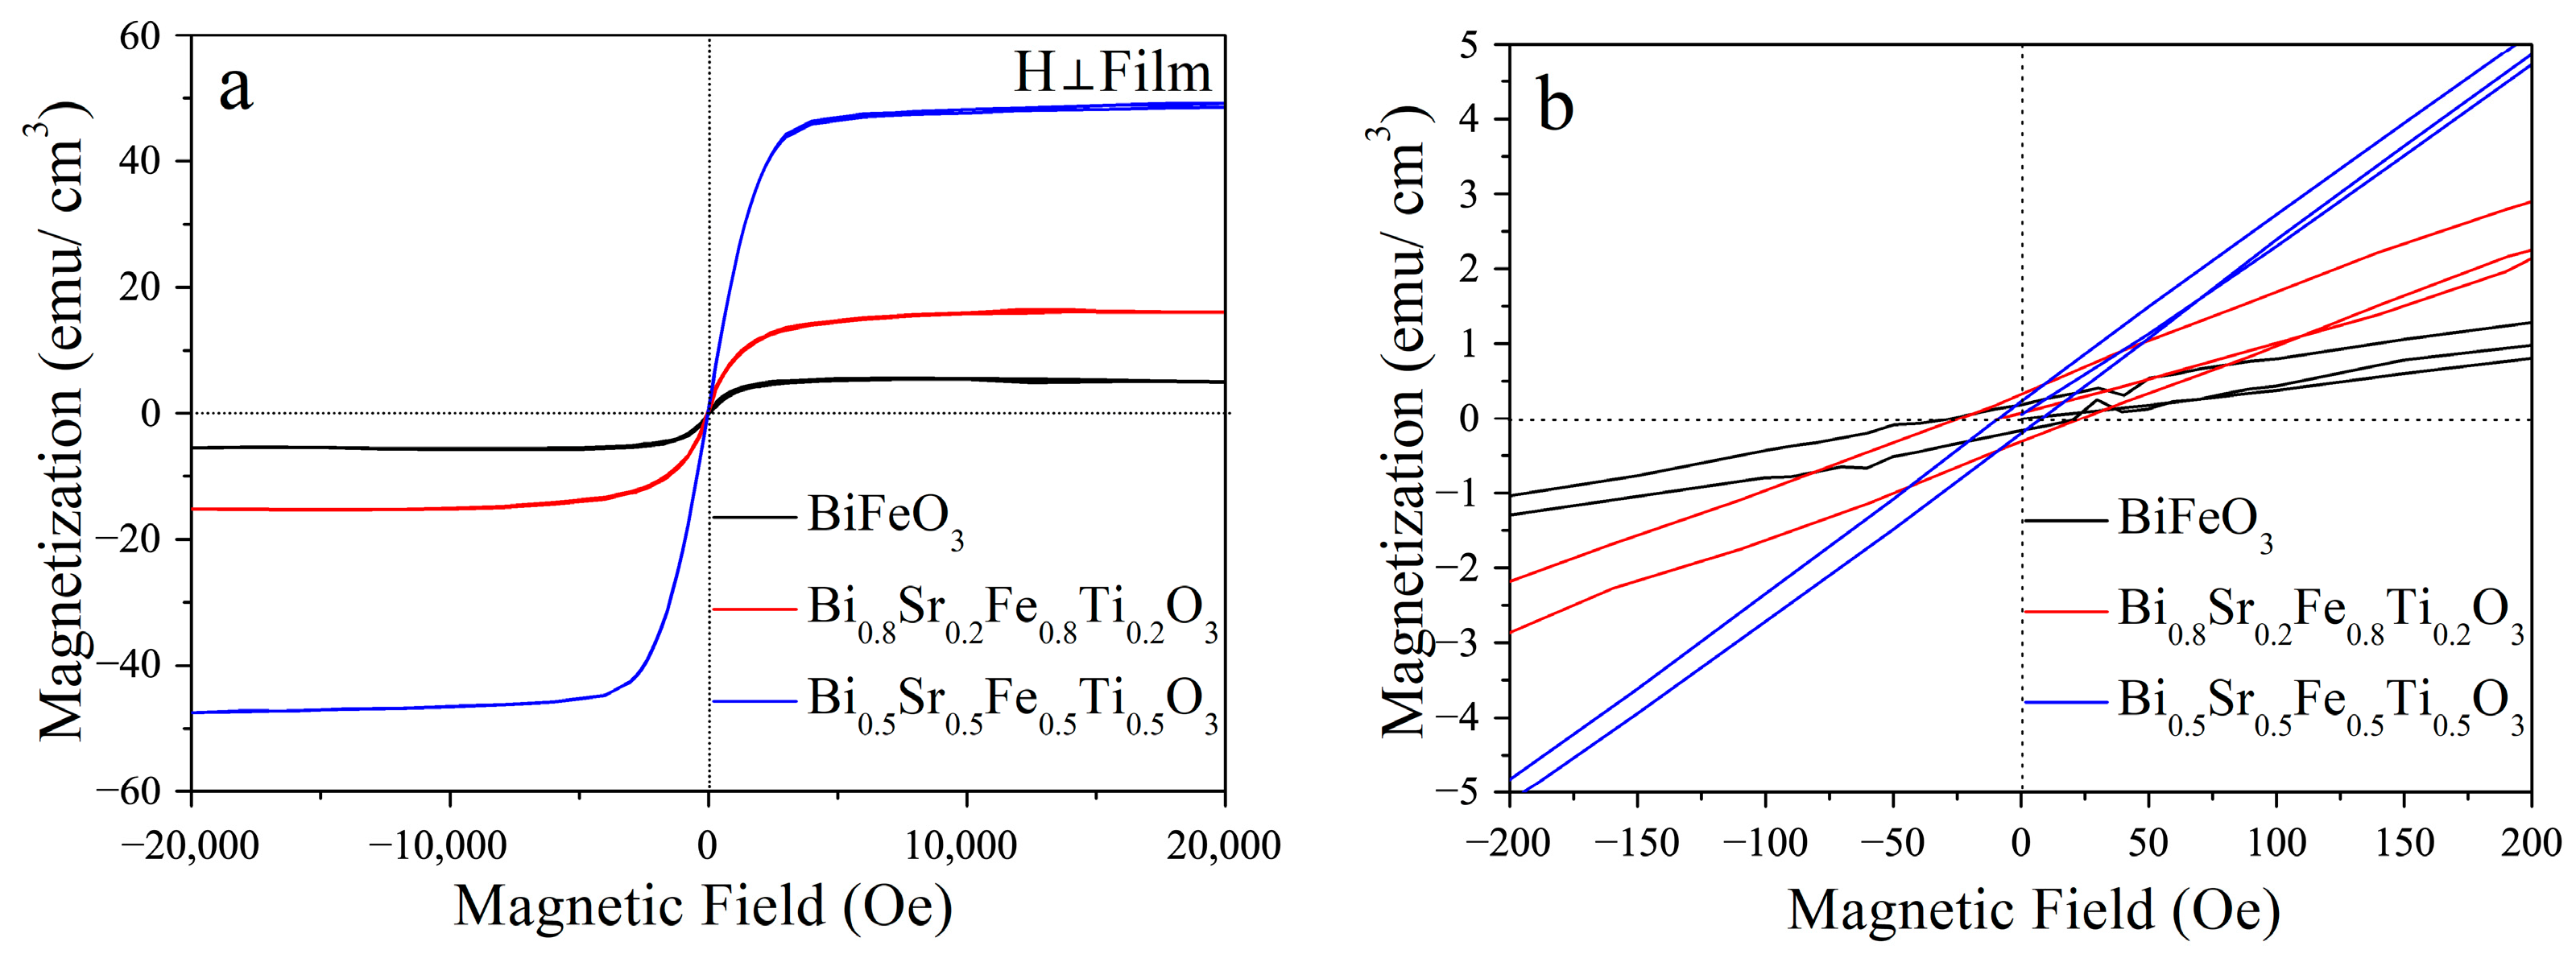
Figure 10 shows the magnetic hysteresis loops of Bi1−xSrxFe1−xTixO3/Si thin films measured at room temperature. The maximum applied magnetic field was 20,000 Oe, with the field direction oriented perpendicular to the film surface (out-of-plane). As seen in Figure 10a, the saturation magnetization (Ms) of the Bi1−xSrxFe1−xTixO3/Si films significantly increased with the Sr2+ and Ti4+ co-doping concentration. Specifically, the Ms of the BiFeO3/Si film was only 5.0 emu/cm3, whereas that of the Bi0.8Sr0.2Fe0.8Ti0.2O3/Si and Bi0.5Sr0.5Fe0.5Ti0.5O3/Si films rose to 17.5 emu/cm3 and 48.0 emu/cm3, respectively. Compared to trigonal BiFeO3, the cubic Bi0.5Sr0.5Fe0.5Ti0.5O3 film exhibited a markedly enhanced magnetic response. This improvement was primarily attributed to the substitution of Fe3+ ions by Ti4+ ions at the B-site, which disrupted the helical G-type antiferromagnetic structure inherent to BiFeO3, thereby significantly enhancing its macroscopic magnetization [34]. Additionally, as shown in Figure 10b, the coercive force (Hc) values for the BiFeO3/Si and Bi0.8Sr0.2Fe0.8Ti0.2O3/Si thin films were both approximately 50 Oe. In contrast, the Hc of the Bi0.5Sr0.5Fe0.5Ti0.5O3/Si film decreased to 20 Oe, indicating improved soft magnetic properties. According to previous studies, magneto-optical materials that exhibit high saturation magnetization and low coercivity are well-suited for use in magneto-optical modulators, switches, sensors, and related devices [35,36]. Therefore, the Bi0.5Sr0.5Fe0.5Ti0.5O3/Si thin film, with its combination of high saturation magnetization and low coercivity, holds great promise for application in these magneto-optical technologies.
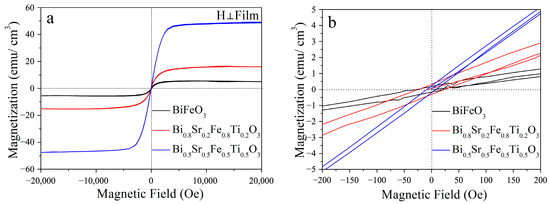
Figure 10.
(a) Magnetic hysteresis loop and (b) coercive force of Bi1−xSrxFe1−xTixO3/Si thin films.
3.6. Magneto-Optical Performance
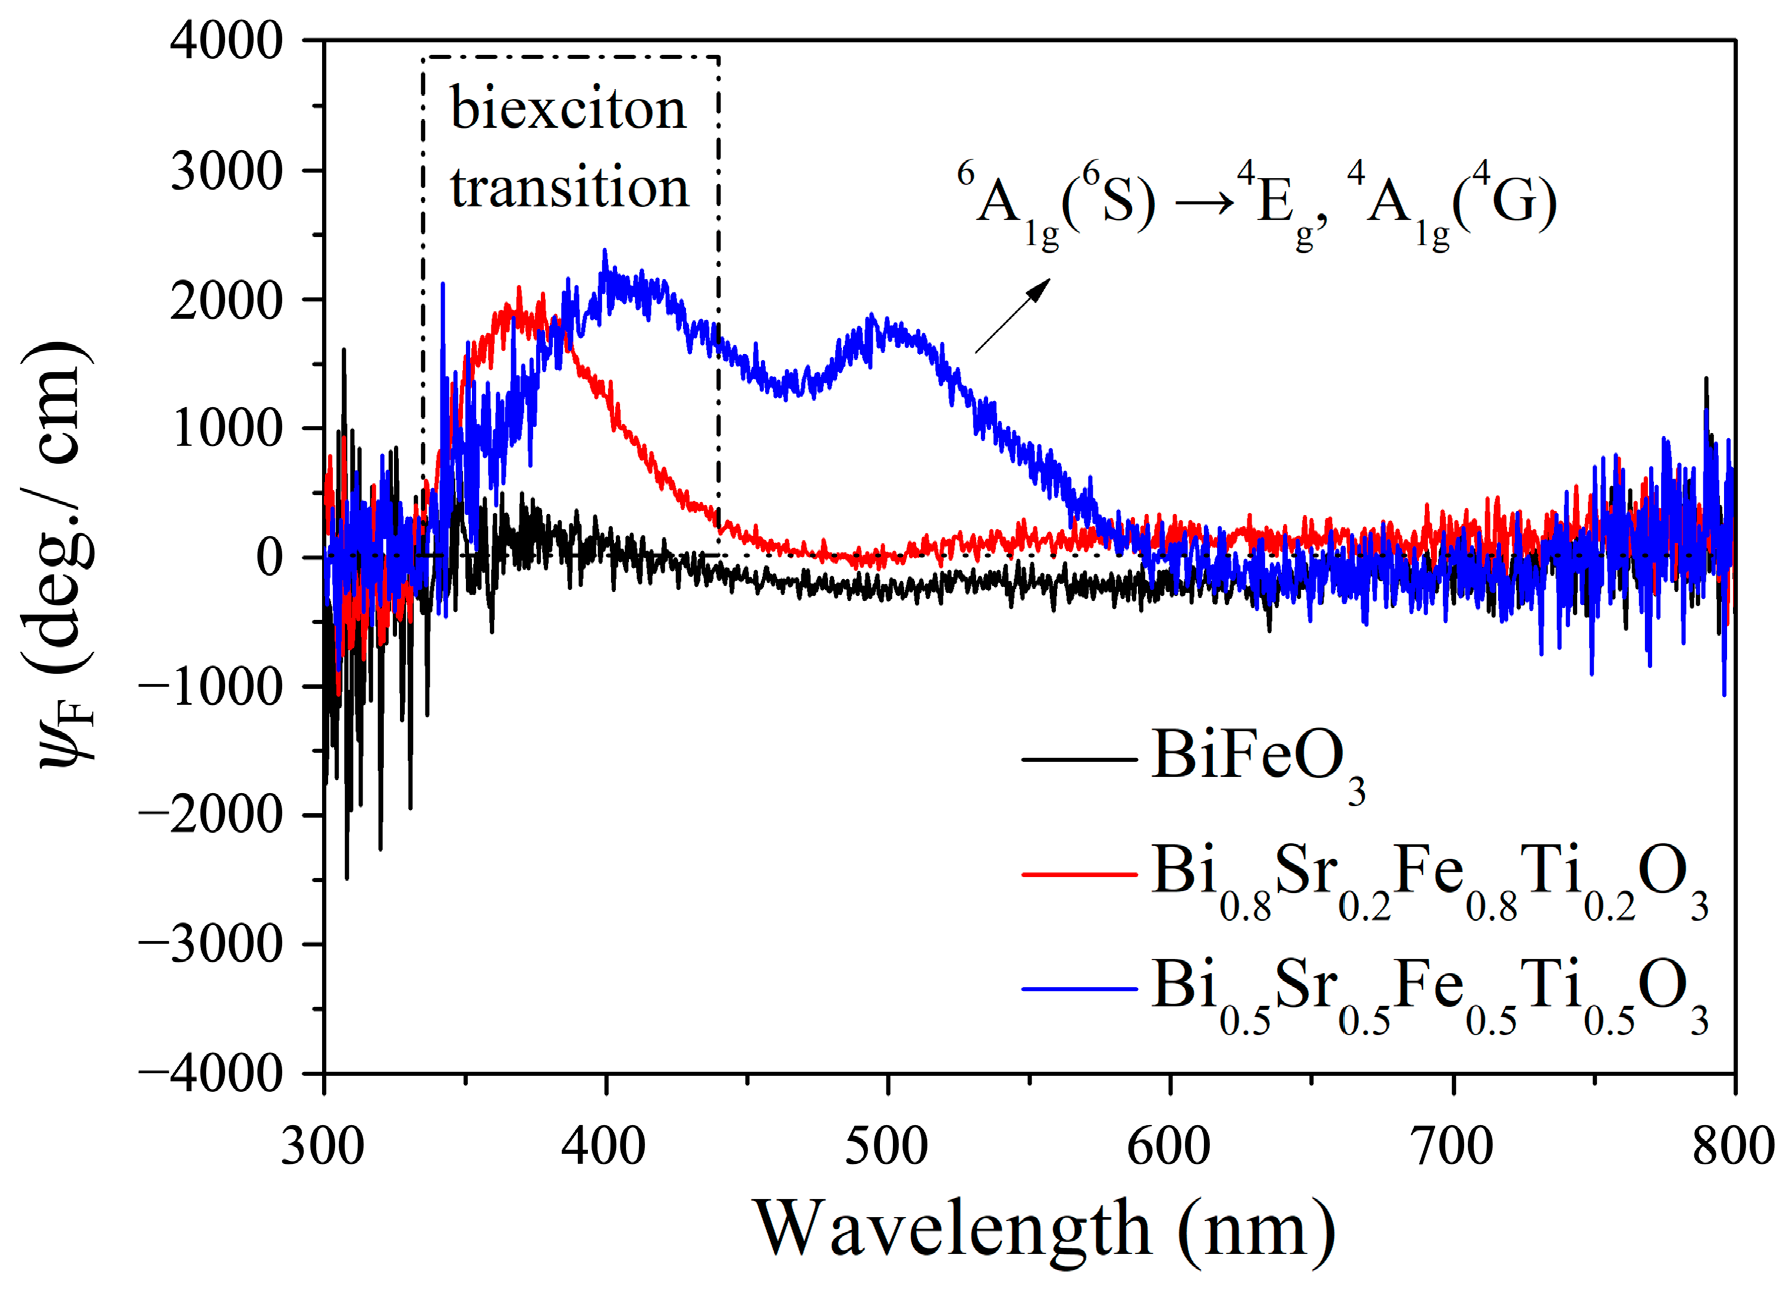
The MCD arises from the difference in absorption coefficients between left-handed and right-handed circularly polarized light in the presence of a magnetic field. Materials exhibiting a strong MCD response have promising applications in optical modulation, sensing, spintronics, magneto-optical imaging, and related fields. Figure 11 presents the MCD spectra of Bi1−xSrxFe1−xTixO3/SiO2 thin films in the 300–800 nm wavelength range, measured under an applied magnetic field of 2500 Oe. As shown, the BiFeO3/SiO2 film exhibited no detectable MCD signal under these conditions, whereas the Bi0.8Sr0.2Fe0.8Ti0.2O3/SiO2 and Bi0.5Sr0.5Fe0.5Ti0.5O3/SiO2 thin films displayed distinct MCD signal peaks, indicating a pronounced magnetic circular dichroism effect. For the Bi0.8Sr0.2Fe0.8Ti0.2O3/SiO2 film, a strong MCD peak appeared at 372 nm, attributed to the paramagnetic double exciton transition, with a corresponding MCD ellipticity (ψF) value of approximately 2000 deg./cm. In contrast, the Bi0.5Sr0.5Fe0.5Ti0.5O3/SiO2 film exhibited prominent MCD peaks at around 400 nm and 500 nm, corresponding to a double exciton transition and 6A1g(6S)→4E9, 4A1g(4G) electronic transitions, respectively [37,38]. The maximum MCD ψF value reached 2200 deg./cm, exceeding that of Ce3+:YIG (1700 deg./cm under a magnetic field of 5000 Oe) [39]. This result indicated that the magneto-optical effect of Bi1−xSrxFe1−xTixO3 was significantly enhanced with increasing Sr2+ and Ti4+ co-doping levels. Notably, the MCD signal corresponding to the 6A1g(6S)→4E9, 4A1g(4G) transition appeared in the Bi0.5Sr0.5Fe0.5Ti0.5O3 film but was absent in the Bi0.8Sr0.2Fe0.8Ti0.2O3 film. This may have been due to the comparatively weaker magnetism of Bi0.8Sr0.2Fe0.8Ti0.2O3, which rendered this transition undetectable in its MCD spectrum.
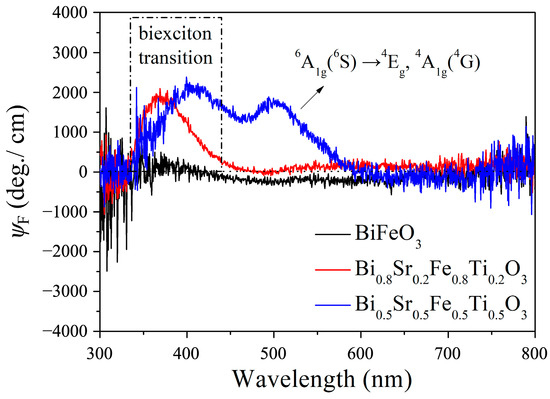
Figure 11.
MCD spectra of Bi1−xSrxFe1−xTixO3/SiO2 thin films.
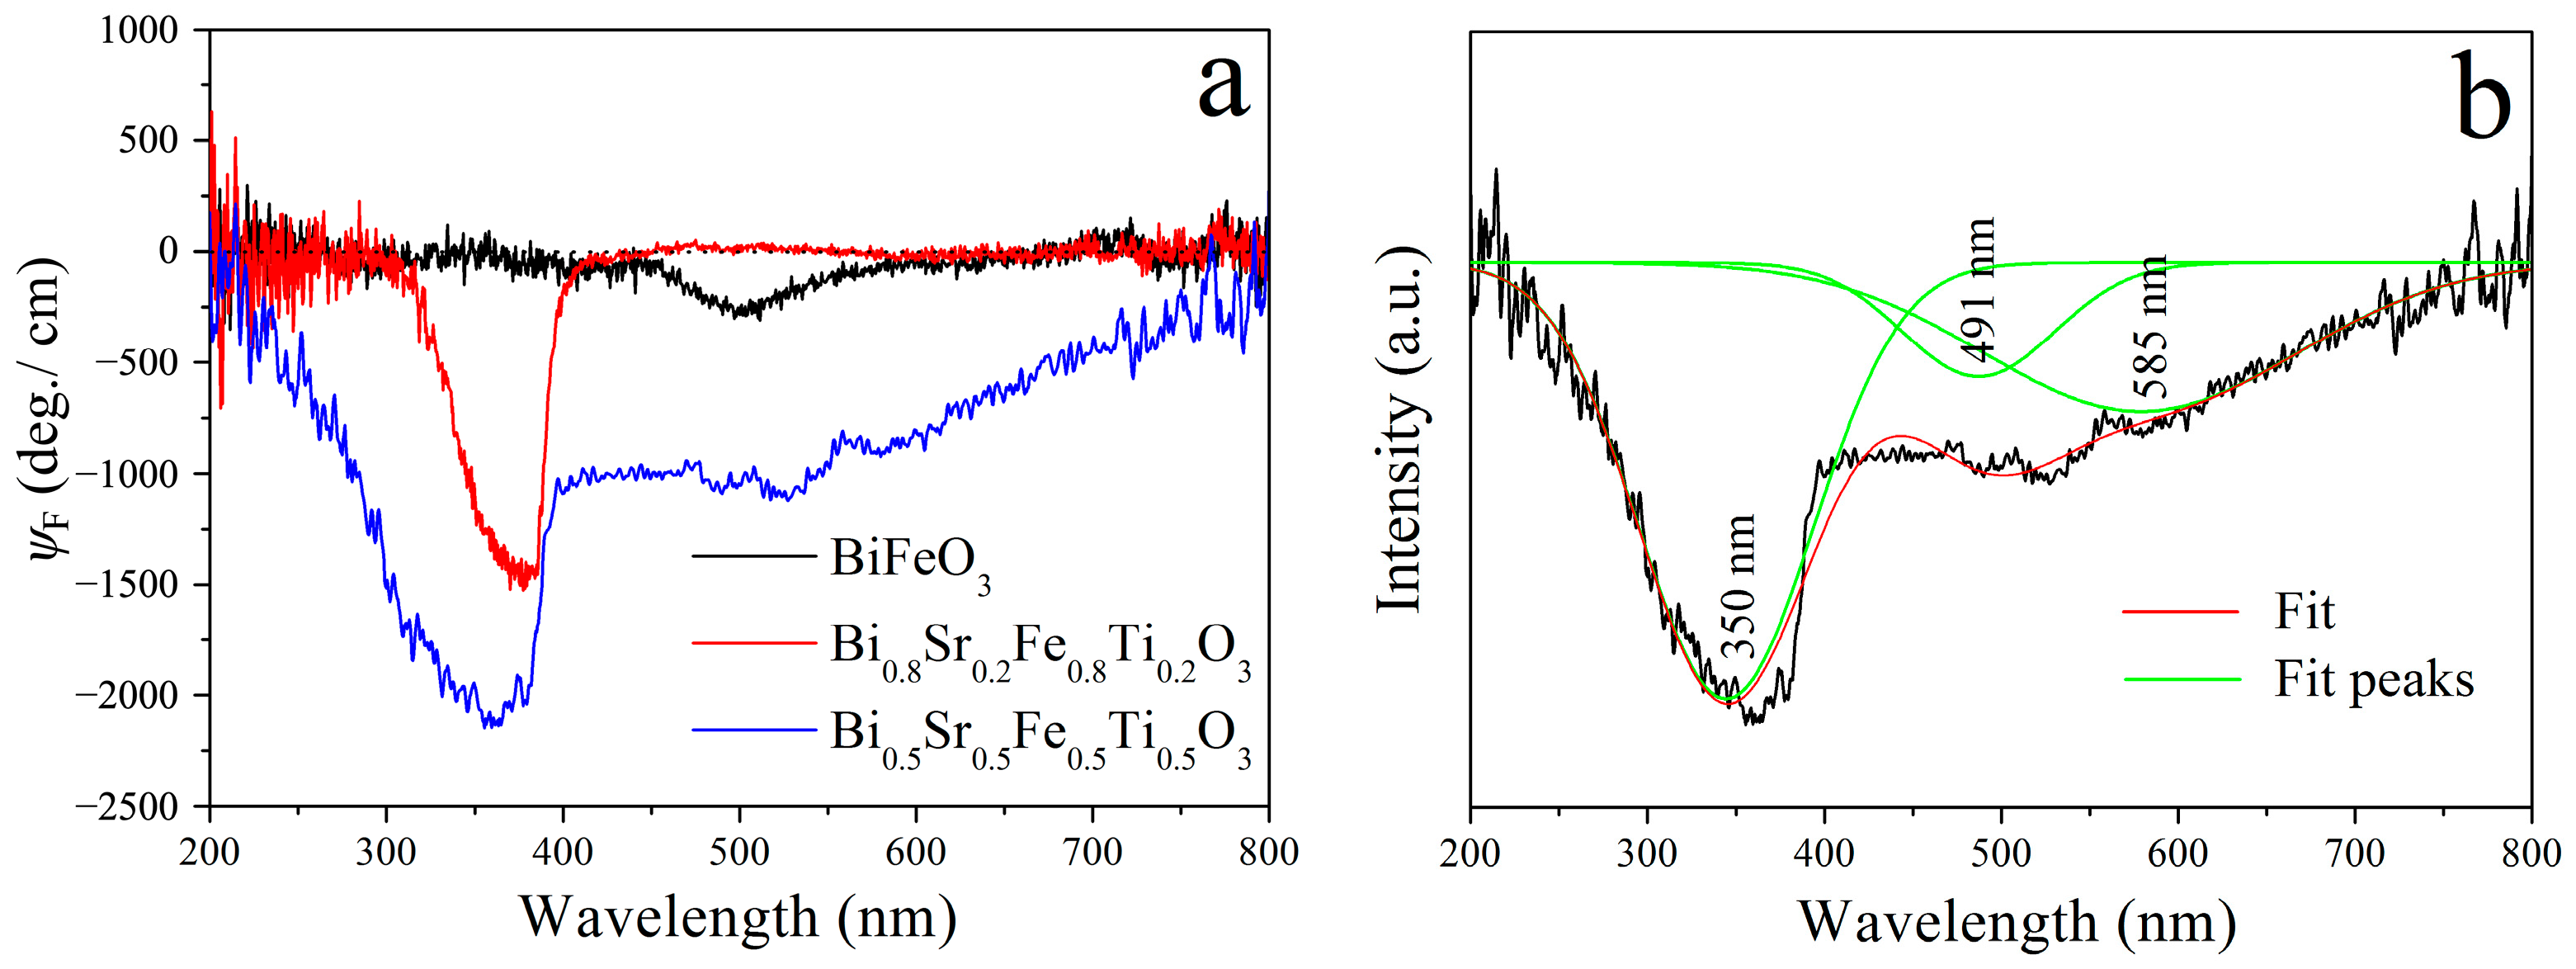
In addition, the MCD spectra of Bi1−xSrxFe1−xTixO3/STO films in the 200–800 nm wavelength range were also measured under an external magnetic field of 2500 Oe, as shown in Figure 12. It can be seen that the BiFeO3/STO film exhibited a weak MCD signal at around 500 nm, with a corresponding MCD ellipticity (ψF) value of only 200 deg./cm. The MCD peak positions of the Bi0.8Sr0.2Fe0.8Ti0.2O3/STO film were similar to those observed for the Bi0.8Sr0.2Fe0.8Ti0.2O3/SiO2 film; however, its maximum |ψF| value decreased to 1490 deg./cm. This reduction may be attributed to differences in substrate properties, such as crystallographic orientation, thickness, absorption characteristics, and optical interference effects. Gaussian fitting of the MCD spectrum of the Bi0.5Sr0.5Fe0.5Ti0.5O3/STO film was performed, as shown in Figure 12b. The fitted spectrum revealed three distinct peaks located at 350 nm, 491 nm, and 585 nm, corresponding to a double exciton transition, a 6A1g(6S)→4E9, 4A1g(4G) transition, and a 6A1g(6S)→4T1g(4G) transition, respectively [36,37]. The maximum |ψF| value reached 2300 deg./cm, comparable to that of the Bi0.5Sr0.5Fe0.5Ti0.5O3/SiO2 thin film. Overall, Sr2+ and Ti4+ co-doping effectively suppressed the detrimental birefringence effects of trigonal BiFeO3 while significantly enhancing the magnetic properties of the BiFeO3 films. As a result, the magneto-optical performance of the Bi1−xSrxFe1−xTixO3 thin films was markedly improved. Notably, compared with the widely used magneto-optical material Ce3+:YIG, the Bi0.5Sr0.5Fe0.5Ti0.5O3 thin film demonstrates a stronger magneto-optical effect under a much lower applied magnetic field.
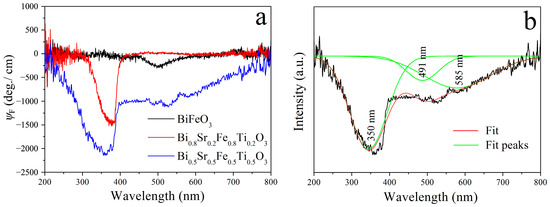
Figure 12.
(a) MCD spectra and (b) fitting curves of Bi1−xSrxFe1−xTixO3/STO thin films.
4. Conclusions
In this study, the tolerance factor (t) of BiFeO3 was effectively modulated by co-doping with Sr2+ and Ti4+ ions, resulting in a structural transformation from the trigonal to the cubic phase. Rietveld refinement analysis revealed that as the doping concentration (x) increased from 0.2 to 0.5, the fraction of the Pm-3m cubic phase in Bi1−xSrxFe1−xTixO3 thin films increased from 82.54% to 91.77%, thereby significantly reducing the lattice mismatch with the silicon substrate. High-quality, <100>-oriented cubic Sr,Ti:BiFeO3 thin films were successfully fabricated on Si substrates via RF magnetron sputtering. In contrast, Sr,Ti:BiFeO3 films deposited on STO substrates exhibited a tetragonal structure due to the presence of compressive strain. Furthermore, Sr2+ and Ti4+ co-doping reduced the concentration of oxygen vacancies and Fe2+ ions, which improved the optical transmittance properties of the Bi1−xSrxFe1−xTixO3 films. With increasing Sr2+ and Ti4+ doping levels, the magnetic properties of the Sr,Ti:BiFeO3 films were markedly enhanced. The highest saturation magnetization, 48.0 emu/cm3, was observed for the Bi0.5Sr0.5Fe0.5Ti0.5O3 thin film, significantly exceeding that of BiFeO3 (5.0 emu/cm3) and Bi0.8Sr0.2Fe0.8Ti0.2O3 (17.5 emu/cm3). In addition to superior magnetic properties, the Sr,Ti:BiFeO3 thin films exhibited excellent magneto-optical performance. The maximum MCD ψF value of the Bi0.5Sr0.5Fe0.5Ti0.5O3 thin film reached 2300 deg./cm, surpassing that of widely used Ce3+:YIG magneto-optical films. Therefore, cubic-phase Sr,Ti:BiFeO3 thin films, with their strong magnetic and magneto-optical effects and high compatibility with silicon substrates, show great potential for application in integrated magneto-optical devices such as modulators, sensors, switches, and silicon-based monolithic integrated magneto-optical isolators.
Author Contributions
Conceptualization, N.L.; methodology, N.L. and Y.C.; validation, Z.X.; formal analysis, N.L. and C.X.; investigation, C.X. and Y.S.; resources, H.Z. and N.L.; data curation, H.Z.; writing, original draft preparation, N.L.; writing—review, and editing, H.Z.; visualization, Y.C.; supervision, H.Z.; project administration, N.L. and H.Z.; funding acquisition, N.L. and H.Z. All authors have read and agreed to the published version of the manuscript.
Funding
This research was funded by the National Natural Science Foundation of China (62105063, 62071123), the Natural Science Foundation of Fujian Province, China (2021J05271) and the Innovation Team of Photoelectric Materials and Devices of Fujian Polytechnic Normal University, China (CXTD202405).
Institutional Review Board Statement
Not applicable.
Informed Consent Statement
Not applicable.
Data Availability Statement
The original contributions presented in the study are included in the article; further inquiries can be directed to the corresponding author.
Conflicts of Interest
Author Yunjin Chen was employed by the company Yunnan Invensight Optoelectronics Technology Co., Ltd. The remaining authors declare that the research was conducted in the absence of any commercial or financial relationships that could be construed as a potential conflict of interest.
References
- Yang, W.; Kong, X.; Fu, B.; Yang, Y.; Chen, R.; Zuo, C.; Liu, H.; Yu, Y.; Zeng, F.; Li, C. Optical properties of CeF3 crystal at high temperature or pressure by first principles and its application in isolators. Opt. Mater. 2024, 154, 115758. [Google Scholar] [CrossRef]
- Bera, S.; Kalimuddin, S.; Bera, A.; Roy, D.S.; Debnath, T.; Das, S.; Mondal, M. Nonlinear Optical Properties of 2D vdW Ferromagnetic Nanoflakes for Magneto-Optical Logic Applications. Adv. Opt. Mater. 2025, 13, 2402318. [Google Scholar] [CrossRef]
- Ji, B.; Jin, Z.; Wu, G.; Li, J.; Wan, C.; Han, X.; Zhang, Z.; Ma, G.; Peng, Y.; Zhu, Y. Ultrafast laser-induced magneto-optical response of CoFeB/MgO/CoFeB magnetic tunneling junction. Appl. Phys. Lett. 2023, 122, 111104. [Google Scholar] [CrossRef]
- Sukhorukov, Y.P.; Telegin, A.V.; Lobov, I.D.; Naumov, S.V.; Dubinin, S.S.; Merencova, K.A.; Artemyev, M.S.; Nosov, A.P. Magnetooptical gyrotropic effects in nanosized BiYIG films and diamagnetic YAG substrates. J. Appl. Phys. 2024, 136, 193905. [Google Scholar] [CrossRef]
- Fakhrul, T.; Khurana, B.; Lee, B.H.; Huang, S.; Nembach, H.T.; Beach, G.S.D.; Ross, C.A. Damping and Interfacial Dzyaloshinskii-Moriya Interaction in Thulium Iron Garnet/Bismuth-Substituted Yttrium Iron Garnet Bilayers. ACS Appl. Mater. Interfaces 2024, 16, 2489–2496. [Google Scholar] [CrossRef] [PubMed]
- Fakhrul, T.; Tazlaru, S.; Khurana, B.; Beran, L.; Bauer, J.; Vančík, M.; Marchese, A.; Tsotsos, E.; Kučera, M.; Zhang, Y.; et al. High figure of merit magneto-optical Ce- and Bi-substituted Terbium Iron garnet films integrated on Si. Adv. Opt. Mater. 2021, 9, 2100512. [Google Scholar] [CrossRef]
- Wahid, D.A.; Morioka, T.; Shimizu, H. Preparation of Bi2Gd1Fe5O12 magnetic garnet films showing Faraday rotation of 36.3 deg./µm on glass substrates by metal organic decomposition method. IEICE Electron. Express 2016, 13, 20161011. [Google Scholar] [CrossRef]
- Sun, X.Y.; Du, Q.; Goto, T.; Onbasli, M.C.; Kim, D.H.; Aimon, N.M.; Hu, J.; Ross, C.A. Single-step deposition of cerium-substituted yttrium iron garnet for monolithic on-chip optical isolation. ACS Photon. 2015, 2, 856–863. [Google Scholar] [CrossRef]
- Yang, Q.H.; Zhang, H.W.; Wen, Q.Y.; Liu, Y.L. Effects of off-stoichiometry and density on the magnetic and magneto-optical properties of yttrium iron garnet films by magnetron sputtering method. J. Appl. Phys. 2010, 108, 073901. [Google Scholar] [CrossRef]
- Meng, F.; Qin, L.; Gao, H.; Zhu, H.; Yuan, Z. Perovskite-structured LaFeO3 modified In2O3 gas sensor with high selectivity and ultra-low detection limit for 2-butanone. J. Alloys Compd. 2024, 970, 176424. [Google Scholar] [CrossRef]
- Cheng, Z.; Hong, F.; Wang, Y.; Ozawa, K.; Fujii, H.; Kimura, H.; Du, Y.; Wang, X.; Dou, S. Interface strain-induced multiferroicity in a SmFeO3 film. ACS Appl. Mater. Interfaces 2014, 6, 7356–7362. [Google Scholar] [CrossRef] [PubMed]
- Wang, Z.; Yang, X.; He, X.; Xue, H.; Wang, X.; Dong, H.; Zhu, J.; Mao, W.; Xu, X.; Li, X. Roles of oxygen vacancy and ferroelectric polarization in photovoltaic effects of BiFeO3 based devices. Solid State Commun. 2023, 360, 115042. [Google Scholar] [CrossRef]
- Chauhan, S.; Kumar, M.; Pal, P. Substitution driven structural and magnetic properties and evidence of spin phonon coupling in Sr-doped BiFeO3 nanoparticles. RSC Adv. 2016, 6, 68028. [Google Scholar] [CrossRef]
- Chen, M.; Ma, J.; Peng, R.; Zhang, Q.; Nan, C.W. Robust polarization switching in self-assembled BiFeO3 nanoislands with quad-domain structures. Acta Mater. 2019, 175, 324–330. [Google Scholar] [CrossRef]
- Wei, Y.; Liu, Z.; Xu, D.; Dong, L.; Li, G.; Wang, Y.; Fan, F.; Meng, X.; Song, J. Dielectric properties and ferroelectric resistive switching mechanism in the epitaxial (111) BiFeO3 films. Ferroelectrics 2023, 613, 97–103. [Google Scholar] [CrossRef]
- Kathirvel, A.; Maheswari, A.U.; Sivakumar, M. Enhanced responsivity of Zr-doped BiFeO3 based self-powered UV-visible heterojunction photodetector fabricated via spray pyrolysis technique. Appl. Surf. Sci. 2023, 618, 156640. [Google Scholar] [CrossRef]
- Eriksson, A.; Tran, T.; Saxin, S.; Svensson, G.; Svedlindh, P.; Eriksson, S.-G.; Knee, C. Effects of A-site substitution on the structure and magnetic properties of Bi0.15Sr0.85-yAeyCo1-xFexO3-δ perovskites. Solid State Sci. 2009, 11, 1945–1954. [Google Scholar] [CrossRef]
- Kuhn, J.N.; Matter, P.H.; Millet, J.M.M.; Watson, R.B.; Ozkan, U.S. Oxygen Exchange Kinetics over Sr- and Co-doped LaFeO3. J. Phys. Chem. C 2008, 112, 12468–12476. [Google Scholar] [CrossRef]
- Jabeen, F.; Shahid, R.; Khan, M.S.; Pandey, R. Effect of Mn doping on the structural, spectral, electrical, ferromagnetic and piezoelectric properties of 0.7BFO-0.3BTO lead-free ceramics. J. Alloys Compd. 2022, 917, 165303. [Google Scholar] [CrossRef]
- Kumar, P.; Kar, M. Effect of Structural Transition on Magnetic and Dielectric Properties of La and Mn co-substituted BiFeO3 Ceramics. Mater. Chem. Phys. 2014, 148, 968–977. [Google Scholar] [CrossRef]
- Lin, N.; Zhang, S.; Chen, H.; Chen, Y.; Chen, X.; Zhang, Y.; Hu, X.; Zhuang, N. Structural design of cubic Sr,V:CeFeO3 thin films with a strong magneto-optical effect and high compatibility with a Si substrate. Dalton Trans. 2020, 49, 7713. [Google Scholar] [CrossRef] [PubMed]
- Kersch, A.; Fischer, D. Phase stability and dielectric constant of ABO3 perovskites from first principles. J. Appl. Phys. 2009, 106, 014105. [Google Scholar] [CrossRef]
- Li, Z.; Yang, M.; Park, J.-S.; Wei, S.-H.; Berry, J.J.; Zhu, K. Stabilizing perovskite structures by tuning tolerance factor: Formation of formamidinium and Cesium Lead Iodide solid-state alloys. Chem. Mater. 2016, 28, 284–292. [Google Scholar] [CrossRef]
- Ali, S.; Sheeraz, M.; Ullah, A.; Yun, W.S.; Ullah, A.; Kim, I.W.; Ahn, C.W. Mapping the low tolerance factor Bi(Li1/3Zr2/3)O3 end member and MPB composition nexus in Bi1/2Na1/2TiO3-based ceramics. Chem. Eng. J. 2024, 485, 150087. [Google Scholar] [CrossRef]
- Sheeraz, M.; Tran, V.-D.; Jo, Y.J.; Kim, G.; Cho, S.; Sohn, C.; Kim, I.W.; Shin, Y.-H.; Ahn, C.W.; Kim, T.H. Defect Engineering of Ferroelectric Hysteresis in Lead-Free Bi1/2(Na,K)1/2TiO3 Thin Films. ACS Appl. Electron. Mater. 2024, 6, 8328–8338. [Google Scholar] [CrossRef]
- Yin, X. Application of Poisson Effect in Rock and Soil Mass. J. Phys. Conf. Ser. 2025, 3005, 012004. [Google Scholar] [CrossRef]
- Grosvenor, A.P.; Kobe, B.A.; Biesinger, M.C.; McIntyre, N.S. Investigation of multiplet splitting of Fe 2p XPS spectra and bonding in iron compounds. Surf. Interface Anal. 2004, 36, 1564–1574. [Google Scholar] [CrossRef]
- Omran, M.; Fabritius, T.; Elmahdy, A.M.; Abdel-Khalek, N. XPS and FTIR spectroscopic study on microwave treated high phosphorus iron ore. Appl. Surf. Sci. 2015, 345, 127–140. [Google Scholar] [CrossRef]
- Qi, K.; Liu, S.; Qiu, M. Photocatalytic performance of TiO2 nanocrystals with/without oxygen defects. Chin. J. Catal. 2018, 39, 867–875. [Google Scholar] [CrossRef]
- Ismail, M.; Chand, U.; Mahata, C.; Nebhen, J.; Kim, S. Demonstration of synaptic and resistive switching characteristics in W/TiO2/HfO2/TaN memristor crossbar array for bioinspired neuromorphic computing. J. Mater. Sci. Technol. 2022, 1, 94–102. [Google Scholar] [CrossRef]
- Arbuzov, V.I.; Voroshilova, M.V.; Gusev, P.E.; Fedorov, N.Y.K. Influence of the redox conditions of melting on the quantitative ratio of ions Fe2+/Fe3+ in aluminum potassium barium phosphate glass. Glass Phys. Chem. 2007, 33, 556–561. [Google Scholar] [CrossRef]
- Li, Y.P.; Wang, N.; Che, X.S.; Chen, H.B.; Liu, Z.T. Infrared transmissive and rain-erosion resistant performances of GeC/GaP double-layer thin films on ZnS substrates. Appl. Surf. Sci. 2013, 264, 538–544. [Google Scholar] [CrossRef]
- Gouveia, A.F.; Assis, M.; Ribeiro, L.K.; Lima, A.E.B.; Gomes, E.d.O.; Souza, D.; Galvão, Y.G.; Rosa, I.L.V.; da Luz, G.E.; Guillamón, E.; et al. Photoluminescence emissions of Ca1-xWO4:xEu3+:Bridging between experiment and DFT calculations. J. Rare Earths 2022, 10, 1527–1534. [Google Scholar] [CrossRef]
- Sen, S.; Parida, R.K.; Parida, B.N. The enhanced multifunctional behavior in G-type antiferromagnetic BiFeO3 due to the modification by MgTiO3. Phys. B 2023, 650, 414559. [Google Scholar] [CrossRef]
- Kotov, V.A.; Popkov, A.F.; Soloviev, S.V.; Vasiliev, M.; Alameh, K.; Nur-E-Alam, M.; Balabanov, D.E. Magnetic heterostructures with low coercivity for high-performance magneto-optic devices. J. Phys. D Appl. Phys. 2013, 46, 035001. [Google Scholar] [CrossRef]
- Nur-E-Alam, M.; Vasiliev, M.; Kotov, V.A.; Alameh, K. Highly bismuth-substituted, record-performance magneto-optic garnet materials with low coercivity for applications in integrated optics, photonic crystals, imaging and sensing. Opt. Mater. Express 2011, 1, 413–427. [Google Scholar] [CrossRef]
- Fu, Q.; Xu, Q.; Zhao, Z.; Liu, X.; Huang, Y.; Hu, X.; Zhuang, N.; Chen, J.; French, R.H. New magneto-optical film of Ce,Ga:GIG with high performance. J. Am. Ceram. Soc. 2016, 99, 234–240. [Google Scholar] [CrossRef]
- Wettling, W. Magneto-optics of ferrites. J. Magn. Magn. Mater. 1976, 3, 147–160. [Google Scholar] [CrossRef]
- Kucera, M.; Bok, J.; Nitsch, K. Faraday rotation and MCD in Ce doped yig. Solid State Commun. 1989, 69, 1117–1121. [Google Scholar] [CrossRef]
Disclaimer/Publisher’s Note: The statements, opinions and data contained in all publications are solely those of the individual author(s) and contributor(s) and not of MDPI and/or the editor(s). MDPI and/or the editor(s) disclaim responsibility for any injury to people or property resulting from any ideas, methods, instructions or products referred to in the content. |
© 2025 by the authors. Licensee MDPI, Basel, Switzerland. This article is an open access article distributed under the terms and conditions of the Creative Commons Attribution (CC BY) license (https://creativecommons.org/licenses/by/4.0/).