
Numerical and Fracture Mechanical Evaluation of Safety Monitoring Indexes and Crack Resistance in High RCC Gravity Dams Under Hydraulic Fracture Risk


Abstract
1. Introduction
2. Methodology
2.1. Material Strength
Safety Monitoring Index Calculation Using Strength Reduction Method
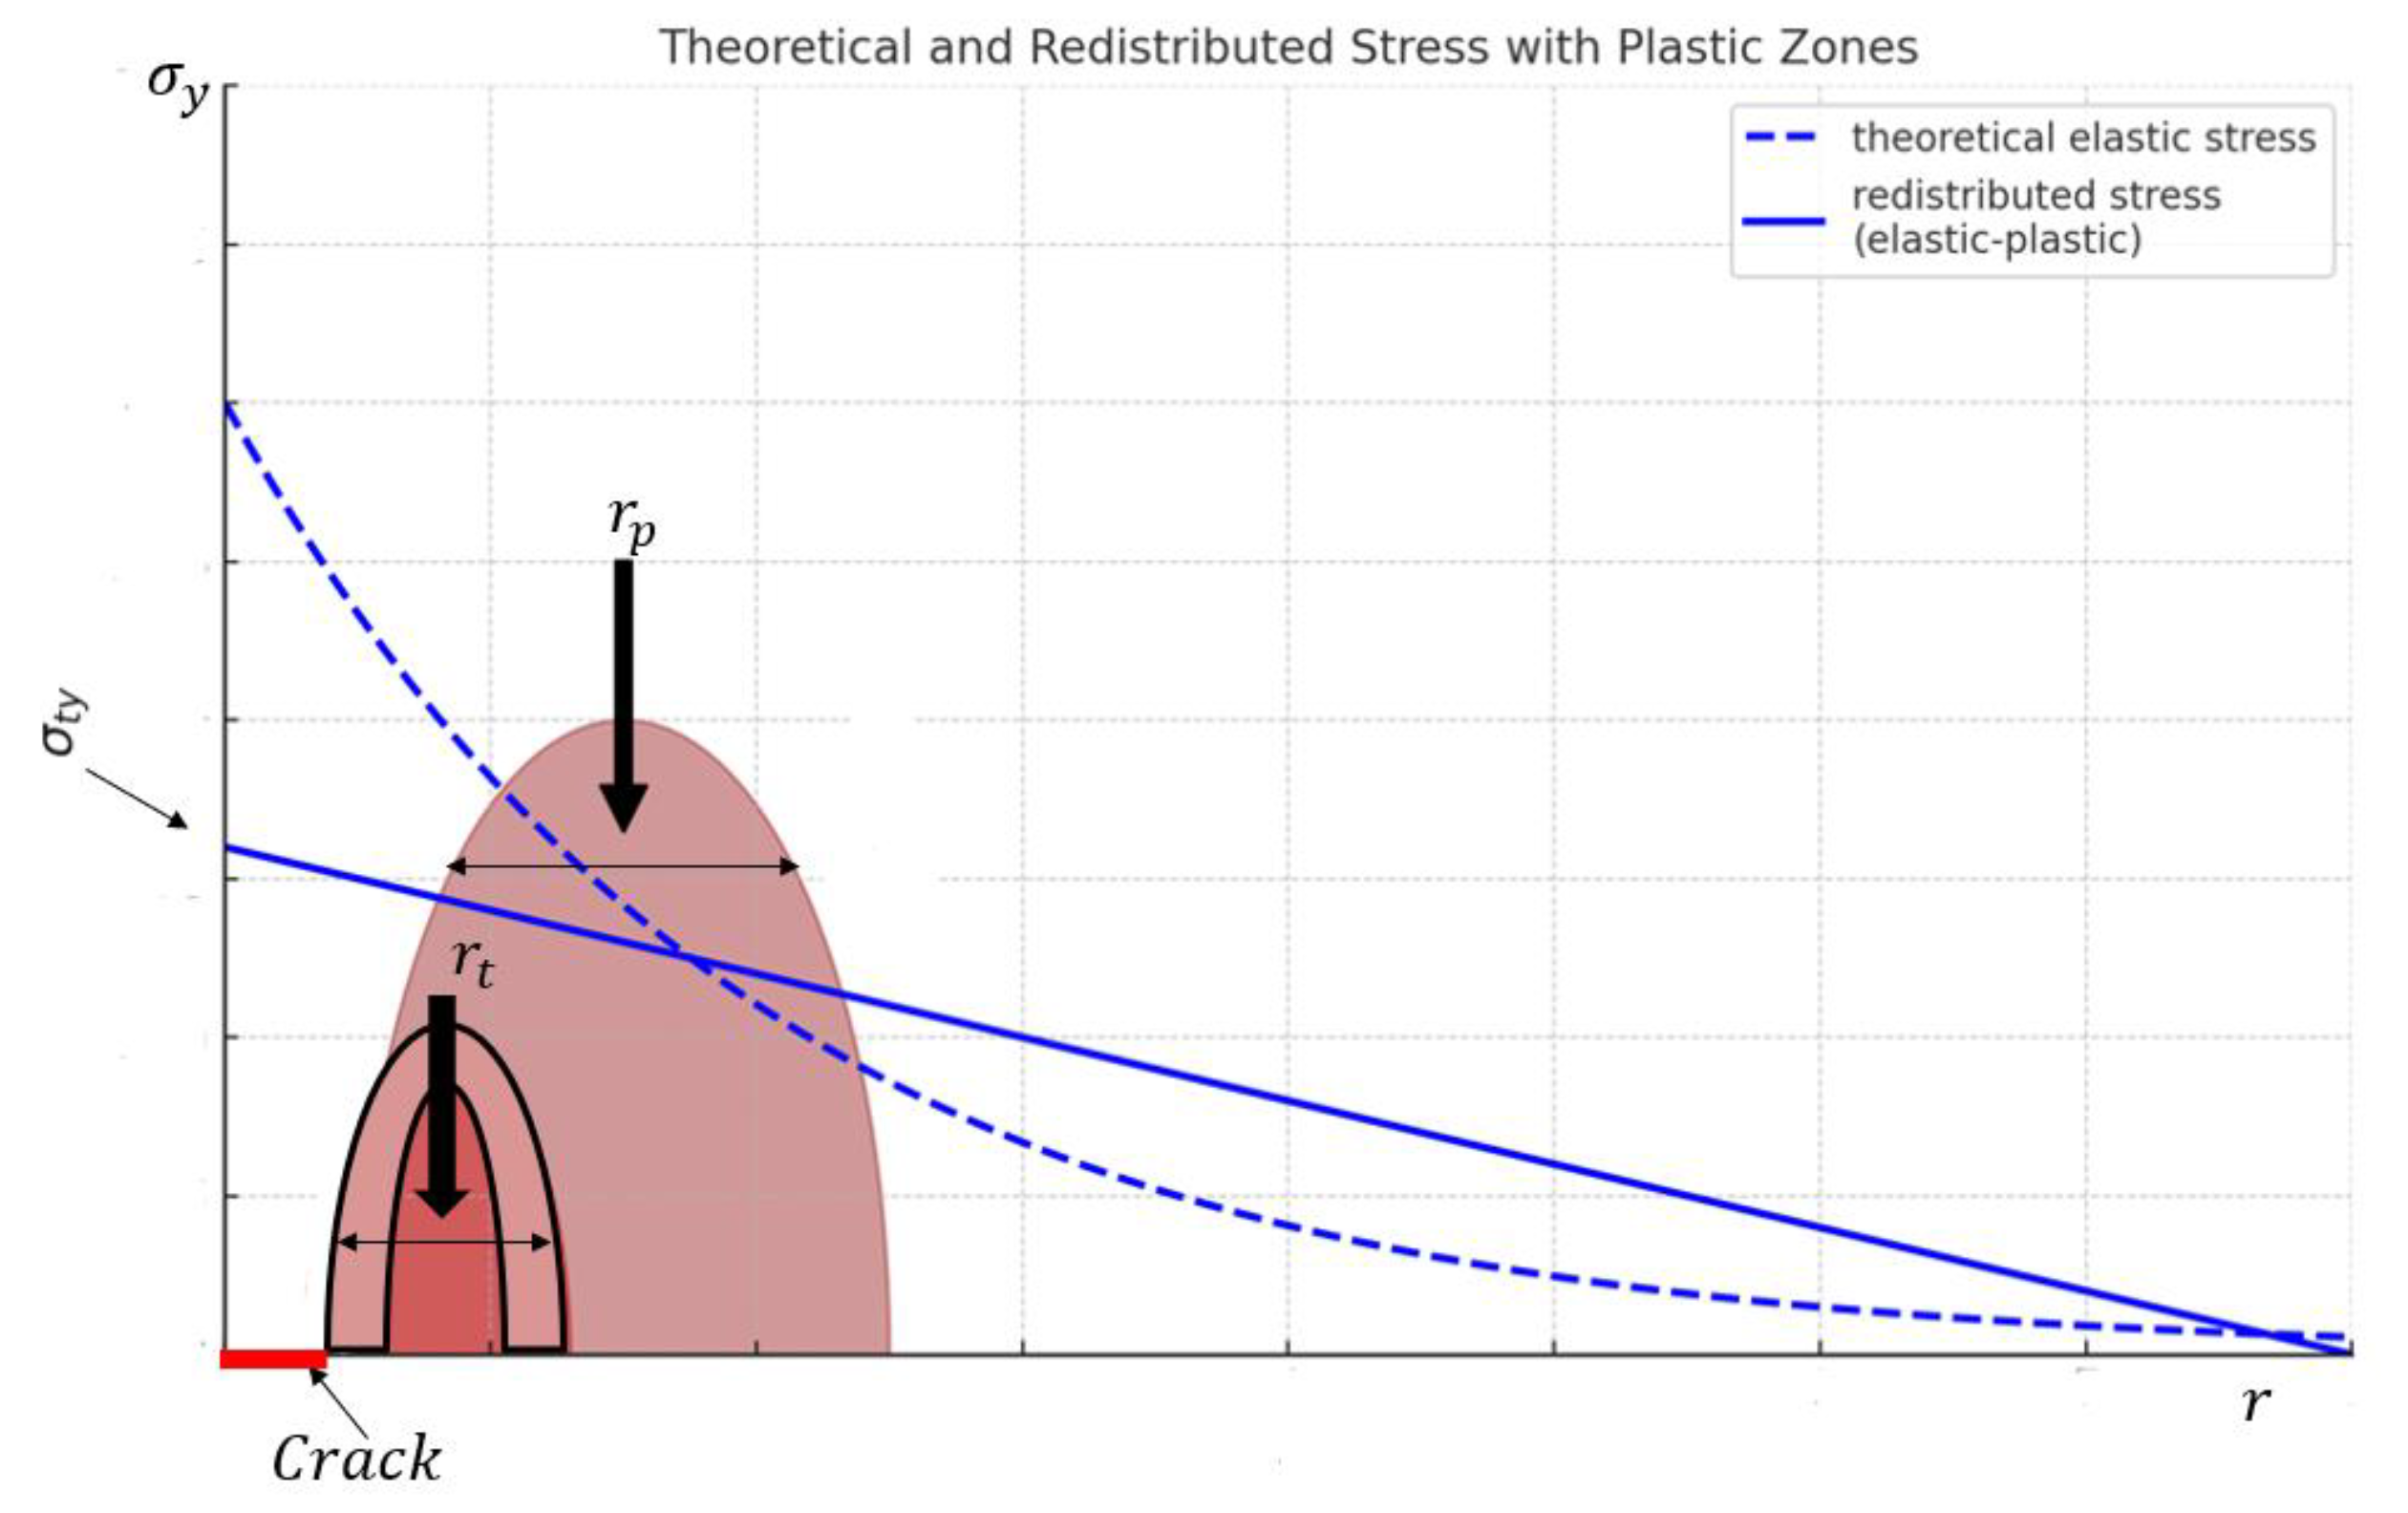
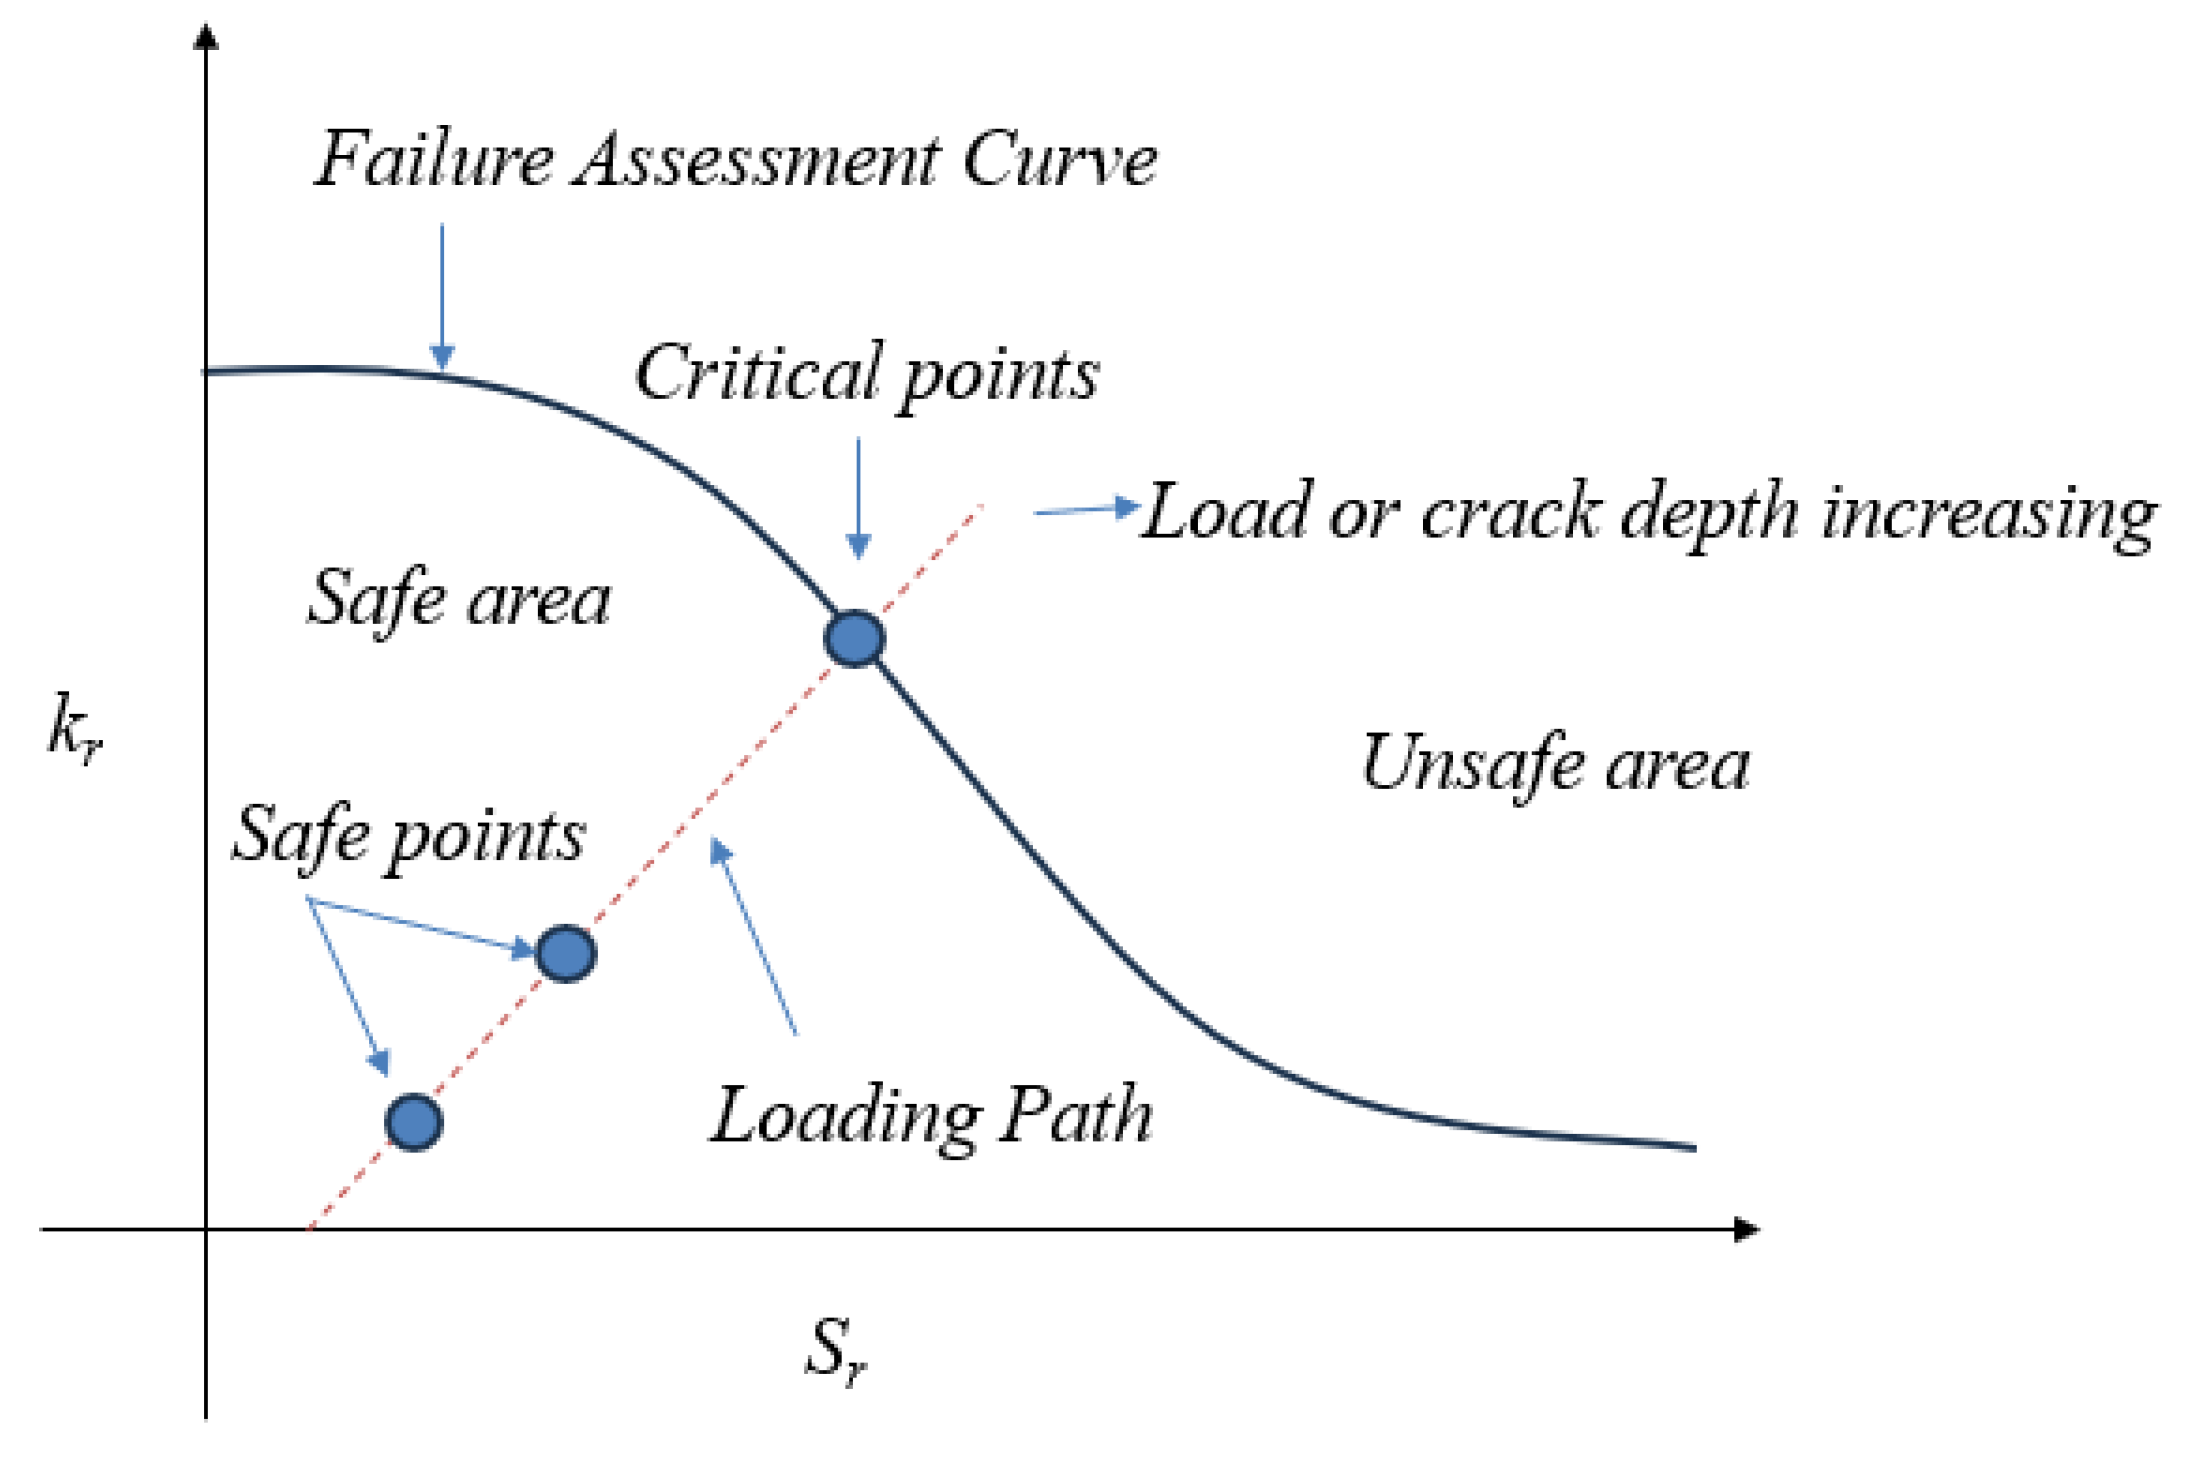
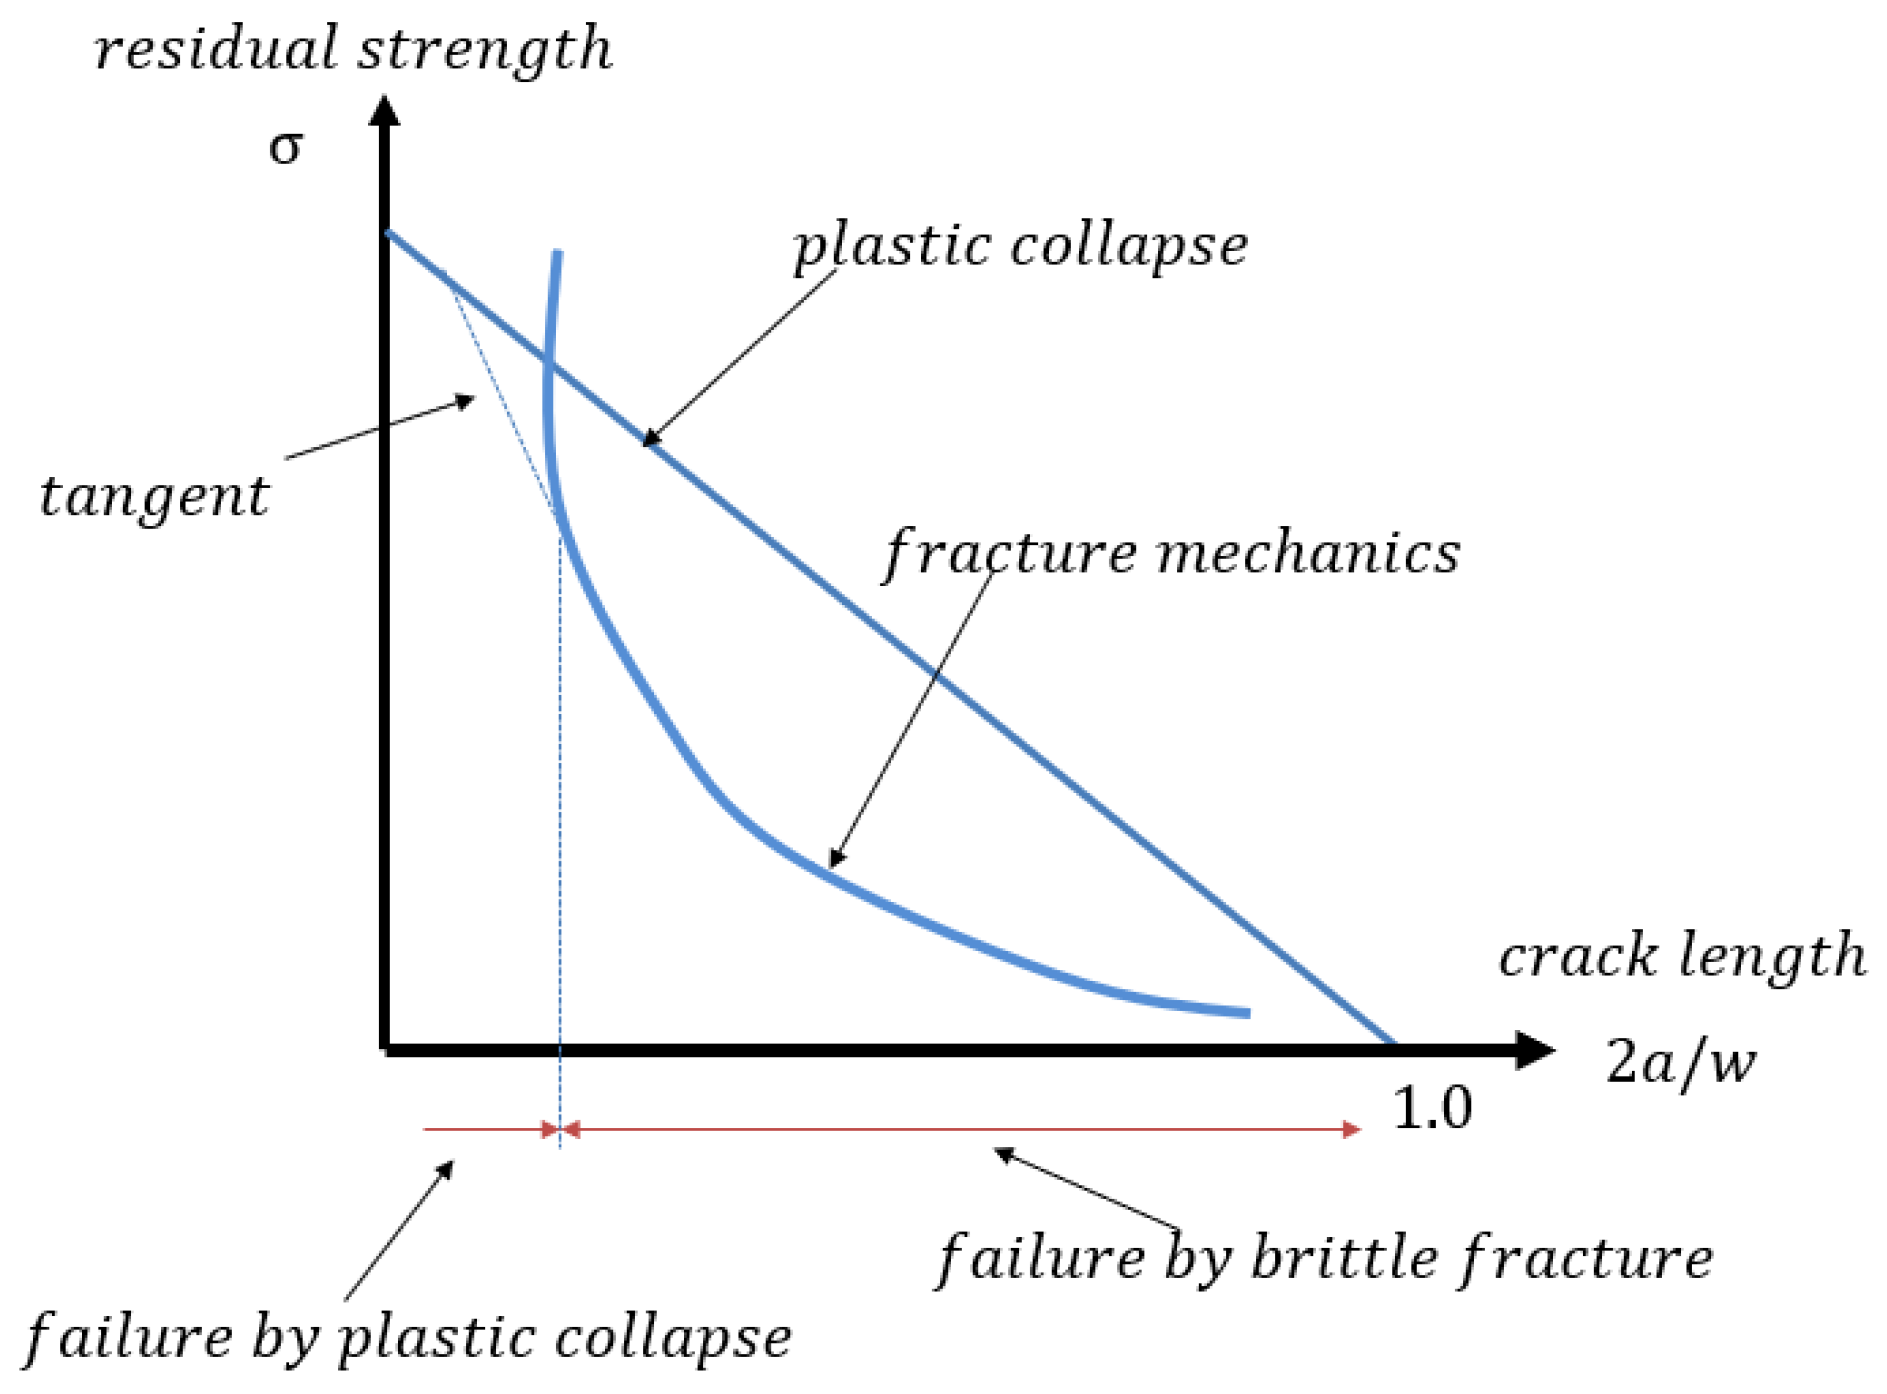
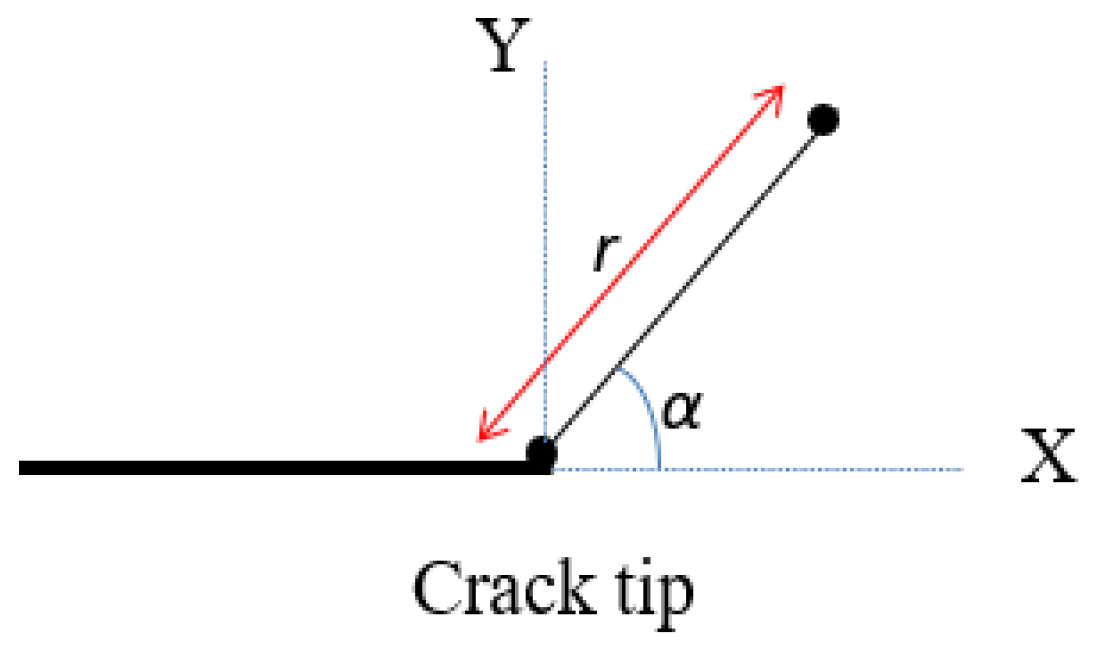
2.2. Fracture Mechanics
3. Analysis Procedures
3.1. Safety Monitoring Index with and Without Considering the Weak Layers
3.2. Comparative Analysis Between Different Crack Locations Influence of Different Crack Locations on the Dam Safety
3.3. Comprehensive Safety Analysis of the Guxian Dam Safety Resistance to Hydraulic Fracture at Different Modes Failure Investigation of Guxian Dam Resistance to Hydraulic Fracture
4. Results and Discussion
4.1. Safety Monitoring Index Considering Weak Layers
4.2. Comparative Analysis Between Different Crack Locations
4.3. Comprehensive Safety Analysis of the Guxian Dam Safety Resistance to Hydraulic Fracture at Different Modes Failure
4.4. Limitations
5. Conclusions
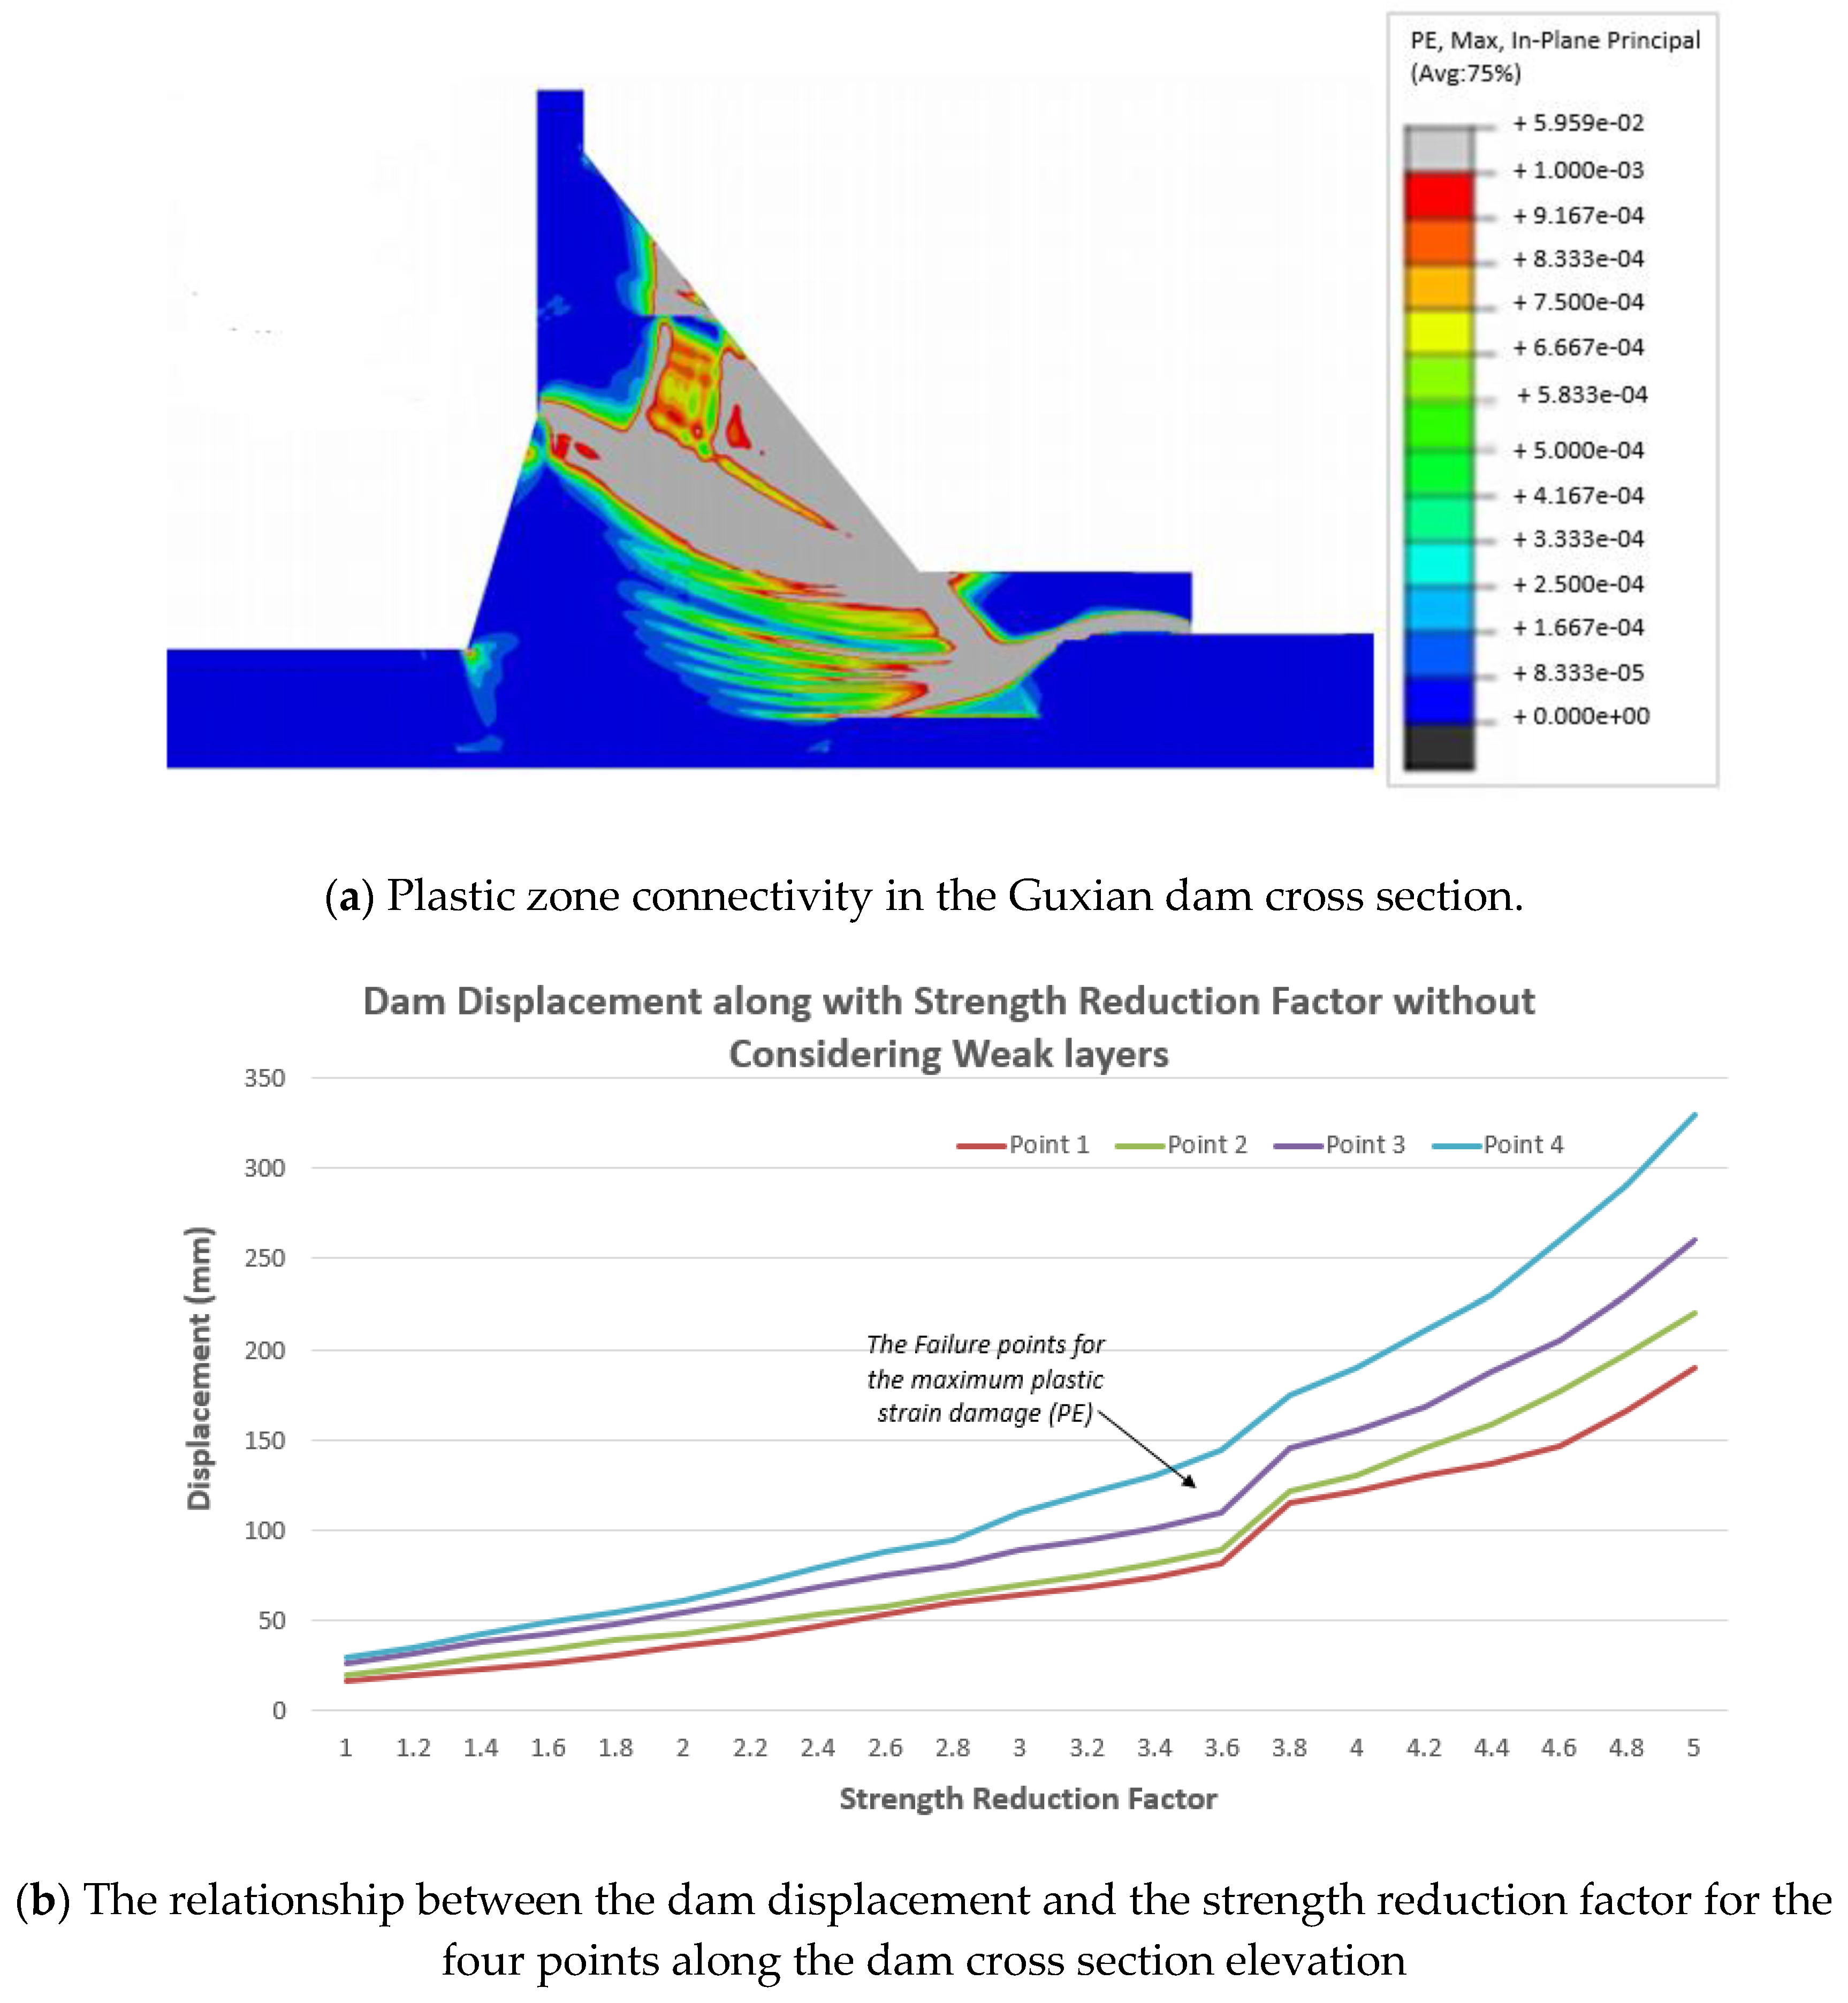
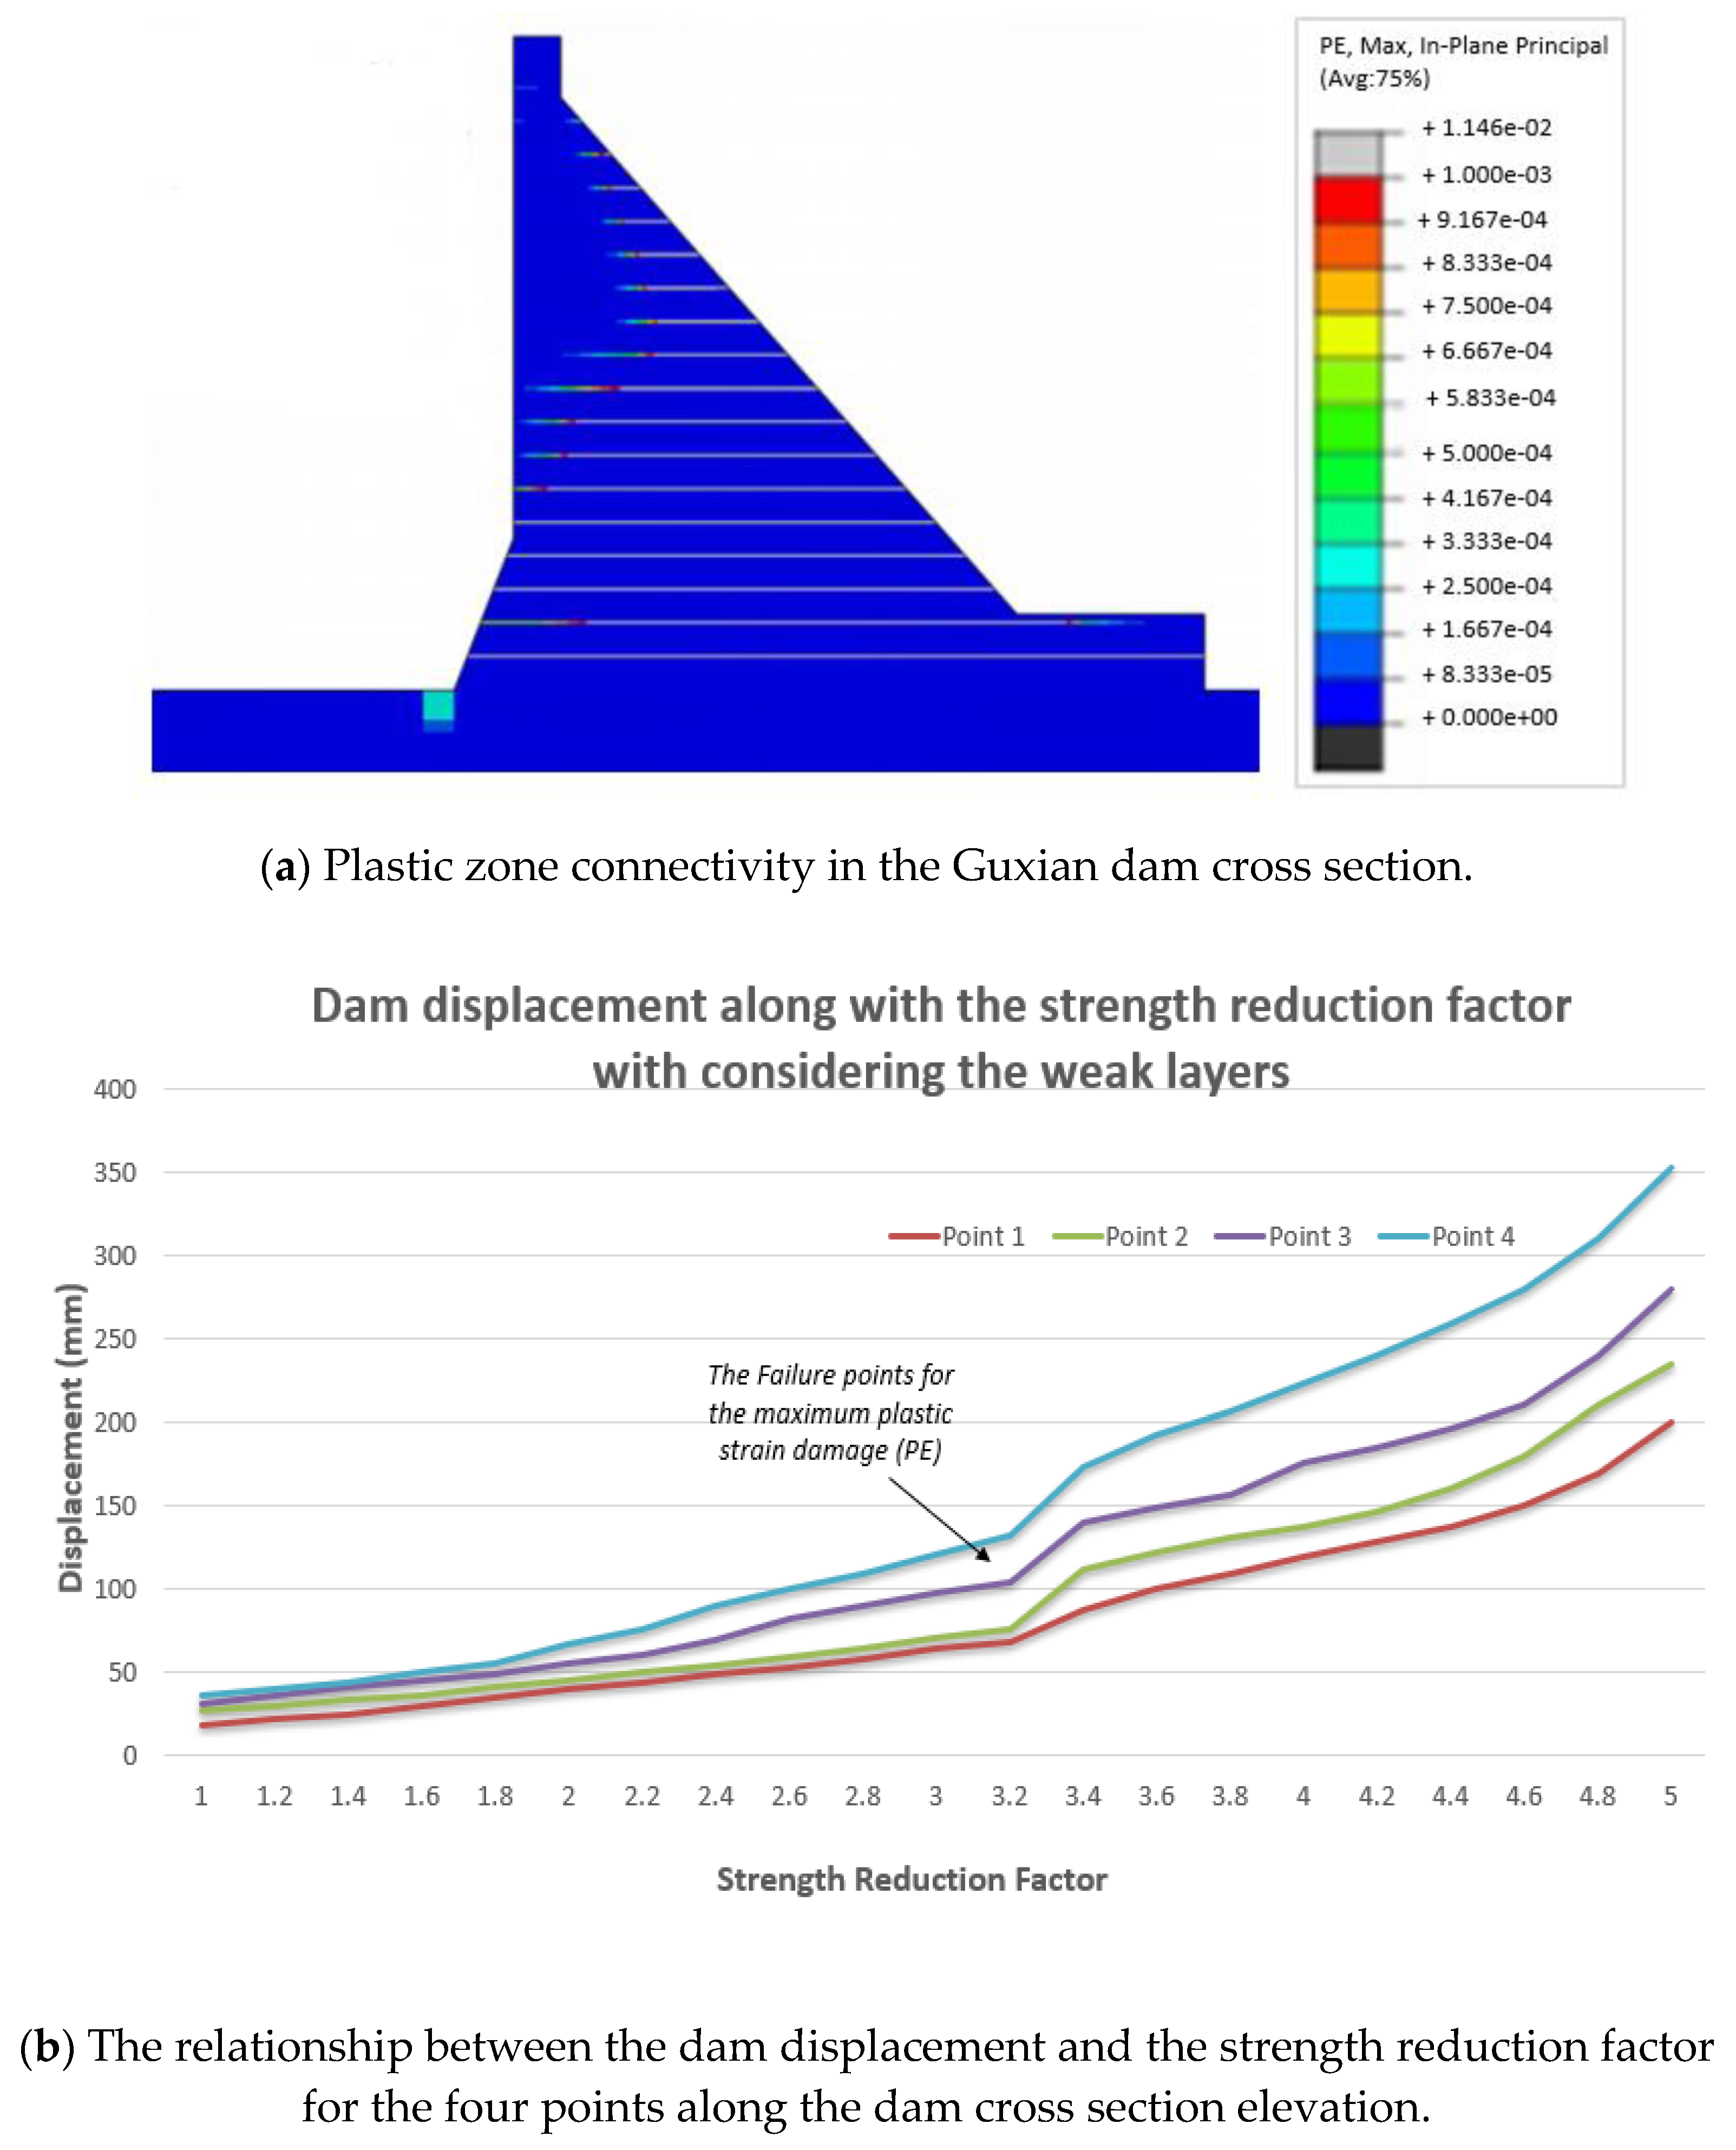
- A numerical model was used to evaluate the safety monitoring index of the Guxian RCC dam, considering the impact of weak layers. The results showed a significant reduction in dam safety, particularly in the lower part of the cross-section, where the safety index decreased by 20%. These weak layers contributed to the formation of extensive plastic zones, reducing the dam’s overall stability. By contrast, the dam crest was less affected, as the weak layers had smaller interface areas in this region, leading to only a 3% reduction in the safety index.
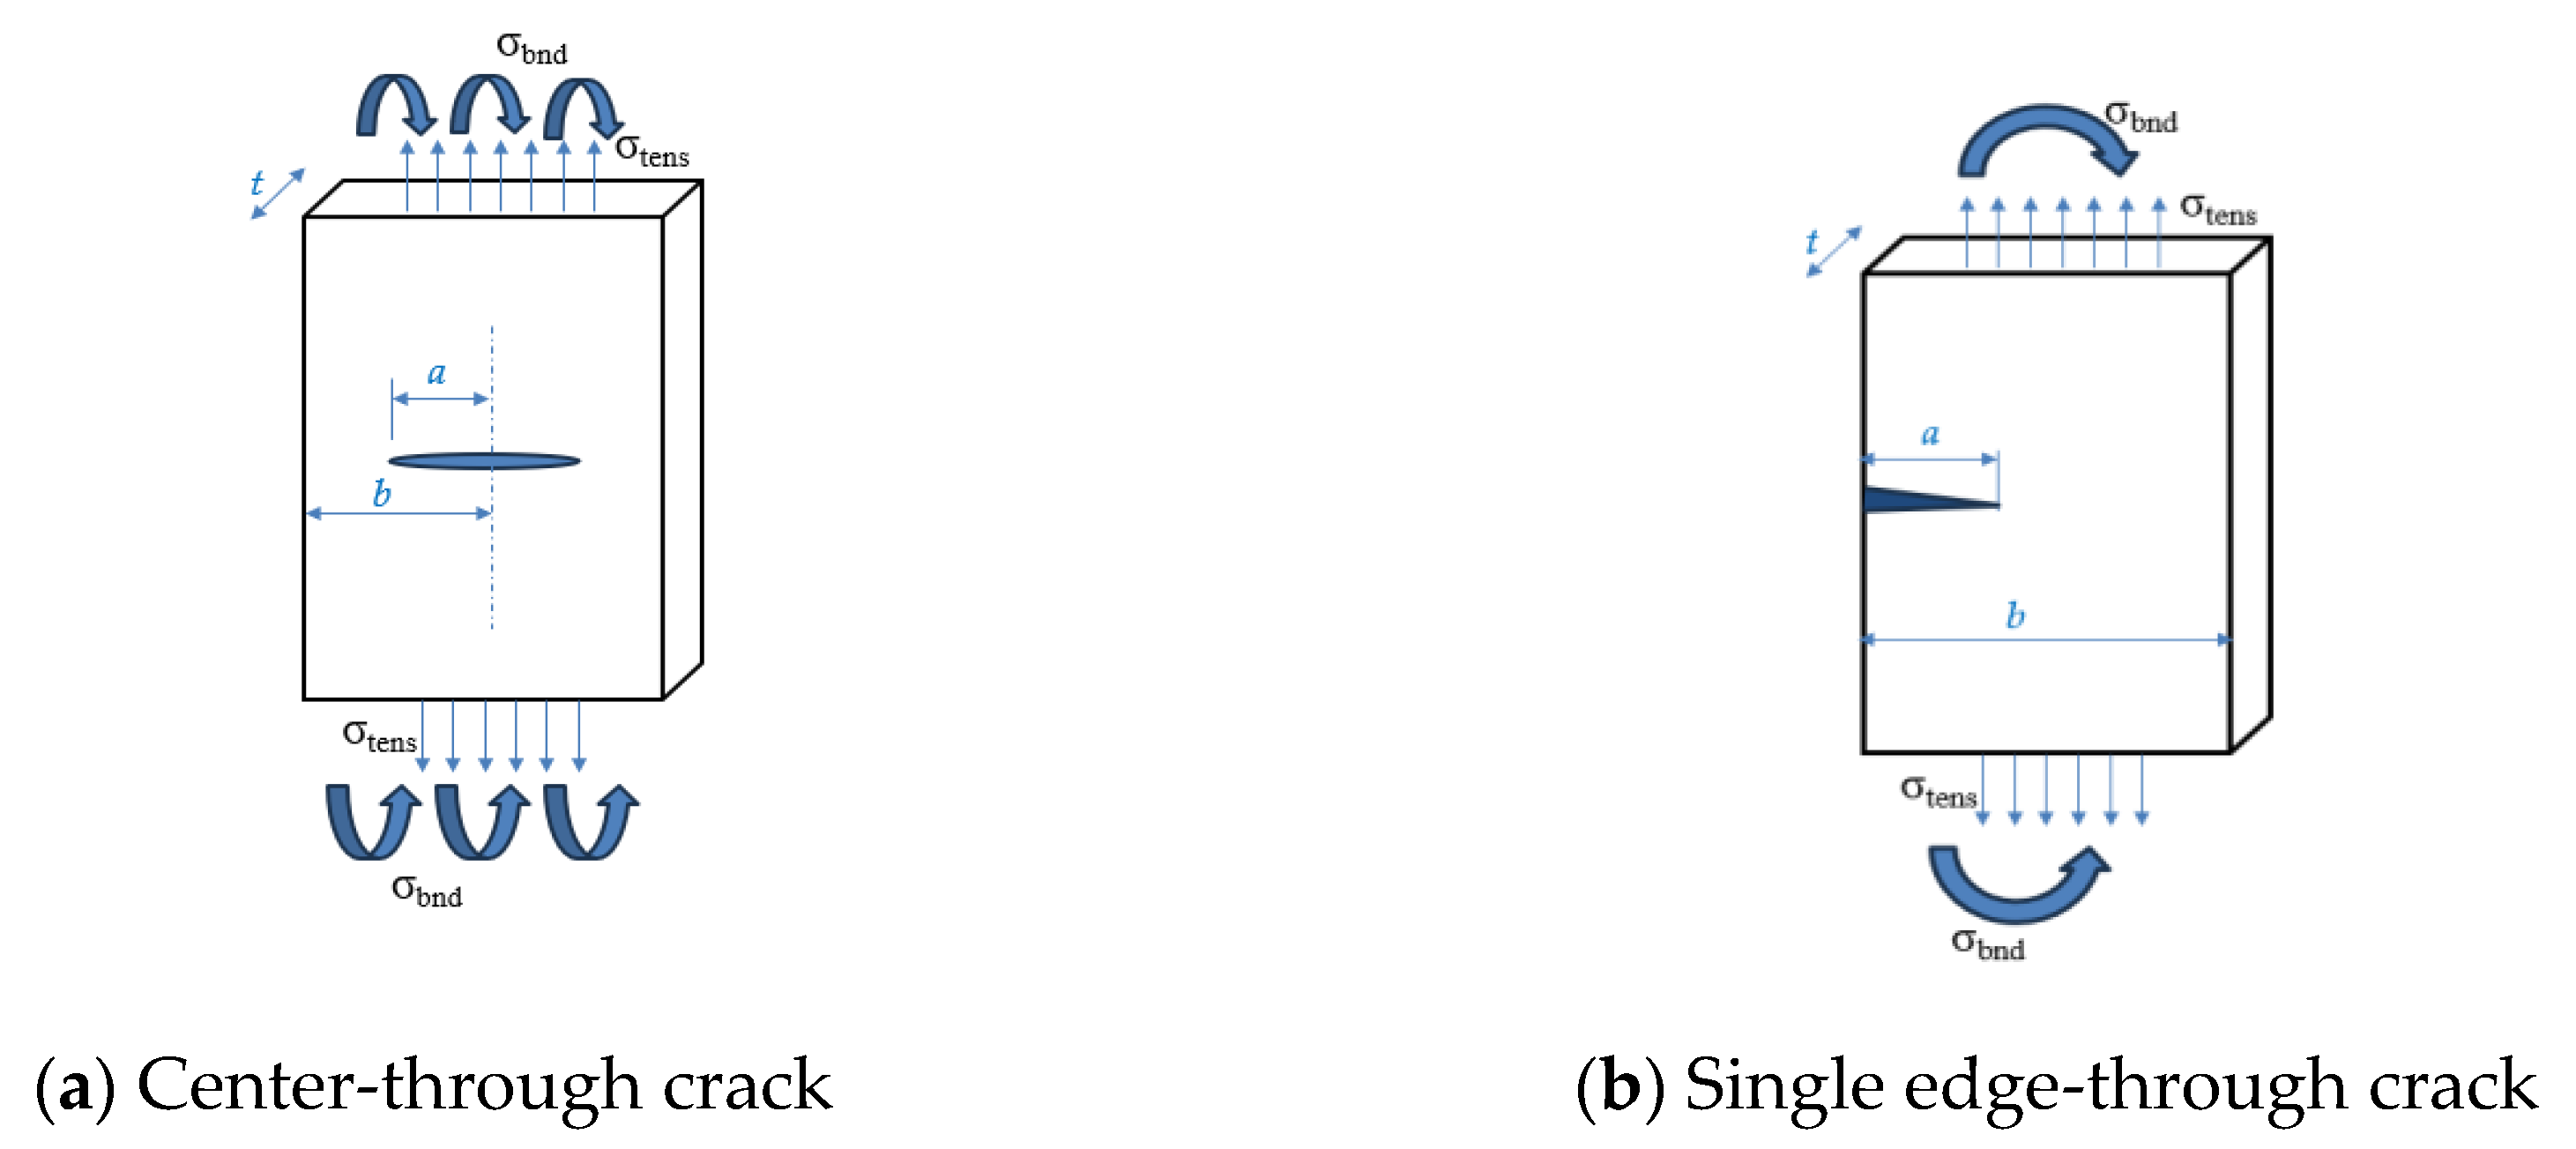
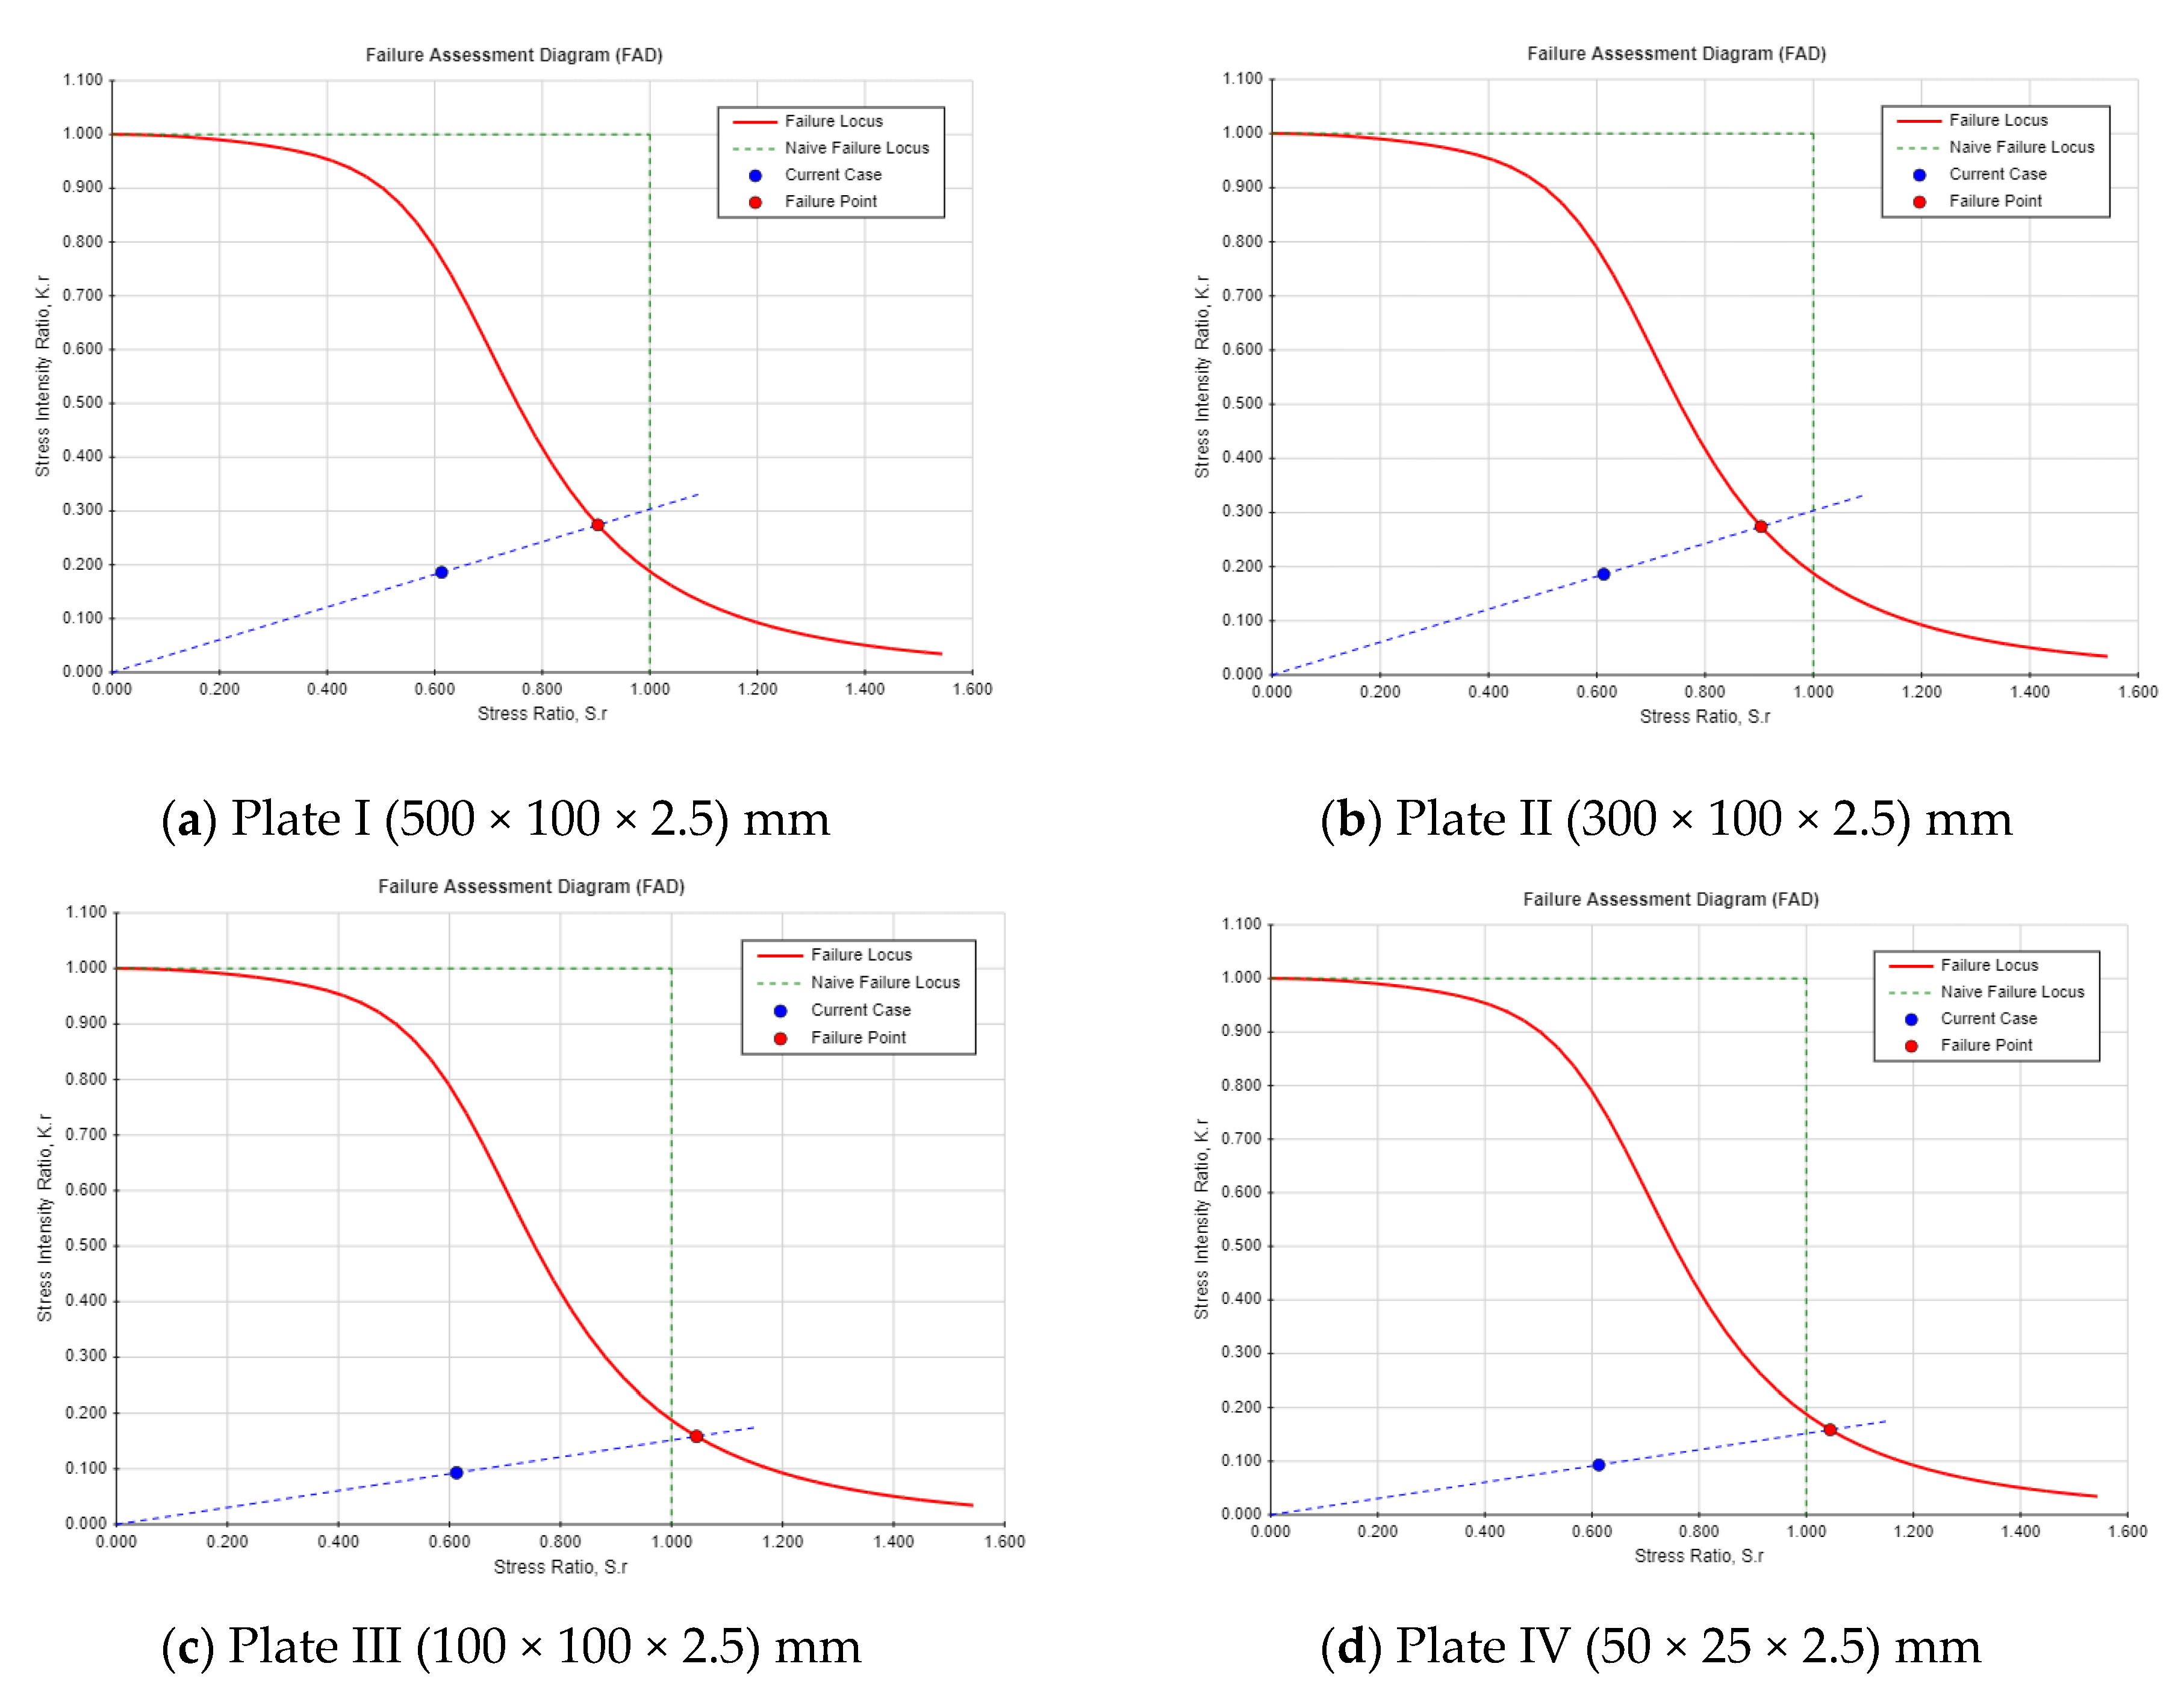
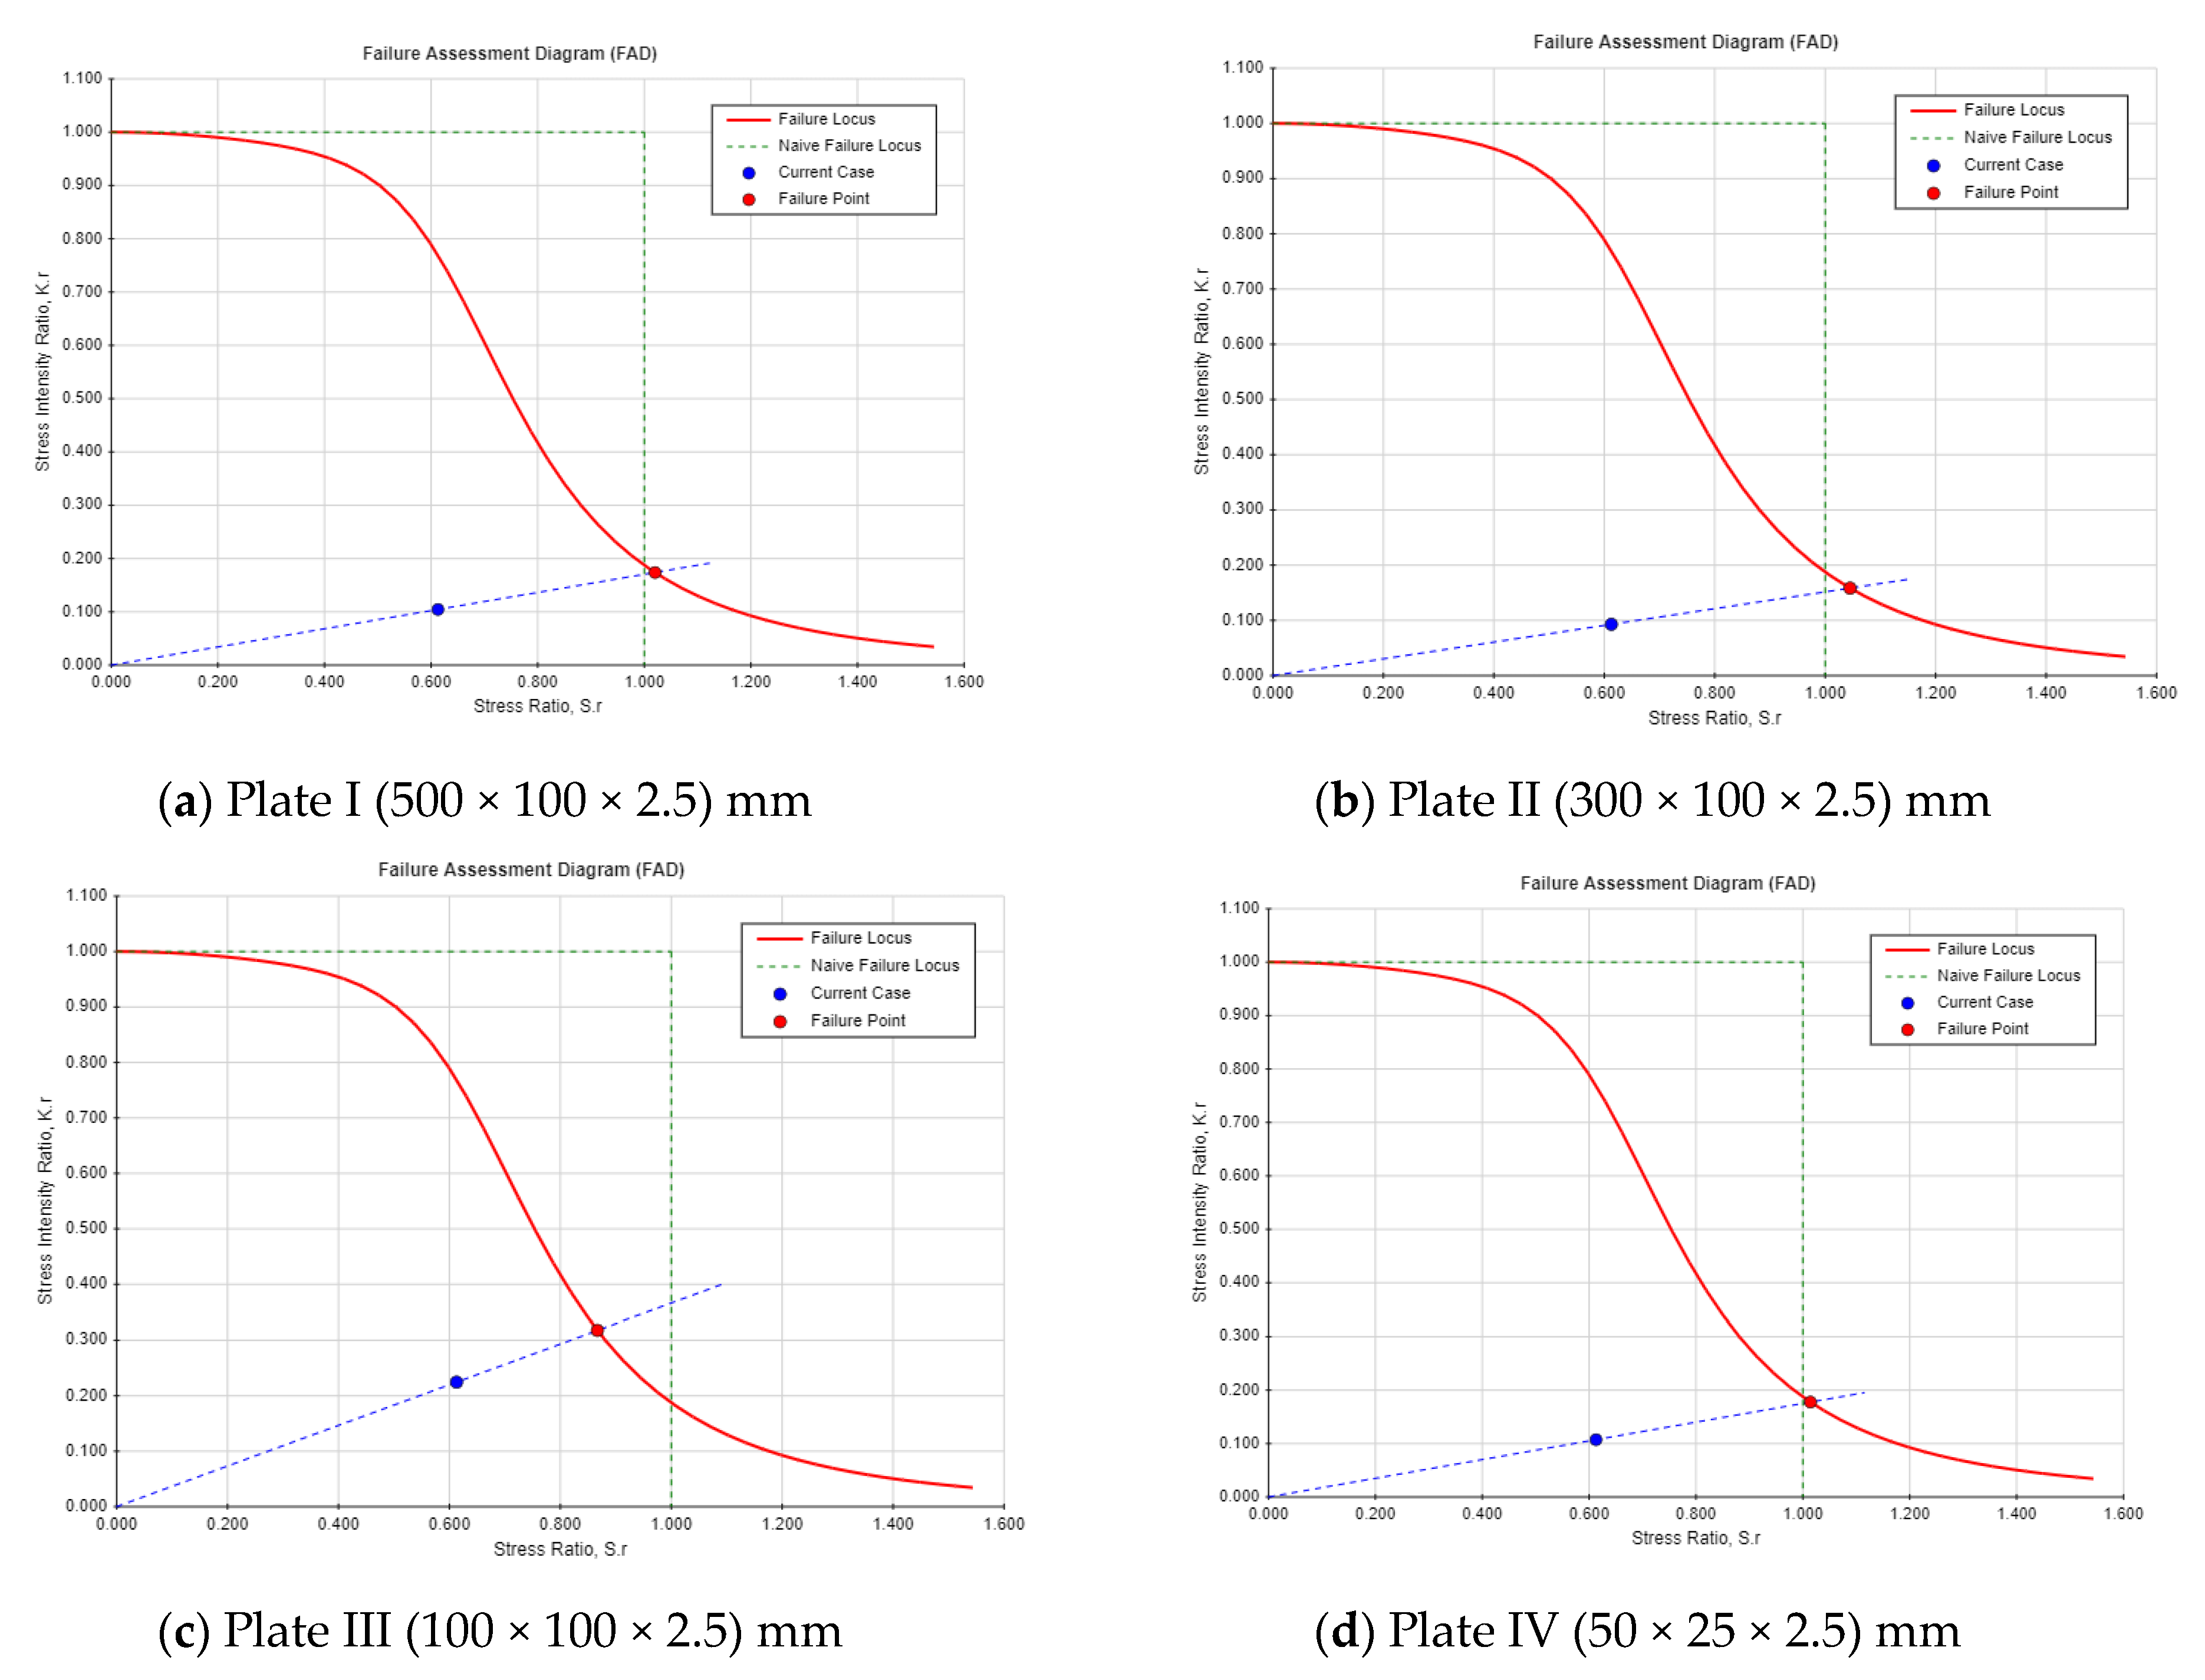
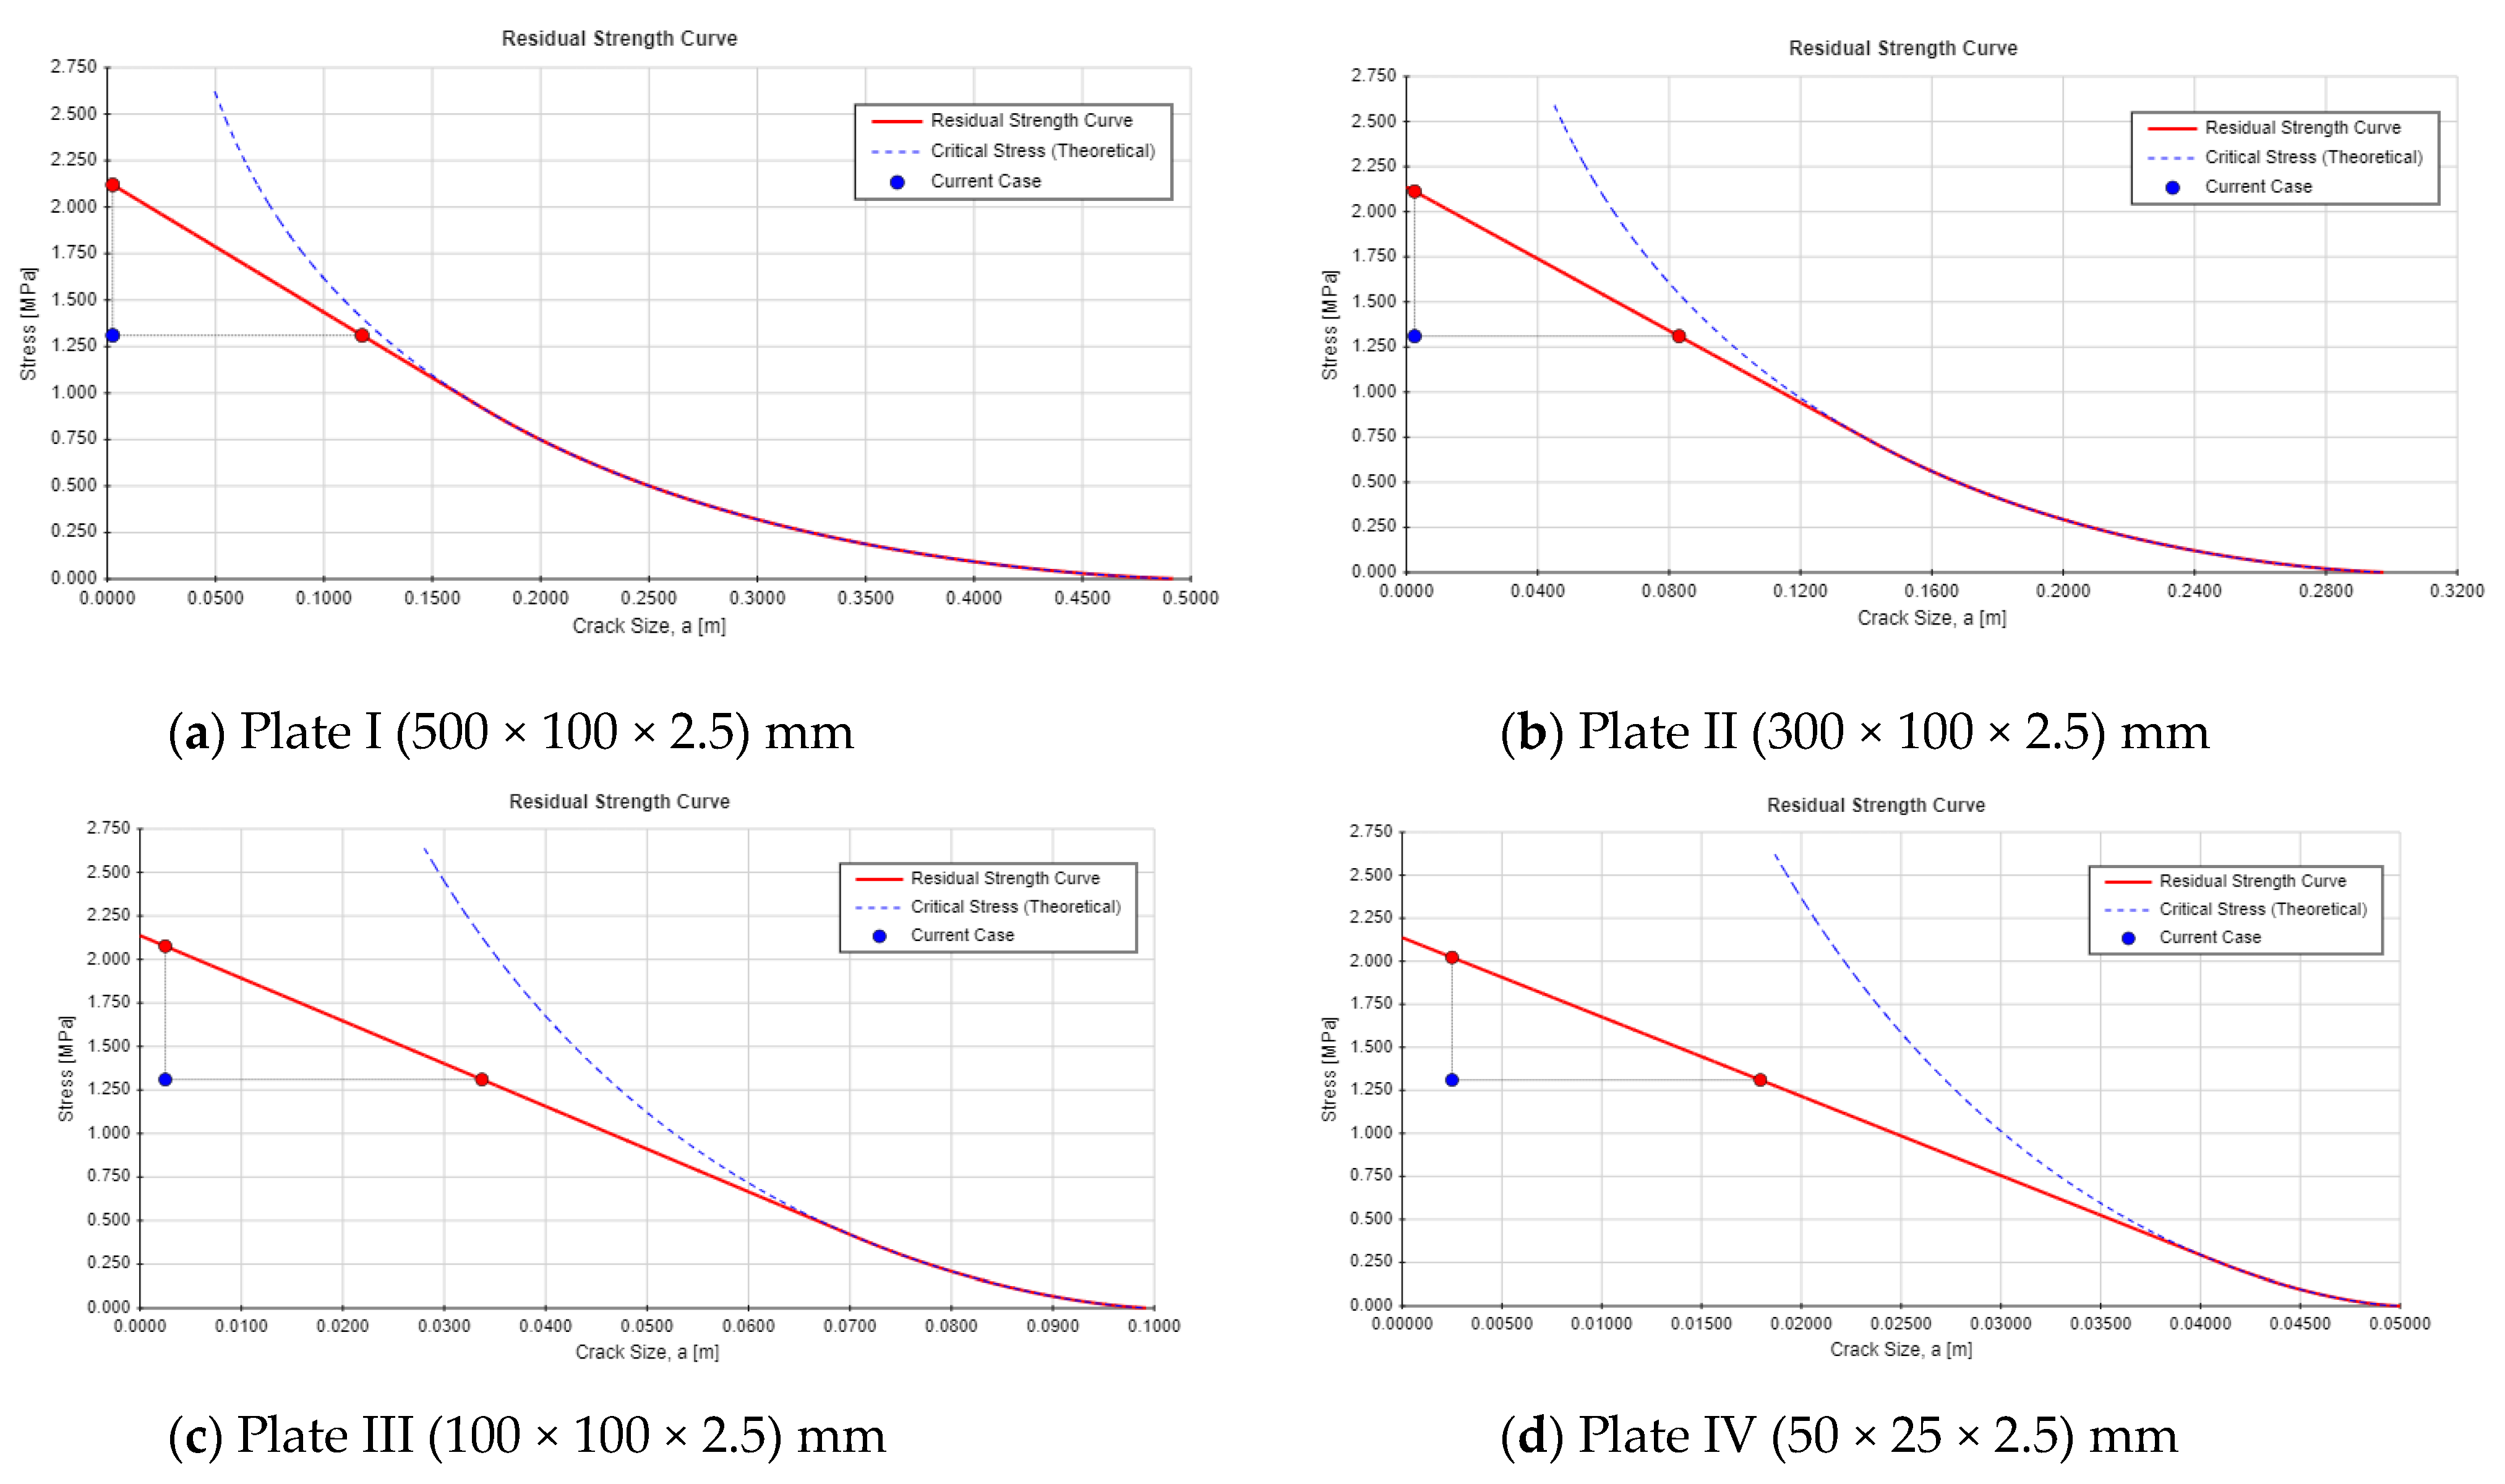
- Two different crack locations were analyzed to assess the safety index of the Guxian dam. The findings revealed that a single-edge crack poses a significantly greater threat to dam safety compared to a center-through crack. Specifically, the safety factor derived from the FAD decreased by 10% for the single-edge crack compared with the center-through crack. Additionally, the critical crack length for this crack type was 40% lower than that of the center-through crack, exposing the dam to a substantially higher risk.
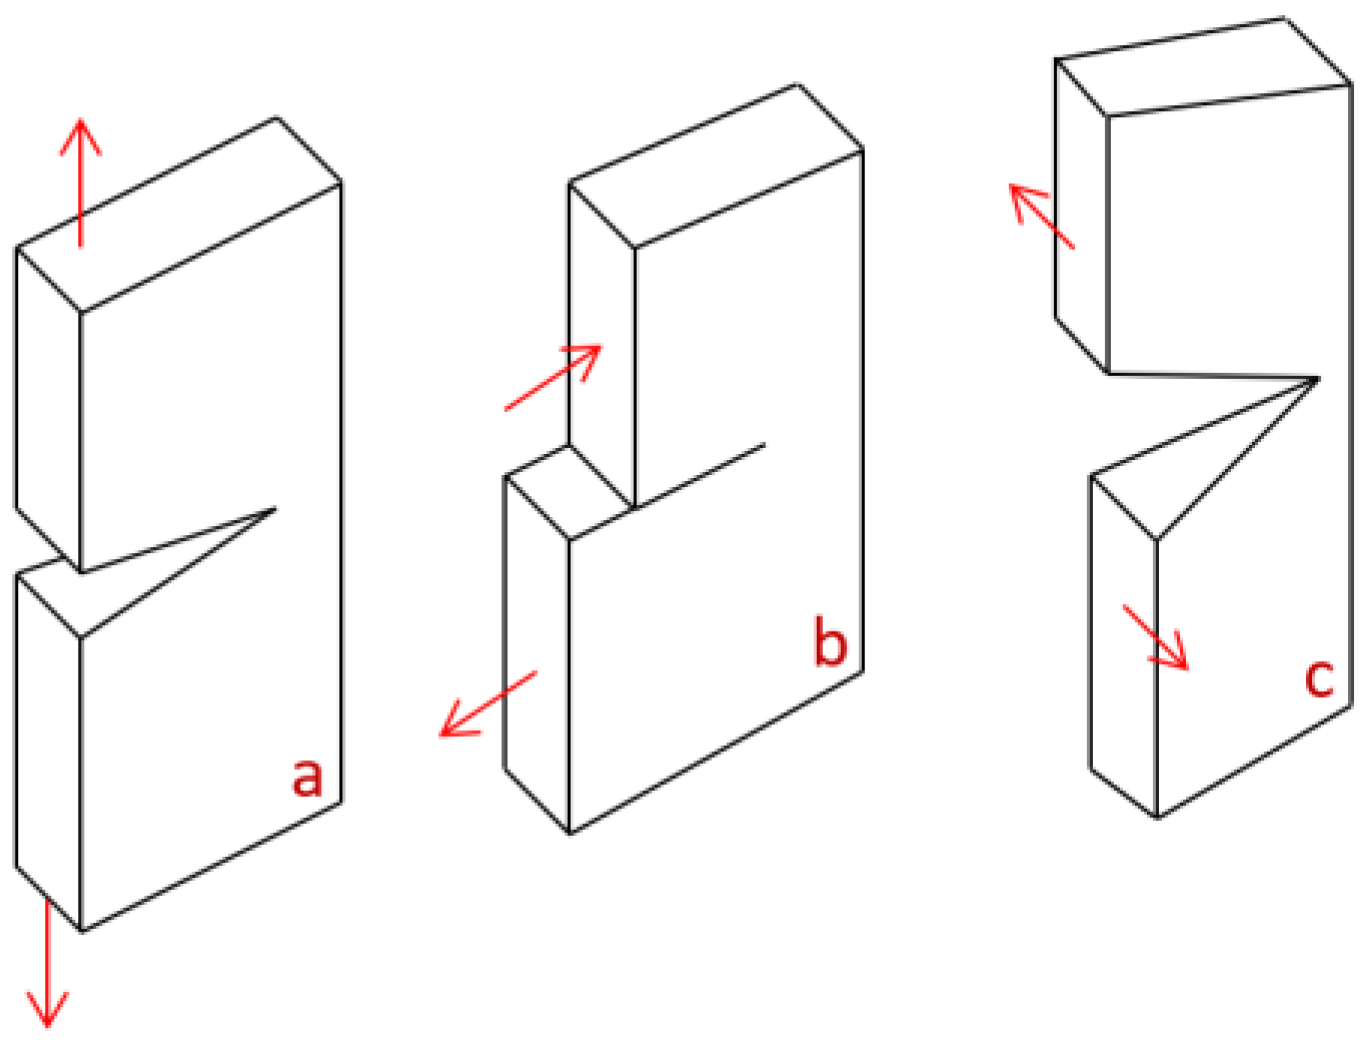
- The resistance of the Guxian dam to hydraulic fracture was assessed using a hydraulic fracture mechanical model, calculating the ultimate overload coefficient for two failure modes, Mode I (opening mode) and Mode II (in-plane shear mode). The analysis showed that the dam’s resistance was lower in Mode I due to the concrete’s weaker resistance to tensile stress compared to shear stress. Mode II fracture energy is generally higher than Mode I, as it accounts for the formation of inclined tensile microcracks within the fracture process zone and the energy needed to overcome shear resistance from aggregate interlock and surface asperities behind the crack tip. The ultimate overload coefficient for Mode I was 5% lower than for Mode II. Although both failure modes pose a risk of hydraulic fracture, Mode I presents a greater threat and should be prioritized in safety evaluations.
- Crack propagation and the presence of weak layers in RCC dams are critical engineering challenges that should be explicitly addressed in design regulations and considered during the design stages. Both factors significantly impact dam safety, particularly during long-term operation.
Author Contributions
Funding
Institutional Review Board Statement
Informed Consent Statement
Data Availability Statement
Conflicts of Interest
References
- Wang, Y.; Jia, J. Experimental study on the influence of hydraulic fracturing on high concrete gravity dams. Eng. Struct. 2017, 132, 508–517. [Google Scholar] [CrossRef]
- Feng, L.M.; Peakau, O.A.; Zhang, C.H. Cracking analysis of arch dams by 3D boundary element method. J. Struct. Eng. 1996, 122, 691–699. [Google Scholar] [CrossRef]
- Vallejo, S.A.N. Hydraulic Engineering Failure of Large Dams. Master’s Thesis, Graz University of Technology, Graz, Austria, 2016. [Google Scholar]
- Schöberl, P. Crack sanitation at Zillergrundl arch dam. In Proceedings of the Symposium on Repair and Upgrading of Dams, Stockholm, Sweden, 5–9 June 1996; COLD: Stockholm, Sweden, 1996. [Google Scholar]
- Lin, P.; Guan, J.; Peng, H.; Shi, J. Horizontal cracking and crack repair analysis of a super high arch dam based on fracture toughness. Eng. Fail. Anal. 2019, 97, 72–90. [Google Scholar] [CrossRef]
- Liang, W.H.; Qiao, C.X.; Tu, C.L. A summarized study on cracks in Zhexi concrete buttress dam. Shuili Xuebao/J. Hydraul. Eng. 1982, 6, 1–10. (In Chinese) [Google Scholar]
- Zhang, H.; Shen, Z.; Xu, L.; Gan, L.; Ma, Z.; Wu, Q.; Liu, D. Experimental investigation on hydraulic fracturing in cement mortar with tensile stress. Eng. Fract. Mech. 2022, 259, 108058. [Google Scholar] [CrossRef]
- Liu, Z.G.; Zhou, Z.B.; Yuan, L.W. Calculation of vertical crack propagation on the upstream face of the Zhexi single buttress dam. J. Hydraul. Eng. 1990, 5, 29–36. [Google Scholar]
- Wang, L.C.; Wu, S.Y. Self-healing mechanism of concrete cracks induced by splitting tensile loading. J. Hydraul. Eng. 2019, 50, 787–797. [Google Scholar]
- Song, Z.P.; Li, N.; Chen, F.X. Three dimensional nonlinear seismic stability analysis of abutment jointed rock mass of high arch dam. Chin. J. Geotech. Eng. 2004, 26, 361–366. [Google Scholar]
- McDonald, J.E.; Curtis, N.F. Repaired and Rehabilitation of Dams; Technical Report, REMR-CS-63; US Army Corps of Engineers, Engineer Research and Development Center: Washington, DC, USA, 1999. [Google Scholar]
- Wang, S.J.; Gu, Y.C.; Ge, C.B. Guideline for dam safety monitoring System appraisal. In Proceedings of the ICOLD Symposium on Sustainable Development of Dams and River Basins, New Delhi, India, 24–27 February 2021. [Google Scholar]
- Suwatthikul, J.; Vanijjirattikhan, R.; Supakchukul, U.; Suksomboon, K.; Nuntawattanasirichai, R.; Phontip, J.; Lewlomphaisarl, U.; Tangpimolrut, K.; Samranyoodee, S. Development of Dam Safety Remote Monitoring and Evaluation System. J. Disaster Res. 2021, 16, 607–617. [Google Scholar] [CrossRef]
- Garcia, L.C.; Martim, A.L.S.S.; Filho, J.G.D.; Fais, L.M.C.F. Dams Safety Index (Dsi): A Reassessment of The Parameters of Analysis. Eng. Agrícola Jaboticabal 2019, 39, 715–720. [Google Scholar] [CrossRef]
- Gu, Y.; Wang, Y.; Pang, Q.; Wu, Y. Further Understanding of Deformation Safety Monitoring Index of Concrete Arch Dams. In Proceedings of the International Forum on Energy, Environment and Sustainable Development (IFEESD 2016), Shenzhen, China, 16–17 April 2016; Atlantis Press: Dordrecht, The Netherlands, 2016. [Google Scholar]
- Zhang, J.; Xie, J.; Kou, P. Abnormal Diagnosis of Dam Safety Monitoring Data Based on Ensemble Learning. IOP Conf. Ser. Earth Environ. Sci. 2019, 267, 062027. [Google Scholar] [CrossRef]
- Wang, S.; Gu, C.; Bao, T. Safety monitoring index of high concrete gravity dam based on failure mechanism of instability. Math. Probl. Eng. 2013, 2013, 732325. [Google Scholar] [CrossRef]
- Fan, S.L.; Chen, J.Y.; Guo, J.Y. Application of finite element equivalent stress method to analyze the strength of gravity dam. J. Hydraul. Eng. 2007, 38, 754–766. (In Chinese) [Google Scholar]
- Su, H.Z.; Wu, Z.R.; Gu, Y.C.; Hu, J.; Wen, Z.P. Game model of safety monitoring for arch dam deformation. Sci. China E 2008, 51, 76–81. [Google Scholar] [CrossRef]
- Wang, C.H. Introduction to Fracture Mechanics; DSTO-GD-0103; DSTO Aeronautical and Maritime Research Laboratory: Canberra, Australia, 1996. [Google Scholar]
- Mehta, P.K.; Monteiro, P.J.M. Concrete Microstructure, Properties and Materials; McGraw-Hill Inc.: New York, NY, USA, 2001. [Google Scholar]
- Ramadan, M.; Jia, J.; Zhao, L.; Li, X.; Wu, Y. Comprehensive Safety Analysis of Ultimate Bearing Capacity Considering Hydraulic Fracture for Guxian High RCC Gravity Dam. Water 2024, 16, 1912. [Google Scholar] [CrossRef]
- Cao, E.; Bao, T.; Li, H.; Xie, X.; Yuan, R.; Hu, S.; Wang, W. A hybridfeature selection-multidimensional LSTM framework for deformation prediction of super high arch dams. KSCE J. Civ. Eng. 2022, 26, 4603–4616. [Google Scholar] [CrossRef]
- Huang, Y.Y.; Xie, T.; Xu, Y.; Wang, R.L. Evaluation of the mechanical parameters of a reinforced concrete dam based on multi-source data. Struct. Concr. 2022, 23, 652–668. [Google Scholar] [CrossRef]
- Xiao, Y.X.; Ye, X.F.; Zhou, W.; Chang, X.L.; Ma, G. Cause analysis of cracks in piers of concrete dam based on nonlinear fracture mechanics model. Eng. J. Wuhan Univ. 2022, 55, 229–237. (In Chinese) [Google Scholar] [CrossRef]
- Qin, X.N.; Gu, C.S.; Zhao, E.F.; Chen, B.; Yu, Y.L.; Dai, B. Monitoring indexes of concrete dam based on correlation and discreteness of multi-point displacements. PLoS ONE 2018, 13, e0200679. [Google Scholar] [CrossRef] [PubMed]
- Su, H.Z.; Li, J.Y.; Wen, Z.P.; Zhou, F.F. A bi-criteria combined evaluation approach for reinforcement effect of gravity dam with cracks. Int. J. Solids 2018, 147, 238–253. [Google Scholar] [CrossRef]
- Zheng, D.J.; Huo, Z.Y.; Li, B. Arch-dam crack deformation monitoring hybrid model based on XFEM. Sci. China Technol. Sci. 2011, 54, 2611–2617. [Google Scholar] [CrossRef]
- Huang, Y.; Li, Z.; Xu, S.; Yu, Z.; Hameed, A. Cause, Stability Analysis, and Monitoring of Cracks in the Gate Storehouse of a Flood Diversion Sluice. KSCE J. Civ. Eng. 2024, 28, 1411–1422. [Google Scholar] [CrossRef]
- Zhuo, R.; Rui, P.; Bin, X.; Yang, Z. Dam safety monitoring data anomaly recognition using multiple-point model with local outlier factor. Autom. Constr. 2024, 159, 105290. [Google Scholar] [CrossRef]
- Li, S.; Zhang, B.; Tong, G.; Li, Y.; Liu, Z.; Shi, B.; Geng, J.; Liu, D.; Wang, H.; Ai, Q.; et al. Online Intelligent Monitoring System and Key Technologies for Dam Operation Safety. Adv. Civ. Eng. 2025, 2025, 9983255. [Google Scholar] [CrossRef]
- Huang, Y.; Chu, Z.; Tian, J.; Feng, T. Reservoir dam safety monitoring method based on BeiDou positioning. In Proceedings of the Proceedings Volume 13506, Sixth International Conference on Geoscience and Remote Sensing Mapping (GRSM 2024), Qingdao, China, 28 January 2025. [Google Scholar] [CrossRef]
- Zhang, W.; Li, H.; Shi, D.; Shen, Z.; Zhao, S.; Guo, C. Determination of Safety Monitoring Indices for Roller-Compacted Concrete Dams Considering Seepage–Stress Coupling Effects. Mathematics 2023, 11, 3224. [Google Scholar] [CrossRef]
- Wang, G.; Liu, A.; Lu, W.; Chen, M.; Yan, P. Seismic Response and Damage Characteristics of RCC Gravity Dams Considering Weak Layers Based on the Cohesive Model. Mathematics 2023, 11, 1567. [Google Scholar] [CrossRef]
- Unger, J.F.; Eckardt, S.; Konke, C. Modelling of cohesive crack growth in concrete structures with the extended finite element method. Comput. Methods Appl. Mech. Eng. 2007, 196, 4087–4100. [Google Scholar] [CrossRef]
- Reinhardt, H.W.; Xu, S. A practical testing approach to determine mode II fracture energy GI I F for concrete. Int. J. Fract. 2000, 105, 107–125. [Google Scholar] [CrossRef]
- Bazant, Z.P.; Pfeiffer, P. Shear fracture tests of concrete. Mater. Struct. 1986, 19, 111–121. [Google Scholar] [CrossRef]
- Chen, W.F.; Saleeb, A.F. Constitutive Equations for Engineering Materials, 1st ed.; Elsevier: Amsterdam, The Netherlands, 2013; Volume 37. [Google Scholar]
- Zhu, B.; Wang, J.; Zhou, H.; Wen, L. An XFEM-based analysis of concrete face cracking in rockfill dams. Math. Probl. Eng. 2021, 2021, 6640668. [Google Scholar] [CrossRef]
- Wood, H.A.; Engle, R.M., Jr. USAF Damage Tolerant Design Handbook: Guidelines for the Analysis and Design of Damage Tolerant Aircraft Structures; Revision A, ASIN B00BJSUU9I; PN: Dayton, OH, USA, 1979. [Google Scholar]
- Osage, D.A.; Janelle, J.L. API 579-1/ASME FFS-1 2007: A Joint API/ASME Fitness-for-Service Standard for Pressurized Equipment. In Proceedings of the SME 2008 Pressure Vessels and Piping Conference, Chicago, IL, USA, 27–31 July 2008; Volume 1: Codes and Standards. The American Petroleum Institute and The American Society of Mechanical Engineers: Washington, DC, USA, 2007; pp. 777–791. [Google Scholar] [CrossRef]
- Anderson, T.L. Fracture Mechanics: Fundamentals and Applications, 3rd ed.; CRC Press: Boca Raton, FL, USA; Taylor & Francis Group: Boca Raton, FL, USA, 2005; pp. 410–423. [Google Scholar]
- Budynas, R.; Nisbett, K. Shigley’s Mechanical Engineering Design, 8th ed.; McGraw-Hill Science: New York, NY, USA, 2006; p. 1059. ISBN 10: 0390764876. [Google Scholar]
- Callister, W.D.; Rethwisch, D.G. Materials Science and Engineering: An Introduction, 9th ed.; John Wiley and Sons: Hoboken, NJ, USA, 2013; ISBN 1118476549, 9781118476543. [Google Scholar]
- Dowling, N.E. Mechanical Behavior of Materials: Engineering Methods for Deformation, Fracture, and Fatigue, 3rd ed.; Pearson Education: London, UK, 2013; ISBN 0131395068/9780131395060. [Google Scholar]
- Liu, A.F. Structural Life Assessment Methods; ASM International: Almere, The Netherlands, 1998. [Google Scholar]
- MIL-HDBK-5J, Metallic Materials and Elements for Aerospace Vehicle Structures; Department of Defense Handbook. 2003. Available online: https://www.milthink.com/detail/49543 (accessed on 23 April 2025).
- ACI. Report on Roller-Compacted Mass Concrete, ACI 2017.5R-11; American Concrete Institute: Farmington Hills, MI, USA, 2011. [Google Scholar]
- NASA-STD-5009; Non-destructive Evaluation Requirements for Fracture-Critical Metallic Components. NASA Standards: Washington, DC, USA, 2008.
- SL 319-2018; Design Specification for Concrete Gravity Dams. China Water and Power Press: Beijing, China, 2018.
- Heidarnezhad, F.; Toufigh, V.; Ghaemian, M. Analyzing and Predicting Permeability Coefficient of Roller-Compacted Concrete (RCC). J. Test. Eval. May 2021, 49, 1454–1473. [Google Scholar] [CrossRef]
- Yu, X.Z. Fracture Mechanics of Concrete. Waterpower 1988, 2, 49–53. [Google Scholar]
- Wu, Z.M.; Zhao, G.F.; Xi, S.L. Fracture toughness of large concrete specimen. J. Hydraul. Eng. 1997, 7, 67–76. [Google Scholar]
- Ehab, S.M.M.S. Mode I Stress Intensity Factor With Various Crack Types. Fract. Struct. Integr. 2021, 16, 471–485. [Google Scholar] [CrossRef]


| Geometry | Stress Intensity Factor |
Center crack in an infinite body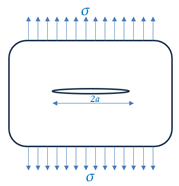 | |
Single edge-through crack in semi-infinite body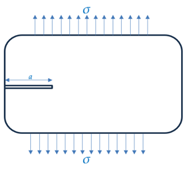 |
| Material | Elastic Properties | Plastic Properties | ||
|---|---|---|---|---|
| Elastic Modulus GPa | Poisson Ratio | Friction Angle ° | Yield Stress MPa | |
| C15W6 | 22 | 0.167 | 50.7 | 1.78 |
| BT CONCRETE | 39 | 0.167 | 59.6 | 4.49 |
| C20W6 | 25.5 | 0.167 | 51.3 | 2.48 |
| C25W8 | 28 | 0.167 | 51.7 | 2.52 |
| Foundation | 32 | 0.2 | 50.7 | 1. 8 |
| Mechanical Properties | Fracture Properties | ||
|---|---|---|---|
| Yield Strength (MPa) | Elastic Modulus (GPa) | Tensile Strength (MPa) | Fracture Toughness K1c (MN/m3/2) |
| 2.1 | 29.3 | 3 | 1.25 |
| Plate | b (mm) | t (mm) | a (mm) |
|---|---|---|---|
| 1 (I) | 500 | 100 | 2.5 |
| 2 (II) | 300 | 100 | 2.5 |
| 3 (III) | 100 | 100 | 2.5 |
| 4 (IV) | 50 | 25 | 2.5 |
| Mode I | Mode II | |
|---|---|---|
| σxx | ||
| σyy | ||
| σxy |
| Parameter | Guxian | Dam Geometric Dimensions |
|---|---|---|
| D1 (m) | 15 | 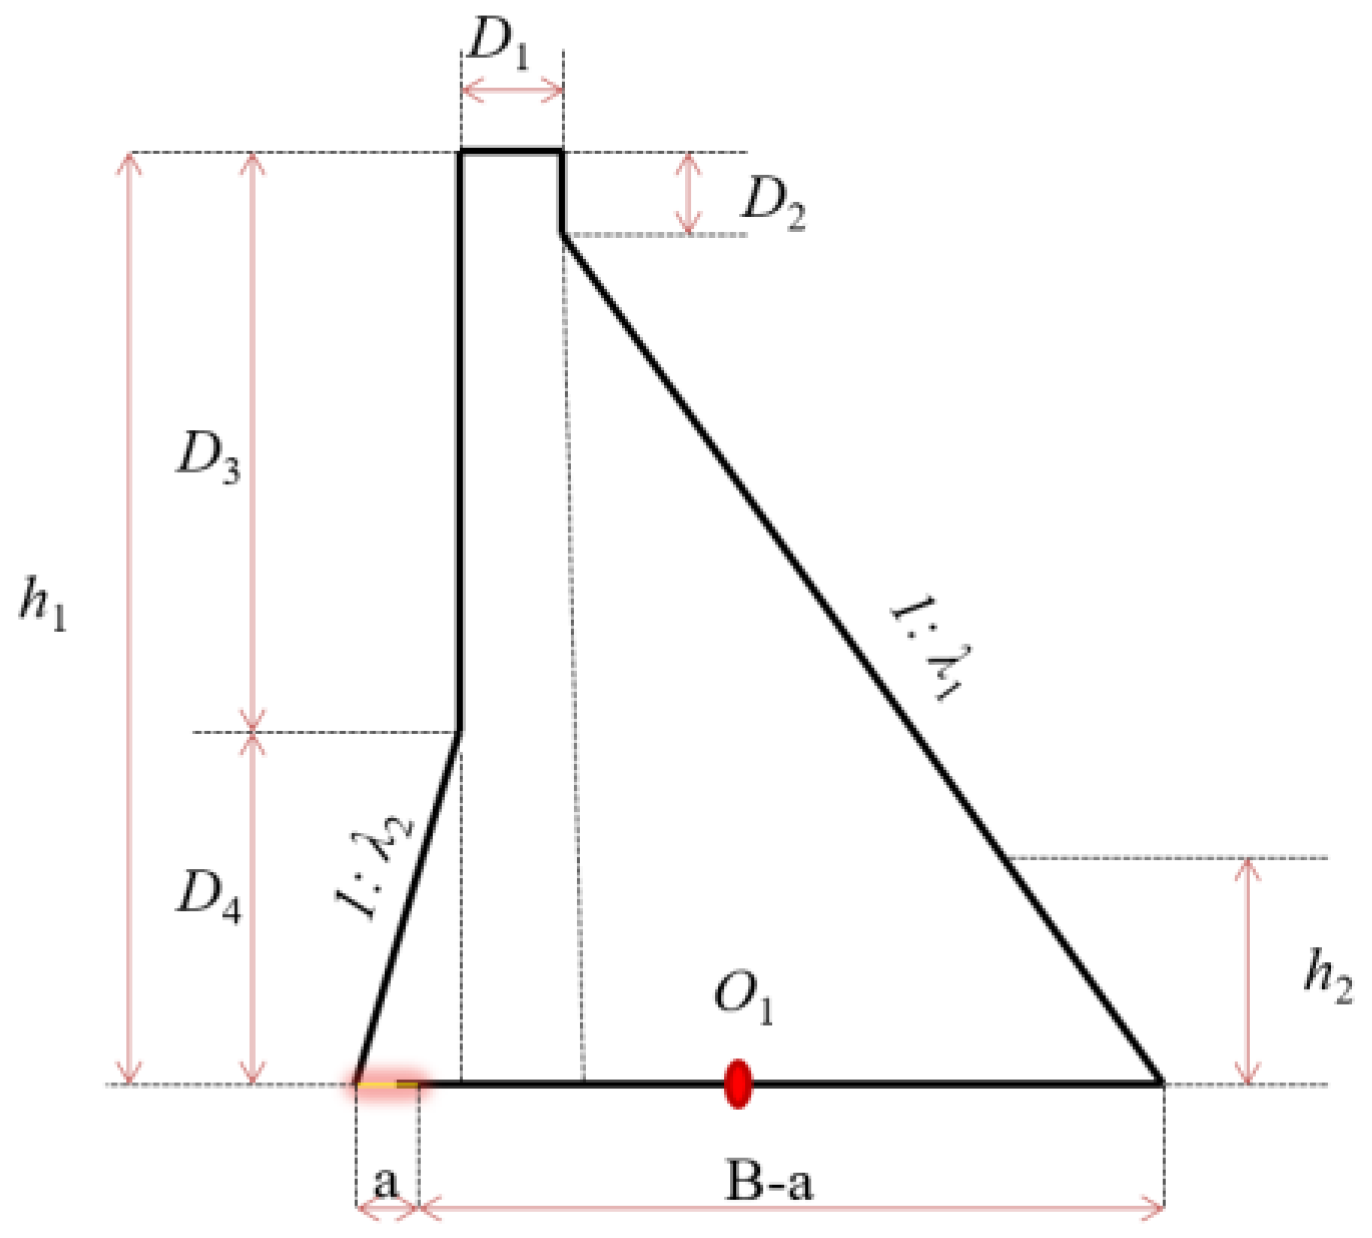 |
| D2 (m) | 20 | |
| D3 (m) | 165 | |
| D4 (m) | 50 | |
| λ1 (slope ratio) | 0.8 | |
| λ2 (slope ratio) | 0.3 | |
| h1 (m) | 215 | |
| h2 (m) | 25 | |
| B (m) | 172.35 | |
| γwat (N/m3) | 10,000 | |
| γcon (N/m3) | 24,000 | |
| ft (MPa) | 1.38 | |
| α | 0.5 |
| Observation Point | Safety Index (In Terms of Displacement) Without Considering the Weak Layers (mm) | Safety Index (In Terms of Displacement) with Considering the Weak Layers (mm) |
|---|---|---|
| Point 1 (465 m) | 115 | 88 |
| Point 2 (480 m) | 122 | 112 |
| Point 3 (525 m) | 145 | 140 |
| Point 4 (631 m) | 175 | 173 |
| Plate/Crack Location | Center-Through Crack | Single-Edge Crack | ||
|---|---|---|---|---|
| FAD Safety Factor | Critical Crack Length (acr) (m) | FAD Safety Factor | Critical Crack Length (acr) (m) | |
| 1 (I) | 1.71 | 0.2157 | 1.66 | 0.1176 |
| 2 (II) | 1.71 | 0.17 | 1.66 | 0.08302 |
| 3 (III) | 1.7 | 0.08 | 1.66 | 0.03372 |
| 4 (IV) | 1.71 | 0.04 | 1.66 | 0.01795 |
Disclaimer/Publisher’s Note: The statements, opinions and data contained in all publications are solely those of the individual author(s) and contributor(s) and not of MDPI and/or the editor(s). MDPI and/or the editor(s) disclaim responsibility for any injury to people or property resulting from any ideas, methods, instructions or products referred to in the content. |
© 2025 by the authors. Licensee MDPI, Basel, Switzerland. This article is an open access article distributed under the terms and conditions of the Creative Commons Attribution (CC BY) license (https://creativecommons.org/licenses/by/4.0/).
Share and Cite
Ramadan, M.; Jia, J.; Zhao, L.; Li, X.; Wu, Y. Numerical and Fracture Mechanical Evaluation of Safety Monitoring Indexes and Crack Resistance in High RCC Gravity Dams Under Hydraulic Fracture Risk. Materials 2025, 18, 2893. https://doi.org/10.3390/ma18122893
Ramadan M, Jia J, Zhao L, Li X, Wu Y. Numerical and Fracture Mechanical Evaluation of Safety Monitoring Indexes and Crack Resistance in High RCC Gravity Dams Under Hydraulic Fracture Risk. Materials. 2025; 18(12):2893. https://doi.org/10.3390/ma18122893
Chicago/Turabian StyleRamadan, Mohamed, Jinsheng Jia, Lei Zhao, Xu Li, and Yangfeng Wu. 2025. "Numerical and Fracture Mechanical Evaluation of Safety Monitoring Indexes and Crack Resistance in High RCC Gravity Dams Under Hydraulic Fracture Risk" Materials 18, no. 12: 2893. https://doi.org/10.3390/ma18122893
APA StyleRamadan, M., Jia, J., Zhao, L., Li, X., & Wu, Y. (2025). Numerical and Fracture Mechanical Evaluation of Safety Monitoring Indexes and Crack Resistance in High RCC Gravity Dams Under Hydraulic Fracture Risk. Materials, 18(12), 2893. https://doi.org/10.3390/ma18122893