Article

Pore Structure Influence on Properties of Air-Entrained Concrete

Department of Building Materials Engineering, Faculty of Civil Engineering, Warsaw University of Technology, Al. Armii Ludowej 16, 00-637 Warsaw, Poland
Materials 2025, 18(12), 2885; https://doi.org/10.3390/ma18122885
Submission received: 12 April 2025 / Revised: 4 June 2025 / Accepted: 12 June 2025 / Published: 18 June 2025
(This article belongs to the Collection Concrete and Building Materials)

Abstract

The study investigates the influence of an air-entraining admixture on the properties and pore structure of ordinary concrete. The aim was to examine how modifications to the concrete mix affect compressive strength, ultrasonic pulse velocity, and resistance to freeze–thaw cycles. Concrete samples with varying admixture dosages (0.00–1.50% of cement mass) were tested for mechanical properties and pore structure. Freeze–thaw resistance was assessed using both direct (PN-B-06265) and indirect methods (EN 480-11), while pore characteristics were evaluated via computer-aided image analysis. Results show that increasing the admixture dosage enhances freeze–thaw resistance by refining the pore structure—particularly by increasing the content of micropores below 0.3 mm—while simultaneously reducing compressive strength and ultrasonic velocity. Statistical analysis revealed that pore parameters such as total air content, specific surface area, and spacing factor significantly correlate with concrete performance. The regression models confirmed that compressive strength and ultrasonic velocity are negatively impacted by increased pore volume, while freeze–thaw resistance improves due to a more favorable pore size distribution. The findings demonstrate that optimizing the admixture dosage can effectively balance durability and mechanical performance, and that quantitative stereological parameters provide a valuable basis for predicting the behavior of air-entrained concrete.

1. Introduction

The behavior of every material is somehow related to its microstructure. It is well known that changes in pore content, their size distribution, and even in their arrangement in hardened cement matrix may have a significant effect on the performance of cement composites [1,2,3,4,5,6,7,8,9]. A clear example of this is how the pore structure affects concrete durability in cold climates. The durability of concrete is one of the key factors determining the quality and longevity of concrete structures. A particularly significant factor influencing concrete durability and safe use of structures in such conditions is resistance to the aggressive impact of the environment caused by cyclic freezing and thawing.
In hardened concrete, there are three main types of pores: gel pores, capillary pores, and air voids [10,11,12,13]. Gel pores are very small (less than 10 nm) and do not affect the strength or durability of concrete, as they are inaccessible and do not participate in water transport. Capillary pores, which can be up to 1 μm in size, do not influence the compressive strength, but they are very important for durability (including freeze–thaw resistance), because they form a system of pathways for water and aggressive ion transport. When the temperature drops well below freezing, water inside these pores starts to freeze. As water turns into ice, it expands by about 9% [14,15,16]. This volume expansion leads to pressure buildup within the pores if the matrix lacks sufficient pore space and interconnectivity to accommodate it [14]. If the pressure surpasses the tensile strength of the cement paste at any point, local cracks will form, and consequently, the mechanical properties and durability of the concrete may deteriorate after a number of freeze–thaw cycles [16,17,18,19,20]. Certainly, the intensity of the induced hydraulic pressure depends on the cement paste’s permeability, degree of saturation, distance to the nearest unfilled void, and the freezing rate [21].
The third type of pore that can be distinguished in the concrete microstructure are air voids, also called entrapped air. Their content in ordinary concrete is about 3% of the volume, and their size can be as large as 5 mm [22]. Air voids are irregular in shape, mostly formed accidentally during mixing, transport, and other handling properties. They do not contribute to improved freeze–thaw resistance; on the contrary, they may negatively affect durability and significantly deteriorate mechanical performance [23,24,25,26].
Concrete can be made more resistant to freezing and thawing by changing its microstructure using an air-entraining admixture (AEA) [27,28,29]. This admixture lowers the surface tension of the mixing water, facilitating the formation and stabilization of fine air bubbles within the cement paste. High alkalinity in the mix further makes this effect even stronger, promoting the generation and persistence of these tiny air voids. They are smaller than the entrapped air, have a spherical shape and are usually between 0.01 mm and 0.1 mm [30] or, in some cases, up to 0.3 mm [31]. These introduced microscopic, uniformly distributed air voids interrupt the continuity of capillaries in the concrete and provide a pressure relief system. When water within the concrete freezes and expands, the nearby air voids gives the ice space to grow, which reduces internal stress and prevents cracking [32]. Besides improving freeze–thaw resistance, air-entraining admixture may also improve the concrete fire resistance [33], reduce water absorption (decrease in the penetration depth and absorbed water) [34,35,36], as well as workability of fresh mix [37,38].
Although the AEA have many benefits, the resulting increase in air content may cause some properties concerns, especially when the dosage is too high or due to unfavorable technological conditions. In general, higher air content is associated with a reduction in the compressive strength of concrete—for every 1% increase in air content, the compressive strength can drop by 4% to 6% [39,40]. The introduced micropores may lead to increase in apparent gas diffusivity and permeability [41,42]. Excessive air entrainment may reverse the intended effects of the admixture, leading to reduced workability [43], increased water absorption [44], higher permeability and delayed setting [45], end even aggravate freeze–thaw damage [28,46], due to microstructure deterioration.
As shown, the pore structure of cement composites significantly affects their performance under cyclic freezing and thawing conditions. Therefore, the traditional design process for cement composites—that is based on the relation between composition, production technology and properties—should be supplemented with the analysis of the material’s microstructure. This should include recognizing the quantitative relations between microstructure and properties.
There are many methods of analyzing microstructure of concrete. These methods may be divided into two groups: microscopic techniques, which allow for the observation of microstructure morphology (i.e., dimensions or arrangement of phases at different levels of magnification), and volumetric technics, which provide averaged information about the microstructure within a given sample volume (e.g., mercury porosimetry, nitrogen absorption, image analysis). Especially interesting is the image analysis method, due to its low cost and the short time required to obtain results. In the area of cement composite technology, the image analysis method is commonly employed to calculate parameters that describe the geometrical features of aggregate grains and pore structure, e.g., amount, size, volume fraction, surface, shape, and arrangement [41,47,48,49,50,51,52,53,54,55,56,57,58,59,60]. It can also be used to assess crack characteristics in the hardened cement matrix by determining their length, orientation, and width [61,62,63,64,65,66]. Less common uses include analysis of the degree of cement hydration [67] and the petrographic analysis of concrete [68]. Recently, advanced computer tools like neural networks are being used more often to automatically analyze complex microstructure images, which is shown by the growing number of scientific papers on this topic.
Image analysis can be used to estimate freeze–thaw resistance indirectly by determining pore structure parameters using the transverse method, as described in EN 480-11 [69]. This method has several advantages, the most important one being that it takes much less time than direct testing methods. The procedure involves preparing precisely ground and polished samples and observing the pore structure along a set of parallel measurement lines using an optical or digital microscope. During this, the number of pores intersected by the lines and the length of chord of each pore are recorded. The data is then analyzed to describe the pore system using parameters like total pore content (A), content of the micropores below 0.3 mm (A300), specific surface area (α), spacing factor ( L ¯ ), and pore size distribution. Although the standard does not define fixed threshold values for these parameters, recommended ranges are available in the literature and national specifications [14,69,70,71,72,73,74,75,76,77,78]. The most important microstructure parameters—mainly because they are the most commonly evaluated and compared in studies—are the L ¯ and A300. Typically, L ¯ should not exceed 0.25 mm, while A300 should be at least 1.5%. The recommended values for the remaining parameters are as follows: A between 4% and 7%, A300 at least 1.5%, and α between 15 and 24 mm−1.
In this study, image analysis was used to examine the pore structure of ordinary concrete, where the microstructure was modified by adding different amounts of air-entraining admixture. The analysis included parameters listed in EN 480-11, as well as additional ones proposed by the author, such as the share of pores in different size ranges and the pore content excluding coarse aggregate. The tests were carried out using a proprietary computer program developed in MATLAB (ver. R2024b).
Manual analysis using the traditional transverse method is time-consuming, requires experience, and needs a microscope, either optical or digital. The method proposed in this study follows the EN 480-11 sample preparation procedure, but instead of using a microscope, the microstructure image is captured digitally. Then, a two-step image analysis is performed: first, manual segmentation to isolate pores, and second, automatic measurement and calculation of pore structure parameters. This approach makes the analysis faster and more accurate, because the computer performs calculations quickly and consistently. Also, a microscope is not needed, since a high-resolution flatbed scanner can be used to capture the image [79,80,81,82]. Similar methods have been successfully used in other studies [76,77], where computer algorithms were applied to evaluate the air void system in concrete according to EN 480-11. However, unlike those studies, this work compares indirect image-based results with direct freeze–thaw resistance tests.
The European standards do not specify the methodology for freeze–thaw resistance testing or the criteria for its assessment. Therefore, the direct tests were performed according to procedure described in PN-B06265 standard [83], which is the Polish supplement to EN 206 [84]. The applied method enables the assessment of frost resistance under cyclic freezing and thawing conditions, considering both the degree of internal damage to the concrete, expressed by the reduction in sample compressive strength, and external damage, defined by level of surface damage and loss of the sample mass. The results were analyzed using correlation and multiple regression with stepwise selection, to determine which microstructure parameters have the strongest effect on freeze–thaw resistance, and to identify those that can be used to build a predictive model. This study offers a new insight, as such a comparison between direct and indirect methods has not been made before—likely due to the time and effort required for direct freeze–thaw testing.
In designing air-entrained concrete, it is important to find a balance between compressive strength and durability in freeze–thaw conditions. Adding air to concrete helps it resist freezing and thawing, but it also creates tiny air voids. These increase the concrete’s porosity, which lowers its density and reduces its compressive strength. Too much air can make the structure too weak, while too little air increases the risk of damage from freezing and de-icing salts. That is why both the working conditions and structural requirements must be considered to find the right amount of air. The goal is to achieve a good balance between durability and strength. For this reason, a similar analysis was performed for compressive strength as was done for freeze–thaw resistance. The analysis also included the ultrasonic pulse velocity (UPV), which is one of the most important non-destructive testing methods. The wave velocity depends on the material’s density, elasticity, and the presence of pores or small cracks. This makes it useful for estimating compressive strength [53,79,85,86,87,88]. Although this method does not directly measure air content, more air voids—common in air-entrained concrete—decreases [89,90]. So, wave velocity can indirectly show how porous the concrete is. Because of this, ultrasound can help assess the concrete’s strength, uniformity, and durability.
The presented article brings new value by applying advanced imaging and statistical methods to a practical problem of designing durable concrete for cold climates. By combining microstructure analysis with mechanical and durability properties, it offers a holistic approach to concrete design that considers both structural and environmental factors. The developed models allow for precise design of freeze–thaw resistant concrete by optimizing the amount of air-entraining admixture. These models can also support quality control in technology labs and may even help update standards for freeze–thaw-resistant concrete design. Finally, they may be used to optimize the dosage of air-entraining admixtures.

2. Experimental Investigation

2.1. Materials

In this study, ordinary concrete was modified with an air-entraining admixture. The reference concrete was the ordinary concrete made with Portland cement CEM I 42.5R and pebble aggregate. The aggregate mix included fine aggregate (fraction 0/2 mm), which was river sand, and coarse gravel aggregates with the maximum grain size of 16 mm (fraction 2/4 mm, 4/8 mm, and 8/16 mm)—see Figure 1. The composition of reference concrete was deliberately designed in such a way to produce hardened concrete susceptible to freeze and thaw damage. The water-to-cement ratio of the concrete mixes was fixed at 0.55. According to the EN 206 European standard, concrete with such a w/c ratio would not meet the requirements for freeze–thaw exposure classes XF3 and XF4, i.e., concretes highly saturated with water, with or without anti-icing agents.
The reference concrete was then modified by adding an air-entraining admixture (Table 1), designed to introduce a stable system of microscopic air voids. These voids disrupt the continuity of capillary pores, thereby improving freeze–thaw resistance of cement composites, even in the presence of de-icing agents. The admixture [91] also reduces segregation and bleeding, and it is compatible with all types of cement and other chemical admixtures, including superplasticizers. It is recommended for use in concrete exposed to harsh environmental conditions, such as road pavements, precast elements, and bridge components. The admixture was incorporated into concrete mix at a dosage of 0.04%, 0.2%, and 1.5% of the cement mass, representing the lower limit, recommended dosage, and upper limit suggested by the manufacturer, respectively. A detailed composition of the concretes used in the study is given in Table 2.

2.2. Methods

2.2.1. Consistency

The consistency of the concrete mix was tested using the slump test method, according to EN 12350-2 [92]. The fresh concrete was placed into a cone-shaped mold in three layers, with each layer compacted manually by 25 strokes using a tamping rod. After filling, the mold was carefully lifted, and the slump was measured. The test consists of measuring the slump, defined as the difference between the height of the mold and the height of the highest point of the demolded concrete mix sample. The slump test is sensitive to changes in the consistency of the concrete mix and can measure slumps ranging from 10 mm to 210 mm. The entire procedure—from the start of filling the mold to removing it—should be completed within 2.5 min. The consistency classes based on the slump test are shown in Table 3.

2.2.2. Air Content

The air content in the concrete mix was measured using the pressure method according to EN 12350-7 [93], which involves a device called a pressure air meter. It is widely used because it is quick, reliable, and suitable for most types of concrete, especially those containing normal weight aggregates. In this method, a sample of fresh concrete is placed into a sealed container and covered with a lid equipped with a pressure gauge. Water is added to fill the space above the concrete, and then air pressure is applied. When the pressure is released into the chamber, the change in pressure is used to calculate the volume of air in the concrete. The result, shown on the gauge, indicates the percentage of air content with an accuracy of 0.1%. This method is based on the relation between air volume and applied pressure, described by Boyle’s Law, which states that for a given mass of an ideal gas at constant temperature, the volume is inversely proportional to the pressure.

2.2.3. Compressive Strength

The compressive strength tests were carried out on cubic samples measuring 100 mm × 100 mm× 100 mm. The samples were kept in water at a temperature of 20 ± 2 °C for 28 days, following the EN 12390-2 standard [94]. The compressive strength for each concrete mix was calculated as the average of the results from three samples.

2.2.4. Ultrasonic Pulse Velocity

One of the oldest and simplest non-destructive method (NDT) is the ultrasonic pulse velocity (UPV) testing. The UPV method utilizes longitudinal elastic waves—vibrations with the frequencies above 20 kHz, which is the upper limit of the audible frequency for humans. The higher frequency vibrations allow for more accurate measurements; however, they also are subjected to greater attenuation, resulting in lower signal energy. Consequently, the testing of heterogenous concrete composites should be carried out using ultrasonics with the highest possible frequencies that still allow for the registration of good quality waveforms after signal propagation through the material.
In this study, a digital ultrasonic flaw detector Pundit PL-200 and two piezoelectric transducers operating at the frequency of 54 kHz were used. The test was performed by the direct method (Figure 2) according to EN 12504-4 [95], where transducers were placed on opposite sides of 100 mm × 100 mm × 100 mm cubic samples, intended for compressive strength tests. To determine the propagation time of the ultrasonic pulse between the emitter and receiver, amplitude-versus-time graphs were analyzed (Figure 2). The UPV was calculated by dividing the distance between transducers (equal about 100 mm) by the recorded propagation time. Each measurement was repeated in three different directions per sample. With three samples prepared for each material, a total of nine UPV results were obtained for each composition. Finally, four average velocities were calculated for each type of concretes.

2.2.5. Freeze–Thaw Resistance (Direct Method)

The EN-206 European standard [84] does not specify the methodology for freeze–thaw resistance testing or the criteria for its assessment. Therefore, the direct tests were performed according to the procedure described in the PN-B06265 standard [83], which is the Polish supplement to EN 206. The applied method enables the assessment of frost resistance under cyclic freezing and thawing conditions, considering both the degree of internal damage to the concrete, expressed by reduction in sample compressive strength, and external damage, defined by level of surface damage and loss of the sample mass. For the test, 12 cubic samples with dimensions of 100 mm × 100 mm × 100 mm were prepared per each composition and cured in water at a temperature of 20 ± 2 °C for 28 days. After this period, half of the samples were removed from the water, weighed, and subjected to cycles of freezing in air and thawing in water, while the remaining half was left in water as control samples. Each cycle lasted 8 h, with the temperature ranging from −18 ± 2 °C to 18 ± 2 °C. The testing lasted for 150 cycles, corresponding to a total duration of 50 days. Subsequently, the compressive strength of the samples subjected to cycles, as well as reference ones, was assessed. Once all results were collected, the average mass loss (Equation (1)) and the average compressive strength reduction (Equation (2)) were calculated using the following formulas:
m = m 1 m 2 m 1 · 100 [ % ]
f c = f c 1 f c 2 f c 1 · 100 [ % ]
where m1—the average mass of the samples before the first cycle in a water-saturated state [kg]; m2—the average mass of the samples after completing the cycles in a water-saturated state [kg]; fc1—the average compressive strength of the control samples (non-frozen, water-saturated) [MPa]; and fc2—the average compressive strength of the samples after the final cycle [MPa].
The freeze–thaw resistance test gives a positive result, i.e., a result confirming the achievement of the freeze–thaw resistance level corresponding to the specified number of cycles (in this case, F150), when the following conditions are met:
-
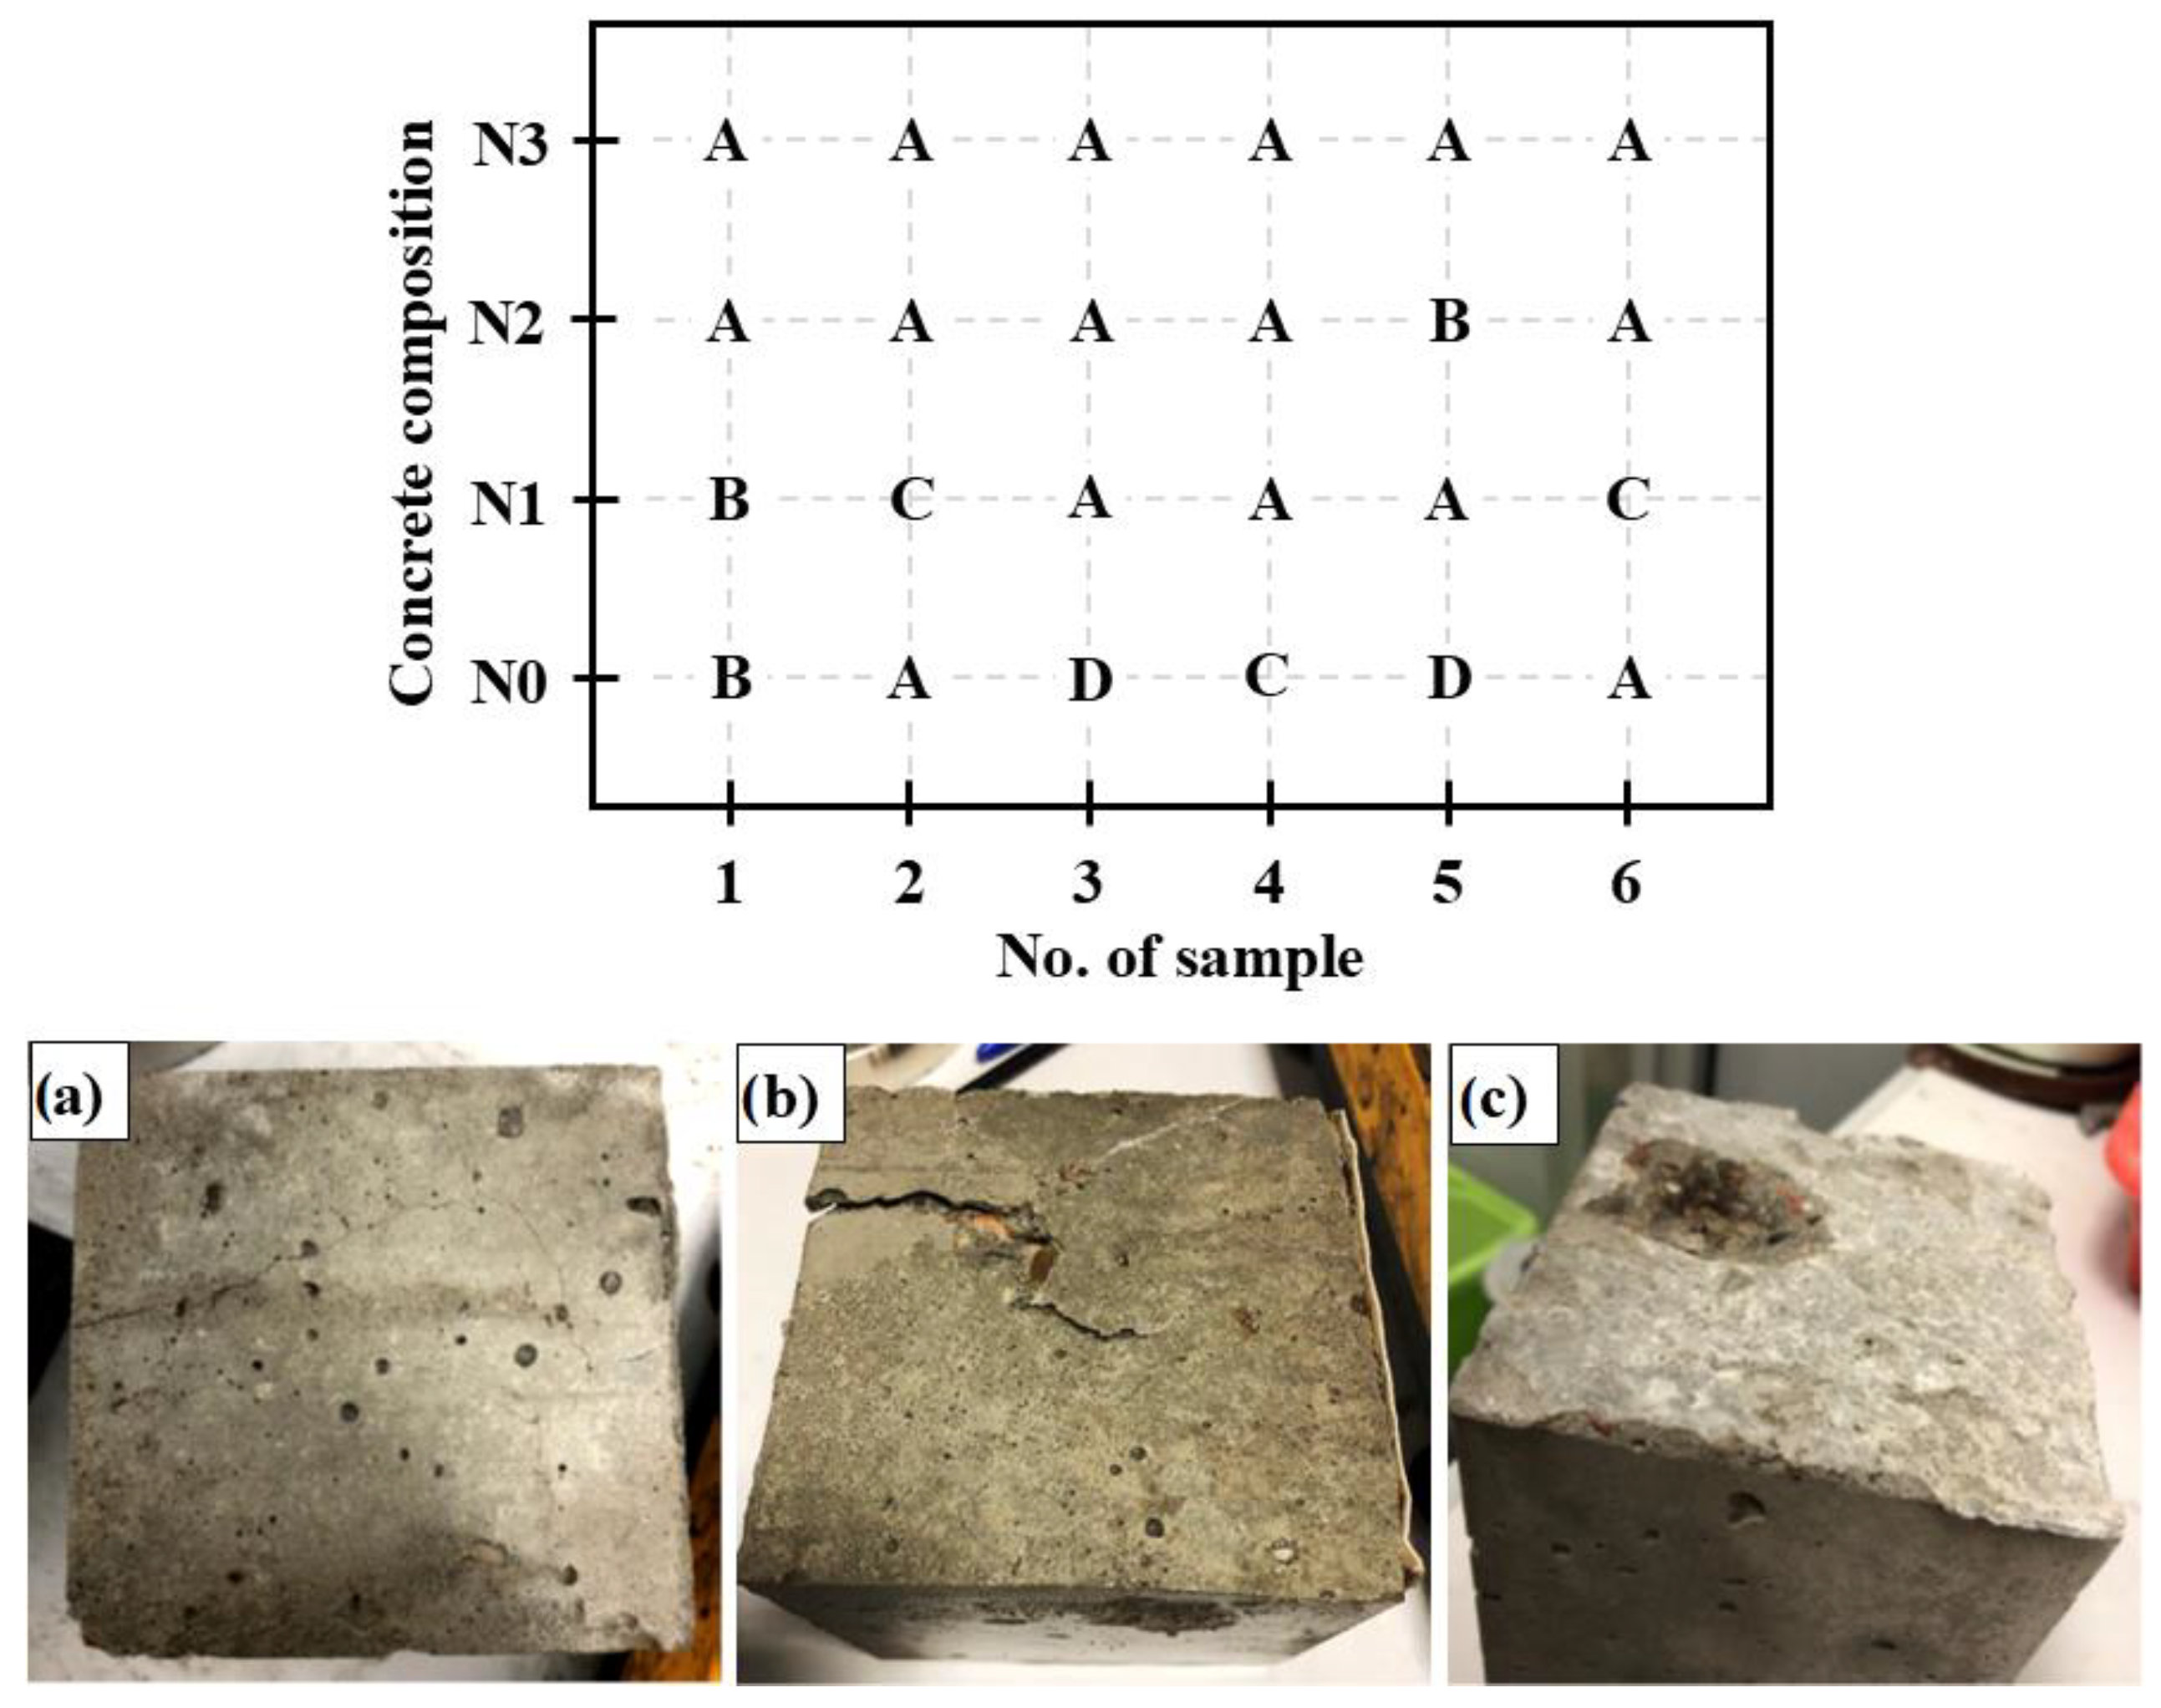
the samples do not show any cracking,
-
the average mass loss of the samples does not exceed 5%,
-
the average reduction in compressive strength does not exceed 20%.

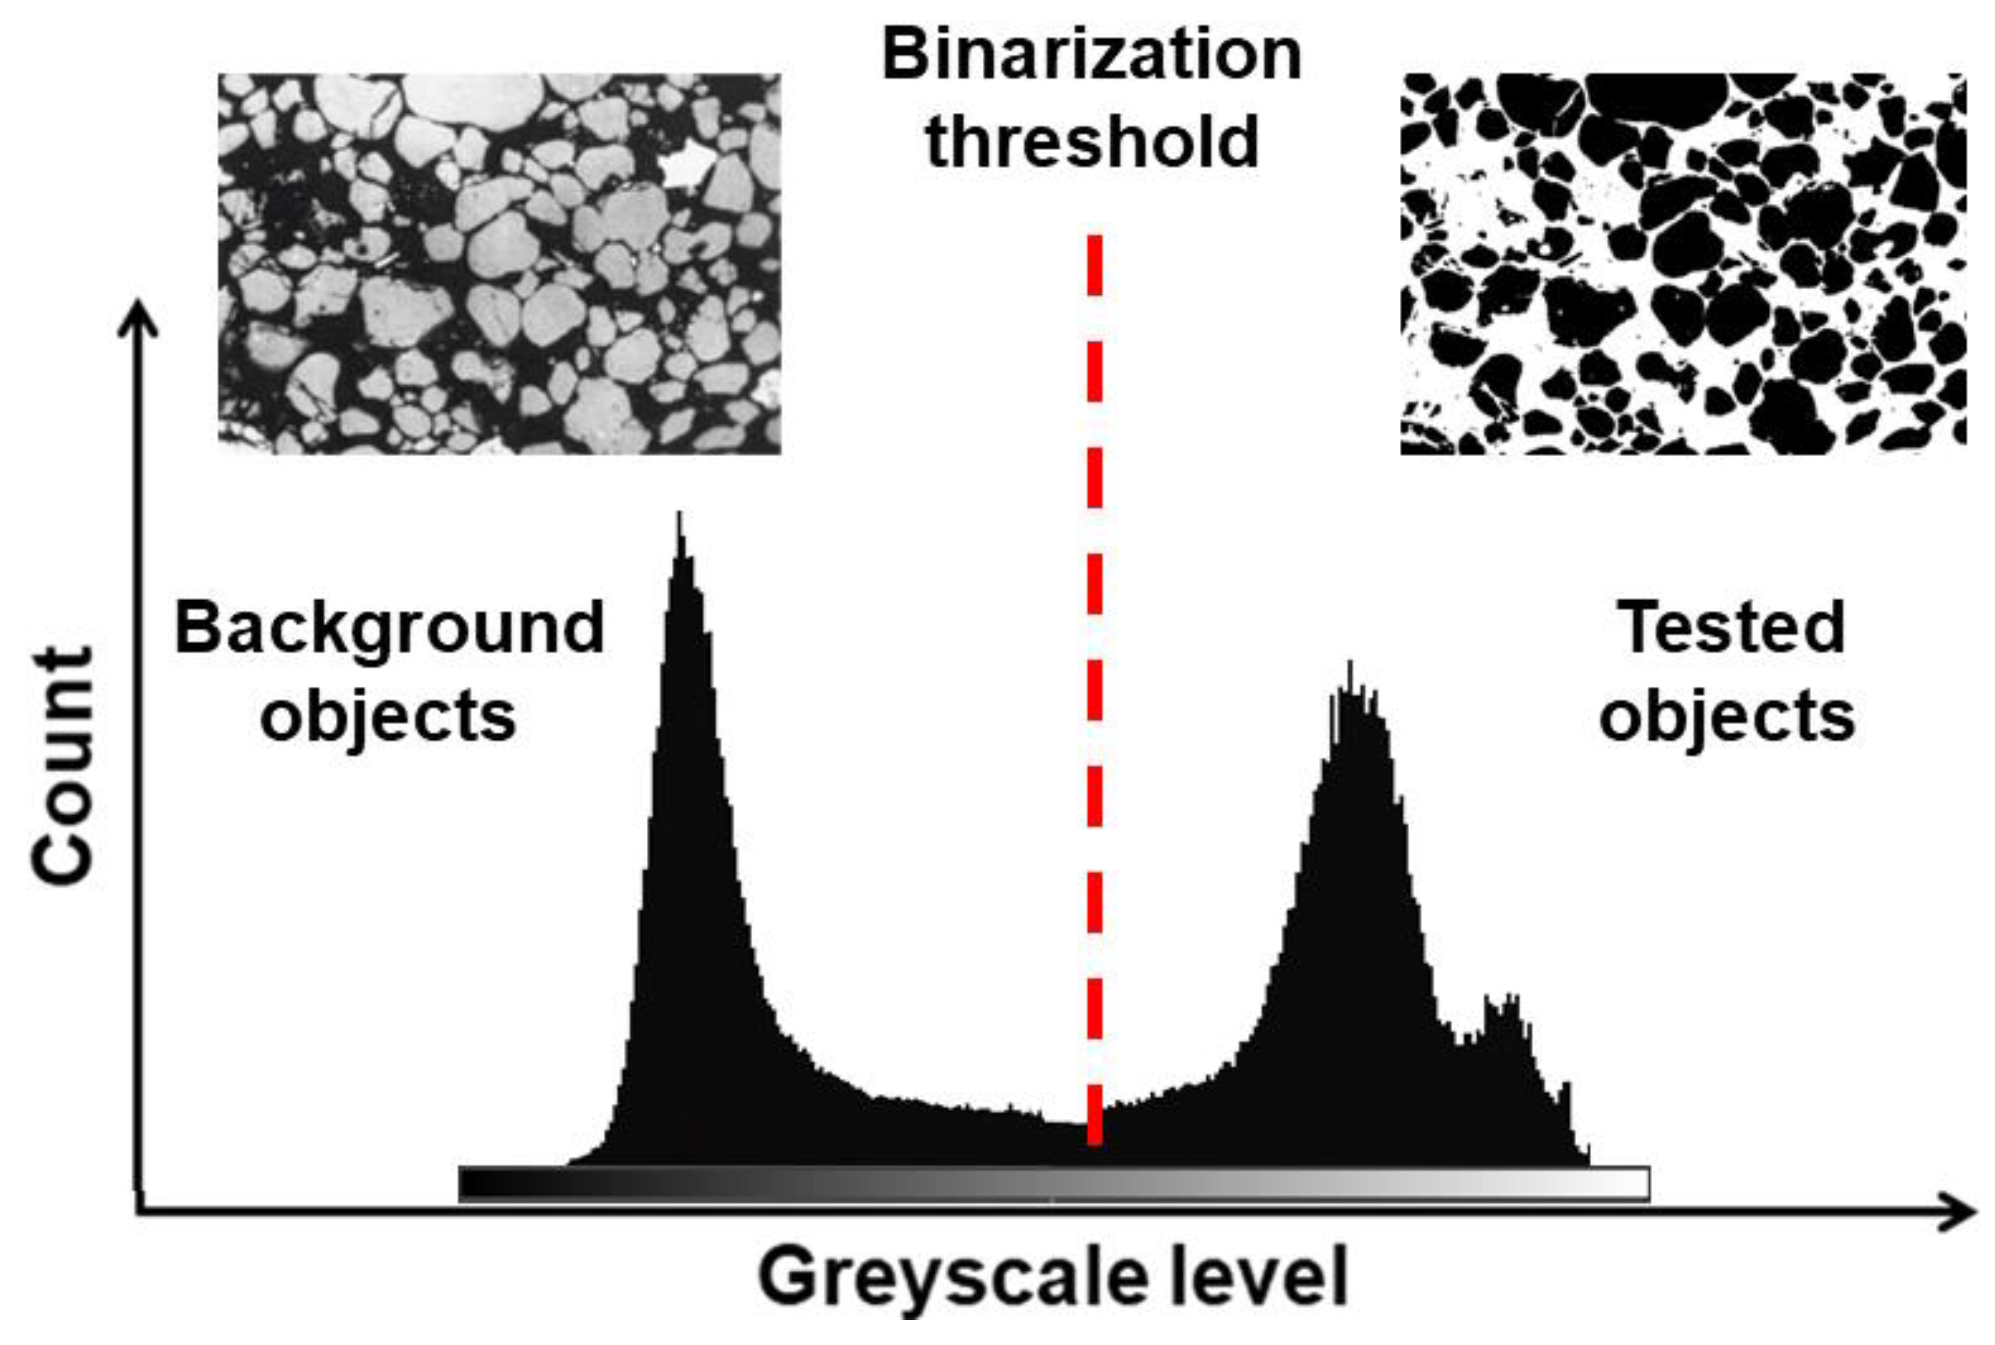
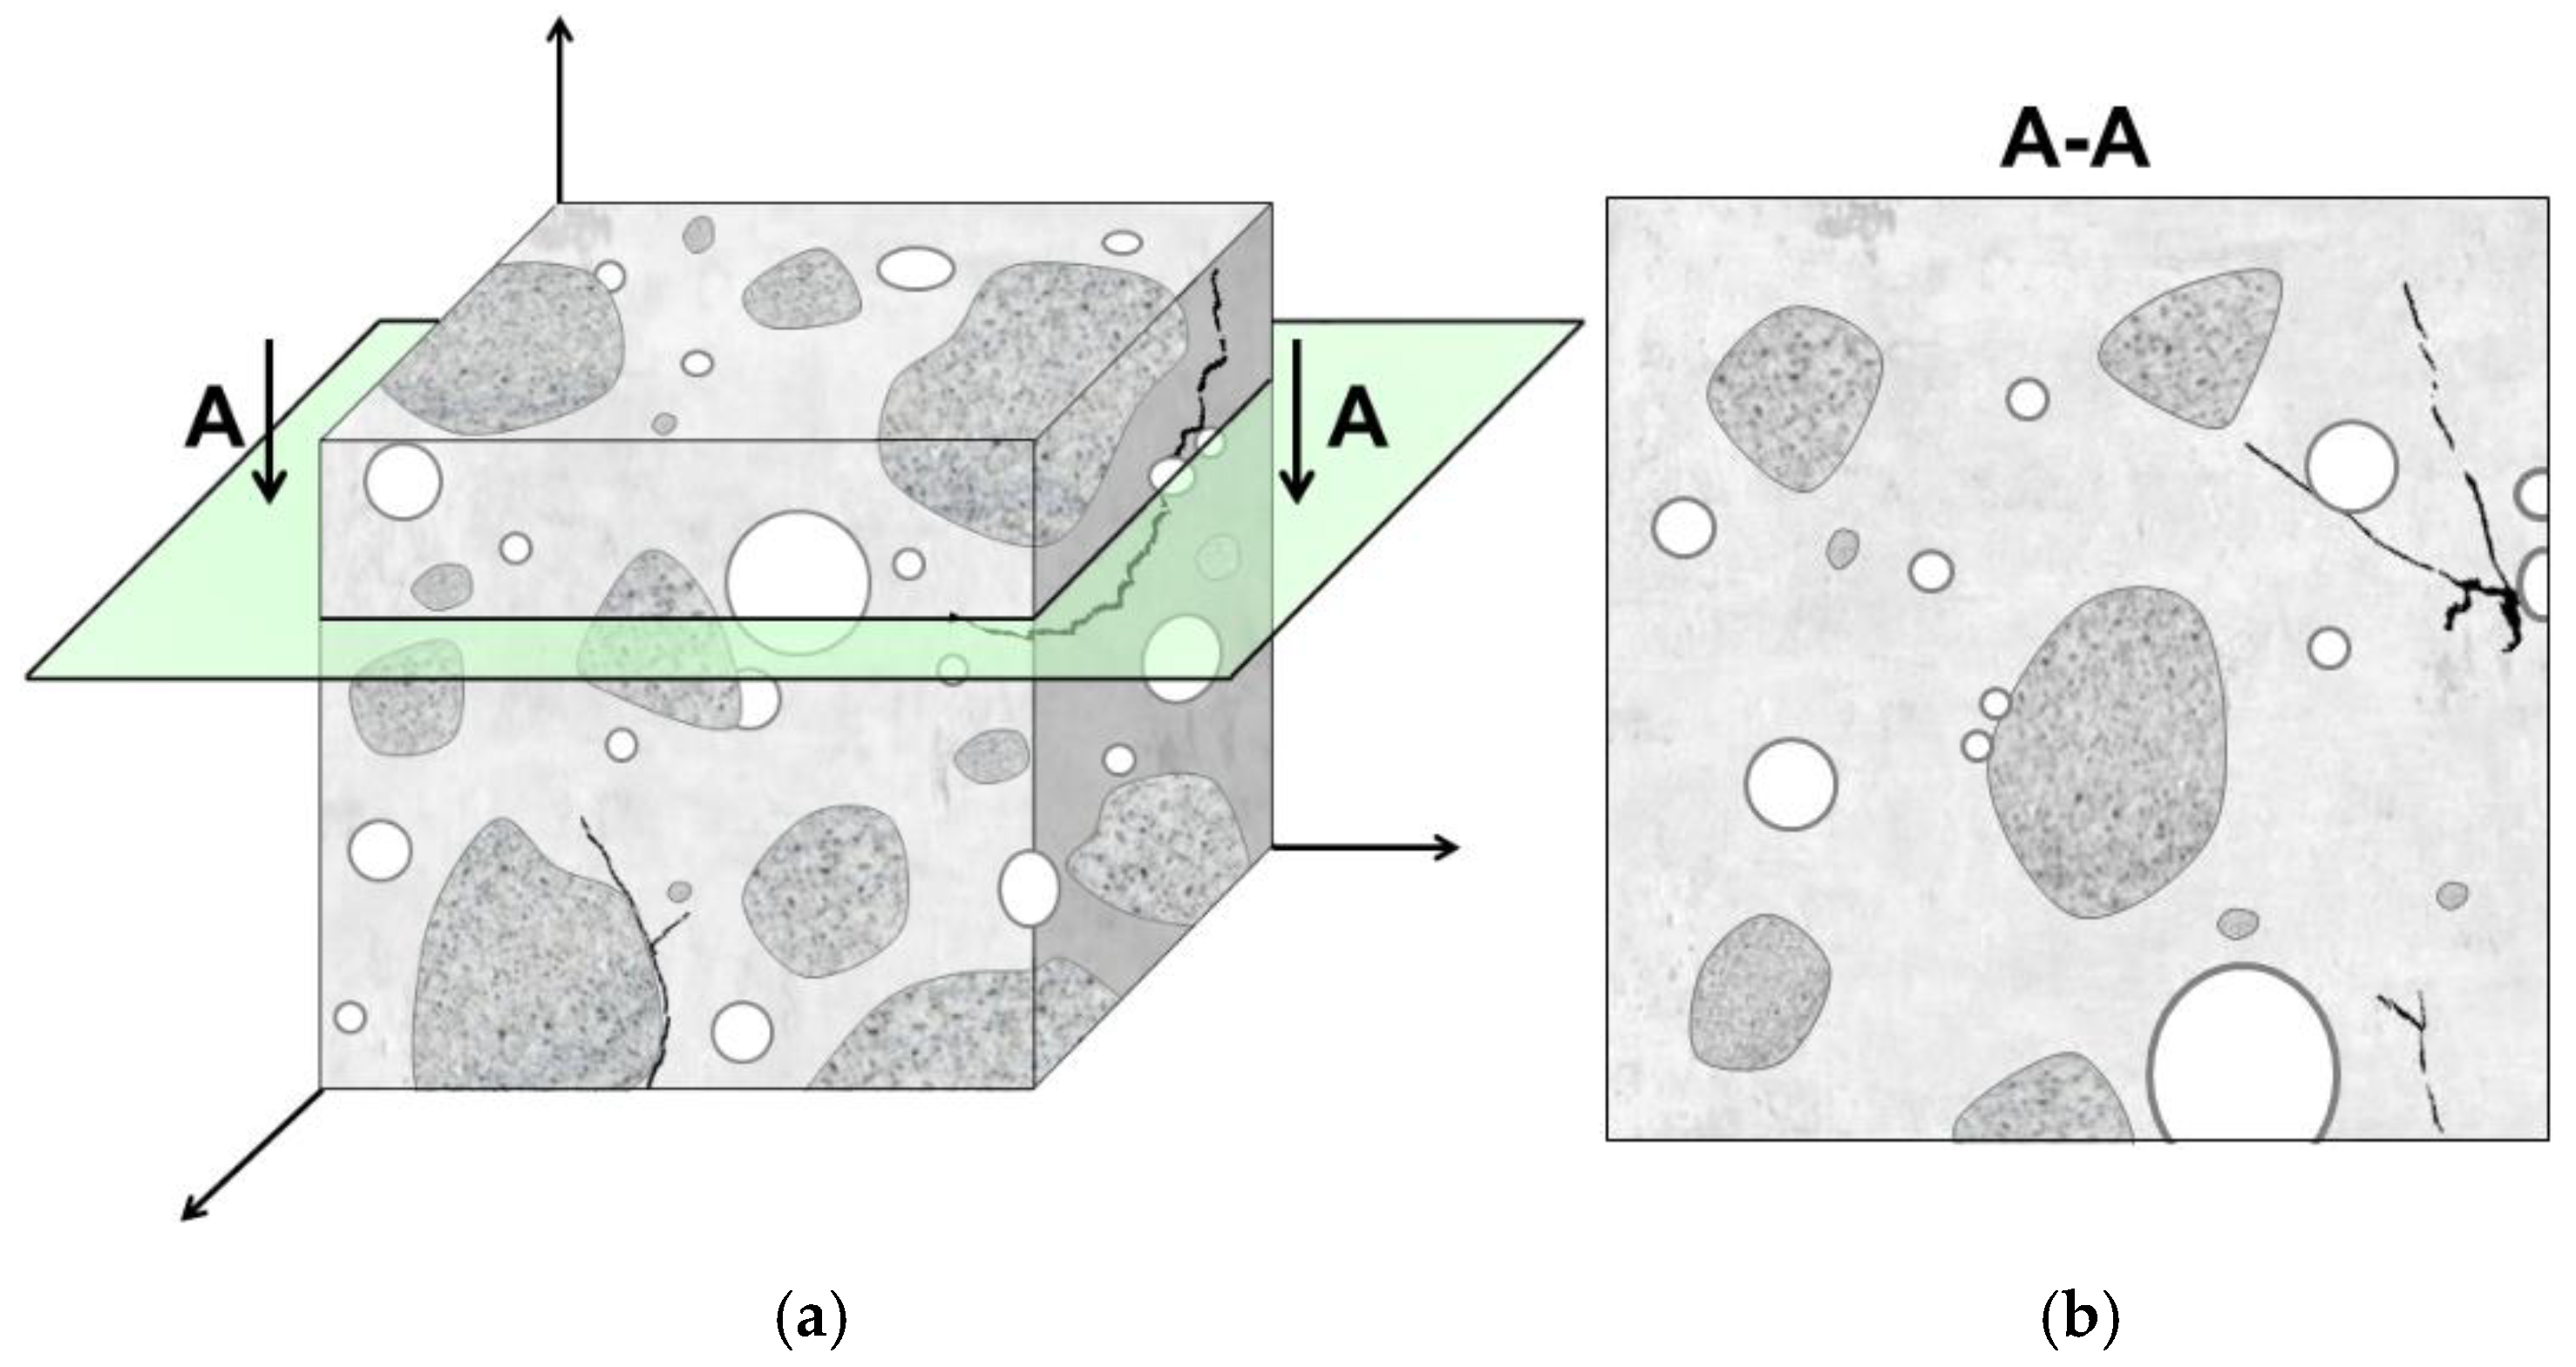
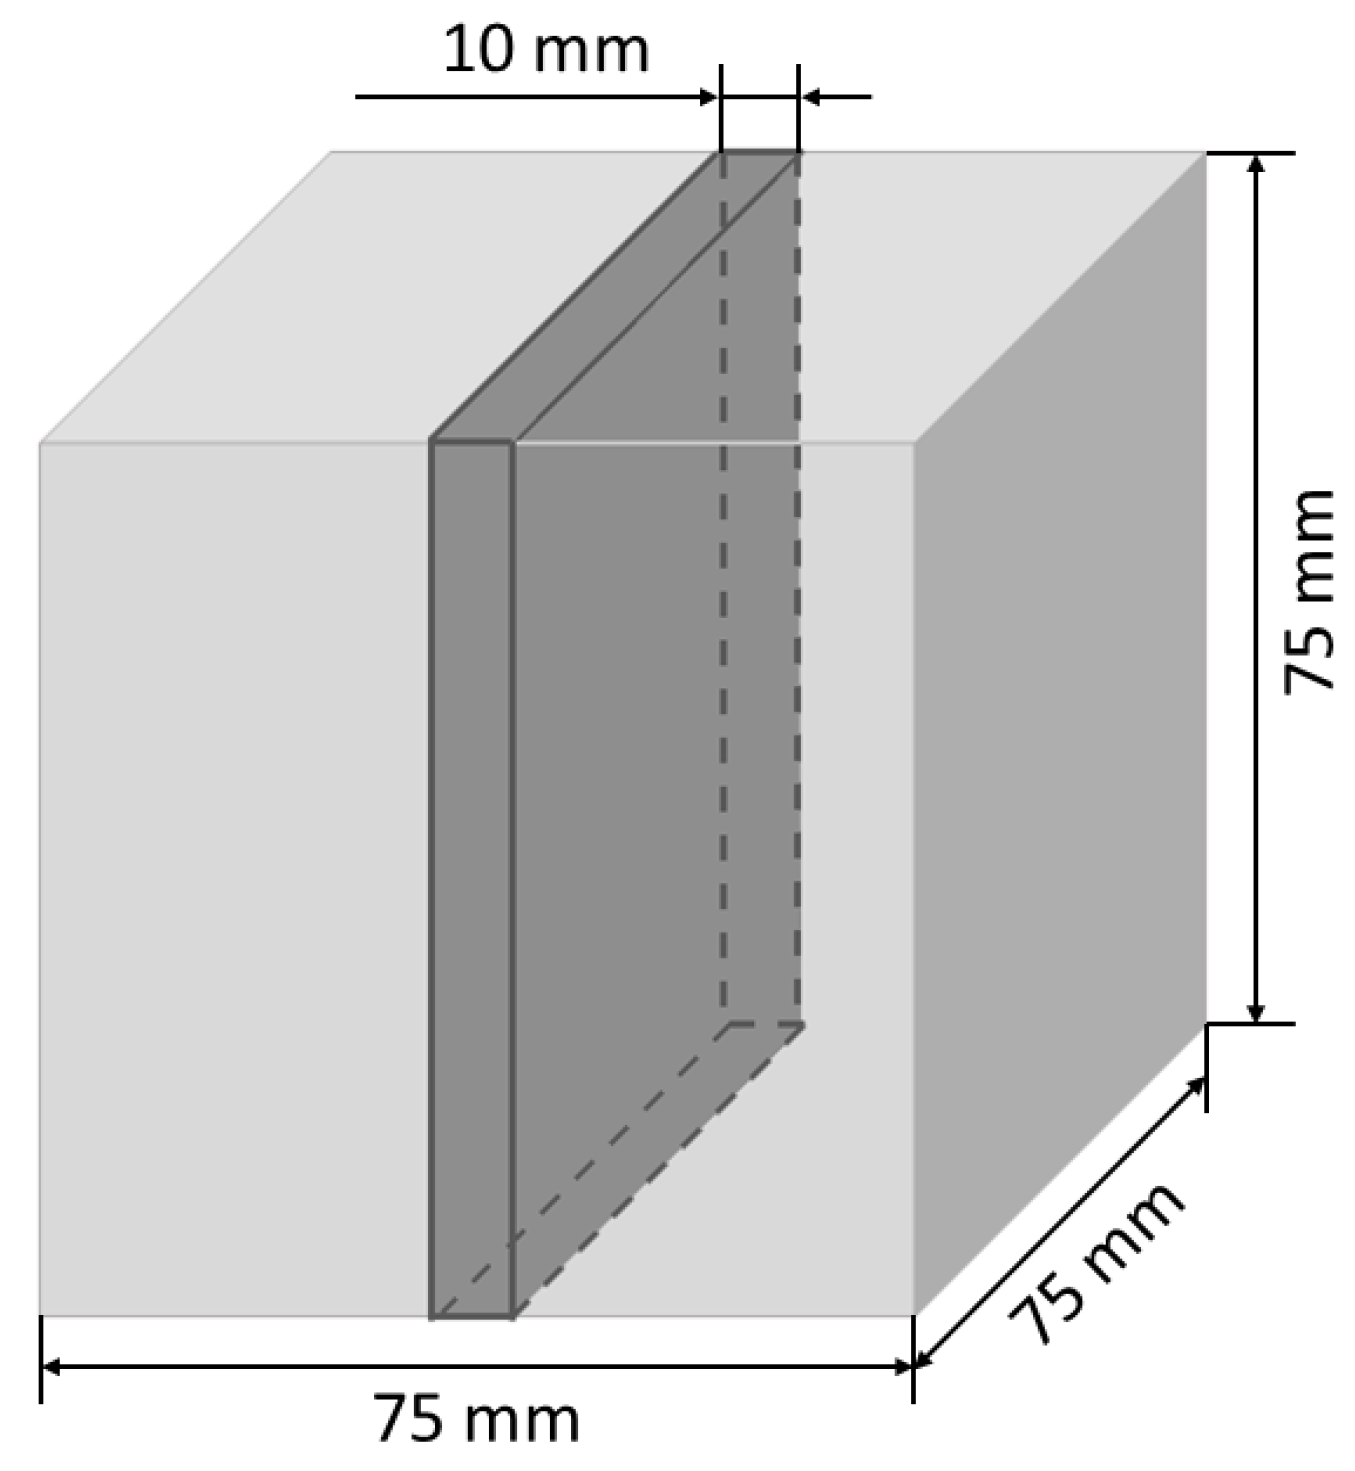
2.2.6. Pore Structure Analysis (Indirect Method)

The quantitative analysis of pore structure was carried out using image analysis method. It is a stereological method used for quantitative characterization of three-dimensional objects in a material volume based on measurements performed on the two-dimensional images of the microstructure. The analysis is performed on the surface of specially prepared cross-sections of samples, known as microsections. Obtaining accurate and representative results requires precise sampling and proper preparation of the surfaces to remove deformed and damaged layers of material (e.g., those caused during sample cutting). This is achieved through grinding and polishing, which ensure that the microstructure images truly reflect the material. Sample preparation often begins with embedding the specimens in a colored polymer resin. This step protects fragile materials or coatings, standardizes sample sizes to fit into holders for grinding and polishing machines, and before all, allows for distinguishing pores from other microstructural components.
Microstructure images are commonly captured using light microscopes [50,55,59,62] or digital cameras [54,60,64,65]. However, flatbed scanners could also be employed [35,36,37]. These techniques are effective for evaluating microstructures at the macro- or microscale. For finer scale analysis, more advanced tools such as a scanning electron microscope (SEM) [48,56] or X-ray micro-computed tomography [41] are required. The quality of the images, particularly their resolution, determines the smallest pore diameter that can be detected using image analysis.
The captured images undergo qualitative analysis through digital image processing to differentiate components of the microstructure and isolate those relevant to the analysis. Digital image processing includes any changes to the image’s RGB values—such as adjusting brightness, contrast, or binarization—as well as structural modifications in binary images, like morphological transformations (e.g., dilation or erosion). In addition, the process of isolating specific areas of the microstructure is called segmentation. It is based on the chosen uniformity criterion, such as color, brightness level, or texture. The simplest form of image segmentation is binarization, which separates all image pixels into black (representing the selected microstructural components) and white (representing the insignificant background), based on a specified brightness threshold (Figure 3). Following segmentation, the images undergo quantitative analysis, primarily using computer software, which ensures faster, more accurate, and more consistent results than manual methods.
Capturing a microstructure image reduces the number of dimensions of its constituents (Figure 4). For instance, three-dimensional objects, such as aggregate grains or pores with a volume V, are represented as planar shapes with area A; the interfacial transition zones between aggregate grains and the hardened cement matrix are depicted as curvilinear lines with a length L, while cracks may be linked to points P. As a result, parameters describing the three-dimensional microstructure of a material (Table 4, parameters with index V) are derived from the characteristics measured on the individual cross-sections (Table 4, parameters with index A). One of the fundamental and simplest stereological principles is the Cavalieri–Hacquert relation [96]. It states that the volume fraction of the selected phase within a unit volume of material (VV) is equal to surface area fraction in the microstructure image (AA), and also equal to the fraction of grid points hitting that phase in the image (PP). This relation is expressed as follows (Equation (3)):
VV = AA = PP
Another example is the relation estimated using the Saltykov method [97]. In this approach a microstructure image is intersected with multiple vertical test lines with a total length L. The number of intersections n between these lines and the selected objects in the image is counted. Based on this, the intersection density can be calculated using the following equation (Equation (4)):
S V = 2 n L
The image analysis method could also be used to indirectly estimate the freeze–thaw resistance by determining parameters of pore structure according to EN 480-11 [69]. Its main advantage is the significantly shorter testing time compared to direct methods. The procedure involves preparing precisely ground and polished samples, and conducting pore structure observations along a series of parallel measurement lines. During this process, the number of pores intersected by the lines and the chord length of each pore are recorded. The mathematical analysis allows for describing the pore system with parameters such as total pore content (A), content of the micropores below 0.3 mm (A300), specific surface area (α), and spacing factor ( L ¯ ).
The total air content (A) represents the percentage of the total volume of pores within the concrete volume, and it corresponds to the VV. It is determined as the ratio of the total length of chords passing through pores (Ta) to the total length of the measurement lines (Ttot), expressed as a percentage (Equation (5)):
A = T a × 100 T t o t    [ % ]
Pore content with the diameter of up to 0.3 mm (A300) refers to the percentage of pores with the maximal diameter of 0.3 mm in the total volume of a material. It is determined during the calculation of the air pore size distribution.
The specific surface area of pores (α) is a parameter defined as the ratio of the total surface area of the pores to their volume. It is calculated using the following equation (Equation (6)):
α = 4 × N T a    [ m m 1 ]
where N is the total number of chords passing through the pores, and Ta is the total length of the chords passing through the pores.
Pore spacing ratio L ¯ represents the maximum distance separating any point in the cement matrix and the edge of the nearest pore. It is calculated using one of the two equations, depending on the ratio R, which is defined as the ratio of the cement paste volume (computed on the base of the mix recipe) to the total air content. If R > 4.342, Equation (7) is used, whereas for R ≤ 4.342, Equation (8) must be applied [69]. The aforementioned equations are as follows:
L ¯ = 3 × 1.4 × 1 + R 1 / 3 1 α    [ m m ]
L ¯ = P × T t o t 400 × N    [ m m ]
where R—the ratio of the cement matrix volume to the total air content, α—the specific surface area of the pores, P—the volume fraction of the cement paste, Ttot—the total length of measurement lines, and N—the total number of chords passing through the pores.
In this study, the pore structure was analyzed using the method and parameters defined in the EN 480-11 European standard. However, the procedure for determining these parameters was modified. Unlike the transverse method recommended in the standard, the study utilized the image analysis method supported by a proprietary computer software operating in the MATLAB environment (ver. R2024b). For each concrete mix, three samples with dimensions of 75 mm × 75 mm × 75 mm were prepared and cured in water at the temperature of 20 ± 2 °C for 28 days. The preparation procedure involved the following steps: (1) cutting one slice approximately 75 mm × 75 mm × 10 mm in size from each of the three samples for every concrete composition (resulting in a total of three slices per mix composition, as shown in Figure 5); (2) cold mounting the cut slices under reduced pressure using a blue-colored epoxy resin; (3) grinding; (4) final polishing.
After preparing the sample cross-sections, 2D images of the microstructure were captured using a flatbed scanner at a resolution of 4800 DPI, where 1 pixel corresponds to 5.3 μm. The resolution of the recorded images was selected to be as high as possible in order to enable the most accurate observation of the smallest pores, without significantly increasing the time required for image processing and analysis. The images were processed using specialized software to obtain precise binary images, isolating the black pores of interest against a white background representing other irrelevant components of microstructure in GIMP—GNU Image Manipulation Program ver. 2.10. The digital image processing involved adjustments of contrast, brightness, gamma, and color saturation (Figure 6b), followed by pore selection and binarization (Figure 6c). As a result of the computer analysis, parameters describing the pore structure were obtained, including those required for assessing freeze–thaw resistance according to EN 480-11; these parameters included the total air content (A), content of micropores up to 0.3 mm (A300), specific surface area of pores (α), and pore spacing ratio ( L ¯ ). To better understand how the pore structure affects concrete properties, the analysis also included the share of pores with a diameter between 0.3 mm and 1 mm (A1000) pores equal to or greater than 1.0 mm (AMAX), and the share of pores excluding coarse aggregate, which represents the share of pores in the cement mortar (AC)—see Table 5.

2.2.7. Statistical Analysis

In this study the obtained results were subjected to statistical analysis to determine the effect of the air-entraining admixture on the concrete properties and microstructure parameters, as well as to establish relations between them. The relation between variables can be described using correlation and regression [98], both of which were applied in this study. Correlation measures the strength of the relation between two variables, while regression aims to describe this relation using a mathematical model that allows prediction of one variable based on the value of the other. In practice, a common way to check for correlation between two features is to create a scatter plot, where the independent (explanatory) variable is placed on the x-axis and the dependent (response) variable is placed on the y-axis. The pattern of points on the plot gives an initial idea of the strength and direction of the relationship and can help in choosing a suitable mathematical function to describe it (e.g., linear, polynomial, or exponential).
There are several numerical indicators that express the strength of the relation between two variables. The most commonly used are the Pearson correlation coefficient (r) and the coefficient of determination (r2). The Pearson coefficient is a standardized measure of the strength and direction of a linear relationship, ranging from −1 to 1. A positive or negative sign indicates the direction of the correlation, and the closer the absolute value of r is to 1, the stronger is the correlation. The coefficient of determination (r2) is calculated by squaring the correlation coefficient. It shows what percentage of the variation in the dependent variable can be explained by changes in the independent variable.
Regression analysis is a statistical tool used to examine the relation between quantitative variables and to predict unknown values of a dependent variable based on known values of one or more independent variables (predictors). The regression model equation is usually determined using the least squares method, which fits a line in such a way that the sum of the squared differences between the observed (empirical) and predicted (theoretical) values is minimized. The simplest case is simple linear regression, where the goal is to determine how changes in the dependent variable Y can be explained by changes in a single independent variable x (Equation (9)):
Y = β0 + β1x
where β0—constant term, β1—slope coefficient of regression line.
When the effect of two or more independent variables on variable Y is considered, the regression is called multiple regression, and the equation of the line takes the following form (Equation (10)):
Y = β0 + β1x1 + β2x2 + … + βnxn
The constant term (β0) is the point where the regression line crosses the y-axis. The coefficients β1, β2, … βn are the structural parameters of the model, representing the independent contribution of each predictor (independent variable) to the prediction of the dependent variable. The sign of each coefficient indicates whether the effect of the corresponding independent variable on the dependent variable is positive or negative.
The quality of the regression model is most often evaluated using the multiple correlation coefficient (R) and the coefficient of determination (R2). The R value shows the overall strength of the relation between the dependent variable Y and all the independent variables included in the model (x1, x2, ..., xn). When squared, R2 becomes a measure that can be interpreted as the percentage of the variation in the dependent variable explained by the model. It is also useful for comparing the quality of different models. However, since R2 increases with the number of predictors, models with different numbers of independent variables are compared using the adjusted R2, which accounts for model complexity. These regression coefficients can range from 0 to 1, where values closer to 1 indicate a better fit. Another commonly used measure of how well the model fits the data is the standard estimation error (SEE), which is the standard deviation of the residuals. It is expressed in the same units as the dependent variable and shows the average difference between the observed values of Y and the values predicted by the model.
The statistical analysis of the results presented in this study was conducted using the Statistica data analysis software. Relationships between variables were illustrated using scatter plots with linear trend lines fitted by the least squares method. The strength of these relationships was assessed using Pearson’s correlation coefficient (r). Simple linear regression models were also presented.
In the regression analysis, models were developed to best explain the variability of the dependent variables—compressive strength, ultrasonic pulse velocity, and freeze–thaw resistance—based on quantitative parameters describing the pore structure of the tested concretes. The strength of the relations between the dependent variables and the selected set of independent variables (included in the regression models), the significance of the effect of the selected independent variables (pore structure parameters) on the predictive value of the models, and the level of differences between actual observations and values predicted by the models were assessed using the multiple correlation coefficients (R), test probabilities (p), and standard estimation error (SEE), respectively. The usefulness of individual microstructural parameters in explaining the dependent variables was assessed based on the probability values (p), while the direction and magnitude of the changes they caused were determined using the β regression coefficients.

2.2.8. Summary of Experimental Plan

The experimental program is outlined in Figure 7, while Table 6 provides a summary of the tests performed and the number of samples used for each concrete composition.

3. Results and Discussion

3.1. The Influence of the Air-Entraining Admixture on the Properties and Microstructure

3.1.1. Fresh Mix Properties

The results of concrete mix tests including the consistency by the slump test (ST) and the air content (AC) by the pressure method are presented in Table 7.
The increase in the amount of air-entraining admixture led to a greater air content. A significant increase in the air content was observed at the admixture level of at least 0.2% (more than 2 times compared with N0). At the highest tested dose (1.5%), the AC was over 3.5 times higher than N0, showing that the admixture became less effective at higher doses. Importantly, just 0.2% was sufficient to meet the air content requirement specified in the EN 206 standard (minimum air content of 4%), necessary to ensure adequate durability of concrete in freezing–thawing conditions (exposure classes XF2–XF4). The effectiveness of the admixture decreased after exceeding the amount recommended by the manufacturer (i.e., 0.2%). This means that adding more admixture does not cause a proportional increase in entrained air.
The admixture had a strong influence on consistency, increasing the fluidity of the concrete mix due to the ball-bearing effect of the fine entrained air bubbles, which reduce friction between aggregate particles [99]. As a result, the mix became easier to handle in terms of mixing, transporting, and placing. This enhancement in workability could be particularly beneficial in low-slump concrete mixes, where achieving the desired consistency can be challenging. Even a 0.04% addition increases the mix slump by 50% (from 60 mm to 90 mm). At 0.2% admixture, the slump was three times that of the N0 mix, resulting in a change in consistency class from S2 to S4. Further increases in the admixture content did not significantly affect the mix’s consistency, as the slump difference between N2 and N3 was only 30 mm, despite the substantial increase in the admixture dosage.
The increase in concrete mix workability, expressed as an increase in fluidity, was also reported in the literature [100,101,102].

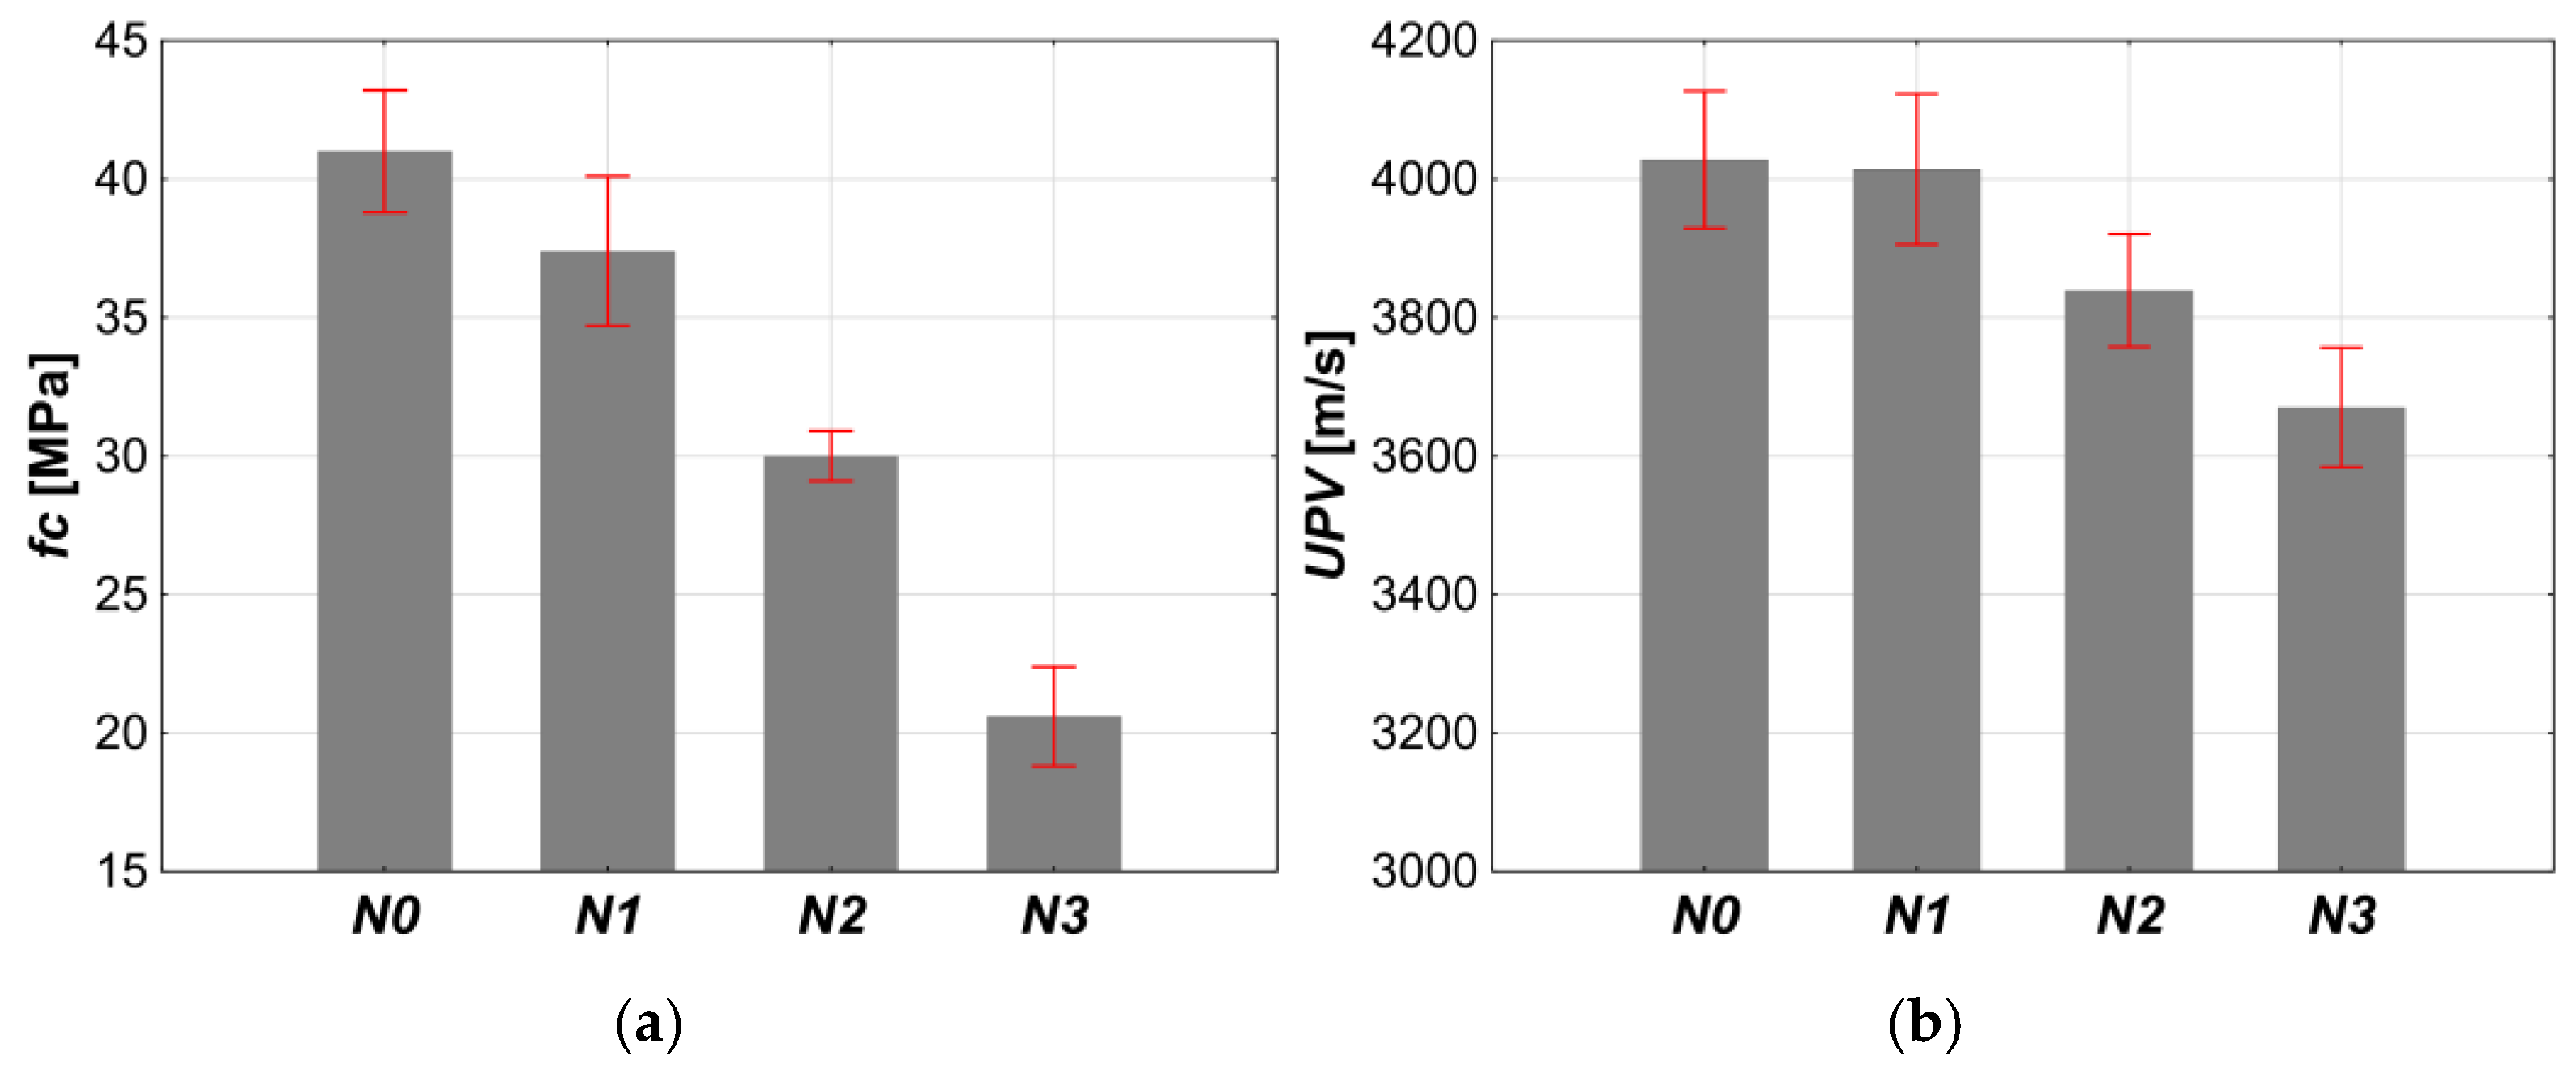
3.1.2. Compressive Strength and Ultrasonic Pulse Velocity of Concrete

The results of compressive strength (fc) and ultrasonic pulse velocity (UPV) test after 28 days of curing are shown in Table 8 and in Figure 8 and Figure 9. The air-entraining admixture at a content of 0.04% (N1) caused a slight reduction in compressive strength. However, due to overlapping standard deviations, the strength of N0 and N1 can be considered similar, so they can be treated as part of the same data set. When the admixture content increased to 0.2% (N2), the compressive strength dropped significantly—by about 27% compared to N0. A further increase in the admixture dosage to 1.5% (N3) resulted in another decrease in the fc, with a total reduction of around 50%, compared to N0.
Changes in UPV with increasing admixture content were consistent with the changes in fc. After adding 0.04% of the admixture, the ultrasonic pulse velocity changed slightly. At 0.2% the UPV was reduced by about 3.0% compared to N0. While 1.5% caused a further decrease in the UPV by only about 5%, in total, the UPV decreased by approximately 8% compared to N0. Both the changes in the fc and the UPV indicated that the air introduced into the concrete mix remained in the hardened concrete as air voids. These voids were responsible for the reduction in compressive strength and the pulse velocity as the admixture dosage increased.
In general, higher porosity has a negative impact on the compressive strength, as air voids reduce the effective load-bearing area. The relation between fc-porosity in cement composites is well-documented in the literature [1,79,103,104,105].
Higher porosity is also associated with lower ultrasonic pulse velocity, making it a sensitive indicator of the density and internal structure of cement composites. As the porosity increases, more internal discontinuities appear, which disrupt the uniform transmission of ultrasonic pulses. These voids scatter and cause multiple reflections of the wavefront, increasing travel time and reducing the UPV. Some of the wave energy is also absorbed by the porous structure, which lowers the signal’s amplitude and clarity. This fact is also well supported in the literature [79,106,107,108].
Correlation analysis confirmed that compressive strength and pulse velocity are statistically significantly related, as the correlation coefficient was very high (r = 0.99). Both properties are positively correlated, meaning that an increase in one of them is accompanied by an increase in the other.

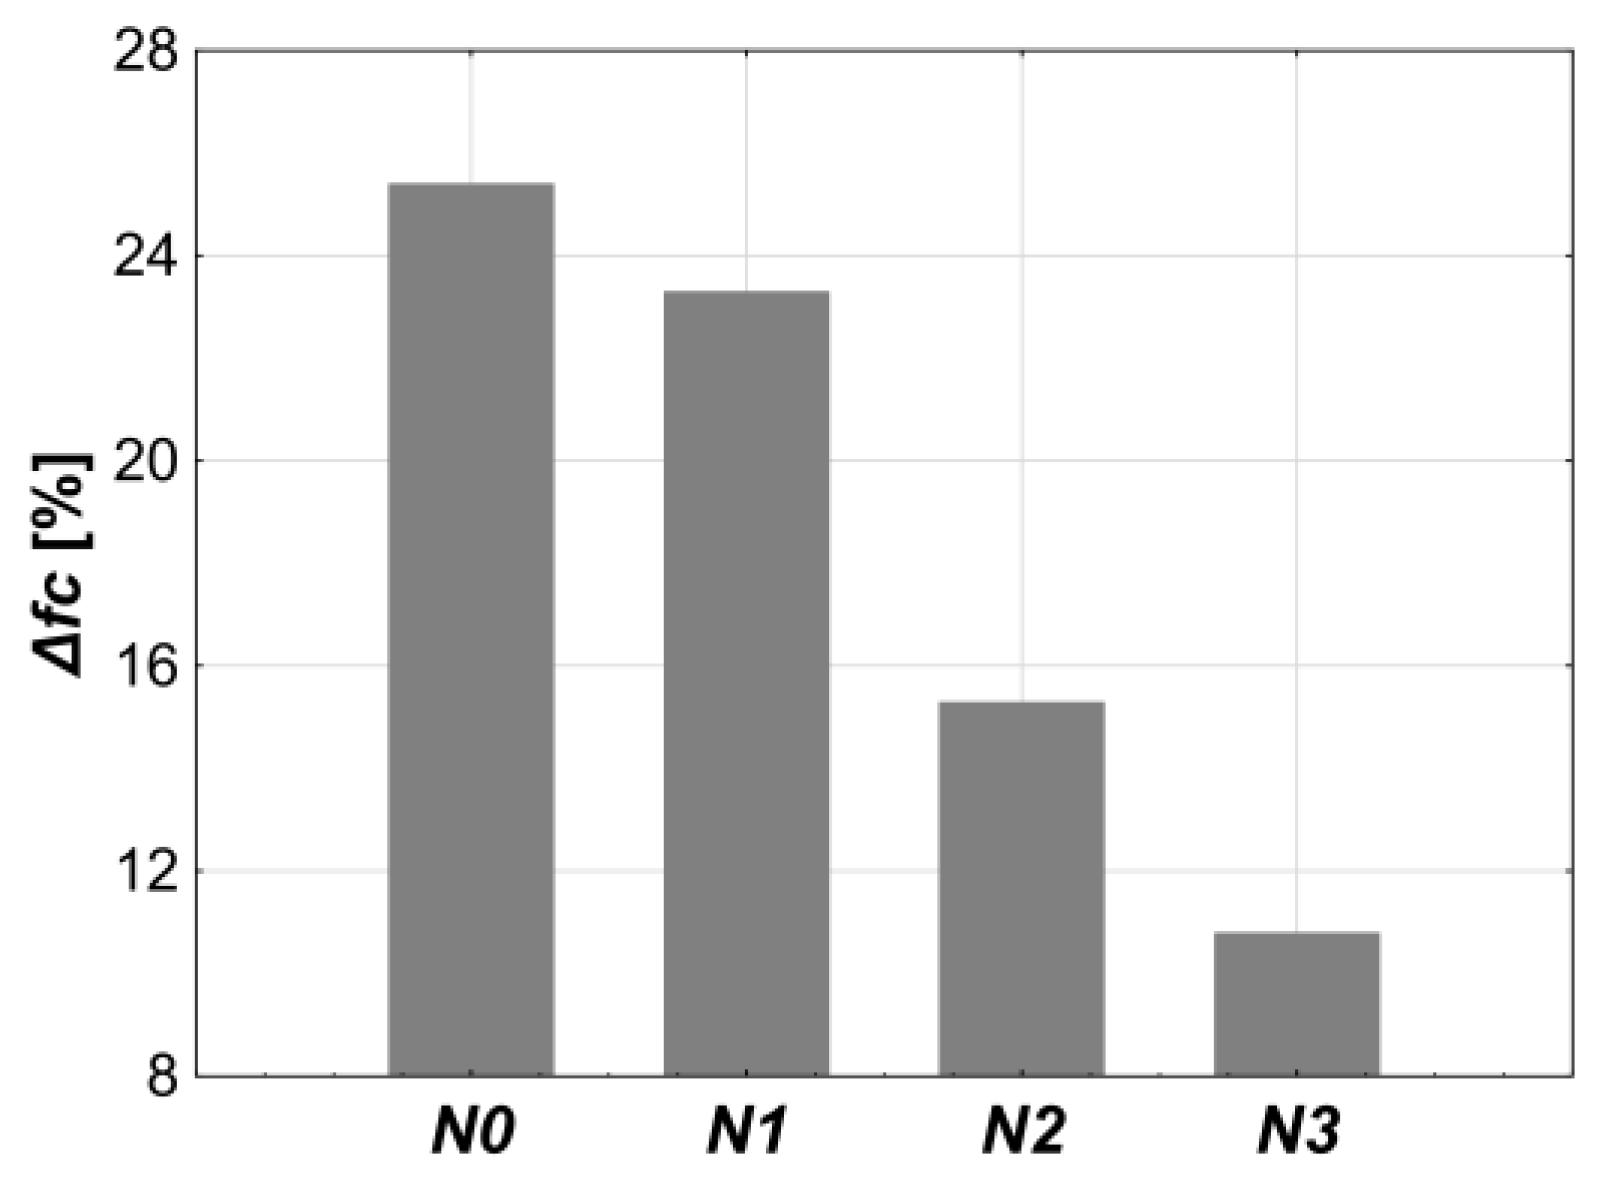
3.1.3. Freeze–Thaw Resistance of Concrete

The freeze–thaw resistance was evaluated based on the average mass loss (Δm), the average compressive strength reduction (Δfc), and the level of surface damage. The obtained results are presented in Table 9 and Figure 10 and Figure 11. The maximum average mass loss after the cycles for all concrete compositions was about 0.3%. This is well below the 5.0% limit specified by the PN-B06265 standard, which is one of the three conditions required to achieve freeze–thaw resistance.
The increase in the air-entraining admixture dosage caused changes in the average reduction in compressive strength after the cycles, indicating the improvement in the freeze–thaw resistance of the tested concrete. At a dosage of 0.04% (N1), the strength loss (Δfc = 23.5%) was only slightly lower than in the reference concrete N0fc = 25.4%). However, with 0.2% of admixture (N2) the noticeable decrease in Δfc occurred, bringing it below the 20% threshold necessary to confirm the freeze–thaw resistance. A further increase in the admixture dosage to 1.5% (N3) caused an additional decrease in Δfc, reaching 10.8%.
The level of surface damage to the samples caused by cyclic freezing and thawing also shows a decreasing trend with the increasing amount of the air-entraining admixture. The highest number of damaged samples and the most severe damage were observed in the case of the reference concrete (N0, 4/6 damaged samples with the presence of cracks and spalling). With the admixture dosage of 0.04%, damage reduced to 3 out of 6 samples. At 0.2%, only 1 sample was slightly cracked. A further increase in the admixture content to 1.5% (N3) completely eliminated surface damage in the samples. The results of the visual assessment of the samples confirm the positive effect of the air-entraining admixture on freeze–thaw resistance, even at the lowest applied dosage.
Analyzing the results in light of the requirements of the PN-B06265 standard, it was found that only the N3 concrete composition directly meets all the criteria, i.e., the average mass loss below 5%, the average compressive strength loss below 20%, and the absence of visible damage. However, N2 may be more consistent with the definition of freeze–thaw resistance. It had only minor surface damage (the single crack on one of six samples) and still met the 20% strength loss limit after the cycles. N2 better fits the definition of defined performance concrete, being not only durable but also structurally reliable. This is because, unlike N3, which lost nearly 50% of its compressive strength after the admixture was added, N2 showed the smaller reduction of about 27%.
The positive influence of air-entraining admixture on freeze–thaw resistance has also been reported in the literature [109,110,111,112], including studies in which freeze–thaw resistance was evaluated according to PN-B-06265 [83].

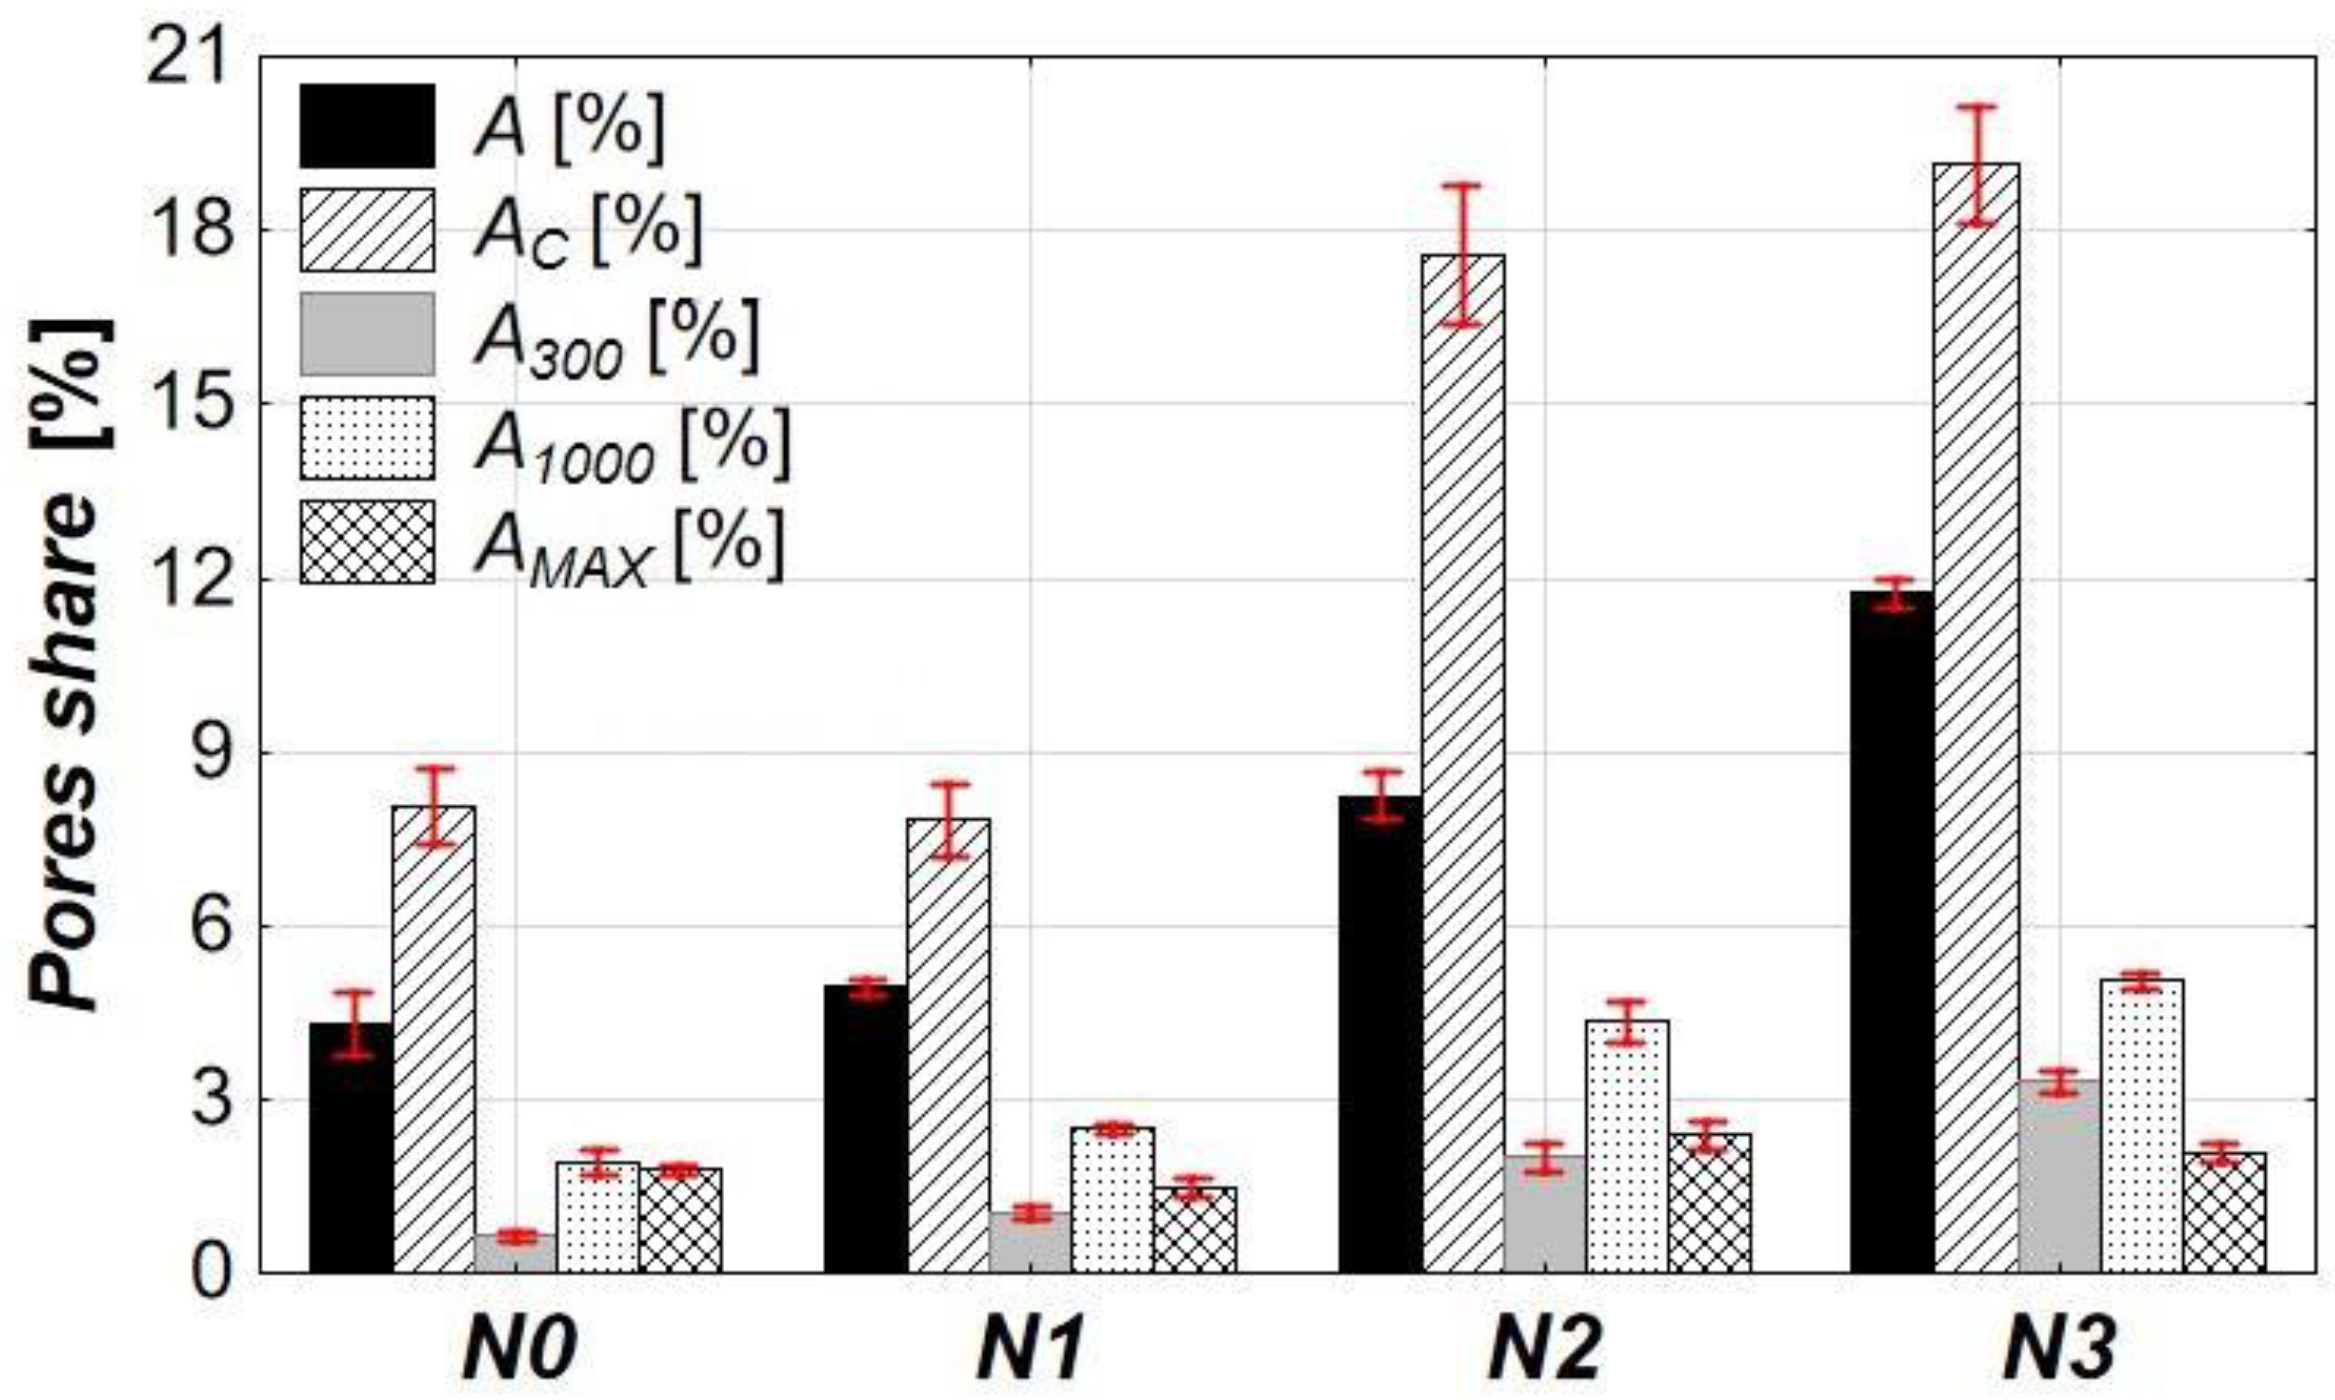
3.1.4. Pore Structure of Concrete

The microstructure of concrete was analyzed using the stereological method of image analysis supported by computer software. The analysis included the calculation of the total air content (A), the content of pores with a maximum diameter of 0.3 mm (A300), the specific surface area of pores (α), and the pore arrangement ratio ( L ¯ ) which were used to assess freeze–thaw resistance according to the EN 480-11 standard. Additionally, the content of pores with the diameters ranging from 0.3 mm to 1.0 mm (A1000), those larger than 1.0 mm (AMAX), and the total porosity excluding the coarse aggregate influence (i.e., total porosity of the mortar—AC) were also determined. The results of this analysis are presented in Table 10 and Figure 12, Figure 13 and Figure 14.
The values of all computed parameters changed with an increasing dosage of the air-entraining admixture in the concrete mix. The most noticeable changes occurred at the dosage of 0.2% (N2). In contrast, the changes in the microstructure parameters resulting from dosing the admixture at a level five times lower (0.04%, N1) or over seven times higher (1.5%, N3) were considerably less intense. Overall, increasing the admixture content resulted in an increase in A in the hardened concrete, along with increases in the other related parameters (AC, A300, A1000, AMAX). A small increase in A was observed at the dosage of 0.04% (N1), while a significant increase occurred after adding 0.2% (N2) of the admixture. The 1.5% dosage (N3) caused the further increase in A, but it was less pronounced—in total, A was nearly 2.5 times higher than in the reference mix (N0).
The AC parameter was calculated excluding the presence of aggregate, meaning the analysis assumed no coarse aggregate was present in the concrete (no aggregate with grain sizes above 4 mm). Because of this, the AC values are much higher than A. However, the trend in changes remains similar. The significant increase in AC was observed only at the dosage of 0.2% (N2), where the AC nearly doubled compared to the N0, and at the 1.5% (N3), where it increased by almost 2.5 times.
The increase in the share of pores smaller than 0.3 mm is evident, as these are precisely the pores that should be introduced by the air-entraining admixture. The addition of 0.04%, 0.2%, and 1.5% of the admixture resulted in an increase in A300 by more than 1.5, 4, and 6 times, respectively, compared to the reference sample (N0). The increase in A1000 changed less significantly than A300. It was less pronounced—approximately 1.7 times higher at 0.04%, nearly 3 times at 0.2%, and around 3.5 times at 1.5%. This may be due to the merging of smaller pores into larger ones. In contrast, a small increase in the share of the macropores with a diameter greater than 1.0 mm after adding 0.2% (N2) and 1.5% (N3) of the admixture was rather random and most likely resulted from non-uniform compaction of the samples.
The specific surface area of pores (α), calculated across the entire range of air void sizes, is closely linked to the air content in hardened concrete. As new air voids are introduced, their combined surface area increases. The addition of the air-entraining admixture led to increases in α by approximately 18%, 28%, and 80% for admixture dosages of 0.04% (N1), 0.2% (N2), and 1.5% (N3), respectively. Correlation analysis confirmed a strong relation between the α and the total air content (A), with a correlation coefficient of 0.97 (Figure 13). Among the other pore-related parameters (AC, A300, A1000, and AMAX), the strongest correlation was found between the specific surface area and the share of pores with a diameter below 0.3 mm, also with a correlation coefficient of 0.97. This is due to the higher surface-to-volume ratio of smaller pores, and as a consequence, an increase in their volume share leads to a more significant increase in the total specific surface area. his is further supported by the slope coefficients of the linear regression equations, where the highest value corresponds to the α–A300 relation (Figure 13). On the other hand, the weakest correlation was observed between α and AMAX (r = 0.46), which seems reasonable, as pores larger than 1 mm are typically random and result from insufficient compaction rather than admixture content.
Another parameter that changes with the increasing admixture content is the spacing factor L ¯ . This factor reflects the maximum distance between any point in the cement paste and the nearest air void. As the number of pores increases, the distances between neighboring pores decrease, resulting in a lower L ¯ . The addition of the air-entraining admixture reduced L ¯ by approximately 22% (N1), 56% (N2), and 71% (N3) compared to the reference concrete N0, corresponding to the admixture dosage of 0.04%, 0.2%, and 1.5%, respectively. A strong correlation was observed between L ¯ and A (r = 0.95, Figure 14). The most significant influence on L ¯ come from the pores smaller than 0.3 mm, which are introduced directly as a result of the air-entraining admixture, and from pores between 0.3 mm and 1.0 mm, which may result from either the admixture’s effect or the merging of smaller pores. This is supported by the highest slope coefficients in the linear regression equations describing the relations between L ¯ and these two parameters (AMAX was excluded due to the least reliable relation).
The analysis of quantitative parameters of microstructure (A, A300, α, L ¯ ) with respect to the PN-EN 480-11 standard allows for the indirect evaluation of concrete freeze–thaw resistance. According to the literature, freeze–thaw-resistant concrete typically meets the following criteria: A = 4–7%, A300 > 1.5%, α = 15–24 mm−1, and L ¯ < 0.2–0.25 mm [14,69,70,71,72,73,74,75,76,77,78]. The results show that three out of four criteria (A300, α and L ¯ ) are met by the concrete N2 and N3. However, none of them met the requirement regarding the total air content in hardened concrete; the closest is N2, which exceeded the upper limit by 1.24%. Interestingly, the A requirement is met by other samples, including the reference concrete N0, suggesting that the recommended range for this parameter might be too low for air-entrained concretes. Another possible explanation is the overestimation of A due to the influence of AMAX, which is highly dependent on the degree of compaction. When the AMAX is subtracted from A, the adjusted total air content falls within the required 4–7% range.

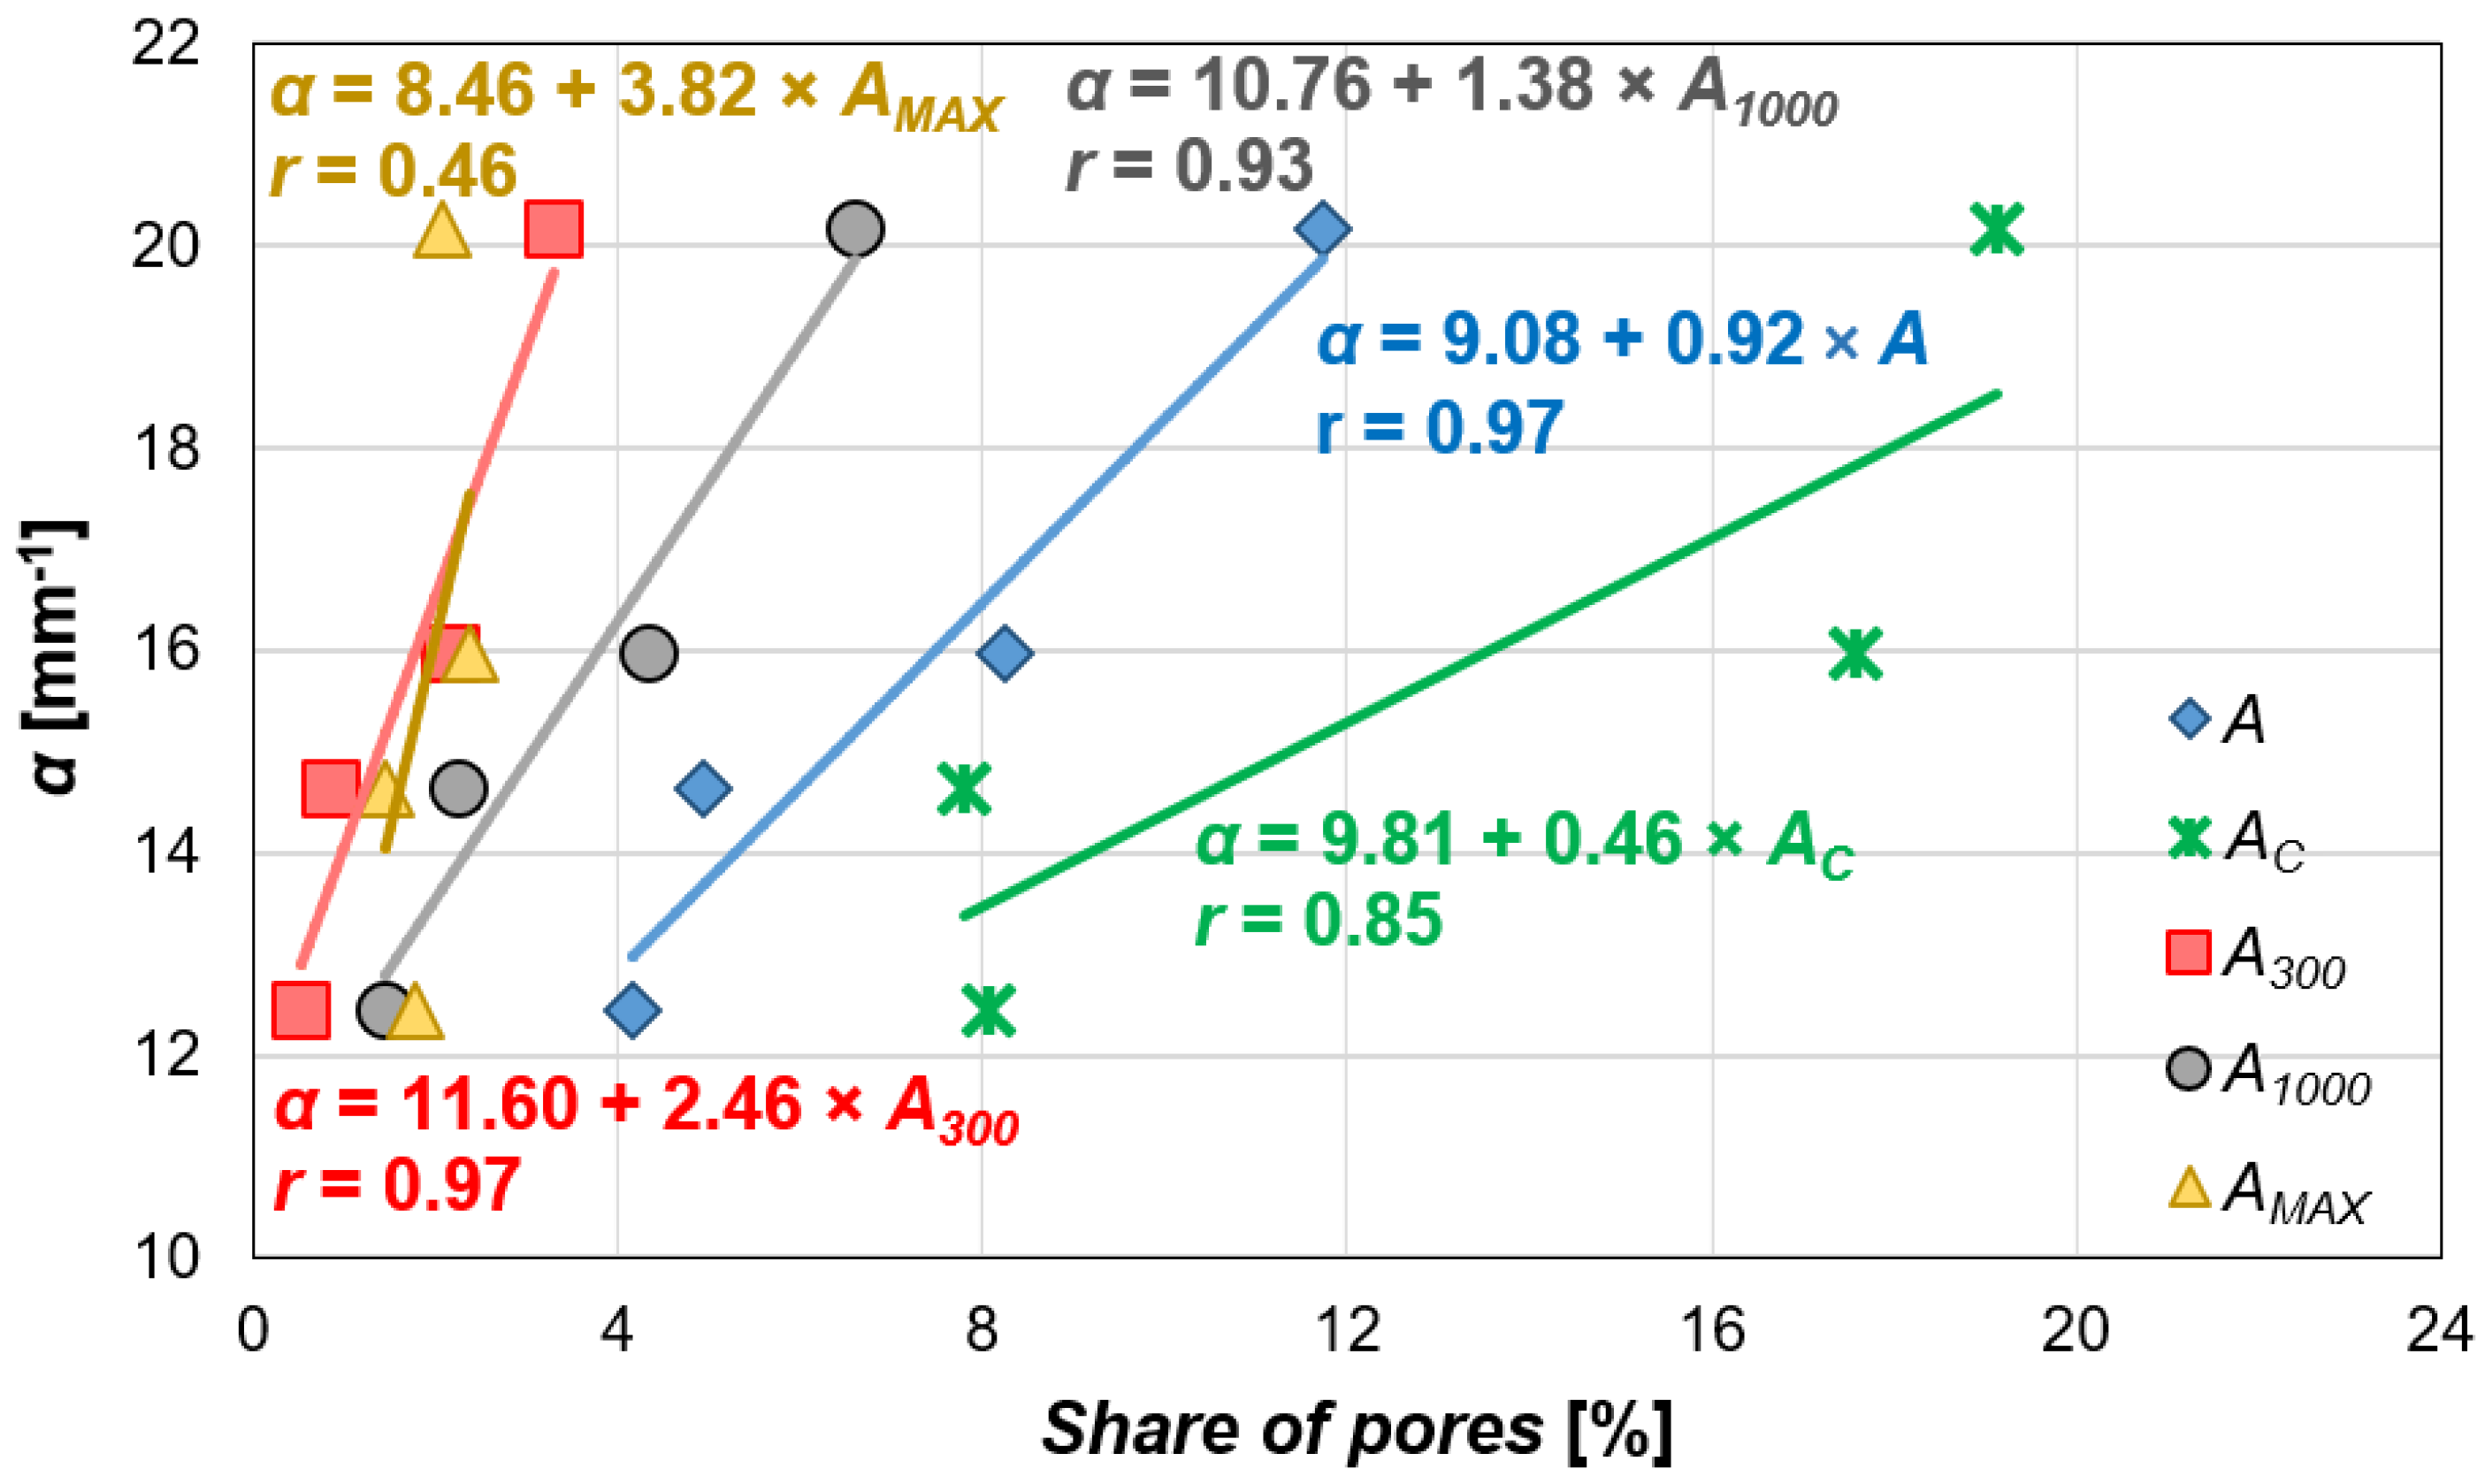
3.2. Analysis of Relations Between the Concrete Properties and the Quantative Parameters of Pore Structure

3.2.1. The Influence of the Pore Structure on the Compressive Strength

The compressive strength showed a negative correlation with all calculated microstructure parameters regarding pore content, meaning that an increase in A, AC, A300, A1000, or AMAX resulted in a decrease in fc (Figure 15). In general, all relations—except fc—AMAX—were characterized by correlation coefficient in the range 0.96–0.99, which classifies them as very strong relations (Figure 15a–d). The correlation of fc with AMAX (Figure 15e) was the weakest, as the content of pores in this category is rather incidental. However, r = −0.61 still indicated that these pores have some influence on compressive strength.
A very strong correlation was observed between fc and L ¯ (r = 0.96, Figure 15f). It was expected, as the spacing factor is closely related to the pore content in concrete. Lower pore content results in fewer pores, meaning that they are farther apart, which leads to higher compressive strength.
Another microstructural parameter strongly correlated with compressive strength is the specific surface area (r = 0.98, Figure 15g). An increase in α led to a decrease in the fc, as the increase in the specific surface area directly indicates a rise in the number of pores of various sizes.
The study of the influence of pore structure on compressive strength was also carried out by the multiple regression analysis with the stepwise forward selection. The following parameters were chosen as explanatory variables for the dependent variable fc: the total pore content (A), the total pore content in mortar (AC)—parameter calculated excluding the influence of coarse aggregate, the content of micropores with a diameter smaller than 0.3 mm (A300), the content of micropores with a diameter between 0.3 mm and 1.0 mm (A1000), the content of pores with a diameter greater than 1.0 mm (AMAX), the specific surface area of pores (α), and the spacing factor of air voids ( L ¯ ).
The results of the successive steps of the regression analysis are shown in Table 11 and Table 12. The correlation coefficient in the first step was R = 0.9999 with the standard estimation error SEE = 0.3901 (Table 11). It turned out that the most important variable for predicting the compressive strength was the content of pores A1000, with the slope coefficient β = −0.9994 and the probability p < 0.0001. The increase in the A300 caused a decrease in fc, similar to changes observed in the correlation analysis (see Figure 15c).
In the next step, a bivariate model was tested using the two independent variables that showed the highest correlation with fc (Table 12). This model included the A1000 and the A300 as predictors and showed the R = 0.9999 and the SEE = 0.0022. The still-high correlation coefficient and the standard estimation error two orders of magnitude lower indicated a better fit to the empirical data compared to the previous model. Moreover, the probability p of the fc(A1000, A300) model was over six times lower than the fc(A1000) model, confirming its higher predictive reliability.
It also is worth noting that the entire relation in the bivariate model was primarily driven by the presence of the A1000 in the equation, as indicated by its standardized regression coefficient (β = 1.63), which was more than 2.5 times higher than that of the A300(β = 0.63). This suggests that pores in the 0.3–1.0 mm range have a stronger negative impact on compressive strength. The reason is that smaller pores—especially uniformly distributed—are more favorable for concrete performance, whereas an increase in pore diameter reduces the concrete’s load-bearing capacity. However, the results also showed that even the smallest pores (i.e., below 0.3 mm) can negatively affect mechanical properties, if their amount is too high. This observation is consistent with findings reported in the literature [1,2,3,4,5,6,7,8,9,10,11,12,13].
Adding any other pore structure parameter into the regression model resulted in a only a slight improvement in statistics (R, SEE) while significantly deteriorating the model’s p-value. Moreover, none of the additional variables were statistically significant (i.e., the variables p-values increased above the accepted significance level equal 0.05). These findings confirm that the bivariate regression model fc(A1000, A300) was the most optimal configuration. Due to its high quality, it can be effectively used to predict compressive strength.

3.2.2. The Influence of the Pore Structure on the Ultrasonic Pulse Velocity

The correlation analysis of the ultrasonic wave velocity and the pore structure parameters yielded results similar to those obtained for the compressive strength (Figure 16). The UPV testing plays an important role in concrete structure diagnostics, including as an indirect method for assessing compressive strength in concrete structures. This is because fc and the UPV are strongly related and, therefore, show similar correlations with other variables.
The increase in A, AC, A300, and A1000 values led to a reduction in the UPV (Figure 16a–d), with correlation coefficients reaching very high values, ranging from −0.91 to −0.99. The weakest correlation was observed between the UPV and the macropores content AMAX (r = −0.61, Figure 16e). It was expected, as increasing porosity led to more internal discontinuities, which disrupt the uniform transmission of ultrasonic pulses. Air voids scatter and cause multiple reflections of the wavefront, increasing travel time and reducing the UPV.
The UPV also showed good or very good correlation with L ¯ (r = 0.91, Figure 16f) and the α (r = −0.97, Figure 16g). Similarly to fc, the increase in L ¯ and α resulted in an increase and decrease in the UPV, respectively. Both L ¯ and α are associated with the concrete porosity. The lower pore content corresponds to the lower number of pores, which means the average distance between them is greater and their specific surface area is smaller. That is why the decrease in L ¯ and increase in α led to the lower compressive strength and, consequently, the lower ultrasonic pulse velocity. Therefore, the ultrasonic method can be a good indicator of the quality of air-entrained concretes.
The influence of pore structure on the ultrasonic pulse velocity was also investigated using a multiple regression analysis with a stepwise forward selection (Table 13). The parameters selected as explanatory variables for the UPV were identical to those chosen for fc, including the total pore content (A), the total pore content in mortar (AC)—a parameter calculated excluding the influence of coarse aggregate—the micropore content with a diameter smaller than 0.3 mm (A300), the micropore content with a diameter between 0.3 mm and 1.0 mm (A1000), the pore content with a diameter greater than 1.0 mm (AMAX), the specific surface area of pores (α), and the air void spacing factor ( L ¯ ).
The results of the successive steps of the regression analysis are presented in Table 13 and Table 14. The variable that best explains ultrasonic pulse velocity was the total pore content, as it was the first to be included in the model, which achieved the R = 0.9946, the p < 0.0054, and the SEE = 18.8740. The p-value for the variable A is 0.0054, indicating high statistical significance. Moreover, the negative sign of the regression coefficient (β = −0.9946) indicates that the increase in pore content led to a decrease in ultrasonic pulse velocity, which is consistent with the results of the correlation analysis (Figure 16a).
In the second step of the multiple regression, the model was expanded to include the A300 pore content. The resulting model, UPV (A, A300), maintained the very high multiple correlation coefficient (R = 0.9999), the p-value reduced by half (p < 0.0027), and the standard error (SEE = 0.6939) two orders of magnitude lower compared to the UPV (A) model. These properties indicate that the two-variable model is better than the single-variable one.
It should also be noted that both variables in the UPV (A, A300) model were statistically significant, as their p-values were below the assumed significance level of 0.05 (p = 0.0105 for A, and the p = 0.0166 for A300). The regression coefficients indicated that changes in A (β = −2.81) have more than 1.5 times greater impact on the dependent variable UPV compared to A300 (β = 1.73). Among all the parameters, the total pore content A has the greatest influence on the UPV, indicating that for ultrasonic wave propagation, the overall content of air voids in concrete is more important than their size. The wave velocity depends on the material’s elasticity, which in turn is affected by the content of air voids in the concrete. The higher the porosity, the lower the elastic modulus [113], and consequently, the lower the UPV [114].
Furthermore, the direction of the UPV changes caused by both explanatory variables was opposite: the increase in A resulted in a decrease in the UPV, whereas the increase in A300 led to the increase in the UPV. Notably, the influence of A300 is opposite to that observed in the correlation analysis (Figure 16c).
The compressive strength and the ultrasonic pulse velocity were highly correlated, which was reflected in the similarities between their multiple regression results. In both cases, the optimal model was a two-variable regression model, in which different variables (A1000 and A300) were initially included. However, in the second step, the same pore content A300 was incorporated into both models.
The UPV (A, A300) model proved optimal because adding any other variable describing the pore structure, although it slightly improved the model’s properties (R, SEE), resulted in variables that were not statistically significant (p > 0.05), and similarly, the model’s p-value worsened. The performance of the developed model demonstrates its high quality, suggesting that it can be effectively used for predicting ultrasonic pulse velocity.

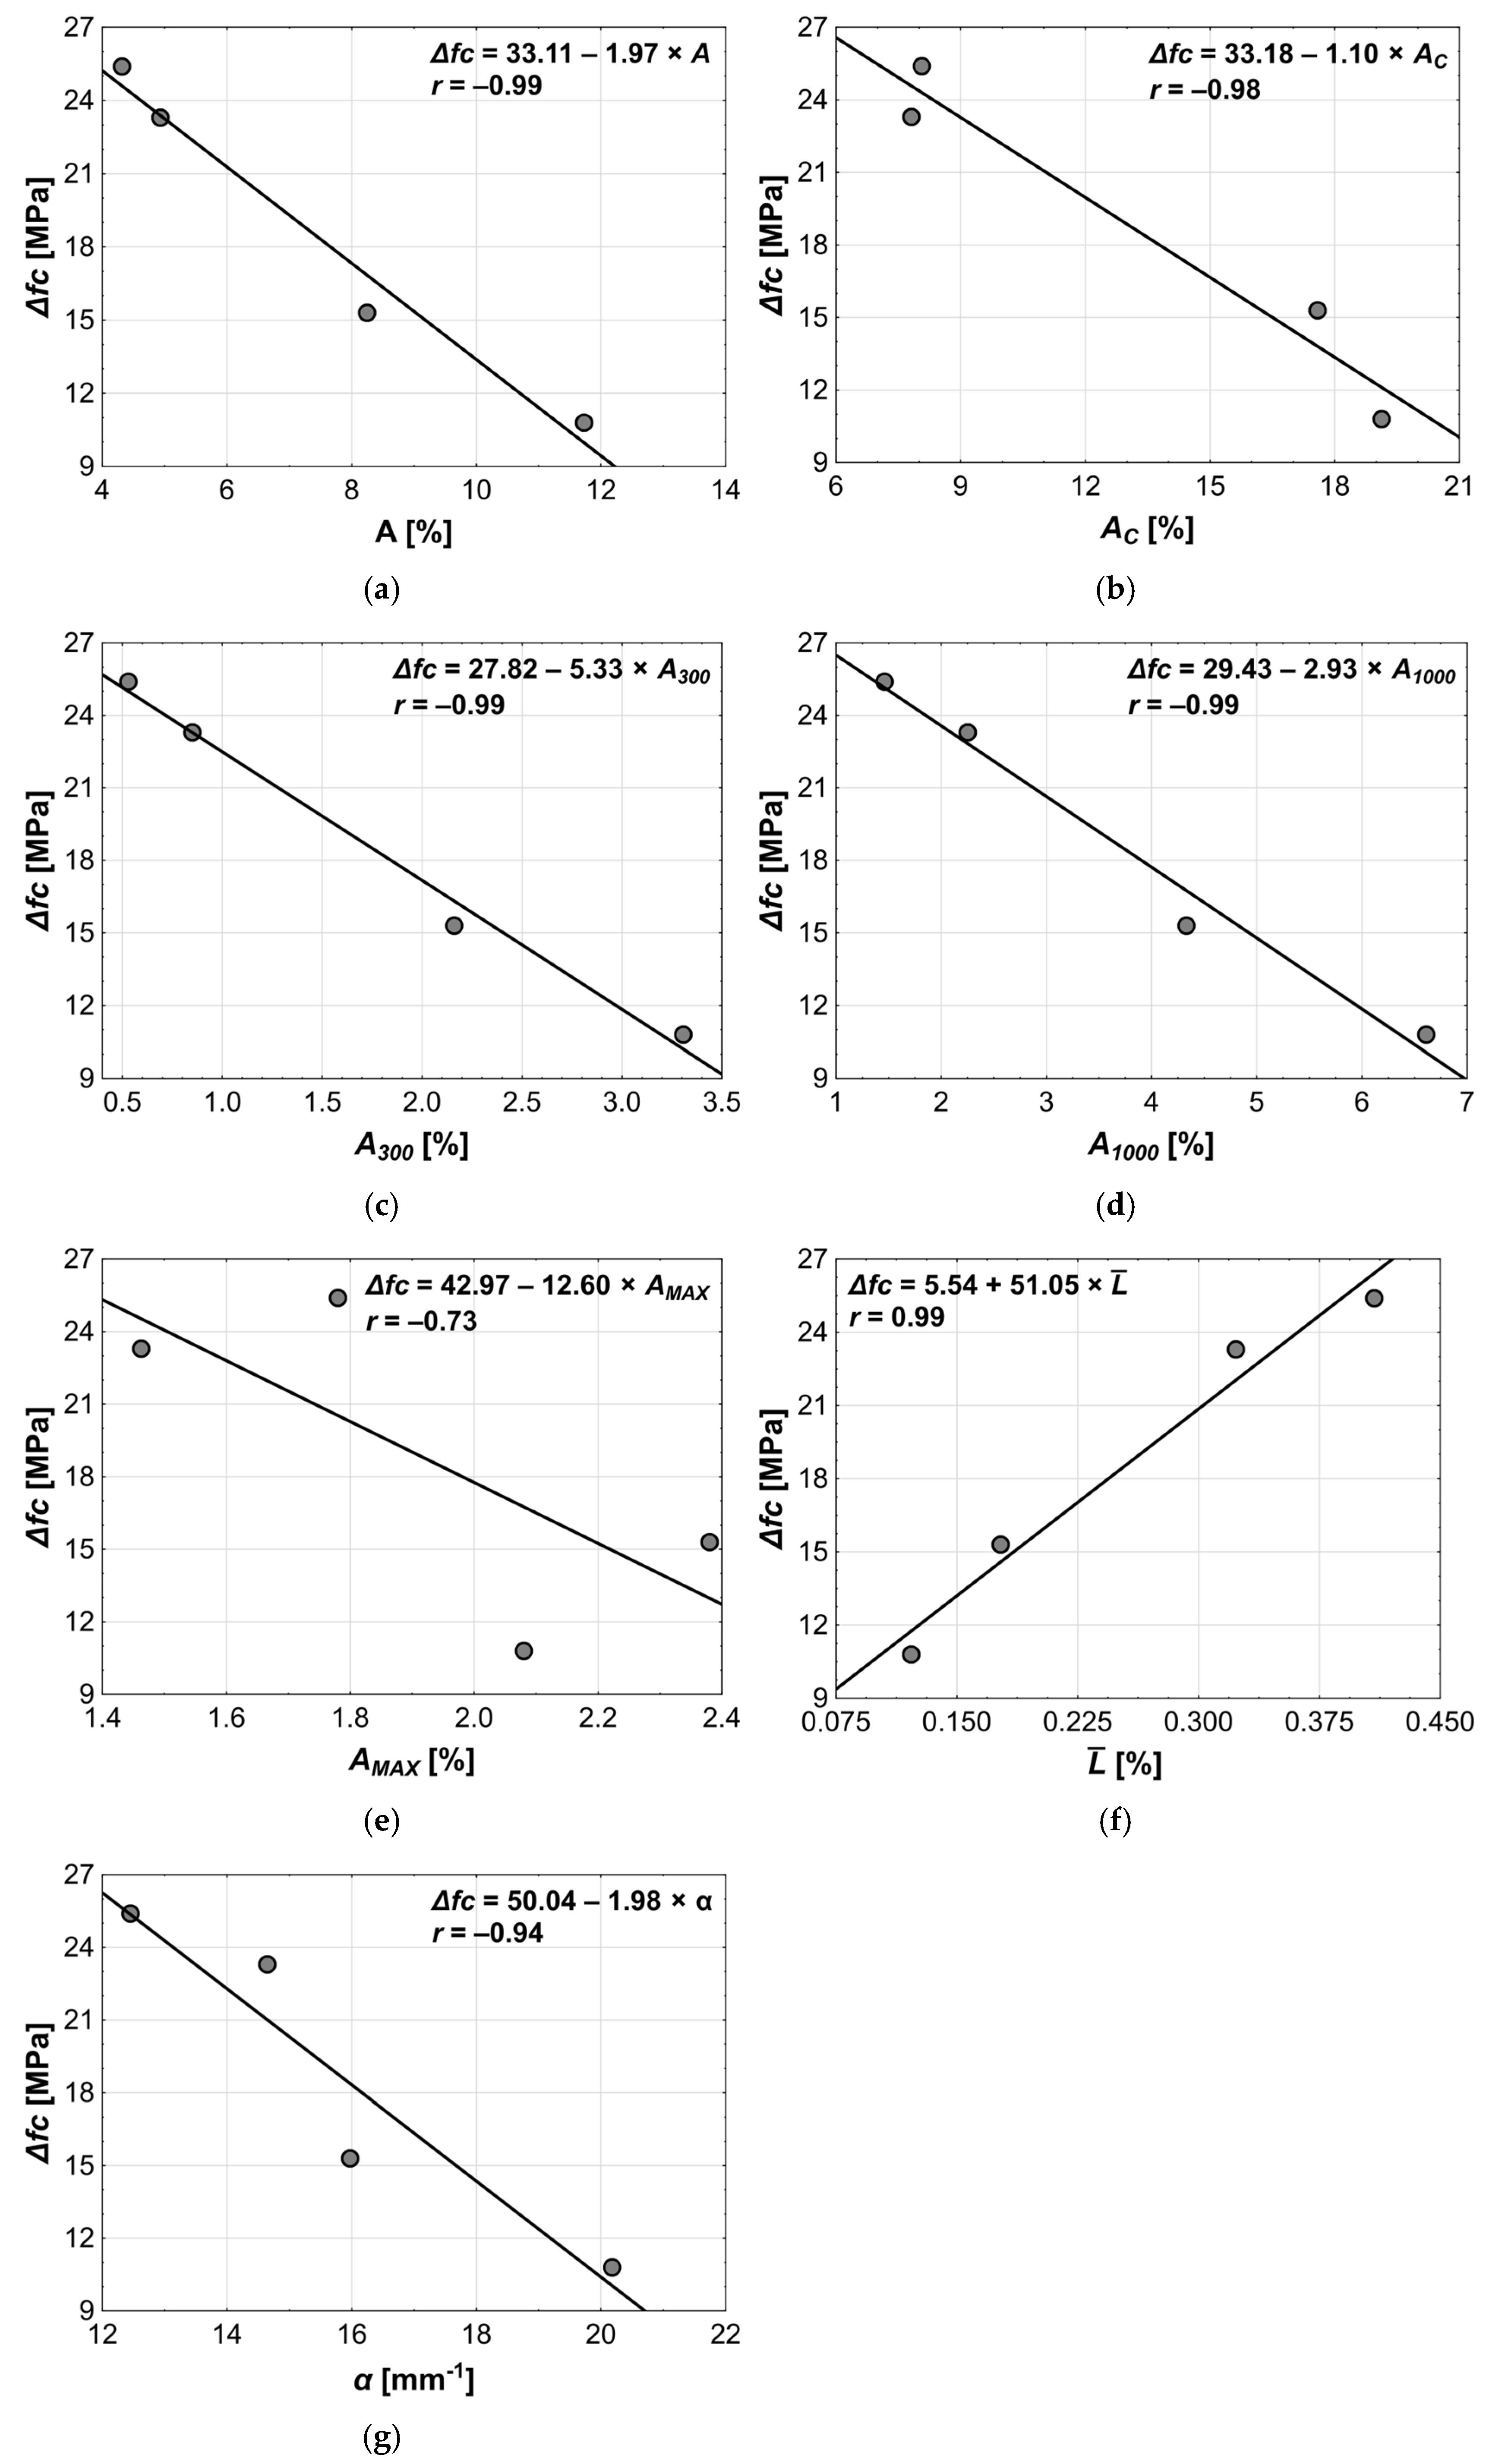
3.2.3. The Influence of the Pore Structure on the Freeze–Thaw Resistance

The freeze–thaw resistance of concrete, expressed as the percentage loss in compressive strength between reference samples and samples subjected to the freeze–thaw cycles, showed very strong correlation with all the microstructure parameters (r ranging 0.98–0.99, Figure 17a–d,f,g), except for the AMAX (Figure 17e), which exhibited a significantly lower correlation coefficient (r = –0.87). The increase in the values of parameters A, Ac, A300, and A1000 resulted in a decrease in the Δfc, with the strongest effect observed for the A300—the highest slope coefficient (5.33)—more than twice that of the A1000 (2.93). The decrease in the Δfc indicated the increase in freeze–thaw resistance, as the freeze–thaw cycles caused a progressively smaller reduction in the compressive strength. The dominant influence of the A300 parameter on the Δfc confirmed the well-known benefit of introducing air bubbles up to 0.3 mm in diameter in cement composites. Since increasing the amount of air-entraining admixture raised both the A300 and the A1000 pore contents, the Δfc showed similarly strong correlations with all parameters describing porosity.
The compressive strength change (Δfc) was also very strongly correlated with the air void spacing factor L ¯ (r = 0.99) and the specific surface area of pores α (r = −0.99). The increase in Δfc—that is, a decrease in resistance to freeze–thaw cycles—was observed alongside the decrease in the L ¯ and the increase in α. This, in turn, is related to the increase in pore content—in other words, the increase in the number of pores, which reduced the distance between them and increased their total specific surface area. The strong correlation of both parameters with Δfc underscored the usefulness of determining their values when assessing the freeze–thaw resistance of concrete.
It should also be noted that each of the pore structure parameters identified in the literature as significant from the standpoint of freeze–thaw resistance (A, A300, L ¯ , α) was similarly strongly associated with Δfc.
The analysis of the influence of pore structure on the freeze–thaw resistance was also conducted using multiple regression analysis with stepwise forward selection. The parameters selected as explanatory variables for Δfc were identical to those chosen for fc and UPV, including the total pore content (A), the total pore content in mortar (AC), the micropore content with a diameter smaller than 0.3 mm (A300), the micropore content with a diameter between 0.3 mm and 1.0 mm (A1000), the pore content with a diameter greater than 1.0 mm (AMAX), the specific surface area of pores (α), and the air void spacing factor ( L ¯ ).
The results of the regression analysis for the freeze–thaw resistance are presented in Table 15. The microstructure parameter that best explained changes in the Δfc is the share of pores with a diameter up to 0.3 mm (p = 0.0008). This parameter is the only variable that appeared in the regression model, because no other parameter added as the first or second one was statistically significant. Just like in the correlation analysis, the regression analysis also showed that the increase in A300 resulted in the decrease in Δfc, which was related to the increase in freeze–thaw resistance. The Δfc (A300) model had a very good fit to the data, indicated by very good model properties—an R value of 0.9945, a probability p < 0.0055, and an SEE of 0.8779.
These results showed that among the pore structure parameters listed in EN 480-11, A300 best describes the freeze–thaw resistance evaluated according to the PN-B-06250 standard. This may suggest that A300 alone might be enough for an indirect assessment of freeze–thaw resistance. Moreover, the developed model is of sufficient quality to be used for estimating the level of freeze–thaw resistance.

4. Conclusions

The goal of this study was to examine the influence of concrete modification with the air-entraining admixture on its properties and pore structure. It also analyzed the relations between the pore structure, described by quantitative stereological parameters, and selected properties, namely compressive strength, ultrasonic wave velocity, and freeze–thaw resistance. To achieve this, correlation analysis and multiple regression analysis with forward stepwise selection were used. Based on the obtained results, the following conclusions can be drawn:
The image analysis method, supported by custom software, was successfully used to describe the air void structure in concrete.
The effectiveness of the air-entraining admixture was confirmed. It increased the air content in the fresh concrete mix and improved its workability. The entrained air remained in the hardened concrete as pores—mostly smaller than 1.0 mm. This led to the decrease in the compressive strength and the ultrasonic pulse velocity, but also improved the concrete’s resistance to freeze–thaw cycles.
The optimal admixture dosage was found to be 0.2% of the cement mass. At this level, the concrete showed the best balance between compressive strength and freeze–thaw resistance, confirmed by both indirect (pore structure) and direct (strength loss after freezing–thawing cycles) methods.
The ultrasonic pulse velocity proved to be a useful tool for evaluating the air entrainment quality, as it strongly correlates with both compressive strength and pore structure parameters defined in EN 480-11.
The pore structure parameter that best explains changes in compressive strength is the content of pores between 0.3 and 1.0 mm. The smaller pores—especially those uniformly distributed—are more favorable for concrete performance, whereas an increase in pore diameter reduces concrete’s load-bearing capacity.
The total pore content is the best predictor of ultrasonic pulse velocity, indicating that for ultrasonic wave propagation, the overall content of air voids in concrete is more important than their size. The wave velocity depends on the material’s elasticity, which in turn is affected by the content of air voids in the concrete. The higher the porosity, the lower the elastic modulus, and consequently, the lower the UPV.
For the freeze–thaw resistance (measured directly), the most important pore structure parameter is the content of pores smaller than 0.3 mm. This indicates that pores of this size are crucial for maintaining concrete durability under cyclic freezing and thawing conditions. It also confirms the effectiveness of the air-entraining admixture, which introduces air voids into the concrete—specifically those smaller than 0.3 mm.
The high quality of the regression models developed using stepwise forward selection showed that they can be used to predict compressive strength, ultrasonic pulse velocity, and freeze–thaw resistance based on stereological pore structure analysis.
The approach used in this study could be the first step toward fully automating the evaluation of freeze–thaw resistance by the image analysis method. The next step may involve applying deep learning algorithms.

Funding

This paper was co-financed under the research grant of the Warsaw University of Technology supporting the scientific activity in the discipline of Civil Engineering, Geodesy, and Transport.

Institutional Review Board Statement

Not applicable.

Informed Consent Statement

Not applicable.

Data Availability Statement

The original contributions presented in this study are included in the article. Further inquiries can be directed to the corresponding author.

Conflicts of Interest

The author declares no conflicts of interest.

References

  1. Chen, X.; Wu, S.; Zhou, J. Influence of Porosity on Compressive and Tensile Strength of Cement Mortar. Constr. Build. Mater. 2013, 40, 869–874. [Google Scholar] [CrossRef]
  2. Erniati; Tjaronge, M.W.; Zulharnah; Irfan, U.R. Porosity, Pore Size and Compressive Strength of Self Compacting Concrete Using Sea Water. Procedia Eng. 2015, 125, 832–837. [Google Scholar] [CrossRef]
  3. Lian, C.; Zhuge, Y.; Beecham, S. The relationship between porosity and strength for porous concrete. Constr. Build. Mater. 2011, 25, 4294–4298. [Google Scholar] [CrossRef]
  4. Naik, T.R. Concrete durability as influenced by density and/or porosity. In Proceedings of the Cement and Concrete Institute of Mexico Symposium: World of Concrete–Mexico, Guadalajara, Mexico, 4–7 June 1997. [Google Scholar]
  5. Yudenfreund, M.; Hanna, K.M.; Skalny, J.; Odler, I.; Brunauer, S. Hardened Portland cement pastes of low porosity. Part 5: Compressive strength. Cem. Concr. Res. 1972, 2, 731–743. [Google Scholar] [CrossRef]
  6. Zhao, H.; Xiao, Q.; Huang, D.; Zhang, S. Influence of Pore Structure on Compressive Strength of Cement Mortar. Sci. World J. 2014, 2024, 247058. [Google Scholar] [CrossRef] [PubMed]
  7. Claisse, P.A.; Cabrera, J.G.; Hunt, D.N. Measurement of porosity as a predictor of the durability performance of concrete with and without condensed silica fume. Adv. Cem. Res. 2001, 13, 165–174. [Google Scholar] [CrossRef]
  8. Li, Y.; Ma, H.; Wen, L.; Yuan, J.; Zhang, Y.; Li, Y.; Zhou, H.; Chen, J. Influence of Pore Size Distribution on Concrete Cracking with Different AEA Content and Curing Age Using Acoustic Emission and Low-Field NMR. J. Build. Eng. 2022, 58, 105059. [Google Scholar] [CrossRef]
  9. Sypek, M.; Latawiec, R.; Łaźniewska-Piekarczyk, B.; Pichór, W. Impact of Surfactant and Calcium Sulfate Type on Air-Entraining Effectiveness in Concrete. Materials 2022, 15, 985. [Google Scholar] [CrossRef]
  10. Talaat, A.; Emad, A.; Tarek, A.; Masbouba, M.; Essam, A.; Kohail, M. Factors Affecting the Results of Concrete Compression Testing: A Review. Ain Shams Eng. J. 2021, 12, 205–221. [Google Scholar] [CrossRef]
  11. Leventis, A.; Verganelakis, D.A.; Halse, M.R.; Webber, J.B.; Strange, J.H. Capillary Imbibition and Pore Characterisation in Cement Pastes. Transp. Porous Media 2000, 39, 143–157. [Google Scholar] [CrossRef]
  12. Zhang, Y.; Liu, R.; Zhang, R.; Yan, X.; Zhao, Z.; Zhu, Y. Effect of Constrictivity of Gel/Capillary Pores in Concrete on Chloride Ions Migration. Iran. J. Sci. Technol. Trans. Civ. Eng. 2024, 48, 4201–4213. [Google Scholar] [CrossRef]
  13. Wang, Y.; Li, L.; An, M.; Sun, Y.; Yu, Z.; Huang, H. Factors Influencing the Capillary Water Absorption Characteristics of Concrete and Their Relationship to Pore Structure. Appl. Sci. 2022, 12, 2211. [Google Scholar] [CrossRef]
  14. Neville, A.M. Properties of Concrete; Pearson Education Limited: London, UK, 2011. [Google Scholar] [CrossRef]
  15. Pawlowicz, J. Evaluation of Air Entraining Behaviour in Concrete Using Computer Aided Methods on Hardened Samples. Master’s Thesis, TU Delft University, Delft, The Netherlands, 2019. [Google Scholar]
  16. Kosmatka, S.H.; Wilson, M.L. Design and Control of Concrete Mixtures, 15th ed.; Engineering Bulletin 001.15; Portland Cement Association: Skokie, IL, USA, 2011. [Google Scholar]
  17. Lv, D.; Liu, H.; He, F.; Wang, W.; Miao, Q.; Li, H.; Wang, F.; Zhao, J.; Shi, C. Freeze–Thaw Damage Characteristics of Concrete Based on Compressive Mechanical Properties and Acoustic Parameters. Materials 2024, 17, 1010. [Google Scholar] [CrossRef]
  18. Zhao, Y.; Lian, S.; Bi, J.; Wang, C.; Zheng, K. Study on Freezing-Thawing Damage Mechanism and Evolution Model of Concrete. Theor. Appl. Fract. Mech. 2022, 121, 103439. [Google Scholar] [CrossRef]
  19. Luo, S.; Bai, T.; Guo, M.; Wei, Y.; Ma, W. Impact of Freeze–Thaw Cycles on the Long-Term Performance of Concrete Pavement and Related Improvement Measures: A Review. Materials 2022, 15, 4568. [Google Scholar] [CrossRef] [PubMed]
  20. Shang, H.S.; Song, Y.P. Experimental Study of Strength and Deformation of Plain Concrete under Biaxial Compression after Freezing and Thawing Cycles. Cem. Concr. Res. 2006, 36, 1857–1864. [Google Scholar] [CrossRef]
  21. Kelestemur, O.; Yildiz, S.; Gokcer, B.; Arici, E. Statistical Analysis for Freeze–Thaw Resistance of Cement Mortars Containing Marble Dust and Glass Fiber. Mater. Des. 2014, 60, 548–555. [Google Scholar] [CrossRef]
  22. Krstic, M.; Davalos, J.F.; Rossi, E.; Figueiredo, S.C.; Copuroglu, O. Freeze–Thaw Resistance and Air-Void Analysis of Concrete with Recycled Glass–Pozzolan Using X-ray Micro-Tomography. Materials 2021, 14, 154. [Google Scholar] [CrossRef]
  23. Li, G.; Hasholt, M.T.; Jensen, O.M. Air Void Analysis of Hardened Concrete Without Colour Enhancement. In Concrete Durability and Service Life Planning; Kovler, K., Ed.; Springer: Cham, Switzerland, 2020; Volume 26, pp. 79–83. [Google Scholar] [CrossRef]
  24. Mehta, P.K.; Monteiro, P.J.M. Concrete: Microstructure, Properties, and Materials, 4th ed.; McGraw-Hill Education: New York, NY, USA, 2014. [Google Scholar]
  25. Kovler, K.; Zhutovsky, S.; Spatari, S.; Jensen, O. (Eds.) Concrete Durability and Service Life Planning. In RILEM Bookseries; Springer: Cham, Switzerland, 2020; Volume 26, pp. 127–134. [Google Scholar] [CrossRef]
  26. Zhu, C.; Zhu, E.; Wang, B.; Li, J.; Yao, T.; Zhang, Z. Effect of Porosity and Pore Size on the Axial Compressive Properties of Recycled Aggregate Concrete. Materials 2025, 18, 2830. [Google Scholar] [CrossRef]
  27. Zhang, D.; Zhang, Z.; Zhang, L.; Zhang, J.; Zhang, X.; Zhang, Y.; Zhang, Q. Investigation on the Effect of Entrained Air on Pore Structure in Hardened Mortar and Concrete. Cem. Concr. Res. 2021, 139, 106230. [Google Scholar] [CrossRef]
  28. He, R.; Lu, N. Hydration, fresh, mechanical, and freeze–thaw properties of cement mortar incorporated with polymeric microspheres. Adv. Compos. Hybrid Mater. 2024, 7, 92. [Google Scholar] [CrossRef]
  29. Chen, Y.; Al-Neshawy, F.; Punkki, J. Investigation on the Effect of Entrained Air on Pore Structure in Hardened Concrete Using MIP. Constr. Build. Mater. 2021, 295, 123583. [Google Scholar] [CrossRef]
  30. Gagné, R. Science and Technology of Concrete Admixtures; Elsevier: Amsterdam, The Netherlands, 2016. [Google Scholar]
  31. Szklarzyńska, M.; Gaudy, J.; Wojtysiak, Z. Air void characteristic in hardened, air entrained construction concrete in terms of specimens compacting method. In Proceedings of the XI Konferencja Dni Betonu, Wisła, Poland, 11–13 October 2021; Stowarzyszenie Producentów Cementu: Wisła, Poland, 2021; pp. 1117–1134. [Google Scholar]
  32. Schwoon, O. A New Efficient and Safe Admixture for Freeze/Thaw Resistant Concrete. In High Tech Concrete: Where Technology and Engineering Meet; Hordijk, D.A., Luković, M., Eds.; Springer: Cham, Switzerland, 2018; pp. 2162–2168. [Google Scholar] [CrossRef]
  33. Guo, L.; Liu, J.; Zhou, M.; An, S. Effect of Sulfate Attack on Geopolymer Mortars at Early Ages of Exposure. Constr. Build. Mater. 2021, 274, 121835. [Google Scholar] [CrossRef]
  34. Li, W.; Pour-Ghaz, M.; Trtik, P.; Wyrzykowski, M.; Münch, B.; Lura, P.; Weiss, W.J. Using Neutron Radiography to Assess Water Absorption in Air Entrained Mortar. Constr. Build. Mater. 2016, 110, 98–105. [Google Scholar] [CrossRef]
  35. Zhang, P.; Wittmann, F.H.; Vogel, M.; Müller, H.S.; Zhao, T. Influence of Freeze-Thaw Cycles on Capillary Absorption and Chloride Penetration into Concrete. Cem. Concr. Res. 2017, 100, 60–67. [Google Scholar] [CrossRef]
  36. Nematzadeh, A.; Aytekin, B.; Mardani-Aghabaglou, A. Effect of Mineral Additives and Permeability Reducing Admixtures Having Different Action Mechanisms on Mechanical and Durability Performance of Cementitious Systems. Front. Struct. Civ. Eng. 2021, 15, 1277–1291. [Google Scholar] [CrossRef]
  37. Zhang, H. Concrete. In Building Materials in Civil Engineering; Zhang, H., Ed.; Woodhead Publishing Series in Civil and Structural Engineering; Woodhead Publishing: Cambridge, UK, 2011; pp. 81–423. [Google Scholar] [CrossRef]
  38. Blikharskyy, Z.; Markiv, T.; Sobol, K.; Turba, Y.; Selejdak, J. The Effect of Air-Entraining Agent on the Properties of Mortars. Arch. Civ. Eng. 2023, 69, 147–156. [Google Scholar] [CrossRef]
  39. Neville, A.M. Properties of Concrete, 5th ed.; Pearson Education: Harlow, UK, 2011. [Google Scholar]
  40. Güleryüz, E.; Özen, S.; Mardani-Aghabaglou, A. Effect of Utilization of Mineral Admixture on the Fresh and Hardened Properties of Air-Entrained Cement Mortars. Pamukkale Univ. J. Eng. Sci. 2020, 26, 1053–1061. [Google Scholar] [CrossRef]
  41. Abed, A.A.; Sołowski, W.T. Estimation of Water Retention Behaviour of Bentonite Based on Pore Structure Analysis. Constr. Build. Mater. 2021, 300, 123441. [Google Scholar] [CrossRef]
  42. Liu, L.; He, Z.; Cai, X.; Fu, S. Application of Low-Field NMR to the Pore Structure of Concrete. Appl. Magn. Reson. 2020, 52, 15–31. [Google Scholar] [CrossRef]
  43. Topcu, I.B.; Atesin, Ö.; Uygunoglu, T. Effect of High Dosage Air-Entraining Admixture Usage on Micro Concrete Properties. Int. J. Adv. Technol. Eng. Sci. 2017, 2, 1–11. [Google Scholar]
  44. Bednarek, M.; Grzybowski, M. Influence of Air-Entraining Admixture on Selected Properties of Concrete. MATEC Web Conf. 2018, 163, 05002. [Google Scholar]
  45. Łaźniewska-Piekarczyk, B. The Methodology for Assessing the Impact of New Generation Superplasticizers on Air Content in Self-Compacting Concrete. Constr. Build. Mater. 2014, 53, 488–502. [Google Scholar] [CrossRef]
  46. Yang, W. Is Air-Entraining Agent a Panacea for Solving Frost Resistance Problem? In The Issues and Discussion of Modern Concrete Science; Tsinghua University Press: Beijing, China; Springer: Berlin/Heidelberg, Germany, 2015; pp. 53–68. [Google Scholar] [CrossRef]
  47. Fan, Y.F.; Luan, H.Y. Pore structure in concrete exposed to acid deposit. Constr. Build. Mater. 2013, 49, 407–416. [Google Scholar] [CrossRef]
  48. Kim, H.-T.; Razakamandimby, D.F.T.; Szilágyi, V.; Kis, Z.; Szentmiklósi, L.; Glinicki, M.A.; Park, K. Reconstruction of Concrete Microstructure Using Complementarity of X-ray and Neutron Tomography. Cem. Concr. Res. 2021, 148, 106540. [Google Scholar] [CrossRef]
  49. Han, J.; Wang, K.; Wang, X.; Monteiro, P.J.M. 2D image analysis method for evaluating coarse aggregate characteristic and distribution in concrete. Constr. Build. Mater. 2016, 127, 30–42. [Google Scholar] [CrossRef]
  50. Wawrzenczyk, J.; Kozak, W. A method of analyzing the porous microstructure in air-entrained concrete on the basis on 2D image analysis. Proc. Eng. 2015, 108, 102–107. [Google Scholar] [CrossRef]
  51. Ojala, T.; Chen, Y.; Punkki, J.; Al-Neshawy, F. Characteristics of entrained air voids in hardened concrete with the method of digital image analysis coupled with Schwartz-Saltykov conversion. Materials 2021, 14, 2439. [Google Scholar] [CrossRef]
  52. Kuziak, J.; Zalegowski, K.; Jackiewicz-Rek, J.; Stanisławek, E. Influence of the Type of Cement on the Action of the Admixture Containing Aluminum Powder. Materials 2021, 14, 2927. [Google Scholar] [CrossRef]
  53. Zalegowski, K.; Piotrowski, T.; Garbacz, A. Influence of Polymer Modification on the Microstructure of Shielding Concrete. Materials 2020, 13, 498. [Google Scholar] [CrossRef]
  54. Pourebrahimi, M.; Shahhosseini, V.; Ramezanianpour, A.A. Innovative Sieve Simulation and Microstructure Image Analysis Techniques for Estimation of Aggregate Size Distribution in Hardened Concrete. Constr. Build. Mater. 2023, 384, 131456. [Google Scholar] [CrossRef]
  55. Ye, G.; Hu, J.; van Breugel, K.; Stroeven, P. Characterization of the Development of Microstructure and Porosity of Cement-Based Materials by Numerical Simulation and ESEM Image Analysis. Mater. Struct. 2002, 35, 603–613. [Google Scholar] [CrossRef]
  56. Imtiaz, T.; Ahmed, A.; Hossain, M.S.; Faysal, M. Microstructure Analysis and Strength Characterization of Recycled Base and Sub-Base Materials Using Scanning Electron Microscope. Infrastructures 2020, 5, 70. [Google Scholar] [CrossRef]
  57. Bangaru, S.S.; Wang, C.; Zhou, X.; Hassan, M. Scanning Electron Microscopy (SEM) Image Segmentation for Microstructure Analysis of Concrete Using U-Net Convolutional Neural Network. Autom. Constr. 2022, 144, 104602. [Google Scholar] [CrossRef]
  58. Yuan, Y.; He, Z.; Niu, K.; Tian, B.; Chen, L.; Bai, W.; Zheng, S.; Yu, G. Analyzing Pore Evolution Characteristics in Cementitious Materials Using a Plane Distribution Model. Coatings 2023, 13, 2023. [Google Scholar] [CrossRef]
  59. Dequiedt, A.-S.; Coster, M.; Chermant, L.; Chermant, J.-L. Study of Phase Dispersion in Concrete by Image Analysis. Cem. Concr. Compos. 2001, 23, 215–226. [Google Scholar] [CrossRef]
  60. Xie, X.; Yu, Z.; Zhang, Y.; Wang, J.; Wang, X. Quick Image Analysis of Concrete Pore Structure Based on Deep Learning. Constr. Build. Mater. 2019, 211, 71–83. [Google Scholar] [CrossRef]
  61. Glinicki, M.A.; Litorowicz, A. Diagnosis of cracks in cement matrix composites using computer image analysis. Roads Bridges 2007, 3, 45–77. (In Polish) [Google Scholar]
  62. Ringot, E.; Bascoul, A. About the analysis of microcracking in concrete. Cem. Concr. Compos. 2001, 23, 261–266. [Google Scholar] [CrossRef]
  63. Dung, C.V.; Le, A.D. Autonomous Concrete Crack Detection Using Deep Fully Convolutional Neural Network. Autom. Constr. 2018, 99, 52–58. [Google Scholar] [CrossRef]
  64. Gonthina, M.; Chamata, R.; Duppalapudi, J.; Lute, V. Deep CNN-Based Concrete Cracks Identification and Quantification Using Image Processing Techniques. Asian J. Civ. Eng. 2023, 24, 727–740. [Google Scholar] [CrossRef]
  65. Avendaño, J.C.; Leander, J.; Karoumi, R. Image-Based Concrete Crack Detection Method Using the Median Absolute Deviation. Sensors 2024, 24, 2736. [Google Scholar] [CrossRef] [PubMed]
  66. Mertens, G.; Elsen, J. Use of Computer Assisted Image Analysis for the Determination of the Grain-Size Distribution of Sands Used in Mortars. Cem. Concr. Res. 2006, 36, 1453–1459. [Google Scholar] [CrossRef]
  67. Qian, H.; Li, Y.; Yang, J.; Xie, L.; Tan, K.H. Segmentation and Analysis of Cement Particles in Cement Paste with Deep Learning. Cem. Concr. Compos. 2023, 136, 104819. [Google Scholar] [CrossRef]
  68. Song, Y.; Huang, Z.; Lange, D.A. Deep Learning-Based Automated Image Segmentation for Concrete Petrographic Analysis. Cem. Concr. Res. 2020, 135, 106118. [Google Scholar] [CrossRef]
  69. EN 480-11:2008; Admixtures for Concrete, Mortar and Grout–Test Methods–Part 11: Determination of Air Void Characteristics in Hardened Concrete. European Committee for Standardization (CEN): Brussels, Belgium, 2008.
  70. Newlon, H.; Mitchell, T.M. Freezing and Thawing. In Significance of Test and Properties of Concrete and Concrete-Making Materials; Klieger, P., Lamond, J.F., Eds.; ASTM Publication: West Conshohocken, PA, USA, 1994. [Google Scholar]
  71. ACI Committee 201; Guide to durable concrete. ACI J. 1979, 74, 573–582.
  72. Material Specification for Concrete-Materials and Production, Metric; Ontario Provincial Standard Specification: Brampton, ON, Canada, 2014; OPSS.PROV 1350.
  73. Glinicki, M.A.; Jaskulski, R.; Dąbrowski, M. Design principles and testing of internal frost resistance of concrete for road structures–critical review. Roads Bridges -Drog. I Mosty 2016, 15, 21–43. [Google Scholar] [CrossRef]
  74. Wawrzenczyk, J.; Molendowska, A.; Kłak, A. Relationship between porosity characteristics and concrete frost durability in bridges. Struct. Environ. 2012, 4, 28–34. [Google Scholar]
  75. Glinicki, M.A. European requirements for air-entrained concrete in the XF class environment. Drogownictwo 2005, 3, 86–88. (In Polish) [Google Scholar]
  76. Wawrzeńczyk, J.; Kowalczyk, H. Simplified Method of Estimating the A300 Micropore Content in Air-Entrained Concrete. Materials 2023, 16, 2752. [Google Scholar] [CrossRef]
  77. Molendowska, A.; Wawrzeńczyk, J.; Kowalczyk, H. Development of the Measuring Techniques for Estimating the Air Void System Parameters in Concrete Using 2D Analysis Method. Materials 2020, 13, 428. [Google Scholar] [CrossRef] [PubMed]
  78. Li, B.; Wei, D.; Zhou, Y.; Huang, Y.; Tie, B.; Lei, M. Mechanisms of Arsenate and Cadmium Co-immobilized on Ferrihydrite Inferred from Ternary Surface Configuration. Chem. Eng. J. 2021, 424, 130410. [Google Scholar] [CrossRef]
  79. Zalegowski, K.; Piotrowski, T.; Garbacz, A.; Adamczewski, G. Relation between microstructure, technical properties and neutron radiation shielding efficiency of concrete. Constr. Build. Mater. 2020, 235, 117389. [Google Scholar] [CrossRef]
  80. Zalegowski, K.; Garbacz, A. Analiza ilościowa mikrostruktury betonu (The quantitative image analysis of concrete microstructure). Inżynieria I Bud. 2016, 75, 417–424. [Google Scholar]
  81. Fonesca, P.C.; Scherer, G.W. An image analysis procedure to quantify the air void system of mortar and concrete. Mater. Struct. 2015, 48, 3087–3098. [Google Scholar] [CrossRef]
  82. Michałek, J.; Sobótka, M. Assessment of Internal Structure of Spun Concrete Using Image Analysis and Physicochemical Methods. Materials 2020, 13, 3987. [Google Scholar] [CrossRef]
  83. PN-B-06265:2018-10/Ap1:2019-05; Concrete–Specification, Performance, Production and Conformity–NATIONAL Annex to PN-EN 206+A1:2016-12. Polish Committee for Standardization: Warsaw, Poland, 2019.
  84. EN 206+A2:2021; Concrete–Specification, Performance, Production and Conformity. European Committee for Standardization: Brussels, Belgium, 2021.
  85. Zalegowski, K. Ultrasonic Quality Assessment of Polymer-Cement Concrete with PET Waste as the Aggregate. Arch. Civ. Eng. 2018, 64, 67–77. [Google Scholar] [CrossRef]
  86. Moura, M.A.d.N.; Moreno Junior, A.L.; Ferreira, G.C.d.S. Ultrasonic Testing on Evaluation of Concrete Residual Compressive Strength: A Review. Constr. Build. Mater. 2023, 373, 130887. [Google Scholar] [CrossRef]
  87. Lemus, R.M.; Ruiz, R.O.; Castellanos, E.N. Correlation between Compressive Strength of Concrete and Ultrasonic Pulse Velocity: A Case of Study and a New Correlation Method. Constr. Build. Mater. 2023, 369, 130569. [Google Scholar] [CrossRef]
  88. Rao, S.K.; Sravana, P.; Rao, T.C. Relationship between Ultrasonic Pulse Velocity and Compressive Strength for Roller Compacted Concrete Containing GGBS. Int. J. Appl. Eng. Res. 2016, 11, 2077–2084. [Google Scholar]
  89. Lencis, U.; Udris, A.; Kara De Maeijer, P.; Korjakins, A. Methodology for Determining the Correct Ultrasonic Pulse Velocity in Concrete. Buildings 2024, 14, 720. [Google Scholar] [CrossRef]
  90. Hasannejad, M.; Berenjian, J.; Pouraminian, M.; Larijani, A.S. Studying of microstructure, interface transition zone and ultrasonic wave velocity of high strength concrete by different aggregates. J. Build. Pathol. Rehabil. 2022, 7, 9. [Google Scholar] [CrossRef]
  91. Chryso Official Website. Available online: https://www.chryso.pl (accessed on 20 February 2025).
  92. EN 12350-2:2019; Testing Fresh Concrete–Part 2: Slump Test. European Committee for Standardization: Brussels, Belgium, 2019.
  93. EN 12350-7:2019; Testing Fresh Concrete–Part 7: Air Content–Pressure Method. European Committee for Standardization: Brussels, Belgium, 2019.
  94. EN 12390-2:2019; Testing Hardened Concrete–Part 2: Making and Curing Specimens for Strength Tests. European Committee for Standardization: Brussels, Belgium, 2019.
  95. EN 12504-4:2004; Testing Concrete in Structures–Part 4: Determination of Ultrasonic Pulse Velocity. European Committee for Standardization: Brussels, Belgium, 2004.
  96. Gundersen, H.J.G.; Jensen, E.B. The efficiency of systematic sampling in stereology and its prediction. J. Microsc. 1987, 147, 229–263. [Google Scholar] [CrossRef]
  97. Saltykov, S.A. Stereological Parameters of the Structure and Properties of Alloys. Metall. Sci. Heat Treat. 1972, 14, 1082–1085. [Google Scholar] [CrossRef]
  98. Metcalfe, A.; Green, D.; Greenfield, T.; Mansor, M.; Smith, A.; Tuke, J. Statistics in Engineering: With Examples in MATLAB® and R, 2nd ed.; Chapman and Hall/CRC: Boca Raton, FL, USA, 2019. [Google Scholar] [CrossRef]
  99. Puthipad, N.; Suchi, M.; Rath, S.; Attachaiyawuth, A. Enhanced entrainment of fine air bubbles in self-compacting concrete with high volume of fly ash using defoaming agent for improved entrained air stability and higher aggregate content. Constr. Build. Mater. 2017, 144, 1–12. [Google Scholar] [CrossRef]
  100. Chia, K.H.; Zhang, M.H. Workability of air-entrained lightweight concrete from rheology perspective. Mag. Concr. Res. 2007, 59, 367–375. [Google Scholar] [CrossRef]
  101. American Concrete Institute. ACI PRC-212.3-16: Report on Chemical Admixtures for Concrete; ACI: Farmington Hills, MI, USA, 2016. [Google Scholar]
  102. Al-Jabari, M. 1-Introduction to Concrete Chemistry. In Integral Waterproofing of Concrete Structures Advanced Protection Technologies of Concrete by Pore Blocking and Lining; Woodhead Publishing: Cambridge, UK, 2022. [Google Scholar] [CrossRef]
  103. Gao, H.; Zhang, X.; Zhang, Y. Effect of the Entrained Air Void on Strength and Interfacial Transition Zone of Air-Entrained Mortar. J. Wuhan Univ. Technol. Mater. Sci. Ed. 2015, 30, 1020–1028. [Google Scholar] [CrossRef]
  104. Emamian, S.A.; Eskandari-Naddaf, H. Effect of Porosity on Predicting Compressive and Flexural Strength of Cement Mortar Containing Micro and Nano-Silica by ANN and GEP. Constr. Build. Mater. 2019, 218, 8–27. [Google Scholar] [CrossRef]
  105. Sánchez-Mendieta, C.; Galán-Díaz, J.J.; Martinez-Lage, I. Relationships between Density, Porosity, Compressive Strength and Permeability in Porous Concretes: Optimization of Properties through Control of the Water-Cement Ratio and Aggregate Type. J. Build. Eng. 2024, 97, 110858. [Google Scholar] [CrossRef]
  106. Soutsos, M.N.; Domone, P.L.; Halliwell, S.M. Ultrasonic Pulse Velocity Evaluation of Cementitious Materials. In Non-Destructive Testing Methods and New Applications; Eissa, M.E., Ed.; InTech: Rijeka, Croatia, 2012. [Google Scholar] [CrossRef]
  107. Benaicha, M.; Jalbaud, O.; Burtschell, Y. Ultrasonic Characterization and Mechanical Performance of Self-Compacting Concrete in Fresh and Hardened States. Ultrasonics 2025, 152, 107657. [Google Scholar] [CrossRef] [PubMed]
  108. Benaicha, M.; Jalbaud, O.; Hafidi Alaoui, A.; Burtschell, Y. Porosity Effects on Rheological and Mechanical Behavior of Self-Compacting Concrete. J. Build. Eng. 2022, 48, 103964. [Google Scholar] [CrossRef]
  109. Li, M.; Lai, Y.; Ma, D.; Wang, J.; Xu, L.; Gao, Z.; Liu, Y.; Li, L.; Guo, Y.; Zheng, L.; et al. Influence of Combined Air-Entraining Superplasticizer and Surface Treatments on Airport Pavement Concrete against Salt Freezing. Coatings 2023, 13, 372. [Google Scholar] [CrossRef]
  110. Liu, Q.; Chen, Z.; Yang, Y. Study of the Air-Entraining Behavior Based on the Interactions between Cement Particles and Selected Cationic, Anionic and Nonionic Surfactants. Materials 2020, 13, 3514. [Google Scholar] [CrossRef] [PubMed]
  111. Huang, C.; Zhang, Y.; Wang, Y.; Zhang, Y.; Wang, Y. The Effectiveness of Different Additives on Concrete’s Freeze–Thaw Resistance. Materials 2023, 18, 978. [Google Scholar] [CrossRef]
  112. Góra, J.; Grzegorczyk-Frańczak, M. Frost Resistance of Concretes with Low-Clinker Cements Depending on Curing Time. Adv. Sci. Technol. Res. J. 2024, 18, 406–421. [Google Scholar] [CrossRef]
  113. Vu, V.H.; Tran, B.V.; Hoang, V.H.; Nguyen, T.H.G. The Effect of Porosity on the Elastic Modulus and Strength of Pervious Concrete. In Modern Mechanics and Applications; Tien Khiem, N., Van Lien, T., Xuan Hung, N., Eds.; Lecture Notes in Mechanical Engineering; Springer: Singapore, 2022. [Google Scholar] [CrossRef]
  114. Kim, W.; Jeong, K.; Choi, H.; Lee, T. Correlation analysis of ultrasonic pulse velocity and mechanical properties of normal aggregate and lightweight aggregate concretes in 30–60 MPa range. Materials 2022, 15, 2952. [Google Scholar] [CrossRef]
Figure 1. The granulation curve of aggregate used in the study.
Materials 18 02885 g001
Figure 2. Scheme of ultrasonic measurements.
Materials 18 02885 g002
Figure 3. The scheme of image binarization with a global threshold; on the left—output image, on the right—image after segmentation.
Materials 18 02885 g003
Figure 4. Hypothetical microstructure of concrete containing aggregate grains, pores, and cracks: (a) three-dimensional sample with marked cross-section A–A, (b) two-dimensional sample cross-section [79].
Materials 18 02885 g004
Figure 5. Scheme of sample cutting for computer image analysis.
Materials 18 02885 g005
Figure 6. Scheme of image preparation for computer image analysis: (a) recorded image; (b) processed image; (c) binarized image of pore structure.
Materials 18 02885 g006
Figure 7. The scheme of the experimental program.
Materials 18 02885 g007
Figure 8. The influence of the air-entraining admixture on the: (a) compressive strength, (b) ultrasonic pulse velocity.
Materials 18 02885 g008
Figure 9. Relation between compressive strength and ultrasonic pulse velocity.
Materials 18 02885 g009
Figure 10. The influence of the air-entraining admixture content on the freeze–thaw resistance.
Materials 18 02885 g010
Figure 11. Classification of surface damages after freeze–thaw cycles. Scale of damages: A—lack of damages, B—minor cracks (a), C—severe cracking (b), and D—cracking and spalling (c).
Materials 18 02885 g011
Figure 12. The influence of the air-entraining admixture dosage on the pore structure.
Materials 18 02885 g012
Figure 13. The relation between the content of pores in different size ranges and the specific surface area.
Materials 18 02885 g013
Figure 14. The relation between the content of pores in different size ranges and the spacing factor.
Materials 18 02885 g014
Figure 15. Results of linear regression analysis between fc and following explanatory variables: (a) A, (b) AC, (c) A300, (d) A1000, (e) AMAX, (f) L ¯ , (g) α.
Materials 18 02885 g015
Figure 16. Results of linear regression analysis between UPV and following explanatory variables: (a) A, (b) AC, (c) A300, (d) A1000, (e) AMAX, (f) L ¯ , (g) α.
Materials 18 02885 g016
Figure 17. Results of linear regression analysis between Δfc and following explanatory variables: (a) A, (b) AC, (c) A300, (d) A1000, (e) AMAX, (f) L ¯ , (g) α.
Materials 18 02885 g017
Table 1. Characteristics of air-entraining admixture [91].
CharacteristicContent [%]
FormLiquid
ColorStraw yellow
Density1.003 ± 0.01 kg/dm3
pH7 ± 1
Chloride ion content≤0.1%
Alkali content≤1.0%
Table 2. The composition of concretes tested in the study.
SymbolIngredients
Cement [kg]Water [kg]Aggregate [kg]Air-Entering Admixture [% of Cement Mass]
N032017719050.00
N10.04
N20.20
N31.50
Table 3. Consistency classes according to slump test method [92].
ClassSlump Flow [mm]
S110–40
S250–90
S3100–150
S4160–210
S5≥220
Table 4. The fundamental parameters used to describe objects in a material’s cross-section and throughout its volume.
ParameterDefinition
AASurface area of objects related to an image area
LALine length related to an image area
NANumber of objects related to an image area
VVVolume fraction of the selected objects in a volume unit of a material
SVSurface area of selected objects in a volume unit of a material
LVLine length in a volume unit of a material
NVNumber of elected objects in a volume of a material
Table 5. Summary of parameters obtained for tested concretes by image analysis method.
ParameterShort Description
AVolume fraction of pores across full range of pore sizes
A300Volume fraction of pores of sizes below 0.3 mm
αSpecific surface area of pores across full range of pore sizes
L ¯ Average maximum distance from any point in cement paste to edge of nearest pore
A1000Volume fraction of pores of sizes between 0.3 mm and 1.0 mm
AMAXVolume fraction of pores of sizes above 1.0 mm
ACVolume fraction of pores across full range of pore sizes,
excluding volume of coarse aggregate
Table 6. Summary of conducted tests and samples used for each composition.
TestSample Size (mm3)No. of Samples
Freeze–thaw resistance100 × 100 × 10012
Compressive strength100 × 100 × 1003
Ultrasonic pulse velocity100 × 100 × 1003
Pore structure, i.e., air contents,
specific surface area, spacing factor
75 × 75 × 103
Table 7. Air content (AC) and consistency (ST) of concrete mixes.
SampleAEA [%]AC [%]ST [mm]
N00.002.660
N10.042.990
N20.205.9180
N31.509.4210
AEA—Air-entraining admixture content [%].
Table 8. Compressive strength (fc) and ultrasonic pulse velocity (UPV) of concretes.
SampleAEA [%]fc [MPa]UPV [m/s]
N00.0041.0 ± 2.24052 ± 48
N10.0437.4 ± 2.74043 ± 59
N20.2030.0 ± 0.93916 ± 86
N31.5020.6 ± 1.83735 ± 76
AEA—Air-entraining admixture content [%].
Table 9. The air content and consistency of concrete mixes.
SampleAEA [%]Δm [%]Δfc [%]
N00.000.225.4
N10.040.123.5
N20.200.115.3
N31.500.310.8
AEA—Air-entraining admixture content [%].
Table 10. Results of quantitative analysis of microstructure described by stereological parameters.
SampleAEA [%]A [%]AC [%]A300 [%]A1000 [%]AMAX [%]α [mm−1] L ¯ [mm]
N00.004.32 ± 0.548.06 ± 0.670.53 ± 0.101.46 ± 0.221.78 ± 0.0912.45 ± 0.530.41 ± 0.02
N10.044.93 ± 0.147.81 ± 0.630.85 ± 0.122.50 ± 0.081.46 ± 0.1614.65 ± 0.980.32 ± 0.05
N20.208.24 ± 0.3916.59 ± 1.212.16 ± 0.25 4.33 ± 0.342.38 ± 0.1815.97 ± 0.470.18 ± 0.02
N31.5011.73 ± 0.2419.13 ± 1.013.31 ± 0.215.04 ± 0.152.08 ± 0.2422.45 ± 0.970.12 ± 0.01
AEA—Air-entraining admixture content [%].
Table 11. Results of multiple regression analysis for variable A1000 (step 1).
N = 4Dependent variable—fc
R = 0.9994; p < 0.0006; SEE = 0.3901
fc = 46.55 − 1.00 × A1000
βSD βBSD Bp
A1000−0.99940.0249−3.90410.0976<0.0001
Constant 46.54920.40720.0006
Table 12. Results of multiple regression analysis for variable A1000 and A300 (step 2).
N = 4Dependent variable—fc
R = 0.9999; p < 0.0001; SEE = 0.0022
fc = 47.93 − 6.37 × A1000 + 4.47 × A300
βSD βBSD Bp
A1000−1.63040.0026−6.36910.0100<0.0001
A3000.63190.00264.46640.01810.0026
Constant 47.93300.0061<0.0001
Table 13. Results of multiple regression analysis for variable A (step 1).
N = 4Dependent variable—UPV
R = 0.9946; p < 0.0054; SEE = 18.8740
UPV = 25.13 − 3.19 × A
βSD βBSD Bp
A−0.9946A−0.9946A−0.9946
Constant Constant Constant
Table 14. Results of multiple regression analysis for variable A and A300 (step 2).
N = 4Dependent variable—UPV
R = 0.9999; p < 0.0027; SEE = 0.6939
UPV = 4453.98 − 117.89 × A + 200.75 × A300
βSD βBSD Bp
A−2.7220A−2.7220A−2.7220
A3001.7305A3001.7305A3001.7305
Constant Constant Constant
Table 15. Results of multiple regression analysis for variable A300 (step 1).
N = 4Dependent variable—Δfc
R = 0.9945; p < 0.0055; SEE = 0.8779
Δfc = 27.81 − 5.33 × A300
βSD βBSD Bp
A300−0.9945A300−0.9945A300−0.9945
Constant 27.81490.80940.0008
Disclaimer/Publisher’s Note: The statements, opinions and data contained in all publications are solely those of the individual author(s) and contributor(s) and not of MDPI and/or the editor(s). MDPI and/or the editor(s) disclaim responsibility for any injury to people or property resulting from any ideas, methods, instructions or products referred to in the content.

