
Searching Optimum Self-Brazing Powder Mixtures Intended for Use in Powder Metallurgy Diamond Tools—A Statistical Approach


Abstract
1. Introduction
2. Experimental
- (a)
- Carbonyl iron (FSSS = 6.5 μm);
- (b)
- Carbonyl nickel (grade T123, FSSS = 5.4 μm);
- (c)
- Atomised bronze containing 20% (B20, particle size < 53 μm), 15% (B15, particle size < 45 μm), and 10% (B10, particle size < 45 μm) of tin;
- (d)
- Atomised copper (grade LT16, particle size < 45 μm);
- (e)
- Carbonyl ferrophosphorus containing 9% of P (Fe-P, D50 = 6 μm);
- (f)
- Ferrophosphorus containing 15.6% of P (Fe3P, D50 = 8 μm).
3. Results
4. Discussion
Author Contributions
Funding
Institutional Review Board Statement
Informed Consent Statement
Data Availability Statement
Acknowledgments
Conflicts of Interest
References
- Konstanty, J. Powder Metallurgy Diamond Tools; Elsevier: Amsterdam, The Netherlands, 2005. [Google Scholar]
- Konstanty, J. Applications of powder metallurgy to cutting tools. In Advances in Powder Metallurgy: Properties, Processing and Applications; Woodhead Publishing: Sawston, UK, 2013; pp. 555–585. [Google Scholar]
- Yu, Y.Q.; Tie, X.R.; Zhang, G.Q.; Huang, G.Q.; Huang, H.; Xu, X.P. Comparison of brazed and sintered diamond tools for grinding of stone. Mater. Res. Innov. 2014, 18, S2-869–S2-873. [Google Scholar] [CrossRef]
- Luo, X.; Ma, H.; Huang, M.; Tang, M. Research and application of cobalt-substitute prealloy powder for diamond tools. Diam. Abras. Eng. 2006, 26, 18–24. [Google Scholar]
- Liu, Z.; Yan, Z.; Chen, F.; Wang, S.; Long, Y.; Wu, Y. Fabrication and Performance Characterization of Cu-10Sn-xNi Alloy for Diamond Tools. Acta Metall. Sin. 2020, 56, 760–768. [Google Scholar]
- Cao, X.; Bao, L.; Li, Z.; Cheng, C.; Chen, P.; Pan, J.; Yu, Q.; Yu, X. Effect of sintering process on properties of CuSnZn alloy powder. Diam. Abras. Eng. 2024, 44, 449–455. [Google Scholar]
- Zhong, S.-J.; Long, W.-M.; Cheng, Y.-F. Brazing technology of effectively improve diamond tools life and cutting efficiency. Mater. Sci. Technol. 2009, 17, 222–225. [Google Scholar]
- Fang, Y.; Luo, X.; Li, X. Development of pre-alloyed powders for diamond tools and their characteristics. In Materials Science Forum; Trans Tech Publications Ltd.: Bäch, Switzerland, 2007; Volume 539–543, pp. 2675–2680. [Google Scholar]
- Loladze, N.T.; Tserodze, M.P.; Avalishvili, Z.A.; Dzidzishvili, I.G. Features of the Sintering of Fe–Cu–Sn–Ni and Cu–Ti–Sn–Ni Powders during Hot Pressing. Powder Metall. Met. Ceram. 2021, 60, 377–384. [Google Scholar] [CrossRef]
- Polvorosa, N.G.; Peña, G.; Luno-Bilbao, C.; Iturriza, I. Effect of the processing conditions on the diamond stability during the production of diamond impregnated tools. In Proceedings of the Euro PM 2018 Congress and Exhibition, Bilbao, Spain, 14–18 October 2018. [Google Scholar]
- Konstanty, J.; Romański, A.; Baczek, E.; Tyrala, D. New wear resistant iron-base matrix materials for the fabrication of sintered diamond tools. Arch. Metall. Mater. 2015, 60, 633–637. [Google Scholar] [CrossRef]
- Konstanty, J.; Romański, A.; Wieczorek-Ciurowa, K.; Sikora, T. Prealloyed Iron-Based Powder, a Method for the Manufacturing and Use Thereof and a Sintered Component. European Patent EP3124634B1, 23 October 2024. [Google Scholar]
- Lingam, D.; Ananthanarayanan, R.; Jeevanantham, A.K.; Seenivasagam, D.R. Optimization methods in powder metallurgy for enhancing the mechanical properties: A systematic literature review. Eng. Res. Express 2024, 6, 022504. [Google Scholar] [CrossRef]
- Abirami Thiruppathi, K.; Raghuraman, S. Investigations on the influence of mechanical behaviour of copper aluminium nickel powder compacts processed through powder metallurgy. In Innovative Design and Development Practices in Aerospace and Automotive Engineering; Lecture Notes in Mechanical Engineering, Part F; Elsevier: Amsterdam, The Netherlands, 2017; Volume 9, pp. 281–292. [Google Scholar]
- Vairamuthu, J.; Kumar, A.S.; Stalin, B.; Ravichandran, M. Optimization of powder metallurgy parameters of tic-and b4c-reinforced aluminium composites by taguchi method. Trans. Can. Soc. Mech. Eng. 2021, 45, 249–261. [Google Scholar] [CrossRef]
- Bhutta, M.R.; Gillani, F.; Zahid, T.; Bibi, S.; Ghafoor, U. Investigation of Hardness and Microanalysis of Sintered Aluminum-Based Supplemented Metal Matrix Machined Composites. Crystals 2023, 13, 1347. [Google Scholar] [CrossRef]
- Chauhan, S.; Verma, V.; Prakash, U.; Tewari, P.C.; Khanduja, D. Analysis of powder metallurgy process parameters for mechanical properties of sintered Fe–Cr–Mo alloy steel. Mater. Manuf. Process. 2017, 32, 537–541. [Google Scholar] [CrossRef]
- ASTM B962-23; Standard Test Methods for Density of Compacted or Sintered Powder Metallurgy (PM) Products Using Archimedes’ Principle. ASTM International: West Conshohocken, PA, USA, 2023.


| No. | Mixture | Mixture Composition | Chemical Composition | |||||||||||
|---|---|---|---|---|---|---|---|---|---|---|---|---|---|---|
| FeCN | Fe-P | Fe3P | B20 | B15 | B10 | Ni | Cu | Fe | Cu | Sn | Ni | P | ||
| M1 | 31FeCN + 25B15 + 15FeP + 20Cu + 9Ni | 31 | 15 | - | - | 25 | - | - | 20 | 44.6 | 41.3 | 3.8 | 9.0 | 1.3 |
| M2 | 31FeCN + 27B15 + 18Cu + 15FeP + 9Ni | 31 | 15 | - | - | 27 | - | - | 18 | 44.6 | 41.0 | 4.1 | 9.0 | 1.3 |
| M3 | 40B20 + 27.6FeCN + 22.4FeP + 10Cu | 27.6 | 22.4 | - | 40 | - | - | - | 10 | 48.0 | 42.0 | 8.0 | - | 2.0 |
| M4 | 40FeCN + 30Cu + 20B15 + 10FeP | 40 | 10 | - | - | 20 | - | - | 30 | 49.1 | 47.0 | 3.0 | - | 0.9 |
| M5 | 39FeCN + 20B20 + 20Cu + 12Fe3P + 9Ni | 39 | - | 12 | 20 | - | - | 9 | 20 | 49.1 | 36.0 | 4.0 | 9.0 | 1.9 |
| M6 | 31FeCN + 20B20 + 20FeP + 20Cu + 9Ni | 31 | 20 | - | 20 | - | - | 9 | 20 | 49.2 | 36.0 | 4.0 | 9.0 | 1.8 |
| M7 | 31FeCN + 25B15 + 20FeP + 15Cu + 9Ni | 31 | 20 | - | - | 25 | - | 9 | 15 | 49.2 | 36.3 | 3.8 | 9.0 | 1.8 |
| M8 | 40B15 + 32FeCN + 19FeP + 9Ni | 32 | 19 | - | - | 40 | - | 9 | - | 49.3 | 34.0 | 6.0 | 9.0 | 1.7 |
| M9 | 34FeCN + 25B20 + 17FeP + 15Cu + 9Ni | 34 | 17 | - | 25 | - | - | 9 | 15 | 49.5 | 35.0 | 5.0 | 9.0 | 1.5 |
| M10 | 41.5FeCN + 25B20 + 15Cu + 9.5Fe3P + 9Ni | 41.5 | - | 9.5 | 25 | - | - | 9 | 15 | 49.5 | 35.0 | 5.0 | 9.0 | 1.5 |
| M11 | 39B10 + 33FeCN + 19FeP + 9Ni | 33 | 19 | - | - | - | 39 | 9 | - | 50.3 | 35.1 | 3.9 | 9.0 | 1.7 |
| M12 | 40FeP + 35B20 + 15FeCN + 10Ni | 15 | 40 | - | 35 | - | - | 10 | - | 51.4 | 28.0 | 7.0 | 10.0 | 3.6 |
| M13 | 35FeCN + 35B20 + 20FeP + 10Ni | 35 | 20 | - | 35 | - | - | 10 | - | 53.2 | 28.0 | 7.0 | 10.0 | 1.8 |
| M14 | 37FeCN + 35B15 + 19FeP + 9Ni | 37 | 19 | - | - | 35 | - | 9 | - | 54.3 | 29.8 | 5.3 | 9.0 | 1.7 |
| M15 | 43FeCN + 35B20 + 15FeP + 7Ni | 43 | 15 | - | 35 | - | - | 7 | - | 56.7 | 28.0 | 7.0 | 7.0 | 1.3 |
| M16 | 35FeP + 30B20 + 25FeCN + 10Ni | 25 | 35 | - | 30 | - | - | 10 | - | 56.9 | 24.0 | 6.0 | 10.0 | 3.2 |
| M17 | 45FeCN + 35B15 + 15FeP + 5Cu | 45 | 15 | - | - | 35 | - | - | 5 | 58.7 | 34.8 | 5.3 | - | 1.3 |
| M18 | 53FeCN + 35B15 + 7Fe3P + 5Ni | 53 | - | 7 | - | 35 | - | 5 | - | 58.9 | 29.8 | 5.3 | 5.0 | 1.1 |
| M19 | 57FeCN + 25B20 + 10Ni + 8Fe3P | 57 | - | 8 | 25 | - | - | 10 | - | 63.8 | 20.0 | 5.0 | 10.0 | 1.2 |
| M20 | 65.5FeCN + 20B20 + 6.5Fe3P + 5Cu + 3Ni | 65.5 | - | 6.5 | 20 | - | - | 3 | 5 | 71.0 | 21.0 | 4.0 | 3.0 | 1.0 |
| M21 | 61FeCN = 20B20 + 11FeP + 5Cu + 3Ni | 61 | 11 | - | 20 | - | - | 3 | 5 | 71.0 | 21.0 | 4.0 | 3.0 | 1.0 |
| Material No. | Dimensional Change DL/L0 % | Density g/cm3 | Porosity % * | HV1 ** |
|---|---|---|---|---|
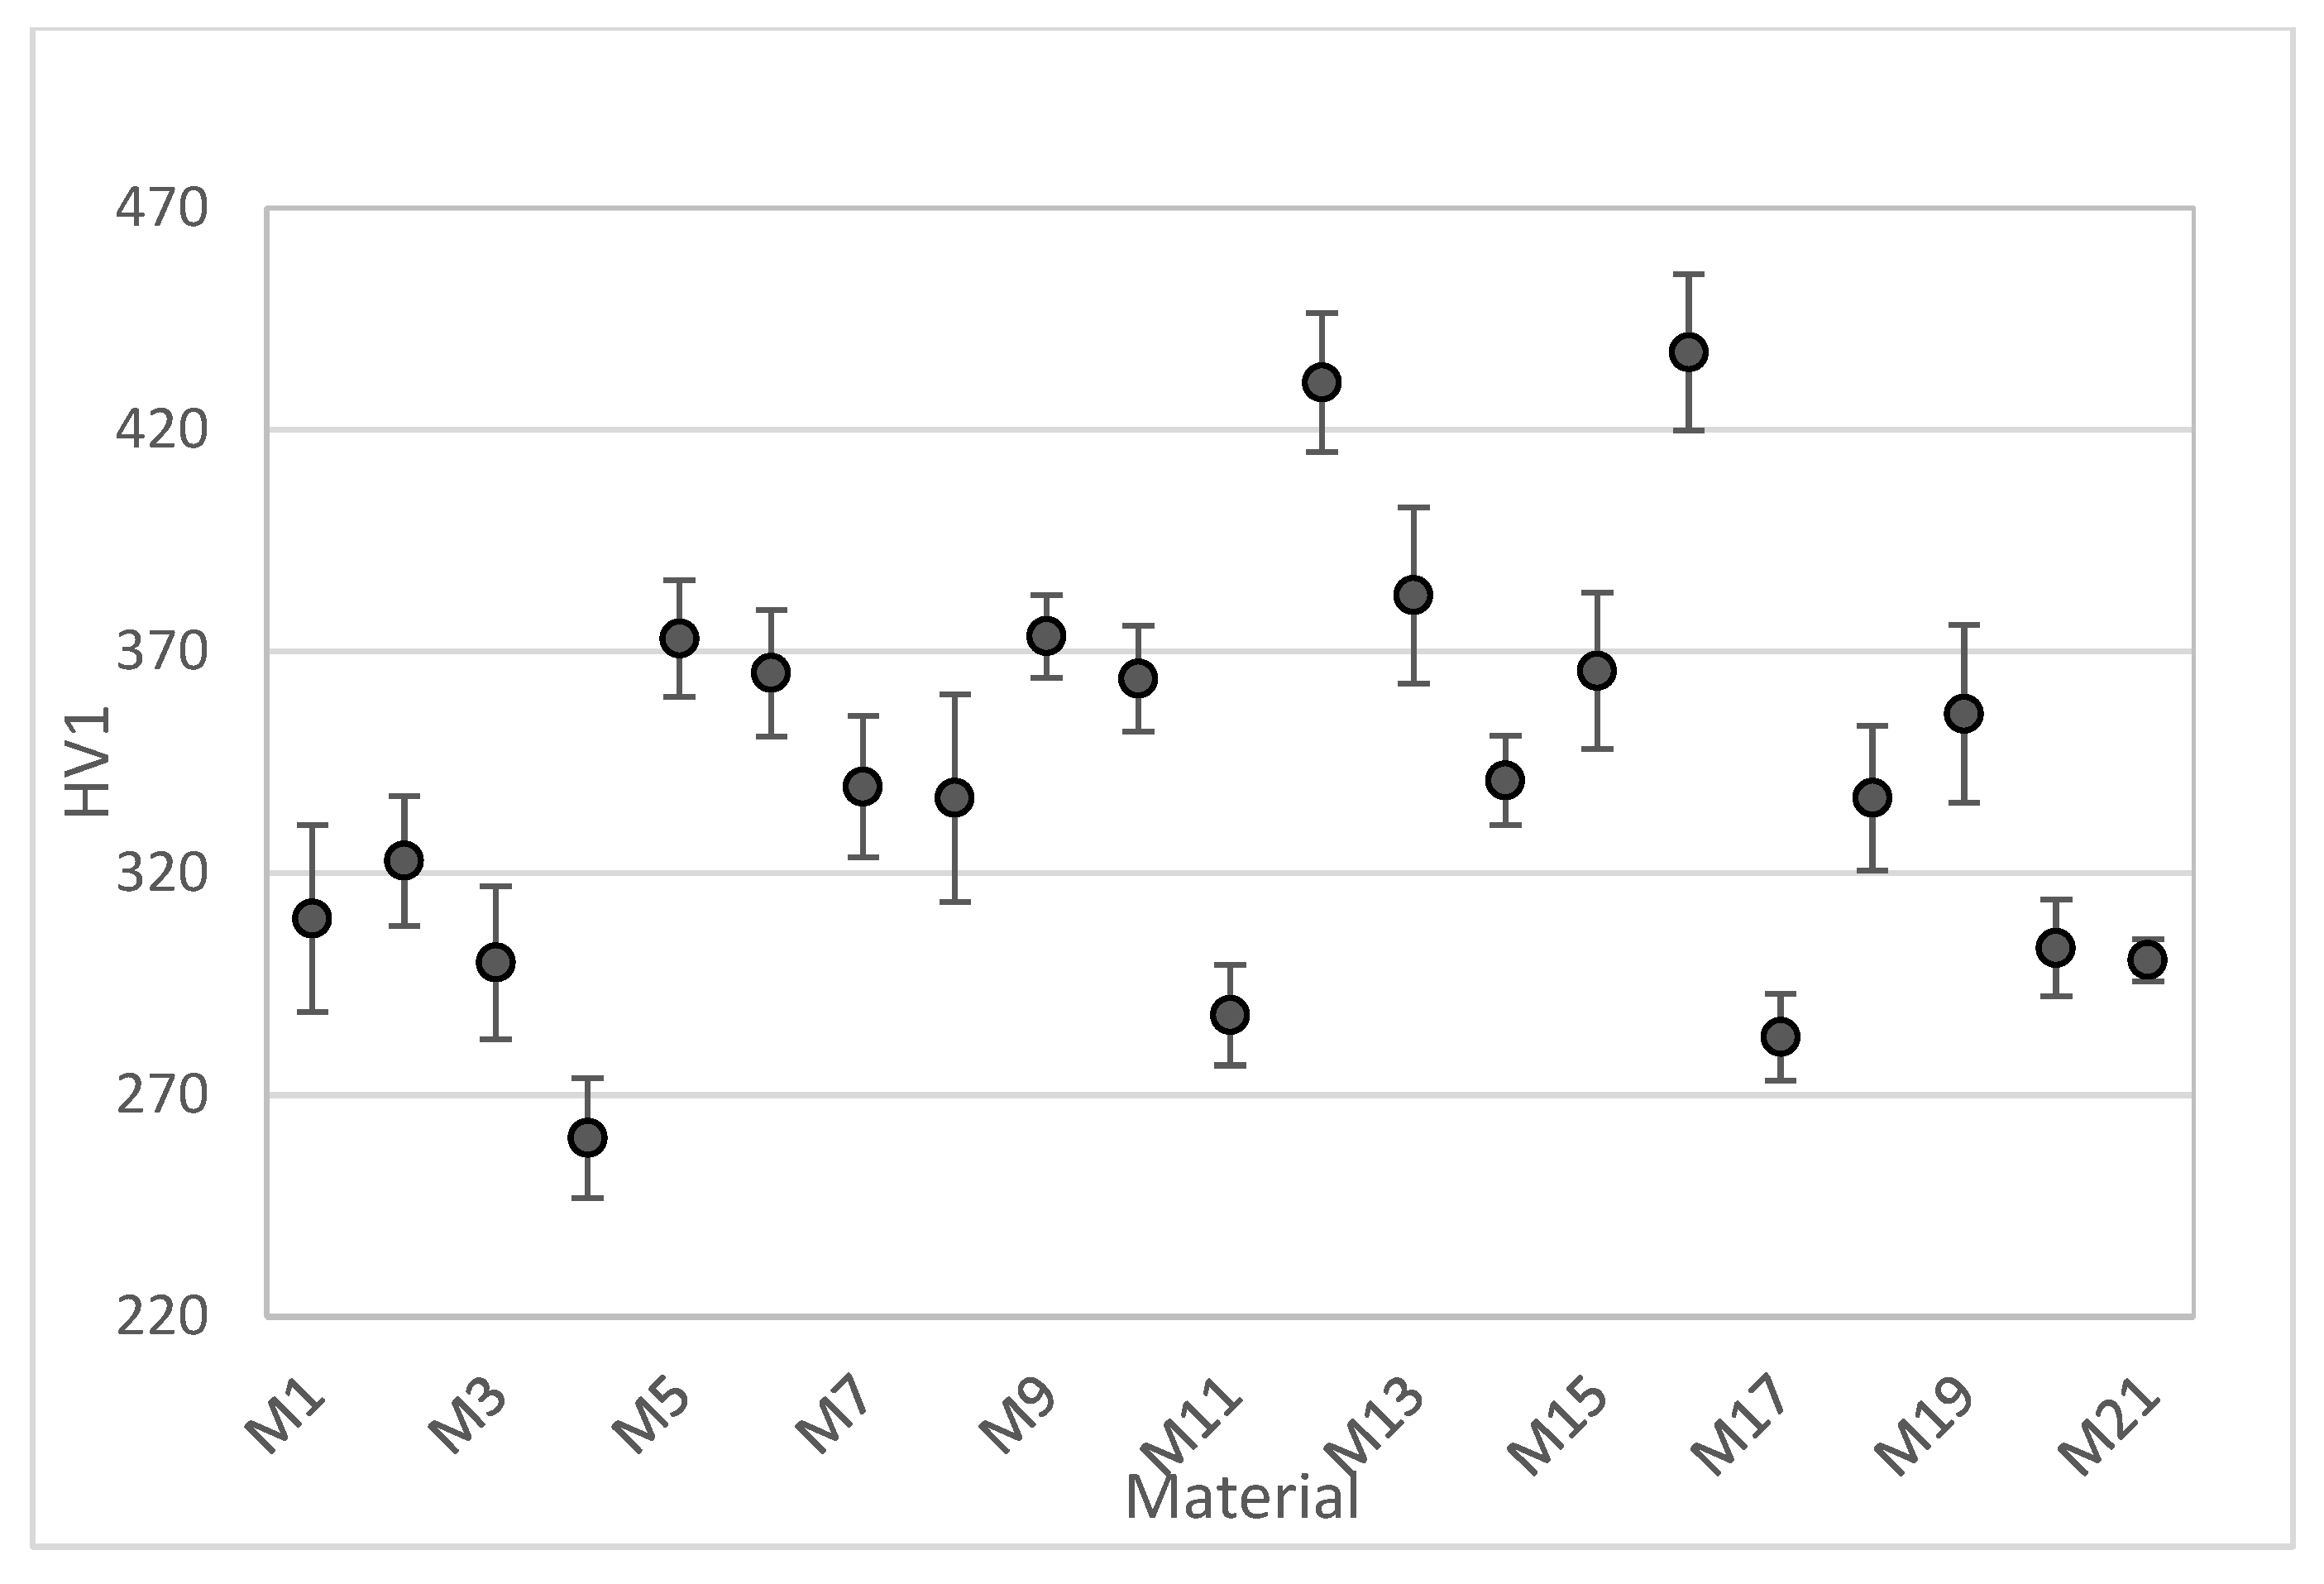
| M1 | −11.44 | 8.15 | 1.46 | 310 ± 67 |
| M2 | −11.67 | 8.14 | 1.60 | 323 ± 46 |
| M3 | −12.81 | 8.18 | 1.19 | 300 ± 55 |
| M4 | −11.45 | 8.16 | 1.10 | 260 ± 43 |
| M5 | −11.42 | 7.98 | 0.79 | 373 ± 41 |
| M6 | −11.91 | 8.14 | 1.13 | 365 ± 45 |
| M7 | −11.49 | 8.12 | 0.40 | 340 ± 50 |
| M8 | −11.89 | 8.10 | 0.71 | 337 ± 74 |
| M9 | −12.35 | 8.11 | 0.60 | 374 ± 29 |
| M10 | −11.61 | 8.01 | 0.57 | 364 ± 38 |
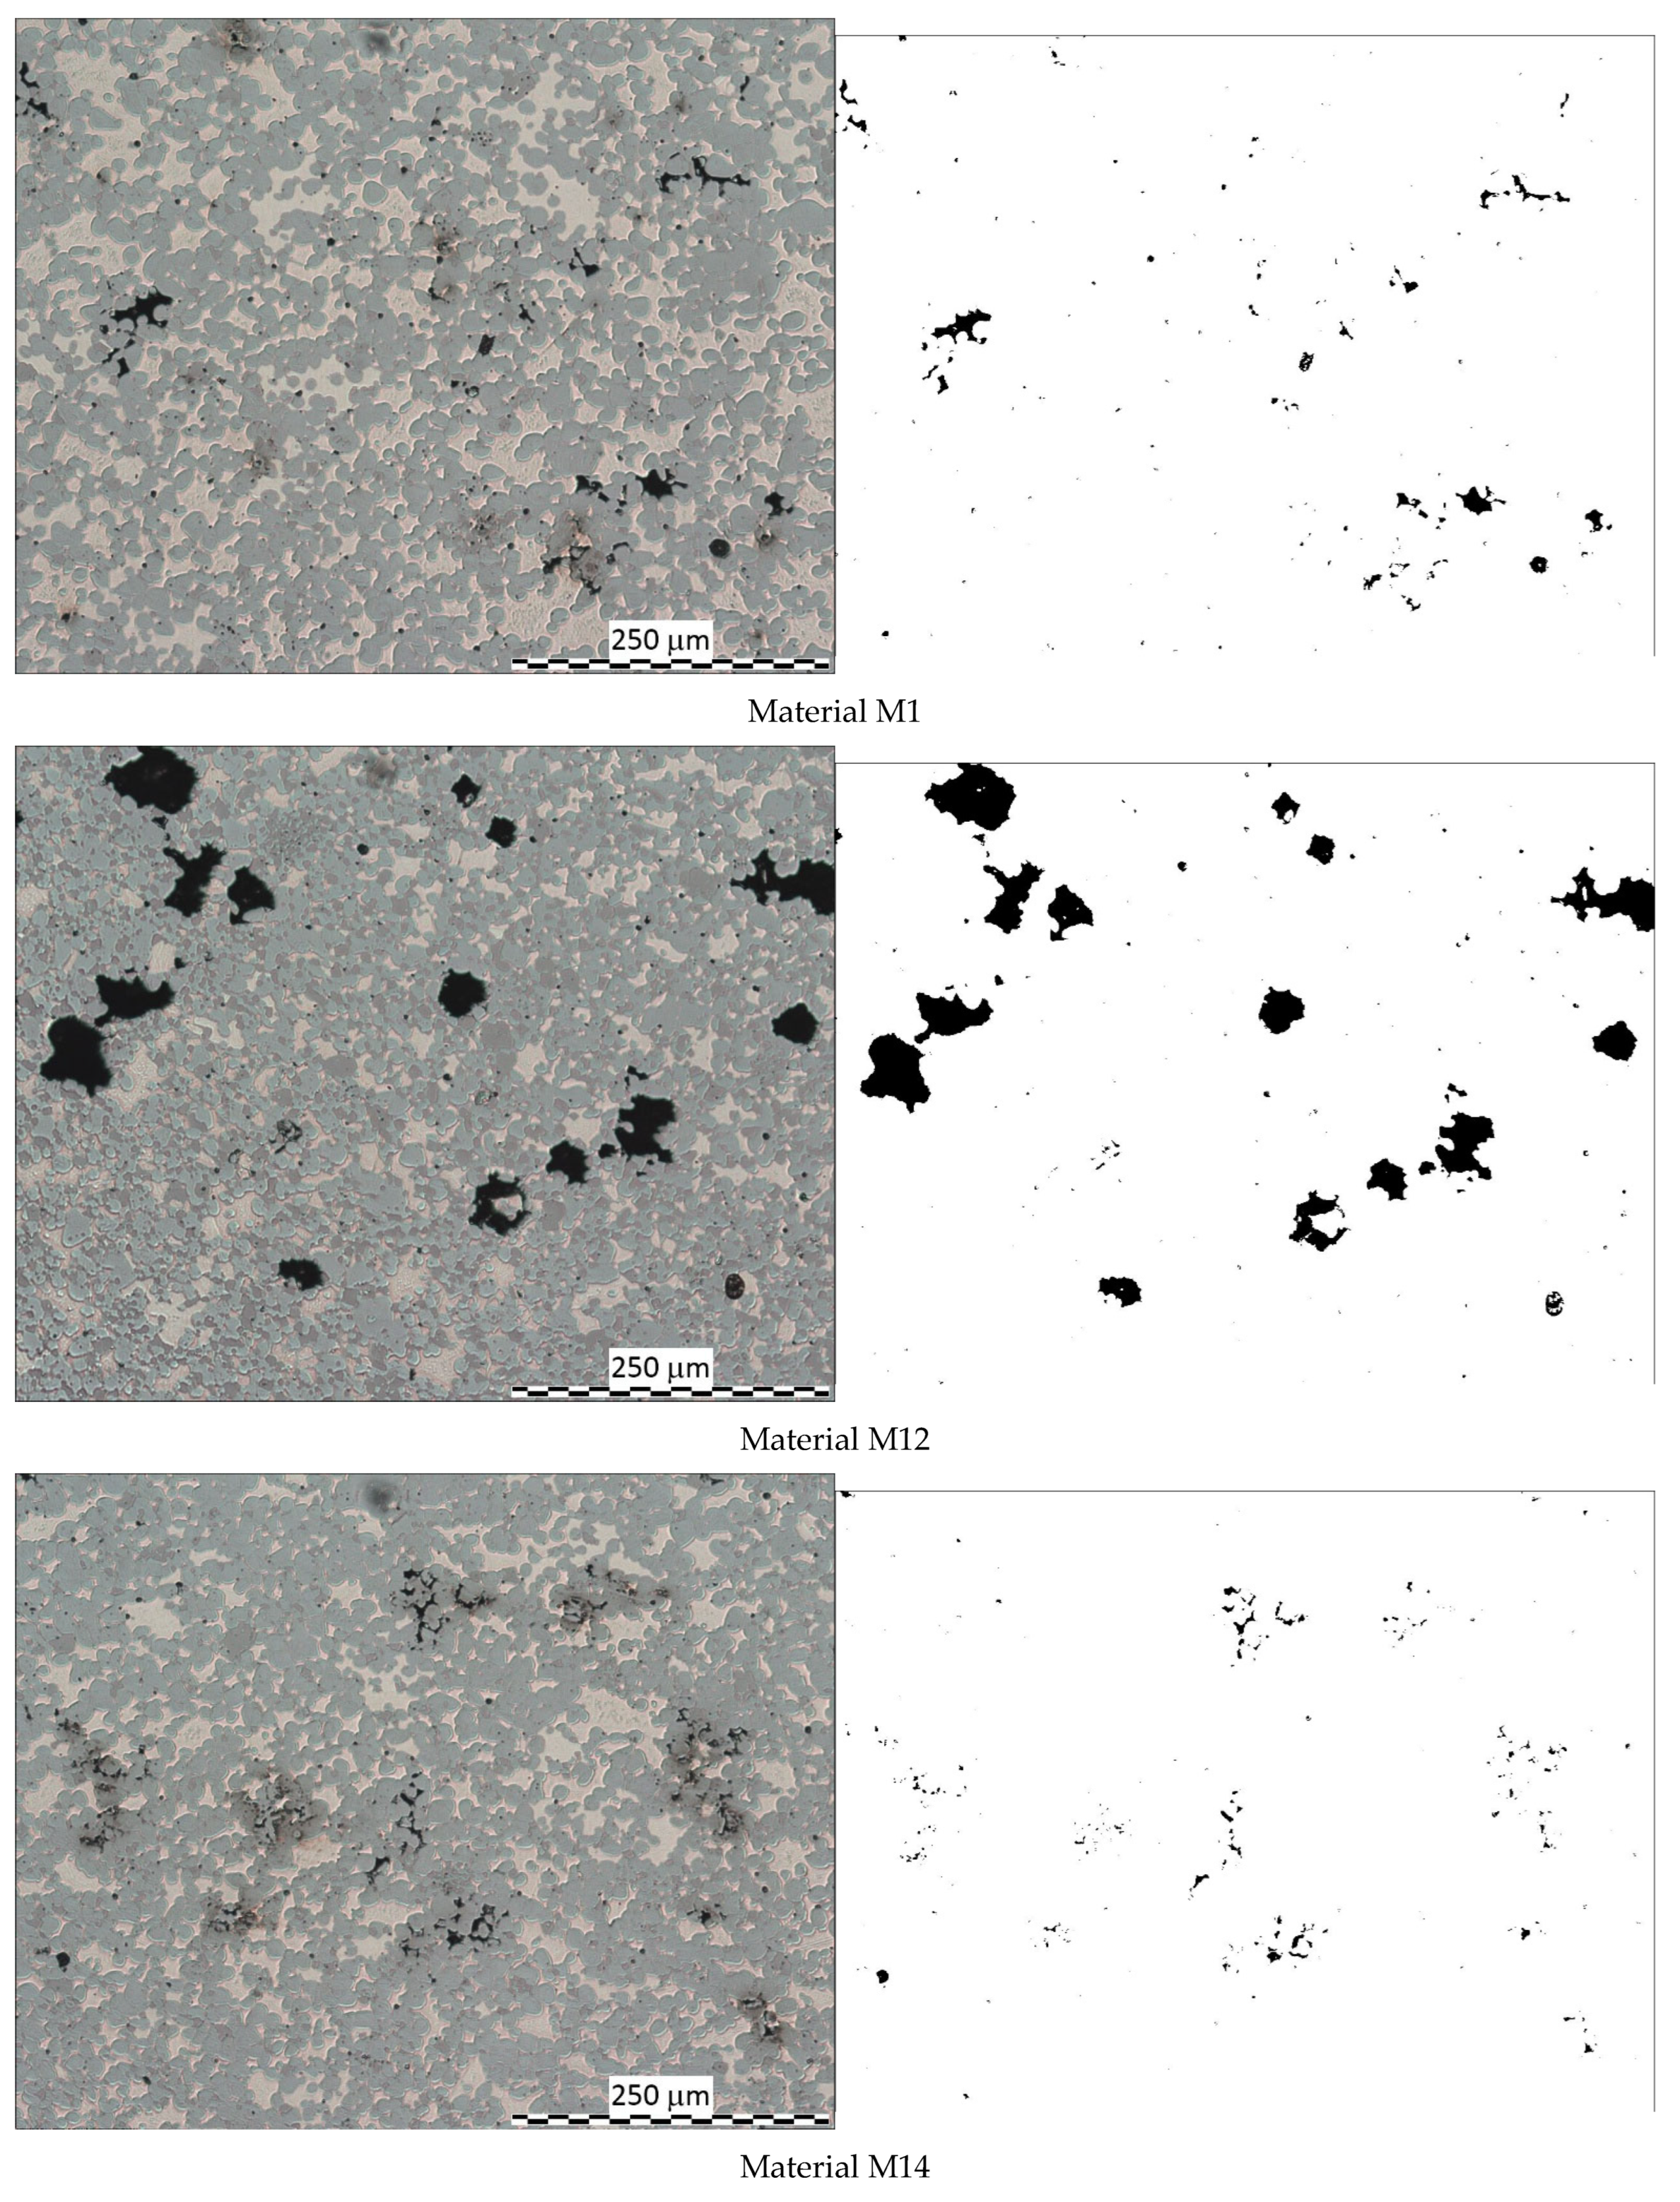
| M11 | −11.49 | 8.06 | 0.37 | 288 ± 36 |
| M12 | −10.81 | 7.20 | 7.58 | 431 ± 50 |
| M13 | −11.21 | 7.98 | 1.21 | 383 ± 63 |
| M14 | −11.82 | 8.04 | 0.28 | 341 ± 32 |
| M15 | −10.94 | 8.07 | 0.32 | 366 ± 56 |
| M16 | −12.12 | 7.93 | 0.65 | 437 ± 56 |
| M17 | −12.29 | 8.02 | 1.38 | 283 ± 31 |
| M18 | −10.89 | 7.98 | 0.48 | 337 ± 52 |
| M19 | −11.25 | 7.87 | 1.30 | 356 ± 63 |
| M20 | −11.82 | 7.89 | 0.69 | 303 ± 35 |
| M21 | −12.20 | 8.04 | 0.80 | 300 ± 15 |
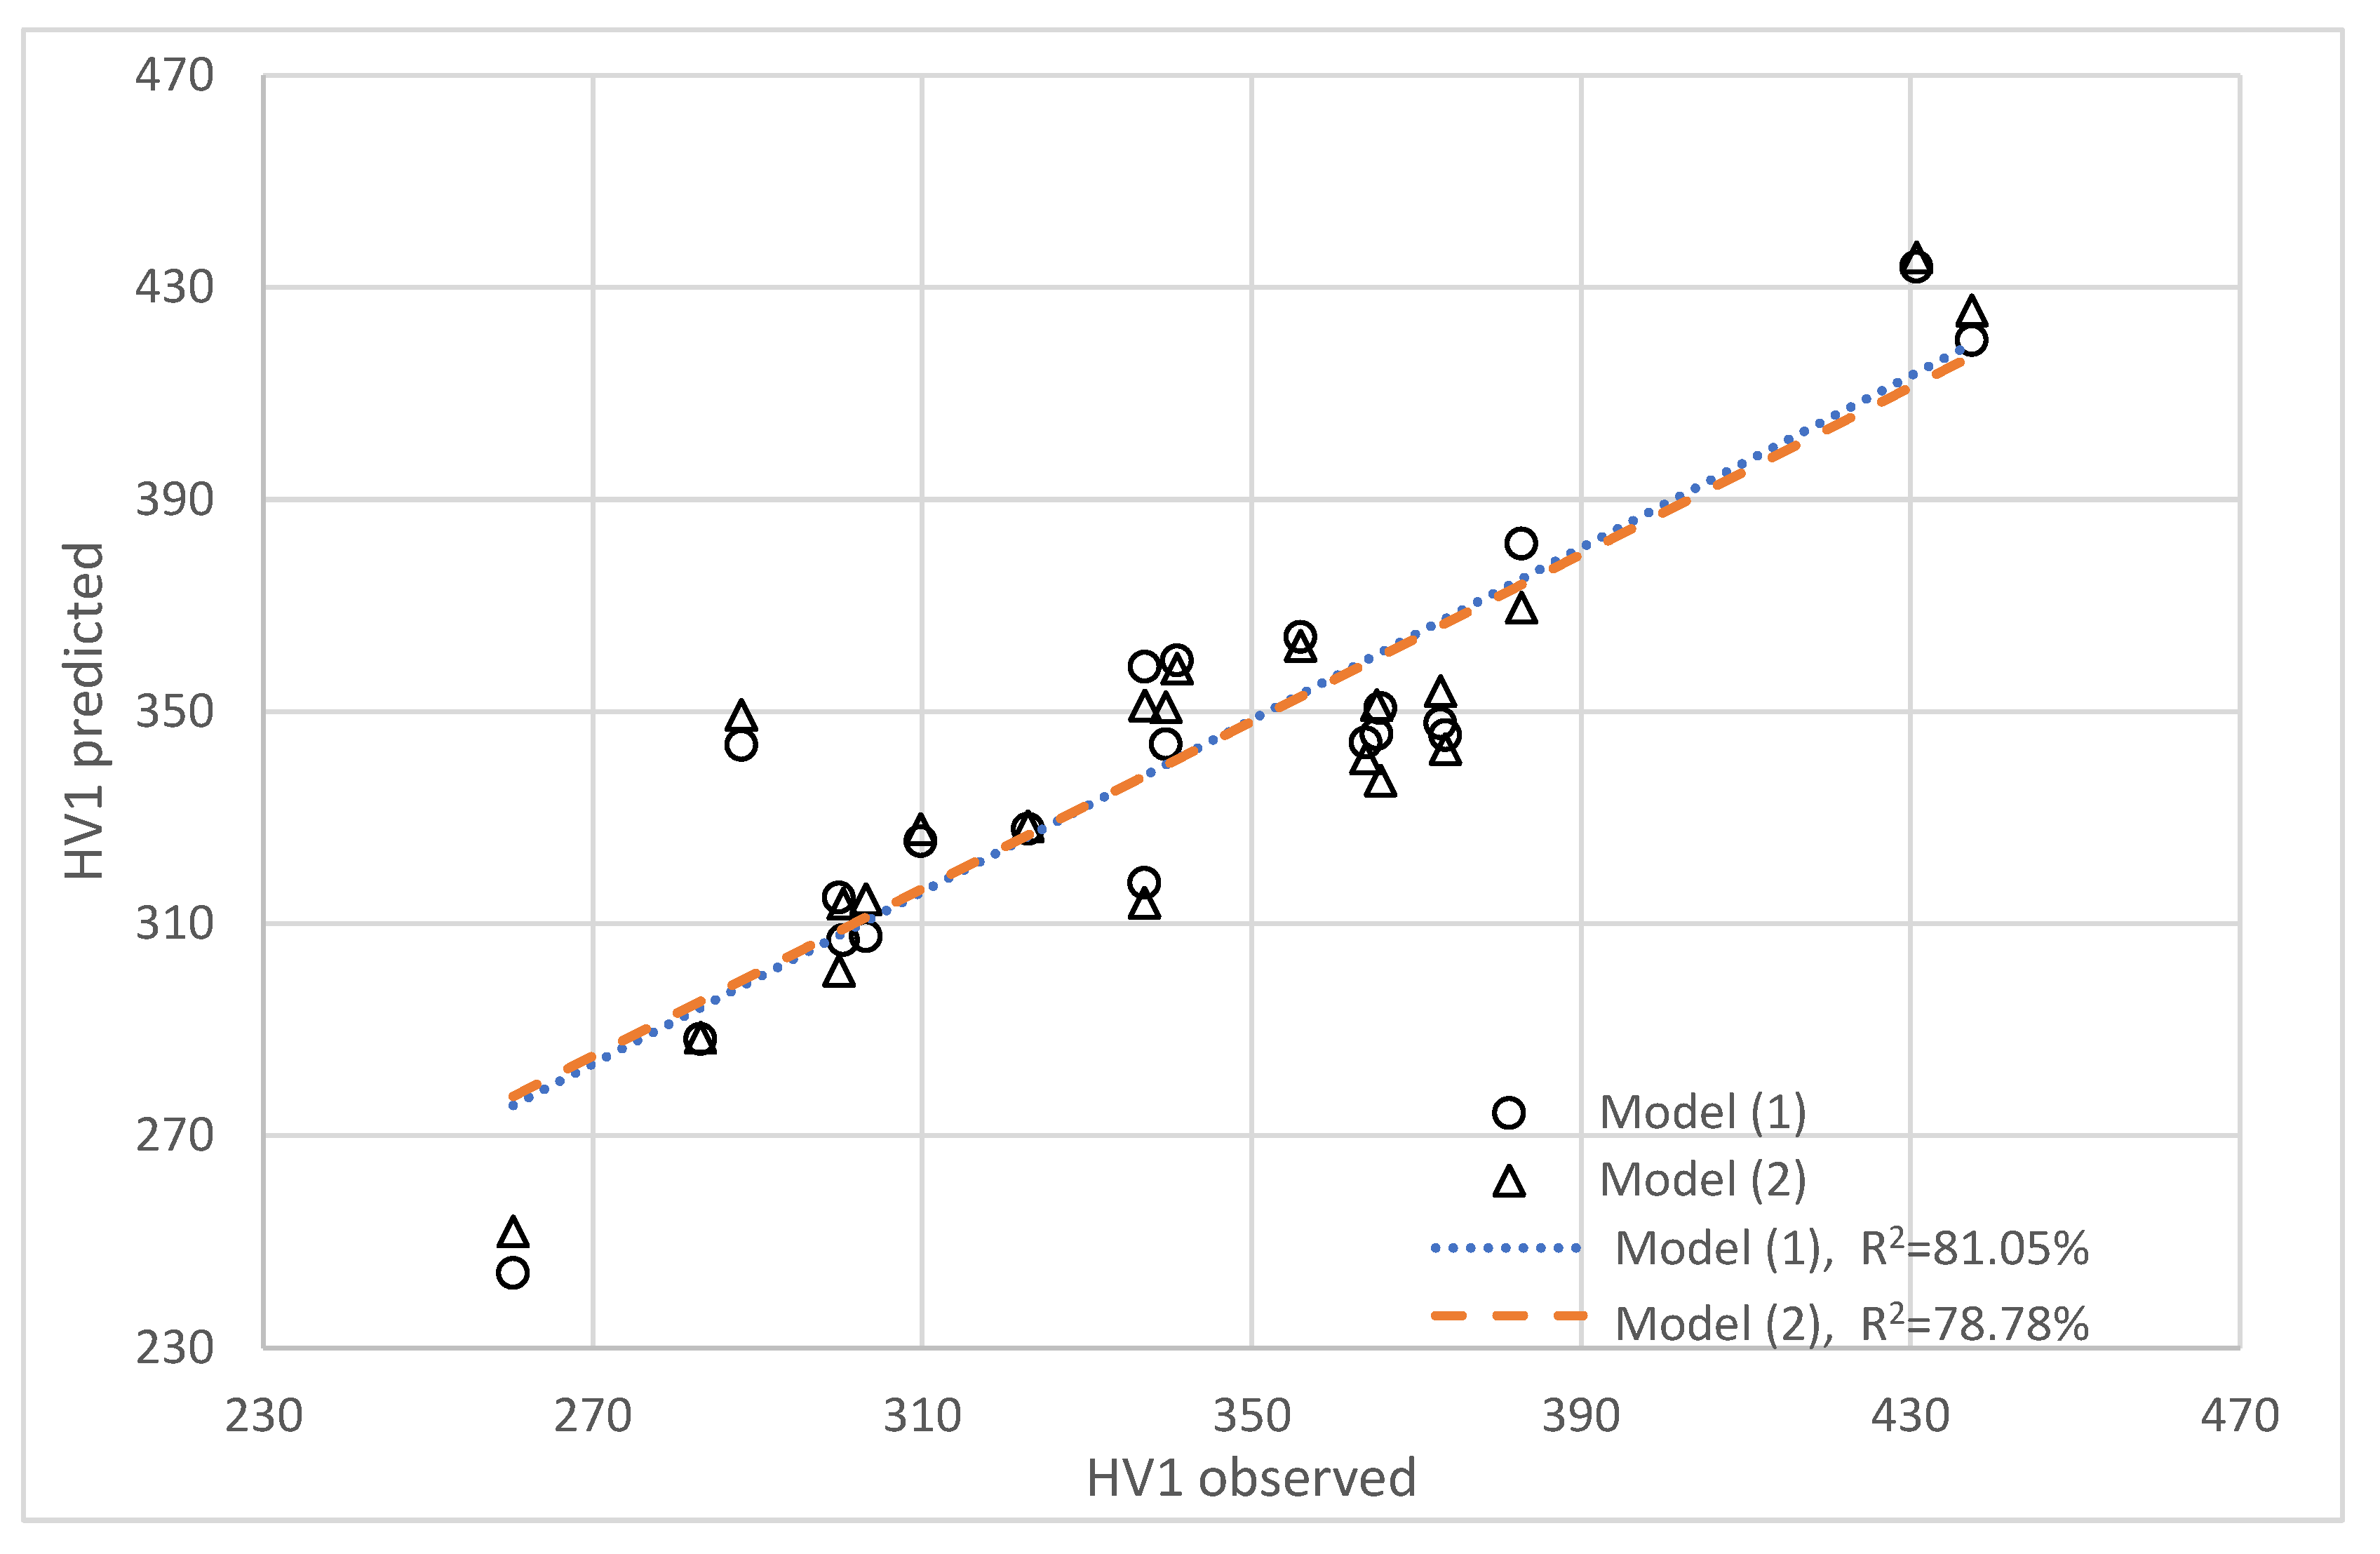
| N = 21 | Standardised Regression Coefficient Beta | Std. Error of Beta | Regression Coefficient b | Std. Error of b | t Test Value t(16) | p-Value |
|---|---|---|---|---|---|---|
| Intercept | 263.9546 | 36.6013 | 7.2116 | 0.000002 | ||
| % Cu | −0.2220 | 0.1149 | −1.3796 | 0.7139 | −1.9325 | 0.071193 |
| % Sn | 0.1848 | 0.1333 | 6.2908 | 4.5399 | 1.3869 | 0.184853 |
| % Ni | 0.4711 | 0.1278 | 5.9912 | 1.6257 | 3.6852 | 0.002004 |
| % P | 0.4142 | 0.1443 | 29.0141 | 10.1091 | 2.8701 | 0.011109 |
| N = 21 | Standardised Regression Coefficient Beta | Std. Error of Beta | Regression Coefficient b | Std. Error of b | t Test Value t(16) | p-Value |
|---|---|---|---|---|---|---|
| Intercept | 295.6330 | 29.3471 | 10.0737 | 0.000000 | ||
| % Cu | −0.2621 | 0.1141 | −1.6291 | 0.7093 | −2.2969 | 0.034597 |
| % Ni | 0.4217 | 0.1260 | 5.3627 | 1.6029 | 3.3457 | 0.003833 |
| % P | 0.5233 | 0.1242 | 36.6556 | 8.6987 | 4.2139 | 0.000584 |
| N = 21 | Standardised Regression Coefficient Beta | Std. Error of Beta | Regression Coefficient b | Std. Error of b | t Test Value t(16) | p-Value |
|---|---|---|---|---|---|---|
| Intercept | −11.7418 | 0.8463 | −13.8742 | 0.000000 | ||
| % Cu | −0.0862 | 0.2366 | −0.0060 | 0.0165 | −0.3645 | 0.720280 |
| % Sn | 0.0167 | 0.2744 | 0.0064 | 0.1048 | 0.0607 | 0.952343 |
| % Ni | 0.4613 | 0.2623 | 0.0658 | 0.0374 | 1.7591 | 0.097660 |
| % P | −0.1716 | 0.2963 | −0.1334 | 0.2302 | −0.5793 | 0.570442 |
| N = 21 | Standardised Regression Coefficient Beta | Std. Error of Beta | Regression Coefficient b | Std. Error of b | t Test Value t(16) | p-Value |
|---|---|---|---|---|---|---|
| Intercept | −0.0055 | 0.0212 | −0.2590 | 0.798932 | ||
| % Cu | −0.0289 | 0.2001 | −0.0001 | 0.0004 | −0.1446 | 0.886810 |
| % Sn | −0.0667 | 0.2323 | −0.0007 | 0.0026 | −0.2870 | 0.777808 |
| % Ni | −0.1991 | 0.2227 | −0.0008 | 0.0009 | −0.8941 | 0.384527 |
| % P | 0.7461 | 0.2514 | 0.0174 | 0.0058 | 2.9676 | 0.009071 |
Disclaimer/Publisher’s Note: The statements, opinions and data contained in all publications are solely those of the individual author(s) and contributor(s) and not of MDPI and/or the editor(s). MDPI and/or the editor(s) disclaim responsibility for any injury to people or property resulting from any ideas, methods, instructions or products referred to in the content. |
© 2025 by the authors. Licensee MDPI, Basel, Switzerland. This article is an open access article distributed under the terms and conditions of the Creative Commons Attribution (CC BY) license (https://creativecommons.org/licenses/by/4.0/).
Share and Cite
Romański, A.; Matusiewicz, P.; Cygan-Bączek, E. Searching Optimum Self-Brazing Powder Mixtures Intended for Use in Powder Metallurgy Diamond Tools—A Statistical Approach. Materials 2025, 18, 2726. https://doi.org/10.3390/ma18122726
Romański A, Matusiewicz P, Cygan-Bączek E. Searching Optimum Self-Brazing Powder Mixtures Intended for Use in Powder Metallurgy Diamond Tools—A Statistical Approach. Materials. 2025; 18(12):2726. https://doi.org/10.3390/ma18122726
Chicago/Turabian StyleRomański, Andrzej, Piotr Matusiewicz, and Elżbieta Cygan-Bączek. 2025. "Searching Optimum Self-Brazing Powder Mixtures Intended for Use in Powder Metallurgy Diamond Tools—A Statistical Approach" Materials 18, no. 12: 2726. https://doi.org/10.3390/ma18122726
APA StyleRomański, A., Matusiewicz, P., & Cygan-Bączek, E. (2025). Searching Optimum Self-Brazing Powder Mixtures Intended for Use in Powder Metallurgy Diamond Tools—A Statistical Approach. Materials, 18(12), 2726. https://doi.org/10.3390/ma18122726