Article

In Situ Phase Separation Strategy to Construct Zinc Oxide Dots-Modified Vanadium Nitride Flower-like Heterojunctions as an Efficient Sulfur Nanoreactor for Lithium-Sulfur Batteries

1
New Energy Research Institute, College of Environment and Energy, South China University of Technology, Guangzhou 510006, China
2
School of Materials Science and Engineering, Henan Normal University, Xinxiang 453007, China
3
Siyuan Laboratory, Guangzhou Key Laboratory of Vacuum Coating Technologies and New Energy Materials, Guangdong Provincial Engineering Technology Research Center of Vacuum Coating Technologies and New Energy Materials, Guangdong Provincial Key Laboratory of Nanophotonic Manipulation, Department of Physics, Jinan University, Guangzhou 510632, China
*
Authors to whom correspondence should be addressed.
Materials 2025, 18(11), 2639; https://doi.org/10.3390/ma18112639
Submission received: 1 April 2025 / Revised: 10 May 2025 / Accepted: 30 May 2025 / Published: 4 June 2025
(This article belongs to the Special Issue Advanced Electrode Materials for Batteries: Design and Performance)

Abstract

:
Exploring advanced sulfur cathode materials is important for the development of lithium-sulfur batteries (LSBs), but they still present challenges. Herein, zinc oxide dots-modified vanadium nitride flower-like heterojunctions (Zn-QDs-VN) as sulfur hosts are prepared by a phase separation strategy. Characterizations confirm that the flower structure with high specific surface area and pores improves active site exposure and electron/mass transfer. In situ phase separation enriches the Zn-QDs-VN interface, addressing the issues of uneven distribution and interface reduction of Zn-QDs-VN. Further theoretical computations reveal that ZnO-QDs-VN with optimized intermediate spin states can constitute a stable LiS* bond sequence, which can conspicuously facilitate the adsorption and conversion of LiPSs and reduce the battery reaction energy barrier. Therefore, the ZnO-QDs-VN@S cathode shows a high initial specific capacity of 1109.6 mAh g−1 at 1.0 C and long cycle stability (maintaining 984.2 mAh g−1 after 500 cycles). Under high S loading (8.5 mg cm−2) and lean electrolyte conditions (E/S = 6.5 μL mg−1), it also exhibits a high initial area capacity (10.26 mAh cm−2) at 0.2 C. The interfacial synergistic effect accelerates the adsorption and conversion of LiPSs and reduces the energy barriers in cell reactions. The study provides a new method for designing heterojunctions to achieve high-performance LSBs.

Graphical Abstract

1. Introduction

Lithium-sulfur batteries (LSBs) are considered one of the new energy systems with promising applications due to their attractive energy density (2600 Wh kg−1) and high theoretical capacity (1675 mAh g−1) [1,2]. However, the inherent drawbacks of the cathode, such as rapid volume expansion, the notorious shuttle effect of lithium polysulfide (LiPSs), and sluggish kinetics of S-involved reaction, greatly limit large-scale applications of LSBs [3,4]. To overcome these challenges, great effort has been devoted to exploring advanced sulfur host materials [5]. Among them, metal oxides (MOs such as ZnO, Co3O4, and MnO2) that have good polarity and can strongly absorb LiPSs by chemical binding to suppress the shuttle effect are considered potential candidates [6,7,8]. Unfortunately, the strong adsorption capacity and poor conductivity of MOs often lead to sluggish electrochemical conversion of LiPSs, thus greatly restricting the performance of LSBs [9,10].
In recent years, many studies have shown that vanadium nitride (VN) with metallic properties exhibits exceptional catalytic performance for sulfur redox reactions due to its excellent electrical conductivity and suitable d-band structures [11,12]. For example, Yang et al. prepared an N-doped porous graphitic carbon-supported VN as a superior electrocatalytic cathode host for LSBs with a high specific capacity of 1442 mAh g−1 at 0.1 C [13]. Moreover, VNs such as CC/VN/Co@NCNTs [14] and VN/NG [15] have also been developed as electrocatalysts for enhancing LSB performance. Therefore, reasonable coupling with VN to build heterostructures may be an effective way to overcome the shortcomings of MOs. Moreover, due to the difference in work function (WF) between VN and MOs, electrons can be spontaneously transferred at the interface to form a built-in electric field (BIEF), thus helping to further optimize each other’s electronic structure to balance the adsorption capacity and catalytic activity toward LiPSs [16,17]. In addition to improving intrinsic activity, the method of fully expose accessible active sites is equally important for overall performance. For heterojunctions, the main activity sites with high performance are located at the interface in general [18]. Nevertheless, the most common method of preparing heterostructures is the ex situ approach, where each component or precursor is synthesized separately and then combined, often resulting in uneven distributions, reduced heterointerfaces, and, consequently, weakened interactions. How to construct heterojunctions with tight interfaces remains a significant challenge.
In this work, a zinc oxide dots-modified VN flower-like heterojunction (Zn-QDs-VN) is prepared by a self-template limited and phase separation strategy as an efficient sulfur nanoreactor. Characterizations show that ZnO-QDs with a nanosize (<10 nm) are encapsulated into porous flower-shaped nanoreactors to enrich the interfaces, thus strongly enhancing the interaction. Moreover, the partial Zn volatilization in the synthesis process significantly improved the specific surface area and pore structure of samples, which provided more space to store the S nanoparticles, expose active sites, and improve the electron/mass transfer. Further theoretical calculations indicate that ZnO-QDs-VN with optimized intermediate spin states can form stable LiS* bond sequences, which can significantly promote the adsorption and conversion of LiPSs and reduce the energy barrier in battery reactions. Based on the above advantages, the ZnO-QDs-VN@S cathode exhibits a high initial specific capacity of 960.8 mAh g−1 at 3.0 C and can maintain a specific capacity of 687.9 mAh g−1 after 500 cycles. Moreover, even under harsh conditions (sulfur loading of 8.5 mg cm−2 and E/S = 6.5 μL mg−1), it also exhibits an extremely high initial area capacity (10.258 mAh cm−2), and the capacity retention (CR) is 60.31% after 100 cycles.

2. Experimental Section

2.1. Materials

All chemical reagents purchased for unprocessed use were of analytical grade. Ammonium metavanadate (NH4VO3) was bought from Shanghai Maclin Biochemical Co., Ltd. (Shanghai, China). Zinc nitrate hexahydrate (Zn(NO3)2·6H2O) was purchased from Guangzhou Qian Hui Glass Instrument Co., Ltd. (Guangzhou, China). The water used in this experiment was pure (99.7%).

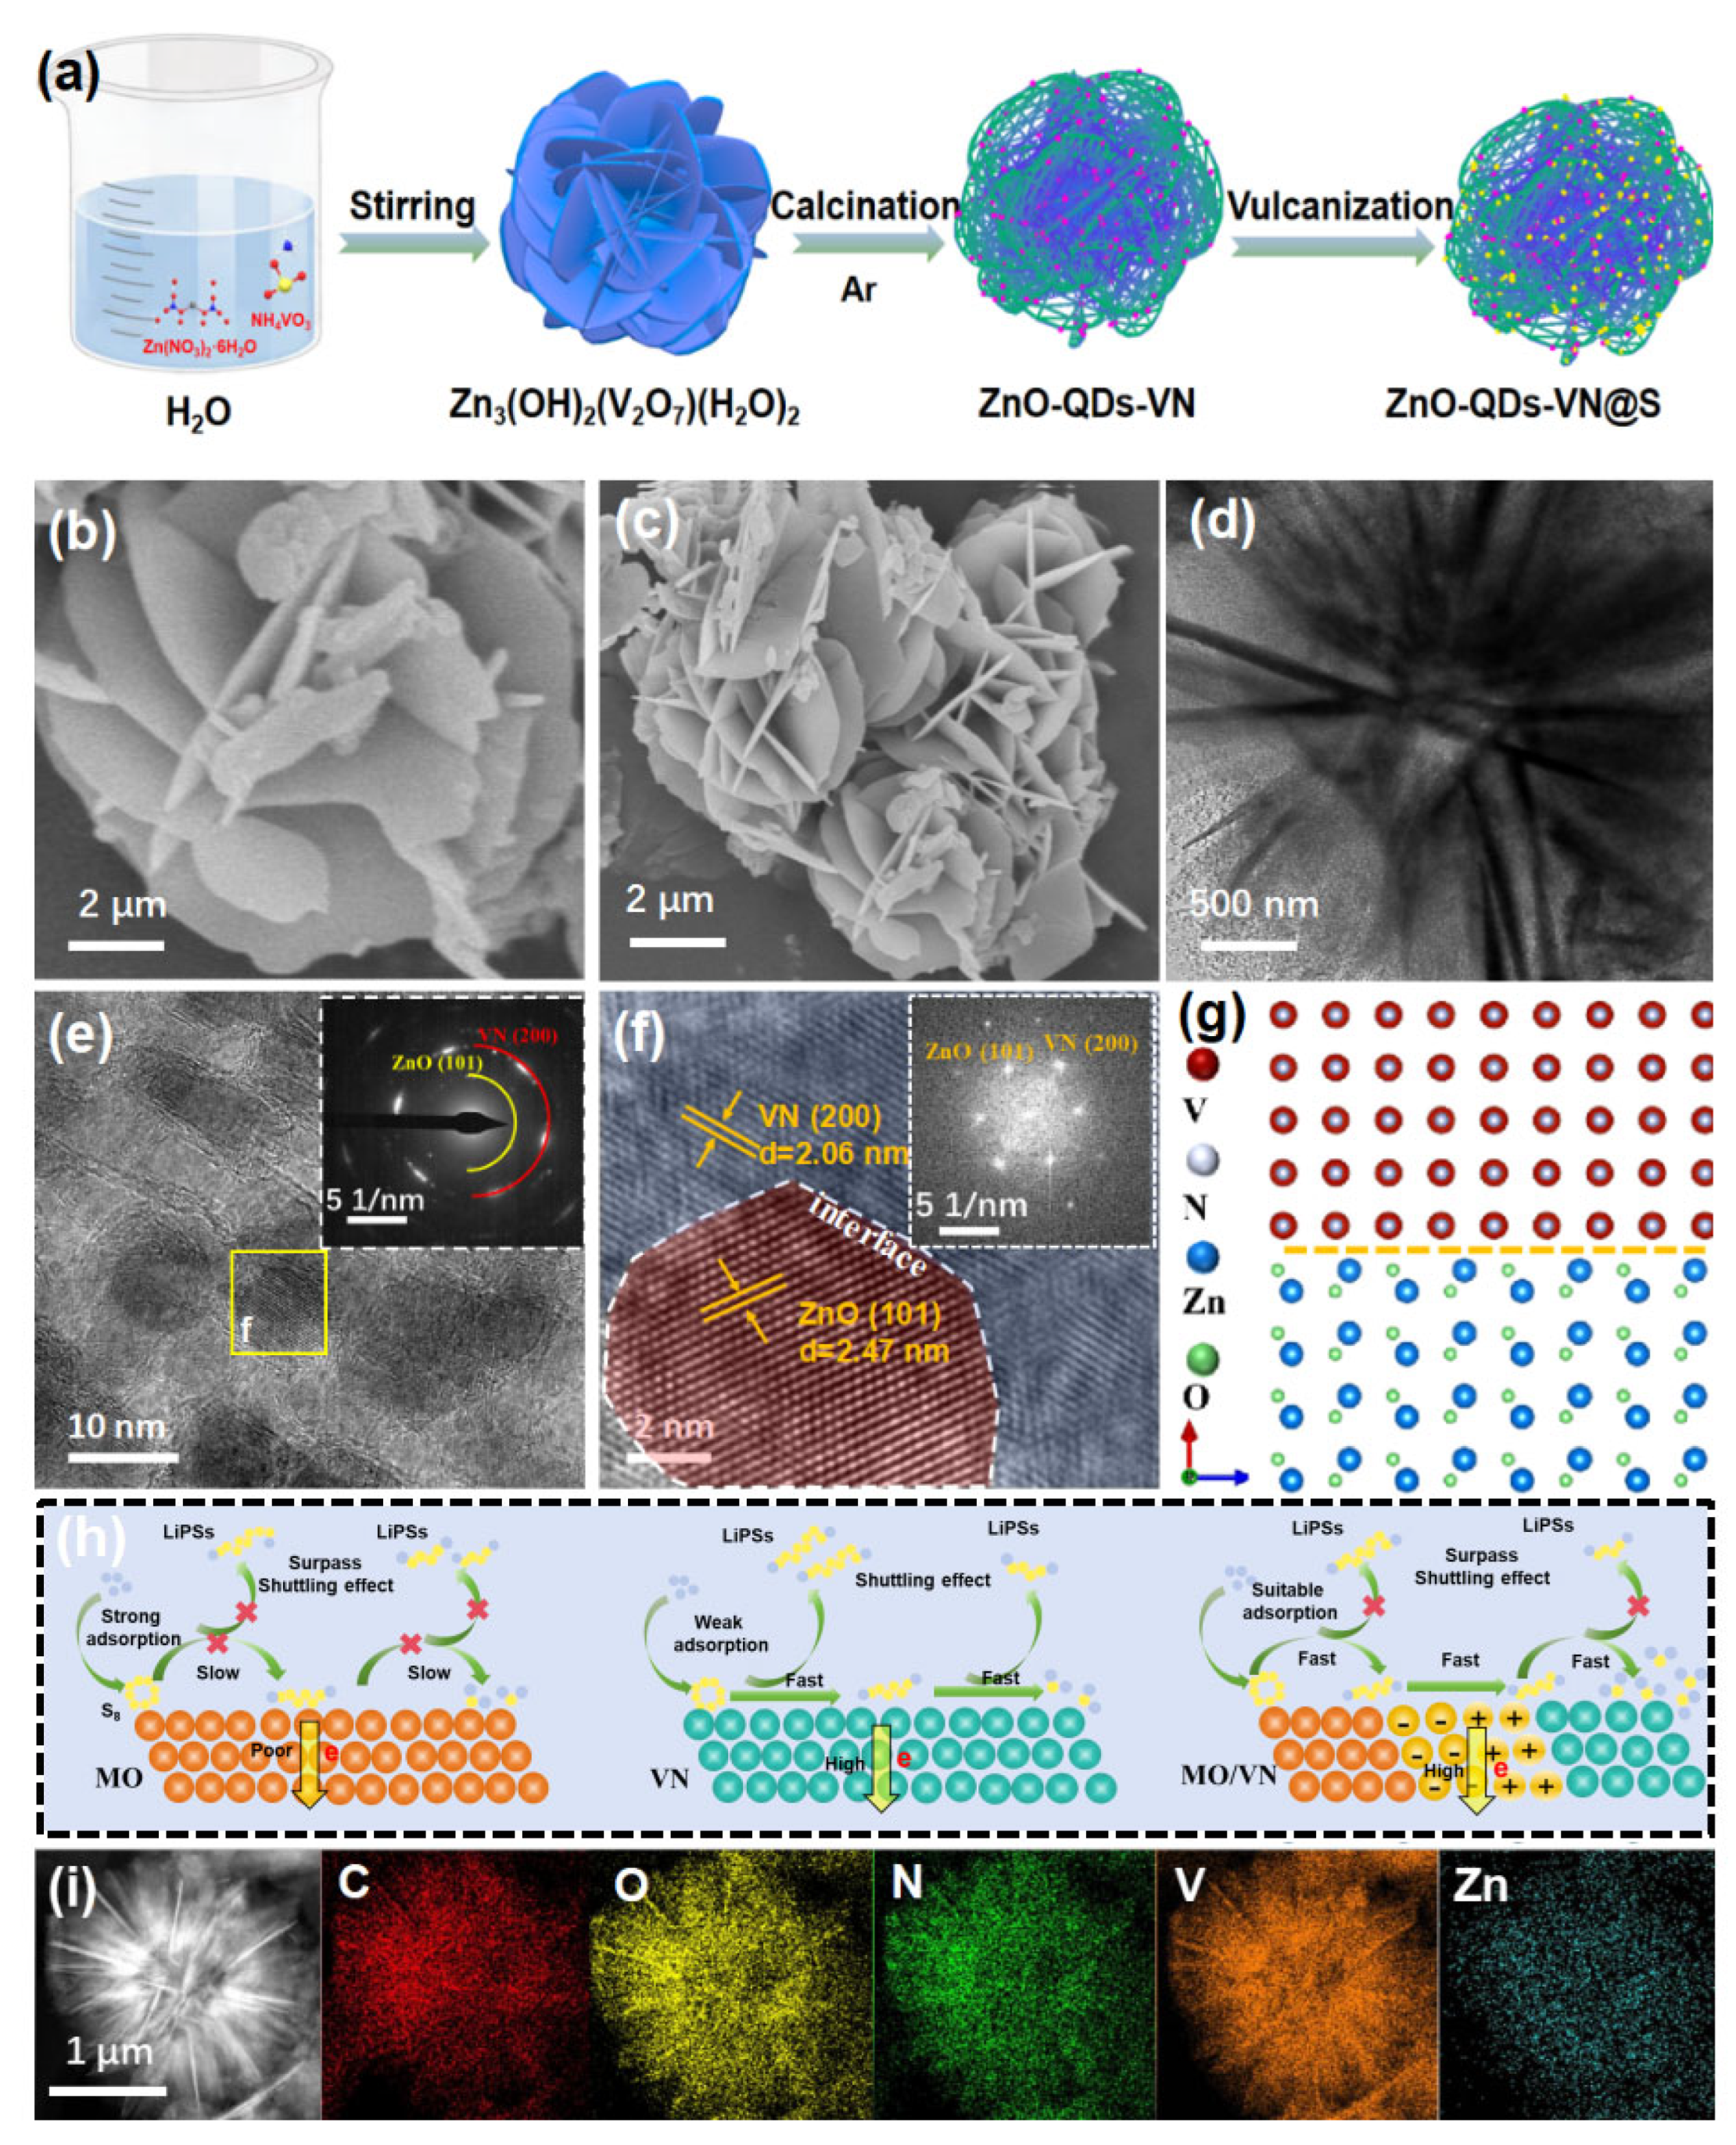
2.1.1. Preparation of Zn3(OH)2(V2O7)(H2O)2

First, 0.421 g of NH4VO3 was dispersed in 20 mL of distilled water at 80 °C to form solution A. The Zn(NO3)2·6H2O (1.070 g) was dissolved in 20 mL of distilled water and stirred at room temperature for 20 min to form solution B. Then, solution A was slowly poured into solution B with stirring for 10 h at room temperature to obtain a uniform orange solution. Finally, the Zn3(OH)2(V2O7)(H2O)2 precursor was collected and dried at 60 °C overnight.

2.1.2. Preparation of Porous ZnO-QDs-VN and Other Specimens for Comparison

ZnO-QDs-VN was prepared through the calcination process. The obtained Zn3 (OH)2(V2O7)(H2O)2 and Melamine (C3H6N6) (weight ratio 1:10) were placed in two different locations in a porcelain vessel, with C3H6N6 positioned upstream of the furnace. The mixture was then calcined for 0.5 h at 750 °C in an argon atmosphere at a slope rate of 3 °C min−1 and denoted as ZnO-QDs-VN. However, the VN nanosheets were prepared by etching ZnO-QDs-VN in 0.1 M HCL solution for 24 h, and the VN nanosheets were filtered and dried overnight at 60 °C. The ZnO was prepared by calcining zinc acetate at 450 °C in air for 2 h.

2.1.3. Preparation of ZnO-QDs-VN@S, VN@S and ZnO@S

The ZnO-QDs-VN@S composites were obtained by mixing sulfur powder and as-prepared ZnO-QDs-VN (weight ratio 7:3) and heating at 155 °C (ramp rate of 2 °C min−1) for 12 h under an argon atmosphere, followed by further heating to 200 °C for 1 h to remove excess sulfur. VN@S and ZnO@S composites were synthesized in the same manner.

2.1.4. Analysis of Synthetic Mechanism

The synthesis mechanism is based on the synergistic effect of precursor coordination assembly and melamine, forming the target structure through high-temperature in situ phase separation.
Firstly, after dissolving ammonium metavanadate and zinc nitrate, Zn2⁺ forms a Zn-V-O-N-C composite coordination network with VO₄3⁻ and amino groups of melamine. Elemental molecular-level uniform dispersion is achieved through stirring and drying. Secondly, in argon at 750 °C, melamine decomposes to generate reducing gases (such as NH₃) and N3⁻, which reduce V⁵⁺ to V3⁺ and promote VN formation; zinc nitrate decomposes to form ZnO, while carbon residues from melamine serve as 2D growth templates. Subsequently, the higher bond energy of V-N compared to Zn-O drives preferential formation of VN nanosheets, while ZnO desorbs as quantum dots due to lower bond energy; carbon skeletons from melamine decomposition restrict ZnO grain growth and anchor them onto VN surfaces, forming heterojunction composite structures. Finally, argon protection prevents excessive oxidation, and 750 °C balances reaction kinetics and grain size control, ultimately achieving in situ dispersion and doping of ZnO quantum dots on VN nanosheets.

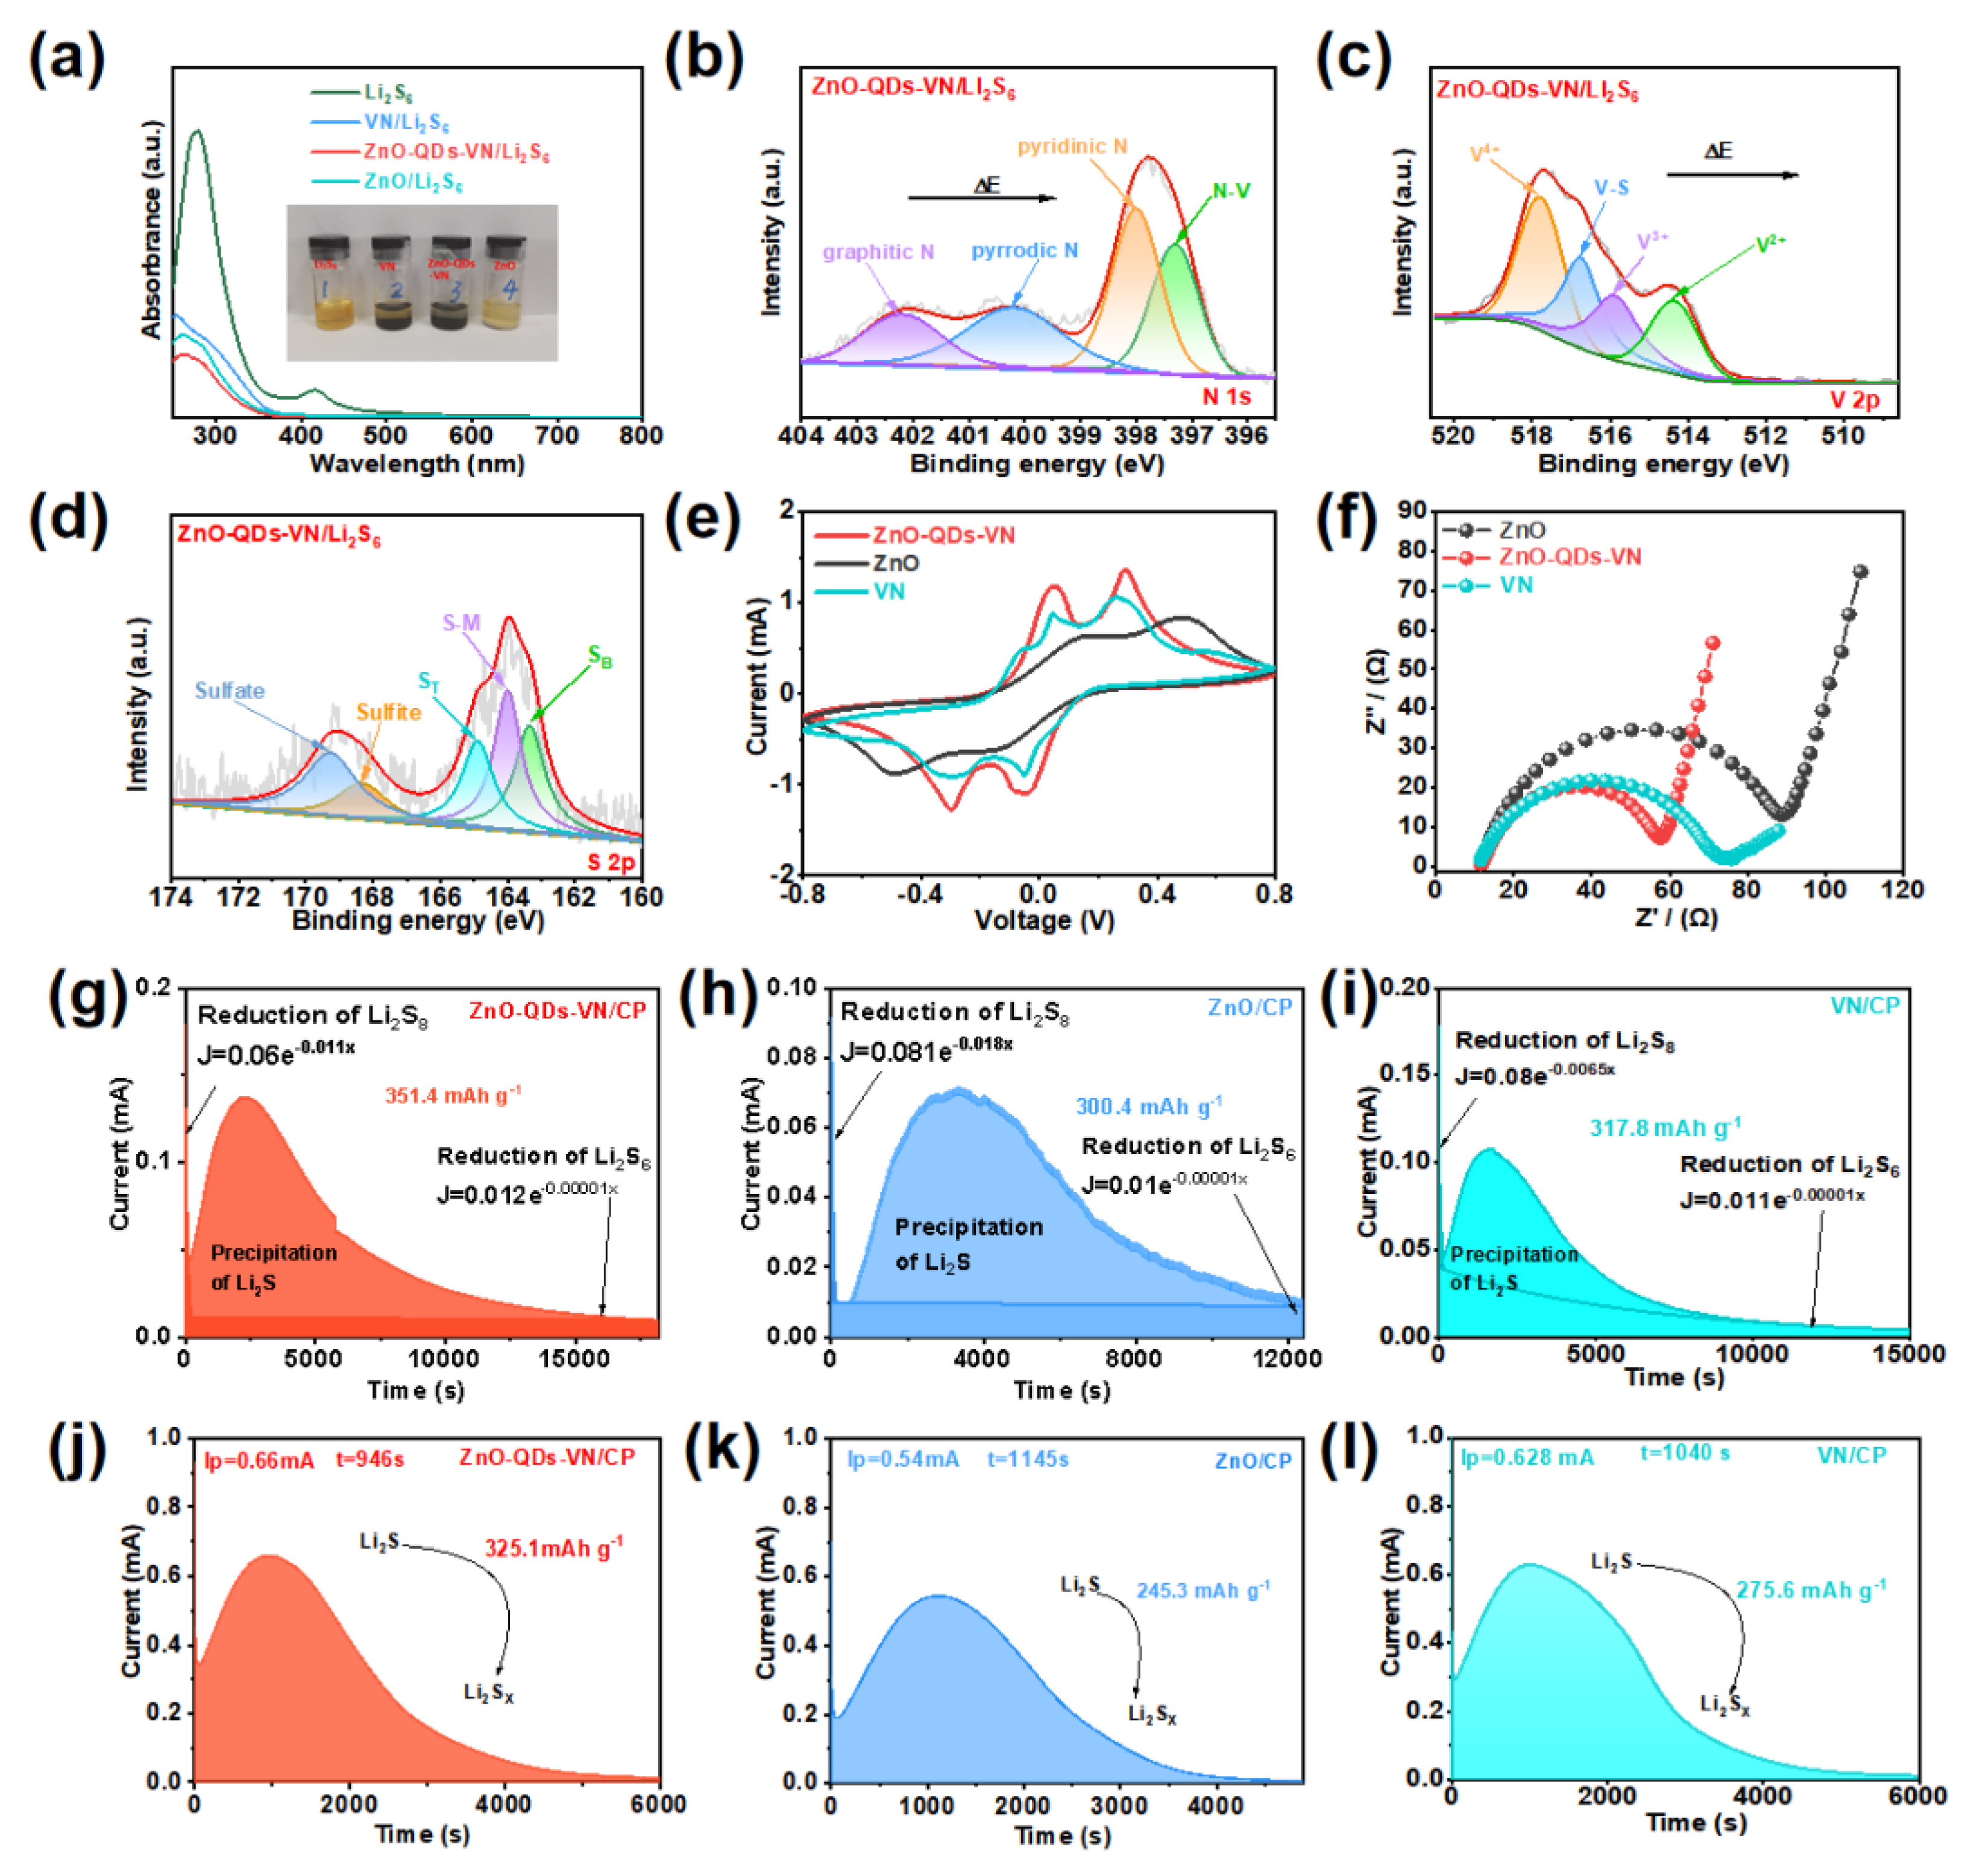
2.1.5. Preparation of Li2S6 Solution for the Adsorption Experiments

The Li2S and S powder (molar ratio 5:1) were dissolved in tetrahydrofuran (THF) solution to give 0.2 M Li2S6/THF solution. Subsequently, the mixture was put in DOL/DME (volume ratio 1:1) solution and stirred for 12 h at 55 °C in a glove box. ZnO-QDs-VN and VN were added to 6 mL of the above-prepared solution, which was allowed to stand for some time to observe the color, evaluate the adsorption effect of the material on LiPSs, and further analyze the content of Li2S6 by UV-vis.

2.1.6. Lithium Sulfide Deposition and Dissolution Experiments

The Li2S and S powder (molar ratio 7:1) were dissolved in ethylene glycol dimethyl ether (TEG) solution to obtain 0.2 M Li2S8/TEG as cathode electrolyte and conventional LSBs as anode electrolyte. ZnO-QDs-VN@S, VN@S was applied to the carbon paper as the anode of the battery, and the lithium sheet was assembled into the battery as the cathode. Lithium sulfide deposition experiments were performed with a constant current of 0.112 mA, then kept at 2.05 V with a constant voltage discharge until the current was below 10−5 mA to obtain an i–t curve. For lithium sulfide dissolution experiments, the prepared battery was discharged to 1.7 V at 0.112 mA and then charged at 2.24 V constant voltage until the current was below 10−5 mA to obtain an i–t curve.

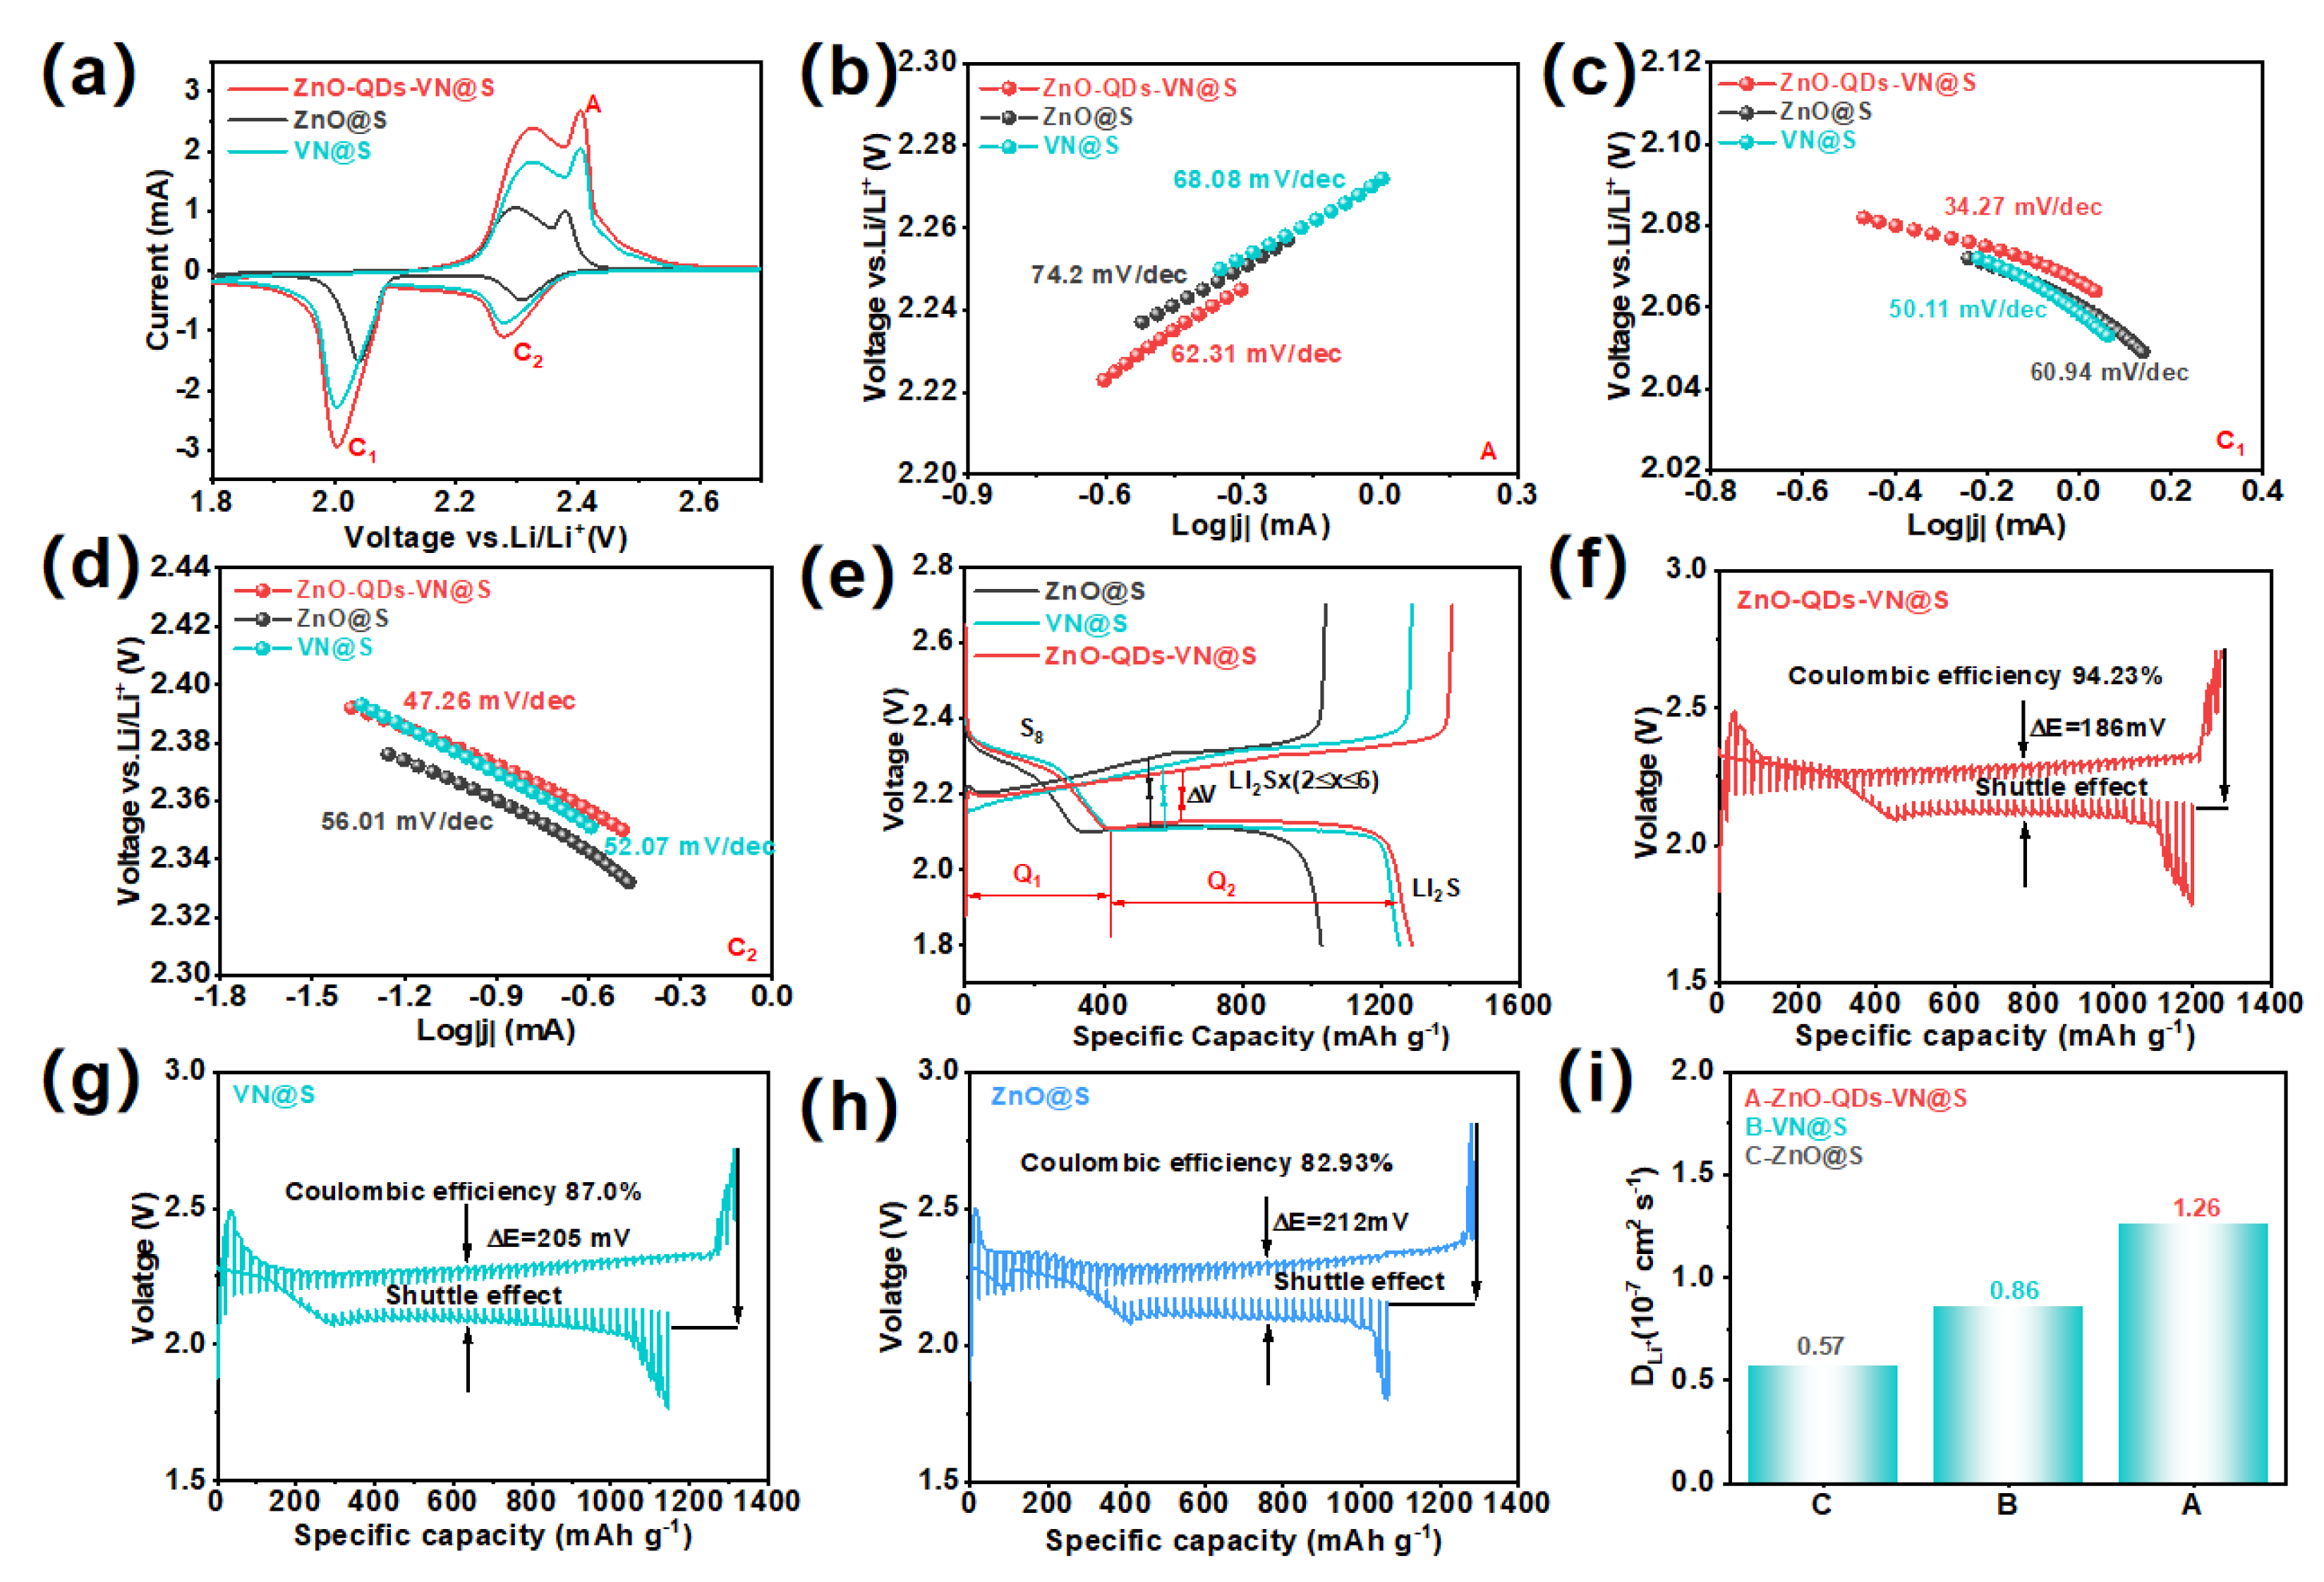
2.1.7. Voltammograms of Symmetric Cells

The prepared ZnO-QDS-VN and VN were used as the working electrodes of the symmetric cell, and the Li2S6 solution of 20 μL (0.2 M) was used as the electrolyte of the symmetric cell. The CV or EIS of the battery was then obtained within a certain scanning rate and voltage range (0.8–−0.8 V). This study used the CHI 660D electrochemical workstation (Shanghai Chen Hua Co., Ltd., Shanghai, China) to test.

2.1.8. Constant Current Titration Interval (GITT) Test

In this study, GITT under the first circle of ZnO-QDs-VN@S and VN@S was performed under the test condition of 0.1 C for charging and discharging for 10 min, and then allowed to stand for 1 h. Then, the charge/discharge curves of ZnO-QDs-VN@S and VN @S were analyzed to calculate the internal resistance of LSBs at different charge–discharge stages of ZnO-QDs-VN@S and VN@S.

2.1.9. Electrochemical Performance Test of the Coin Battery

Active materials (for example, ZnO-QDs-VN@S, ZnO, and VN), Super P, and PVDF were mixed with N-methyl-pyrrolidone (NMP) at a molar ratio (7:2:1) to form a uniform dispersion for 6 h. Then, the mixture was coated on carbon-coated aluminum foil (with a thickness of 300 μm) and dried overnight at 60 °C. After drying, the foil was cut into circular thin slices with an area of 1.131 cm2 using a slicer. Weight loading: The loading of the active substance was 1.2 mg cm−2 (calculated by weighing). Electrode conductivity: The conductivity of the electrode sheet was measured to be 7 S/cm by the four-probe method. The prepared active materials as the anode, lithium metal foil as the cathode, and commercial polypropylene (PP) as the membrane were used to assemble CR2032 coin batteries.
The electrolyte consisted of 1 M LiTFSI dissolved in a binary solvent of 1,3-dioxopentane (DOL)/ethylene glycol diformaldehyde (DME) (v/v is 1:1), and 2 wt% lithium nitrate (LiNO3) was added as the electrolyte additive. Current density: All test current densities were normalized by electrode area (cm2), with the unit being mA cm−2 (for example, in constant current charge and discharge tests, a current density of 1 mA cm−2 corresponds to a total current of 1.131 mA).

2.2. Material Characterization

Scanning electron microscopy (SEM, Tescan Mira LMS, Taiciken Trading (Shanghai) Co., Ltd., Shanghai, China) and transmission electron microscopy (TEM, JEM-ARM300F, JEOL, Tokyo, Japan) were used to record the morphology of the as-prepared materials. The structure and crystal structure information of the as-prepared materials were analyzed by X-ray diffractometer (XRD, Bruker D8 ADVANCE, Bruker AXS GmbH, Karlsruhe, Germany) and X-ray photoelectron spectroscopy (XPS, PHI X-tool, Chigasaki, Kanagawa, Japan). The pore structure and surface properties of the as-prepared materials were characterized by using a nitrogen adsorption–desorption instrument (Quantachrome Instruments. Boynton Beach, FL, USA). Thermogravimetry (TGA, Mettler-Toledo Group. Zurich, Switzerland) to determine the sulfur mass fraction of the as-prepared materials in N2. The adsorption properties of lithium polysulfide were tested using a UV–vis spectrophotometer (UV2600-2200 CH, Shimadzu Corporation, Kyoto, Japan).

3. Results and Discussion

3.1. Physical Characterization and Component Analysis of ZnO-QDs-VN Electrocatalyst

Figure 1a shows the synthesis process for the ZnO-QDs-VN@S, where the Zn3 (OH)2(V2O7)(H2O)2 nanoflowers are obtained via the coprecipitation at ambient temperature; the corresponding SEM image is displayed in Figure 1b. Subsequently, the ZnO-QDs-VN nanosheets with enriched pore size were prepared by a one-step nitriding process. In the SEM images (Figure 1c), ZnO-QDs-VN can still maintain the nanoflower-like morphology well. As control samples, VN samples were also prepared by etching ZnO-QDs-VN with acid. Due to the leaching of ZnO, the surface of VN becomes rough (Figure S1a). Finally, the ZnO-QDs-VN@S was prepared by the conventional melt diffusion method. In Figure S1b, one can find that the morphology of ZnO-QDs-VN is almost changed after loading of S. In addition, no obvious sulfur particles can be observed on the surface, indicating that S particles are confined within a 3D flower-like structure. The information of phase was analyzed by the XRD pattern (Figure S2a), where ZnO-QDs-VN exhibited five distinct diffraction peaks at 37.9°, 44.4°, 64.5°, 77.2°, and 81.4°, corresponding to the (111), (200), (220), (311), and (222) planes of VN (PDF# 73-2038) [19,20]. Moreover, four other peaks at 30.1°, 35.4°, 46.2°, and 54.5° were also observed and belonged to the (100), (101), (102), and (110) planes of ZnO (PDF # 36-1451) [21], confirming that VN and ZnO were successfully synthesized in the samples. Furthermore, after S loading, the XRD pattern of ZnO-QDs-VN@S (Figure S2b) showed a series of intense sulfur diffraction peaks (PDF#08-0247), suggesting that sulfur was successfully encapsulated in the ZnO-QDs-VN host [3].
TEM images (Figure 1d and Figure S3) further demonstrated that ZnO-QDs-VN had a nanoflower-like morphology, and the uniform dispersion of ZnO quantum dots on the surface of VN nanosheets could be clearly observed in the images. The HRTEM images (Figure 1e,f) displayed clear lattice fringes with a spacing of 0.206 and 0.247 nm, corresponding to the (200) crystal plane of VN and the (101) crystal plane of ZnO (JCPDS 36-1451), respectively. Furthermore, Rietveld refinement of the XRD data was carried out through fitting calculations (Figure S4). The results show that the grain sizes of the ZnO phase and VN phase of the ZnO-ODS-VN composite material were 10.32 nm and 26.94 nm, respectively, which is consistent with the HRTEM observation results. The SAED pattern and FFT plots (Figure 1e,f inset) further support the results; the obvious diffraction rings and spots of VN (200) and ZnO (101) can be observed [19,21]. In Figure 1f, one can see the clear interface between VN and ZnO-QDs, which suggests the formation of a heterojunction in ZnO-QDs-VN (the corresponding model is shown in Figure 1g). Compared to single ZnO, the ZnO/VN heterojunction can fully combine each other’ s strengths to enhance the catalytic and adsorption capacity toward LiPSs, thereby effectively inhibiting the shuttling effects and accelerating the cell reaction kinetics to improve the performance of LSBs (Figure 1h). Moreover, the mapping images (Figure 1i) show that the elements of C, O, N, V, and Zn are uniformly dispersed throughout the sample surface.
The specific surface area (SAA) and pore size distribution were characterized by BET measurements. The N2 adsorption/desorption plots exhibited the characteristics of a type IV isotherm, with a distinct hysteresis loop evident in the pressure data, indicating the coexistence of micropores and mesopores within the materials [22]. The ZnO-QDs-VN showed a high SAA of 150.453 m2 g−1. Furthermore, the pore size distribution plots indicated that ZnO-QDs-VN exhibits a high pore volume of 0.489 cm3 g−1 and a substantial pore size with an average diameter of 8.647 nm (Figure S5a). In Figure S5b, VN exhibits the same SAA, pore volume, and average pore size as ZnO-QDs-VN. The large SAA, high pore volume, and suitable pore size cannot only help to provide more space to store active S species, but also enhance the mass transfer. The N2 adsorption/desorption and pore size distribution plots (Figure S5c) of ZnO-QDs-VN@S confirm this view, where the SAA and pore volume decrease rapidly compared to ZnO-QDs-VN. This phenomenon is primarily attributed to the melting of S into the pore structure, which effectively obstructs the pore. Furthermore, thermogravimetric analysis (TGA) (Figure S6) corroborates the exceptional sulfur-carrying capacity of ZnO-QDs-VN, with an S loading of up to 69%, which ensures an improvement in the energy density of LSBs.
To analyze the electron interaction between ZnO quantum dots (QDs) and vanadium nitride (VN), Mott–Schottky (M-S) plots (Figure 2a–c) were initially conducted. The positive slopes observed indicate that both ZnO and VN are n-type semiconductors [10]. Consequently, the formation of a heterojunction in ZnO-QDs-VN is an n-n type junction. From the M–S plots, the flat band potentials (EFB) of the fitted plots of ZnO-QDs-VN, VN, and ZnO were evaluated and determined to be −0.94, −0.92, and −0.97 V (vs. Ag/AgCl), respectively. The positions of the conductive bands could be calculated as −5.85 eV, −5.82 eV, and −5.86 eV (vs. Vac.) from these values. It is evident that the conductive band of ZnO-QDs-VN is between VN and ZnO, which means electrons at the interface between ZnO-QDs and VN spontaneously transfer to form a BIEF (Figure 2d), thus helping to boost the reaction kinetics. In Figure S7a, the full XPS spectrum shows that ZnO-QDs-VN contains V, N, O, and Zn elements, while VN contains only N and V. The quantification of their contents is shown in Tables S1 and S2; the content of Zn in ZnO-QDs-VN is about 1.3 at.%. In Zn 2p spectra of ZnO-QDs-VN (Figure S7b), the peaks at 1021.9 and 1045.1 eV belong to Zn 2p3/2 and Zn 2p1/2 of ZnO, respectively [23], while there are no obvious peaks in the Zn 2p spectra of VN, indicating that ZnO-QDs were completely removed by acid etching. In V 2p spectra (Figure 2e), ZnO-QDs-VN displays three deconvoluted peaks, attributed to V2+ (514.2 eV), V3+ (516.1 eV), and V4+ (517.4 eV) [24]. It is noteworthy that the binding energy (BE) of V in ZnO-QDs-VN is higher than that of VN, indicating that the charge is transferred from VN to ZnO-QDs. These findings align with the results of M–S plots [25]. Moreover, the N1s (Figure 2f) further support the views, where one can find that the BE of N1s in ZnO-QDs-VN is the positive shift of 0.2 eV compared to VN. Moreover, the differential charge density analysis (Figure 2g and Figure S8) demonstrates that the electron cloud density in VN is diminished following the formation of a heterojunction, whereas the electron cloud density in ZnO is augmented. The electron-rich region has the potential to enhance the affinity for Li, while the electron-deficient region may improve the affinity for S [26,27]. The dual effects in ZnO-QDs-VN can boost the conversion of LiPSs in LSBs [21].

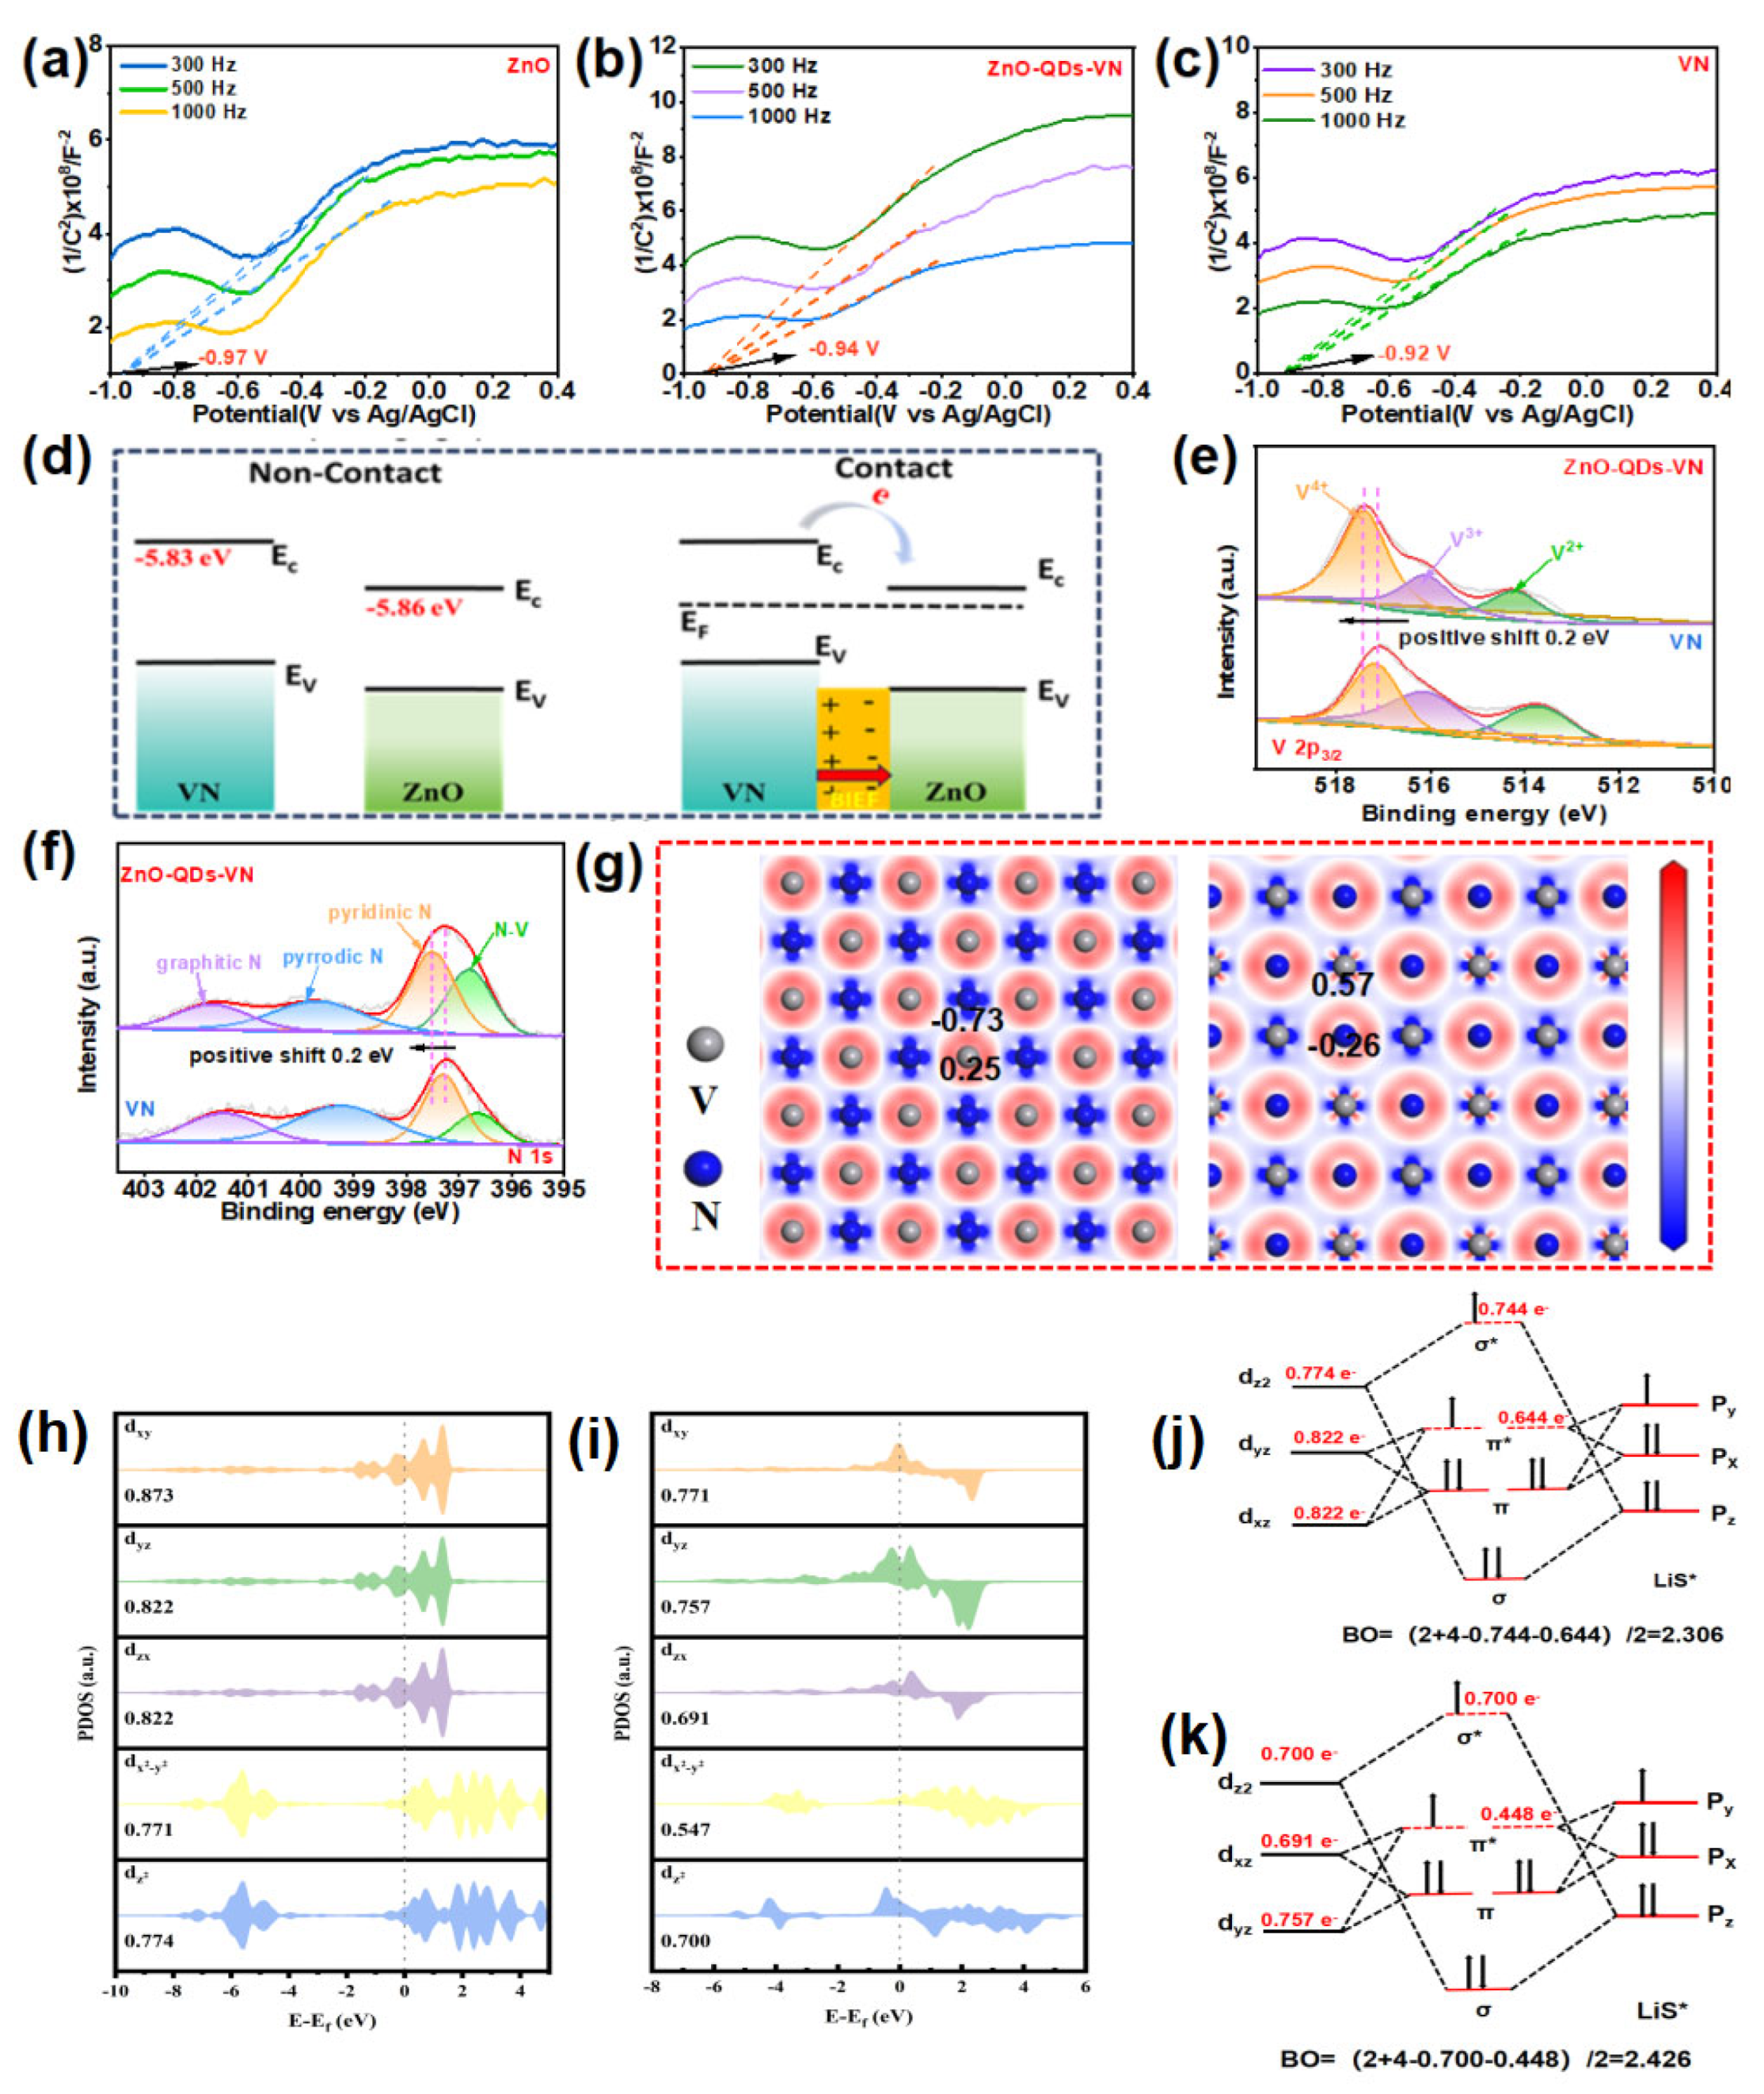
3.2. Overview of Calculation Details and Methods

Density functional theory (DFT) calculations were performed in the CASTEP code of Material Studio 2019. The generalized gradient approximation (GGA) and the Perdew–Burke–Ernzerhof (PBE) function were used for exchange-correlation energy. The k-point mesh and cutoff energy for plane-wave expansions were set to “3 × 2 × 1” and 450 eV, respectively. The atomic positions were relaxed until the force on each atom was under 0.03 eV Å−1, and the convergence tolerance of the energy was set to 10−5 eV. To avoid interplanar interactions, a vacuum space of 15 Å was applied to each slab. VN (200) and ZnO (101) were used to construct the heterostructure of ZnO-QDs-VN. All the heterostructures were matched under a 5% matching error.

3.3. Spin Configuration−Orbital Orientation

To theoretically investigate the influence of ZnO on the electron alignment within V3d-orbitals, we analyzed the electron spin states through projected density of states (PDOS) calculations. By integrating the PDOS curve near this critical energy point, one can ascertain the occupancy numbers for these orbitals, thereby elucidating changes in electron distribution among different orbital types [5]. As illustrated in Figure 2h,i, the PDOS analysis indicated that, compared to the pure VN model, there was a significant reduction in electron occupancy within both low-energy t2g and high-energy eg orbitals in the ZnO-QDs-VN model. This reduction in electron count primarily stems from ZnO’s impact on V 3d-orbitals, particularly due to bonding interactions between oxygen atoms and vanadium atoms within ZnO. The V 3d-orbital undergoes splitting into lower-energy t2g and higher-energy eg levels as a result of crystal field effects. In isolation, under relatively weak crystal fields present in VN models, energy separation between t2g and eg levels remains minimal, resulting in a relatively stable electron distribution. However, upon integration with ZnO-QDs, oxygen atoms significantly alter 3d-orbital energy distributions by interacting with V 3d electrons, a process attributed to variations stemming from oxygen atom electronegativity coupled with ZnO crystal field influences, which intensify splitting among V 3d levels while forming more discrete d-orbital groups. Consequently, under the enhanced induction of the crystal field effect with the participation of ZnO, electrons transition from a high-energy configuration (eg) to a low-energy configuration after splitting, and the orbital occupancy of the high-energy eg is significantly reduced. Furthermore, alongside diminished occupation rates within high-energy eg levels lies a concurrent decline observed within low-energy t2g orbitals. In the ZnO-QDs-VN model, the splitting of the V 3d-orbitals encompasses not only the energy elevation of the eg orbit but also alterations in the energy levels of the t2g orbitals. Consequently, some electrons may transition from their original t2g orbital to other, lower-energy orbitals, thereby diminishing electron occupancy within the t2g orbital. PDOS calculations revealed that within this model framework (ZnO-QDs-VN), due to electron transfer from higher-energy to lower-energy orbitals, there is also a decrease in low-energy orbital occupancy, which indicates an ongoing rearrangement of electron spins as well.
To further explore structural active sites within ZnO-QDs-VN, we concentrated on coupling dynamics between the 3d orbital of the V element and key intermediate orbitals throughout the reaction processes. As shown in Figure 2j,k, vanadium possesses five d-orbitals: dx²−y², d, dxy, dxz, and dyz, all exhibiting distinct energy distributions influenced by ligand field effects within an ideal octahedral coordination environment provided by ZnO-QDs-VN [28]. During the operation of lithium-sulfur batteries, lithium polysulfides (LiPSs) and Li2S are two important reaction intermediates. The electronic structure of LiPSs is mainly determined by the 3p orbitals of sulfur atoms [29]. According to the principle of orbital symmetry, the 3dz2-orbital of Voh2+ undergoes significant d-p hybridization due to its strong symmetry match with the pz orbital of S, forming σ bonds and σ* bonds. At the same time, the 3dxz and 3dyz orbitals of Voh2+ are hybridized with the 3px and 3py orbitals of S, forming weaker π and π* bonds. Compared with σ bonds, π bonds have a lower energy to form, but they play a key role in regulating the stability of the intermediate and the advancement of the reaction process [30]. It is this d-p hybridization phenomenon that determines the specific behavior of the ZnO-QDs-VN structure in the catalytic reaction through the bonding strength of different orbitals. Based on ligand field theory and molecular orbital theory, within this framework, it is observed that intermediate spin states in the ZnO-QDs-VN structure (2.426) exhibit greater stability compared to those in the VN model (2.306). This phenomenon indicates that ZnO-QDs-VN can capture LiPSs more effectively and significantly inhibit the LiPS shuttle effect.

3.4. Absorption and Catalytic Conversion Mechanism

The LiPS adsorption capacity of ZnO-QDs-VN, VN, and ZnO was analyzed by static adsorption experiments in Li2S6 solution (3 × 10⁻³ M). The Figure 3a inset shows that the ZnO-QDs-VN/Li2S6 solution becomes nearly transparent after 3 h. Nevertheless, the VN/Li2S6 solution still shows a deep yellow color at the same time. The color of the ZnO/Li2S6 solution was between that of the ZnO-QDs-VN/Li2S6 solution and VN/Li2S6 solution. The ultraviolet (UV) spectra (Figure 3a) confirmed the results, where the ZnO-QDs-VN exhibited a much weaker absorption peak at around 370 nm compared to VN and ZnO. The results further proved that the interaction between ZnO-QDs and VN can greatly enhance the adsorption capacity towards LiPSs. To gain insight into the reasons for the increased adsorption capacity, XPS tests were performed after the adsorption experiments. In the full XPS spectra (Figure S9a), a new formation peak (Li 1s) was evident, indicating that LiPSs are adsorbed on the sample. In Figure S9b, the BE of the peaks of Zn 2p1/2 and Zn 2p3/2 in ZnO-QDs-VN/Li2S6 are negatively shifted compared with ZnO-QDs-VN. In addition, the BE of both N 1s and V 2p3/2 is also shifted. Interestingly, compared to ZnO-QDS-VN, a new V-S peak appeared at 516.8 eV in V 2p3/2 of ZnO-QDS-VN/Li2S6 [30,31] (Figure 3b,c). The results suggest that there is a strong chemisorption between Li2S6 and ZnO-QDs-VN. As shown in Figure 3d, the S 2p spectrum exhibits two peaks at 163.4 and 164.6 eV, corresponding to the “bridging” sulfur (SB) and the “terminal” sulfur (ST), respectively [32]. Meanwhile, the peak located at 164 eV was identified as the formation of the sulfur–metal (S–M) bond, further confirming the chemical interaction between ZnO-QDs-VN and LiPSs. Moreover, due to the surface redox reaction between ZnO-QDs-VN and LiPSs, additional peaks were observed at 168.32 and 169.72 eV, which are attributed to the thiosulfate and sulfate, suggesting the good catalytic activity of ZnO-QDs-VN [33].
Then, the catalytic performance of various materials was analyzed through a symmetric cell test. In the cyclic voltammetry (CV) curve (Figure 3e), the ZnO-QDs-VN symmetric cell showed two pairs of distinct redox peaks, which belong to a multi-step conversion of LiPSs. A comparable phenomenon was observed in both the symmetric cells of VN and ZnO, but the redox current peak was lower than that of ZnO-QDs-VN, and the corresponding potential revealed hysteresis, indicating that the heterojunction can significantly improve the redox reaction kinetics of LiPSs [34]. The electrochemical impedance curve (EIS) was further calculated to analyze the performance, where the high-frequency region is typically associated with charge transfer resistance (Rct), while the low-frequency region is employed to quantify the diffusion resistance (Zw) of lithium ions [35,36]. In Figure 3f, one can find that the ZnO-QDs-VN symmetric cells exhibit lower charge transfer resistance and greater diffusion resistance among all samples, which reveals that forming heterojunctions can also improve the charge/Li+ transfer.
In addition, we also perform Li2S nucleation experiments to further analyze the catalytic activity of different samples towards the conversion of LiPSs. Figure 3g–i illustrate that the ZnO-QDs-VN electrode exhibits a higher precipitation peak (Ip = 0.14 mA) and a faster nucleation time (t = 2323 s) in comparison to ZnO (Ip = 0.071 mA, t = 3357 s) and VN (Ip = 0.1074 mA, t = 2830 s). Moreover, the Li2S nucleation ability of the ZnO-QDs-VN electrode (351.4 mAh g−1) has a significantly higher Li2S nucleation capacity than that of ZnO (300.4 mAh g−1) and VN (317.8 mAh g−1), confirming that the presence of ZnO-QDs enhances the kinetics and catalytic activity of LiPS conversion to Li2S. Subsequently, the Li2S dissolution experiment was conducted, as illustrated in Figure 3j–l. Compared with the electrode of ZnO (Ip = 0.54 mA, 245.3 mAh g−1, t = 1145 s) and VN (Ip = 0.628 mA, 275.6 mAh g−1, t = 1040 s), the ZnO-QDs-VN electrode exhibited a greater dissolution current response (Ip = 0.66 mA), a higher dissolution capacity (325.1 mAh g−1), and an earlier dissolution time (946 s). The above results demonstrate that ZnO-QDs-VN possesses superior redox kinetics for bidirectional sulfur conversion.

3.5. Electrochemical Performance of ZnO-QDs-VN Heterostructure Composite Materials

The electrochemical properties of the as-prepared samples were further characterized by assembling the ZnO-QDs-VN@S cathode (loading of 1.2 mg cm−2). Figure 4a depicts the CV profiles of ZnO-QDs-VN@S, ZnO@S, and VN@S cathodes under the voltage window of 1.7–2.8 V with a scan rate of 0.1 mV s−1. Two distinct reduction peaks were observed in the CV curve at 2.0 and 2.28 V, which are attributed to the reduction conversion of S8 to higher-order LiPSs, subsequently undergoing a conversion to Li2Sx (4 ≤ X ≤ 8), and finally to Li2S2/Li2S. Correspondingly, there were two distinct oxidation peaks at 2.32 and 2.4 V, attributed to the conversion of Li2S2/Li2S to Li2Sx [13]. The ZnO-QDs-VN@S exhibited higher current density and lower reaction polarization during the sulfur redox processes, further indicating the superior redox kinetics of the ZnO-QDs-VN@S cathode. Then, linear voltammetry (LSV) was used to investigate the catalytic performance for the bidirectional sulfur conversion of LiPSs (Figure S10a–c), in which the ZnO-QDs-VN@S cathode had a higher current than those of VN@S and ZnO@S in the potential range of 2.20–2.32 V, 2.02–2.10 V, and 2.28–2.44 V. The corresponding Tafel plots based on CV curves (Figure 4b–d) showed that the Tafel slope of the ZnO-QDs-VN@S cathode at A, C1, and C2 peaks were 62.31, 34.27, and 47.26 mV dec−1, respectively, lower than those of ZnO@S (74.2, 60.94, and 56.01 mV dec−1) and VN@S (68.08, 50.11, and 52.07 mV dec−1), further indicating that the ZnO-QDs-VN@S can significantly enhance the kinetics of bidirectional sulfur reactions.
To further evaluate the diffusive ability of Li+ during the reaction, the CV test was performed with scanning rates from 0.1 to 0.5 mV s−1 (Figure S11a–c). As the scanning rate was increased, the oxidation peaks were observed to shift to higher potentials, while the reduced peaks shifted to lower potentials. The shift values of ZnO-QDs-VN@S at the A, C1, and C2 peaks were 41, 79, and 17 mV, smaller than those of ZnO@S (63, 82, 40 mV) and VN@S (60, 81, 26 mV), which is a notable indicator of enhanced Li+ diffusivity and reaction kinetics. In Figure S12a–c, it can be found that the oxidation/reduction peaks’ current densities are linearly related to the square root of the scanning speed. The Li+ diffusion coefficient (Dliq) was estimated based on the classical Randles–Sevcik equation [37] (Equation (S1)). As shown in Figure S13, the peaks of ZnO-QDs-VN@S at A, C1, and C2 were 5.56 × 10⁻⁷, 1.73 × 10⁻⁷, and 0.9 × 10⁻⁷, respectively, higher than those of ZnO@S (A: 2.84 × 10⁻⁷, C1: 1.25 × 10⁻⁷, C2: 0.63 × 10⁻⁷) and VN@S (A: 4.8 × 10⁻⁷, C1: 1.39 × 10⁻⁷, C2: 0.85 × 10⁻⁷).These results indicate that ZnO-QDs-VN@S demonstrates higher lithium ion mass transfer efficiency in the electrolyte and superior interfacial ion transport kinetics. Meanwhile, they also reflect that ZnO-QDs-VN@S is favorable for enhancing Li+ diffusion capability.
Figure S14 depicts the three-times CV curves of the ZnO-QDs-VN@S cathode, in which each curve overlaps very well, suggesting that the ZnO-QDs-VN@S cathode effectively alleviates the dissolution of LiPSs and improves the reversible conversion of the charge–discharge process. In constant-current charge–discharge (GCD) curves of as-prepared samples (Figure 4e), there were two platforms in the discharge curve; the first platform was the conversion of S8 to Li2Sx (4 ≤ X ≤ 8), and the second platform was the conversion of long-chain LiPSs to short-chain Li2S2/Li2S [38,39]. The discharge capacities of ZnO-QDs-VN@S in the first and second platforms were 398.6 and 891.2 mAh g−1, much higher than those of ZnO@S (335.9, 691.5 mAh g−1) and VN@S (392.7, 837.2 mAh g−1). The catalytic efficiency of LiPSs can be further analyzed by the emission platform capacity ratio between the first and second platforms [40], and the corresponding platform capacity ratios were 2.24, 2.05, and 2.13 for ZnO-QDs-VN@S, ZnO@S, and VN@S, respectively (Table S3). In addition, the ZnO-QDs-VN@S cathode displayed a smaller polarization potential of only 132 mV, superior to the ZnO@S (ΔV = 169 mV) and VN@S (ΔV = 151 mV) cathodes. The results further prove that ZnO-QDs-VN@S possesses excellent catalytic ability for polysulfide redox reactions.
The internal resistance of the ZnO-QDs-VN@S cathode during the discharge and charge cycles was measured utilizing the constant current intermittent titration technique (GITT) [41]. In Figure 4f–h, the ZnO-QDs-VN@S cathode exhibits two discharge platforms with a higher discharge capacity of 1200.1 mAh g−1, smaller polarization potential ΔE = 186 mV, and better Coulomb efficiency of 94.23% compared to the VN@S cathode (1144.2 mAh g−1, 87.0%, 205 mV) and ZnO@S cathode (1069 mAh g−1, 82.93%, 212 mV), indicating the high sulfur utilization in the ZnO-QDs-VN@S cathode. According to the results of the conducted GITT tests, the calculation formula for the lithium ion diffusion coefficient (DLi+) was calculated with the Wagner equation [40] (Equation (S2)). As shown in Figure 4i, the Li+ diffusion coefficient of ZnO-QDs-VN@S was 1.26 × 10⁻⁷, which was higher than that of ZnO@S (0.57 × 10⁻⁷) and VN@S (0.86 × 10⁻⁷), respectively. It reflects the real kinetic characteristics of the ZnO-QDs-VN@S electrode under limited diffusion conditions, contributing to the enhancement of the battery’s cycle stability. Furthermore, the internal resistance during lithiation/dehydrogenation was measured using the following equation [22,42] (Equation (S3)). As illustrated in Figure 5a,b, the ZnO-QDs-VN@S cathode exhibited a reduction in resistance during the charging and discharging processes compared with the VN@S and ZnO@S cathodes, further suggesting that the ZnO-QDs-VN@S cathode is capable of enhancing the chemical anchoring and catalytic reaction of LiPSs.
Additionally, EIS tests were conducted before and after 100 and 150 cycles of the battery to assess its conductivity. In the Nyquist plots (Figure 5c,d), the ZnO-ODs-VN@S cathode exhibits the lowest Ret value among all samples. This finding demonstrates that the ZnO-ODs-VN battery possesses excellent fast charge and ion transfer capabilities, accelerating the redox reaction kinetics of sulfur. Due to the penetration of the electrolyte, the active material on the electrode surface was redispersed after cycling. Therefore, both Rct and Zw were smaller than those before cycling (Figure S15a,b) [11]. By comparing the Rct and Zw of the ZnO-QDs-VN@S, VN@S, and ZnO@S cathodes before and after cycling, the study shows that with the increase in battery cycle times, the charge transfer resistance (Rct) presents a downward trend. This phenomenon may be related to the following mechanisms. First, during the cycling process, more stable catalytic sites gradually form at the interface between the active material and the carrier (ZnO-QDS-VN@S structure), accelerating the electrochemical reaction kinetics and thereby reducing the Rct. Second, although the cycle may be accompanied by some structural changes, the unique porous structure in the material design (the highly conductive skeleton of VN) continuously optimizes the lithium-ion/electron transport path, offsetting part of the increase in mass transfer resistance. Additionally, the results further confirm that the ZnO-QDs-VN@S cathode exhibits a higher electron transfer rate and stronger electron transfer capability.
Figure 5e shows the rate performance of the prepared materials. The ZnO-QDs-VN@S cathode expressed high specific capacities at 0.1, 0.2, 0.5, 1.0, 2.0, 3.0, and 4.0 C, which were 1382.9, 1189.9, 1148.7, 1084.8, 1019.2, 935.3, and 800.5 mAh g−1, respectively, higher than those of the ZnO@S cathode and VN@S cathode. Upon returning the current rate to 0.1 C, the specific capacity could be recovered to 1330.1 mAh g−1, representing 96.23% of the initial capacity, demonstrating exceptional rate performance. The corresponding charge–discharge curves at different current densities (Figure 5f and Figure S16a,b) showed that the ZnO-QDs-VN@S cathode still expressed two well-defined discharge voltage plateaus even at the ultra-high 3.0 C, which further indicates the effective adsorption and conversion of LiPSs on the ZnO-QDs-VN surface. Moreover, by comparing the differences in the corresponding GCD spectra of the prepared samples (Figure S16c), ZnO-QDs-VN@S showed a lower polarization value at different current densities.
Figure 5g illustrates the long-term cycling durability tests, which demonstrated that the initial capacity of the ZnO-QDs-VN@S cathode was 1329.3 mAh g−1 at 0.1 C. Following 100 cycles, the specific capacity was observed to remain at 1210.1 mAh g−1, while the coulombic efficiency was recorded at 92%. These values were better than those of the ZnO@S cathode (1034.4 mAh g−1, 89%) and VN@S cathode (1038.7 mAh g−1, 91.8%). At 0.5 C, the ZnO-QDs-VN@S cathode also displayed a high initial specific capacity of 1135.6 mAh g−1, and could still maintain a capacity of 911.89 mAh g−1 after 500 cycles with a coulombic efficiency of 84.3% (Figure S17a). Moreover, in Figure 5h, one can find that the ZnO-QDs-VN@S cathode also exhibits excellent stability even at 1.0 C, which can be maintained at 984.4 mAh g−1 after 500 cycles with a high coulombic efficiency of 88.7%. In contrast, the capacity of the ZnO@S and VN@S cathodes underwent a sharp decrease after 500 cycles, dropping to only 259.6 and 471.4 mAh g−1, respectively. Even at 2.0 and 3.0 C (Figure S17b,c), the ZnO-QDs-VN@S cathode still exhibited remarkable cycling stability, with specific capacities remaining at 840.5 (0.044% decay per cycle) and 687.9 mAh g−1 (0.056% decay per cycle) after 500 cycles, respectively.
The performance of the ZnO-QDs-VN@S cathode under high sulfur mass loading was further investigated. In Figure 5i, ZnO-QDs-VN@S with high S loading (7.0 mg cm−2) exhibits a high initial areal capacity of 8.107 mAh cm−2 at 0.2 C. Moreover, when the S loading mass further increases to 8.5 mg cm−2, ZnO-QDs-VN@S also provides a relatively high initial area capacity of 10.258 mAh cm−2, and after 100 cycles, the capacity retention rate is 62.65%. However, the VN@S cathode under high S loading displays a low initial area capacity of only 6.042 and 7.308 mAh cm−2, with capacity retention rates of 54.05% and 52.25%, respectively (Figure S18). The findings demonstrate that ZnO-QDs-VN, which exhibits high performance as a sulfur host, is capable of facilitating the sulfur reaction kinetics even under high sulfur loading. Its capability even surpasses that of the majority of advanced sulfur host materials that have been reported in LSBs (Table S4).

4. Conclusions

In short, we have successfully synthesized an in situ nanoreactor of a zinc oxide dots-modified vanadium nitride flower-like heterojunction (Zn-QDs-VN) with a phase separation strategy as a multifunctional sulfur host material for LSBs. Various characterization and electrochemical tests indicated that the unique heterostructure of ZnO-QDs-VN increases the sulfur loading, promotes the bidirectional catalytic conversion of LiPSs, effectively suppresses the shuttle effect of LiPSs, enhances the rapid transfer of electrons/ions, and accelerates the entire redox reaction kinetics. Further theoretical computations demonstrated that ZnO-QDs-VN with optimized intermediate spin states can form a stable LiS* bond sequence, which can significantly promote the adsorption and conversion of LiPSs and reduce the energy barrier in the battery reaction. As a consequence, the ZnO-QDs-VN@S cathode exhibits excellent electrochemical performance. The ZnO-QDs-VN@S cathode can reach a high initial specific capacity of 960.8 mAh g−1 even at 3.0 C and maintains a specific capacity of 687.9 mAh g−1 after 500 cycles, with a decay rate of 0.056% per cycle. Moreover, under high sulfur loading (8.5 mg cm−2), the ZnO-QDs-VN@S cathode can maintain a high initial area capacity of 10.258 mAh cm−2 at 0.2 C and has good durability (CR of 62.65% after 100 cycles). The study provides a new method for designing heterojunctions to achieve high-performance LSBs.

5. Prospects

In summary, due to poor cycle stability and the obvious “shuttle effect”, the commercialization process for LSBs has encountered severe challenges. To address this issue, this study focused on constructing a ZnO-QDs-VN heterostructure, aiming to accelerate the catalytic conversion rate of LiPSs and deeply analyze the mechanism of the ZnO-QDs-VN catalyst on LiPSs. Meanwhile, the internal structure of the ZnO-QDs-VN heterojunction and its intrinsic relationship with the adsorption/catalytic behavior of LiPSs were also deeply studied. Although certain research achievements have been made, it is still necessary to conduct in-depth and systematic research on the related mechanisms. Currently, the following prospects are proposed for subsequent research:
  • Deepen the analysis of application potential. Through systematic research on industry data (such as production costs and process parameters of similar materials), combined with existing experimental data, conduct a preliminary feasibility assessment of the synthetic method from the perspectives of raw material economy and process complexity, and clarify the gap between current research and practical application.
  • Strengthen cross-disciplinary cooperation. We have reached initial cooperation agreements with certain enterprises and plan to jointly conduct pilot-scale amplification experiments in subsequent research, optimize the synthesis process in line with the demands of the enterprises, and verify the performance of the materials under actual working conditions.
  • Adjust the research focus. In line with recommendations, we will reduce some repetitive electrochemical characterization content and instead focus on the synthesis mechanism during the synthesis process, providing theoretical support for subsequent process optimization through mechanism analysis.

Supplementary Materials

The following supporting information can be downloaded at: https://www.mdpi.com/article/10.3390/ma18112639/s1, Figure S1: SEM images for (a) VN, and (b) ZnO-QDs-VN@S, Figure S2: XRD patterns of (a) ZnO-QDs-VN, VN, and ZnO, (b) ZnO-QDs-VN@S, Figure S3: TEM images of ZnO-QDs-VN at different magnifications, Figure S4: The XRD patterns of the refined (a) VN, (b) ZnO-QDs-VN, and (c) ZnO, Figure S5: BET adsorption-desorption isotherms of (a) ZnO-QDs-VN, (b) VN, (c) ZnO-QDs-VN@S, Figure S6:TGA of ZnO-QDs-VN@S, VN@S, and ZnO@S. Figure S7: (a) XPS survey scan of ZnO-QDs-VN, (b) High-resolution XPS spectra of Zn 2p, Figure S8: Schematic diagram of differential charge density of (a) ZnO, (b) ZnO-QDs-VN, Figure S9: (a) XPS survey scan of ZnO-QDs-VN/Li2S6, High-resolution XPS profiles (b) Zn 2p regions of ZnO-QDs-VN after soaking in Li2S6, Figure S10: LSV curves at around (a) A, (b) C1, and (c) C2 of ZnO-QDs-VN@S, ZnO@S, and VN@S, Figure S11: CV curves of ZnO-QDs-VN@S, ZnO@S, and VN@S at the rate of 0.1–0.5 mV s−1, Figure S12: (a) A, (b) C1, and (c) C2 peak current and square root of scan rate, Figure S13: Li+ diffusion coefficients calculated from CV curves for different cathodes, Figure S14: Three cycles of CV curves of ZnO-QDs-VN@S cathode at 0.5 mV s−1, Figure S15: (a) EIS curves of ZnO-QDs-VN@S, ZnO@S, and VN@S after 100 cycles (data are mean ± 2.2 Ω from three independent experiments), (b) EIS curves of ZnO-QDs-VN@S, ZnO@S, and VN@S after 150 cycles (data are mean ± 1.8 Ω from three independent experiments), Figure S16: (a,b) Charging and discharging curves of LSBs assembled at different speeds with ZnO@S and VN@S cathodes, (c) The voltage differences of LSBs fabricated with distinct cathode materials at different rates, Figure S17: (a–c) Cycle performance of ZnO-QDs-VN@S at 0.5 C, 2.0 C, and 3.0 C, Figure S18: The areal capacity of VN@S cathodes under 0.2 C with high sulfur loading, Table S1: High-resolution fitting parameter table of ZnO-QDs-VN. Table S2: High-resolution fitting parameter table of VN, Table S3: The discharge capacity and ratio between the two discharge platforms, Table S4: Comparison of the ZnO-QDs-VN@S performance with other published Works. Equation (S1): Calculation of DLi+ from CV curves, Equation (S2): Calculation of DLi+ from GITT curves, Equation (S3): Calculation of internal resistance from GITT. Refs. [43,44,45,46] are cited in Supplementary Materials.

Author Contributions

Data curation: N.C. and W.Z. Formal analysis: N.C., D.Z. and N.W. Methodology: N.C., M.C., and N.W. Software: N.C., K.Y., H.Z. and A.W. Writing-original draft: N.C. Conceptualization: W.Z., M.C. and D.Z. Supervision: W.Z., M.C., D.Z. and L.L. Validation: W.Z., M.C., K.Y., H.Z. and A.W. Investigation: K.Y., H.Z. and A.W. Writing—review & editing: D.Z., N.W., L.L. Resources: N.W. and L.L. Funding acquisition: L.L. All authors have read and agreed to the published version of the manuscript.

Funding

National Natural Science Foundation of China: No. 22209056 and No. 52161033; Natural Science Foundation of Guangdong Province: No. 2024A1515010274; Guangdong Basic and Applied Basic Research Foundation: 2023A1515010270; Science and Technology Planning Project of Guangzhou: 201605030008; Key Research & Development and Promotion Projects in Henan Province: No. 242102241033.

Institutional Review Board Statement

Not applicable.

Informed Consent Statement

Not applicable.

Data Availability Statement

The original contributions presented in the study are included in the article/supplementary material, further inquiries can be directed to the corresponding author.

Conflicts of Interest

The authors declare no conflict of interest.

References

  1. He, J.; Manthiram, A. A review on the status and challenges of electrocatalysts in lithium-sulfur batteries. Energy Storage Mater. 2019, 20, 55–70. [Google Scholar] [CrossRef]
  2. Pan, Z.; Brett, D.J.L.; He, G.; Parkin, I.P. Progress and Perspectives of Organosulfur for Lithium–Sulfur Batteries. Adv. Energy Mater. 2022, 12, 2103483. [Google Scholar] [CrossRef]
  3. Nong, S.; Huang, D.; Li, Y.; Yang, R.; Xie, J.; Li, J.; Huang, H.; Liang, X.; Li, G.; Lan, Z.; et al. Multifunction-balanced porous carbon and its application in sulfur-loading host and separator modification for lithium–sulfur batteries. J. Energy Storage 2024, 81, 110296. [Google Scholar] [CrossRef]
  4. Feng, S.; Fu, Z.-H.; Chen, X.; Zhang, Q. A review on theoretical models for lithium–sulfur battery cathodes. InfoMat 2022, 4, e12304. [Google Scholar] [CrossRef]
  5. Wei, Y.; Tao, Y.; Zhang, C.; Wang, J.; Qiao, W.; Ling, L.; Long, D. Layered carbide-derived carbon with hierarchically porous structure for high rate lithium-sulfur batteries. Electrochim. Acta 2016, 188, 385–392. [Google Scholar] [CrossRef]
  6. Gu, Q.; Qi, Y.; Chen, J.; Lu, M.; Zhang, B. Cobalt Nanoparticles Loaded on MXene for Li-S Batteries: Anchoring Polysulfides and Accelerating Redox Reactions. Small 2022, 18, 2204005. [Google Scholar] [CrossRef]
  7. Zhao, X.; Guan, Y.; Du, X.; Liu, G.; Li, J.; Li, G. Ordered macroporous V-doped ZnO framework impregnated with microporous carbon nanocages as multifunctional sulfur reservoir in lithium-sulfur batteries. Chem. Eng. J. 2022, 431, 134242. [Google Scholar] [CrossRef]
  8. Li, Z.; Zhang, J.; Lou, X.W. Hollow Carbon Nanofibers Filled with MnO2 Nanosheets as Efficient Sulfur Hosts for Lithium–Sulfur Batteries. Angew. Chem. Int. Ed. 2015, 54, 12886–12890. [Google Scholar] [CrossRef]
  9. Wang, N.; Chen, B.; Qin, K.; Liu, E.; Shi, C.; He, C.; Zhao, N. Rational design of Co9S8/CoO heterostructures with well-defined interfaces for lithium sulfur batteries: A study of synergistic adsorption-electrocatalysis function. Nano Energy 2019, 60, 332–339. [Google Scholar] [CrossRef]
  10. Tian, K.; Wei, C.; Wang, Z.; Li, Y.; Xi, B.; Xiong, S.; Feng, J. Heterogenization-Activated Zinc Telluride via Rectifying Interfacial Contact to Afford Synergistic Confinement-Adsorption-Catalysis for High-Performance Lithium−Sulfur Batteries. Small 2024, 20, 2309422. [Google Scholar] [CrossRef]
  11. Zhong, Y.; Chao, D.; Deng, S.; Zhan, J.; Fang, R.; Xia, Y.; Wang, Y.; Wang, X.; Xia, X.; Tu, J. Confining Sulfur in Integrated Composite Scaffold with Highly Porous Carbon Fibers/Vanadium Nitride Arrays for High-Performance Lithium–Sulfur Batteries. Adv. Funct. Mater. 2018, 28, 1706391. [Google Scholar] [CrossRef]
  12. Ye, C.; Jiao, Y.; Jin, H.; Slattery, A.D.; Davey, K.; Wang, H.; Qiao, S.-Z. 2D MoN-VN Heterostructure To Regulate Polysulfides for Highly Efficient Lithium-Sulfur Batteries. Angew. Chem. Int. Ed. 2018, 57, 16703–16707. [Google Scholar] [CrossRef] [PubMed]
  13. Yang, X.; Chen, S.; Gong, W.; Meng, X.; Ma, J.; Zhang, J.; Zheng, L.; Abruña, H.D.; Geng, J. Kinetic Enhancement of Sulfur Cathodes by N-Doped Porous Graphitic Carbon with Bound VN Nanocrystals. Small 2020, 16, 2004950. [Google Scholar] [CrossRef] [PubMed]
  14. Cai, D.; Zhuang, Y.; Fei, B.; Zhang, C.; Wang, Y.; Chen, Q.; Zhan, H. Self-supported VN arrays coupled with N-doped carbon nanotubes embedded with Co nanoparticles as a multifunctional sulfur host for lithium-sulfur batteries. Chem. Eng. J. 2022, 430, 132931. [Google Scholar] [CrossRef]
  15. Jing, E.; Chen, L.; Xu, S.; Tian, W.; Zhang, D.; Wang, N.; Bai, Z.; Zhou, X.; Liu, S.; Duan, D.; et al. Dual redox catalysis of VN/nitrogen-doped graphene nanocomposites for high-performance lithium-sulfur batteries. J. Energy Chem. 2022, 64, 574–582. [Google Scholar] [CrossRef]
  16. Ma, W.; Shao, Z.; Yao, J.; Zhao, K.; Ma, X.; Wu, L.; Zhang, X. Mott-Schottky electrocatalyst selectively mediates the sulfur species conversion in lithium-sulfur batteries. J. Colloid Interface Sci. 2023, 631, 114–124. [Google Scholar] [CrossRef]
  17. Zheng, Y.; Yi, Y.; Fan, M.; Liu, H.; Li, X.; Zhang, R.; Li, M.; Qiao, Z.-A. A high-entropy metal oxide as chemical anchor of polysulfide for lithium-sulfur batteries. Energy Storage Mater. 2019, 23, 678–683. [Google Scholar] [CrossRef]
  18. Xiong, W.; Lin, J.; Wang, H.; Li, S.; Wang, J.; Mao, Y.; Zhan, X.; Wu, D.-Y.; Zhang, L. Construction of strong built-in electric field in binary metal sulfide heterojunction to propel high-loading lithium-sulfur batteries. J. Energy Chem. 2023, 81, 492–501. [Google Scholar] [CrossRef]
  19. Fan, L.; Zhang, Y.; Zhang, Q.; Wu, X.; Cheng, J.; Zhang, N.; Feng, Y.; Sun, K. Graphene Aerogels with Anchored Sub-Micrometer Mulberry-Like ZnO Particles for High-Rate and Long-Cycle Anode Materials in Lithium Ion Batteries. Small 2016, 12, 5208–5216. [Google Scholar] [CrossRef]
  20. Ma, X.; Li, Z.; Chen, D.; Li, Z.; Yan, L.; Li, S.; Liang, C.; Ling, M.; Peng, X. Nitrogen-doped porous carbon sponge-confined ZnO quantum dots for metal collector-free lithium ion battery. J. Electroanal. Chem. 2019, 848, 113275. [Google Scholar] [CrossRef]
  21. Wei, S.; Wang, C.; Chen, S.; Zhang, P.; Zhu, K.; Wu, C.; Song, P.; Wen, W.; Song, L. Dial the Mechanism Switch of VN from Conversion to Intercalation toward Long Cycling Sodium-Ion Battery. Adv. Energy Mater. 2020, 10, 1903712. [Google Scholar] [CrossRef]
  22. Wang, Y.; Zhu, L.; Wang, J.; Zhang, Z.; Yu, J.; Yang, Z. Enhanced chemisorption and catalytic conversion of polysulfides via CoFe@NC nanocubes modified separator for superior Li–S batteries. Chem. Eng. J. 2022, 433, 133792. [Google Scholar] [CrossRef]
  23. Pang, Q.; Sun, C.; Yu, Y.; Zhao, K.; Zhang, Z.; Voyles, P.M.; Chen, G.; Wei, Y.; Wang, X. H2V3O8 Nanowire/Graphene Electrodes for Aqueous Rechargeable Zinc Ion Batteries with High Rate Capability and Large Capacity. Adv. Energy Mater. 2018, 8, 1800144. [Google Scholar] [CrossRef]
  24. Zhou, W.; Zhao, D.; Wu, Q.; Dan, J.; Zhu, X.; Lei, W.; Ma, L.-J.; Li, L. Rational Design of the Lotus-Like N-Co2VO4-Co Heterostructures with Well-Defined Interfaces in Suppressing the Shuttle Effect and Dendrite Growth in Lithium–Sulfur Batteries. Small 2021, 17, 2104109. [Google Scholar] [CrossRef]
  25. Wang, W.-P.; Zhang, J.; Chou, J.; Yin, Y.-X.; You, Y.; Xin, S.; Guo, Y.-G. Solidifying Cathode–Electrolyte Interface for Lithium–Sulfur Batteries. Adv. Energy Mater. 2021, 11, 2000791. [Google Scholar] [CrossRef]
  26. Wang, Z.; Huang, W.; Wu, H.; Wu, Y.; Shi, K.; Li, J.; Zhang, W.; Liu, Q. 3d-Orbital High-Spin Configuration Driven From Electronic Modulation of Fe3O4/FeP Heterostructures Empowering Efficient Electrocatalyst for Lithium−Sulfur Batteries. Adv. Funct. Mater. 2024, 34, 2409303. [Google Scholar] [CrossRef]
  27. Cui, M.; Zheng, Z.; Wang, J.; Wang, Y.; Zhao, X.; Ma, R.; Liu, J. Rational design of Lithium-Sulfur battery cathodes based on differential Atom Electronegativity. Energy Storage Mater. 2021, 35, 577–585. [Google Scholar] [CrossRef]
  28. Zheng, C.; Zhang, X.; Zhou, Z.; Hu, Z. A first-principles study on the electrochemical reaction activity of 3d transition metal single-atom catalysts in nitrogen-doped graphene: Trends and hints. eScience 2022, 2, 219. [Google Scholar] [CrossRef]
  29. Yao, Y.; Wang, H.; Yang, H.; Zeng, S.; Xu, R.; Liu, F.; Shi, P.; Feng, Y.; Wang, K.; Yang, W.; et al. A Dual-Functional Conductive Framework Embedded with TiN-VN Heterostructures for Highly Efficient Polysulfide and Lithium Regulation toward Stable Li–S Full Batteries. Adv. Mater. 2020, 32, 1905658. [Google Scholar] [CrossRef]
  30. Zhou, W.; Chen, M.; Zhao, D.; Zhu, C.; Wang, N.; Lei, W.; Guo, Y.; Li, L. Engineering Spin State in Spinel Co3O4 nanosheets by V-Doping for Bidirectional Catalysis of Polysulfides in Lithium–Sulfur Batteries. Adv. Funct. Mater. 2024, 34, 2402114. [Google Scholar] [CrossRef]
  31. Dan, J.; Zhou, W.; Chen, M.; Zhu, C.; Li, S.; Zhao, D.; Li, L.; An, M. Cobalt-Carbon nanotubes supported on V2O3 nanorods as sulfur hosts for High-performance Lithium-Sulfur batteries. J. Colloid Interface Sci. 2023, 640, 877–889. [Google Scholar] [CrossRef] [PubMed]
  32. Huang, S.; Wang, Z.; Von Lim, Y.; Wang, Y.; Li, Y.; Zhang, D.; Yang, H.Y. Recent Advances in Heterostructure Engineering for Lithium–Sulfur Batteries. Adv. Energy Mater. 2021, 11, 2003689. [Google Scholar] [CrossRef]
  33. Xia, J.; Hua, W.; Wang, L.; Sun, Y.; Geng, C.; Zhang, C.; Wang, W.; Wan, Y.; Yang, Q.-H. Boosting Catalytic Activity by Seeding Nanocatalysts onto Interlayers to Inhibit Polysulfide Shuttling in Li–S Batteries. Adv. Funct. Mater. 2021, 31, 2101980. [Google Scholar] [CrossRef]
  34. Chu, F.; Wang, M.; Liu, J.; Guan, Z.; Yu, H.; Liu, B.; Wu, F. Low Concentration Electrolyte Enabling Cryogenic Lithium–Sulfur Batteries. Adv. Funct. Mater. 2022, 32, 2205393. [Google Scholar] [CrossRef]
  35. Li, J.; Jiang, Y.; Zhang, Z.; Tsuji, M.; Miyazaki, M.; Kitano, M.; Hosono, H. Barium Oxynitride Electride as Highly Enhanced Promotor for Ruthenium Catalyst in Ammonia Synthesis: Comparative Study with Barium Oxide. Adv. Energy Mater. 2023, 13, 2302424. [Google Scholar] [CrossRef]
  36. Capkova, D.; Knap, V.; Fedorkova, A.S.; Stroe, D.-I. Analysis of 3.4 Ah lithium-sulfur pouch cells by electrochemical impedance spectroscopy. J. Energy Chem. 2022, 72, 318–325. [Google Scholar] [CrossRef]
  37. Yi, T.-F.; Wei, T.-T.; Li, Y.; He, Y.-B.; Wang, Z.-B. Efforts on enhancing the Li-ion diffusion coefficient and electronic conductivity of titanate-based anode materials for advanced Li-ion batteries. Energy Storage Mater. 2020, 26, 165–197. [Google Scholar] [CrossRef]
  38. Yu, H.; Zhang, B.; Sun, F.; Jiang, G.; Zheng, N.; Xu, C.; Li, Y. Core-shell polyhedrons of carbon nanotubes-grafted graphitic carbon@nitrogen doped carbon as efficient sulfur immobilizers for lithium-sulfur batteries. Appl. Surf. Sci. 2018, 450, 364–371. [Google Scholar] [CrossRef]
  39. Wu, K.; Lu, G.; Huang, B.; Hu, Z.; Lv, Y.; Younus, H.A.; Wang, X.; Liu, Z.; Zhang, S. Entropy-Driven Highly Chaotic MXene-Based Heterostructures as an Efficient Sulfur Redox Electrocatalysts for Li-S Battery. Adv. Funct. Mater. 2024, 34, 2404976. [Google Scholar] [CrossRef]
  40. Zeng, P.; Yu, H.; Chen, M.; Xiao, W.; Li, Y.; Liu, H.; Luo, J.; Peng, J.; Shao, D.; Zhou, Z.; et al. Flower-like ZnO modified with BiOI nanoparticles as adsorption/catalytic bifunctional hosts for lithium–sulfur batteries. J. Energy Chem. 2020, 51, 21–29. [Google Scholar] [CrossRef]
  41. Wang, Y.; Liu, T.; Estevez, L.; Kumar, J. Kinetics of all-solid-state sulfur cathodes. Energy Storage Mater. 2020, 27, 232–243. [Google Scholar] [CrossRef]
  42. Zhang, X.; Li, G.; Zhang, Y.; Luo, D.; Yu, A.; Wang, X.; Chen, Z. Amorphizing metal-organic framework towards multifunctional polysulfide barrier for high-performance lithium-sulfur batteries. Nano Energy 2021, 86, 106094. [Google Scholar] [CrossRef]
  43. Jian, Z.; Zhang, S.; Guan, X.; Li, J.; Li, H.; Wang, W.; Xing, Y.; Xu, H. ZnO quantum dot-modified rGO with enhanced electrochemical performance for lithium–sulfur batteries. RSC Adv. 2020, 10, 32966–32975. [Google Scholar] [CrossRef] [PubMed]
  44. Fu, J.; Shen, Z.; Cai, D.; Fei, B.; Zhang, C.; Wang, Y.; Chen, Q.; Zhan, H. A hierarchical VN/Co3ZnC@NCNT composite as a multifunctional integrated host for lithium–sulfur batteries with enriched adsorption sites and accelerated conversion kinetics. J. Mater. Chem. A 2022, 10, 20525–20534. [Google Scholar] [CrossRef]
  45. Li, N.; Xu, Z.; Wang, P.; Zhang, Z.; Hong, B.; Li, J.; Lai, Y. High-rate lithium-sulfur batteries enabled via vanadium nitride nanoparticle/3D porous graphene through regulating the polysulfides transformation. Chem. Eng. J. 2020, 398, 125432. [Google Scholar] [CrossRef]
  46. Xu, P.; Liu, H.; Zeng, Q.; Li, X.; Li, Q.; Pei, K.; Zhang, Y.; Yu, X.; Zhang, J.; Qian, X.; et al. Yolk−Shell Nano ZnO@Co-Doped NiO with Efficient Polarization Adsorption and Catalysis Performance for Superior Lithium−Sulfur Batteries. Small 2021, 17, 2005227. [Google Scholar] [CrossRef]
Figure 1. (a) Schematic diagram of the synthesis of ZnO-QDs-VN@S (The red dots represent zinc oxide quantum dots, and the yellow dots denote sulfur). (b,c) SEM images of Zn3(OH)2(V2O7)(H2O)2 and ZnO-QDs-VN. (d–f) TEM and HRTEM images of ZnO-QDs-VN (Inset: the SAED pattern and FFT plots). (g) Model of ZnO/VN heterojunction. (h) Schematic diagram of the activity enhancement mechanism (the orange spheres represent zinc oxide, and the cyan spheres denote vanadium nitride). (i) Element mappings (C, O, N, V, Zn) of ZnO-QDs-VN.
Materials 18 02639 g001
Figure 2. Mott–Schottky plots of (a) ZnO, (b) ZnO-QDs-VN, and (c) VN at different frequencies. (d) Schematic diagram of band structure before and after contact between VN and ZnO. High-resolution XPS spectra of (e) V 2 p3/2, (f) N 1s. (g) Schematic diagram of differential charge density of VN, ZnO-QDs-VN. The PDOS of (h) VN, (i) ZnO-QDs-VN. Schematic diagram of the MO showing the coupling of the LiS* reaction intermediate with the V sites on (j) VN and (k) ZnO-QDs-VN.
Materials 18 02639 g002
Figure 3. (a) UV absorption spectra of Li2S6 solutions assimilated by VN, ZnO-QDs-VN, and ZnO powders, in which the illustration is a direct result of Li2S6 adsorption experiments. High-resolution XPS profiles of (b) N 1s, (c) V 2p, and (d) S 2p regions of ZnO-QDs-VN after soaking in Li2S6. (e) CV of symmetric cells for ZnO-QDs-VN, VN, and ZnO. (f) Nyquist plots of ZnO-QDs-VN, VN, and ZnO. Chronoamperometric profiles of nucleation measurements of (g) ZnO-QDs-VN, (h) ZnO, and (i) VN. Chronoamperometric profiles of Li2S dissolution tests for (j) ZnO-QDs-VN, (k) ZnO, and (l) VN.
Materials 18 02639 g003
Figure 4. (a) The CV curves of the ZnO-QDs-VN@S, VN@S, and ZnO@S at the rate of 0.1 mV s−1 in the voltage range of 1.7–2.8 V. Tafel plots of oxidation peak at around (b) A, reduction peak at around (c) C1, and (d) C2 of ZnO-QDs-VN@S, ZnO@S, and VN@S. (e) Typical charge and discharge platform for ZnO-QDs-VN@S, VN@S, and ZnO@S at 0.1 C. GITT voltage curve of (f) ZnO-QDs-VN@S, (g) VN@S, and (h) ZnO@S cathode. (i) Lithium ion diffusion coefficients calculated from GITT tests for different cathodes.
Materials 18 02639 g004
Figure 5. Reaction resistance of the LSBs with various separators during the (a) charge and (b) discharge processes. (c) EIS curves of ZnO-QDs-VN@S, ZnO@S, and VN@S (the data are the means of three independent experiments ± 2.8 Ω). (d) The relationship between Z’ and ω1/2 with a frequency range between 3.5 and 0.5 Hz (symbols, real data; lines, fitting curves) of ZnO-QDs-VN@S, ZnO@S, and VN@S cathodes. (e) Charge/discharge profiles of LSBs assembled with ZnO-QDs-VN samples at 0.1–4.0 current densities. (f) Charge/discharge curves of ZnO-QDs-VN@S, VN@S, and ZnO@S in different current densities (The red, orange, green, cyan, purple, and blue lines represent the charge-discharge curves of the ZnO-QDs-VN@S cathode at 0.1 C, 0.2 C, 0.5 C, 1.0 C, 2.0 C, and 3.0 C, respectively). (g) Cycle performance of ZnO-QDs-VN@S, VN@S, and ZnO@S cathode at 0.1 C. (h) Cycle performance of ZnO-QDs-VN@S at 1.0 C. (i) The areal capacity of ZnO-QDs-VN@S cathodes under 0.2 C with high sulfur loading.
Materials 18 02639 g005
Disclaimer/Publisher’s Note: The statements, opinions and data contained in all publications are solely those of the individual author(s) and contributor(s) and not of MDPI and/or the editor(s). MDPI and/or the editor(s) disclaim responsibility for any injury to people or property resulting from any ideas, methods, instructions or products referred to in the content.

