3.1. Synthesis Mechanism of FePO4·2H2O
Fe and Ni are located in the eighth group of the fourth period in the periodic table. Both elements have two outer electrons in their outermost orbitals, making it easy for them to lose these electrons to form Fe
2+ and Ni
2+ during electrochemical reactions [
12]. After completion of anodic oxidation, 30% hydrogen peroxide is added to oxidize Fe
2+ to Fe
3+. The completeness of Fe
2+ oxidation by H
2O
2 is thermodynamically ensured by the redox potential difference. The standard oxidation potential of H
2O
2 (E
0 = +1.76 V vs. SHE) significantly exceeds that of Fe
2+/Fe
3+ (E
0 = +0.77 V vs. SHE). With 30% H
2O
2 in 5-fold stoichiometric excess and a 1 h reaction time, the Gibbs free energy change (ΔG = −237 kJ/mol) confirms spontaneous and complete oxidation, consistent with prior reports [
25]. Ni already has eight electrons in the next-to-outermost orbital; hence, no change occurs in the oxidation state of Ni
2+. In the solution, Fe
3+ combines with PO
43− to form an FePO
4·xH
2O precipitate; moreover, Ni
2+ remains in the ionic form under acidic conditions and does not form a precipitate with PO
43− [
17]. This is because the solubility of iron phosphate is considerably low in acidic environments. When PO
43− binds to Fe
3+, the resulting iron phosphate precipitate has low solubility, leading to precipitation in the solution. In comparison, nickel phosphate has higher solubility and remains stable in the solution without forming a precipitate. The mechanism of the electrochemical anodic oxidation reaction is shown in
Figure 1.
During anodic oxidation, Fe atoms in the Ni–Fe alloy anode lose electrons to form Fe
2+ ions, while Ni remains as Ni
2+ due to its stable electronic configuration. The reactions are as follows:
Based on the experimental performance and subsequent Inductively Coupled Plasma (ICP) tests, Ni2+ is retained in the experimental waste solution.
After electrolysis, H
2O
2 oxidizes Fe
2+ to Fe
3+, which then reacts with PO
43− ions to form an FePO
4·2H
2O precipitate:
Ni2+ remains in the solution due to the higher solubility of nickel phosphate under acidic conditions.
3.2. Single Factor Experiments
Temperature plays a crucial role in controlling the morphology and particle size of FePO4·2H2O. Excessive temperature can lead to increased ion collision rates, causing uneven particle size distribution and agglomeration. By controlling the electrolyte temperature at 60 °C, we achieved optimal conditions for the formation of FePO4·2H2O with the desired morphological characteristics. A circulating water bath system was used to control the electrolyte temperature cell while keeping other conditions constant (electrolyte concentration: 1 mol/L and constant voltage: 16 V). The selected temperatures were 40 °C, 50 °C, 60 °C, and 70 °C, and the corresponding iron phosphate samples were designated as FP-40, FP-50, FP-60, and FP-70, respectively.
As shown in
Figure 2, the electrolyte temperature considerably affects the crystallinity of the anodic oxidation precursors. At 40 °C, the precursor is amorphous, and at 50 °C, it is both crystalline and amorphous. Moreover, at 60 °C, it is completely crystalline. At 70 °C, the diffraction peaks become more intense and broader than those at 60 °C, indicating the formation of numerous small crystallites. Lower temperatures provide insufficient energy for nucleation, resulting in the formation of amorphous iron phosphate. The crystallinity improves with the increasing temperature. When the temperature reaches 70 °C, many nucleation sites are created because of the increased energy, leading to smaller crystal sizes owing to the rapid anodic oxidation reaction.
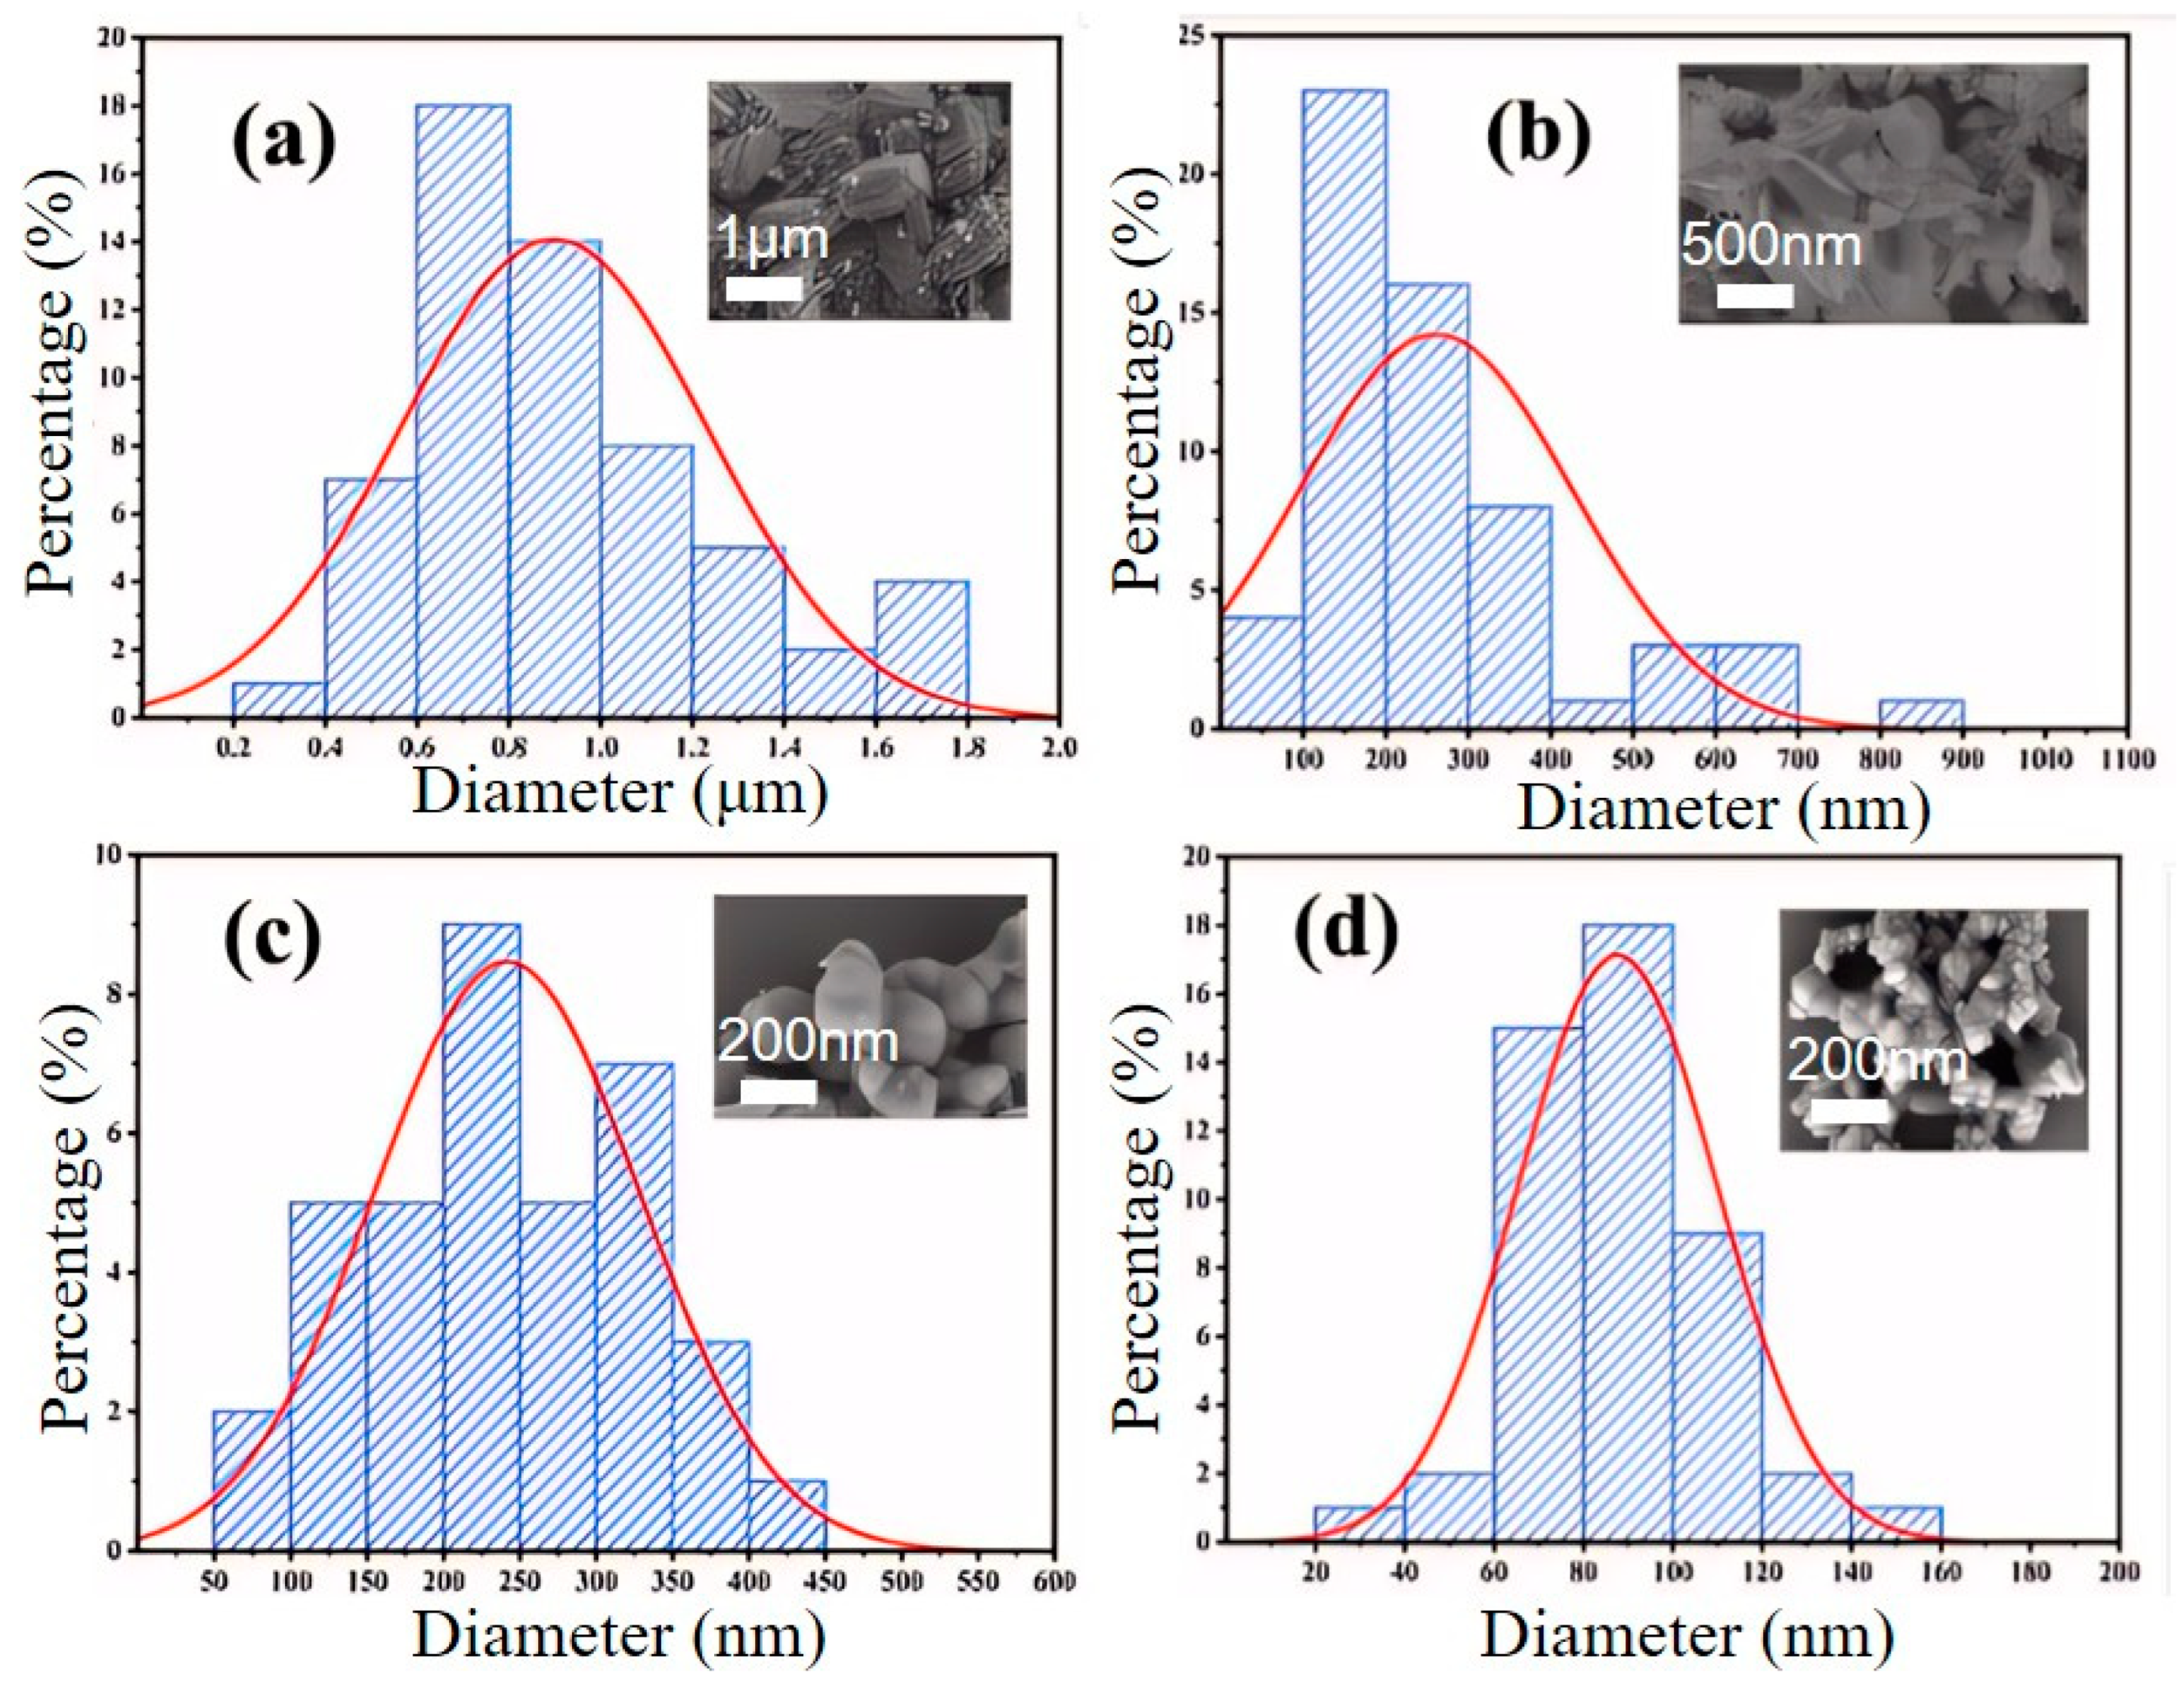
Figure 3 and
Figure 4 show that the morphology and particle size of iron phosphate vary considerably with the changing water bath temperature. At 40 °C, iron phosphate appears as fragmented irregular flakes with severe agglomeration and an average particle size of 1.8 μm. At 50 °C, particle morphology tends to be relatively spherical and the average particle size increases to 9 μm; however, the larger particle size may adversely affect the electrochemical performance of the synthesized lithium iron phosphate. At 60 °C, the average particle size decreases to 1.3 μm, with a layer thickness of 26 nm, demonstrating its suitability as a precursor for lithium iron phosphate. At 70 °C, the primary particles (average size: 450 nm) and secondary particles (average size: 135 nm) were observed; this uneven particle size distribution may create inhomogeneity in the lithium iron phosphate composition, adversely affecting the performance consistency of different batches of products.
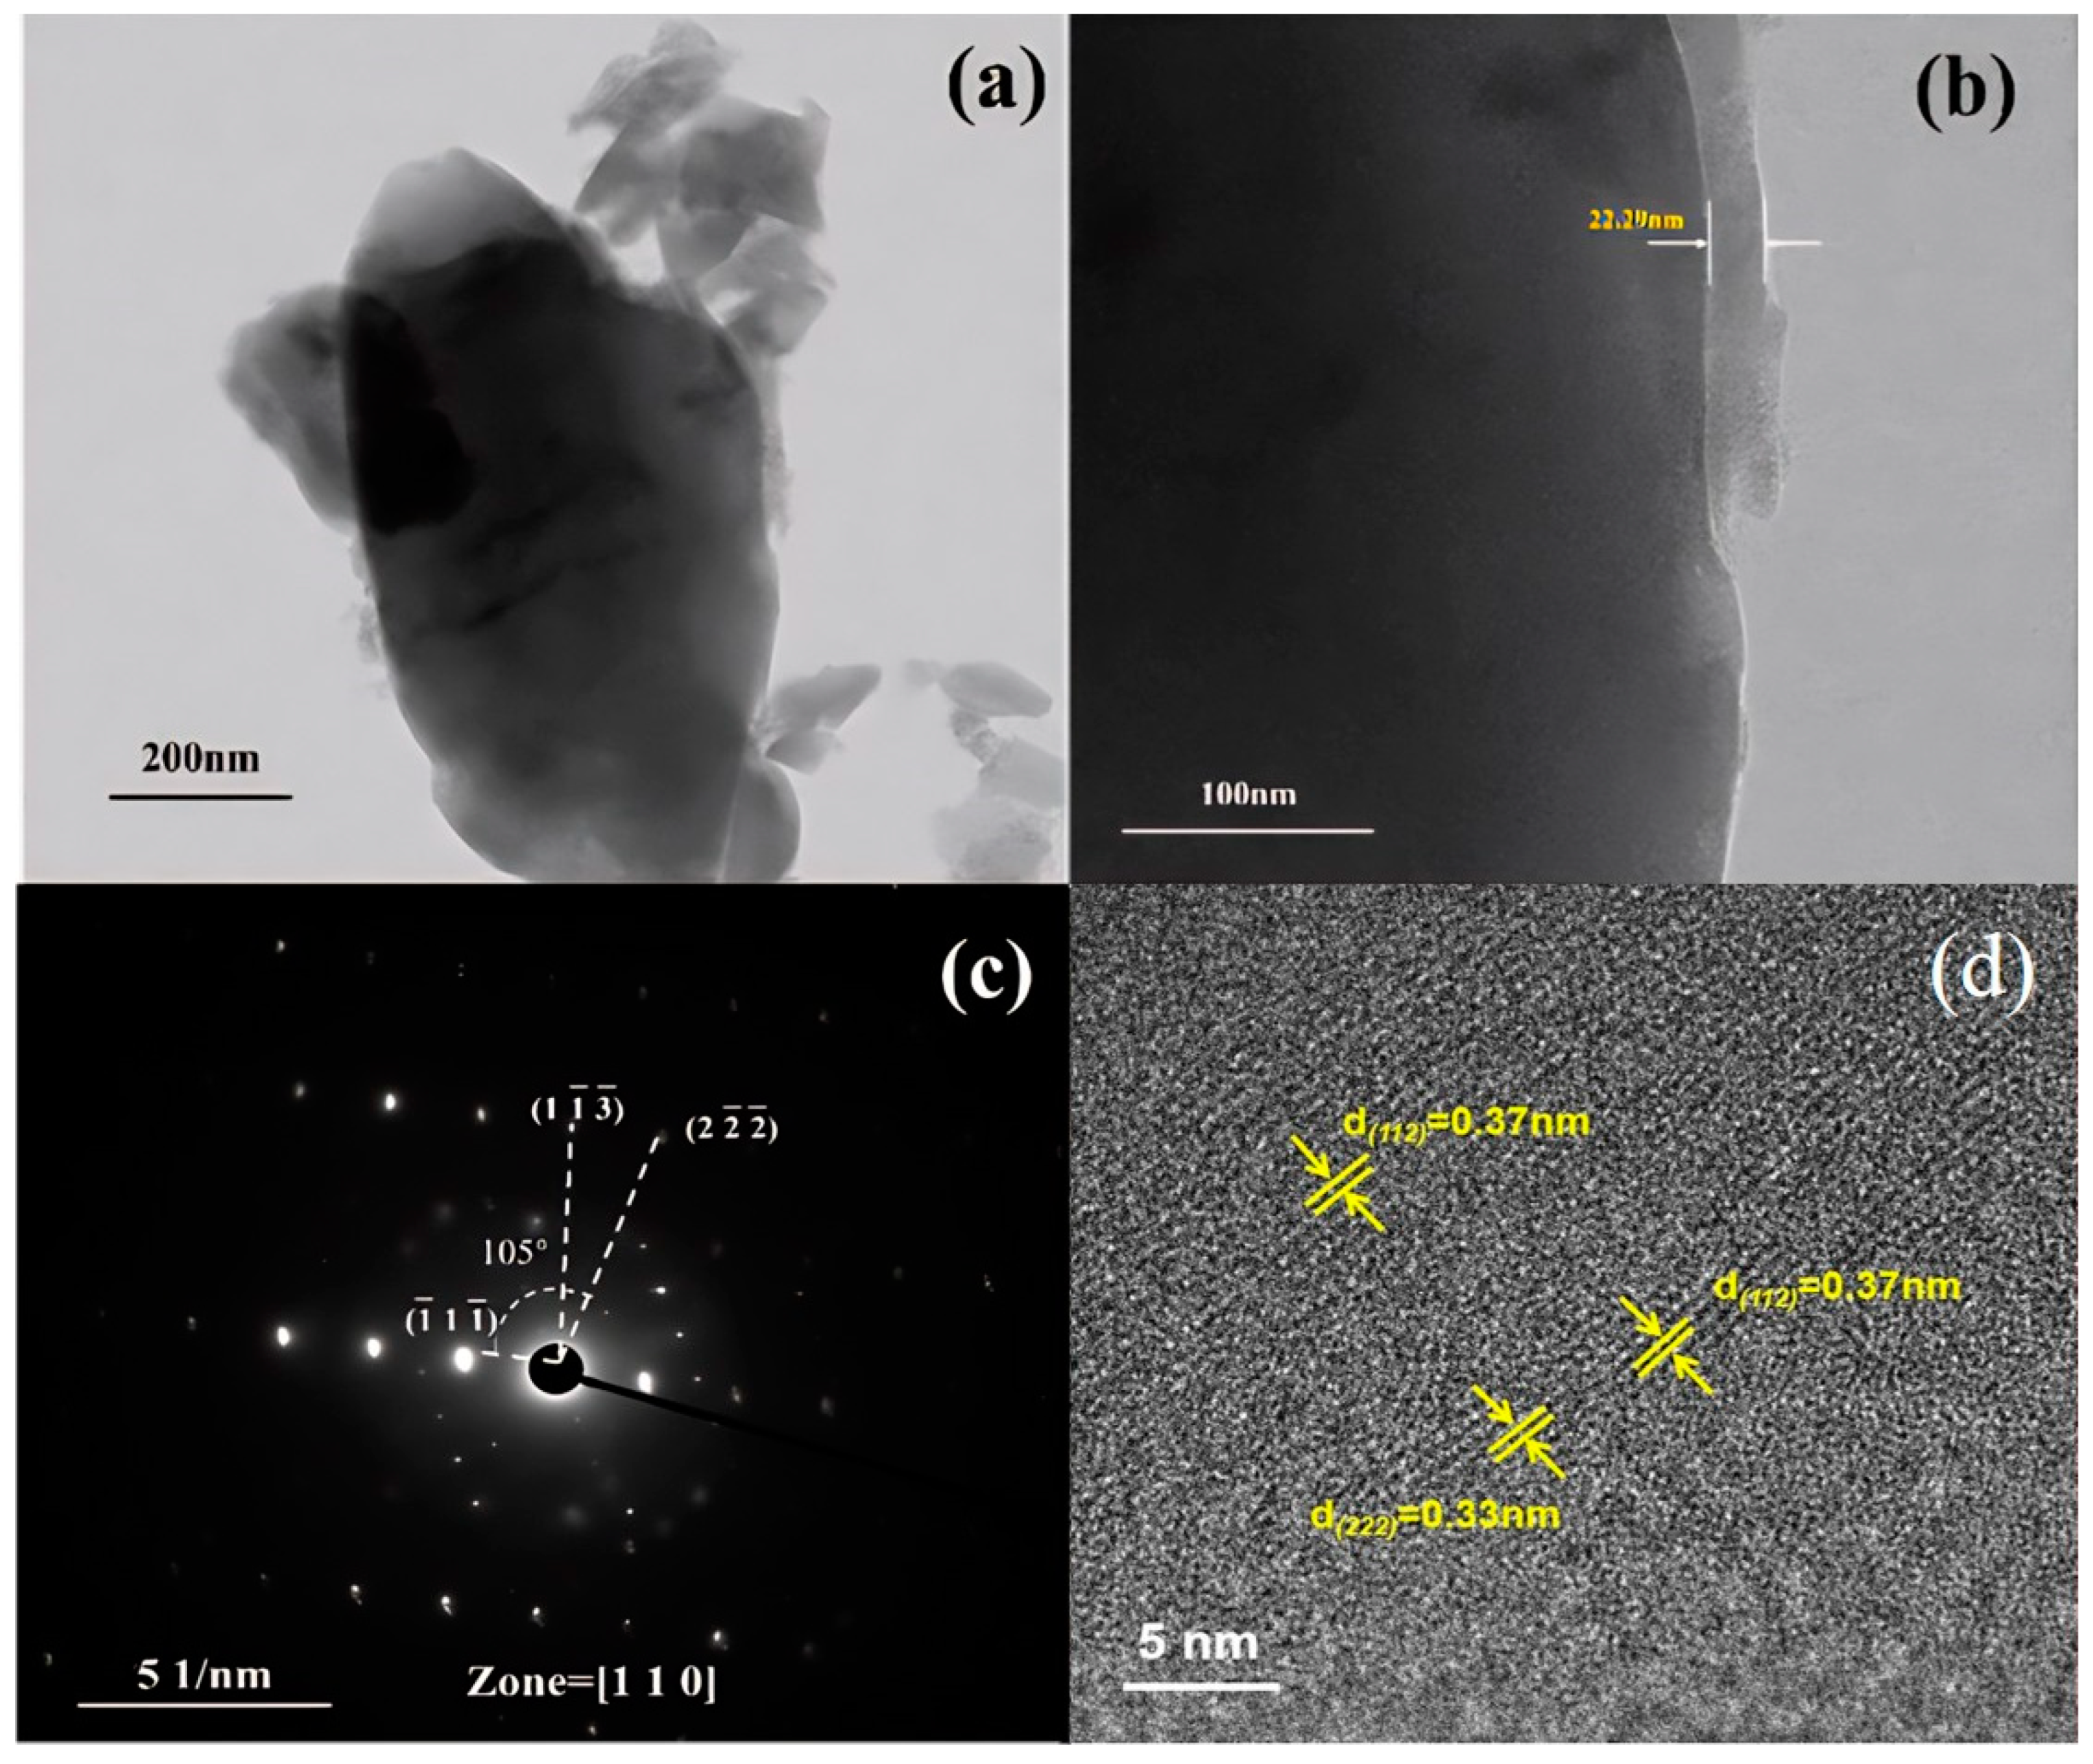
Figure 5 shows that after ultrasonic dispersion, FP-60 comprises nanosheets with an average length and width of approximately 1104 and 456 nm, respectively. The average layer thickness is approximately 26 nm. The FP-60 sample contains crystalline and amorphous regions, and the amorphous region at the edge is approximately 22 nm thick. The crystalline region includes (142), (331), (112), and (221) planes with interplanar spacings of 0.37, and 0.33 nm, respectively. The electron diffraction pattern presented in
Figure 5 reveals planes (
1
), (
2
), and (1
), establishing the crystal zone axis as [110]. The FP-60 sample has a layered morphology; therefore, its grains do not considerably grow in the [110] direction.
3.3. Optimization via Uniform Experimental Design
The nine sets of experimental protocols obtained from the experimental design table presented in
Table 2 are named Scheme: FP 1-FP 9 (
Table 3). Using DPS v21.05 software [
27], we designed a uniform experimental matrix to explore the interactive effects of synthesis parameters. The optimized conditions were found to be the following: electrolyte concentration: 1.2 mol/L, voltage: 16 V, pH: 1.6, and electrolysis time: 8 h. Under these conditions, FePO
4·2H
2O exhibited improved crystallinity, a uniform morphology, and controlled particle size distribution.
Different types of surfactants were added to the electrolyte for anodic oxidation at 1% of the mass of the iron source to prepare iron phosphate by an anodic oxidation reaction. The surfactants selected for the experiment were the following: the cationic surfactant CTAB, the anionic surfactant SDBS, and the polymeric surfactant PVP. The structural formula of each of the above surfactants is shown in
Figure S4.
As demonstrated in
Figure S5, a comparison was conducted between the XRD patterns of the anodic oxidation products obtained following the addition of various surfactants and the standard PDF card (PDF #33-0667). The analysis revealed that the predominant components of the products were identified as FePO
4-2H
2O. However, a notable observation was the presence of Fe(H
2PO
4)
3-2H
2O. The presence of this phase can be attributed to the ability of the pyrrolidone unit in the PVP molecule to form a ligand bond with the metal ion through the oxygen atom. This interaction has the potential to alter the reaction kinetics between Fe
2+ and H
2PO
4− and thereby promote the formation of the Fe(H
2PO
4)
3-2H
2O phase. Secondly, the dissolution of PVP in water will form a certain viscosity, which may affect the ion migration and diffusion process in the electrolyte. Under the action of PVP, this results in the emergence of a local concentration gradient in the electrolyte, thus affecting the direction of the reaction and the formation of the product. The anodic oxidation of the product obtained by the addition of CTAB and SDBS has no obvious heterogeneous peaks, and the composition is relatively homogeneous. In the sample with CTAB, the diffraction peaks were found to be sharper and stronger, indicating that the crystallinity of the product was higher. In the sample with SDBS, compared with the CTAB sample, the half-height width of the diffraction peak was found to be relatively narrow, and the half-height width was found to be inversely proportional to the grain size, indicating that the grain size of the SDBS sample was relatively large compared with that of the CTAB sample under the same additive ratio conditions.
As demonstrated in
Figures S6 and S7, the morphology of the resulting anodic oxidation products of iron phosphate varies significantly under different surfactant addition conditions. When SDBS is added to the electrolyte, the surface morphology of the product is a regular prismatic block piled up by thicker lamellae, and the lamellae are more uniformly distributed. The average particle size of SDBS-FePO
4 is 3 μm, and the average thickness of the lamellae is 125 nm. The morphology of the anodic oxidation product obtained from the addition of PVP to the electrolyte is an irregular block with lamellar particles, and the product obtained from the addition of the surfactant is more prone to agglomeration, with an average particle size of 0.9 μm. The average particle size of the CTAB-FePO
4 was found to be 100 nm, with an average flake thickness of 30 nm. The sample obtained by using this surfactant reached the nanometer scale compared with the former two, and it was the smallest size of the particles in the three samples. However, the sample exhibited a problem of serious agglomeration. In this experiment, ICP-OES was used to analyze the content of each element, the iron/phosphorus ratio and the content of the impurity Ni
2+ in the samples obtained from different CTAB additions, as shown in
Table S3.
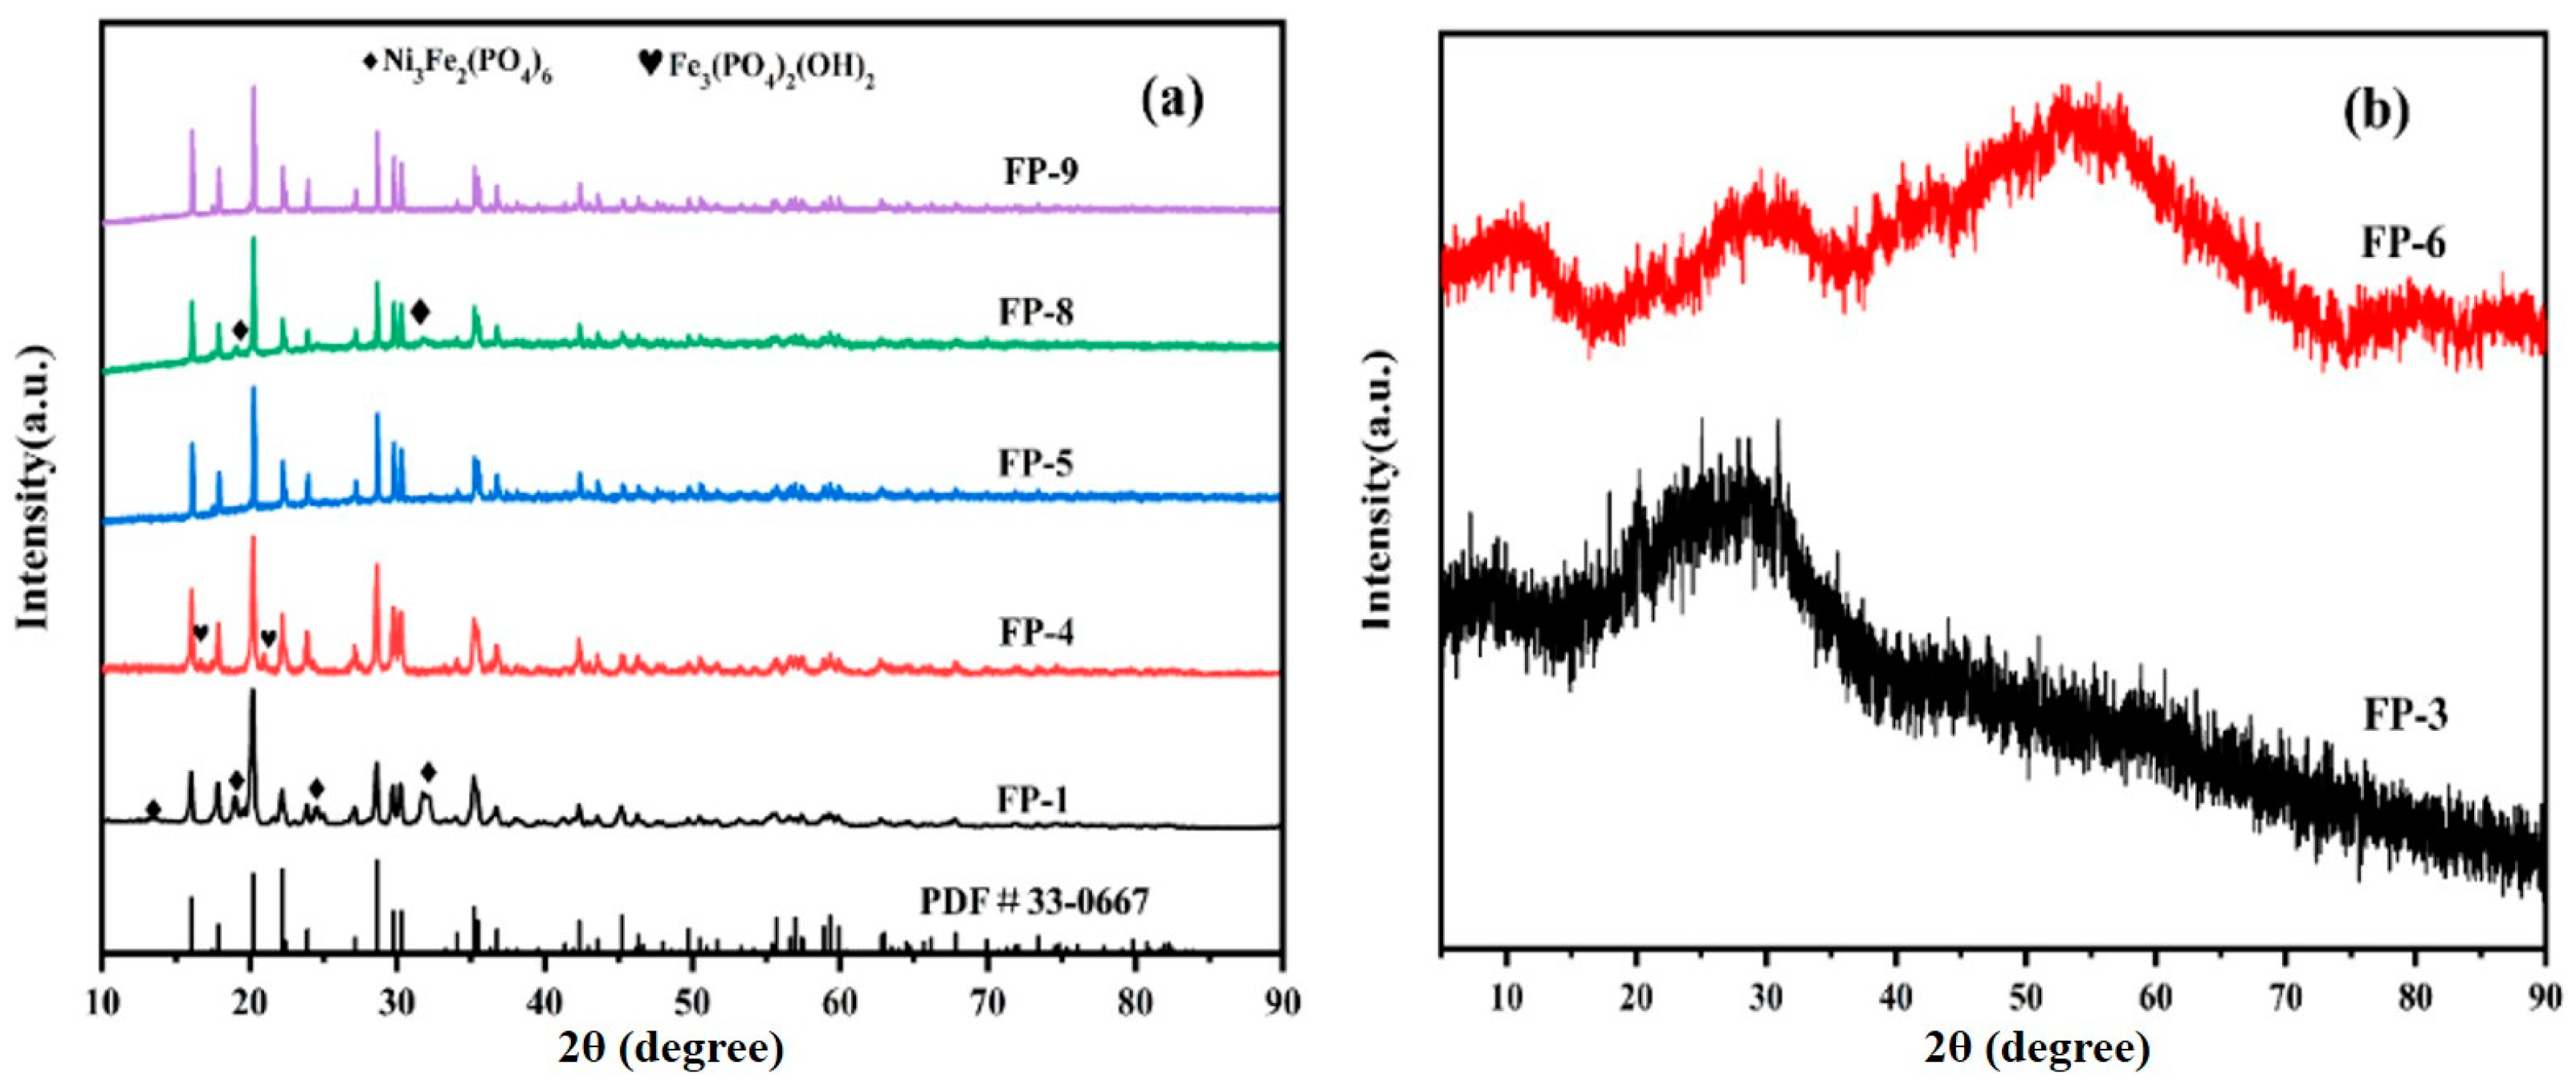
The crystallinity, crystal structure, and space group of the anodic oxidation products obtained using a uniform experimental design were analyzed via their XRD patterns. The XRD patterns of the samples are shown in
Figure 6a,b.
According to
Table 3, the homogenization experiment did not yield any anodic oxidation product after the completion of the experiments for schemes FP-2 and FP-7. Precipitate formation is closely related to the solution pH and the solubility product constant. In scheme FP-2, the pH was 0.8; under these highly acidic conditions, the high concentration of H
+ reacted with PO
43− to form highly soluble HPO
42− or H
2PO
4−, thereby reducing the number of PO
43− available to react with Fe
2+ to form FePO
4 [
17]. Hence, no precipitation was observed in this scheme. In scheme FP-7, the solubility product constant was a constant representing the product of the ion concentrations in a saturated solution of solid salt under specific temperature conditions.
In scheme FP-7, owing to the short duration of electrolysis, the concentration of Fe2+ in the electrolyte was low and the ion concentrations in the solution did not exceed the solubility product constant. Hence, no precipitation was observed. The XRD patterns of samples FP-3 and FP-6 obtained from schemes FP-3 and 6 indicated an amorphous state. The amorphous nature of sample FP-3 may be attributed to the fact that the initial iron phosphate product prepared via anodic oxidation was amorphous. Owing to the short electrolysis reaction time, the product did not have sufficient time for transformation into a stable crystalline form.
Sample FP-6 was prepared in a 0.1-mol/L dilute phosphoric acid solution with a pH of 1.3. Owing to the low electrolyte concentration, the dilute phosphoric acid solution provided a limited number of PO
43−. When Fe
2+ entered the electrolyte, the insufficiency of PO
43− prevented complete binding with Fe
2+. Hence, precipitate formation occurred in the amorphous state. Additionally, the low pH of the electrolyte in the anodic oxidation reaction led to competition between H
+ and Fe
2+ for reaction sites with PO
43−, reducing the number of PO
43− available to form ordered crystals with Fe
2+. Hence, the final reaction product was amorphous [
10].
Figure 5,
Figures S2 and S3 show that the morphology of sample FP-1 obtained via scheme FP-1 is characterized by irregular flakes with an average width of 0.45 μm. However, this sample exhibits considerable agglomeration of the flakes. Samples FP-3 and FP-6, as shown in
Figure 6b, are amorphous. The products obtained in schemes FP-3 and 6 exhibit severe agglomeration and have irregular block-like morphologies, with average particle sizes of 5 and 1.8 μm, respectively. Sample FP-4 obtained via scheme FP-4 has a morphology comprising unevenly sized spherical particles with an average grain size of 1.1 μm. Sample FP-8 obtained via scheme FP-8 has a blocky morphology characterized by the presence of secondary grains; the average sizes of the primary and secondary grains are 2 and 110 nm, respectively. Sample FP-5 obtained via scheme FP-5 has a flaky morphology, with an average flake size of 120 nm; however, this sample also exhibits considerable agglomeration, with agglomerate sizes reaching 8 μm. Sample FP-9 obtained via scheme FP-9 has a spherical morphology comprising flakes, with an average spherical particle size of 4 μm and an average flake thickness of 200 nm.
The elemental compositions and impurity levels, specifically the Ni
2+ content, of samples FP-1–FP-9 obtained via the homogenization experiments were analyzed using Inductively Coupled Plasma Optical Emission Spectrometry (ICP–OES), and the Fe/P was calculated for each sample (
Tables S1 and S2). The elemental concentrations and Fe/P of the samples are presented in
Supporting Information Table S1. Fe/P was calculated as shown in Equations (5) and (6).
Figure 6 shows the elemental composition of the products of the homogenization experiments. According to the standard HG/T 4710-2021, the Fe/P for battery-grade iron phosphate should be 0.96–1.02. However, the Fe/P ratios of the iron phosphate sample (FP-1, FP-3, FP-4, FP-5, FP-6, and FP-8) fall below the minimum threshold set by the industry standard, indicating that these samples do not meet the Fe/P specifications required for battery-grade iron phosphate. In contrast, sample FP-9 has an Fe/P of 1.006, which meets the industry standards for battery-grade iron phosphate, and its Ni
2+ content is 0.14%, reflecting a considerably low level of impurities. The elemental compositions of the products of the homogenization experiments are presented in
Supporting Information Tables S1 and S2. From Equation (3) and
Tables S1 and S2, the results of the experiments make clear that Ni
2+ is retained in the electrolyte at the end of the reaction.
where
Cm is the molar concentration of each element (mol/kg),
Cp is the relative content of the elements tested (%)
, m0 is the total mass of the sample (kg)
, Mp is the molar mass of each element,
I is Fe/P,
CFe is the molar concentration of iron (mol/kg), and
Cp is the molar concentration of phosphorus (mol/kg).
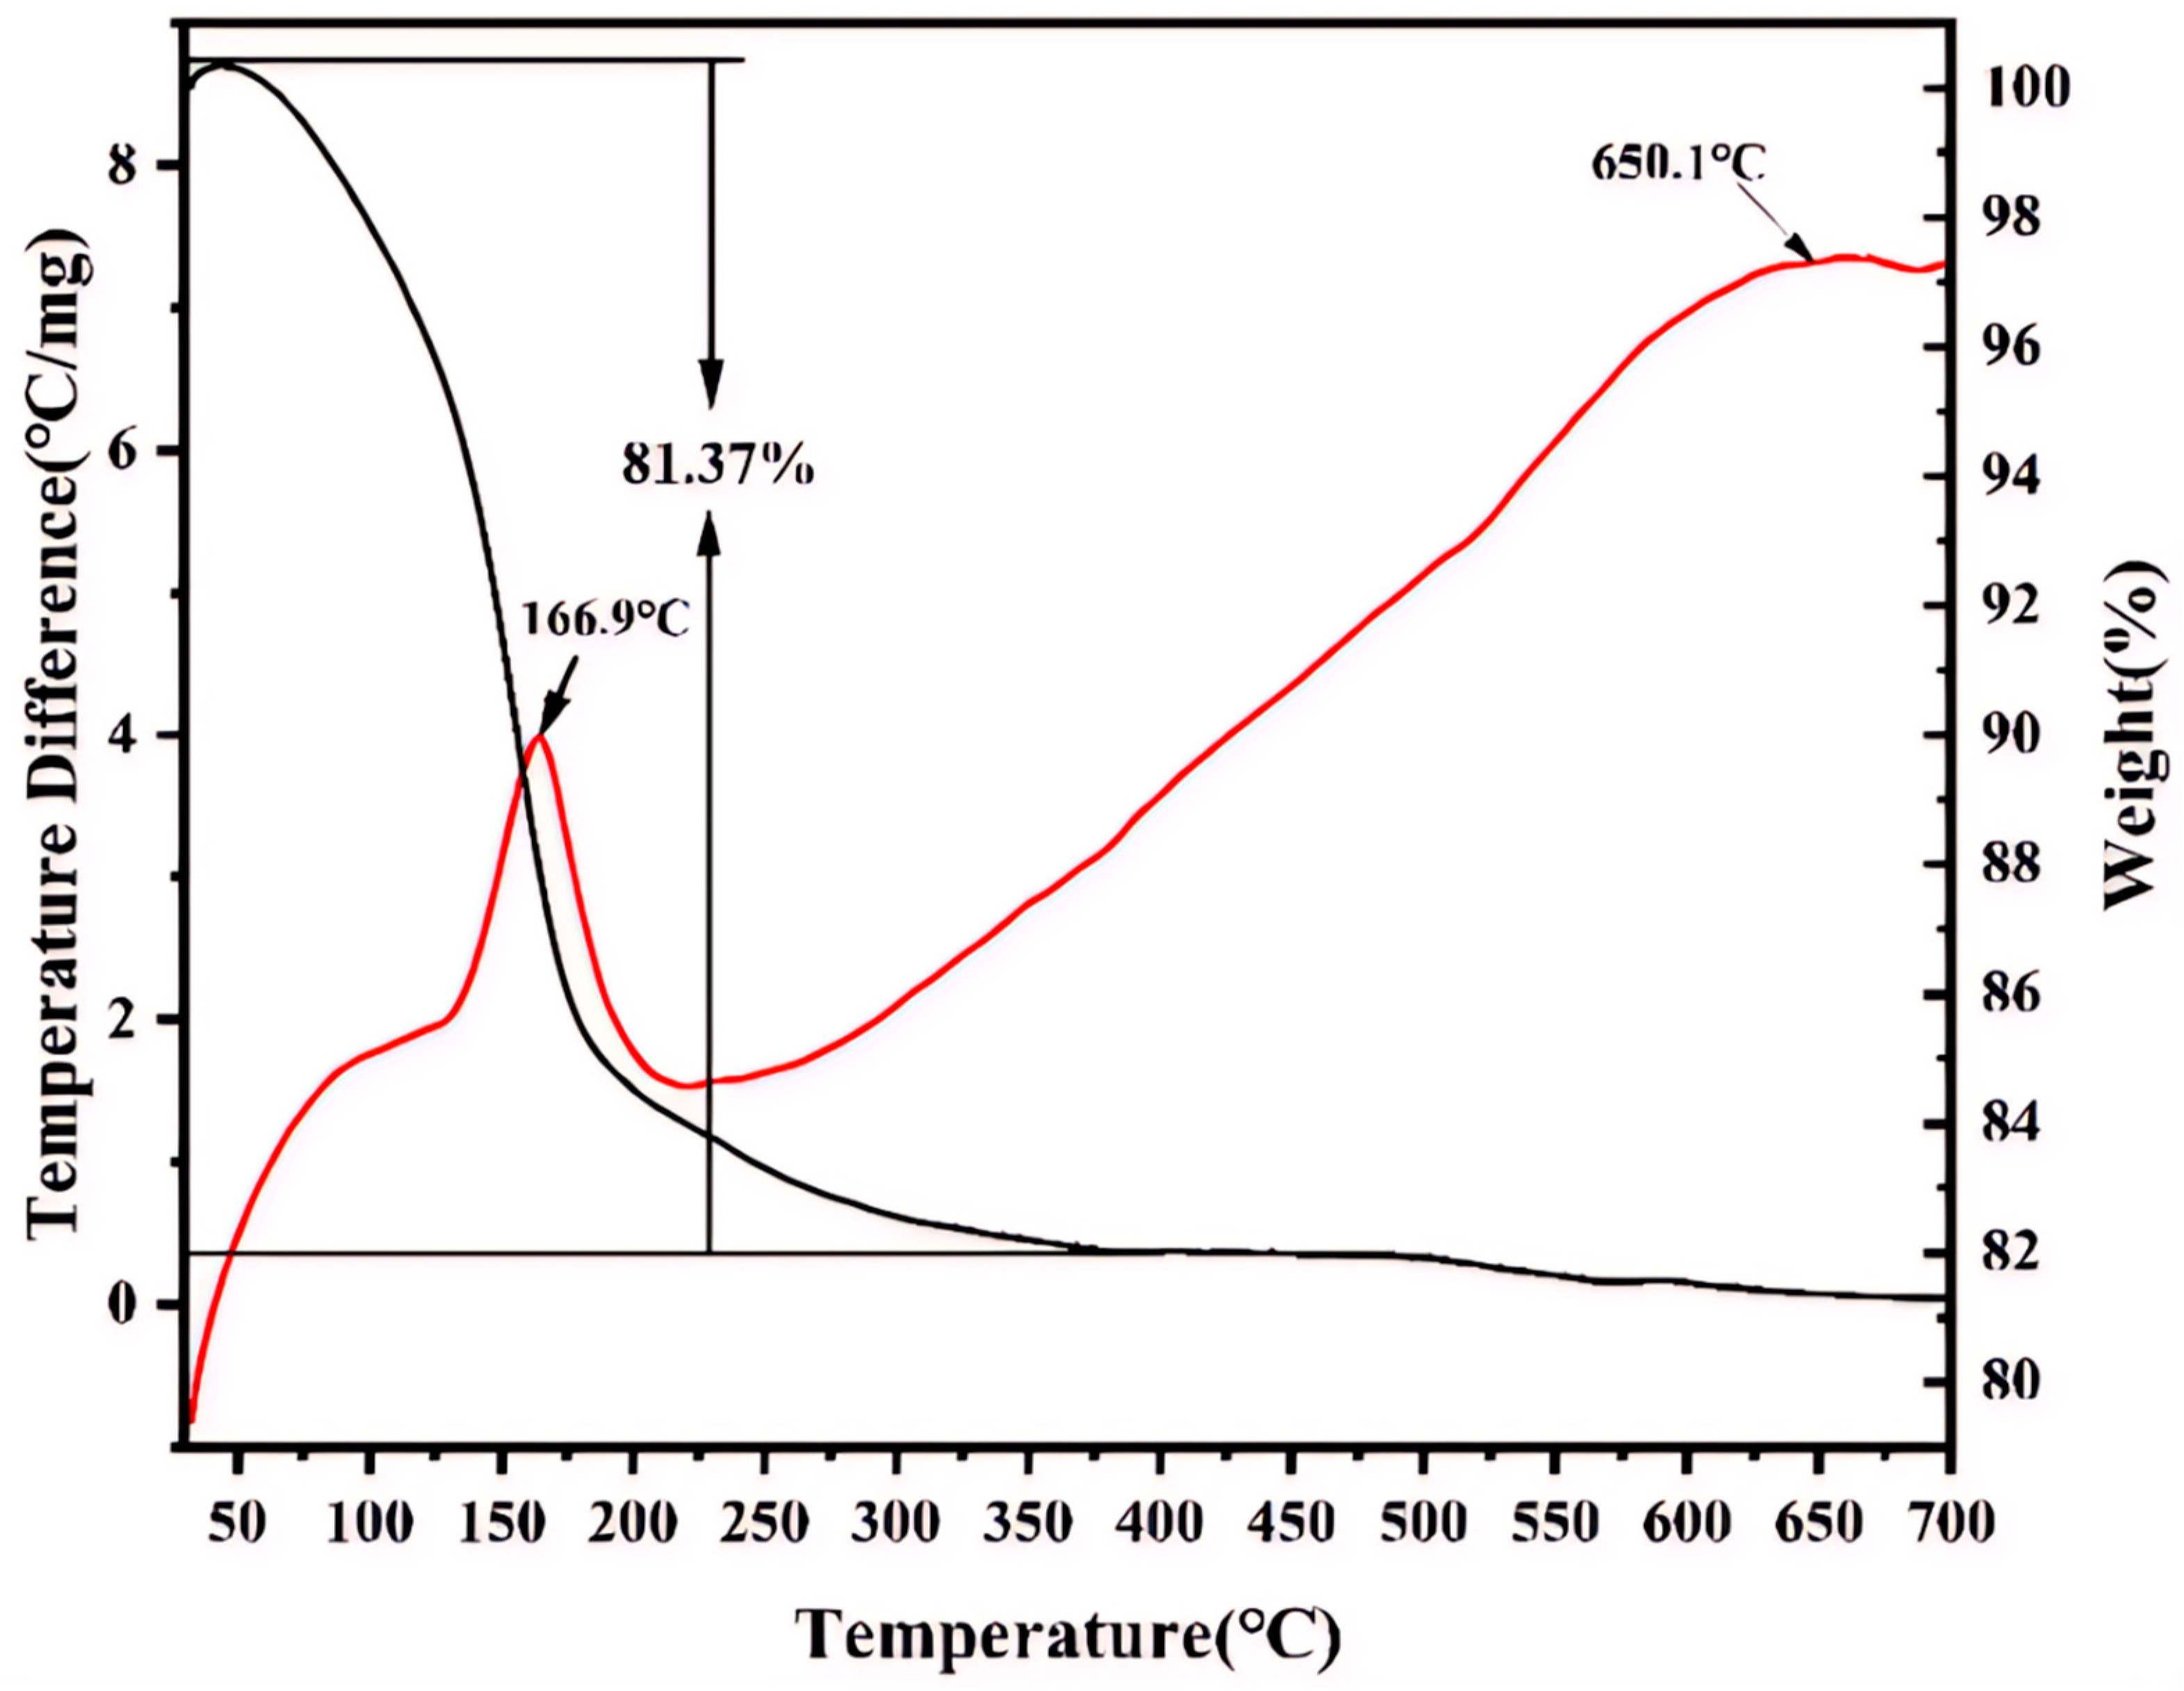
The TG curve shown in
Figure 7 indicates that iron phosphate undergoes considerable mass loss in the temperature range of 30–700 °C primarily because of the evaporation of the water of crystallization under high-temperature conditions. The mass loss of iron phosphate is ~18.63%, indicating that 1 mol of FePO
4 combined with 2 mol of water molecules in this sample. Furthermore, the DSC exotherm at 166.9 °C corresponds to the crystallization of anhydrous FePO
4 following dehydration, as evidenced by the structural transition in XRD (
Figure 6a). While water removal itself is endothermic, the dominant exothermic signal arises from lattice energy release during crystallization, consistent with the reports on hydrated phosphates. At 650.1 °C, an exothermic peak is observed in the DSC curve, while no considerable change is observed in the TG curve, suggesting that a phase transformation occurs at this temperature.
Figure 7 shows no mass loss attributable to organic residues beyond 500 °C. These observations confirm CTAB’s role as a transient morphology-directing agent, with no residual surfactant in the final product.
3.4. Morphology and Particle Size Control with CTAB
Based on the results of the above experiments, the experimental conditions of scheme FP-9 were used to continue the particle refinement experiments (FP-9 hereinafter is referred to as FP). Adding a CTAB surfactant to the electrolyte significantly influenced the growth of the FePO
4·2H
2O crystals. With 3% CTAB, we obtained FePO
4·2H
2O with a reduced particle size (~250 nm) and improved uniformity. The surfactant molecules adsorbed on specific crystal facets, hindering unrestricted growth and facilitating controlled morphology. The effects of different types of surfactants on the anodic oxidation products are shown in
Figures S4–S8 and
Table S3. The effect of CTAB dosage on the iron phosphate prepared via electrochemical anodic oxidation was examined [
28]. The single-factor experimental design is presented in
Table 4.
Samples with different CTAB dosages were named as follows: FP-0.05CTAB, FP-1.5CTAB, FP-3CTAB, and FP-5CTAB.
According to
Figure 8a, the XRD patterns of the electrolyte with the added CTAB during anodic oxidation show FePO
4 was the primary component. The XRD patterns of samples FePO
4-0.05%CTAB, FePO
4-3%CTAB, and FePO
4-5%CTAB have sharp diffraction peaks, indicating excellent crystallinity. In comparison, the XRD pattern of FePO
4-1.5%CTAB indicates lower crystallinity, possibly because of the uneven adsorption of CTAB molecules, the impact of these molecules on electrolyte properties, and changes in the crystal growth rates. Samples FePO
4-1.5%CTAB and FePO
4-5%CTAB contain the Ni
3Fe
4(PO
4)
6 phase, whereas samples FePO
4-0.05%CTAB and FePO
4-3%CTAB do not contain any impurities (as indicated by the absence of impurity peaks in their XRD patterns). This result is related to the effect of CTAB concentration on the physicochemical properties of the electrolyte; this effect may alter the local environment during electrolysis and promote the formation of Ni
3Fe
4(PO
4)
6.
According to
Figure 8b, the main peaks in the infrared spectrum of the iron phosphate sample without CTAB are located at 576.08, 1017.4, 1633.5, and 3373.23 cm
−1, corresponding to the Fe–P stretching vibrations, the P–O stretching vibration, the P–O bending vibration, and the H–O stretching vibration in the crystallized water, respectively. In the infrared spectrum of the samples with CTAB, the peaks observed in the range of 2700–3100 cm
−1 indicate the stretching vibrations of the –CH
3 and –CH
2 groups, while the peaks in the range of 1400–1500 cm
−1 correspond to the –N(CH
3)
3 stretching vibrations. In the infrared spectrum of the samples with CTAB, the stretching vibration peak observed at 3561.05 cm
−1 corresponds to –OH, suggesting that the trimethylammonium group of CTAB serves as a hydrogen bond acceptor, forming hydrogen bonds with the hydrogen atoms in water molecules. This interaction stabilizes and increases the number of water molecules adsorbed on the FePO
4 surface. When CTAB is adsorbed on the sample surface, it may form hydrogen bonds with the surface –OH groups, enhancing the vibration of the –OH groups and increasing the intensity of the –OH stretching vibration peak. However, when the CTAB concentration reaches 5%, the peak observed at 3561 cm
−1 weakens, likely because of the formation of a saturated CTAB adsorption layer on the iron phosphate surface. When this layer is saturated, a further addition of CTAB does not increase the amount of surface-adsorbed water. Instead, the excess CTAB may interact with the adsorbed water molecules through hydrophobic interactions, leading to the desorption of water from the surface.
As shown in
Figure 9 and
Figure 10, when the CTAB concentration is 0.05%, the obtained sample FePO
4-0.05CTAB exhibits a flaky morphology with considerable agglomeration; the largest, smallest, and average flake widths are 1.8, 0.3, and 0.9 μm, respectively. At 1.5% CTAB, sample FePO
4-1.5CTAB also shows a flaky morphology with low agglomeration; the largest, smallest, and average flake sizes are 850, 80, and 250 nm, respectively. At 3% CTAB, sample FePO
4-3CTAB comprises spherical particles with maximum, minimum, and average particle sizes of 400, 80, and 250 nm, respectively. At 5% CTAB, sample FePO
4-5CTAB comprises spherical particles with an agglomeration more severe than in case of the spherical particles in sample FePO
4-3CTAB; moreover, the largest, smallest, and average particle sizes are 450, 25, and 90 nm, respectively.
A comparative analysis of the elements, iron/phosphorus ratio, and Ni
2+ impurity in the samples of FP-0.05CTAB~FP-5CTAB obtained from the one-way experiments in
Table S3 and
Figure S8 was conducted, which shows that the iron/phosphorus ratio of FP obtained when the addition of CTAB is 0.05% is 1.009, which is in line with the iron/phosphorus ratio of battery-grade FP as stipulated in the standard HG/T4710-2021, but the content of impurity Ni
2+ in the sample is relatively high, at 0.154%. The iron/phosphorus ratios of FP-1.5CTAB and FP-5CTAB are lower than the minimum iron/phosphorus ratio of the battery-grade iron phosphate specified in the standard. The impurity content is relatively high; therefore, they are not suitable for the preparation of lithium iron phosphate cathode materials. The iron-to-phosphorus ratio of FP-3CTAB is 1.001, which is in line with the battery-grade iron phosphate standard, and has a low content of impurity Ni
2+. This makes it a relatively ideal lithium iron phosphate precursor [
29,
30,
31].
3.5. Electrochemical Performance of LiFePO4/C Cathodes
The LiFePO4/C cathodes synthesized from the optimized FePO4·2H2O precursors demonstrated an enhanced electrochemical performance.
According to
Figure 11, the XRD pattern of the LiFePO
4/C material obtained by further preparation of the FePO
4 material obtained from the above experiments was compared with the standard PDF card (PDF #40-1499) progression, and no obvious stray peaks appeared. The SEM test of the resulting LiFePO
4/C material is shown in
Figure S9, which shows that the prepared LiFePO
4/C material is consistent with the existing studies [
20,
21,
22,
23,
24]. As can be seen from
Figure S9, the lithium iron phosphate material consists of lamellar-stacked particles. Its maximum lamellar particle size is 400 nm, the minimum lamellar particle is 80 nm, and the average particle size is 280 nm. This makes it a relatively ideal lithium iron phosphate precursor. The carbon content in LiFePO
4/C is exclusively derived from ascorbic acid pyrolysis as confirmed by the TGA mass loss (
Figure 7). CTAB’s contribution is limited to precursor particle size reduction (250 nm for FP-3CTAB vs. 1.3 μm for unmodified FP,
Figure 9), which enhances carbon coating uniformity and thereby improves cycling stability (99.36% capacity retention vs. 98% in controls,
Figure 12b).
According to
Figure 12, a comparative analysis was conducted on the initial charge/discharge performance of the lithium iron phosphate (LFP) prepared from distinct precursors [
30,
31,
32]. The specific capacity of the LFP sample prepared from the FP sample without precursor modification was found to be 139 mA h g
−1, the discharge plateau was found to be 3.39 V, and the specific capacity of the LFP sample after 100 charge/discharge cycles was 136 mA h g
−1, with a capacity retention rate of 98%. The LFP-0.05CTAB sample prepared with the FP-0.05CTAB precursor exhibited a specific capacity of 143 mA h g
−1 and a discharge plateau of 3.4 V at 0.2 C. After 100 charge/discharge cycles, the LFP sample demonstrated a capacity retention rate of 98%. The specific capacity of the LFP sample was 140 mA h g
−1, with a capacity retention rate of 98.2%, which is an increase in the specific capacity of the sample compared to that of the LFP. The discharge point platform of the LFP-1.5CTAB prepared with FP-1.5CTAB was slightly decreased compared to LFP, which might be due to the lower amount of Fe
2+ involved in the redox reaction, with the lower Fe-to-phosphorus ratio (0.914) of its precursor, which in turn led to the poorer electrochemical performance. The specific capacity of the LFP-3CTAB sample obtained from the FP-3CTAB precursor is 157 mA h g
−1, and the discharge platform is 3.38 V at a 0.2C current. The specific capacity is 156 mA h g
−1 after 100 charge/discharge cycles, with a capacity retention rate of 99.36%, which represents a significant improvement in the performance of LFP when compared with that of LFP, a known unmodified FP precursor. This enhancement can be attributed to the average particle size of FP-3CTAB, which is 250 nm. The lithium-ion diffusion channel of the LFP prepared from this precursor is shorter than that of the unmodified LFP, thereby improving its electrochemical performance. The specific capacity of the LFP prepared with FP-5CTAB as a precursor was 125 mA h g
−1 at 0.2C, and the discharge platform was 3.23 V. After 100 charge/discharge cycles, the specific capacity of the LFP was 116 mA h g
−1, and the capacity retention rate was 92.95%. A comparison with the unmodified LFP revealed that all performance metrics were reduced. This phenomenon can be attributed to the iron-to-phosphorus ratio in the FP-5 sample, which is only 0.8145. This results in a lower amount of Fe
2+ participating in the redox reaction in the fabricated LFP, which in turn results in the poorer charge/discharge performance of the prepared LFP cathode material.
Electrochemical impedance spectroscopy (EIS) tests were performed on both pre-cycling and post-cycling LFP cells, with the results shown in
Figure S12a. As shown in
Figure S12a, an intercept at the Z’ axis at a high frequency corresponds to the ohmic resistance (R
s), representing the resistance of the electrolyte (see the equivalent circuit model in
Figure S13). The semicircle in the middle frequency range indicates the charge-transfer resistance (R
ct). The inclined line in the low frequency region represents the Warburg impedance (W1), which relates to the solid-state diffusion of lithium ion inside the active particles. A constant phase element (CPE) was placed to represent the double layer capacitance and passivation film capacitance. The diffusion rate of Li+ in electrolyte solution is far greater than that of Li+ in solid-state active material, so the resistance of the charge transfer can be considered as the rate-determining step of the diffusion process of Li
+ during the charge/discharge of a battery. Additionally, the cyclic voltammetry (CV) test results for the LFP cells are presented in
Figure S12b. Post-cycling, a notable reduction in charge transfer resistance was observed in the LFP cell, indicating improved charge transfer kinetics and suggesting an enhanced lithium-ion diffusion coefficient. The CV test confirmed that the LFP cell fabricated using the experimentally prepared LFP material exhibited behavior consistent with the existing literature [
8,
20,
21,
22,
23].
The solid-phase diffusion coefficient of Li
+ is considered of significant interest due to its importance in improving the power density of lithium-ion batteries [
33]. The determination of diffusion characteristics is dependent on the solution of the Warburg impedance response, and the diffusion coefficient (
) of lithium ion can be calculated from the plots in the low frequency region according to the following equations:
where T is the absolute temperature, R the gas constant, n is the number of electrons per molecule during oxidization, A is the surface area, F is the Faraday’s constant, C
Li is the concentration of lithium ions, ω is the angular frequency, and σ is the Warburg factor which has a relationship with Z
re. The Z
re−ω
−1/2 plots are presented in
Figure S14. According to the results shown in
Figures S12a and S14, the R
S post-cycling is 10.8 Ω; the R
ct post-cycling is 48 Ω. The lithium-ion diffusion coefficient (
) was calculated from the Warburg impedance slope (
Figure S14) using Equation (8):
= 1.2 × 10
−12 cm
2 s
−1. This value aligns with the high-performance LFP cathodes reported in [
33], confirming efficient Li
+ transport enabled by the optimized precursor morphology. Moreover, these findings affirm that the presence of Ni in the experimental raw materials did not adversely affect the electrochemical performance of the LFP cells.


