

Influence of Different Surface Treatments on the Low-Temperature Degradation of Three Commercial Yttria-Stabilized Tetragonal Zirconia Polycrystal


Abstract
1. Introduction
2. Materials and Methods
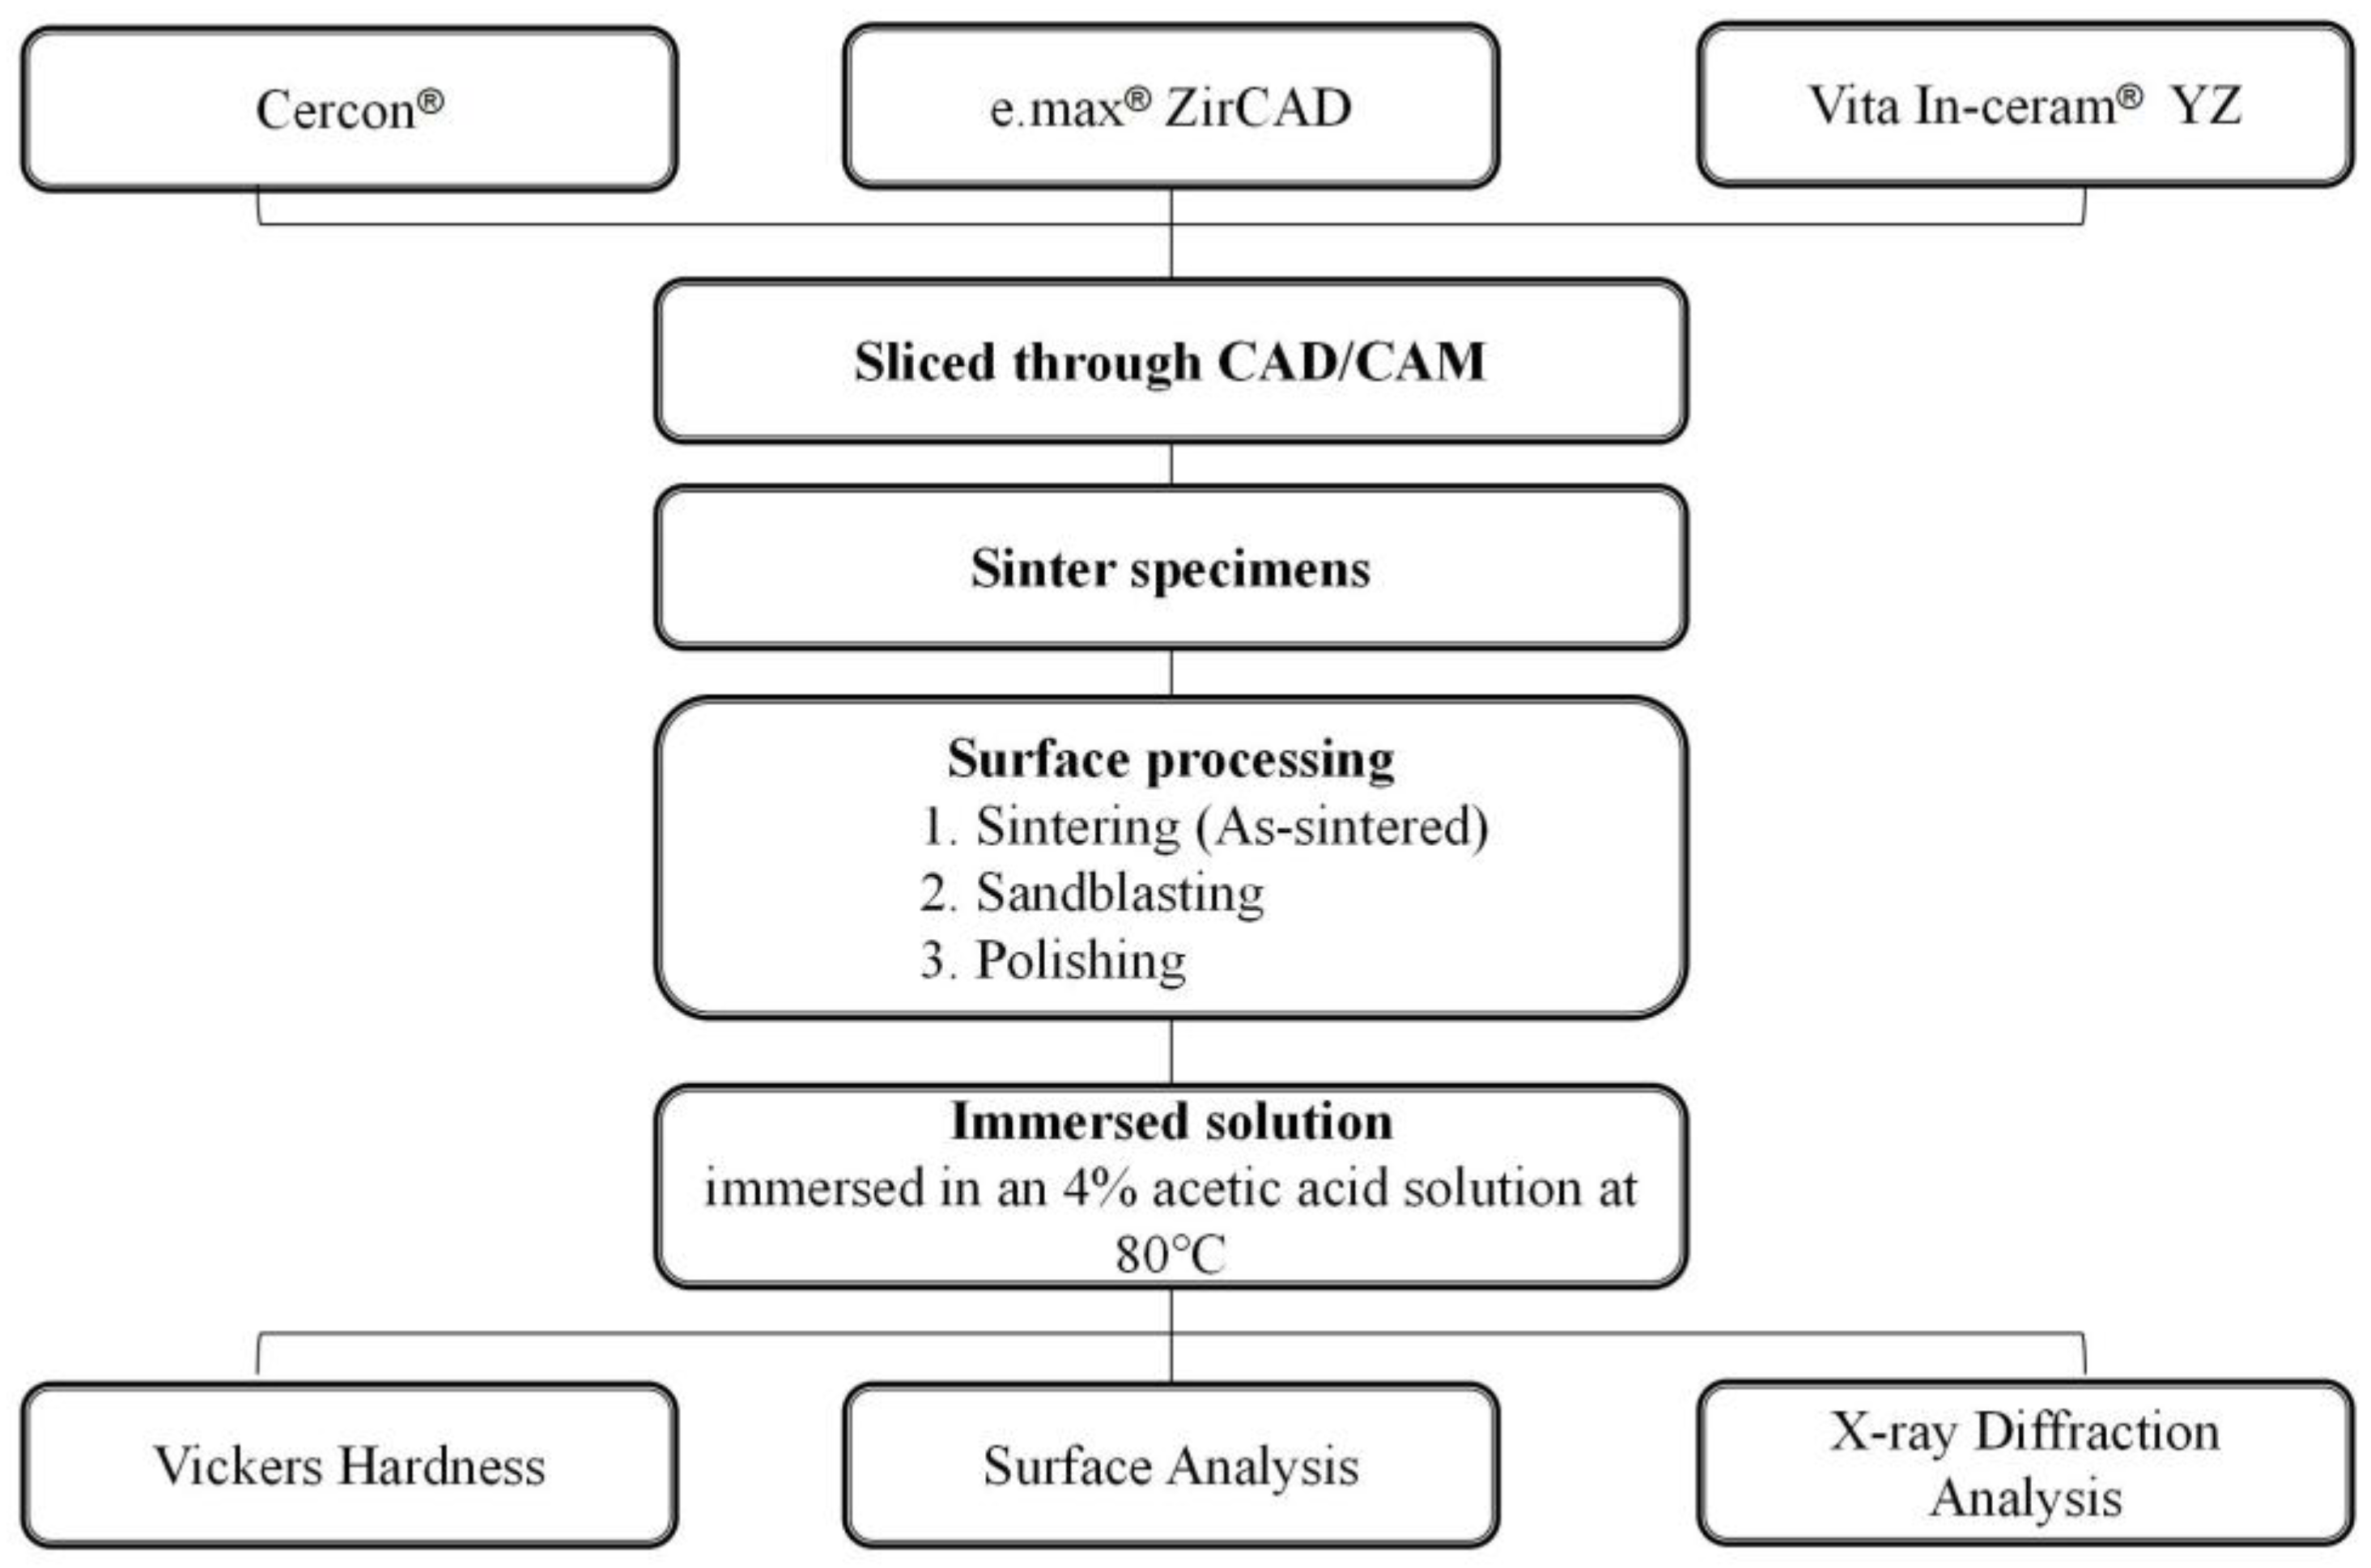
2.1. Specimen Preparation
2.2. Surface Processing
2.3. Low-Temperature Degradation Tests
2.4. Vickers Hardness Measurements
2.5. Scanning Electron Microscopy Analysis
2.6. X-Ray Diffraction Analysis
2.7. Crystalline Grain Size Calculations
2.8. Transformed Zone Depth
3. Results
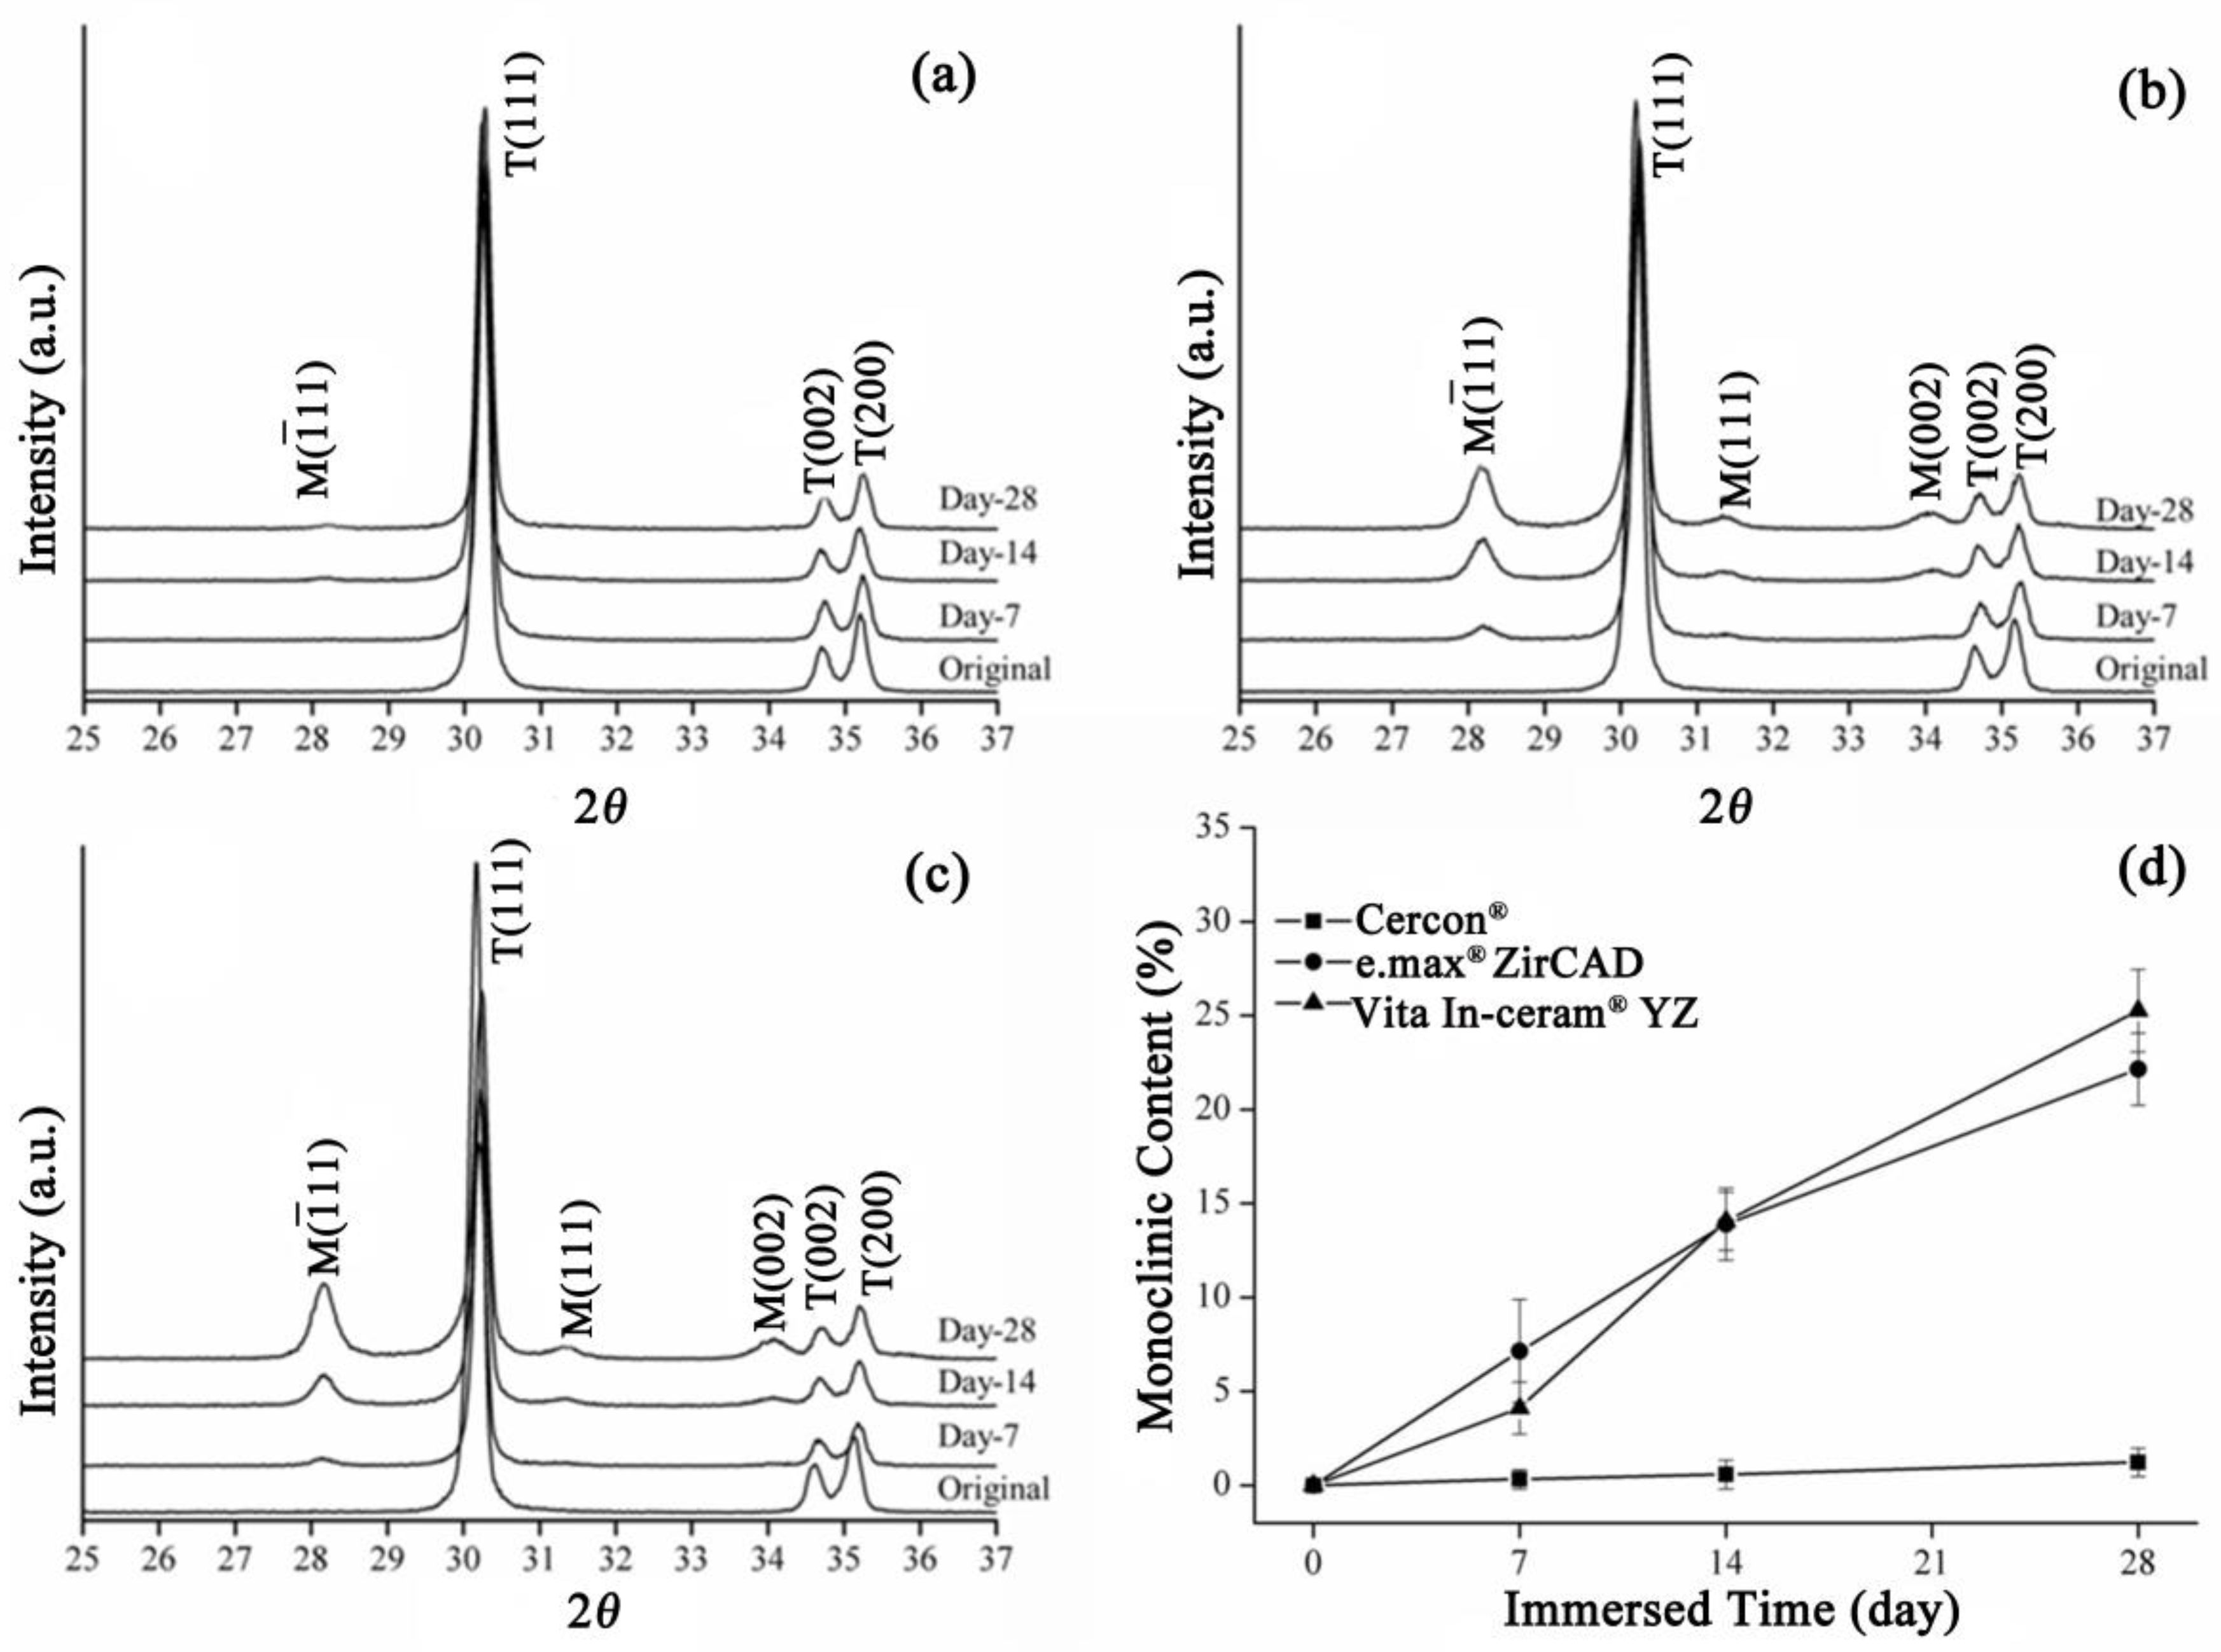
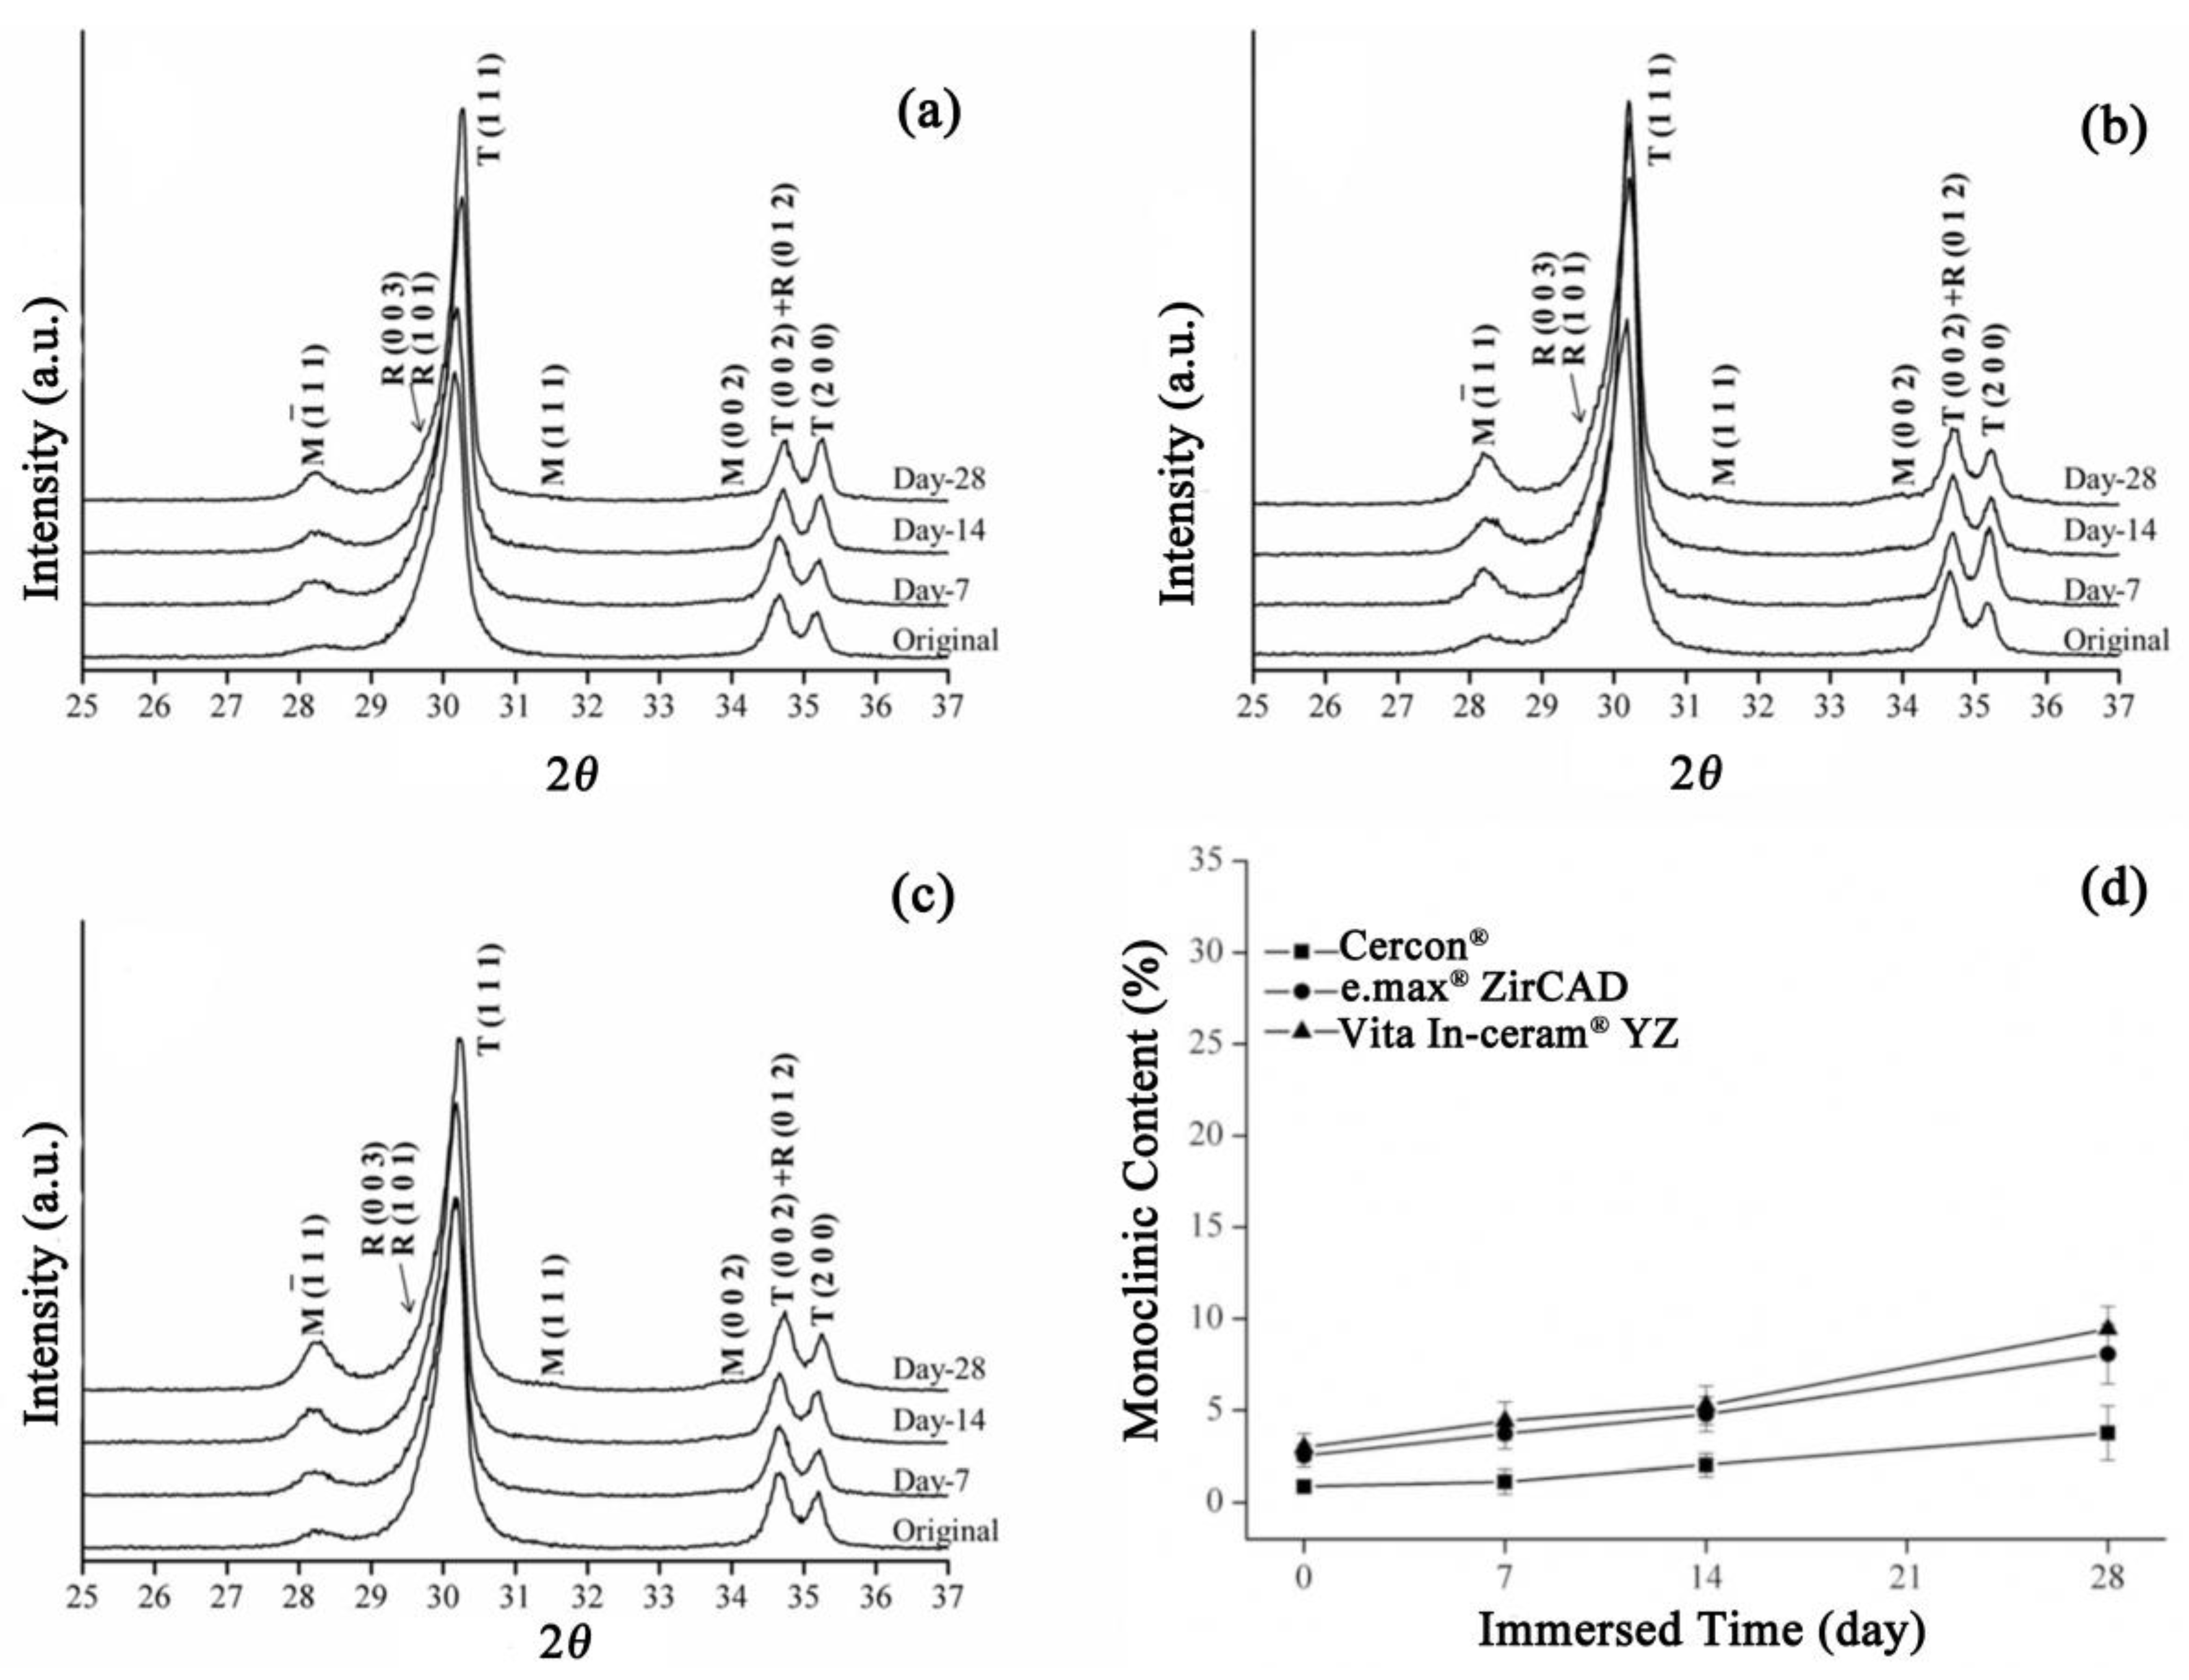
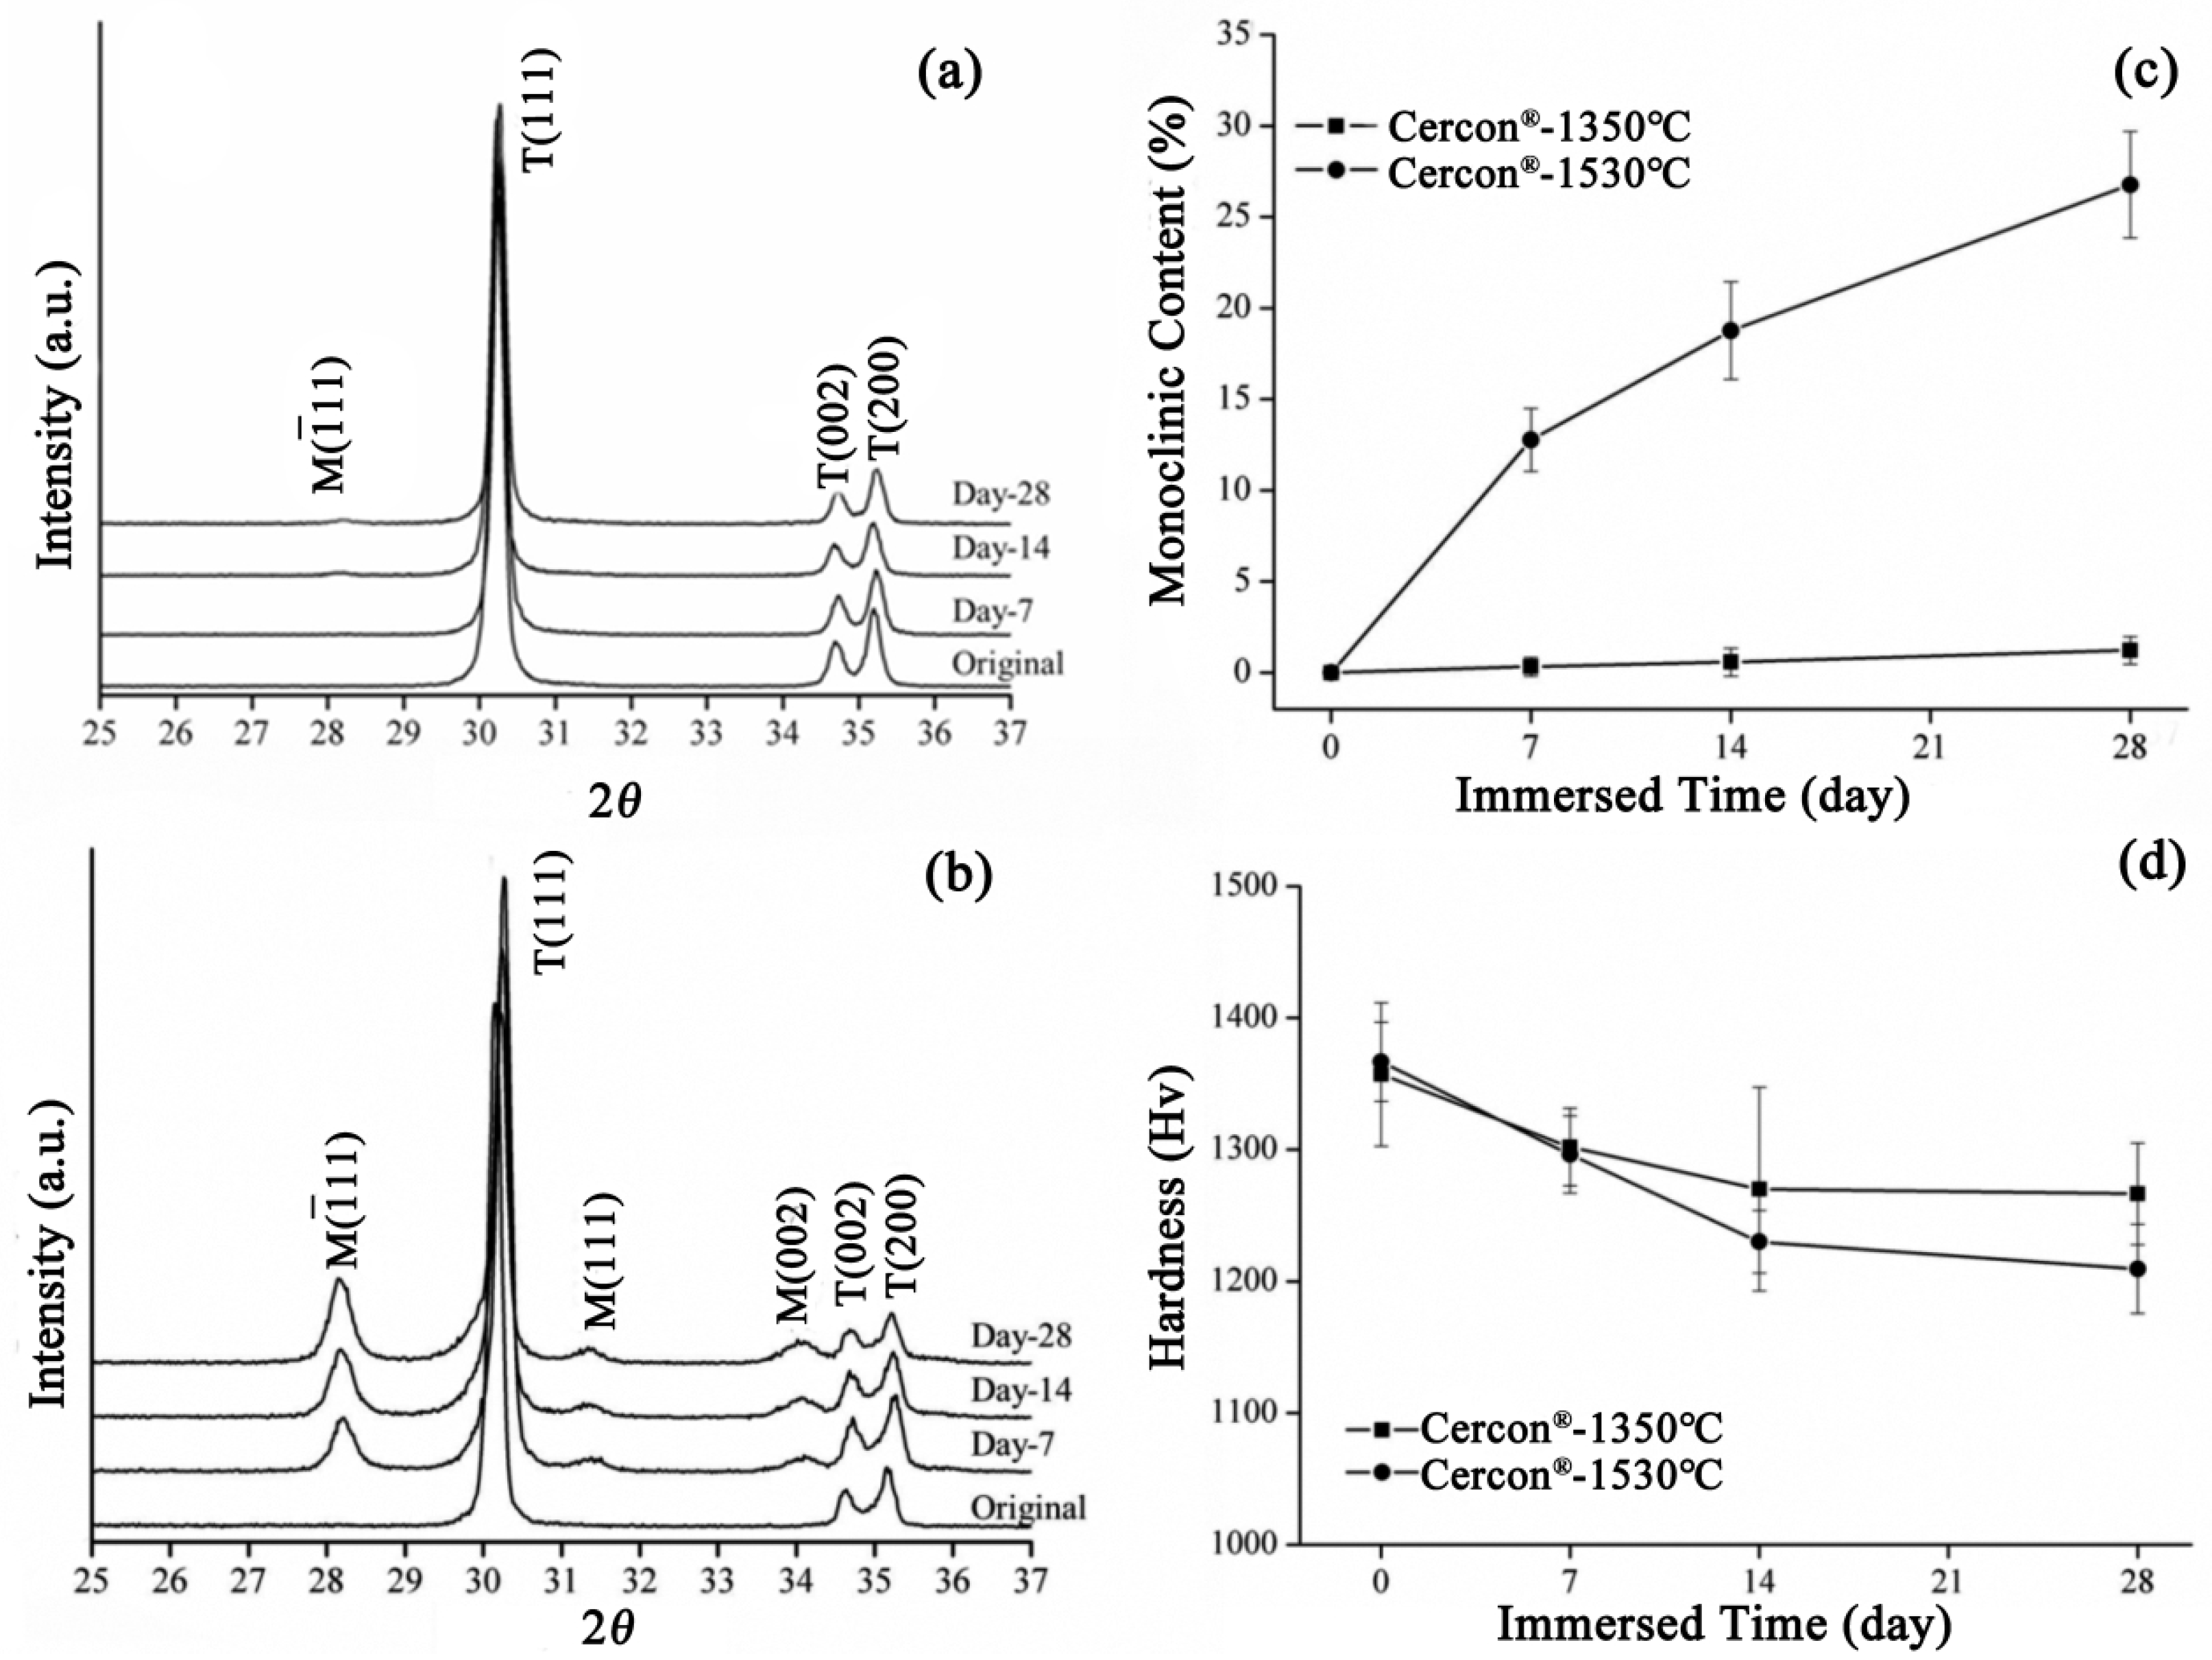
3.1. XRD Analysis
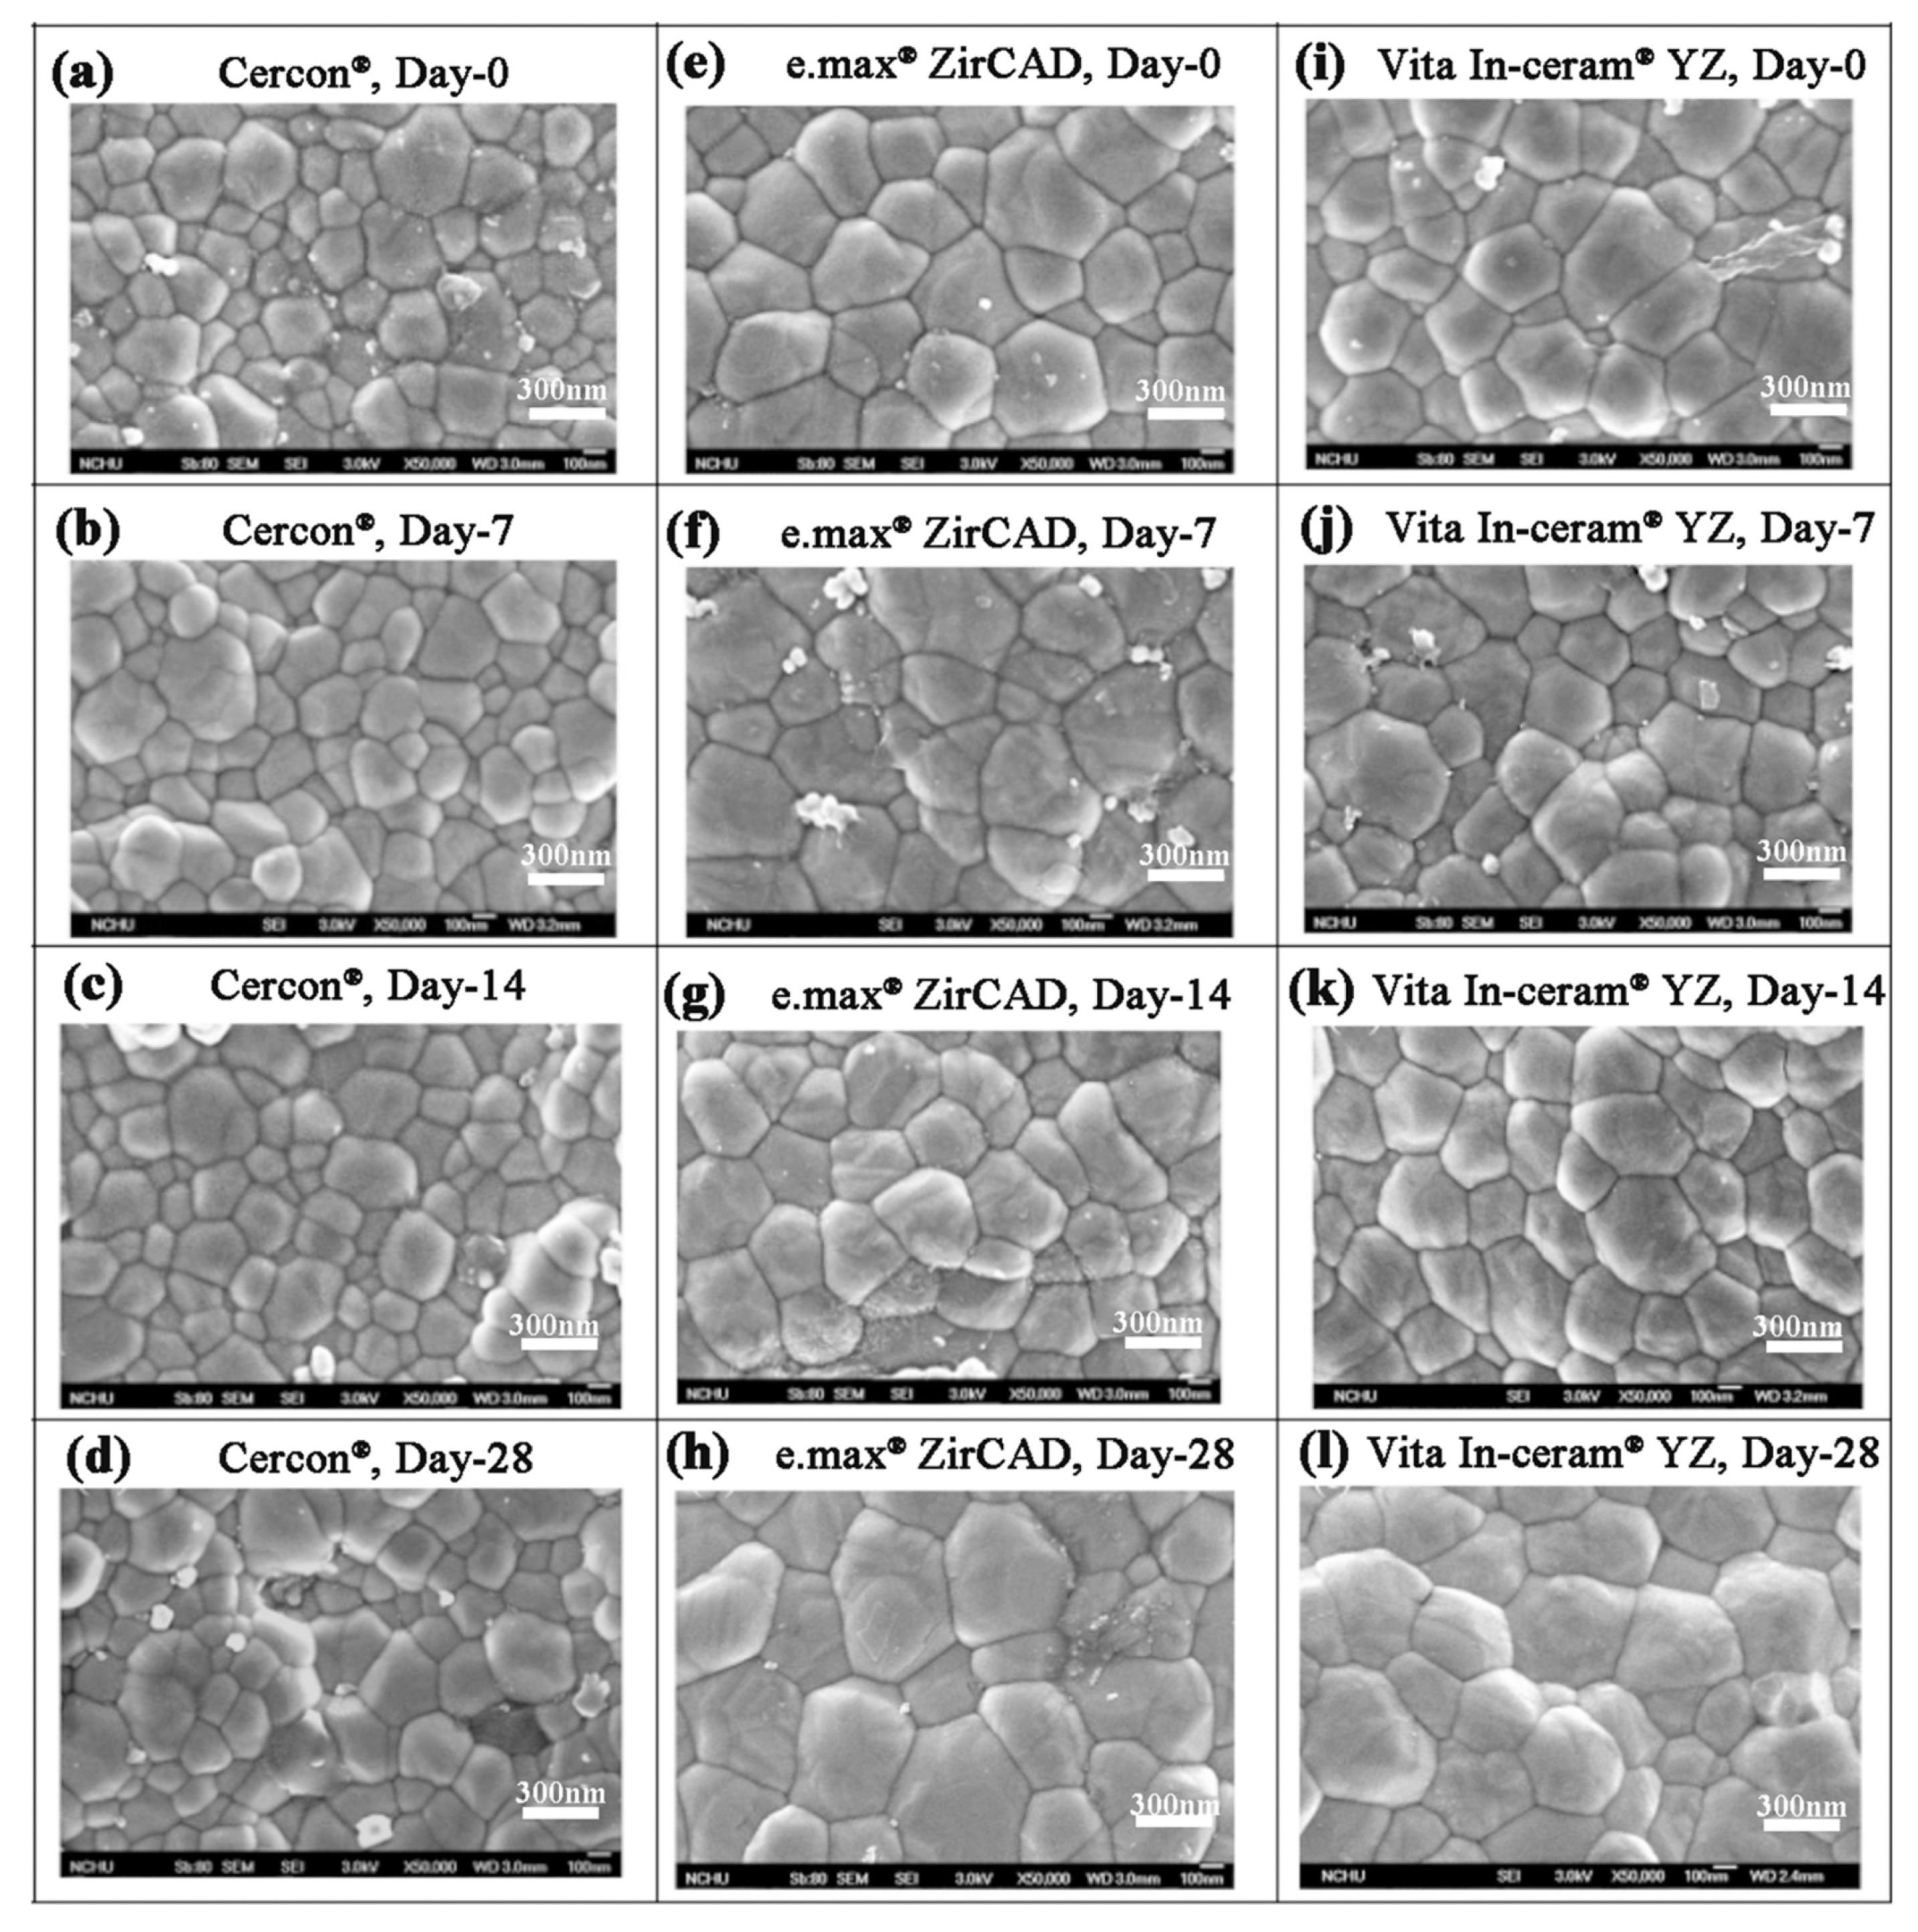
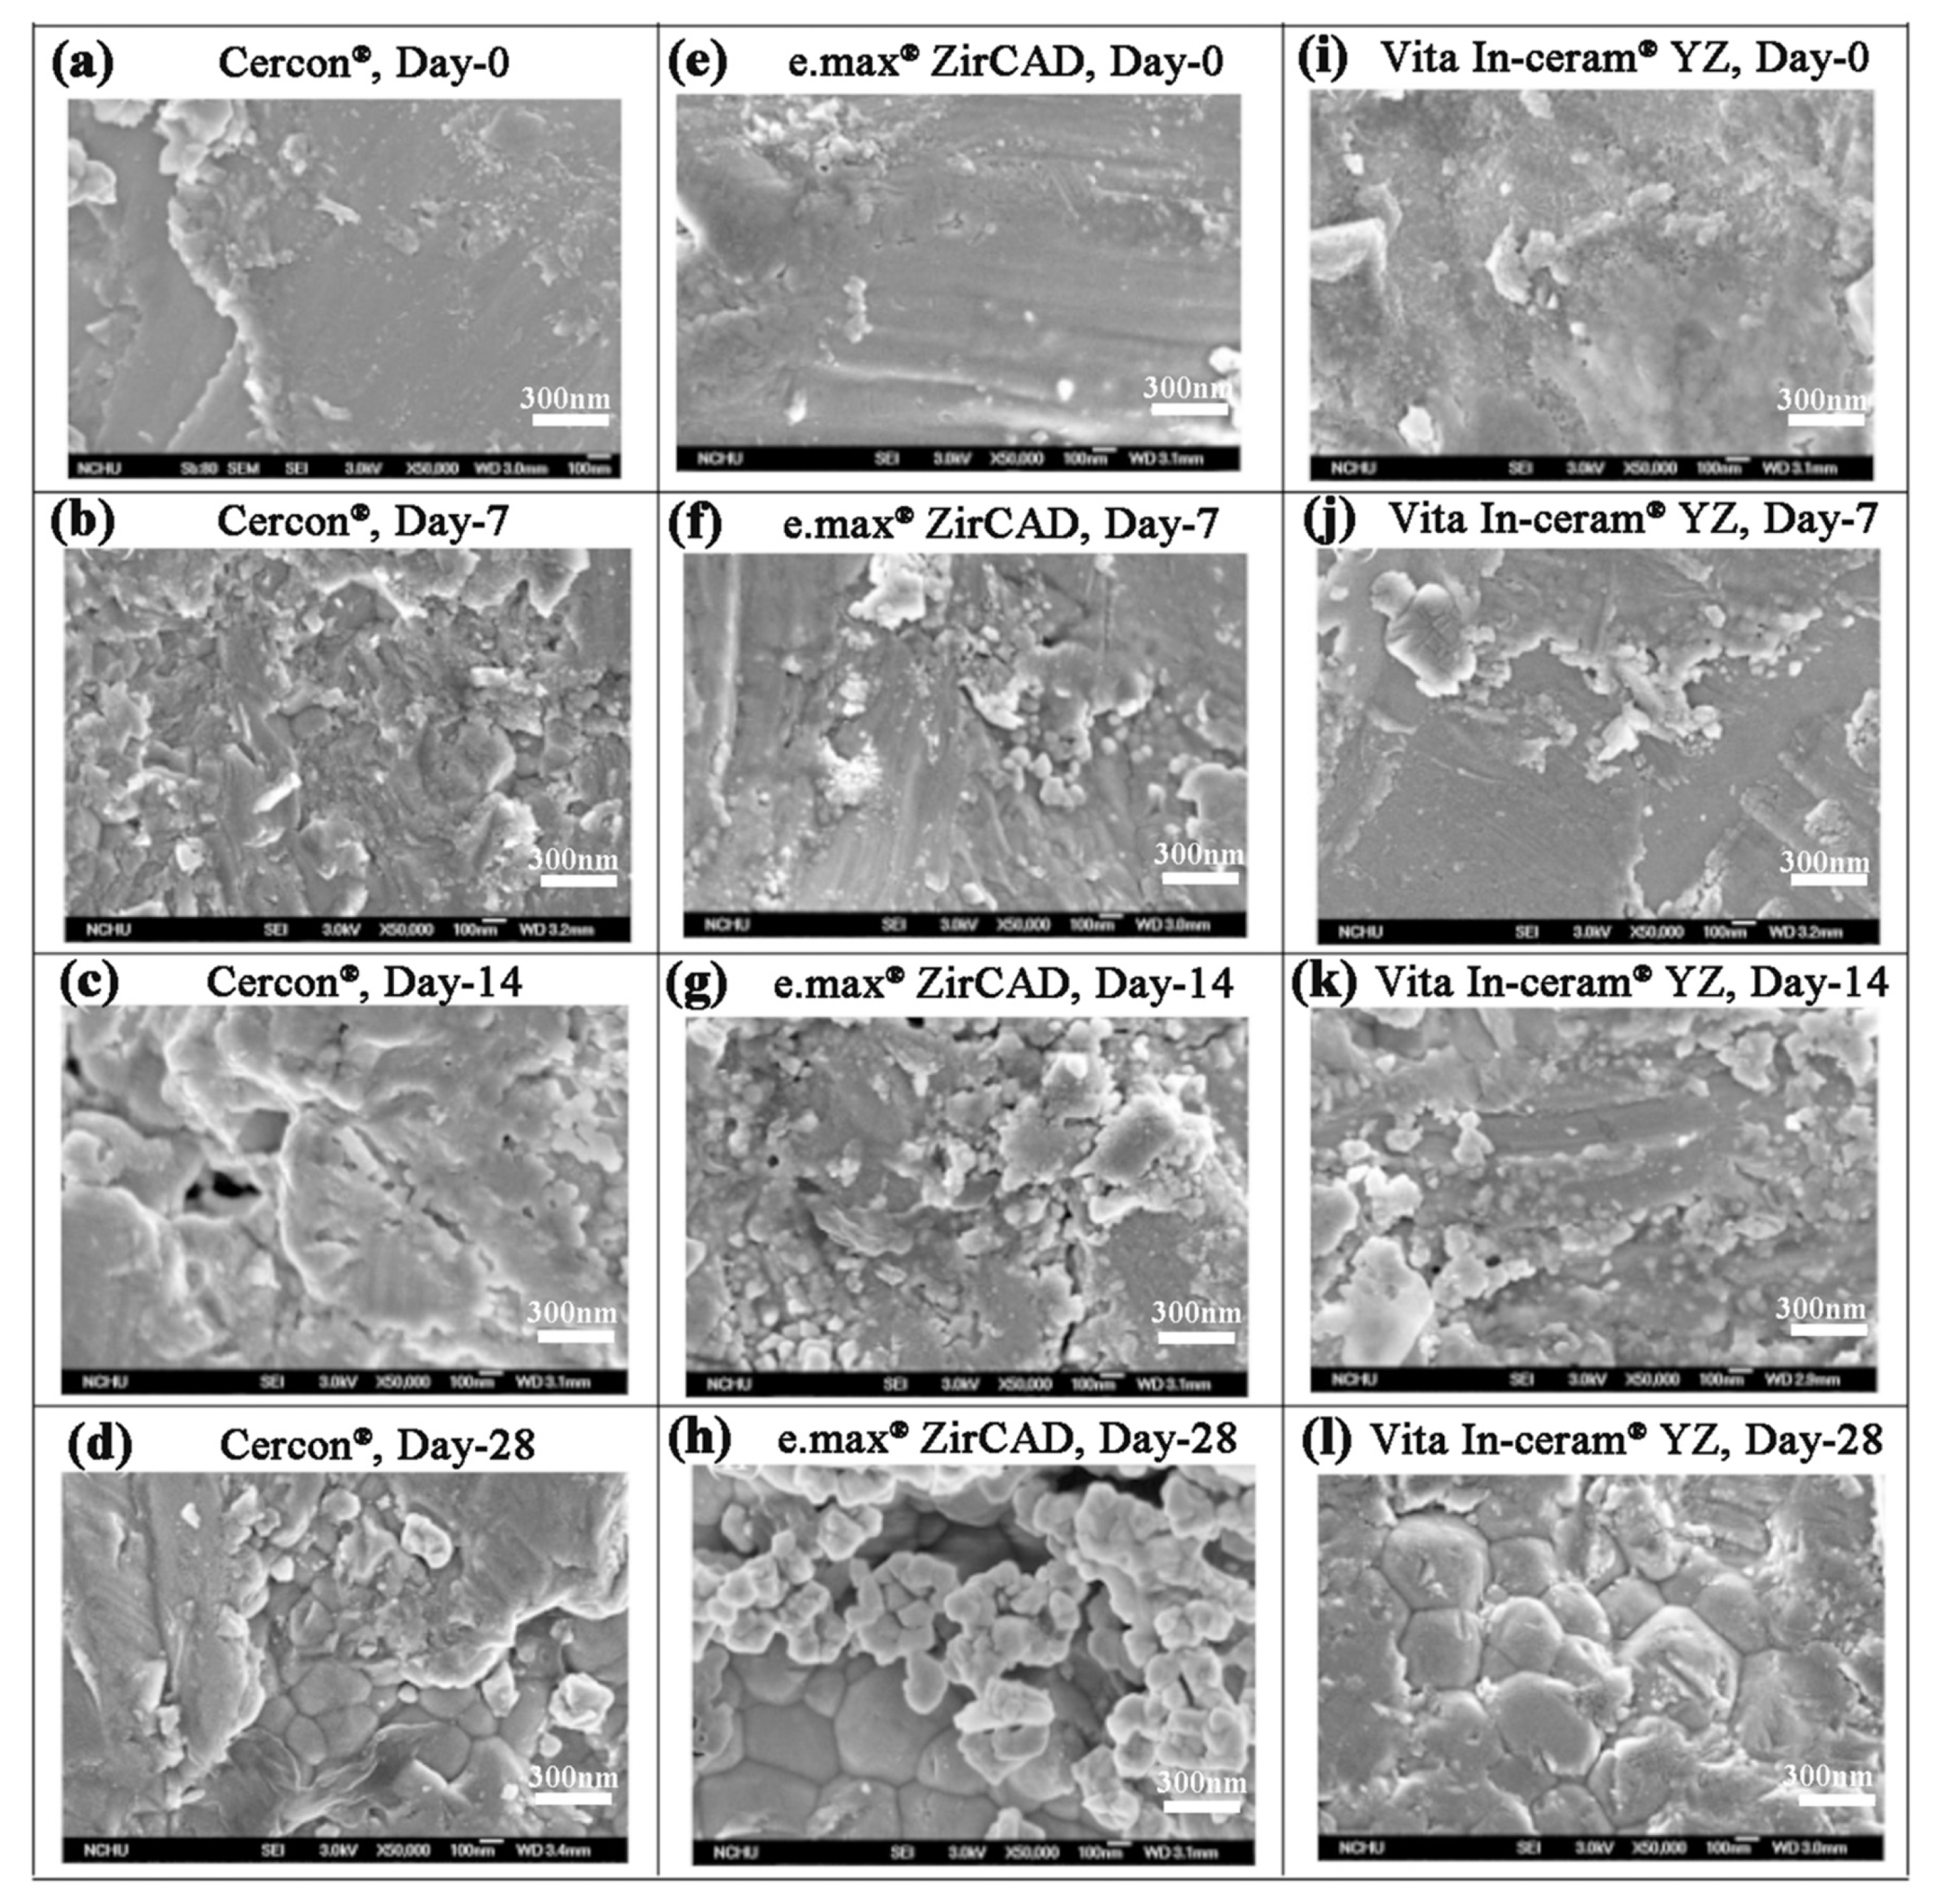
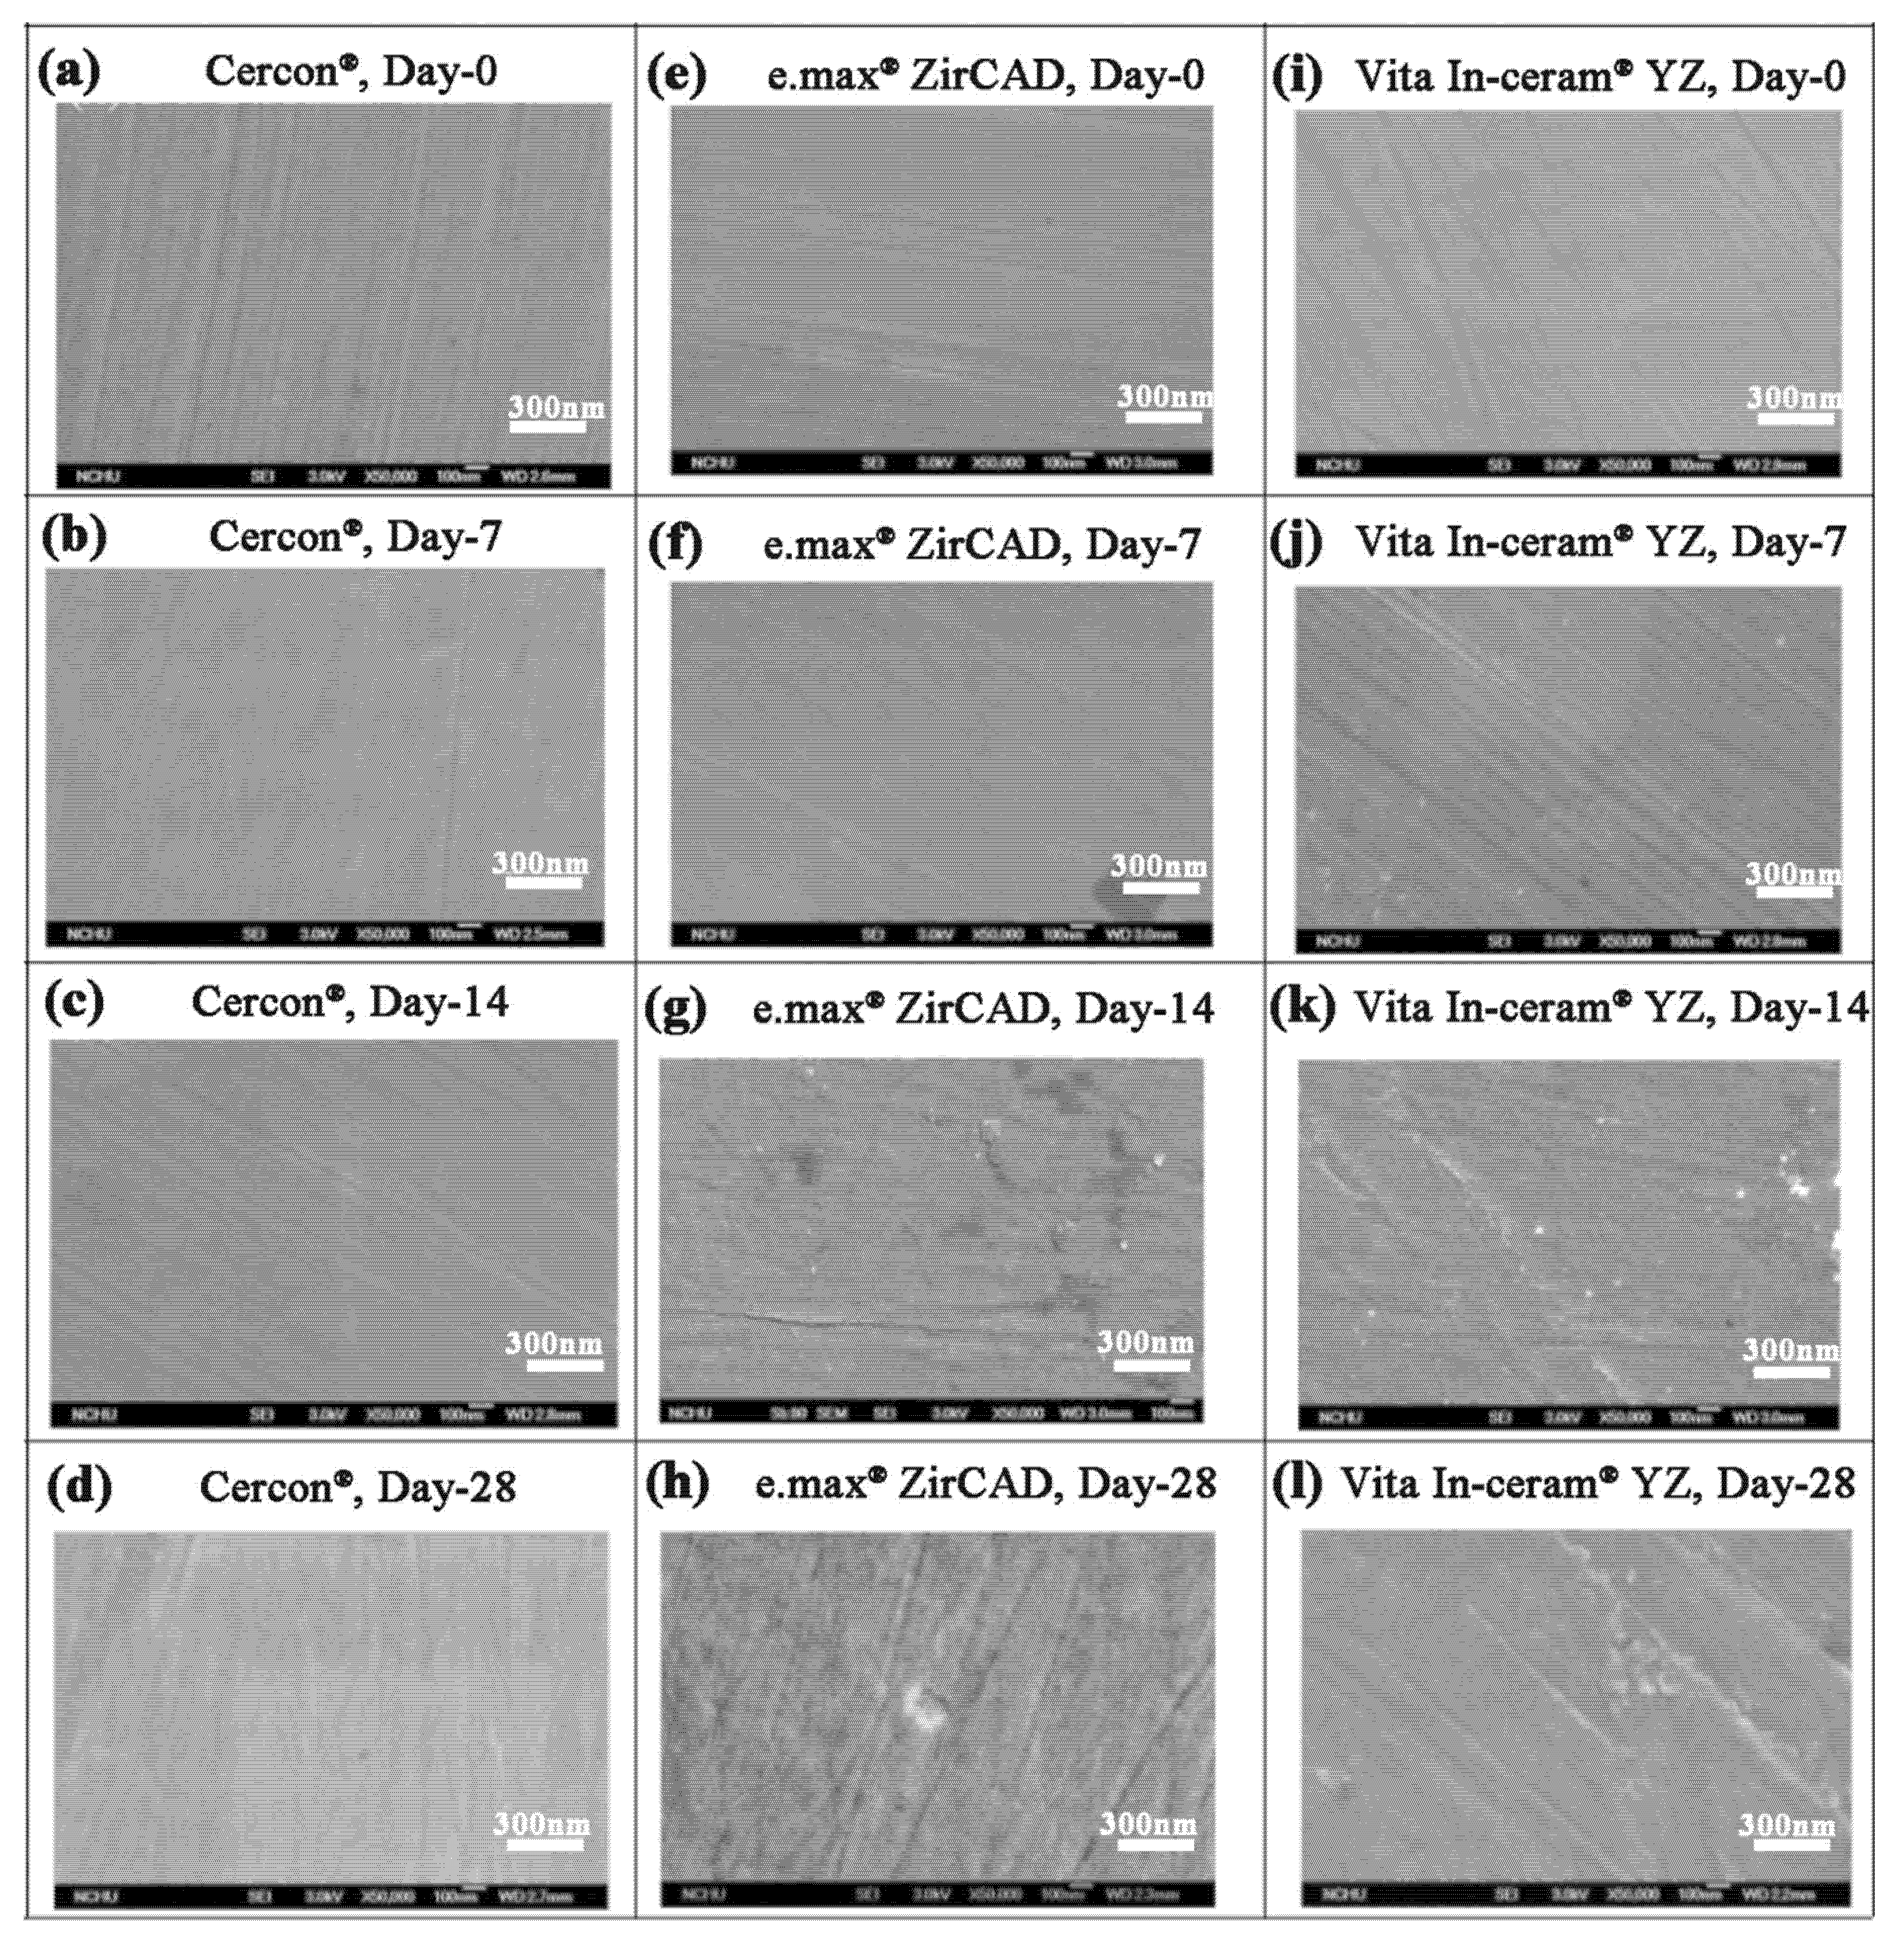
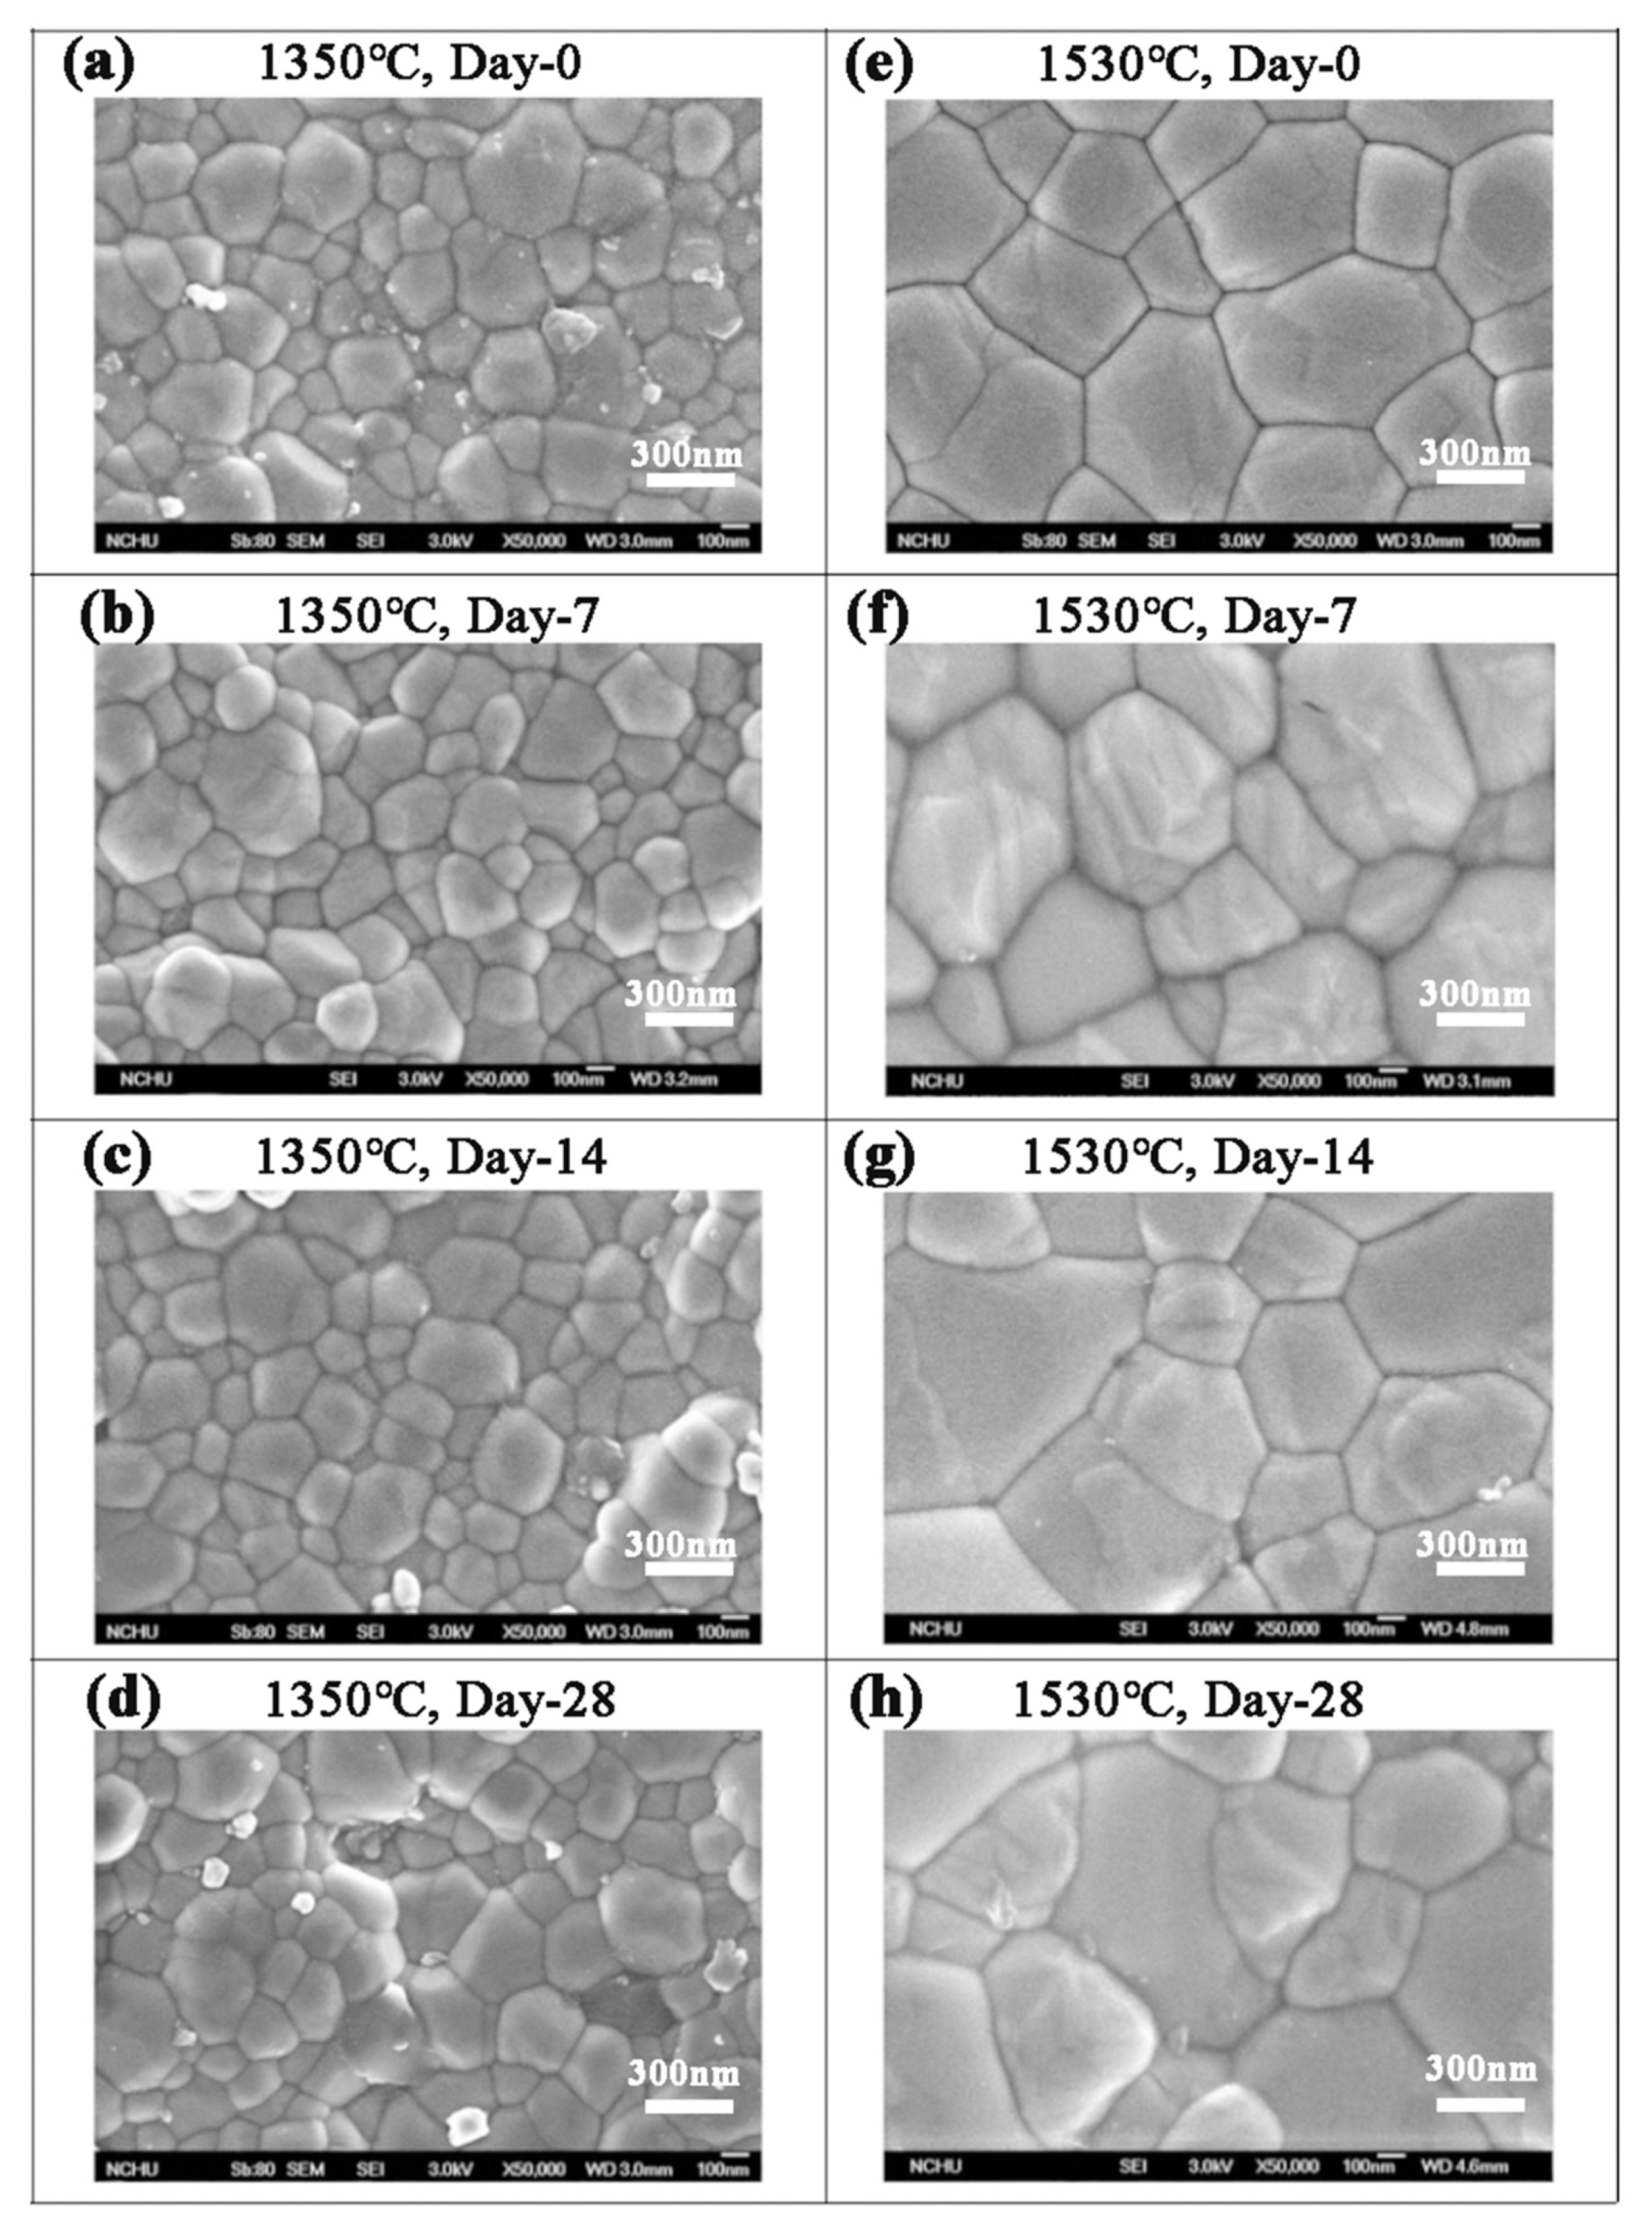
3.2. SEM Investigation
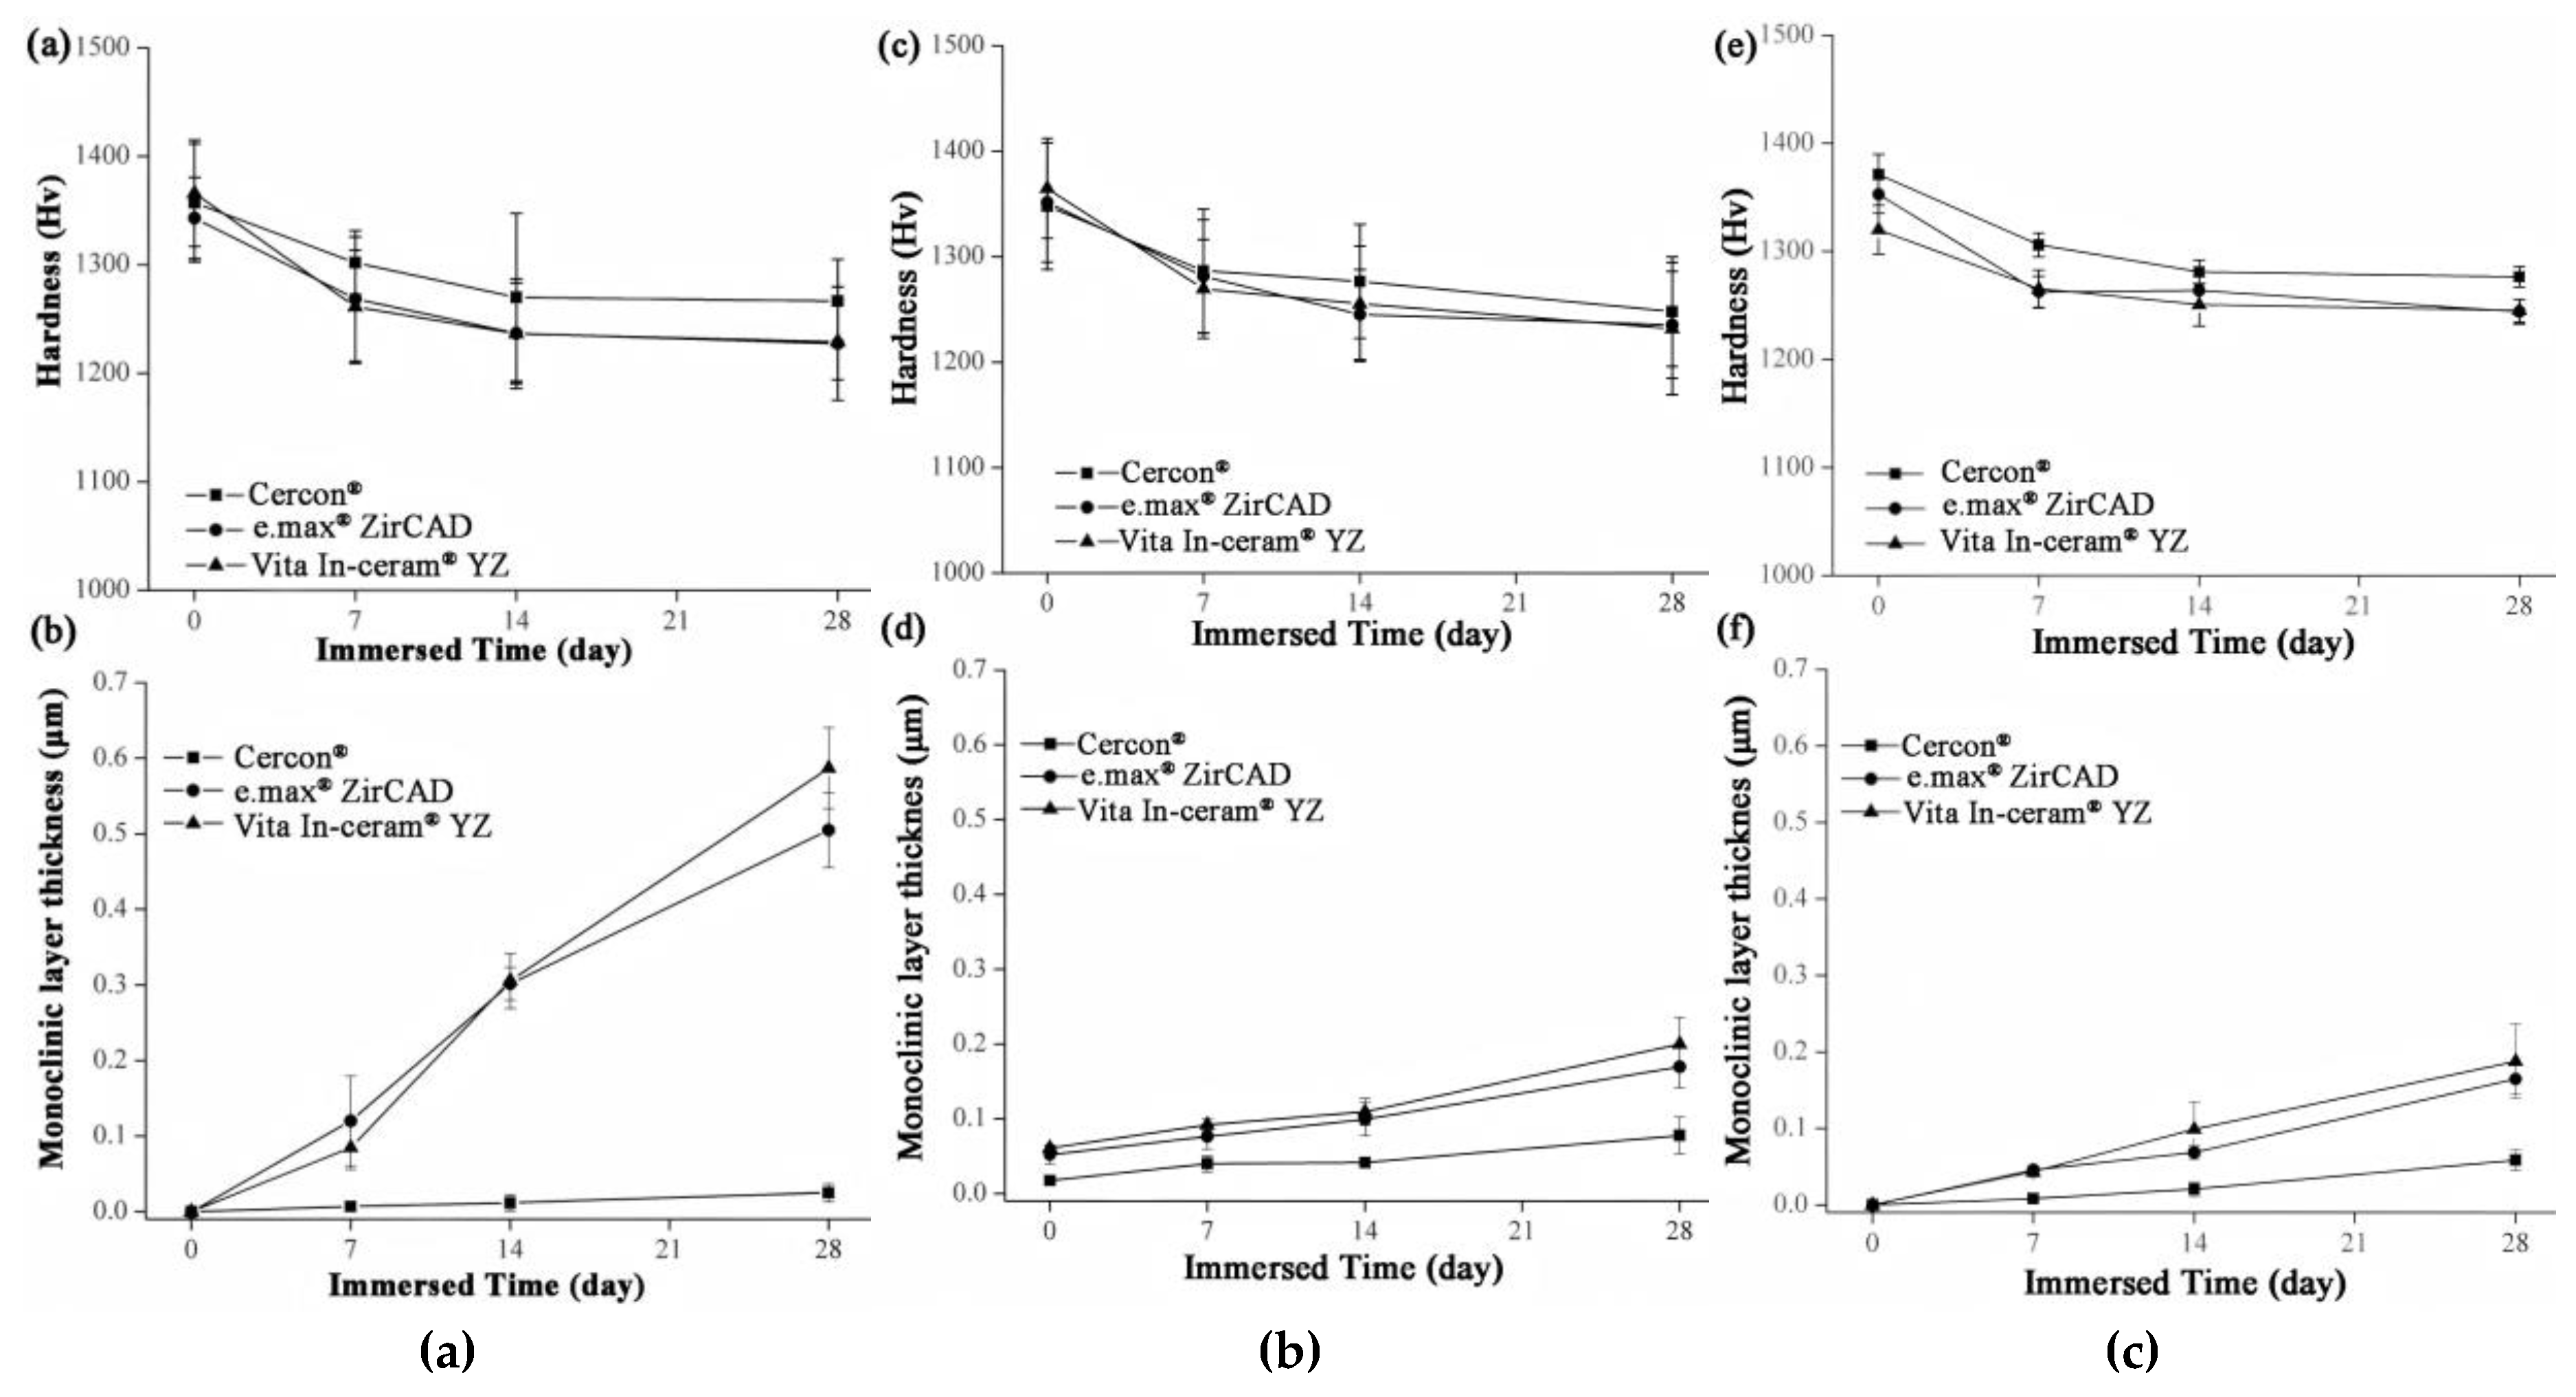
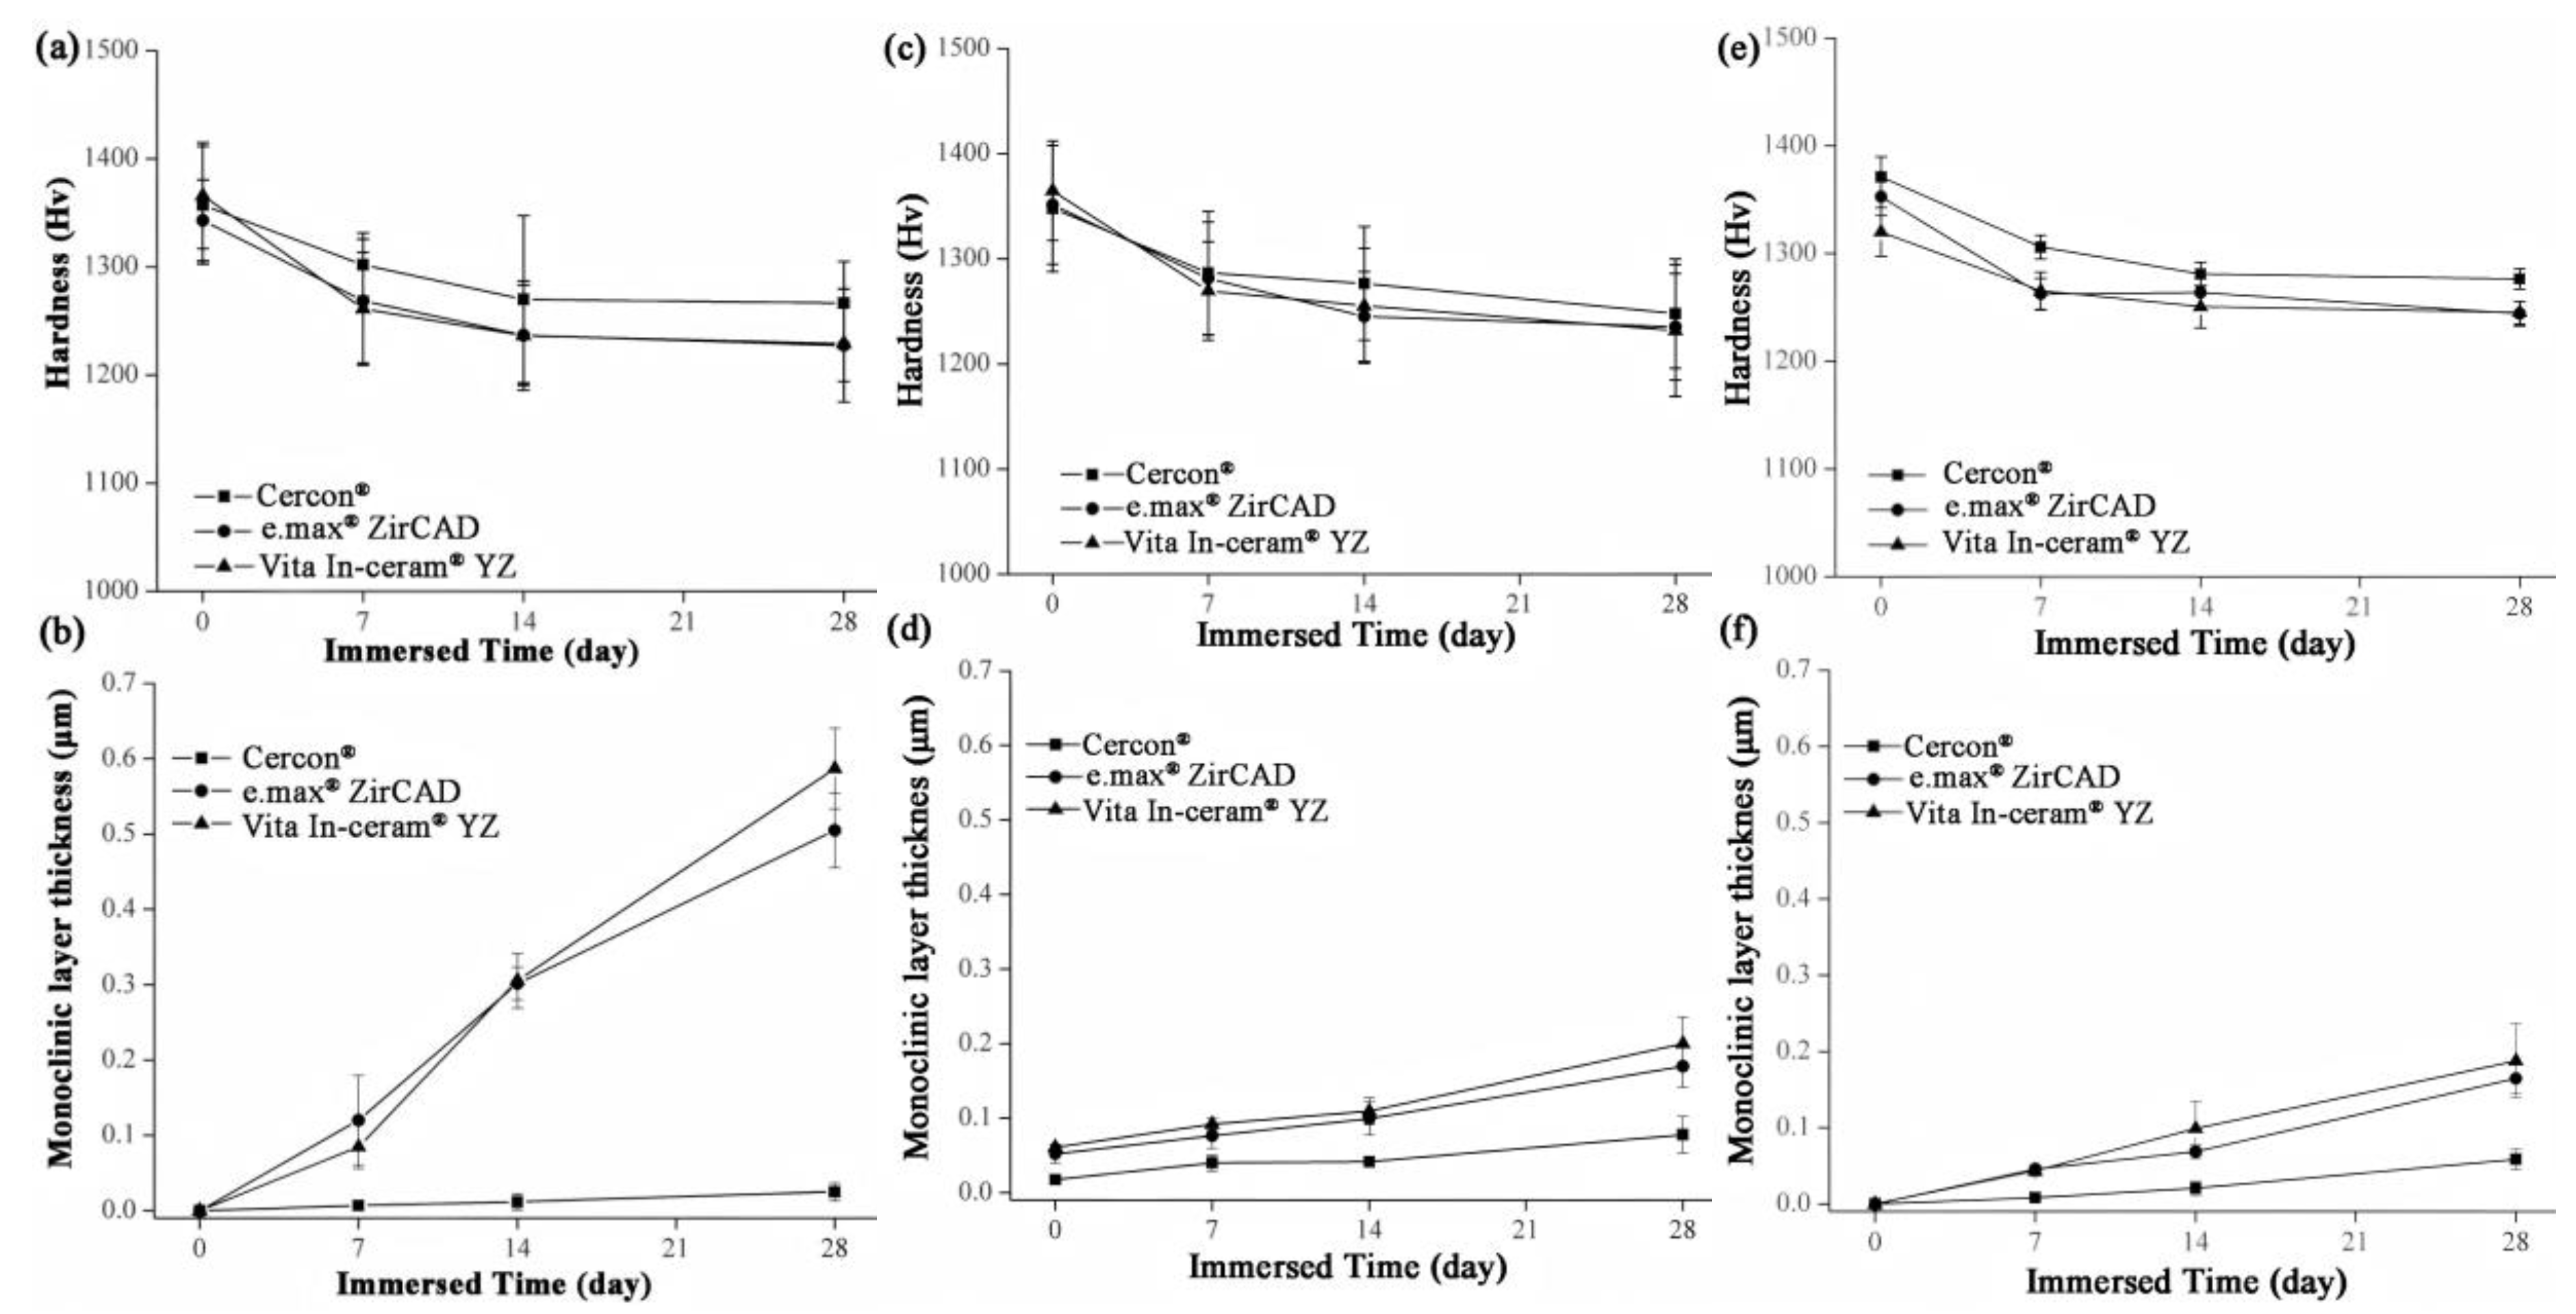
3.3. Microhardness Analysis
4. Discussion
5. Conclusions
- After immersion, the commercial dental zirconia monoclinic phase fractions of e.max® ZirCAD and Vita In-ceram® YZ were similar, with values of 22% and 25%, respectively. However, the monoclinic phase fraction of Cercon® was only 2%. The grain size of Cercon® was smaller than that of e.max® ZirCAD and Vita In-ceram® YZ. It was found that a finer grain structure (<300 nm) inhibited the t→m transformation.
- The differences in commercial dental zirconia in the LTD test were mainly related to the grain size. The products with low sintering temperatures had smaller grains, which could effectively inhibit the occurrence of phase transformation and reduce the LTD of zirconia.
- Commercial dental zirconia could inhibit LTD after surface treatment and immersion, and the inhibitory effect of grinding polishing was better than that of sandblasting.
- In our future work, we will further explore flexural strength, fracture toughness, wear resistance, surface roughness analysis, and material adhesion after modifications. In addition, the biological cell experiments on these materials after processing will be part of the subsequent work to explore their impact in the biological environment.
Author Contributions
Funding
Institutional Review Board Statement
Informed Consent Statement
Data Availability Statement
Conflicts of Interest
Abbreviations
| LTD | Low-temperature degradation |
| SEM | Scanning electron microscope |
| TZD | Transformed zone depth |
| XRD | X-ray diffraction |
| Y-TZP | Yttria-stabilized tetragonal zirconia polycrystal |
References
- Wang, B.; Alazwari, R.S.; Ahmed, S.; Hu, Z.; Cattell, M.J.; Yan, H. Dielectric probing of low-temperature degradation resistance of commercial zirconia bio-ceramics. Dent. Mater. 2024, 40, 921–929. [Google Scholar] [PubMed]
- Lakhloufi, S.; Labjar, N.; Labjar, H.; Serghini- Idrissi, M.; El Hajjaji, S. Electrochemical behavior and surface stability of dental zirconia ceramics in acidic environments. J. Mech. Behav. Biomed. Mater. 2024, 150, 106288. [Google Scholar]
- Carvalho, L.F.; Bergamo, E.T.P.; Campos, T.M.B.; Fermino, E.S.; Alves, L.M.M.; Benalcázar-Jalkh, E.B.; Sousa, E.O.; Coelho, P.G.; Witek, L.; Tebcherani, S.M.; et al. Characterization of a hydrothermally aged experimental alumina-toughened zirconia composite. Dent. Mater. 2024, 40, 1464–1476. [Google Scholar] [CrossRef]
- Čokić, S.M.; Li, M.; Huang, S.; Vleugels, J.; Van Meerbeek, B.; Zhang, F. Coloring multilayer zirconia may affect its optical and mechanical properties. J. Dent. Res. 2024, 103, 1091–1099. [Google Scholar] [CrossRef]
- Akhlaghi, O.; Camposilvan, E.; Garnier, V.; Goharibajestani, Z.; Khabbaz, S.; Ow-Yang, C.; Jorand, Y.; Gremillard, L.; Chevalier, J. Conventional sintering of nano-crystalline yttria-stabilized zirconia enables high-strength, highly translucent and opalescent dental ceramics. Dent. Mater. 2024, 40, 1031–1040. [Google Scholar] [CrossRef]
- Maharishi, A.; McLaren, E.A.; White, S.N. Color- and strength-graded zirconia: Strength, light transmission, and composition. J. Prosthet. Dent. 2024, 131, 1236.e1231–1236.e1239. [Google Scholar] [CrossRef]
- Lughi, V.; Sergo, V. Low temperature degradation -aging- of zirconia: A critical review of the relevant aspects in dentistry. Dent. Mater. 2010, 26, 807–820. [Google Scholar] [CrossRef]
- Koenig, V.; Douillard, T.; Chevalier, J.; Amiard, F.; Lamy de la Chapelle, M.; Le Goff, S.; Vanheusden, A.; Dardenne, N.; Wulfman, C.; Mainjot, A. Intraoral low-temperature degradation of monolithic zirconia dental prostheses: 5-year results of a prospective clinical study with ex vivo monitoring. Dent. Mater. 2024, 40, 198–209. [Google Scholar]
- Deville, S.; Chevalier, J.; Gremillard, L. Influence of surface finish and residual stresses on the ageing sensitivity of biomedical grade zirconia. Biomaterials 2006, 27, 2186–2192. [Google Scholar] [CrossRef]
- Hee-Kyung, K.; Byungmin, A. Effect of Al2O3 sandblasting particle size on the surface topography and residual compressive stresses of three different dental zirconia grades. Materials 2021, 14, 610–628. [Google Scholar] [CrossRef]
- Guazzato, M.; Albakry, M.; Quach, L.; Swain, M.V. Influence of surface and heat treatments on the flexural strength of a glass-infiltrated alumina/zirconia-reinforced dental ceramic. Dent. Mater. 2005, 21, 454–463. [Google Scholar] [PubMed]
- ISO 6872; Dentistry-Ceramic Materials. International Standardization Organization: Geneva, Switzerland, 2015.
- Cristina, H.-G.; María, R.-G.; Serafín, M.-S.; María-Angeles, S.-F.; Daniel, T.-L. A review on cad/cam yttria-stabilized tetragonal zirconia polycrystal (Y-TZP) and polymethyl methacrylate (pmma) and their biological behavior. Polymers 2022, 14, 906. [Google Scholar]
- Alsayed, H. Misfit of implant-supported zirconia (Y-TZP) cad-cam framework compared to non-zirconia frameworks: A systematic review. Medicina 2022, 58, 1347. [Google Scholar] [CrossRef]
- Khulud, A.A.-A.; Saad, A.; Aasem, M.A.; Fahim, V.; Tariq, A. Influence of time and hydration (ageing) on flexural strength of yttrium stabilized zirconia polycrystals (Y-TZP) fabricated with different cad-cam systems. Pak. J. Med. Sci. 2021, 37, 833. [Google Scholar]
- Tian, J.; Ho, W.; Hsu, H.; Song, Y.; Wu, S. Evaluation of feasibility on dental zirconia-accelerated aging test by chemical immersion method. Materials 2023, 16, 7691. [Google Scholar] [CrossRef]
- Zhuang, Y.; Zhu, Z.; Jiao, T.; Sun, J. Effect of aging time and thickness on low-temperature degradation of dental zirconia. J. Prosthodont. 2019, 28, e404–e410. [Google Scholar]
- Okada, M.; Taketa, H.; Hara, E.S.; Torii, Y.; Irie, M.; Matsumoto, T. Improvement of mechanical properties of Y-TZP by thermal annealing with monoclinic zirconia nanoparticle coating. Dent. Mater. 2019, 35, 970–978. [Google Scholar]
- Shahmoradi, M.; Wan, B.; Zhang, Z.; Swain, M.; Li, Q. Mechanical failure of posterior teeth due to caries and occlusal wear- a modelling study. J. Mech. Behav. Biomed. Mater. 2022, 125, 104942. [Google Scholar]
- Chevalier, J.; Gremillard, L.; Virkar, A.V.; Clarke, D.R. The tetragonal-monoclinic transformation in zirconia: Lessons learned and future trends. J. Am. Ceram. Soc. 2009, 92, 1901–1920. [Google Scholar] [CrossRef]
- Schmauder, S.; Schubert, H. Significance of internal stresses for the martensitic transformation in yttria-stabilized tetragonal zirconia polycrystals during degradation. J. Am. Ceram. Soc. 1986, 69, 534–540. [Google Scholar]
- Zinelis, S.; Thomas, A.; Syres, K.; Silikas, N.; Eliades, G. Surface characterization of zirconia dental implants. Dent. Mater. 2010, 26, 295–305. [Google Scholar] [CrossRef] [PubMed]
- Papanagiotou, H.P.; Morgano, S.M.; Giordano, R.A.; Pober, R. In vitro evaluation of low-temperature aging effects and finishing procedures on the flexural strength and structural stability of Y-TZP dental ceramics. J. Prosthet. Dent. 2006, 96, 154–164. [Google Scholar] [CrossRef] [PubMed]
- Kim, J.-W.; Covel, N.S.; Guess, P.C.; Rekow, E.D.; Zhang, Y. Concerns of hydrothermal degradation in cad/cam zirconia. J. Dent. Res. 2010, 89, 91–95. [Google Scholar] [CrossRef]
- Cattani-Lorente, M.; Scherrer, S.S.; Ammann, P.; Jobin, M.; Wiskott, H.W.A. Low temperature degradation of a Y-TZP dental ceramic. Acta Biomater. 2011, 7, 858–865. [Google Scholar] [CrossRef]
- Zhang, F.; Inokoshi, M.; Vanmeensel, K.; Van Meerbeek, B.; Naert, I.; Vleugels, J. Effect of grain boundary segregation on the hydrothermal degradation of dental 3Y-TZP ceramics. In Advances in Bioceramics and Porous Ceramics Viii; Wiley Online Library: Hoboken, NJ, USA, 2015; pp. 81–88. [Google Scholar]
- Kolakarnprasert, N.; Kaizer, M.R.; Kim, D.K.; Zhang, Y. New multi-layered zirconias: Composition, microstructure and translucency. Dent. Mater. 2019, 35, 797–806. [Google Scholar] [CrossRef]
- Nono, M.D.C.D.A. Tetragonal-to-monoclinic transformation influence on the mechanical properties of CeO2- ZrO2 ceramics. Mater. Sci. Forum 2005, 498–499, 506–511. [Google Scholar] [CrossRef]
- Lange, F.F.; Dunlop, G.L.; Davis, B.I. Degradation during aging of transformation-toughenedZrO2- Y2O3 materials at 250 °C. J. Am. Ceram. Soc. 1986, 69, 237–240. [Google Scholar] [CrossRef]
- Yoshimura, M.; Noma, T.; Kawabata, K.; Sōmiya, S. Role of H2O on the degradation process of Y-TZP. J. Mater. Sci. Lett. 1987, 6, 465–467. [Google Scholar] [CrossRef]
- Crispim, A.H.T.; Silva, S.; Moreira, F.G.G.; Silva, B.; Piva, A.; May, L.G.; Daudt, N.F.; Souza, R.O.A. Effect of ZrO2 paste, surface treatments, and storage on weibull characteristics and resin bond strength to zirconia. Braz. Dent. J. 2024, 22, 0103–6440202405581. [Google Scholar] [CrossRef]
Disclaimer/Publisher’s Note: The statements, opinions and data contained in all publications are solely those of the individual author(s) and contributor(s) and not of MDPI and/or the editor(s). MDPI and/or the editor(s) disclaim responsibility for any injury to people or property resulting from any ideas, methods, instructions or products referred to in the content. |
© 2025 by the authors. Licensee MDPI, Basel, Switzerland. This article is an open access article distributed under the terms and conditions of the Creative Commons Attribution (CC BY) license (https://creativecommons.org/licenses/by/4.0/).
Share and Cite
Tian, J.; Liao, H.-J.; Ho, W.-F.; Hsu, H.-C.; Wu, S.-C. Influence of Different Surface Treatments on the Low-Temperature Degradation of Three Commercial Yttria-Stabilized Tetragonal Zirconia Polycrystal. Materials 2025, 18, 2543. https://doi.org/10.3390/ma18112543
Tian J, Liao H-J, Ho W-F, Hsu H-C, Wu S-C. Influence of Different Surface Treatments on the Low-Temperature Degradation of Three Commercial Yttria-Stabilized Tetragonal Zirconia Polycrystal. Materials. 2025; 18(11):2543. https://doi.org/10.3390/ma18112543
Chicago/Turabian StyleTian, Jumei, Huei-Jyuan Liao, Wen-Fu Ho, Hsueh-Chuan Hsu, and Shih-Ching Wu. 2025. "Influence of Different Surface Treatments on the Low-Temperature Degradation of Three Commercial Yttria-Stabilized Tetragonal Zirconia Polycrystal" Materials 18, no. 11: 2543. https://doi.org/10.3390/ma18112543
APA StyleTian, J., Liao, H.-J., Ho, W.-F., Hsu, H.-C., & Wu, S.-C. (2025). Influence of Different Surface Treatments on the Low-Temperature Degradation of Three Commercial Yttria-Stabilized Tetragonal Zirconia Polycrystal. Materials, 18(11), 2543. https://doi.org/10.3390/ma18112543