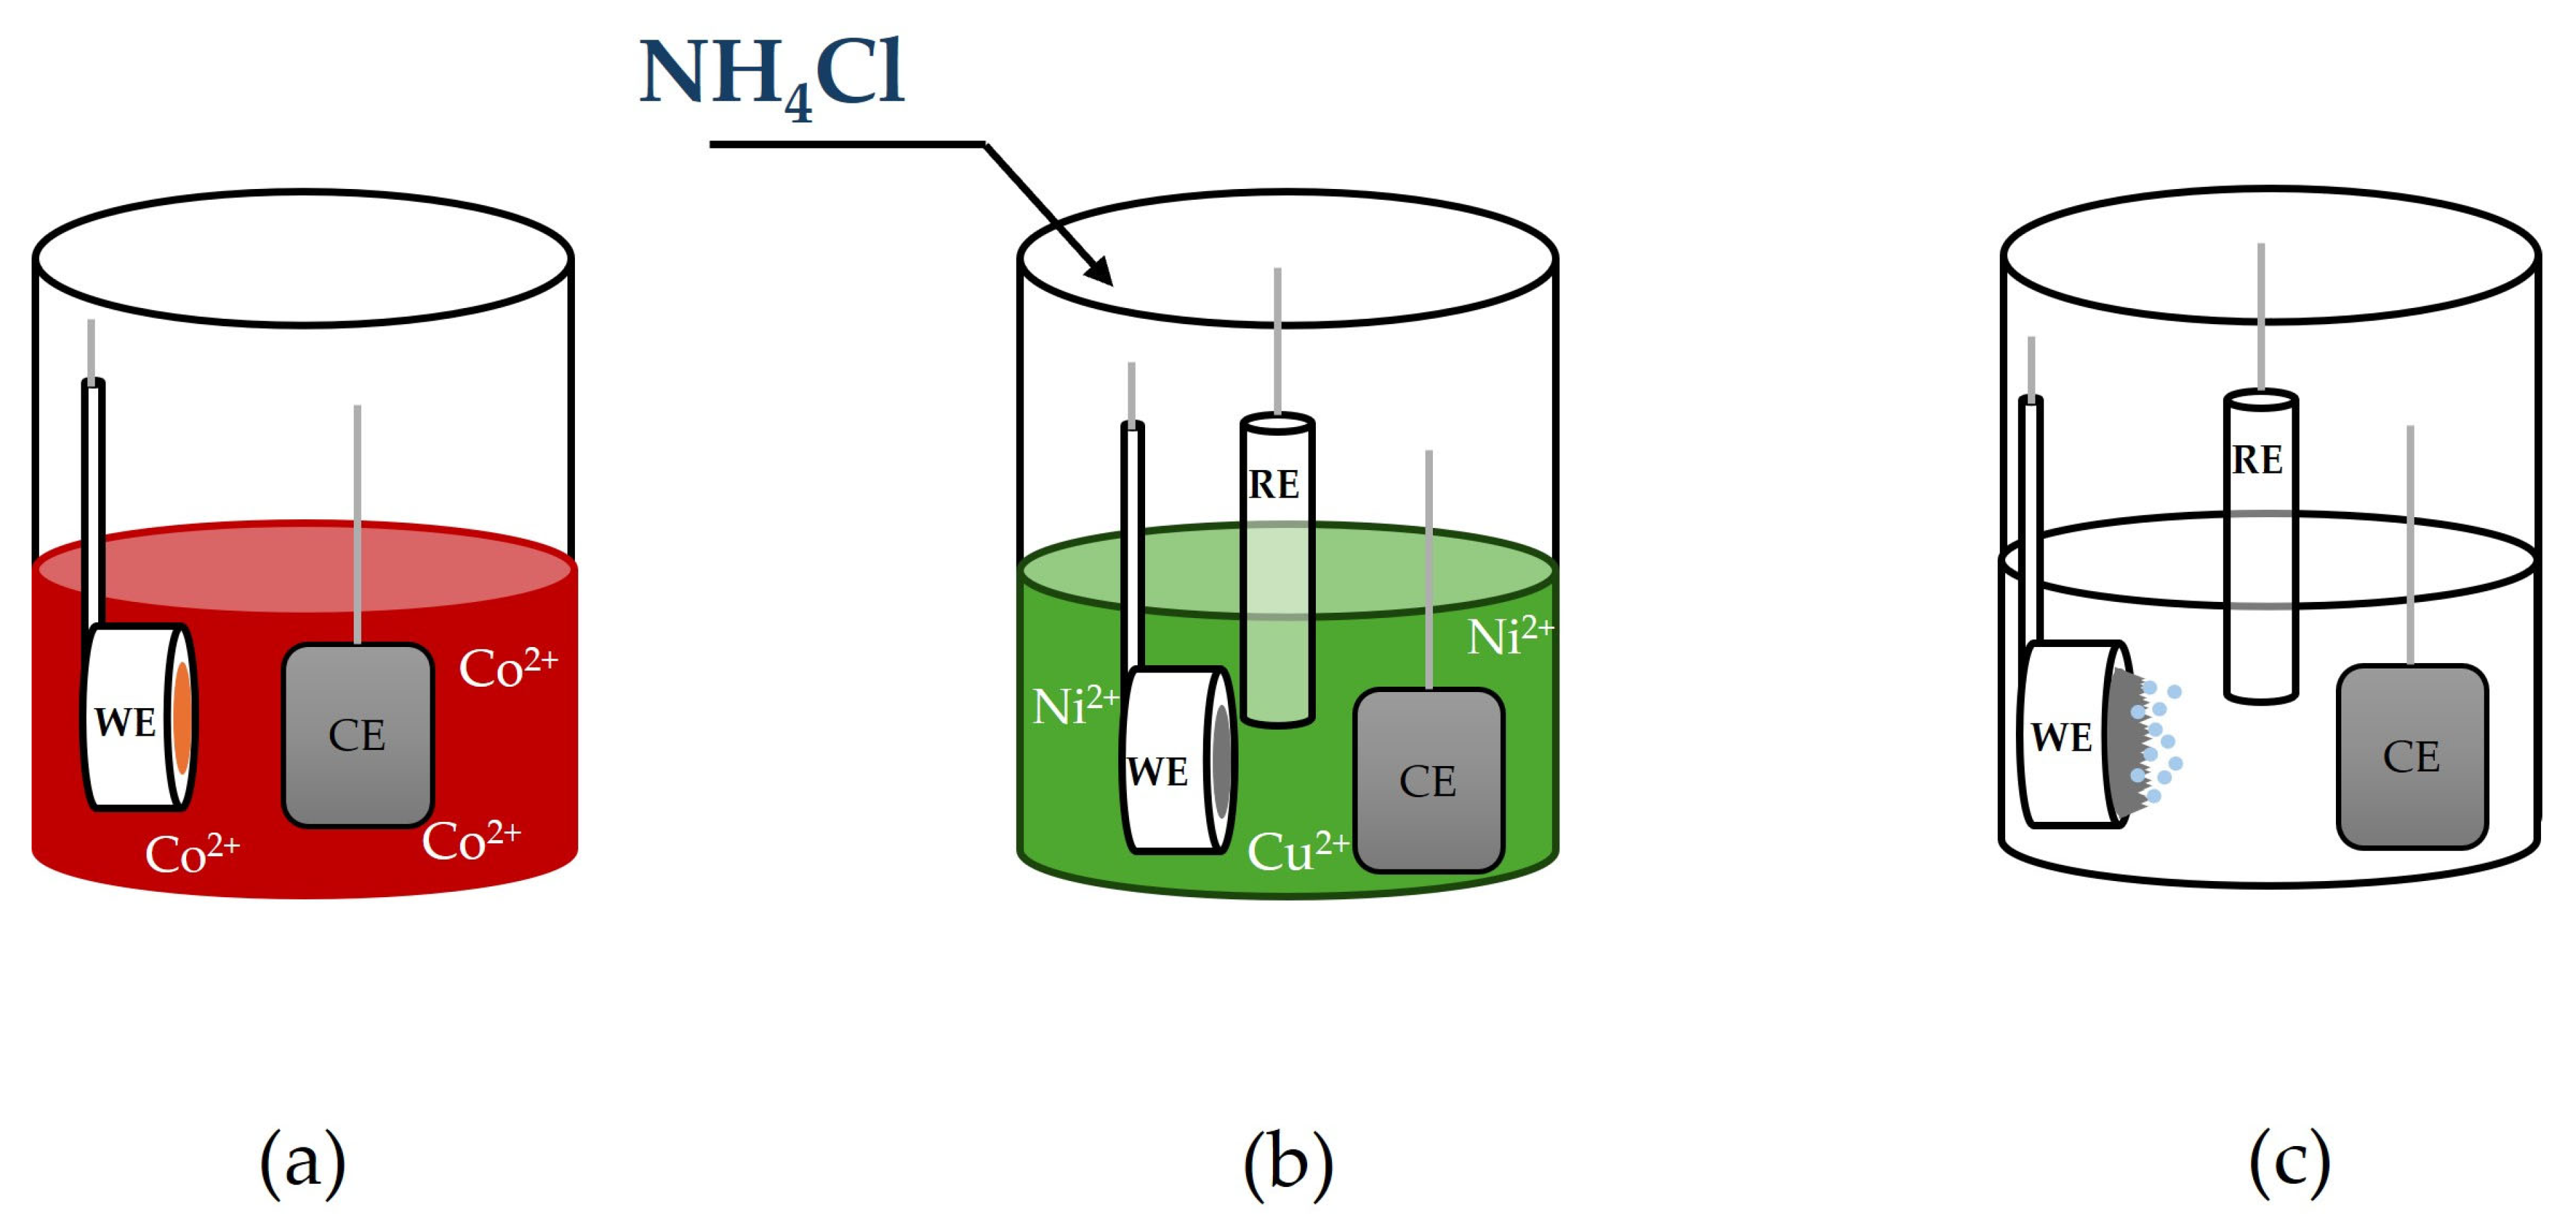
3.1. Synthesis of Ni-Cu Alloys
Firstly, different CuCl
2 contents were added to NiCl
2 solutions to synthesize Ni-Cu alloys. Copper chloride was chosen because it is believed that chloride ions act as a crystal modifier [
43].
Table 1 lists the chemical composition of the obtained samples, and
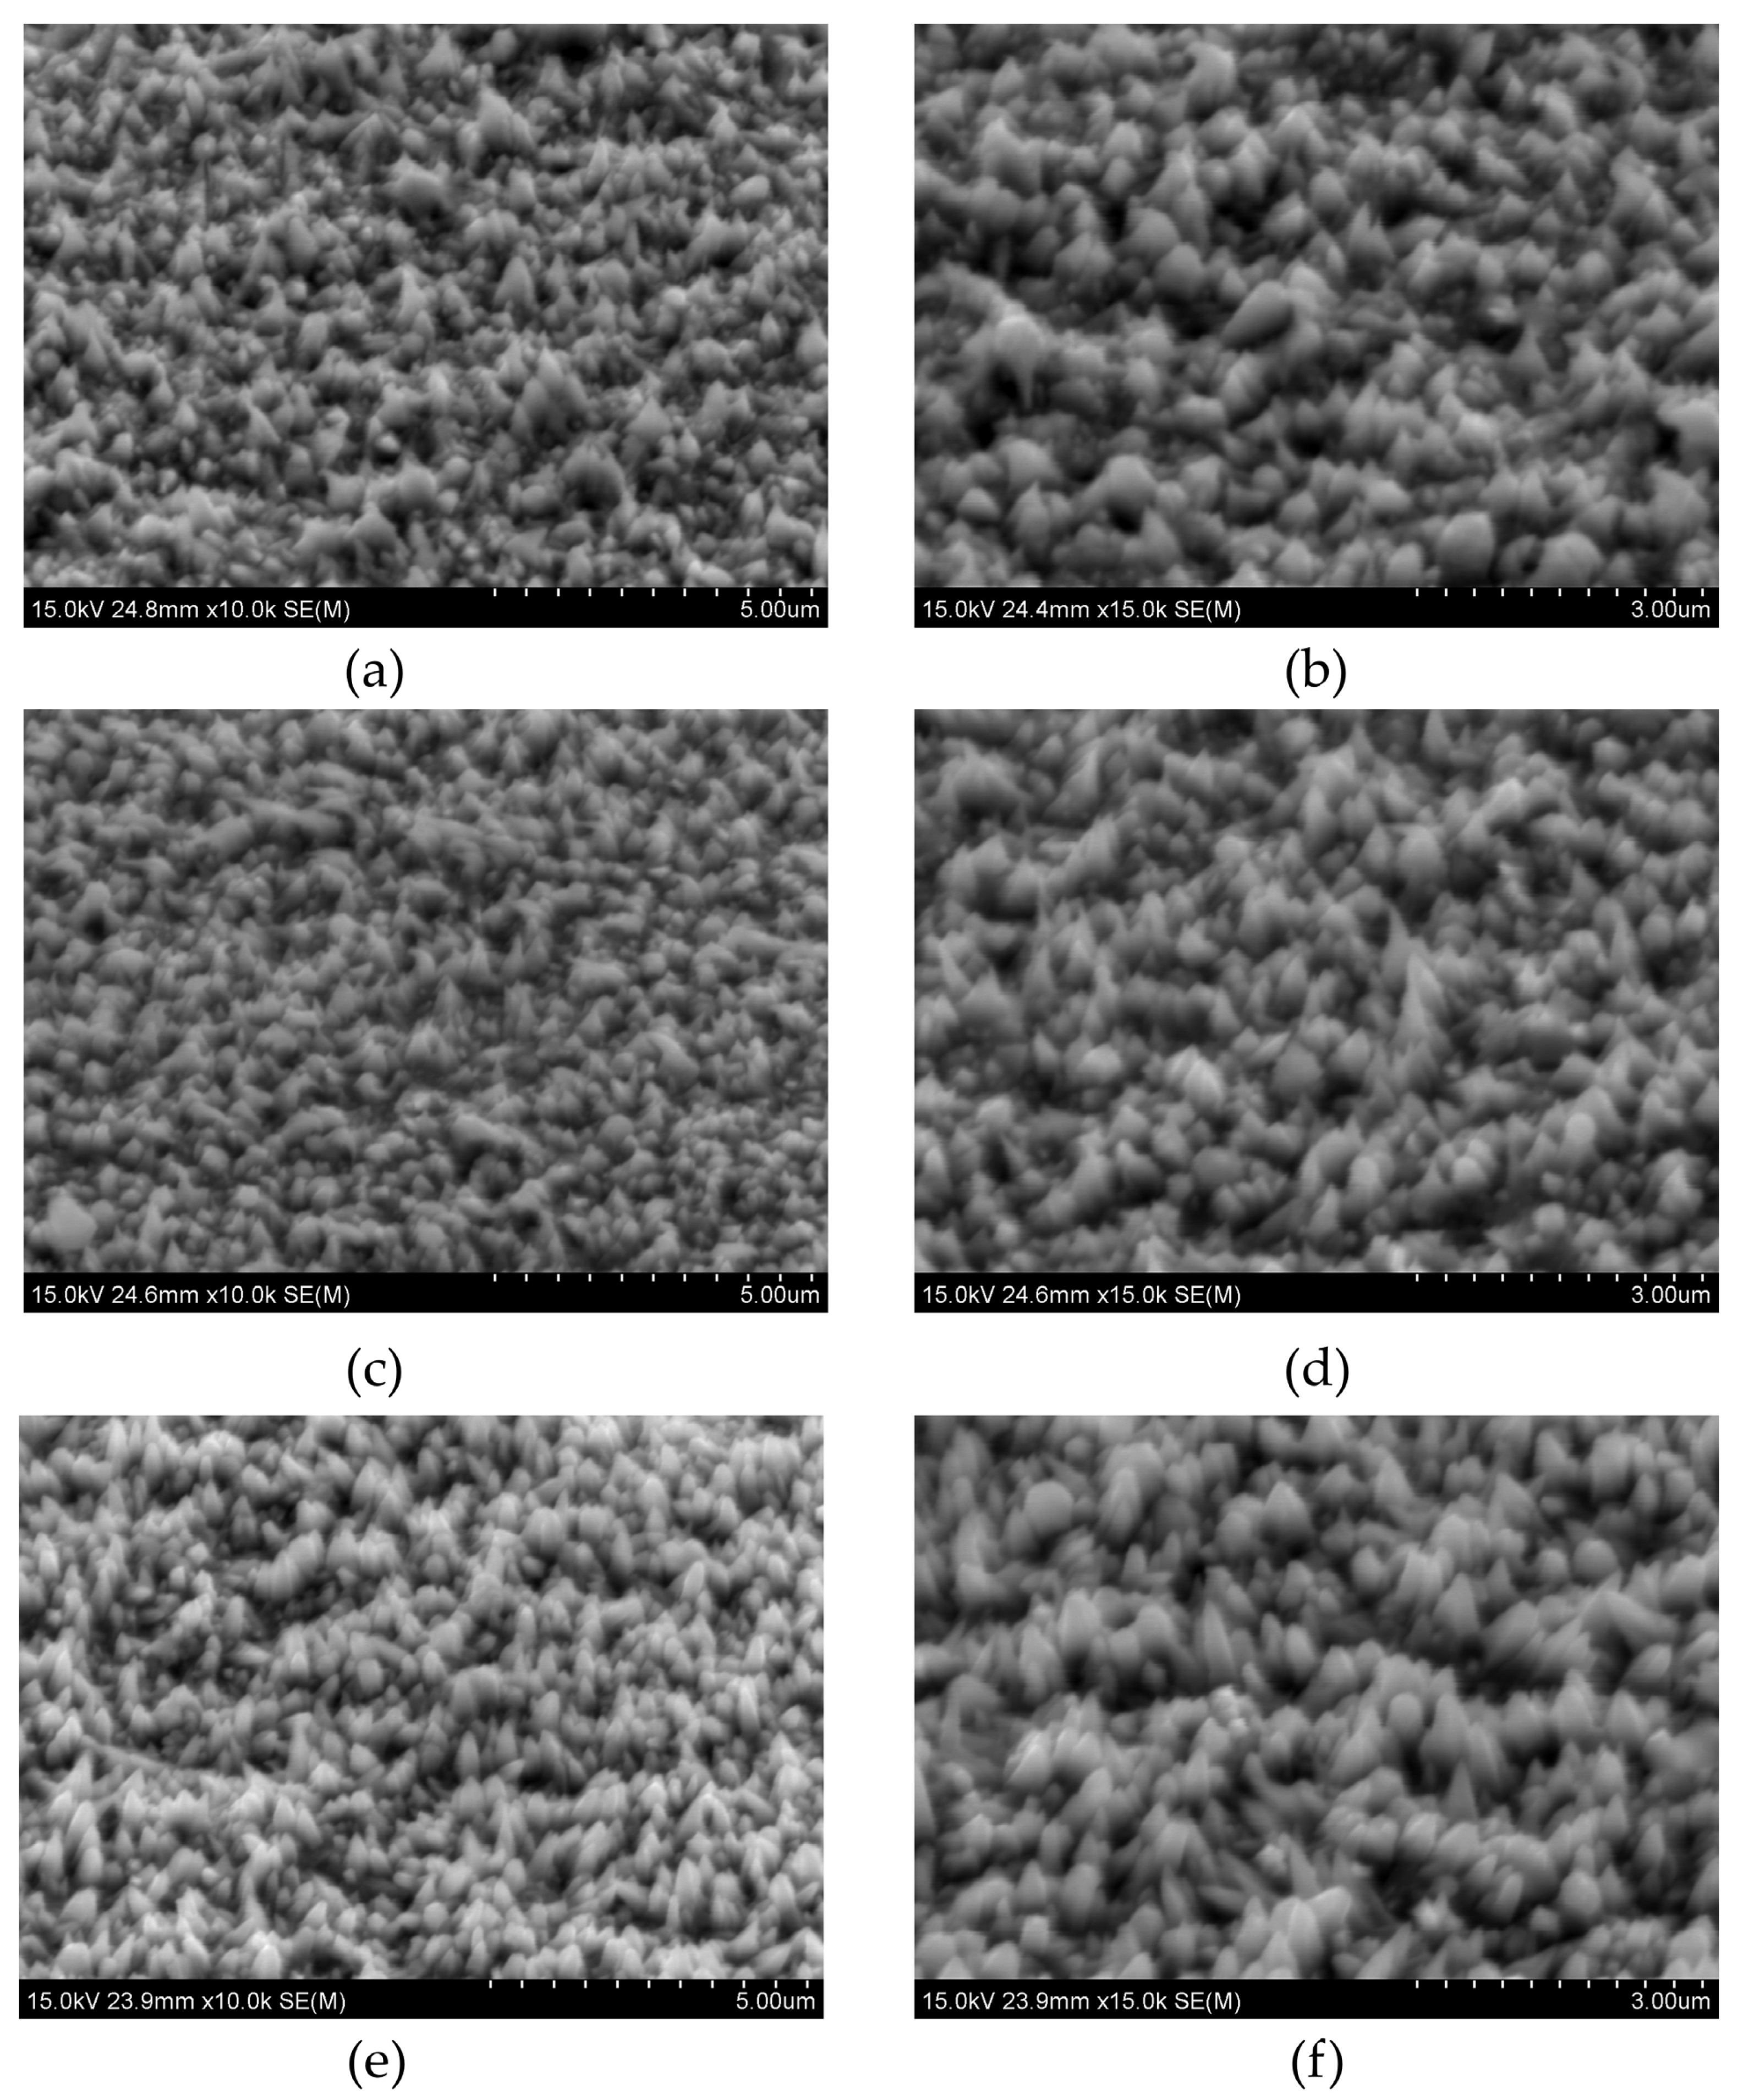
Figure 2 shows their morphology.
When the concentration of copper chloride is too low, Cu is not detected by EDS analysis. The detection limit of this technique is about 0.1 at.%. The morphology of the deposits remains conical, featuring smaller and larger cones. The detected chlorine is likely a residue from the electrolyte (
Table 1). As the Cu concentration increases, the copper content reaches 2.1 at.% and 3.9 at.% for 0.02 mM and 0.05 mM CuCl
2, respectively. The changes in the samples’ structure are also noticeable. For 0.02 mM CuCl
2, the morphology is uniform, with most structures forming large cones. As the concentration increases, these large cones develop rounded ends (
Figure 2). The Cl
− ions coming from NiCl
2 are sufficient for synthesizing conical structures, but in many works, NH
4Cl is added as a crystal modifier.
The electrolyte with a concentration of CuCl2 equal to 0.05 mM was chosen for further analysis of the crystal modifier’s influence on Ni-Cu alloys, as it allows the synthesis of a conical structure with sufficient Cu content.
The crystal modifier NH
4Cl in amounts of 20 g/L and 40 g/L was added to the electrolyte containing NiCl
2 and CuCl
2 (0.05 mM). The addition of the crystal modifier is usually listed in the literature in g/L; therefore, the same unit is kept in this work. The influence of its content on alloys’ chemical composition and morphology was analyzed using EDS (
Table 2) and SEM (
Figure 3) techniques.
The addition of the crystal modifier reduces the Cu content in the coatings. As more modifier is added, the loss of copper becomes more significant compared to samples deposited without NH
4Cl. However, the morphology of the samples remains largely unaffected by the presence of this chemical component. When 20 g/L of ammonium chloride is introduced, cone growth is inhibited, resulting in smaller structures. Further addition of NH
4Cl does not produce additional changes in the morphology. D. Goranova and others [
44] stated that, due to the different deposition modes of Ni and Cu, nickel tends to deposit in the concave regions, while copper preferentially deposits on the convex parts.
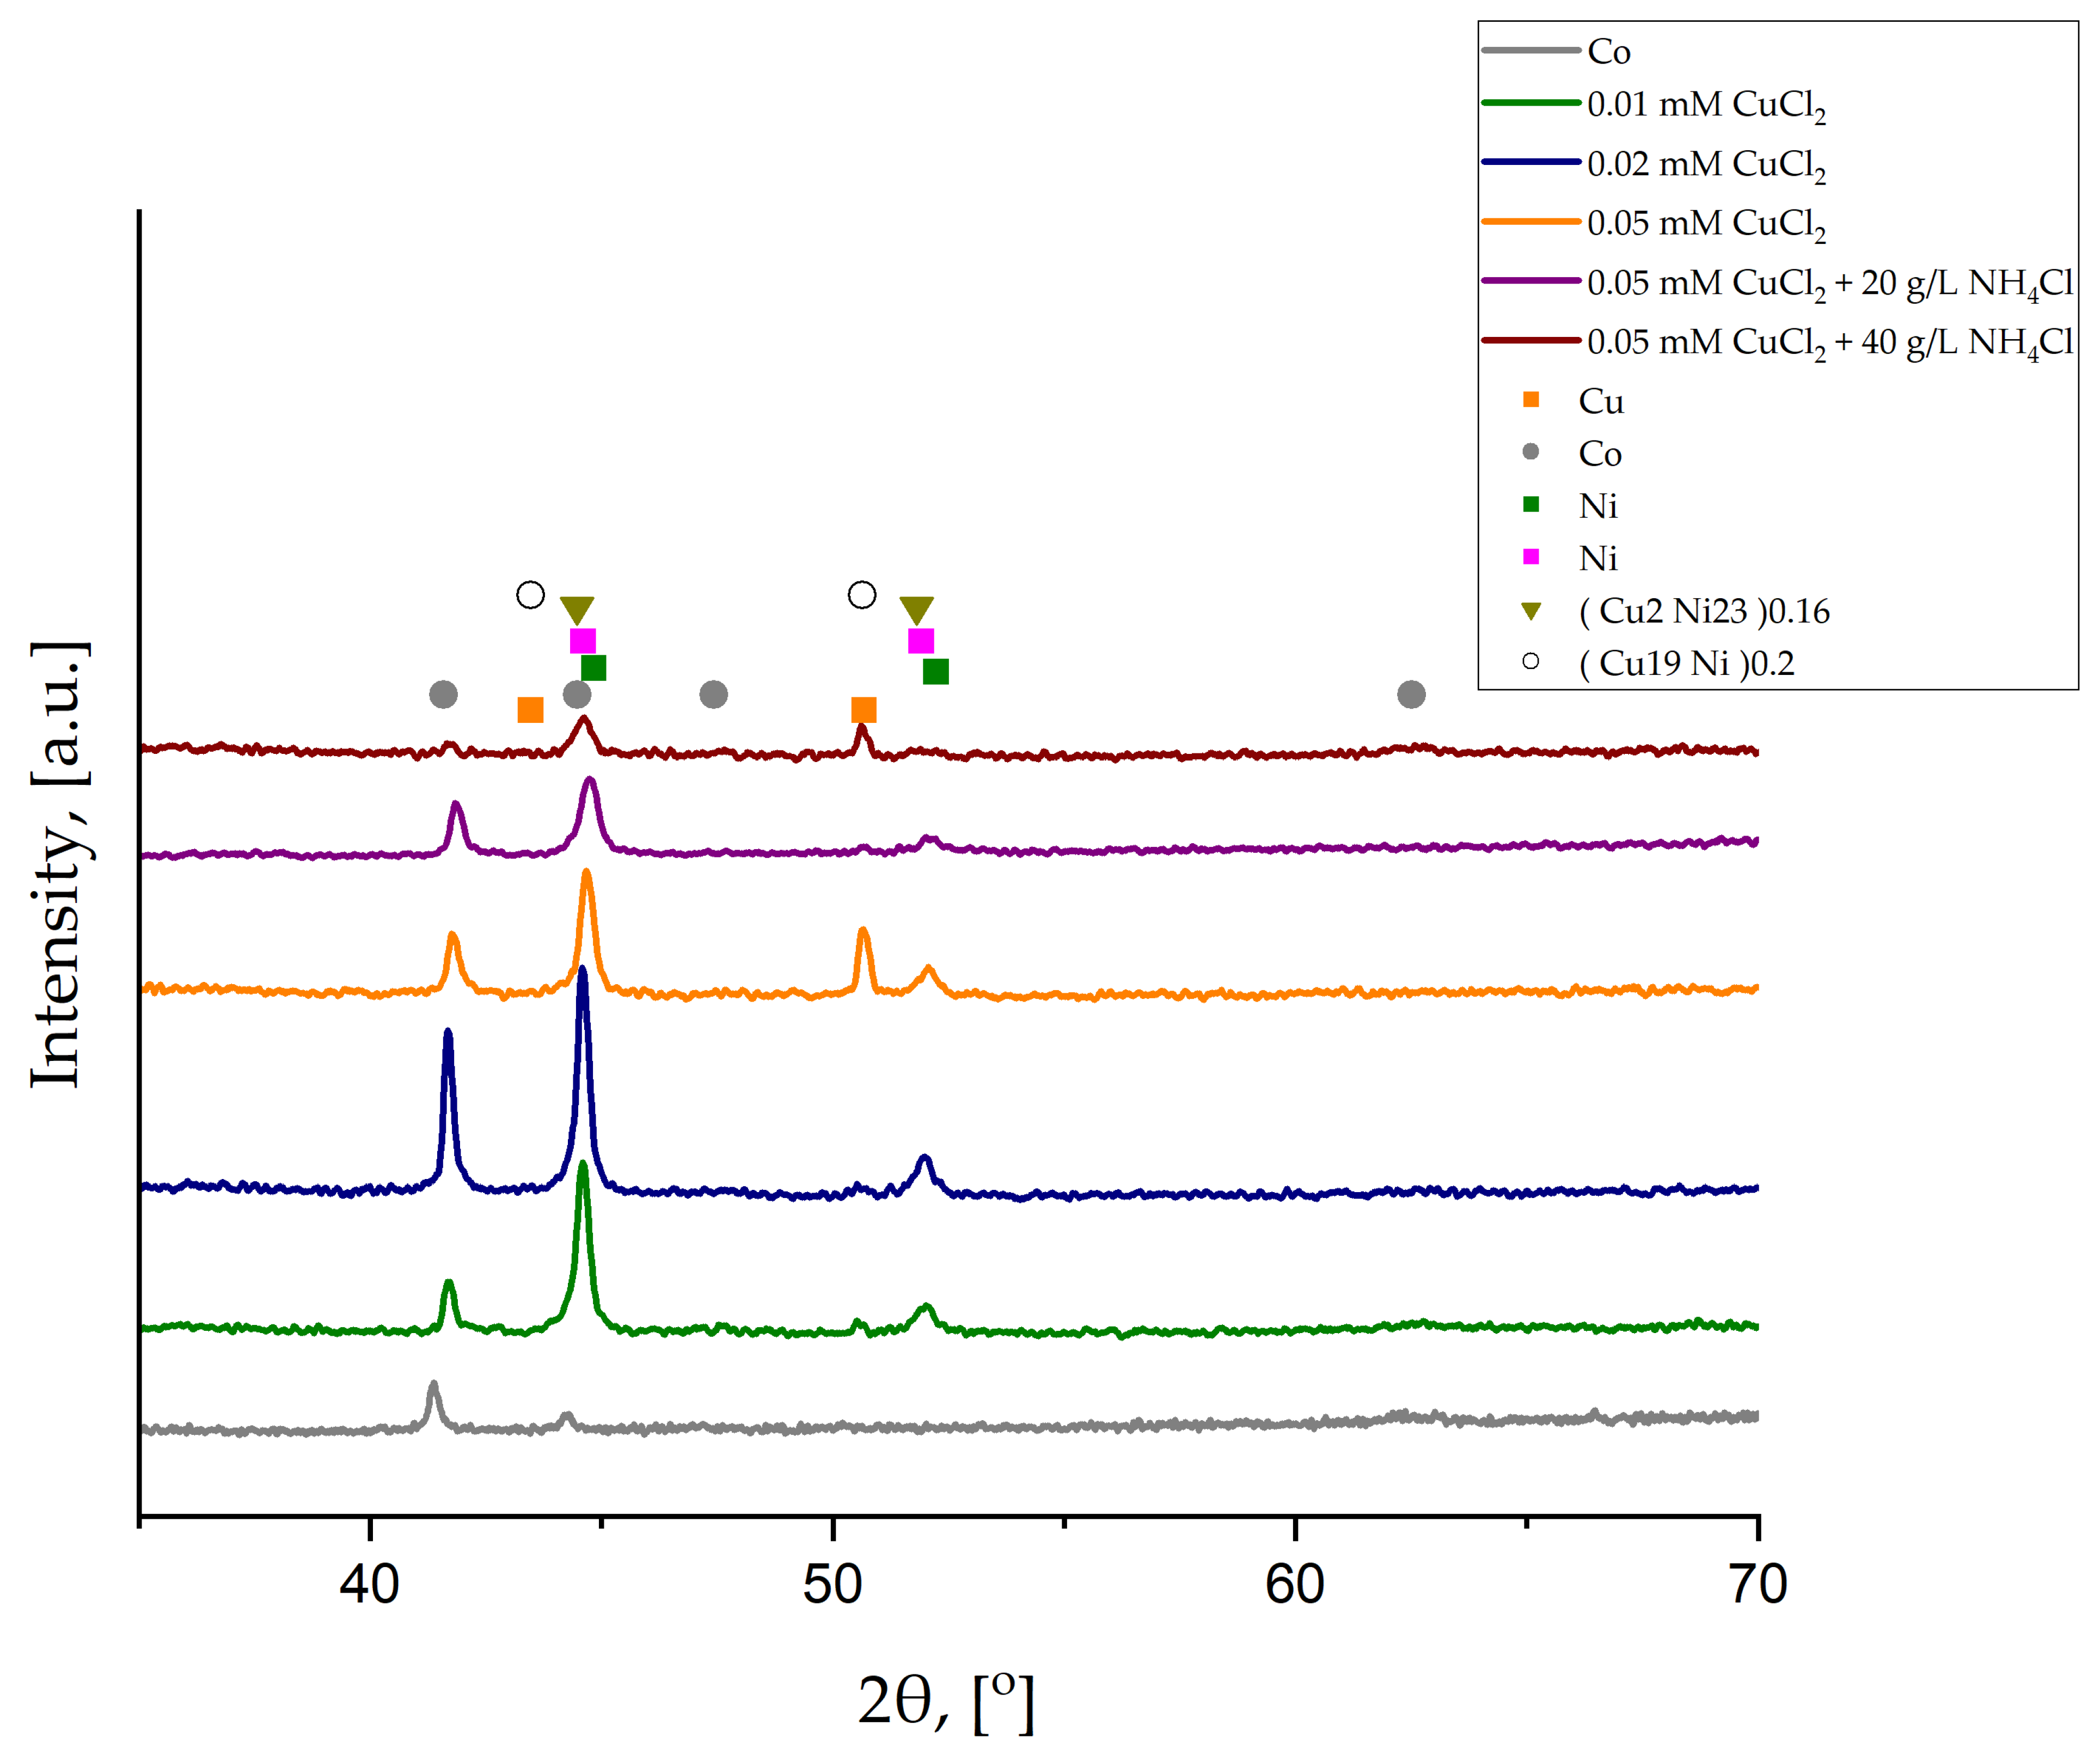
To better characterize the influence of CuCl
2 concentration and crystal modifier content on the deposition of Ni-Cu alloys, XRD analyses were performed. Results are shown in
Figure 4.
The XRD diffraction pattern of the Cu/Co substrate shows that the thickness of the Co deposited layer was sufficient to block the Cu signal coming from the foil. All the deposited Ni-Cu coatings were too thin to cover the signal from the thick Co layer. However, peaks from Ni and Cu are present. Additionally, two different Cu-Ni phases are also detected. No transformation in the crystal structure is observed with increasing copper chloride concentration or crystal modifier content. However, the intensity of peaks at low 2θ angles (approximately 45° to 53°), attributed primarily to CuNi phases, decreases following the addition of NH
4Cl, due to the reduced Cu content as shown in
Table 2. All the structures, except for the Co layer, are cubic. The characteristics of each phase based on Joint Committee on Powder Diffraction Standards (JCPDS) cards are listed in
Table 3.
The observed d-spacing of peaks that contributed to CuNi phases (approximately 45° to 53) are listed in
Table 4 and compared with the data from JCPDS cards for (Cu2Ni23)0.16 and (Cu19Ni)0.2.
For most of the samples, phases Ni (
Table 3) and (Cu2Ni23)0.16 are present, whereas for the sample deposited from the electrolyte containing 40 g/L NH
4Cl, there is a mix of Ni and (Cu19Ni)0.2. Generally, the observed d-spacing is lower than the standard one, except for the sample deposited from the electrolyte with 40 g/L NH
4Cl. For 20 g/L NH
4Cl, the difference (0.0332) between the observed d-spacing and the standard value for (Cu2Ni23)0.16 (
Table 4) is the largest. The observed d-spacing value can decrease due to the presence of compressive stress that can be, i.a., substrate-induced stress coming from the Co layer deposited on the Cu substrate (
Figure 1a) or, for 20 g/L NH
4Cl, the noticeable drop in Cu content, as listed in
Table 2. When Cu-Ni alloys are brush-plated, Ni and Cu 3.8Ni phases are present [
45]. At the same time, the co-deposition from the sulphate solution allows the fabrication of an alloy with the Cu50Ni50 phase [
46].
Based on the obtained XRD diffraction patterns, the grain size was calculated using the Scherrer equation considering the peak at ~44.6
o. This peak can be connected to Ni or CuNi phases. Additionally, the average roughness analysis was conducted using the AFM method. The scan area was 20 µm × 20 µm. An example of a 3D image is shown in
Figure 5. Changes in the samples’ wettability as an important material’s property in the case of its application as a catalyst were also investigated. All these measured values are summarized in
Figure 6.
With the increase in the copper chloride content, the grain size decreases. The addition of a crystal modifier causes a further decrease, irrespective of the amount added. A. Ijaz and others [
47] deposited Ni coatings from a Watts bath in the presence of poly-(2-ethyl-2-oxazoline) (PEOX) for the grain refining effect. There was a clear decrease in nanometer grain sizes from ~1000 nm to ~12 nm. This phenomenon is associated with the control over the adatom mobility due to PEOX adsorption. In this work, however, the influence is relatively slight, as Cl
− ions from NiCl
2, acting as a crystal growth modifier, had already affected the grain size. Instead, the average roughness S
a increased with the addition of CuCl
2, which was confirmed by observations based on the SEM observations (
Figure 2). With the addition of copper chloride, larger cones are observed. Subsequently, the addition of 20 g/L NH
4Cl leads to a decrease in surface roughness, as the cones become smaller (
Figure 2b,c). When the concentration of the capping agent is increased to 40 g/L, the roughness (S
a) rises again to a value similar to that of the sample deposited without the capping agent. Except for the sample deposited from the electrolyte containing 0.01 mM CuCl
2, which remains hydrophilic, all other samples exhibit wettability near the boundary between hydrophilic and hydrophobic behavior. In the case of pure Ni cones, the addition of 20 g/L of the crystal modifier increases the roughness S
a from ~67 to ~96 nm [
48]. Its presence has an even greater effect on wettability, with the contact angle changing from about 81° to roughly 140°. Although Cl
− ions are already present in the electrolyte from NiCl
2, the additional Cl
− from NH
4Cl does not deteriorate the quality of the conical structures. Therefore, the growth mechanism presented in this work should vary from that of pure Ni cones. As mentioned, Cu could be deposited in the upper part of the cones and therefore influences the wettability of the samples.
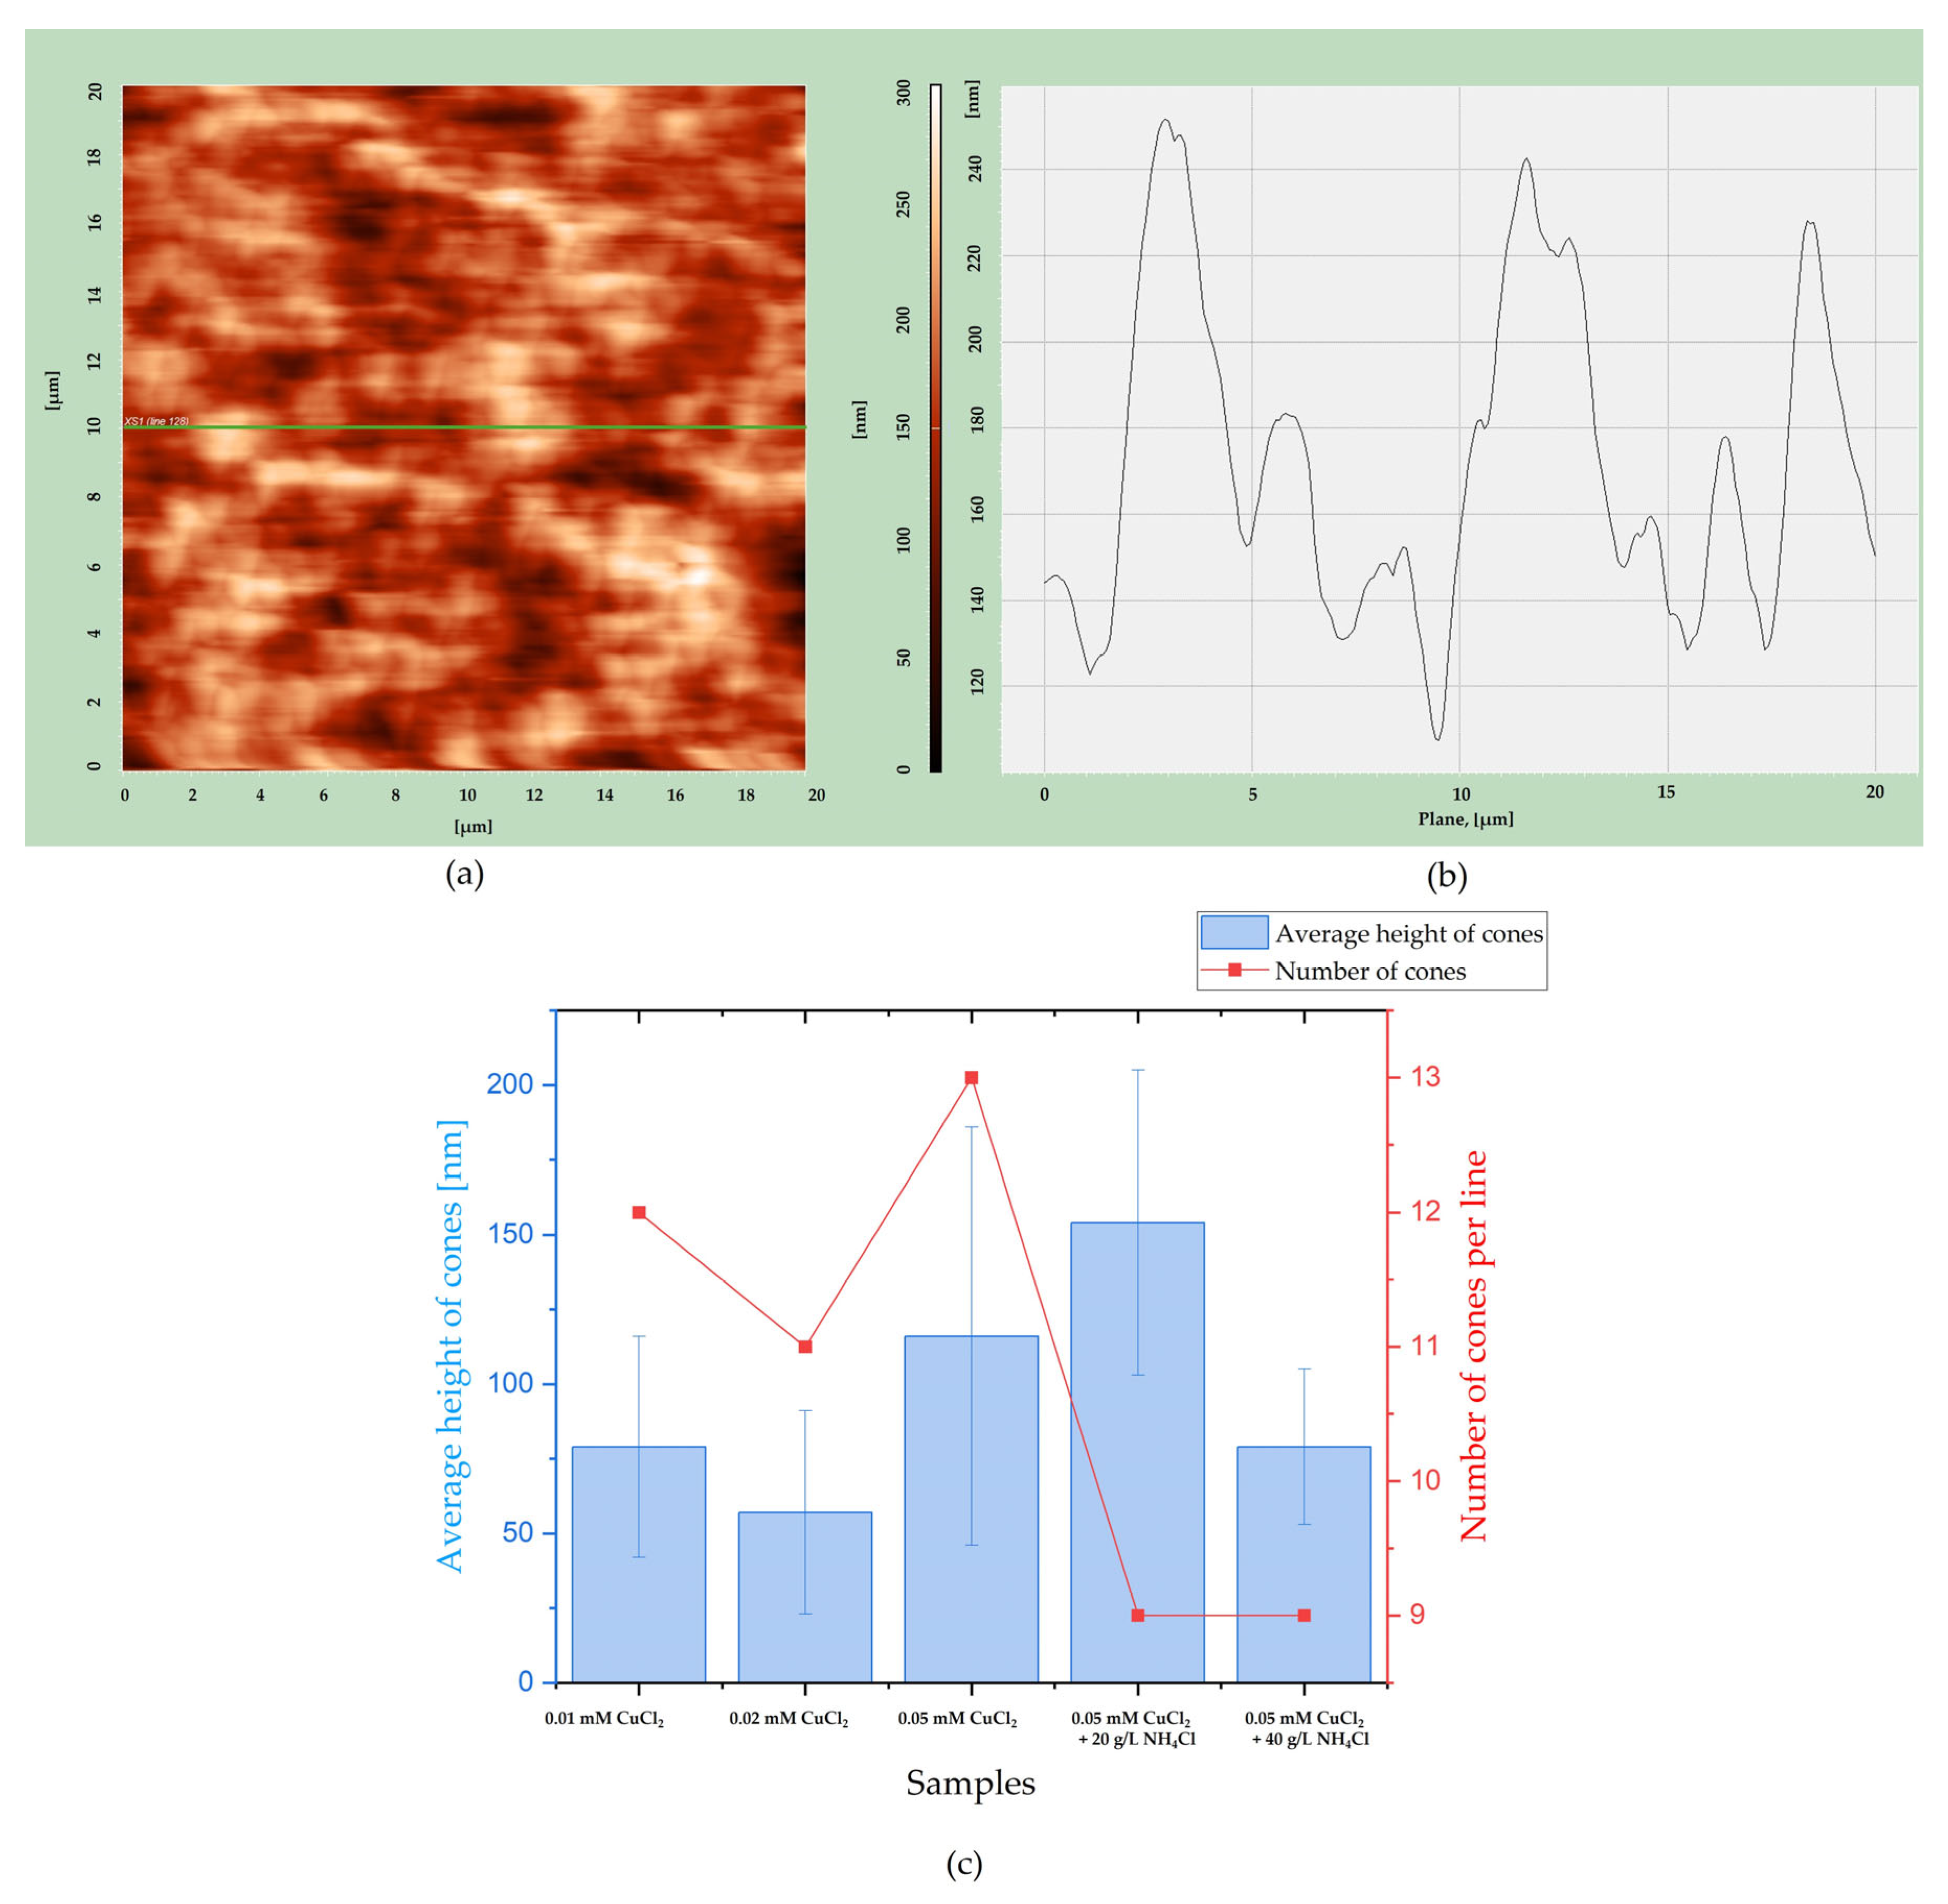
Additionally, the average height of cones and the number were estimated using a cross-sectional line from a 2D AFM image, as shown in
Figure 7. Using Nova AFM software (Nova 1.1.1 Revision 18376), line number 128 was chosen (
Figure 7a), and the cross-section was obtained, as shown in
Figure 7b. It allows the determination of average cone height and the number of cones per line number 128 for each sample and assessment of the geometric surface area of the alloys. The results are shown in
Figure 7c.
There is no clear dependency between the average height of cones and the composition of electrolytes. The cones are of similar height. However, conical structures seem to be the most uniform for samples deposited from the solution containing 0.05 mM CuSO
4 and 40 g/L NH
4Cl, as the standard deviation is the smallest. The number of cones decreases when the crystal modifier is added, regardless of its content. The changes in cone numbers are slight. This result is consistent with the SEM photos shown in
Figure 2 and
Figure 3.
In the literature review [
42], Cu cones were deposited from sulphate solutions using either pulsed electrodeposition or potentiostatic deposition, with NaCl and Janus Green B (JGB) added as crystal modifiers, respectively. The addition of JGB allows the synthesis of superhydrophobic structures [
49]. In both cases, the cones show a strong (1 1 1) preferred orientation. However, the mechanism of conical growth remains not fully understood. Therefore, Y. Deng and others explain that this is based on screw dislocation theory [
49], while M. Dong et al. proposed a twinning growth mechanism [
50].
In this work, the conical growth of Ni-Cu alloys is interrupted when NH
4Cl is added to the electrolyte. It is connected with the complexes created between Cu
2+ and NH
3 in the solution. Calculations supporting this explanation were performed using the IUPAC Stability Constants Database based on data published [
51,
52].
Figure 8 shows the distribution of copper (II) species in aqueous solutions as a function of the concentration of NH
4Cl (c
NH3). The full dissociation of NH
4Cl was assumed.
As can be seen, nearly all Cu
2+ ions form complexes with ammonia, which likely explains the decreased Cu content in the coating after the addition of NH
4Cl. The ammonium chloride shows a weak acid solution nature as it is formed from the neutralization of a strong acid and a weak base. Its dissociation causes a slight lowering of the solution’s pH. Additionally, to deposit Ni-Cu alloys from alkaline citric electrolyte, a 25% NH
4OH is often used in the adjustment of the electrolyte pH to 9 [
44,
53]. However, when the process is performed in sulphate solutions, the morphology is developed, but the conical structures are not present. This highlights the necessity of chlorine ions to synthesize cones.
3.2. Electrocatalytic Properties of the Coatings
The detailed characterization of coatings’ electrocatalytic properties was carried out in 1 M NaOH by Linear Sweep Voltammetry. Measurements were performed after the application of 85% iR compensation. This compensation allows for more accurate evaluation by correcting for the voltage loss caused by the electrolyte solution. Because SCE was used as the reference electrode, the potential recorded against the saturated calomel electrode was converted to the reversible hydrogen electrode (RHE). The obtained curves are shown in
Figure 9.
All coatings show similar properties; however, the catalytic activity is slightly enhanced for the sample deposited by the electrolyte containing 0.05 mM CuCl
2 and 20 g/L NH
4Cl. To make sure that the electrode was stable, the LSV measurements were repeated three times consecutively. An example of the obtained curves for the alloy deposited from the solution containing 0.05 mM CuCl
2 and 40 g/L NH
4Cl is shown in
Figure S1. A slight decrease in the catalytic properties can be observed, but the electrode stability is satisfactory.
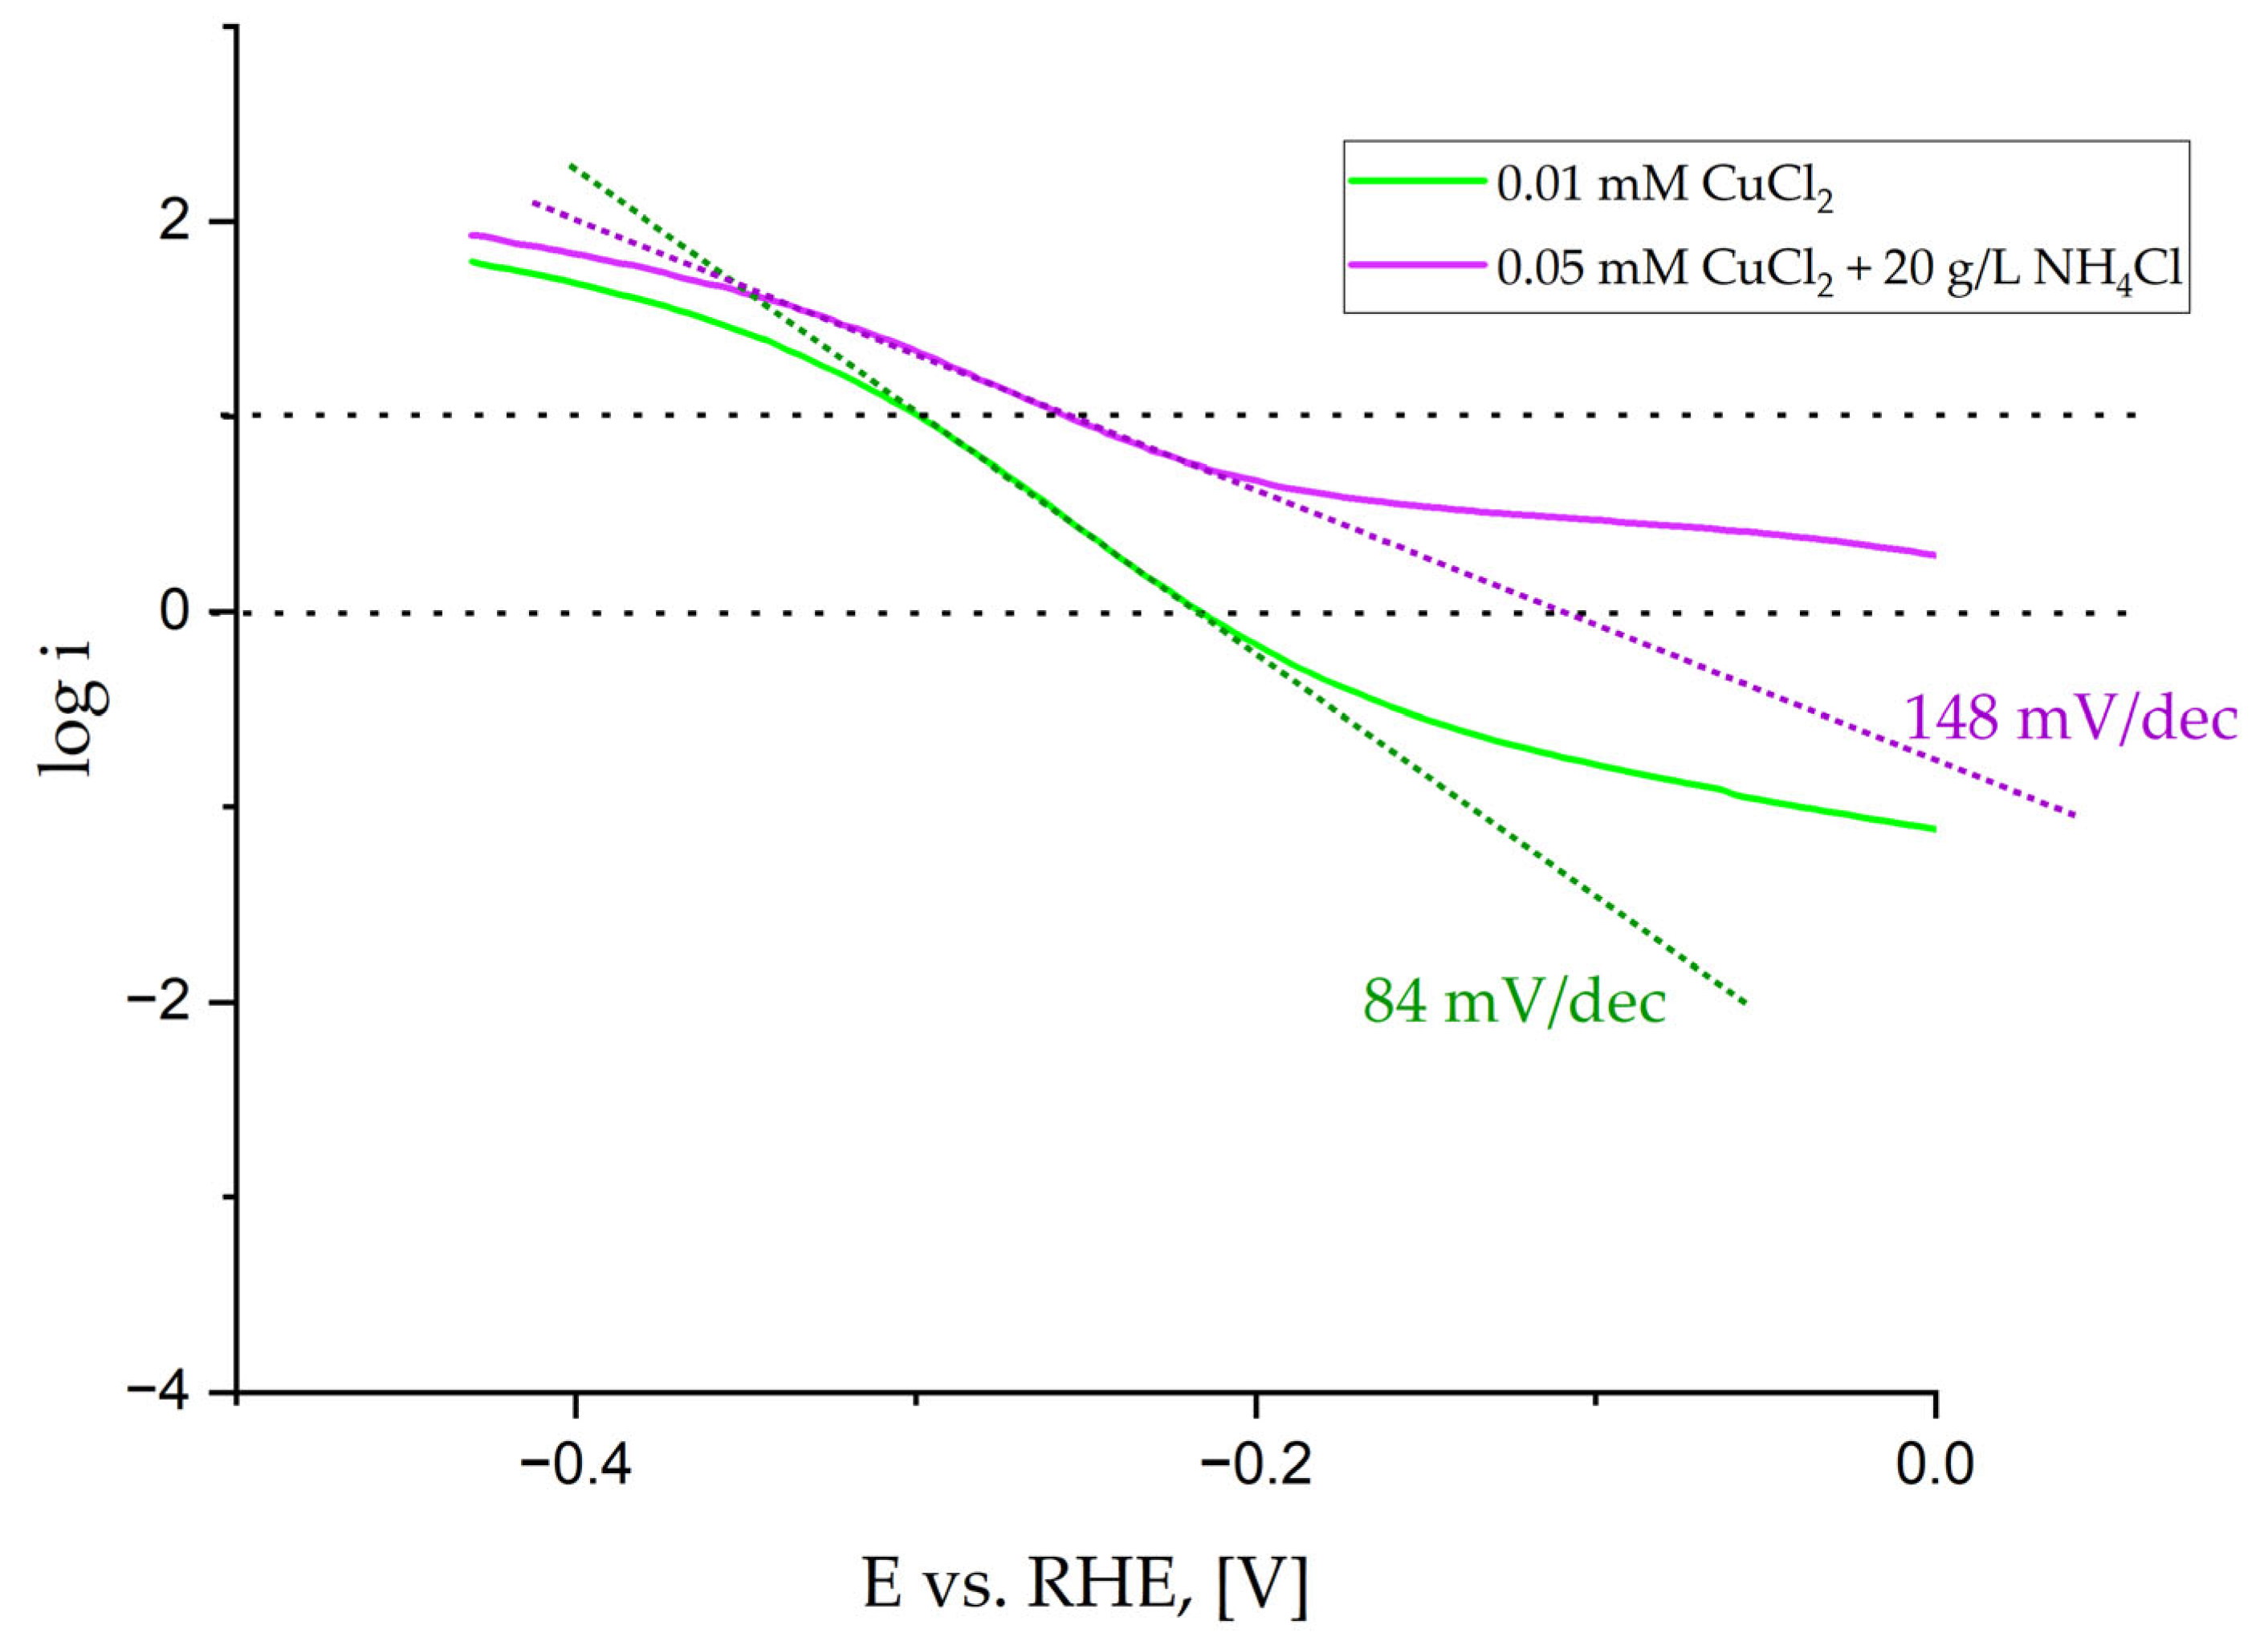
Therefore, to better characterize coatings, typical parameters such as the values of the current density at fixed overpotentials of −200 and −400 mV vs. RHE, the potential required to reach i = 10 mA/cm
2, Tafel slopes, and E
ONSET potential were determined based on curves shown in
Figure 6 and listed in
Table 5. The error is about ±1%. To determine the potential E
ONSET, at which the hydrogen evolution reaction begins, two tangents were plotted on the curve of the potential dependence on the current density. The Tafel slope was determined in the range of low current density from 1 to 10 mA/cm
2. An example of the curves is shown in
Figure 10.
We performed a detailed analysis that shows similar catalytic properties of all deposited coatings. The difference appears in the values of the Tafel slope, where samples deposited by the electrolyte containing 20 g/L NH
4Cl show a different mechanism. For the Tafel slope higher than 120 mV/dec [
54], the reaction follows the Volmer (RDS)–Tafel pathway when the diffusion rate is much faster than the hydrogen oxidation reaction (HOR) rate. For Tafel slopes in the range of 60 and 120 mV/dec, a more prominent HOR current and a lower Tafel slope near the equilibrium potential appear due to slower H
2 mass transport and an increase in the concentration of the locally trapped H
2 in the catalyst layer.
The hydrogen evolution started the earliest on the sample deposited by the solution containing 20 g/L NH
4Cl, as seen in
Figure 10. However, the determined values are similar for all samples. This could be expected as the wettability of the coatings is also similar, even though the sample deposited by the electrolyte containing 0.01 mM CuCl
2 is the only one that is hydrophilic. Moreover, the height of the cones is similar, and their number does not change much. Due to the slight differences between Cu content from 1.6 to 3.9 at.% (
Table 2), the catalytic properties vary just slightly. Therefore, the described fabrication method of Ni alloy cones using the most common crystal modifier NH
4Cl is limited to the metals, which does not create complexes with NH
4Cl at pH = 4, like Co [
55]. Cobalt creates complexes with ammonia, but at higher pH (>9) [
56]. For that reason, the proposed method of Ni-Cu conical structures synthesis from the electrolyte containing the addition of NH
4Cl seems to be adverse. The present crystal modifier creates complexes with Cu
2+ ions. The cones’ fabrication performed from the electrolyte containing only nickel and copper chloride salts is sufficient. Compared with the Ni-Cu cones obtained by the annealing of the Ni cones covered with a thin Cu layer [
27], the Tafel slopes obtained in this work are significantly lower, besides the sample synthesized from the electrolyte containing 0.05 mM CuCl
2 and 20 g/L NH
4Cl, which is comparable with the samples before annealing and follows the Volmer (RDS)–Tafel pathway. This means that the co-deposition of Ni-Cu from the electrolyte, rather than later deposition of Cu on synthesized Ni cones, leads to the fabrication of a material change in the mechanism of hydrogen evolution. Hydrogen evolution started slightly earlier, when Cu was deposited up to 10 sec on previously prepared conical structures.
The obtained data were compared with the already published results on the Ni and Ni alloy Tafel slopes listed in
Table 6. The values chosen are the lowest Tafel values declared in each article.
Compared with the values of the Tafel slope of other coatings presented in the literature, the Ni-Cu cones synthesized in this work show satisfactory properties, placing them in the middle of the range of values. However, considering the simplicity of their synthesis, the results are promising.


