Article

Fatigue Life Anisotropy of API 5L X42 Pipeline Steel in Axial Force-Controlled Tests

by
Manuel A. Beltrán-Zúñiga
1,
Jorge L. González-Velázquez
1,
Diego I. Rivas-López
1,*,
Héctor J. Dorantes-Rosales
1,
Carlos Ferreira-Palma
2,
Felipe Hernández-Santiago
3 and
Fernando Larios-Flores
1
1
DIMM, ESIQIE, Instituto Politécnico Nacional, México City 07738, Mexico
2
Facultad de Ciencias Químicas Región Veracruz, Universidad Veracruzana, Boca del Río 94294, Mexico
3
ESIME-UA, Instituto Politécnico Nacional, México City 02550, Mexico
*
Author to whom correspondence should be addressed.
Materials 2025, 18(11), 2484; https://doi.org/10.3390/ma18112484
Submission received: 21 March 2025 / Revised: 1 May 2025 / Accepted: 6 May 2025 / Published: 26 May 2025

Abstract

:
Fatigue endurance anisotropic behavior was evaluated for an API 5L X42 pipeline steel through axial force-controlled fatigue tests amongst Longitudinal, Diagonal, and Circumferential directions. This study shows that fatigue life anisotropy is mainly controlled by pearlite banding degree (Ai) and ferritic grain orientation (Ω12). Also, it is foreseen that the observed behavior can be related to the dislocation arrays generated by the cyclic loading in relation to microstructure orientation, and the interactions of the fatigue crack tip with the microstructure during the crack propagation stage.

1. Introduction

Marine pipelines and offshore raisers are exposed to fatigue due to cyclic loading induced by ocean currents, slug flow, and other varying loads. One important concern is that these loads are also variable in direction, which induces stress components in different directions in the pipe. Pipeline design codes assume that the mechanical behavior of pipeline steel is isotropic [1,2,3,4,5,6], but experimental evidence indicates that it is not [7,8,9]; therefore, the anisotropic behavior must be considered in the design and structural integrity assessment.
Anisotropy of the fundamental tensile properties of low-carbon steel plates and steel pipelines has been well documented [10,11]. Since the longitudinal direction typically corresponds to the rolling direction, there is a general consensus that the anisotropic behavior in pipeline steels is related to the directionality of the microstructural features introduced by the hot rolling processes stage during the fabrication of the pipe, such as grain elongation, segregation of nonmetallic inclusions, pearlite banding, and crystallographic texture [12,13,14,15,16,17]. Figure 1 shows the tensile behavior reported in the literature for low-carbon steel plates and pipelines, showing the yield strength and elongation as a function of the orientation [9,12,18].
Furthermore, the anisotropic behavior of steel plates and pipes has also been observed in the fracture properties, such as Charpy impact and plane strain fracture toughness, but due to the complex relation between the fracture plane orientation and the orientation of the microstructural features, the results are widespread [18,19,20,21,22,23,24,25,26,27,28,29].
Heiser and Hertzberg [30] evaluated the fatigue crack growth rates of hot rolled steel plates with banded ferrite/pearlite microstructures in L-T, T-S, and S-L orientations, finding that the fatigue crack growth rate is sensitive to the orientation of the microconstituents with respect to the fracture plane. When brittle particles are oriented normally to the applied stress axis, local fracture events would be expected to occur more readily than when they are parallel to the loading direction. These local fractures should lead to faster fatigue crack propagation as well as lower toughness in the short transverse specimens; observations of both higher growth rate and lower toughness were seen in the short transverse specimens. Ohji et al. [31] evaluated the fatigue crack growth behavior of anisotropic rolled steel plate (SB56M) with annealing and spheroidizing heat treatments. They observed that the anisotropy of fatigue crack growth is caused by the banded pearlite microstructure, while nonmetallic inclusions had only a secondary effect. The annealed material showed anisotropy in macroscopic crack growth rate, where the fastest crack growth was observed for the 0°-specimen, in which the crack ran parallel to the laminated structure, and the 60°-specimen showed the slowest crack growth. The anisotropy in crack growth rate almost vanished after spheroidizing heat treatment. Slot et al. [32] studied the influence of the microstructural orientation of low carbon steels on the tensile properties, Charpy impact energy, and fatigue crack growth rate in longitudinal, transversal, and short directions, finding that the microstructure orientation has a statistically significant influence on these properties. The anisotropy in material structure had a small or negligible influence on the yield stress and tensile strength; however, the T-L and T-S anisotropy ratios were approximately 0.4 for the Charpy test, and approximately 1.19 and 0.43 for the crack growth, respectively. Similar results have been observed in other metal alloy systems, such as FSW Al–Li [33], where the tensile strength was higher in the longitudinal direction, as compared to the transverse direction.
While there is a large number of published studies on the anisotropic behavior of steel [34], there is little published research that examines the high-cycle fatigue anisotropy of the API 5L pipeline steel. Because of this, the aim of this study is to obtain and analyze experimental S–N fatigue curves of API 5L X42 pipeline steel in different directions, in order to determine its level of anisotropy, and discuss its relationship with the orientation of the pearlite bands. This knowledge will be useful to perform more accurate mechanical integrity assessments of pipelines operating under directional cyclic loading conditions. The S–N curves were obtained by force-controlled uniaxial fatigue tests with smooth bar specimens in three orientations: longitudinal (L-0°), circumferential (C-90°), and diagonal (D-45°) of an API 5L pipe manufactured by the UOE process, where longitudinal orientation corresponds to the rolling direction.

2. Materials and Methods

2.1. Material

The material used in the experimentation was extracted from a seam-welded pipe of 24 in. nominal diameter and 0.500 in. nominal thickness of API 5L X42 PSL1 specification manufactured by the UOE process, with normalized heat treatment condition. This pipe was removed from service, with an operational history of 8 years. Table 1 reports the operation conditions of pressure, service, and temperature. The chemical composition of the used material, determined by atomic absorption spectrophotometry, is shown in Table 2.
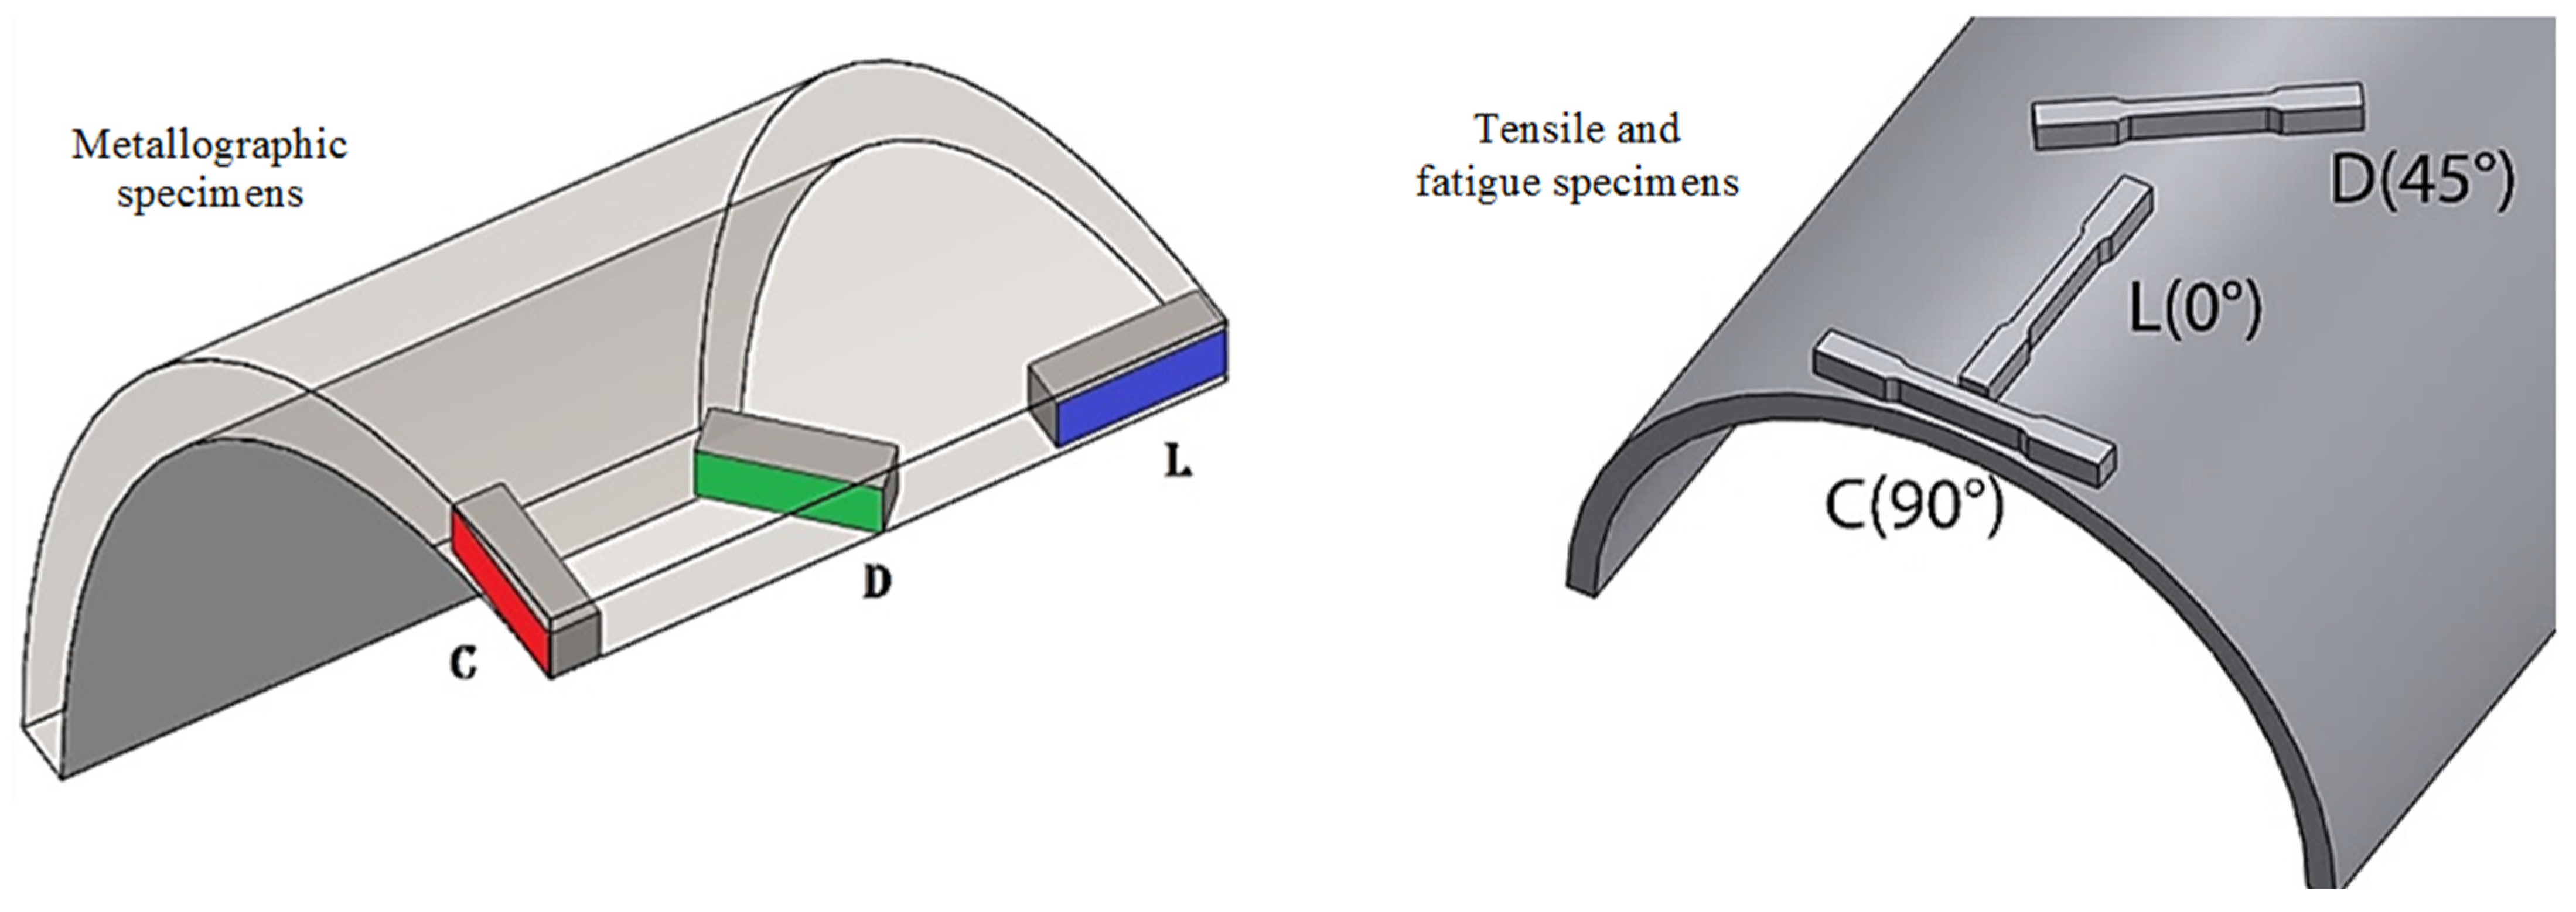
Used specimens were extracted from the base material, far from welding beads. Metallographic and fatigue properties were assessed amongst three directions of the pipe: longitudinal (L-0°), parallel to the rolling direction (RD); diagonal (D-45°), inclined 45° with respect to the RD; and circumferential direction (C-90°), perpendicular to the RD. The three orientations are schematically shown in Figure 2.

2.2. Microstructural Examination

Microstructural examination was realized for both optical microscopy (Olympus GX-40, Olympus, Tokyo, Japan) and Scanning Electron Microscopy (JEOL JSM6300, JEOL, Tokyo, Japan). Metallographic specimens were etched with Nital 2%. The metallographic preparation was carried out as established in the ASTM E3-11 (2017) [35] and ASTM E407-07 (2015) [36] standards. Specimens oriented in the L-0°, D-45°, and C-90° directions are shown in Figure 1. The pearlite banding degree (Ai) and ferritic grain orientation parameter (Ω12) were determined according to ASTM E1268-01 (2016) [37] standard. The average grain size was determined according to ASTM E112-13 (2021) [38] standard, and the nonmetallic inclusion content was determined as per ASTM E45-18a [39] standard.

2.3. Mechanical Tests

Uniaxial tensile tests were carried out according to the ASTM E-8 [40] standard. The test specimens had a gage section of 12.7 mm (½ in) diameter and 50.8 mm (2 in) length as illustrated in Figure 3. Three tests were conducted for each orientation. The tests were conducted at room temperature and humidity (25 °C, 52.8% humidity), at a strain rate of 0.02 min−1. The tests were performed in a universal electromechanical testing machine with a 100 kN load cell, an axial extensometer Epsilon model 3542-050M-50-ST, and a data acquisition system.
Hardness Rockwell B [HRBW] tests were performed according to ASTM E18 [41] Std. Tests were performed at ambient temperature, using a Wilson hardness tester (Buehler, Lake Bluff, IL, USA), model 3dttb, and a tungsten carbide ball indenter with a specified diameter of 1/16 in. The preliminary test force was 10 kgf, and the total test force of 100 kgf. Dust, dirt, or other foreign materials were removed from the sample surface by grinding and cleaning according to ASTM E3-11 (2017) [35] sample preparation procedure. At least 10 indentations were performed for each analyzed direction.

2.4. Force-Controlled Fatigue Tests

Force-controlled constant amplitude axial fatigue tests were performed according to the ASTM E466 Std. [42], with specimens oriented in the longitudinal (L-0°), diagonal (D-45°), and circumferential (C-90°) directions. The fatigue test specimens were smooth bars, whose geometry and dimensions are shown in Figure 4. The reduced section of the test specimen was ground and polished to achieve a smooth and shiny surface finish as specified in the ASTM E466 Std. To assure the correct surface finish, after polishing, each test specimen was examined under a stereomicroscope at 20×, looking for deep scratches, turning marks, cracks, pores, or corrosion pits.
The axial force-controlled fatigue tests were conducted in a servo-hydraulic test machine equipped with a 100 kN load cell, displacement measurements system (LVDT), and data acquisition system. The force ratio was R = −1, using a sinusoidal waveform load spectrum, at 15 Hz frequency. This experimental arrangement was focused on the life up to crack initiation; therefore, fatigue tests were conducted until a complete fracture occurred, and a visible crack was fully identified at 20× magnification or after 106 cycles were completed. Tests were conducted at room temperature and humidity conditions. The stress amplitude levels were established at 75%, 65%, 55%, and 45% of the average ultimate tensile strength determined in the tensile tests for each specimen orientation. To provide the desired accuracy of statistical inference each stress level was tested in triplicate, using 12 specimens for each evaluated direction and a total of 36 specimens for completing the three S–N curves.
The S–N fatigue data were analyzed by the linearized Stress–Life relationship provided in the ASTM E-739 Std. [43], which has the form:
l o g S = A + B l o g N
where N is the fatigue life in cycles, S is the maximum value of constant-amplitude cyclic stress, A is the strength coefficient and B is the fatigue strength exponent. The values of these last two parameters were calculated by the linear regression method from the experimental S–N curves plotted in logarithmic scale.

3. Results and Discussion

3.1. Metallographic Examination

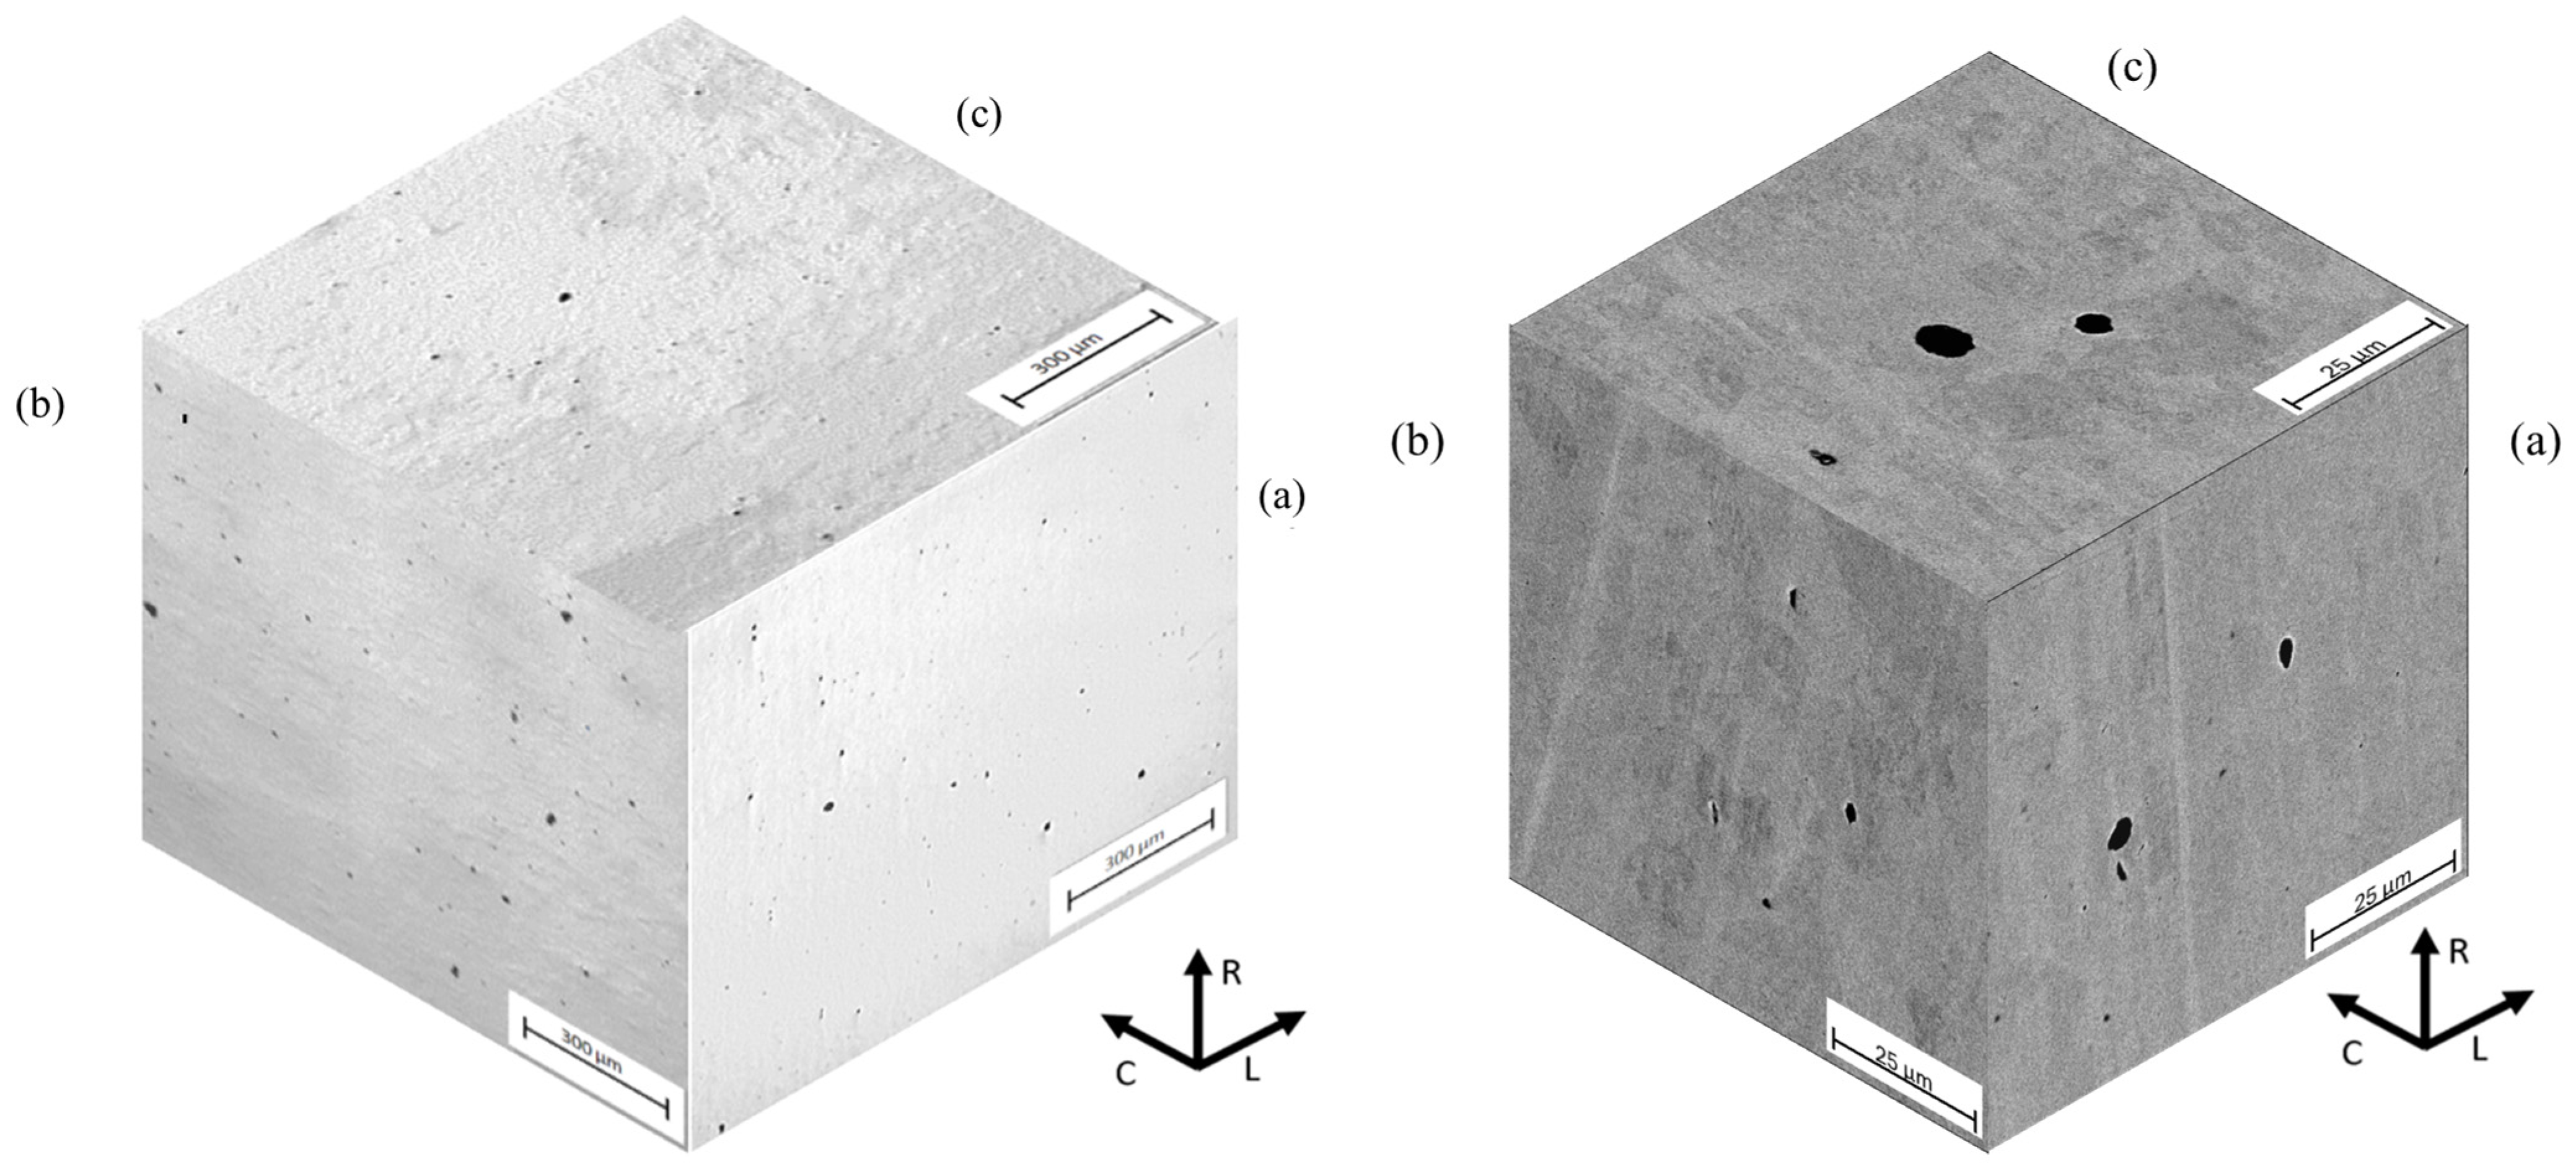
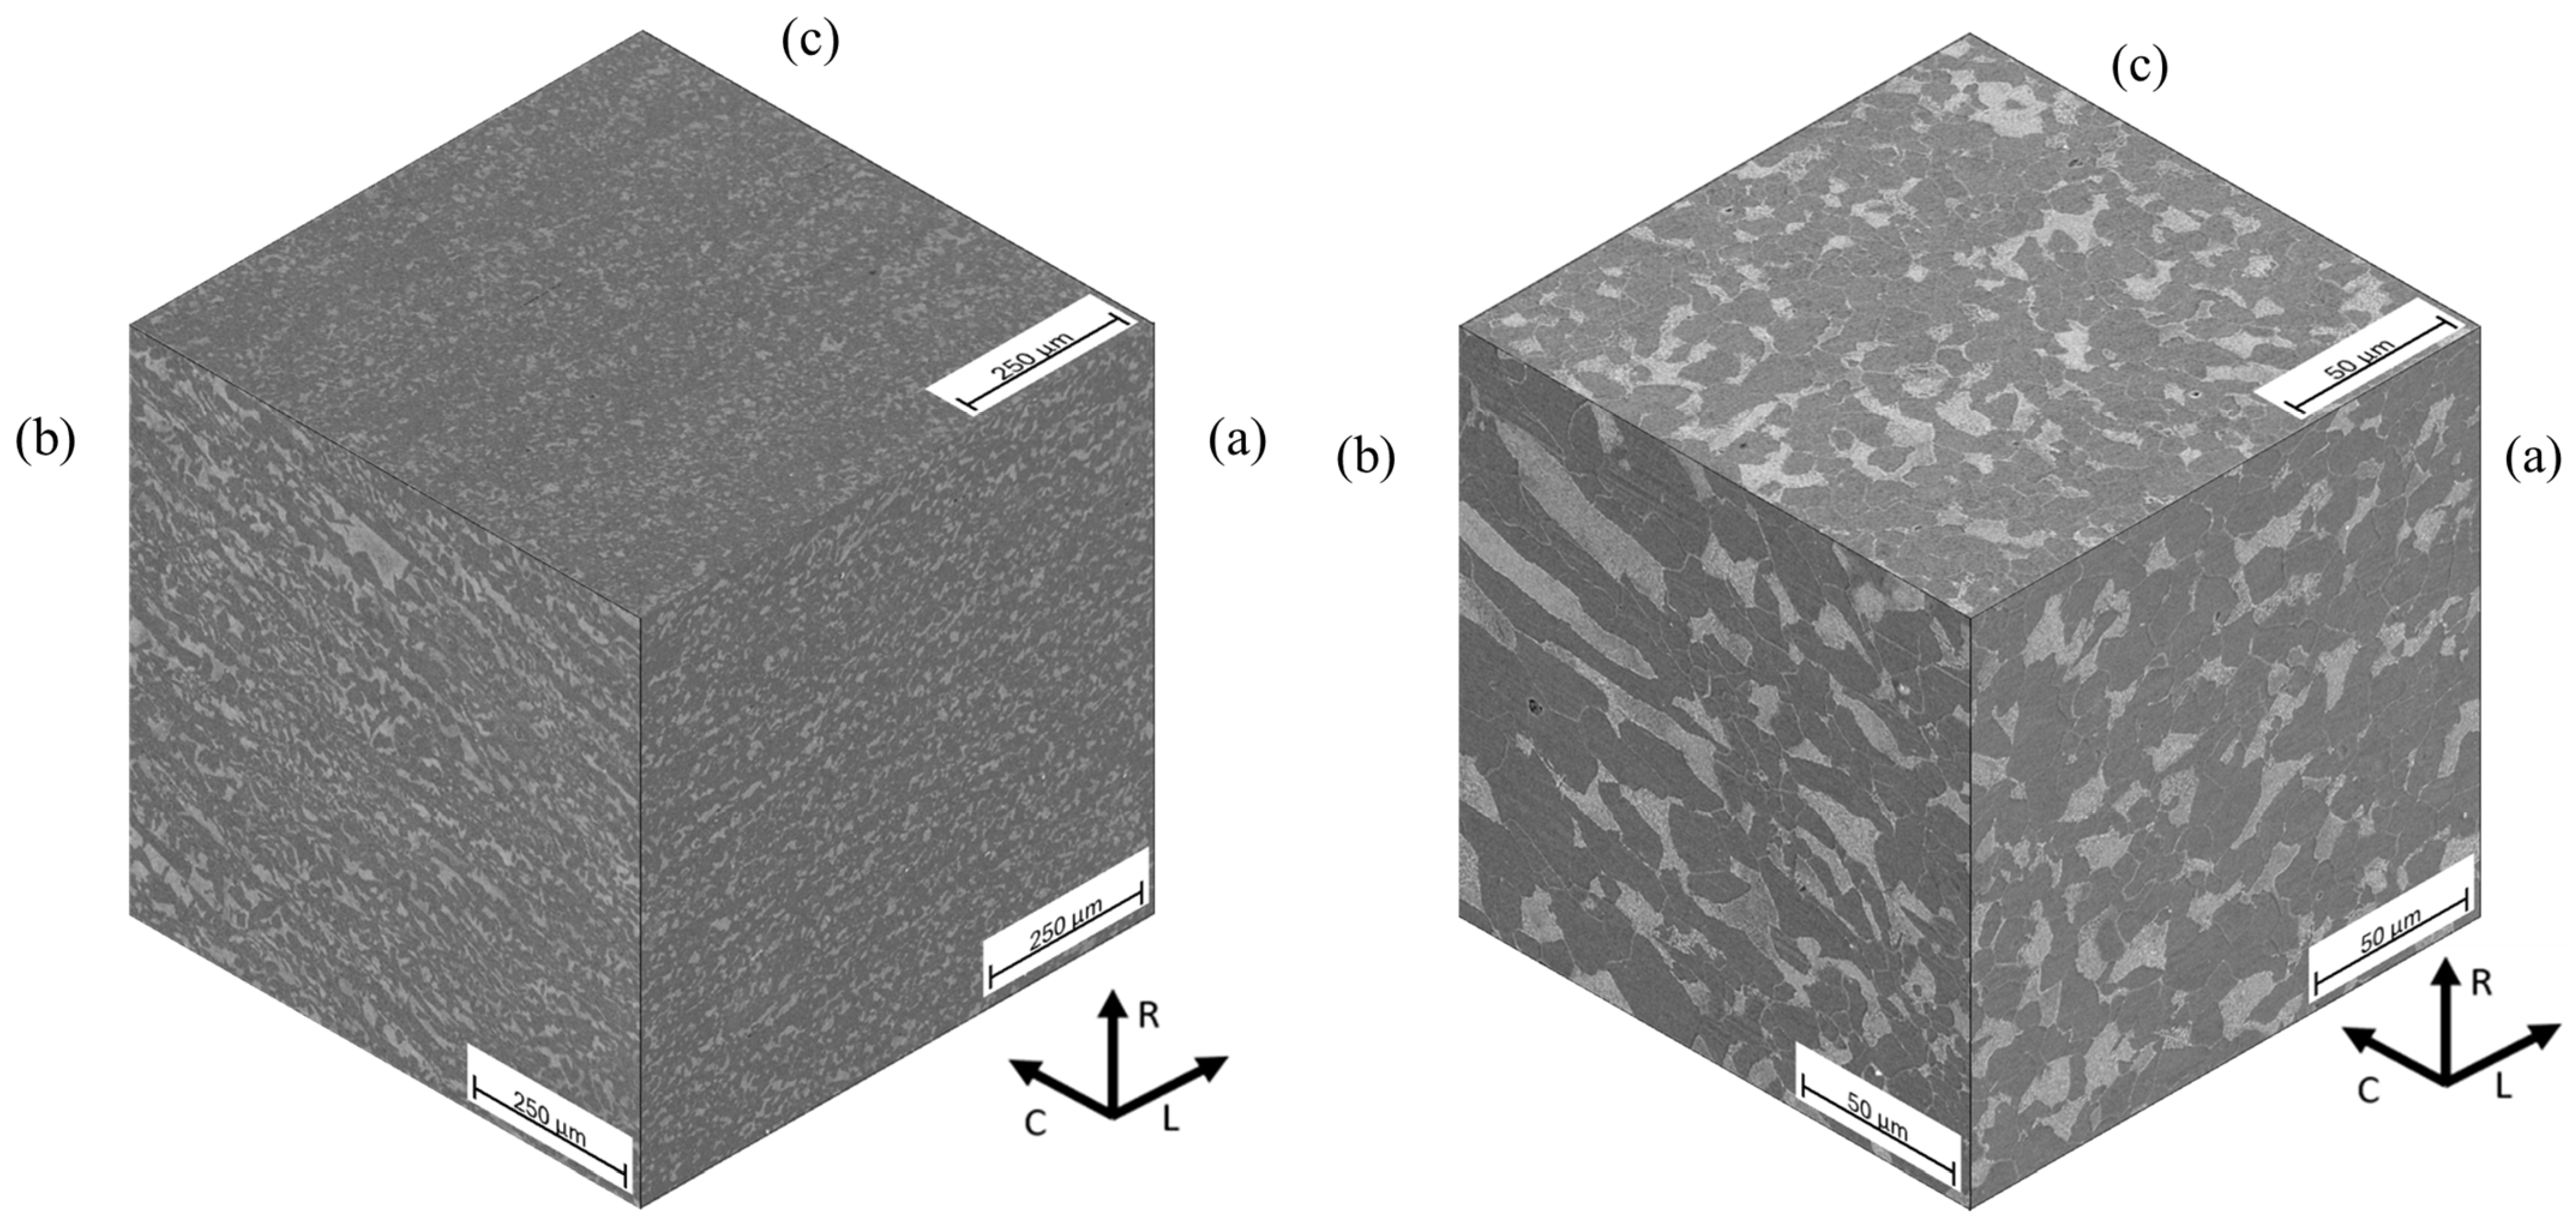
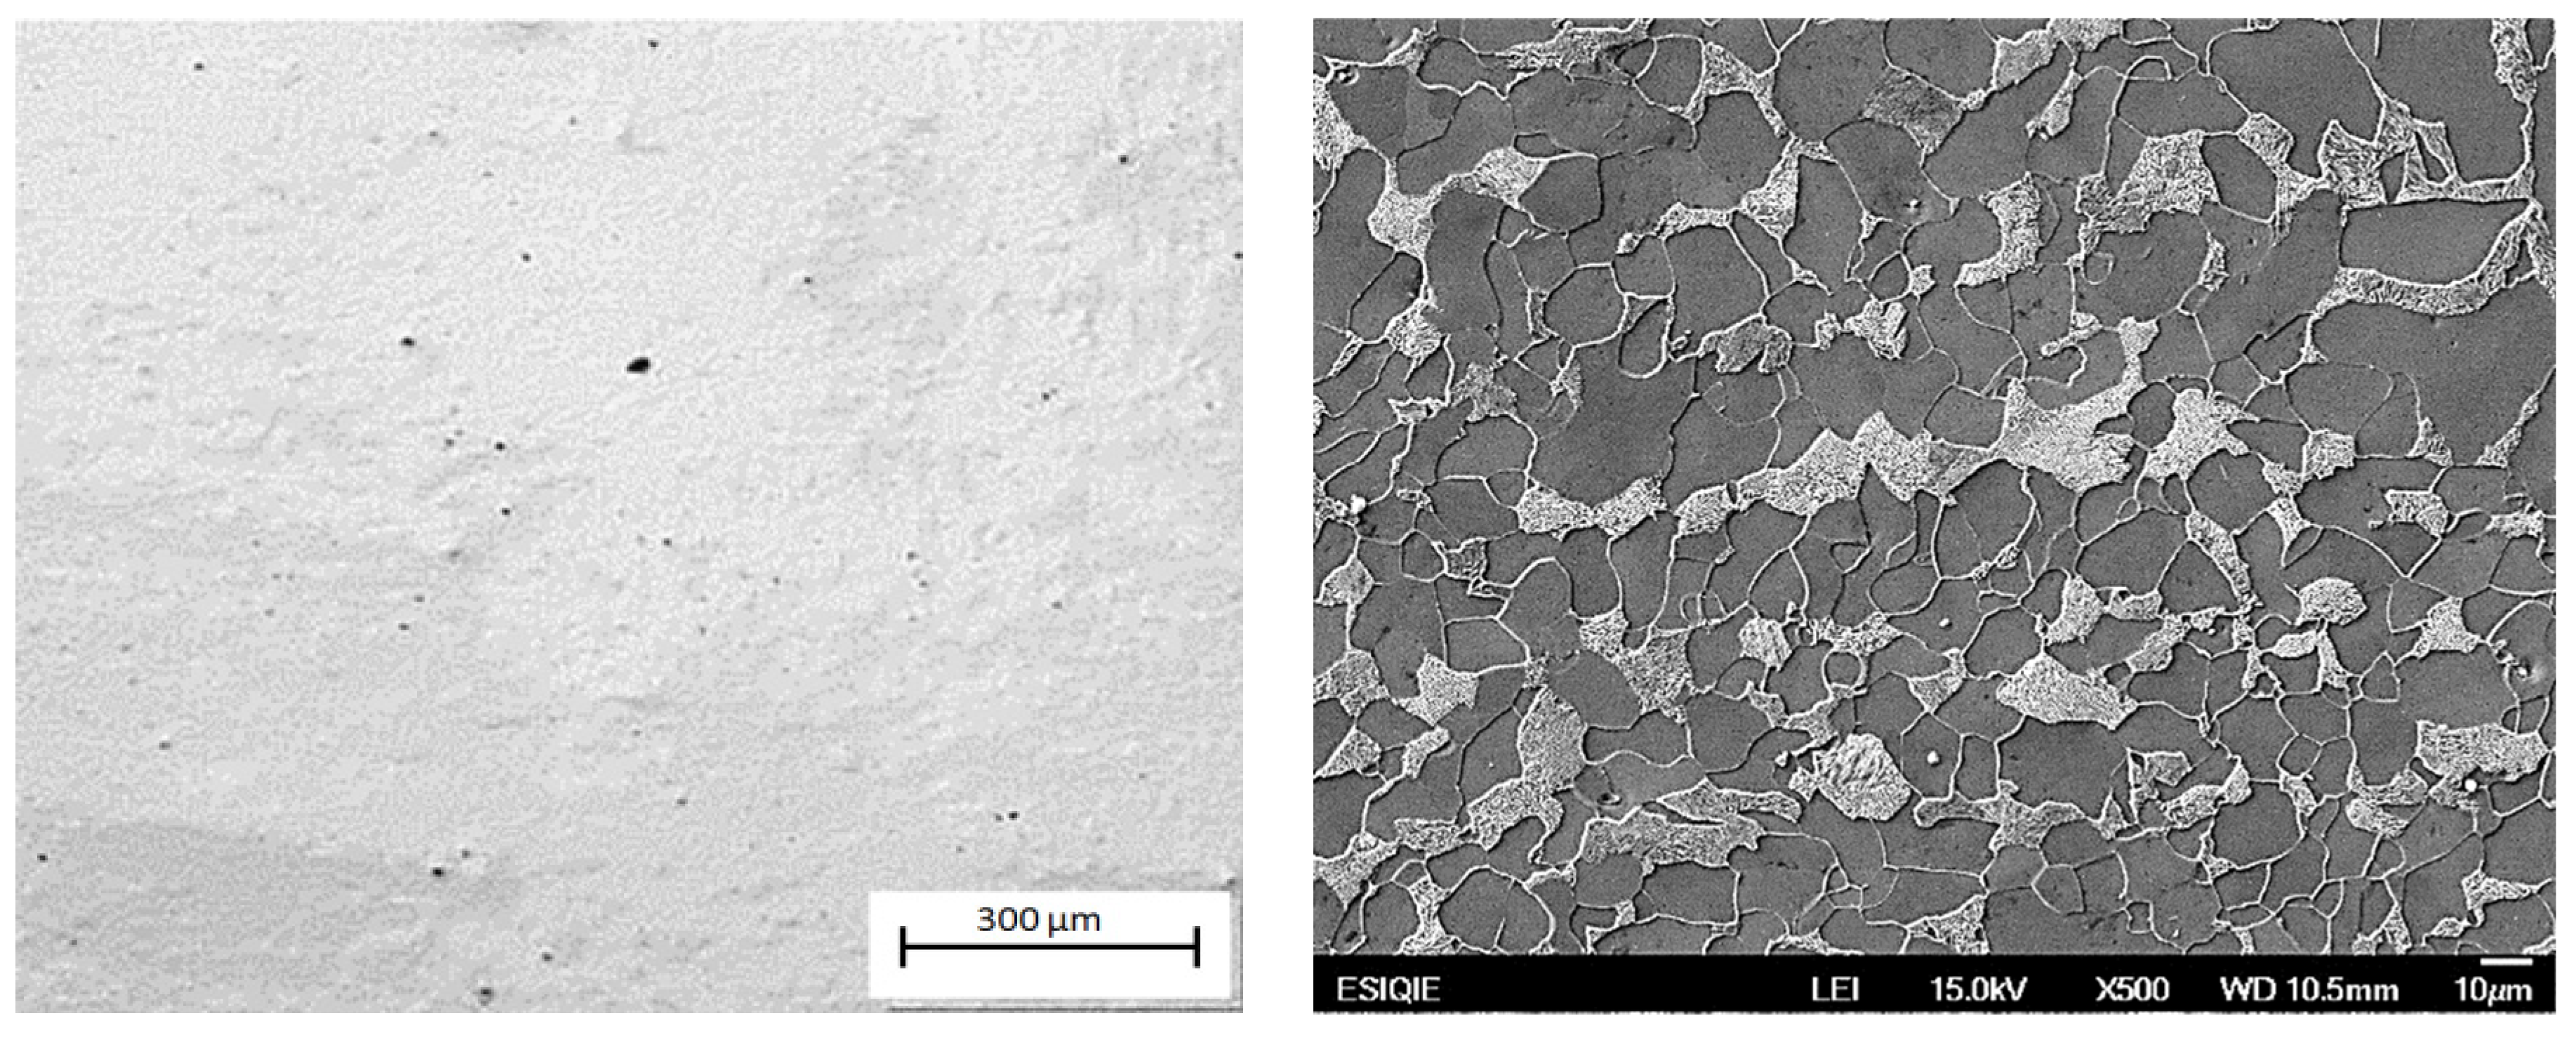
Figure 5 shows the typical aspect of the nonmetallic inclusions for the longitudinal (L-0°), circumferential (C-90°), and radial (R) directions of the original pipe. The nonmetallic inclusions were identified as globular oxides of type D, with a size range between 10 and 24 μm in the three orientations. Figure 6 shows the typical microstructure in the three pipe’s directions, and Figure 7 shows the microstructure in the D-45° direction. The microstructure is a matrix of ferrite grains of 11 µm average diameter, with lamellar pearlite colonies. Slightly elongated grains and moderate pearlite banding are observed in the L-0° direction (corresponding to the RD). In contrast, the D-45° and C-90° directions showed a nearly homogeneous microstructure with equiaxial grains.
Table 3 shows the stereological parameters of the microstructure, where it is observed that the %Vol. of inclusions, the Ferrite-Pearlite contents, as well as the grain size, are similar in the three directions. The Ai and Ω12 parameters that indicate the degree of pearlite banding are maximum in the L-0° direction, and smaller in the C-90° direction, with intermediate values in the D-45° direction, but closer to the C-90° direction. The observed microstructural differences are attributed to the manufacturing process that produces a banded microstructure in the rolling direction (L-0°), while the normalization heat treatment has a homogenizing effect.

3.2. Mechanical Properties

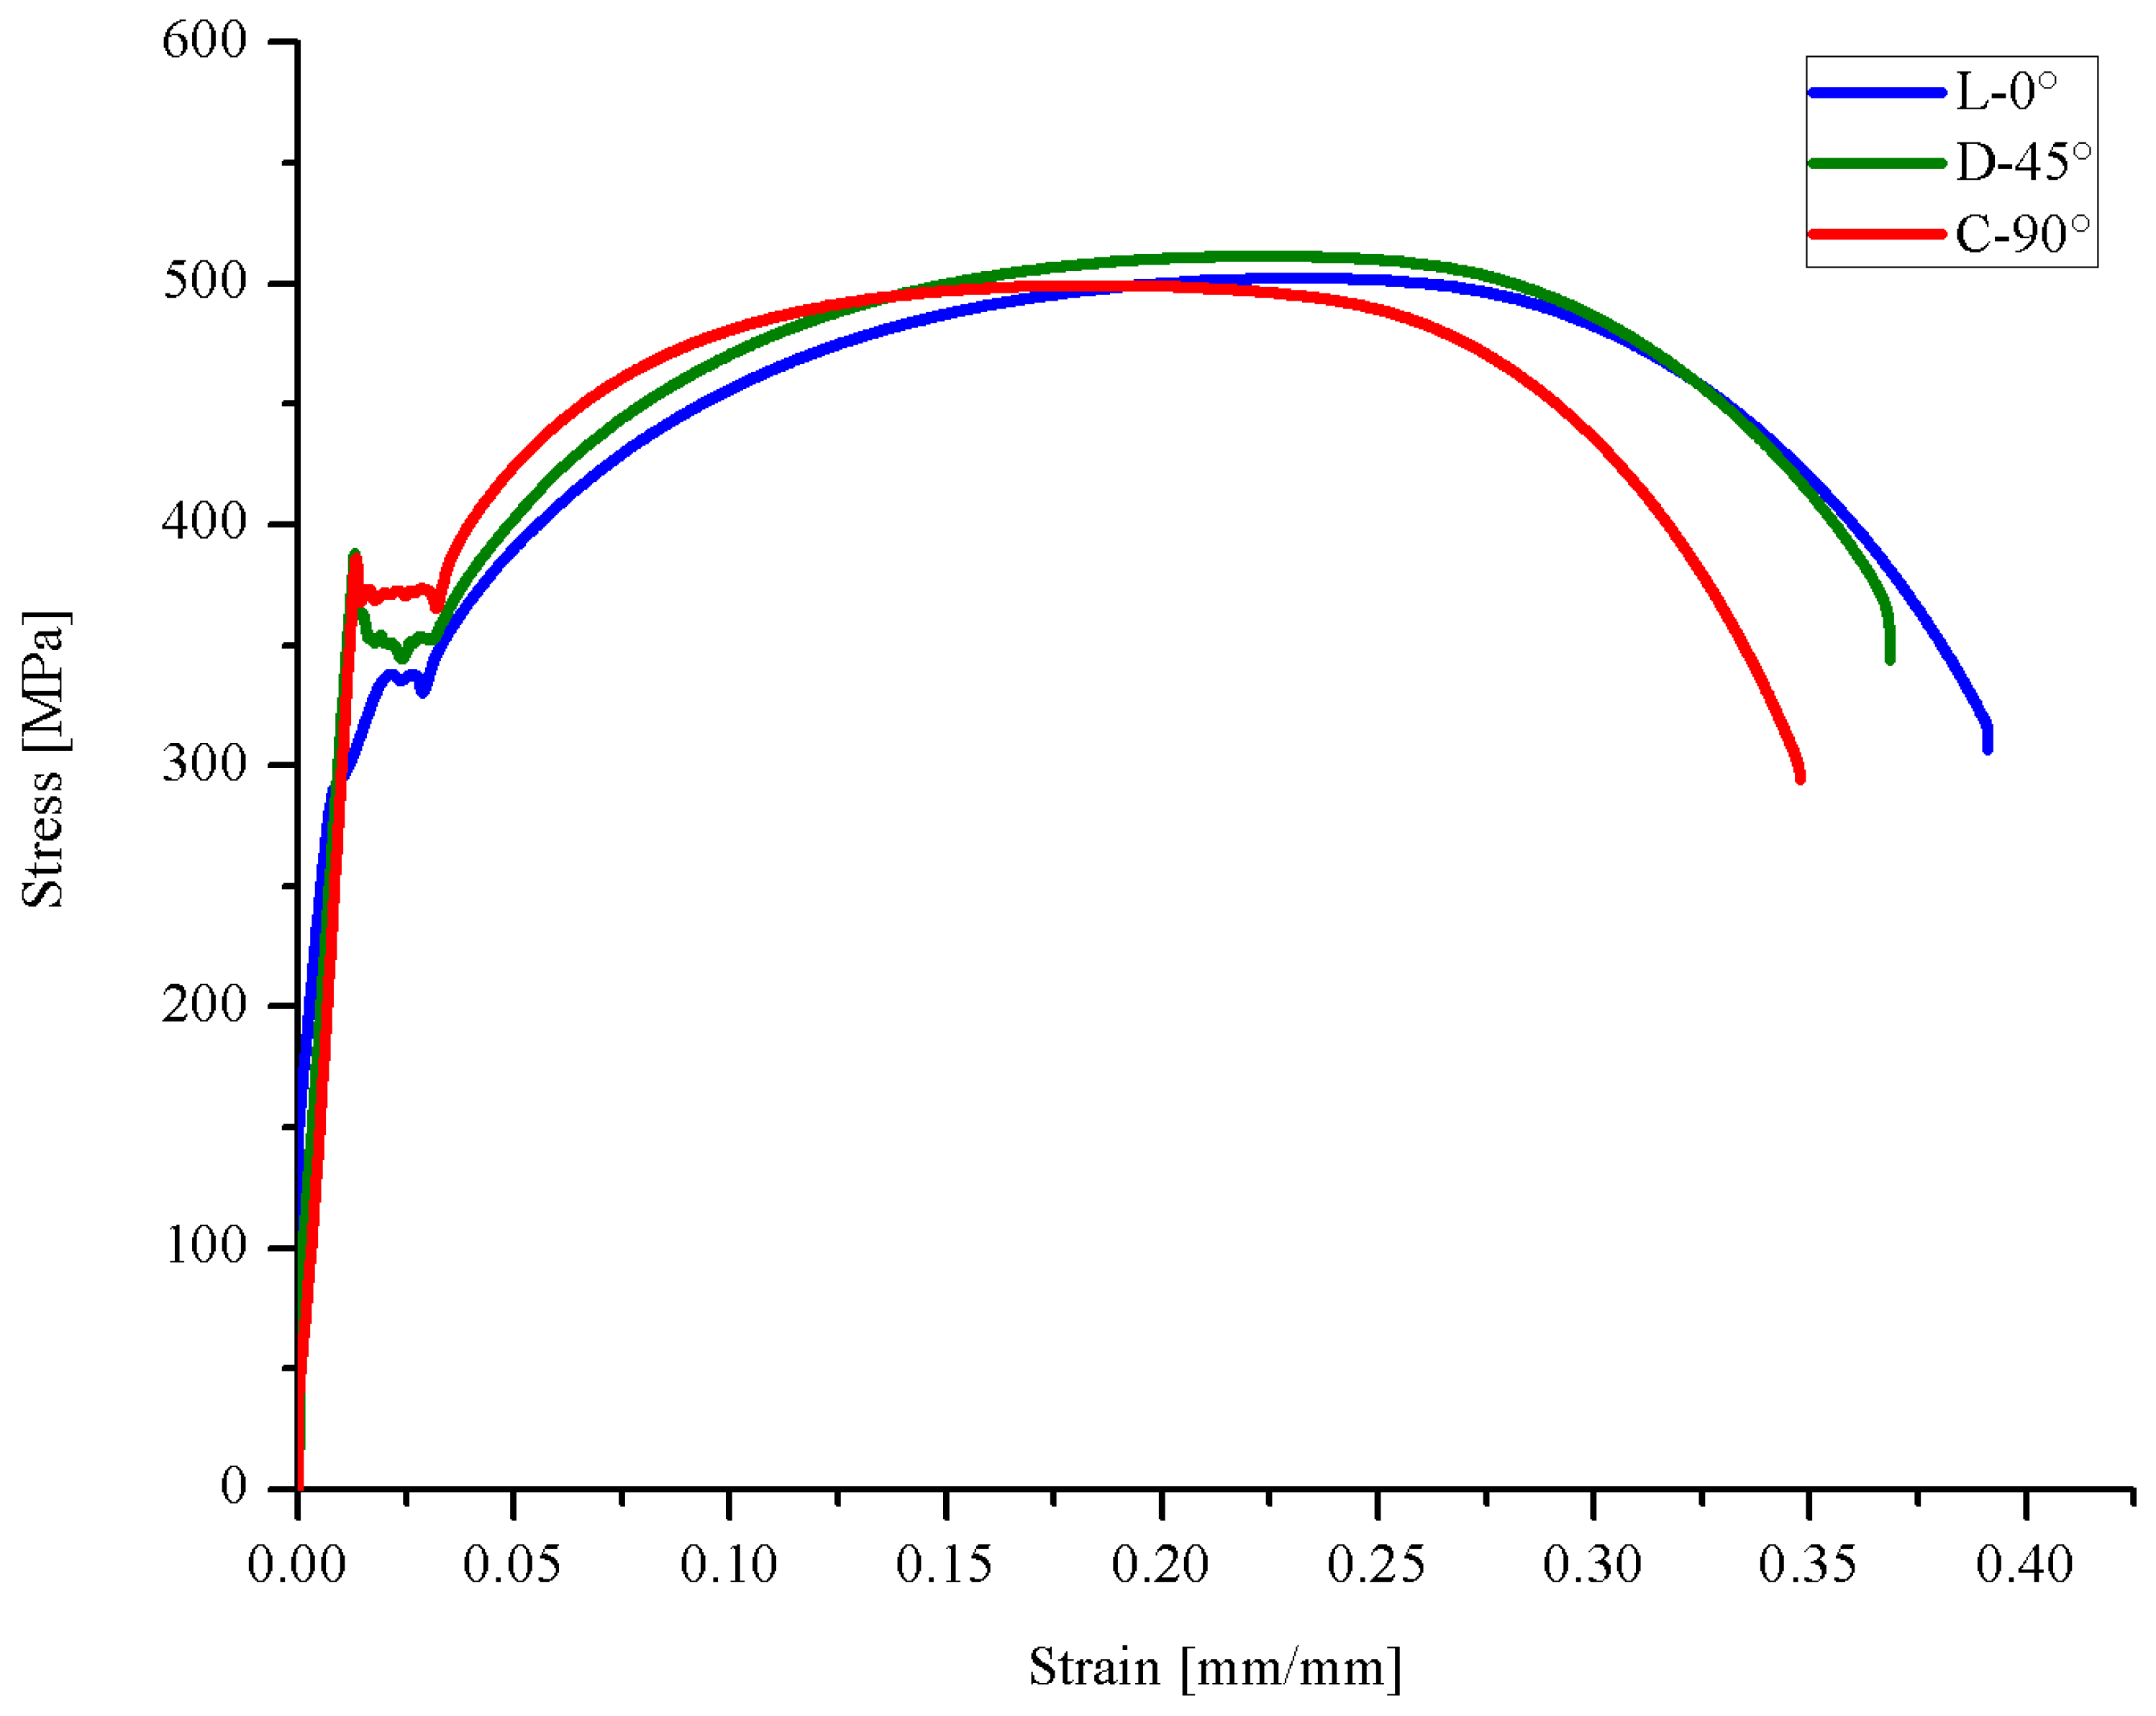
Figure 8 shows the Stress vs. Strain curves obtained for the three evaluated directions; while Table 4 shows the experimental tensile test data and required tensile strength values for API 5L X42 pipeline steel specification.
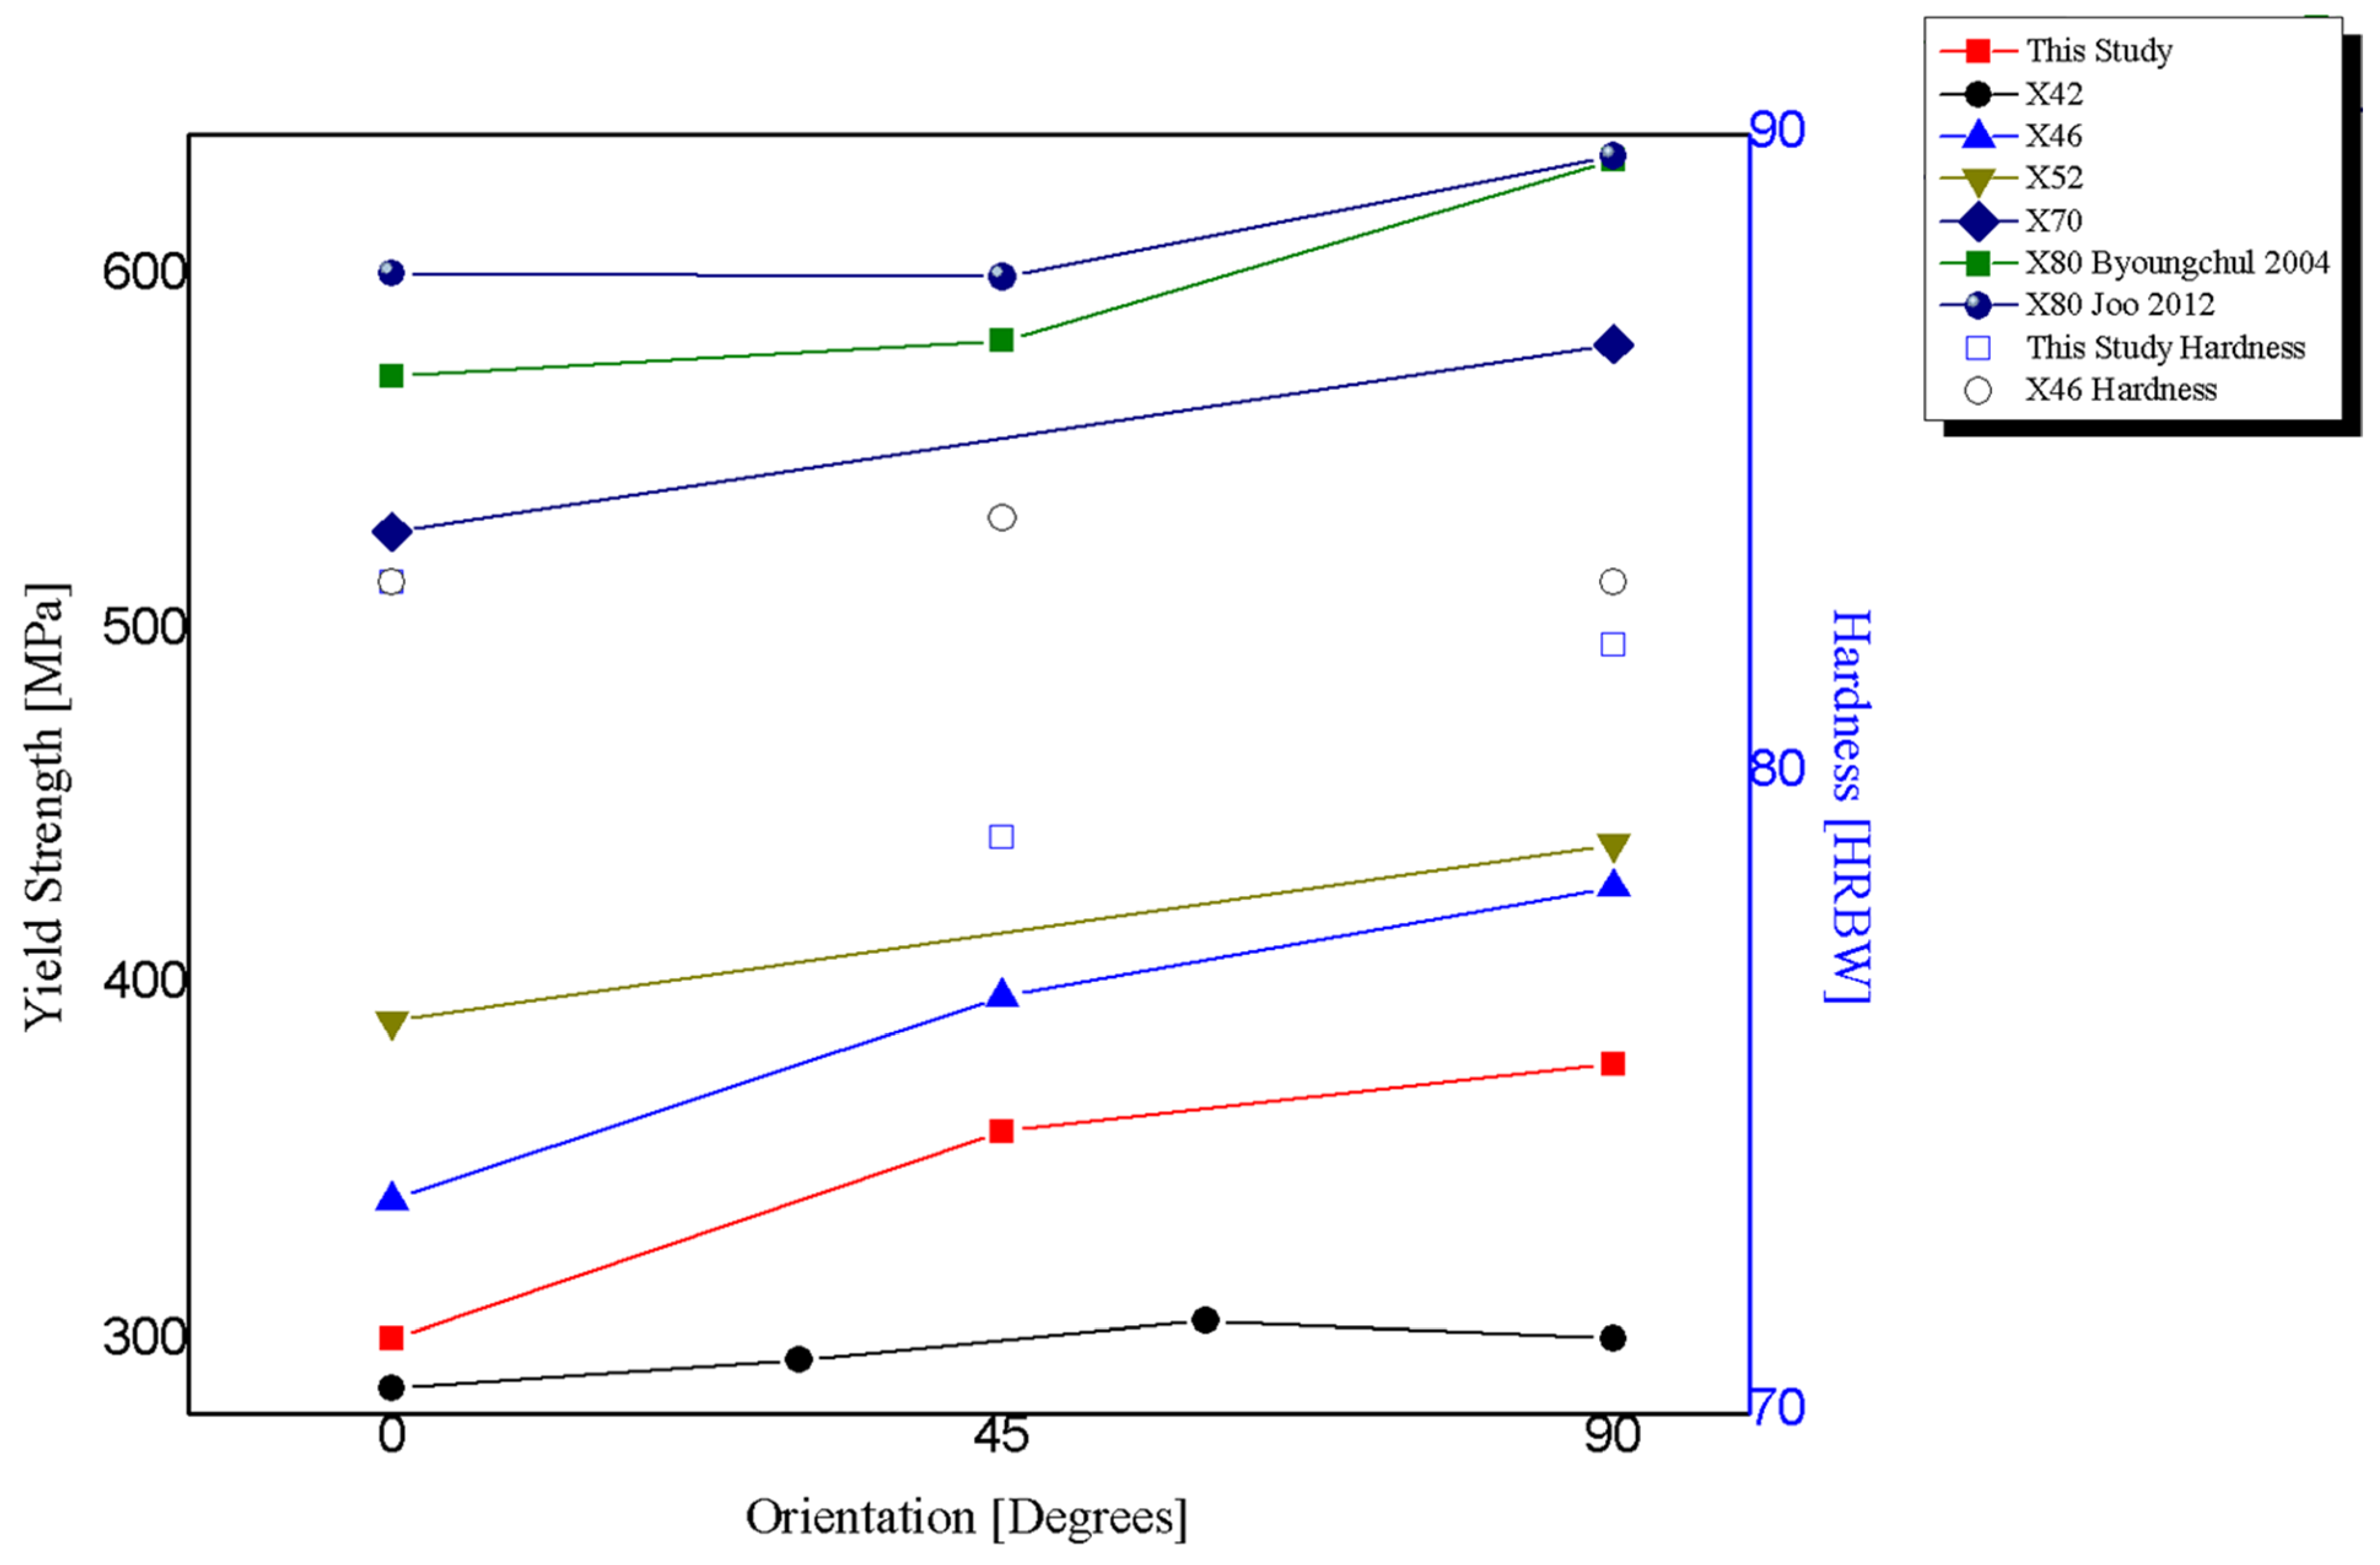
For comparison purposes, several tensile strength and hardness properties reported in the literature were collected and presented in Table 5, along with experimental data obtained in this study. It can be observed that hardness tests are not sensitive to variation amongst directions. In contrast, tensile tests show an anisotropic behavior, being the circumferential direction being the strongest orientation in almost all cases, with differences between 5% and 26%.
Tensile results show that the highest tensile and yield strengths are in the C-90° direction, while the L-0° and D-45° directions showed lower values with respect to the C-90°, but very close between them Figure 9 shows the tensile properties of pipeline steels. Figure 10 shows the tensile properties as a function of the test direction, normalized by the C-90° value. The reason for using the C-90° direction as reference is that in internally pressurized pipes, this is the principal stress direction under normal loading conditions, and therefore it is the most important from the design and structural integrity point of view.
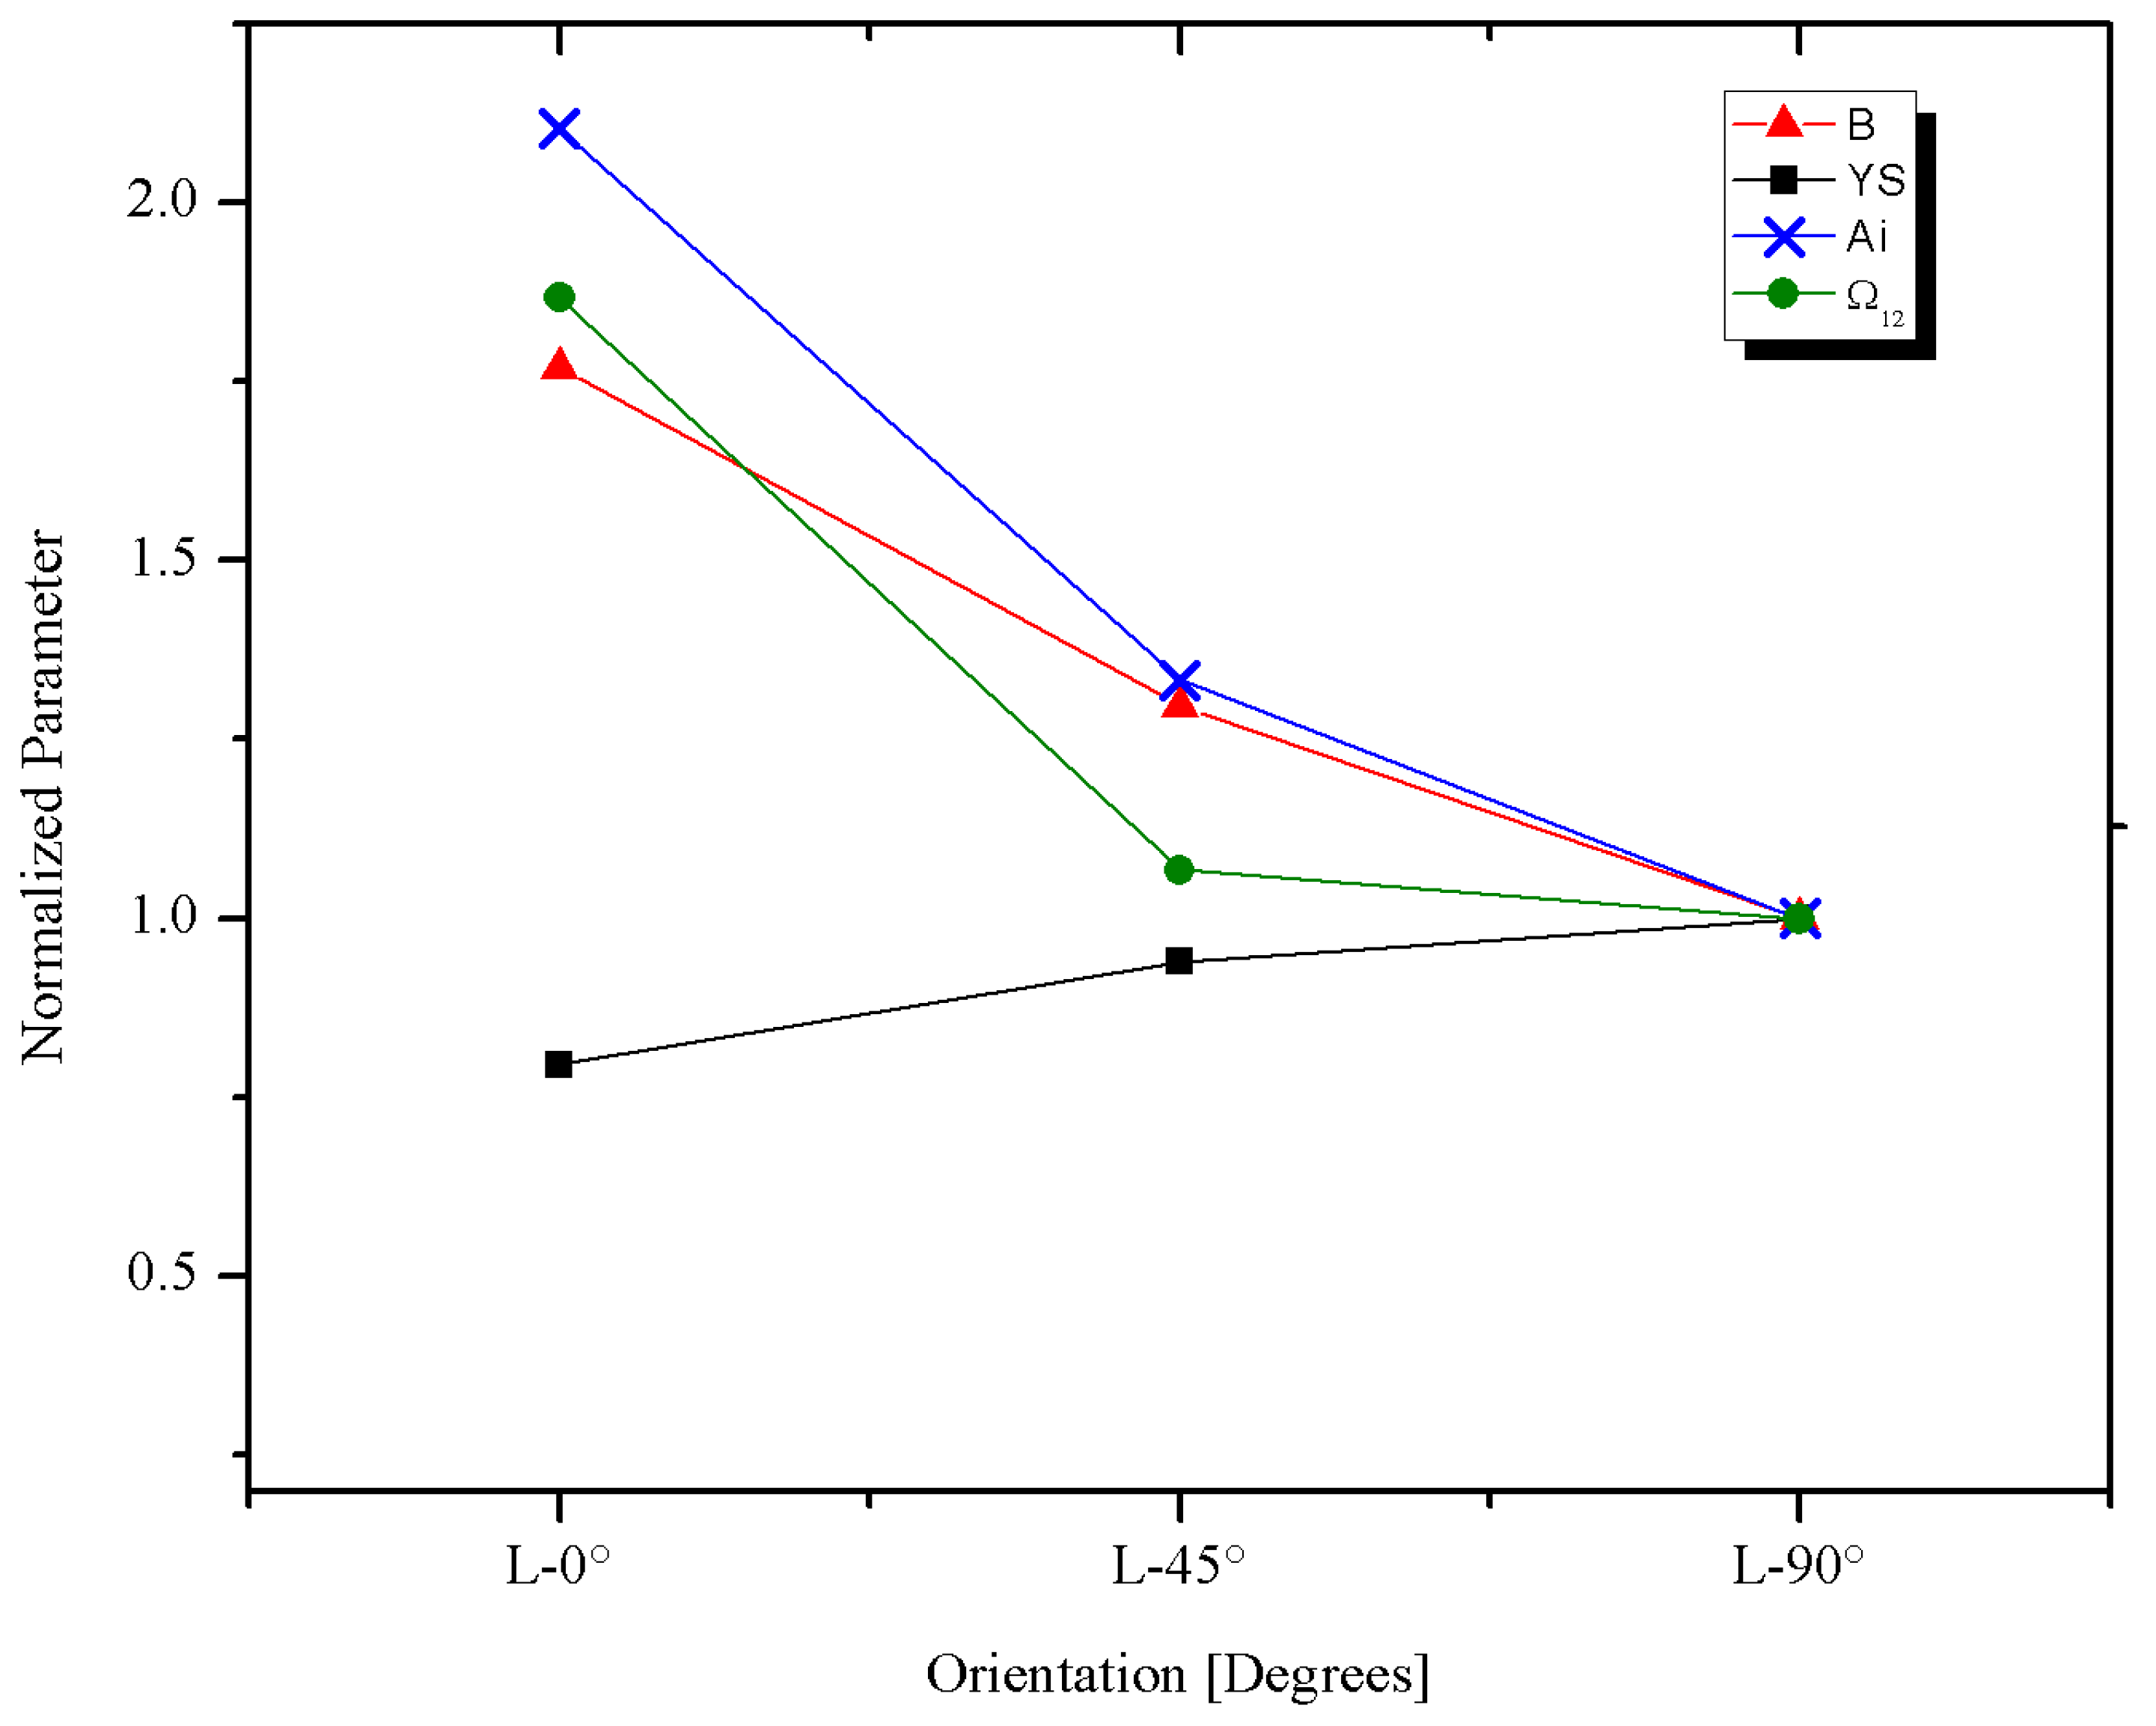
As seen in Figure 10, the greatest variation as a function of the test direction was observed in the Yield Strength (YS), which is consistent with the results obtained by other researchers [23,25], while the greatest anisotropy of the tensile properties is observed between the C-90° and the D-45° directions, which differs from the reported by others [13,23,44], where the most anisotropic direction was the L-0°. However, the difference between the results of this study and those reported by others in Table 5 is less than 4%, which can be considered within the experimental error.

3.3. Fatigue Tests Results and Analysis

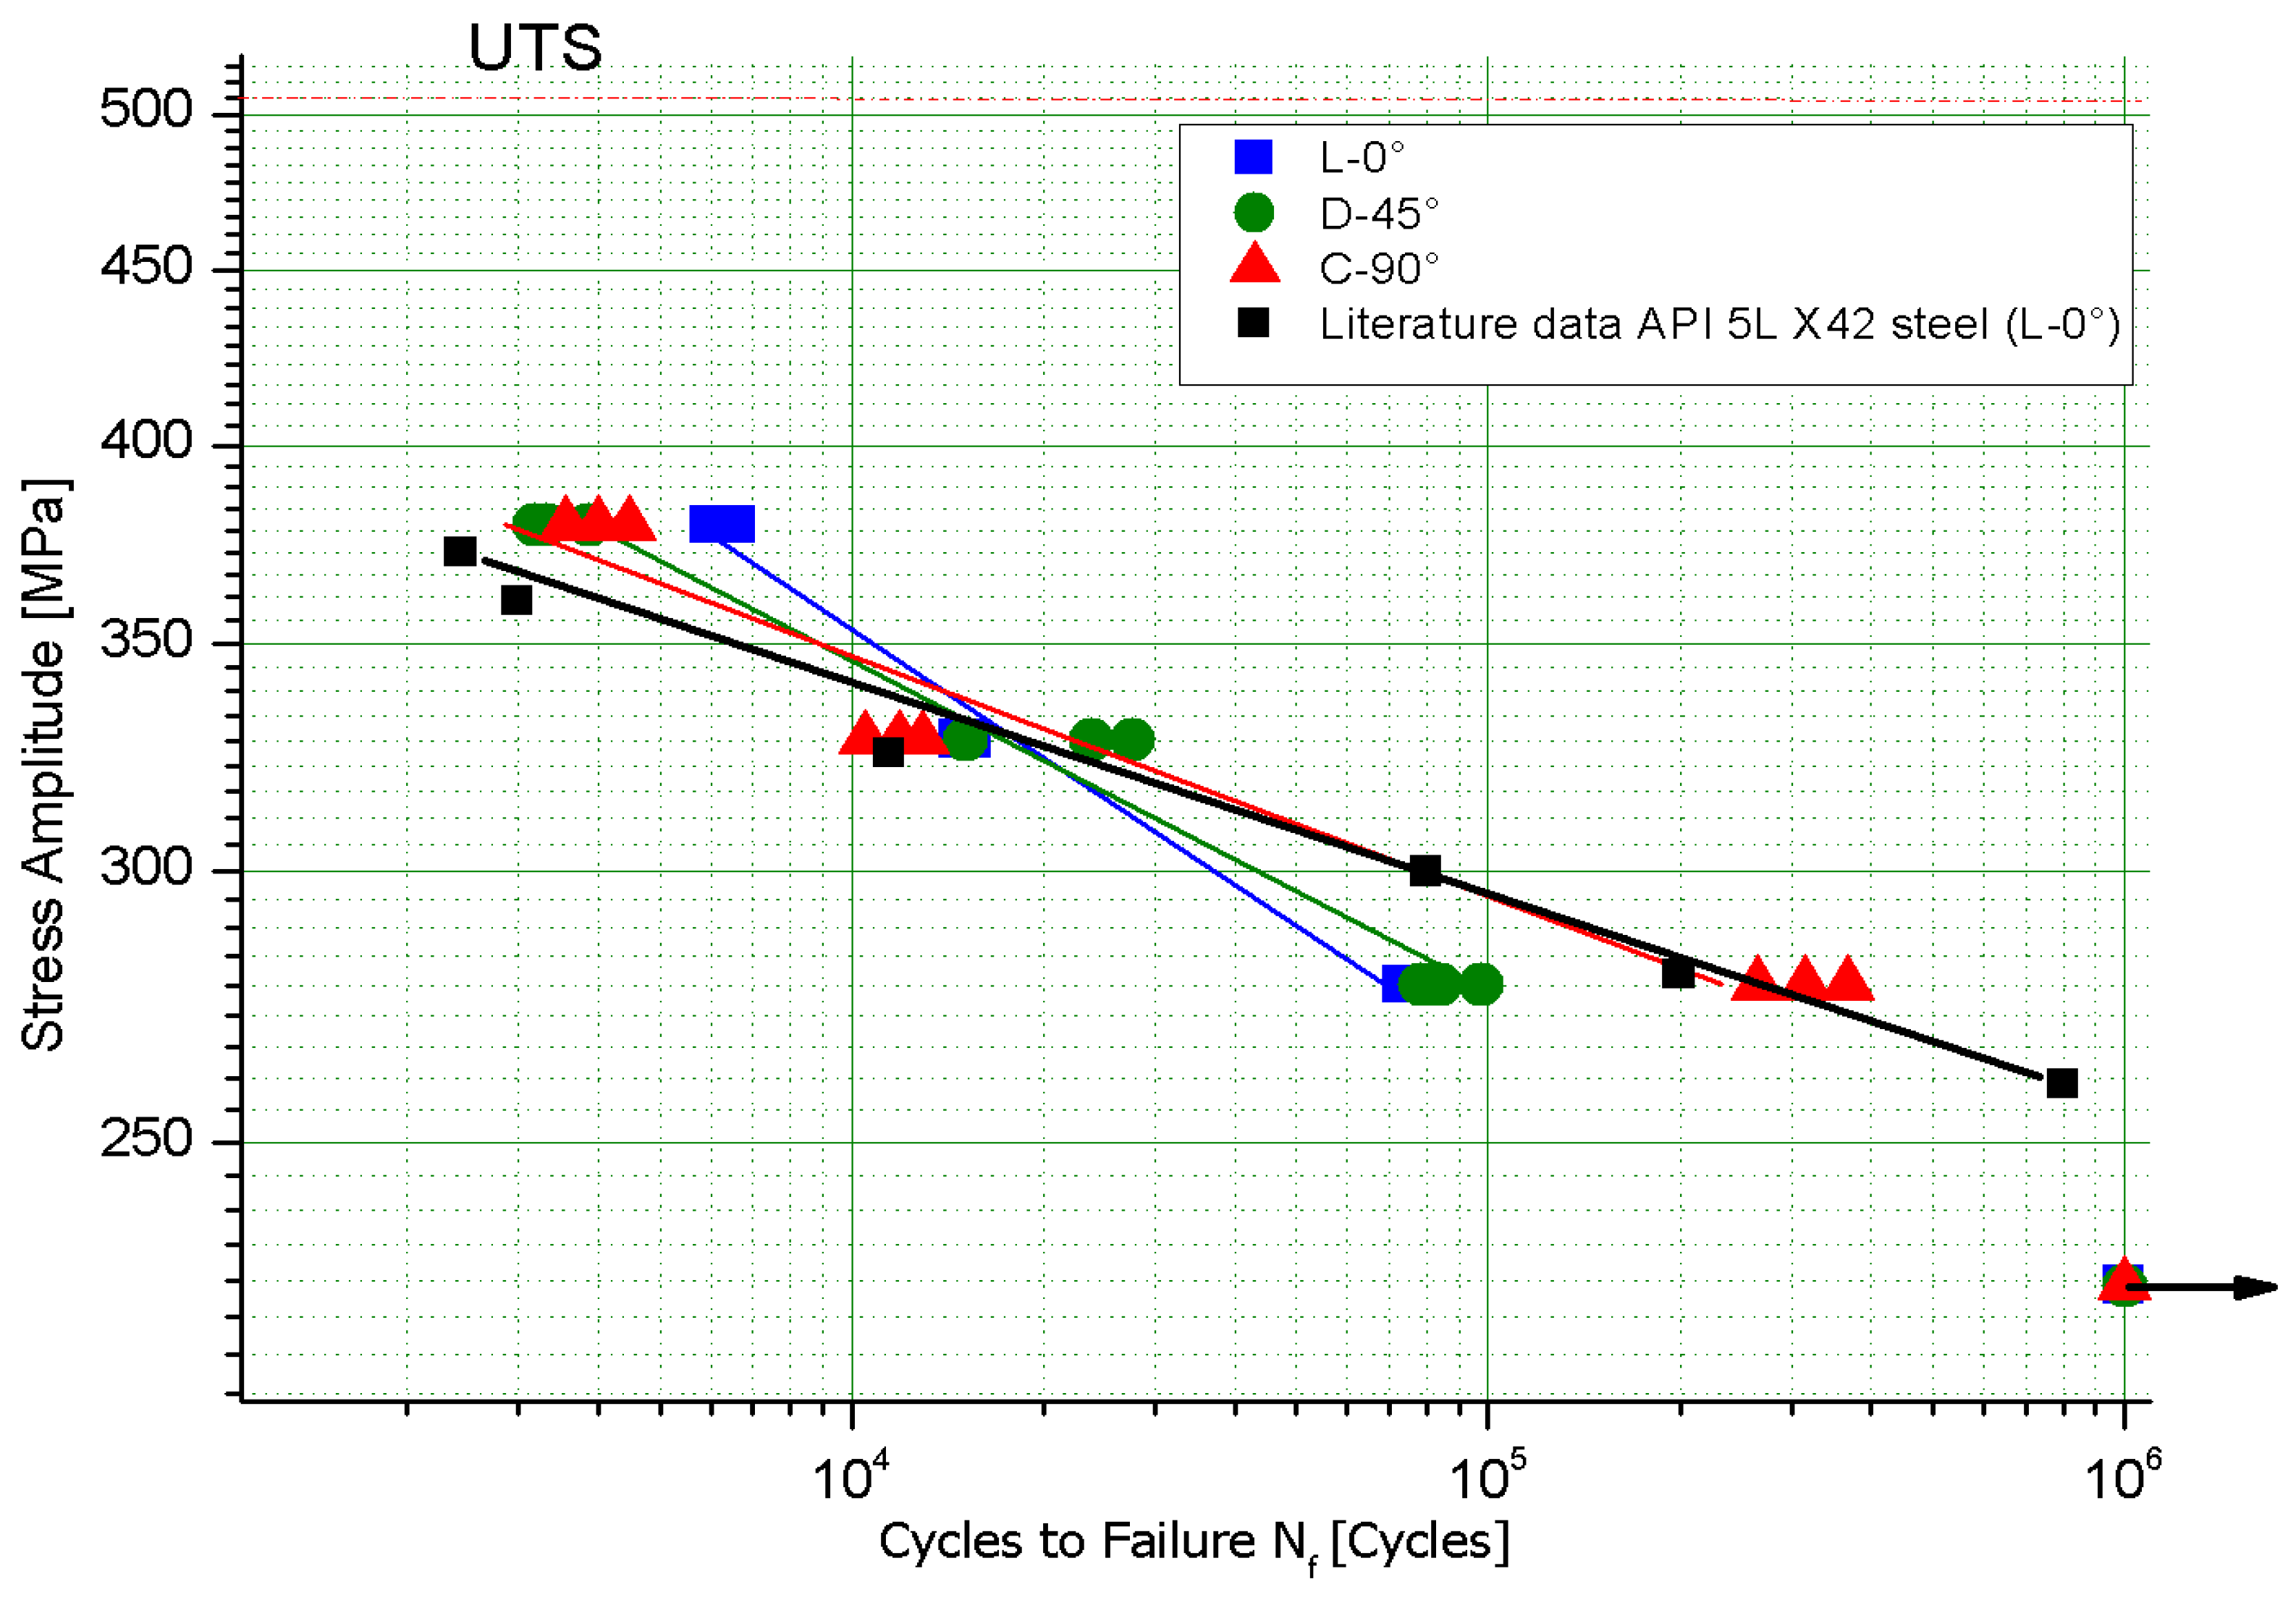
The axial force-controlled fatigue test results of the API 5L X42 steel in the form of S–N curves for the three tested directions are shown in Figure 11. Likewise, Figure 12 shows the S–N curves overlapped, for the three assessed directions. In addition, for comparison porpoises, the B exponent was estimated from the fatigue data reported by Hong et al. [45]. The direction evaluated in the mentioned study corresponds to L-0°.
As seen in Figure 11 and Figure 12, there is a clear dependency of fatigue endurance on the test direction. To quantitatively analyze the anisotropy level of the experimental data, the linear fatigue life parameters of the S–N equation of the ASTM E-739 Std. (Equation (1)) were calculated, with the results given in Table 6.
Before going further, it is important to recall that the fatigue strength exponent (B) represents the slope of the log(S) vs. log(N) fatigue curve and therefore is a good indicator of fatigue endurance, because a high value of B indicates a low fatigue endurance, particularly at low-stress amplitudes, provided that the parameter A is within the same order of magnitude. Thus, the subsequent analysis will be based mostly on this parameter.
It was observed that the B values obtained here are higher than those obtained for the published data of Hong et al., but near the typical value reported by the Universal Slopes Coffin–Manson Law (−0.08), indicating that the API 5L X42 steel tested here has a lower fatigue strength as compared to Hong et al. A possible explanation of this result could be that, even when the specification is the same, the steel tested by Hong was less anisotropic and had a more homogeneous microstructure. Furthermore, since the material tested here was extracted from a pipe segment withdrawn from service, it is possible that the material had already accumulated some level of fatigue damage that resulted in shorter fatigue lives.
In order to identify the parameter that determines the anisotropy in the API 5L X42 pipeline steel, the linear fatigue life parameters were normalized with respect to the direction C-90°, with the results given in Table 7 and Figure 13.
From Figure 12, it is clear that the parameters that control the anisotropy of the API 5L X42 pipeline steel tested here are the degree of pearlite banding (Ai) and the ferritic grain orientation parameter (Ω12), because the fatigue parameter B follows the same tendency, while the variation of YS with respect to the test direction has a much lower effect.
Several authors [12,30,31,32] have suggested that the anisotropic fatigue behavior in low-carbon steel can be attributed to the elongated MnS inclusions that are oriented parallel to the rolling direction. They argue that when the applied principal stress is perpendicular to the rolling direction, the elongated MnS inclusions introduce stress concentration fields that favor fatigue crack nucleation and growth, thus reducing fatigue endurance. However, in the material studied here, the inclusions were of globular oxides, so even though they had different contents in the three directions, the variations did not show any correlation with the fatigue parameter B, nor the tensile properties. Therefore, the anisotropy controlling factor identified here was the orientation of the microstructure. The investigation of the causes of this behavior goes beyond the scope of this study, but we foresee that they can be related to two phenomena, according to the fatigue stage that the material is going through. As it is well known, the process of fatigue in metals occurs in two stages, the first one is the damage accumulation, which is controlled by the dislocation arrays that are generated by the cyclic loading, and clearly, these arrays are influenced by the microstructure orientation. The second stage comprises the nucleation and growth of a crack, where the propagation mechanism takes place at a small process zone located ahead of the crack tip, and where the interactions with the microstructure and its orientation are very complex [46].
In this study, the strongest direction, from the fatigue endurance point of view, was the circumferential C-90° direction; it had the lowest value of B, the highest tensile properties, and the lowest degree of banding (Ai) and the ferritic grain orientation parameter (Ω12). Therefore, it can be concluded, so far, that the orientation of the microstructure not only determines the level of anisotropy but also the fatigue endurance, with the tensile properties having a minor influence.

4. Summary and Conclusions

The anisotropic behavior of fatigue endurance of API 5L X42 pipeline steel was evaluated by axial force-controlled fatigue tests in smooth bar specimens in three directions: Longitudinal (L-0°), Diagonal (D-45°), and Circumferential (C-90°). Results showed that both the tensile and fatigue endurance behavior are anisotropic, with anisotropy ratios of 1.297 for the D-45° direction and 1.736 for the L-0° direction. In all cases, L-0° direction showed the lowest fatigue life, while the highest was observed in C-90° direction. Fatigue strength exponents exhibited significant directional dependence, which can represent as much as 20% of fatigue lifetime reduction depending on the evaluated direction. These variations establish and modify quantitatively the response relative to crack initiation and consequently on total fatigue life. Therefore, the relative orientation of microstructural features with respect to the applied loads must be considered to estimate the remaining life of structural components.
A linear S–N relationship was used to analyze the results, indicating that the parameters that control the anisotropy of the API 5L X42 pipeline steel tested here are the degree of pearlite banding (Ai) and the ferritic grain orientation parameter (Ω12), while the variation of YS with respect to the test direction had a much lower effect. These facts highlight the effects of banding and grain orientation qualitatively, determining their influence on crack initiation. They also open new questions associated with events where some materials showed lower fatigue strength than the design specifications.
Contrary to the suggestion of other authors, the anisotropic fatigue behavior of the material studied here was not determined by the orientation of the nonmetallic inclusions, basically because the inclusions were globular oxides, whose variations did not show any correlation with the fatigue parameters, nor the tensile properties. Furthermore, the anisotropy controlling factors identified here were the degree of banding (Ai) and the ferritic grain orientation parameter (Ω12). Although the role of non-metallic inclusions is not ruled out, and considering the wide variety of chemical compositions, microstructures, forming processes, and heat treatments of steels, the effect of microstructural banding and grain orientation is consistently demonstrated in this work.
The causes of the anisotropic fatigue behavior observed here show that the interactions of the fatigue crack tip with the microstructure during the crack propagation stage have a significant effect on the fatigue endurance. The direction (C-90°) with the lowest values of banding degree (Ai) and grain orientation parameter (Ω12) showed the strongest fatigue endurance behavior (the lowest B). However, further research must be conducted to determine if there is any effect of crystallographic texture on fatigue anisotropy of low-carbon steel.
Understanding and accounting for the anisotropic behavior of fatigue in pipeline steels is significant for reliable design and operation. This involves recognizing that the steel’s fatigue endurance varies depending on the direction of the applied load and the crack orientation. By considering the directional dependence of fatigue, more precise fatigue life prediction models for damage tolerance estimation can be developed, rather than relying on isotropic assumptions. Also, detection of potential crack initiation can be optimized by understanding the directional sensitivity of fatigue, developing more effective inspection techniques. Further research is needed, especially for the interaction with external factors such as environment, temperature, or combined damage mechanisms.

Author Contributions

M.A.B.-Z.: Conceptualization, Methodology, Investigation, Data curation, Writing—original draft, Writing—review & editing. J.L.G.-V.: Conceptualization, Supervision, Writing—review & editing. H.J.D.-R.: Investigation, Formal analysis, Writing—review & editing. D.I.R.-L.: Resources, Formal Analysis. C.F.-P.: Resources, Data curation. F.H.-S.: Data curation. F.L.-F.: Methodology, Investigation. All authors have read and agreed to the published version of the manuscript.

Funding

The Article Processing Charges (APC’s) were financial supported by Instituto Politécnico Nacional (IPN); by Comisión de Operación y Fomento de Actividades Académicas del IPN (COFAA-IPN).

Institutional Review Board Statement

Not applicable.

Informed Consent Statement

Not applicable.

Data Availability Statement

The original contributions presented in this study are included in the article. Further inquiries can be directed to the corresponding author.

Acknowledgments

The authors acknowledge the Instituto Politécnico Nacional (IPN), and Secretaría de Ciencia, Humanidades, Tecnología e Innovación (SECIHTI) for the financial support necessary to carry out this research.

Conflicts of Interest

The authors declare no conflict of interest.

Abbreviations, Symbols, and Definitions

The following abbreviations and symbols were used in this manuscript:
AStrength fatigue coefficient
AiBanding degree
APIAmerican Petroleum Institute
ASTMAmerican Society for Testing and Materials
BFatigue strength exponent
FSWFriction Stir Welding
HRBWHardness Rockwell B
IDIdentification
KRamberg-Osgood Strength Coefficient
nRamberg-Osgood Strain Hardening Constant
NfNumber of cycles to failure
RStress ratio
RDRolling direction
SMaximum value of constant amplitude cyclic stress
UOEU-ing, O-ing, and Expanding process
UTSUltimate Tensile Strength
YSYield Strength
Ω12Microstructural orientation parameter

References

  1. González-Velázquez, J.L. Capítulo 2- Diseño y construcción de ductos marinos de conducción de hidrocarburos. In Ingeniería de Ductos de Transporte de Hidrocarburos; González-Velázquez, J.L., Ed.; Baker & Jules: Tacoma, WA, USA, 2020; pp. 95–180. [Google Scholar]
  2. ASME B31.8; Gas Transmission and Distribution Piping Systems. The American Society of Mechanical Engineers: New York, NY, USA, 2021. Available online: https://www.asme.org/codes-standards/find-codes-standards/b31-8-gas-transmission-distribution-piping-systems (accessed on 12 November 2024).
  3. ASME B31.4; Pipeline Transportation Systems for Liquids and Slurries. The American Society of Mechanical Engineers: New York, NY, USA, 2019. Available online: https://www.asme.org/codes-standards/find-codes-standards/b31-4-pipeline-transportation-systems-liquids-slurries (accessed on 12 November 2024).
  4. DNV-OS-F101; Offshore Standard, SUBMARINE PIPELINE SYSTEMS. Det Norske Veritas: Byrum, Norway, 2005. Available online: https://rules.dnv.com/docs/pdf/dnvpm/codes/docs/2017-10/DNV-OS-F101.pdf (accessed on 12 November 2024).
  5. DNVGL-OS-C101; Offshore Standard, Design of Offshore Steel Structures, General-LRFD Method. Det Norske Veritas: Byrum, Norway, 2015. Available online: https://www.dnv.com/news/dnv-rules-and-standards-for-offshore-units-july-2023-edition-245184 (accessed on 12 November 2024).
  6. Mikael, W. Braestrup, Chapter 6 Design. In Design and Installation of Marine Pipelines; Blackwell Science Ltd.: Oxford, UK, 2005; Available online: https://www.wiley.com/en-us/Design+and+Installation+of+Marine+Pipelines-p-9781405148740 (accessed on 12 November 2024).
  7. Kim, K.; Bae, J.-H. Metallurgical and process parameters for commercial production of high toughness API–X80 grade hot rolled strips. In Proceedings of the Biennial International Pipeline Conference, IPC, Calgary, AB, Canada, 29 September–3 October 2008; Volume 3, pp. 167–173. [Google Scholar] [CrossRef]
  8. Seo, D.H.; Song, W.H.; Ahn, S.S.; Kim, C.M.; Yoo, J.Y. Microstructure and Mechanical Properties of API–X80/X100 Grade Plates and Pipes. In Proceedings of the Seventeenth International Offshore and Polar Engineering Conference, Lisboa, Portugal, 1–6 July 2007; Volume 12, pp. 20–27. [Google Scholar]
  9. Nafisi, S.; Arafin, M.; Collins, L.; Szpunar, J. Texture and mechanical properties of API X100 steel manufactured under various thermomechanical cycles. Mater. Sci. Eng. A 2012, 531, 2–11. [Google Scholar] [CrossRef]
  10. Kichkina, A.A.; Matrosov, M.Y.; Efron, L.I.; Klyukvin, M.B.; Golovanov, A.V. Effect of structural anisotropy of ferrite-bainite pipe steel on mechanical properties in tensile and impact bending tests. Metallurgist 2011, 54, 808–816. [Google Scholar] [CrossRef]
  11. Inagaki, H.; Kurihara, K.; Kozasu, I. Influence of crystallographic texture on the strength and toughness of the controlled rolled high tensile strength steel. Iron Steel Inst. Jpn. 1975, 61, 991–1011. [Google Scholar] [CrossRef]
  12. Ghosh, A.; Modak, P.; Dutta, R.; Chakrabarti, D. Effect of MnS inclusion and crystallographic texture on anisotropy in Charpy impact toughness of low carbon ferritic steel. Mater. Sci. Eng. A 2016, 654, 298–308. [Google Scholar] [CrossRef]
  13. Joo, M.S.; Suh, D.-W.; Bae, J.H.; JBhadeshia, H. Role of delamination and crystallography on anisotropy of Charpy toughness in API X80 steel. Mater. Sci. Eng. A 2012, 546, 314–322. [Google Scholar] [CrossRef]
  14. Joo, M.S.; Suh, D.-W.; Bae, J.H.; Mouriño, S.N. Experiments to separate the effect of texture on anisotropy of pipeline steel. Mater. Sci. Eng. A 2012, 556, 601–606. [Google Scholar] [CrossRef]
  15. Zong, C.; Zhu, G.; Mao, W. Effect of crystallographic texture on the anisotropy of Charpy impact behaviour in pipeline steel. Mater. Sci. Eng. A 2013, 563, 1–7. [Google Scholar] [CrossRef]
  16. Brozzo, P.; Buzzichelli, G. Effect of plastic anisotropy on the occurrence of separations on fracture surfaces of hot rolled steel specimens. Scr. Metall. 1976, 10, 235–240. [Google Scholar] [CrossRef]
  17. Chae, D.; Koss, D.; Wilson, A.; Howell, P. The effect of microstructural banding on failure initiation of HY-100 steel. Met. Mater. Trans. A 2000, 31, 995–1005. [Google Scholar] [CrossRef]
  18. Joo, M.S.; Suh, D.; Bae, J. Toughness anisotropy in X70 and X80 line-pipe steels. Mater. Sci. Technol. 2014, 30, 439–446. [Google Scholar] [CrossRef]
  19. Fegredo, D.; Faucher, B.; Shehata, M. Strength of Metals and Alloys. In Influence of Inclusion Content, Texture and Microstructure on the Toughness Anisotropy of Low Carbon Steels; Pergamon Press: Oxford, UK, 1985; Volume 2, pp. 1127–1132. [Google Scholar]
  20. Baczynski, G.J.; Jonas, J.J.; Collins, L.E. The influence of rolling practice on notch toughness and texture development in high-strength line-pipe. Met. Mater. Trans. A 1999, 30, 3045–3054. [Google Scholar] [CrossRef]
  21. Sang, Y.; Hwang, B.; Lee, S.; Kim, N.J. Correlation of microstructure and Charpy impact properties in API X70 and X80 line-pipe steels. Mater. Sci. Eng. A 2007, 458, 281–289. [Google Scholar] [CrossRef]
  22. Garwood, S.J. The effect of temperature, orientation and constraint on the toughness of A 533 B Class I steel. In Application of Fracture Mechanics to Materials and Structures; Martinus Nijhoff Publishers: Leiden, The Netherlands, 1984; Volume 1, pp. 939–950. [Google Scholar] [CrossRef]
  23. Byoungchul, H.; Yang, G.K.; Sunghak, L.; Young, M.K.; Nack, J.K.; Jang, Y.J. Effective grain size and Charpy impact properties of high toughness X70 pipeline steels. Met. Mater. Trans. A 2004, 36A, 2107–2114. [Google Scholar] [CrossRef]
  24. Yang, X.-L.; Xu, Y.-B.; Tan, X.-D.; Wu, D. Relationships among crystallographic texture, fracture behaviour and Charpy impact toughness in API X100 pipe-line steel. Mater. Sci. Eng. A 2015, 641, 96–106. [Google Scholar] [CrossRef]
  25. Beltran-Zuñiga, M.A.; González-Velázquez, J.L.; Rivas-López, D.I.; Dorantes-Rosales, H.J.; Hernández-Santiago, F. Effect of microstructure and crystallographic texture on the toughness anisotropy of API 5L X46 steel. Fatigue Fract. Eng. Mater. Struct. 2018, 41, 749–761. [Google Scholar] [CrossRef]
  26. Ju, J.-B.; Lee, J.-S.; Jang, J.-I. Fracture toughness anisotropy in API steel line-pipe. Mater. Lett. 2007, 61, 5178–5180. [Google Scholar] [CrossRef]
  27. Sang, Y.S.; Byoungchul, H.; Sangho, K.; Sunghak, L. Fracture toughness analysis in transition temperature region of API X70 pipeline steels. Mater. Sci. Eng. A 2006, 429, 196–204. [Google Scholar] [CrossRef]
  28. Beltrán-Zúñiga, M.A.; González-Velázquez, J.L.; Rivas-López, D.I.; Hernández-Santiago, F.; Dorantes-Rosales, H.J.; López-Hirata, V.M. Determination of fracture toughness in the short transverse direction of low carbon steel pipes by compact-tension specimens completed by welded attachments. Eng. Fract. Mech. 2019, 222, 106711. [Google Scholar] [CrossRef]
  29. Lai, M.O.; Ferguson, W.G. Relationship between fracture topography and fracture toughness of high strength steel. J. Mater. Sci. 1985, 20, 1985–1992. [Google Scholar] [CrossRef]
  30. Heiser, F.; Hertzberg, R. Anisotropy of fatigue crack propagation. J. Basic Eng. 1971, 93, 211–217. [Google Scholar] [CrossRef]
  31. Ohji, K.; Ogura, K.; Harada, S.; Taji, T. Fatigue crack growth behavior of anisotropic rolled steel plate with special reference to laminated structure and inclusions. Bull. JSME 1978, 21, 939–947. [Google Scholar] [CrossRef]
  32. Slot, H.; Nicoreac, M.; Maljaars, J. Influence of material anisotropy on fatigue crack growth in C–Mn steels of existing structures. Fatigue Fract. Eng. Mater. Struct. 2020, 43, 2527–2541. [Google Scholar] [CrossRef]
  33. Cavaliere, P.; De Santis, A.; Panella, F.; Squillace, A. Effect of anisotropy on fatigue properties of 2198 Al–Li plates joined by friction stir welding. Eng. Fail. Anal. 2009, 16, 1856–1865. [Google Scholar] [CrossRef]
  34. Pessard, E.; Morel, F.; Morel, A. The anisotropic fatigue behavior of forged steel. Adv. Eng. Mater. 2009, 11, 732–735. [Google Scholar] [CrossRef]
  35. ASTM E3-11(2017); Standard Guide for Preparation of Metallographic Specimens. ASTM International: West Conshohocken, PA, USA, 2017.
  36. ASTM E407-07(2015); Standard Practice for Microetching Metals and Alloys. ASTM International: West Conshohocken, PA, USA, 2015.
  37. ASTM E1268-01(2016); Standard Practice for Assessing the Degree of Banding or Orientation of Microstructures. ASTM International: West Conshohocken, PA, USA, 2016.
  38. ASTM E112-13(2021); Standard Test Methods for Determining Average Grain Size. ASTM International: West Conshohocken, PA, USA, 2021.
  39. ASTM E45-18a; Standard Test Methods for Determining the Inclusion Content of Steel. ASTM International: West Conshohocken, PA, USA, 2023.
  40. ASTM E-8; Standard Test Methods for Tension Testing of Metallic Materials. ASTM International: West Conshohocken, PA, USA, 2024.
  41. ASTM E18; Standard Test Methods for Rockwell Hardness of Metallic Materials. ASTM International: West Conshohocken, PA, USA, 2024.
  42. ASTM E466-21; Standard Practice for Conducting Force Controlled Constant Amplitude Axial Fatigue Tests of Metallic Materials. American Society of Testing Materials Book of Standards. ASTM International: Philadelphia, PA, USA, 2021; pp. 1–7. [CrossRef]
  43. ASTM E739-10(2015); Standard Practice for Statistical Analysis of Linear or Linearized Stress-Life (S-N) and Strain-Life (ε-N) Fatigue Data, American Society of Testing Materials Book of Standards. ASTM International: Philadelphia, PA, USA, 2015; pp. 1–7. [CrossRef]
  44. Venegas, V.; Caleyo, F.; Baudin, T.; Espina-Hernández, J.H.; Hallen, J.M. On the role of crystallographic texture in mitigating hydrogen-induced cracking in pipeline steels. Corros. Sci. 2011, 53, 4204–4212. [Google Scholar] [CrossRef]
  45. Hong, S.W.; Koo, J.M.; Seok, C.S.; Kim, J.W.; Kim, J.H.; Hong, S.K. Fatigue life prediction for an API 5L X42 natural gas pipeline. Eng. Fail. Anal. 2015, 56, 396–402. [Google Scholar] [CrossRef]
  46. González-Velázquez, J. Fatigue. In Mechanical Behavior and Fracture of Engineering Materials; Structural Integrity; Springer: Cham, Switzerland, 2020; Volume 12. [Google Scholar] [CrossRef]
Figure 1. Tensile properties of low-carbon steel plates and pipelines, literature review.
Materials 18 02484 g001
Figure 2. Directions of the test specimens.
Materials 18 02484 g002
Figure 3. Geometric dimensions of tensile specimens [mm].
Materials 18 02484 g003
Figure 4. Geometry of the continuous radius specimen for fatigue tests, machined according to the ASTM E-466 standard [mm].
Materials 18 02484 g004
Figure 5. Non-metallic inclusions of API 5L X42 steel: (a) longitudinal (L-90°); (b) circumferential (C-90°); and (c) radial (R) directions. Optical microscopy, unetched.
Materials 18 02484 g005
Figure 6. Microstructure of API 5L X42 steel: (a) longitudinal (L-0°); (b) circumferential (C-90°); and (c) radial (R) directions. Scanning electron microscope, SEI bright field, etched with Nital 3.
Materials 18 02484 g006
Figure 7. Microstructure of API 5L X42 steel in the D-45° direction.
Materials 18 02484 g007
Figure 8. Stress vs. Strain curves for the L-0°, D-45° and C-90° evaluated directions of the API 5L X42 steel.
Materials 18 02484 g008
Figure 9. Tensile and hardness properties of pipeline steels [13,23].
Materials 18 02484 g009
Figure 10. Tensile properties as a function of the test direction. Normalized by the C-90° value.
Materials 18 02484 g010
Figure 11. Experimental S–N curves for the API 5L X42 steel, in (a) L-0°, (b) D-45°, and (c) C-90° directions.
Materials 18 02484 g011
Figure 12. S–N curves for the three test directions of the API 5L X42 steel.
Materials 18 02484 g012
Figure 13. Fatigue strength exponent (B), degree of pearlite banding (Ai), ferritic grain orientation parameter (Ω12), and yield strength (YS), normalized by the C-90° as a function of the test direction.
Materials 18 02484 g013
Table 1. Raw material operation conditions.
Properties/Operation ConditionAPI 5L X42 Steel
Product Specification LevelPSL1
Transported productLight crude oil
Nominal Diameter24 in (609.6 mm)
Nominal Thickness0.500 in (12.7 mm)
Design Pressure80 kg/cm2 (1138 psi)
Working Pressure65.3 kg/cm2 (929 psi)
Design Temperature45.0 °C (113 °F)
Working Temperature22.1 °C (71.78 °F)
Run time8 years
Table 2. Chemical composition of API 5L X42 steel [% wt].
IDCSMnCuPCrSiMoTi
Tested Steel API 5L X420.2200.0401.2400.0230.0030.0850.2600.2600.002
API 5L Spec0.260 [max.]0.030 [max.]1.300 [max.]0.035 [max.]0.030 [max.]---0.040 [max.]
Table 3. API 5L X42 stereological counting.
DirectionNon-Metallic Inclusions
[%]
Ferrite
[%]
Pearlite
[%]
AiΩ12Grain Size
[μm]ASTM
L-0°0.552 ± 0.05871.54 ± 2.7628.46 ± 2.761.640.2824.4 ± 1.988.0
D-45°0.506 ± 0.03670.65 ± 2.2529.35 ± 2.251.040.1624.2 ± 2.208.0
C-90°0.533 ± 0.03570.14 ± 2.0729.86 ± 2.070.780.1529.76 ± 2.507.0
R0.497 ± 0.06274.15 ± 2.0125.85 ± 2.01--10.87 ± 3.6110.0
Table 4. Tensile strength properties obtained for the three evaluated directions of the API 5L X42 steel.
IDDirectionDiameterAreaYS LoadYSUltimate LoadUTSElongationRamberg-Osgood Constants
[mm][mm2][kN][MPa][kN][MPa][%]Strength Coefficient K [MPa]Strain Hardening Constant n
This studyL-0°12.57124.1038.38309.2461.06492.0740.16--
12.62125.0936.60292.61762.85502.4238.2--
12.68126.2838.15302.1562.74496.8739.6--
Average12.62 ± 0.06125.15 ± 1.0937.71 ± 0.96301 ± 6.8162.22 ± 1.01497 ± 4.2639.3 ± 0.85150.095
D-45°12.68126.2845.47360.164.53510.9835.92--
12.66125.8846.03365.6964.41511.6837.65--
12.59124.4943.88352.4463.86512.9338.18--
Average12.64 ± 0.04123.3 ± 0.9445.13 ± 1.12359 ± 6.3565.26 ± 0.33512 ± 0.8137.2 ± 0.965240.079
C-90°12.56123.9046.22373.0861.88499.4233.99--
12.49122.5246.82382.1462.53510.3934.5--
12.54123.5146.84379.2662.32504.5635.53--
Average12.53 ± 0.04123.31 ± 0.7146.62 ± 0.35378 ± 3.7762.24 ± 0.33505 ± 4.4834.7 ± 0.65160.066
Spec.API 5L X42- -Min. 290-Min. 414Min. 22--
Table 5. Tensile and hardness properties of API 5L X42 steel.
IDDirectionYS
[MPa]
UTS
[MPa]
Elongation
[%]
Hardness
[HRBW]
This studyL-0°301 ± 8.13497 ± 5.1739.2 ± 0.883 ± 2
D-45°359 ± 6.35512 ± 0.6337.2 ± 0.879 ± 1
C-90°378 ± 4.53505 ± 5.4934.7 ± 0.682 ± 1
X42 [12]L-0°287-35.9-
D-30°295-35.1-
D-60°306-29.5-
C-90°301-15.5-
X46 [25]L-0°340 ± 5505 ± 935.4 ± 0.883
D-45°397 ± 4517 ± 834.9 ± 0.584
C-90°428 ± 10532 ± 1231.7 ± 0.783
X52 [44]L-0°39047331-
C-90°44053634-
X70 [23]L-0°528 ± 17631 ± 5--
C-90°581 ± 2657 ± 5--
X80 [23]L-0°572 ± 9691 ± 317.1 ± 1.2-
D-45°582 ± 13667 ± 619.7 ± 0.5-
C-90°633 ± 8722 ± 415.8 ± 1.5-
X80 [13]L-0°601 ± 35676 ± 413 ± 2-
D-45°600 ± 35663 ± 1016 ± 2-
C-90°634 ± 29707 ± 1615 ± 1-
Spec.API 5L X42Min. 290Min. 414Min. 22-
Table 6. Linearized fatigue life parameters of the API 5L X42 steel in the tested directions.
DirectionBA [MPa]
C-90°−0.0714704
D-45°−0.0926868
L-0°−0.12401195
Hong et al. [45]−0.0606593
Table 7. Normalized properties of the API 5L X42.
Linear Fatigue Life Parameters at 95% ConfidenceSpecimen Direction
L-0°D-45°C-90°
B(θ)/B(C-90°)1.7361.2971.0
YS(θ)/YS(C-90°)0.7960.9401.0
Ai(θ)/Ai(C-90°)2.1031.3331.0
Ω12(θ)/Ω12(C-90)1.8671.0671.0
Disclaimer/Publisher’s Note: The statements, opinions and data contained in all publications are solely those of the individual author(s) and contributor(s) and not of MDPI and/or the editor(s). MDPI and/or the editor(s) disclaim responsibility for any injury to people or property resulting from any ideas, methods, instructions or products referred to in the content.