Article

Insight into Y Content on Microstructure and Mechanical Properties of Mg-Gd-Y-Zr Alloy

1
National Engineering Research Center for Magnesium Alloys, National Key Laboratory of Advanced Casting Technologies, College of Materials Science and Engineering, Chongqing University, Chongqing 400044, China
2
Qinghai Salt Lake Teli Magnesium Co., Ltd., Xining 810000, China
3
Zhejiang Wanfeng Precision Casting Co., Ltd., Shaoxing 312000, China
*
Authors to whom correspondence should be addressed.
Materials 2025, 18(11), 2475; https://doi.org/10.3390/ma18112475
Submission received: 15 April 2025 / Revised: 16 May 2025 / Accepted: 22 May 2025 / Published: 25 May 2025
(This article belongs to the Section Metals and Alloys)

Abstract

This paper investigates the effects of Y content on the microstructure and mechanical properties of Mg-9Gd-xY-0.5Zr alloys. The mechanical properties, together with the grain size, first increase and then decrease, exhibiting a non-monotonous change with the increase in Y content. The alloy with 3 wt.% Y exhibits the best mechanical properties compared to the Y free alloy, with an increase in ultimate tensile strength and yield strength of 33.4% and 19.2%, respectively. However, further increase in the Y content (5 wt.%) does not enhance the strength but promotes the growth of the Mg5(Gd,Y), becoming nucleation points and propagation paths for cracks, leading to a decrease in performance. The cubic phase REH2 and oxide are not the reasons for the poor ductility in as-cast Mg-9Gd-xY-0.5Zr alloys due to low content, and the crystallographic orientation relationship between REH2 and α-Mg is (220)REH2//(11 2 ¯ 0)Mg, and the interface mismatch is 9.13%. This paper systematically prepares and investigates the high-strength as-cast Mg-Gd-Y-Zr alloy, which has important guiding significance.

1. Introduction

The use of magnesium (Mg) alloys in automobile and aircraft components has sparked intense interest due to low density, good electromagnetic shielding, and machining ability [1,2,3,4,5]. Widening the application of Mg alloys is crucial to alleviating the energy crisis and reducing carbon emissions [6,7,8,9]. However, Mg alloys have relatively low absolute strength and poor formability [10,11,12]. Extensive research and development efforts have been devoted to enhancing their mechanical strength [13,14,15], formability [16], and creep resistance [17] through utilizing strengthening theory such as grain refinement [18], aging hardening [19,20], composite strengthening [21,22], and texture strengthening [23].
In addition to the above ways, alloying is a widely used and proven technique to enhance the mechanical properties of Mg alloys [24]. Adding RE to Mg alloys can improve casting performance and high-temperature properties, increase fluidity, purify the melt, and produce stronger precipitation and dispersion strengthening effects [25,26]. Adding Y to Mg alloys can reduce the solid-liquid interface tension and the nucleation energy, and hinder grain growth by forming rich-Y phases with high melting points. Hu et al. [27] found that adding Y to the Mg-6Zn-1Mn-4Sn alloy can form the MgSnY phase, refine grains, and enhance comprehensive mechanical properties. Additionally, adding Zr can refine grains by increasing nucleation points of α-Mg [28]. Wei et al. [29] prepare Mg-8Gd-3Y-0.5Zr alloy by extrusion, predeformation, and aging; the synergistic effect of nano-precipitates and bimodal microstructure simultaneously enhances strength and ductility.
The as-cast Mg-Gd-Y-Zr alloys exhibit poor strength during room temperature deformation. The as-cast Mg-15Gd-5Y-0.5Zr alloy with a high rare earth (RE) content achieved UTS and YS of 247 MPa and 193 MPa, respectively, but the EL is only 0.8% [30]. Jiang et al. [31] prepare alloys such as GW133K, GW123K, GW103K, and GW93K using the steel mold of bottom gating type, and the optimal UTS, YS, and EL are 251 MPa, 209 MPa, and 0.47%, respectively. The sand-cast Mg-9Gd-4Y-0.5Zr exhibits lower UTS and EL, only reaching 200 MPa and 2.2%, respectively [32]. Although Mg-Gd-Y-Zr alloys have been extensively investigated; however, there is limited systematic research on the RE hydrides, oxidation tendencies, defects, and mechanical properties in as-cast Mg-Gd-Y-Zr alloys.
This paper will analyze the impact of Y content on Mg-Gd-Y-Zr alloys by delving into the relationships between the second phases, defects, and properties, providing ideas and guidance for the composition design, organizational optimization, and performance improvement. This paper systematically explains the influence mechanisms of Y addition on the strengthening and fracture mechanisms of as-cast Mg-Gd-Y-Zr alloys and reveals the impact of Y content on the microstructure and properties of as-cast Mg-Gd-Y-Zr alloys.

2. Experiments

The Mg-9Gd-xY-0.5Zr (x = 0, 1, 3, 5 wt.%) alloys are prepared by melting pure Mg, Mg-30Gd, Mg-30Y, and Mg-30Zr master alloys in an electric resistance furnace under the protection of an atmosphere composed of SF6 (1 vol%) and CO2 (99 vol%). Mg-30Gd and Mg-30Y are added to the Mg melt at 740 °C. and Mg-Zr is added at 780 °C. After all the master alloys are melted, the melt is stirred for 5 min and then allowed to settle for 30 min, subsequently, cool the melt to 740 °C, and finally, the melt is poured into a mold that is preheated to 200 °C. The diameter of the as-cast cylindrical ingot is 80 mm. For the sake of convenience, the designed four alloys are denoted as 9Gd, 9Gd-1Y, 9Gd-3Y, and 9Gd-5Y, respectively. Table 1 shows the actual chemical compositions of the Mg-9Gd-xY-0.5Zr alloys.
The microstructure is examined using scanning electron microscopy (SEM, TESCAN VEGA 3 LMH SEM, Tokyo, Japan). The second phases are analyzed by SEM equipped with a backscattered electron spectrometer (BSE) and energy-dispersive spectrometer (EDS) detector. The grain size of alloys with different Y contents is statistically analyzed using electron backscatter diffraction (EBSD, JEOL JSM-7800 F, Tokyo, Japan). The phase constitutions are detected by an X-ray diffractometer (XRD, Rigaku SmartLab, Japan). The microstructure is analyzed in depth using transmission electron microscopy (TEM, FEI Talos F200X, Thermo Fisher Scientific, Waltham, MA, USA). The area fraction of the second phase is evaluated using Image-Pro Plus 6.0 software. The oxidation tendency of different elements is calculated by HSC Chemistry 6.0 software.
As shown in Figure 1a, to ensure the consistency of the data, the observation location of the microstructure for the alloys is all at the 1/2 radius. The universal testing machine is CMT6305-300 KN (SUST, Shenzhen, China), and the strain rate is 1 mm/min. The tensile specimens (18 mm × 4 mm × 2.2 mm) are cut on the 1/2 radius of the cylindrical ingot, each sample is measured 3 times, and an error bar is added.

3. Results

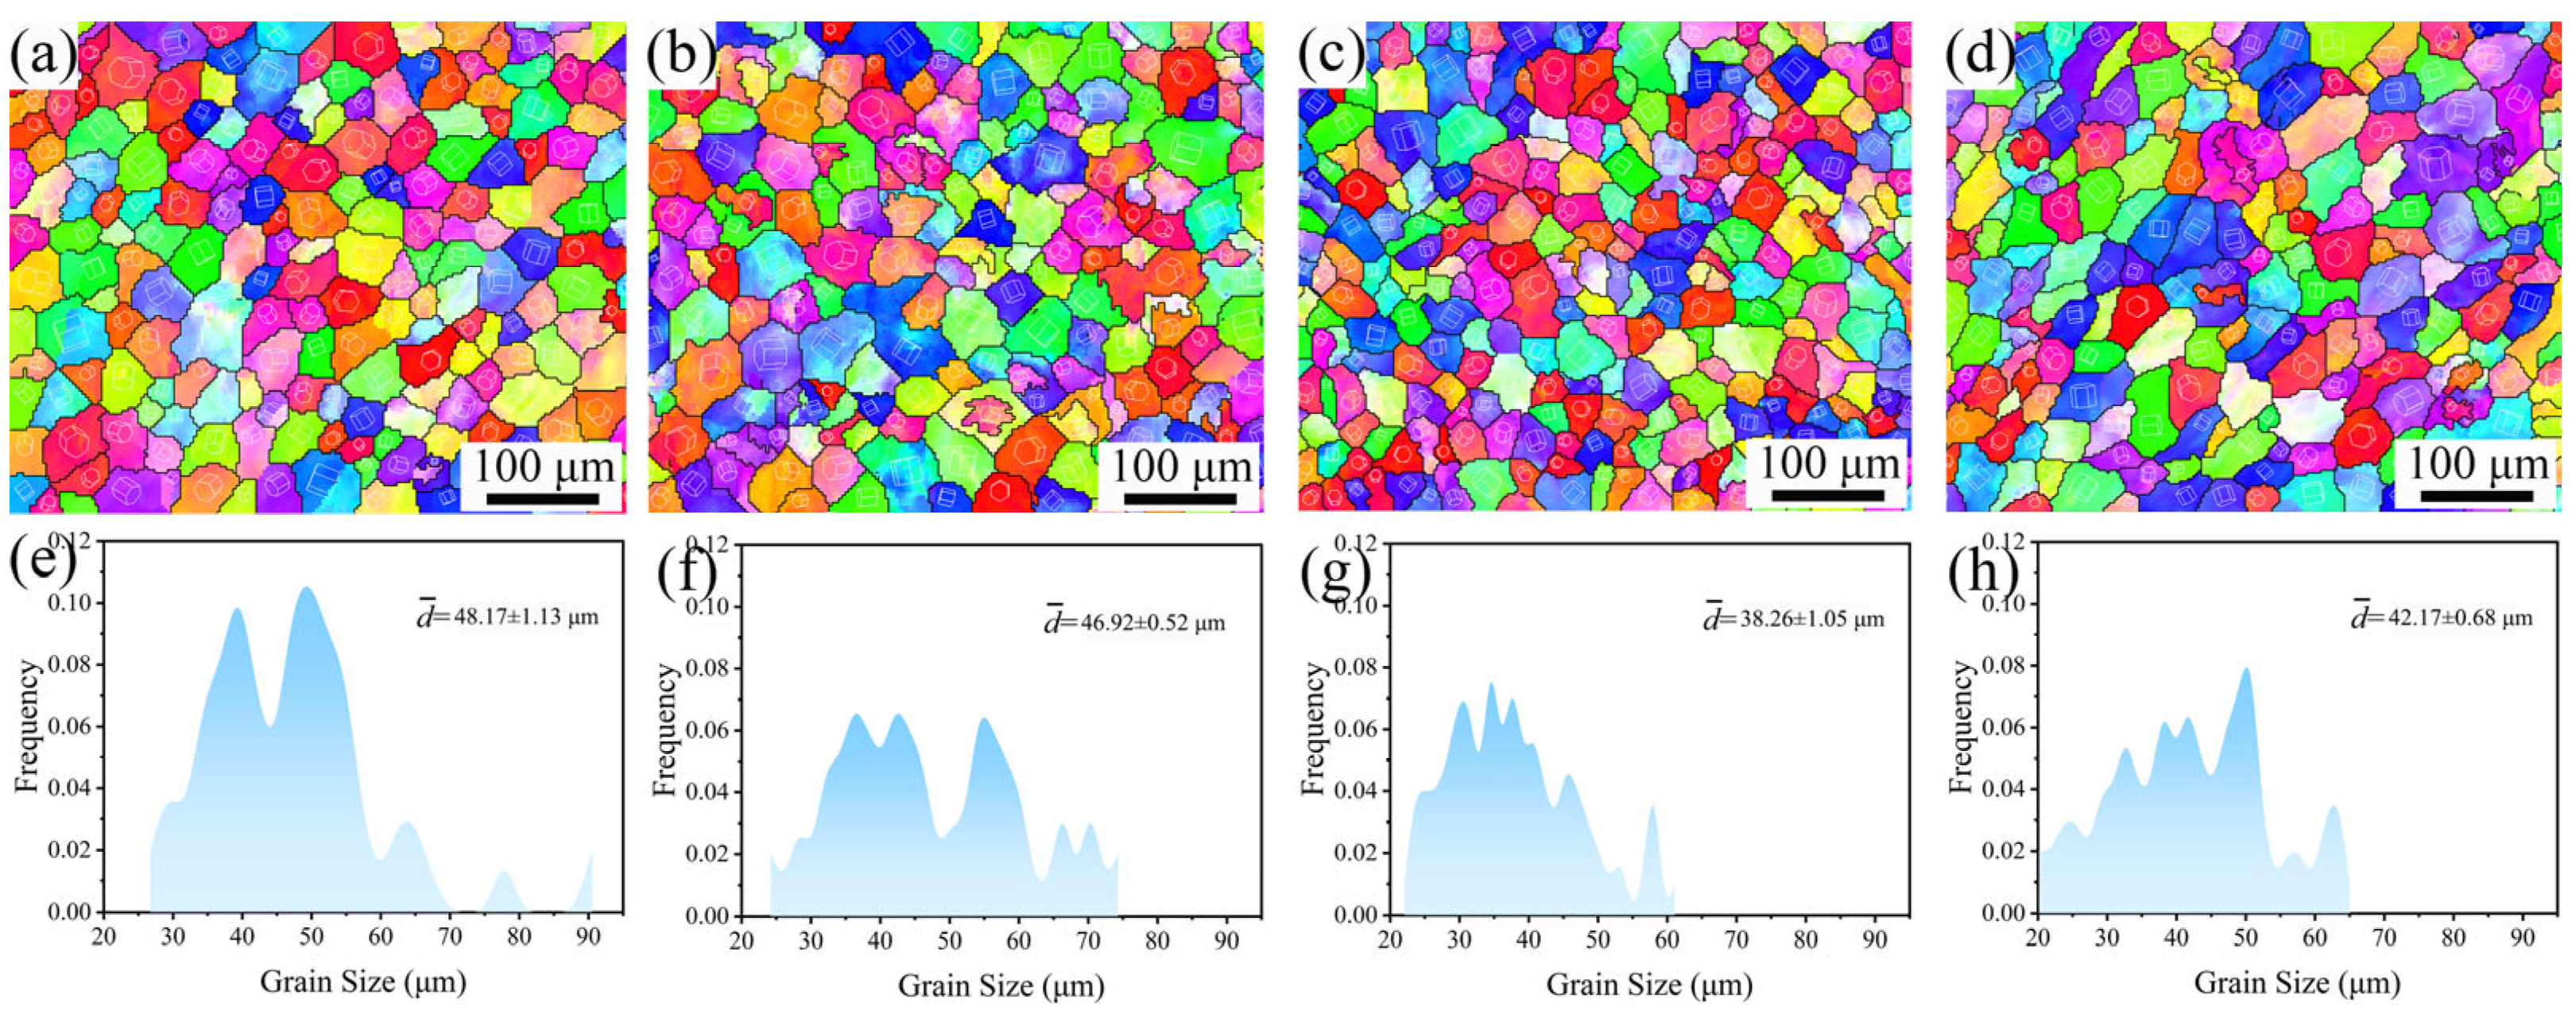
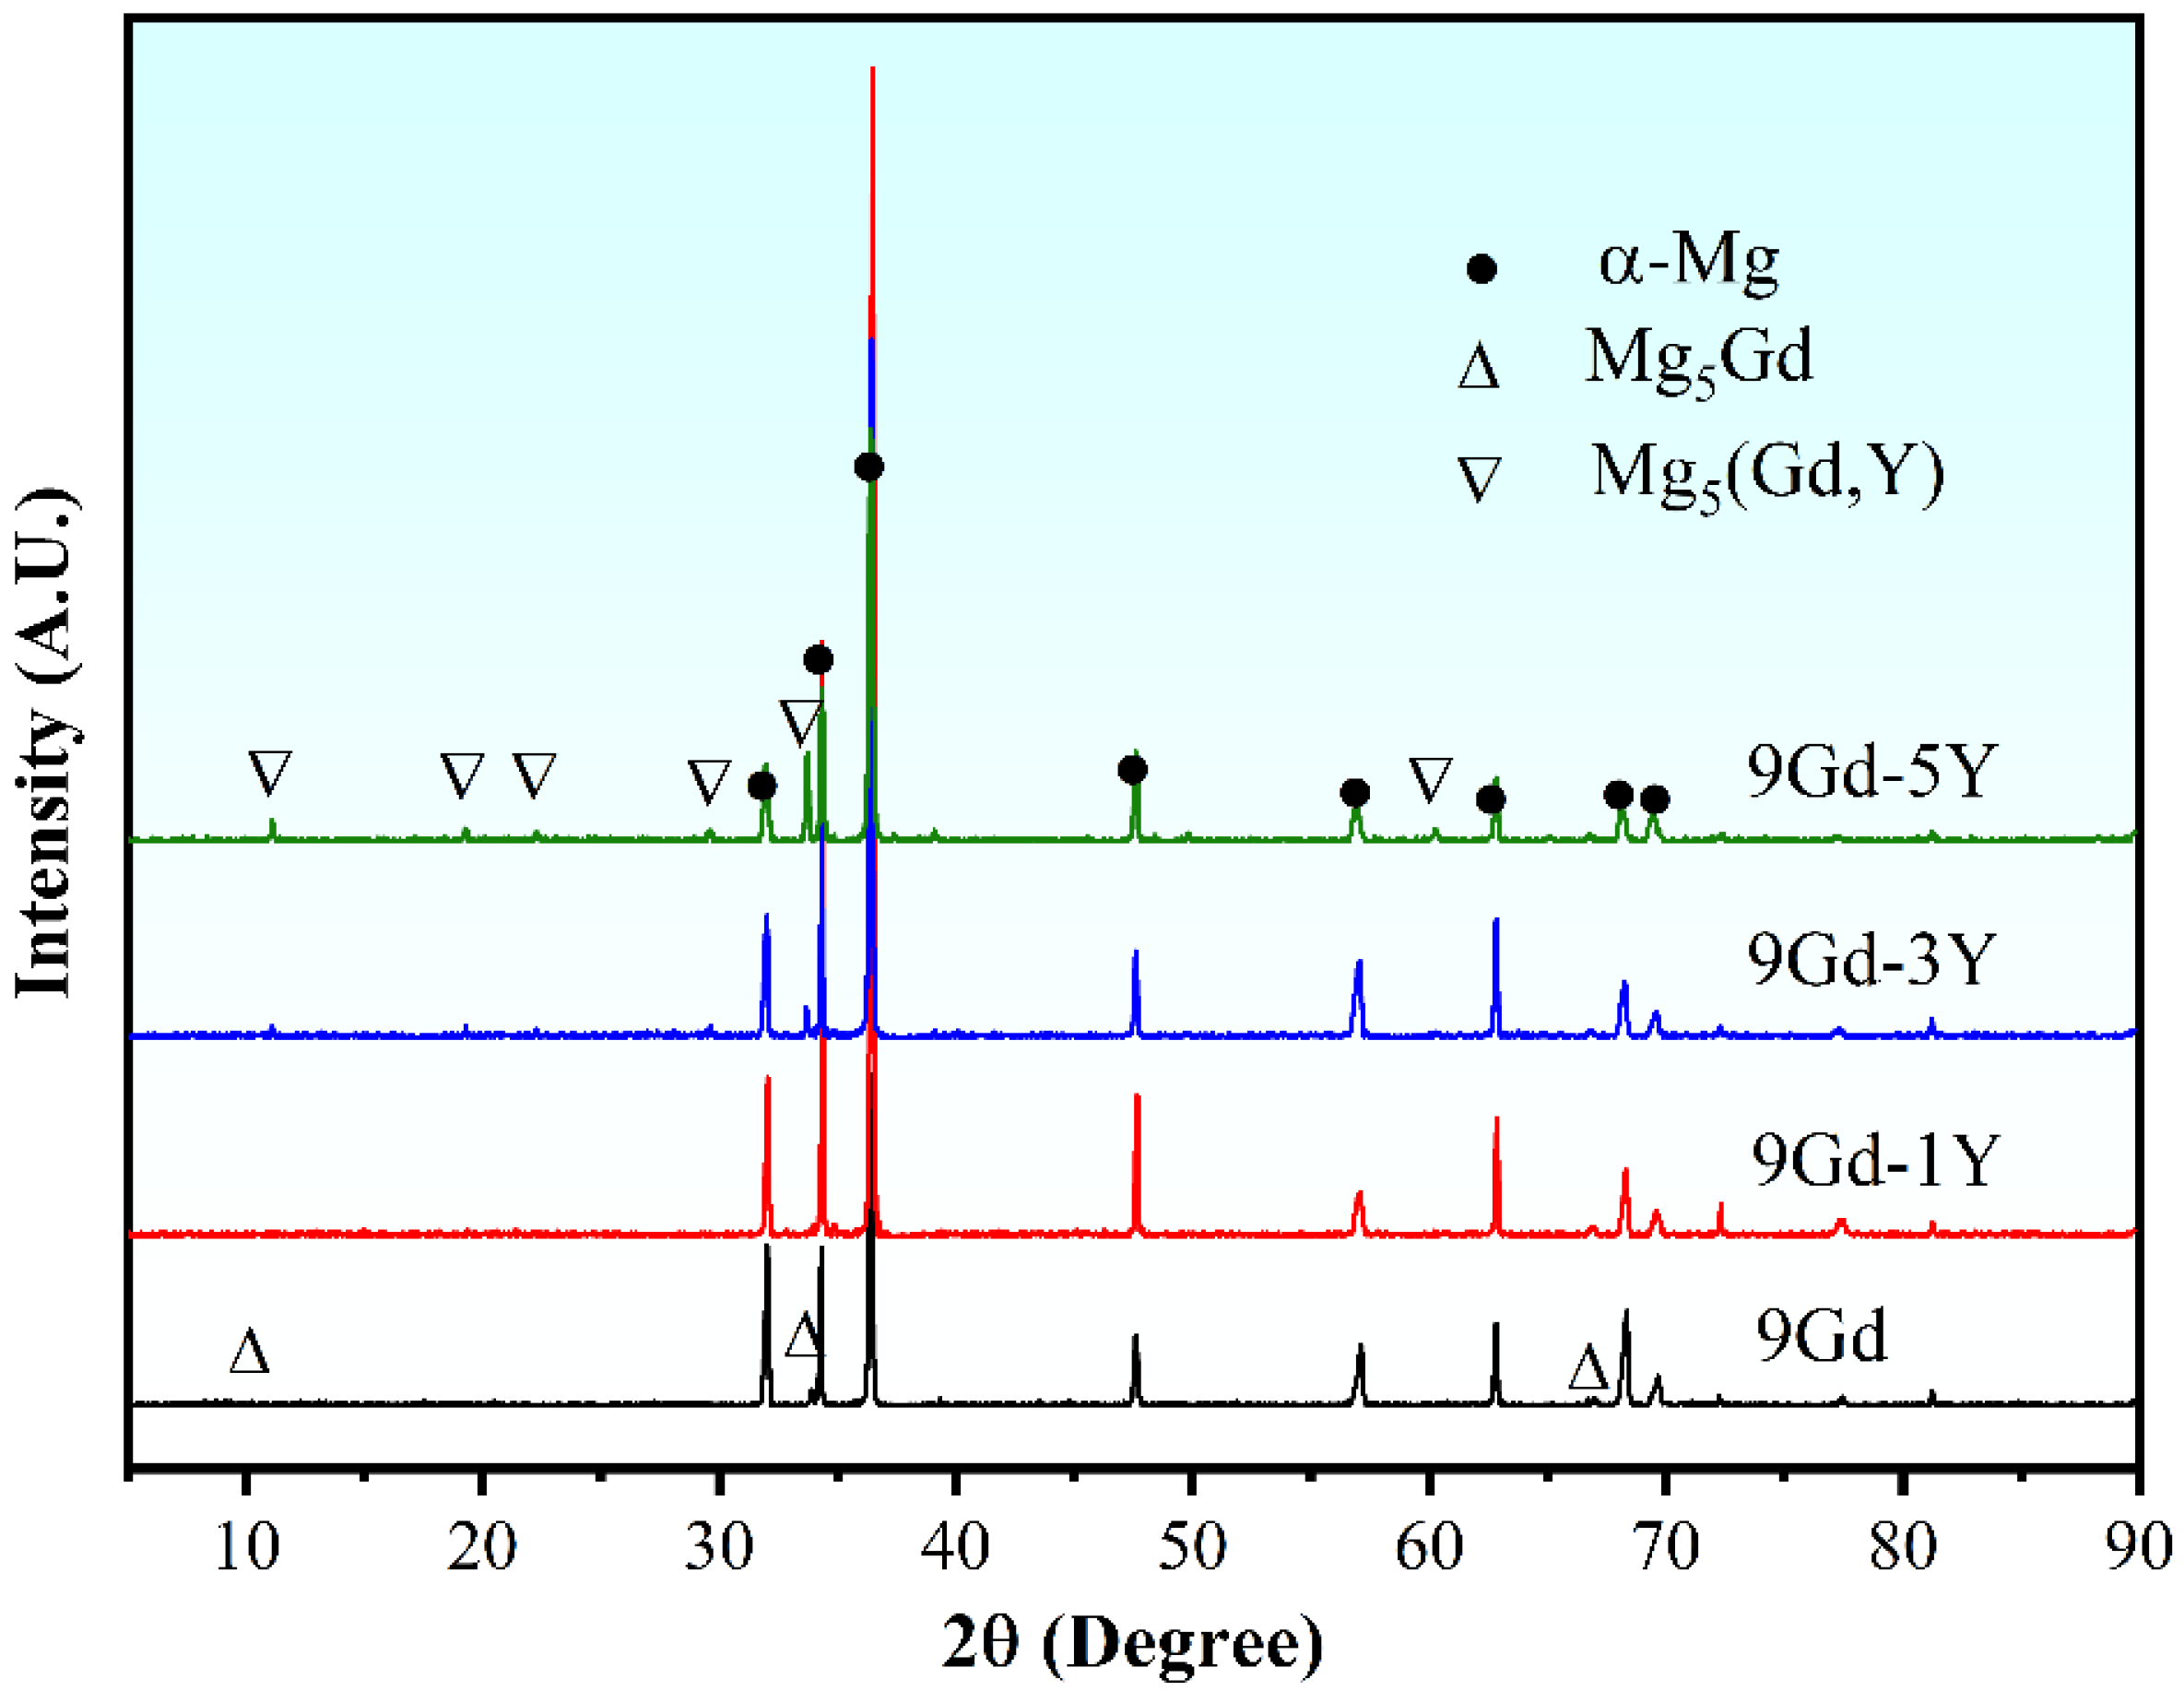
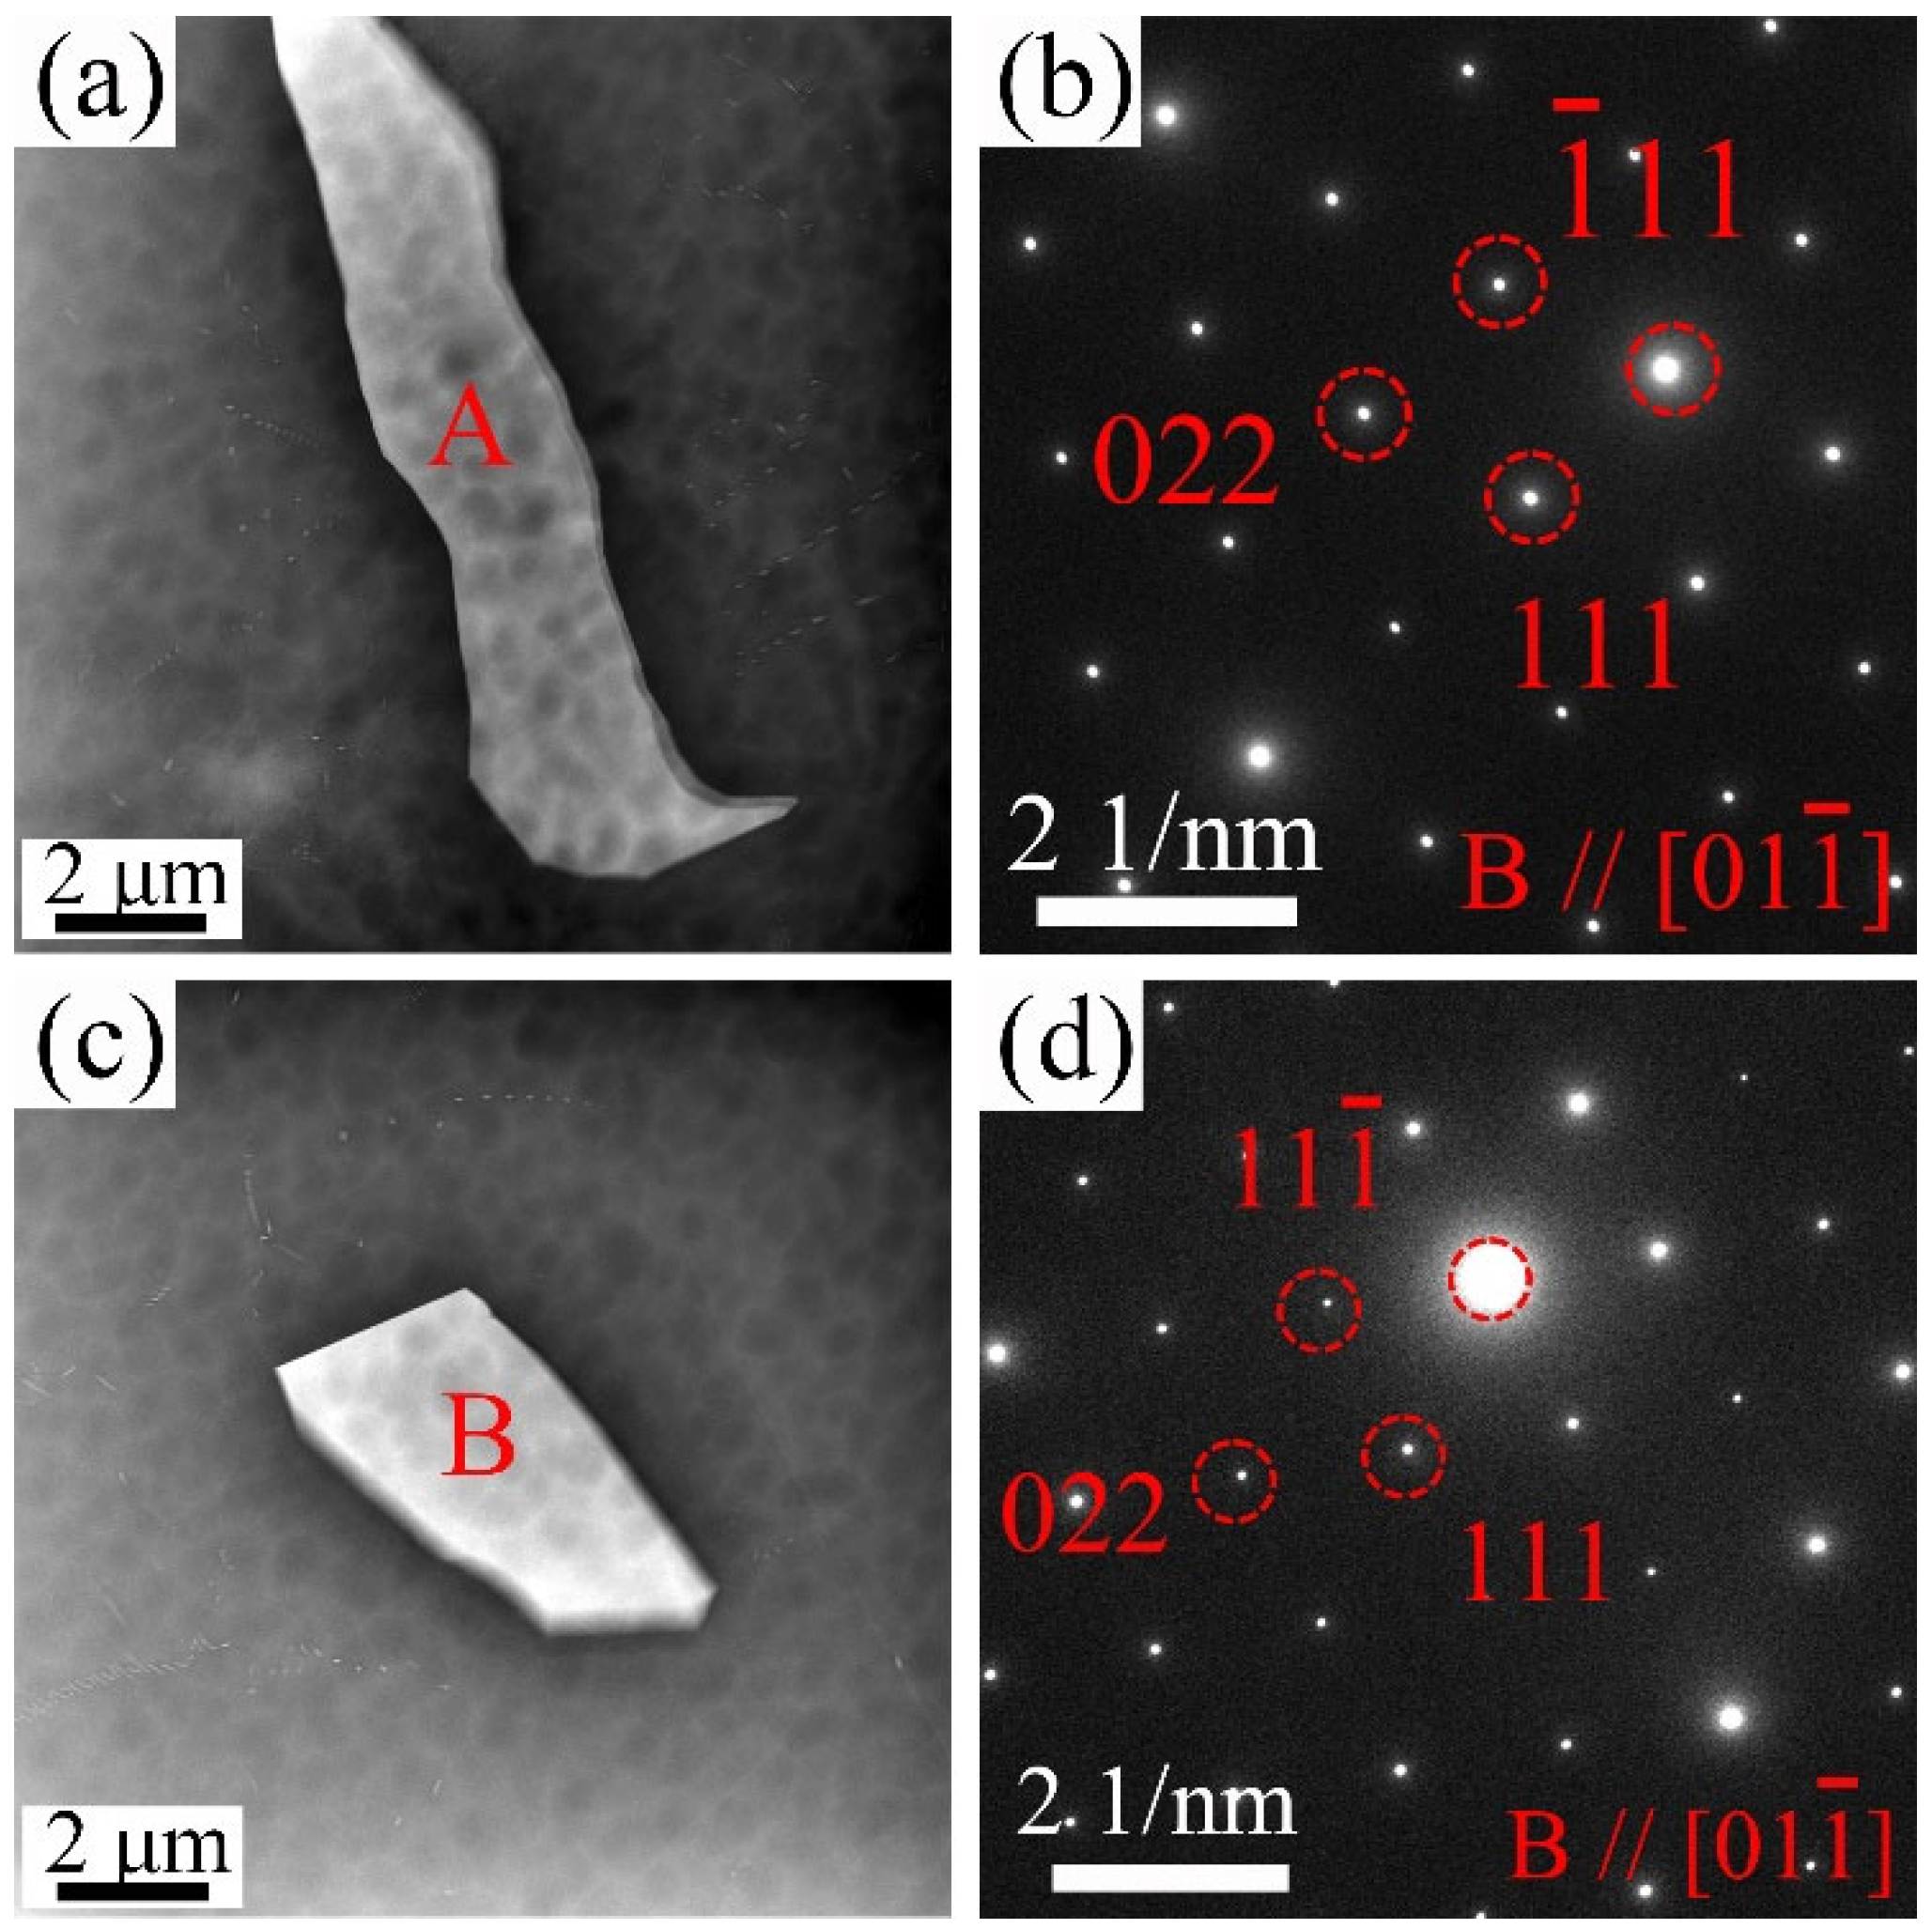
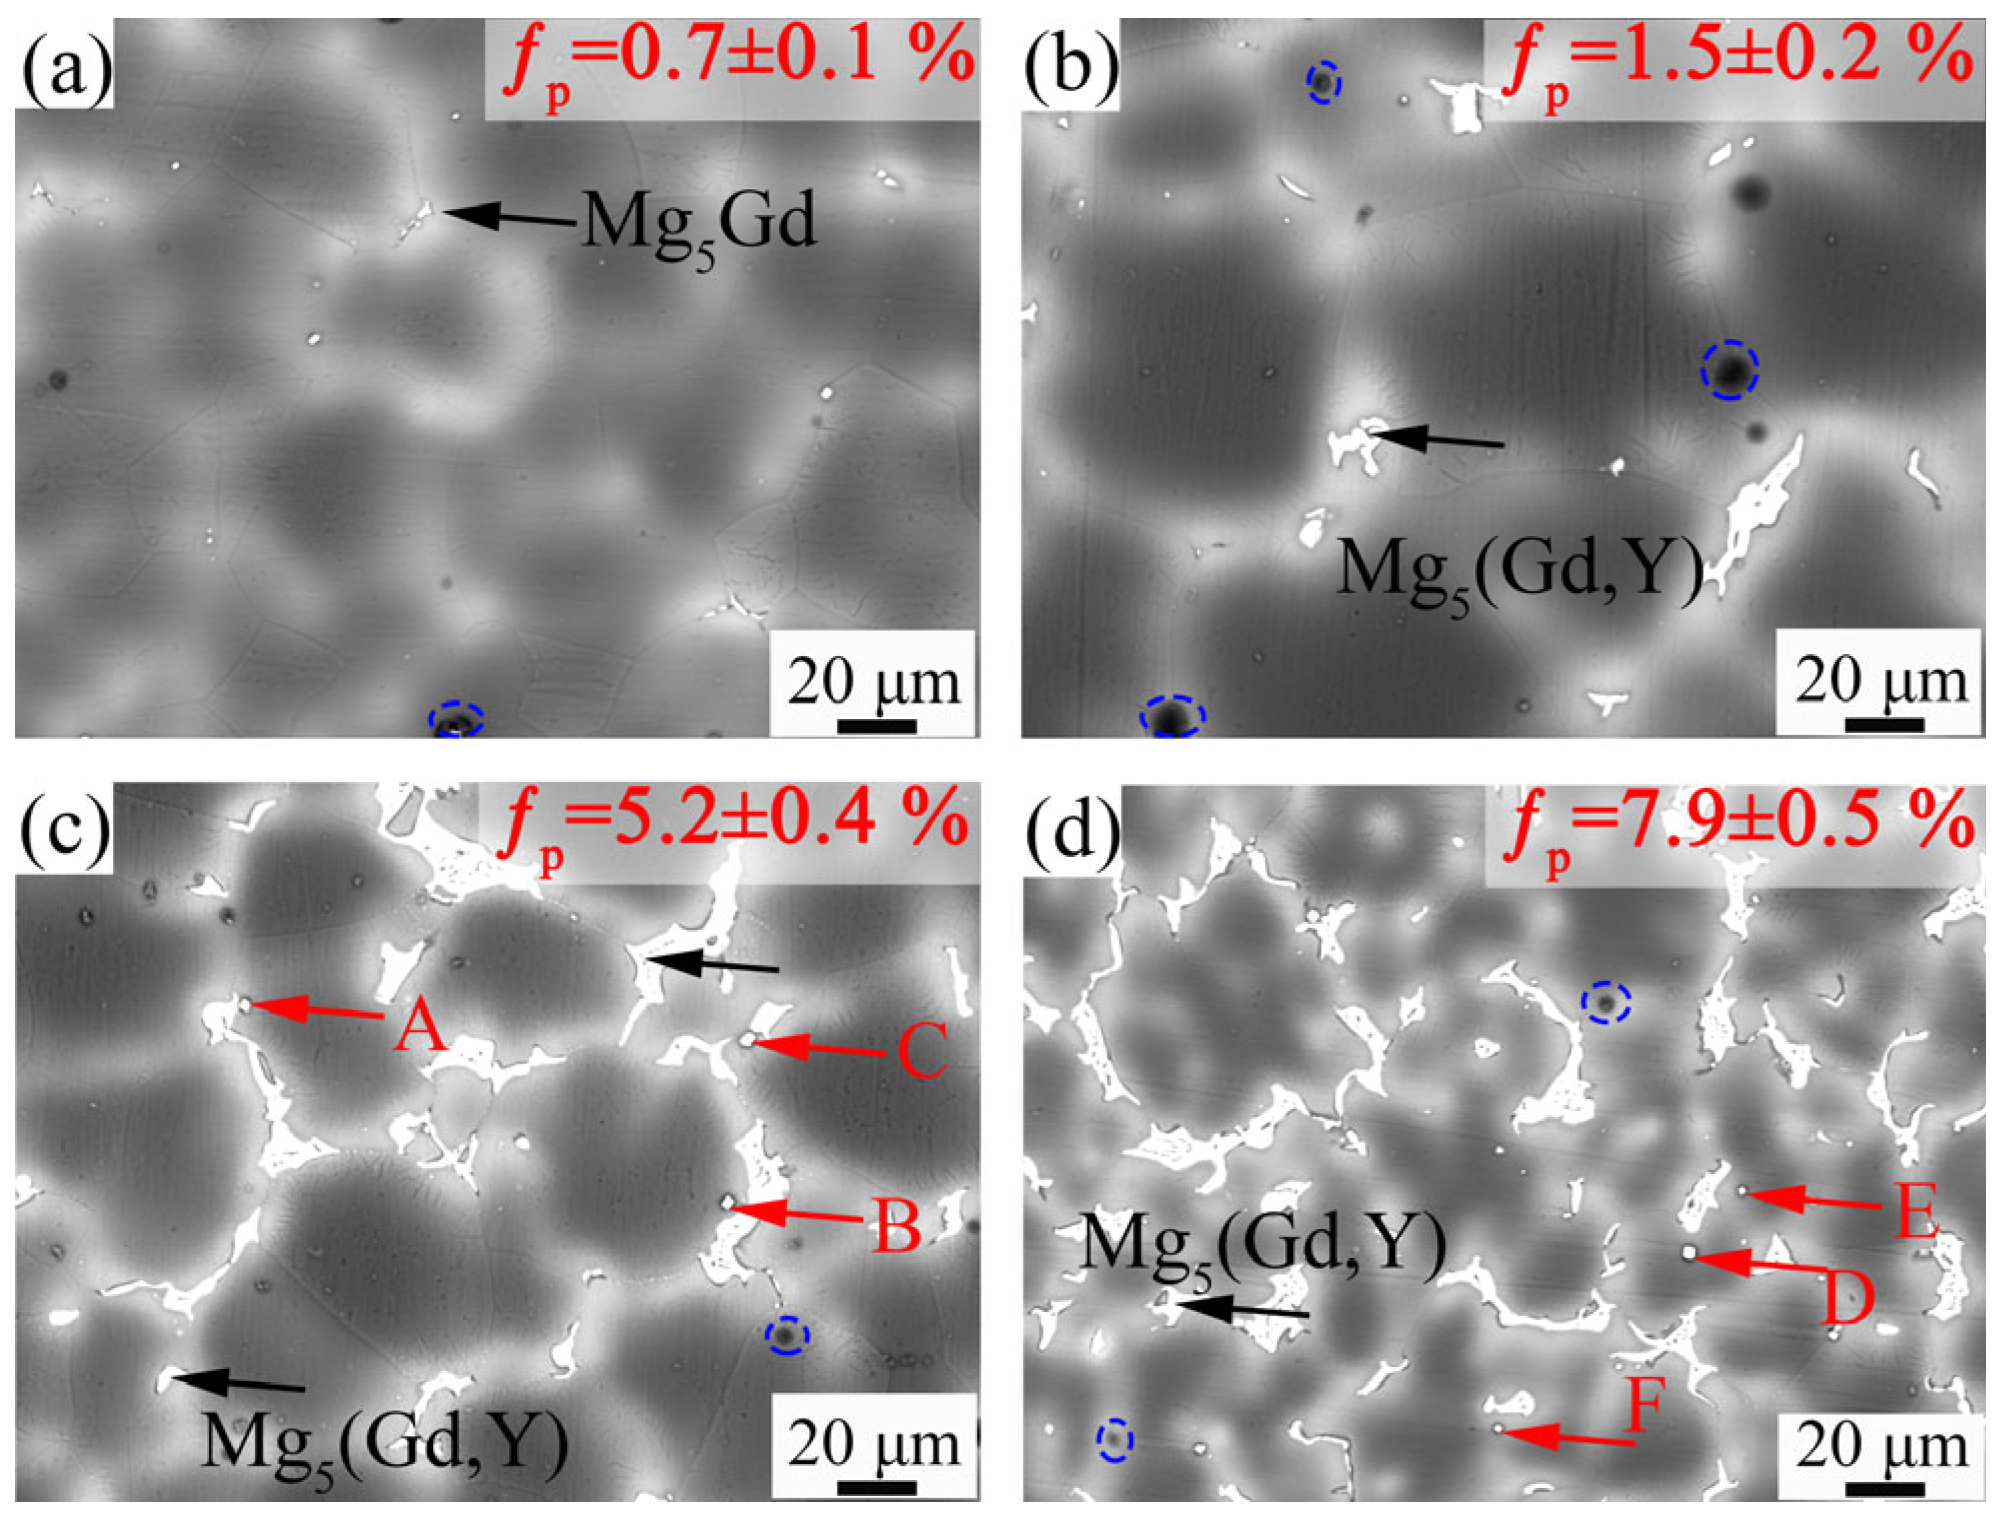
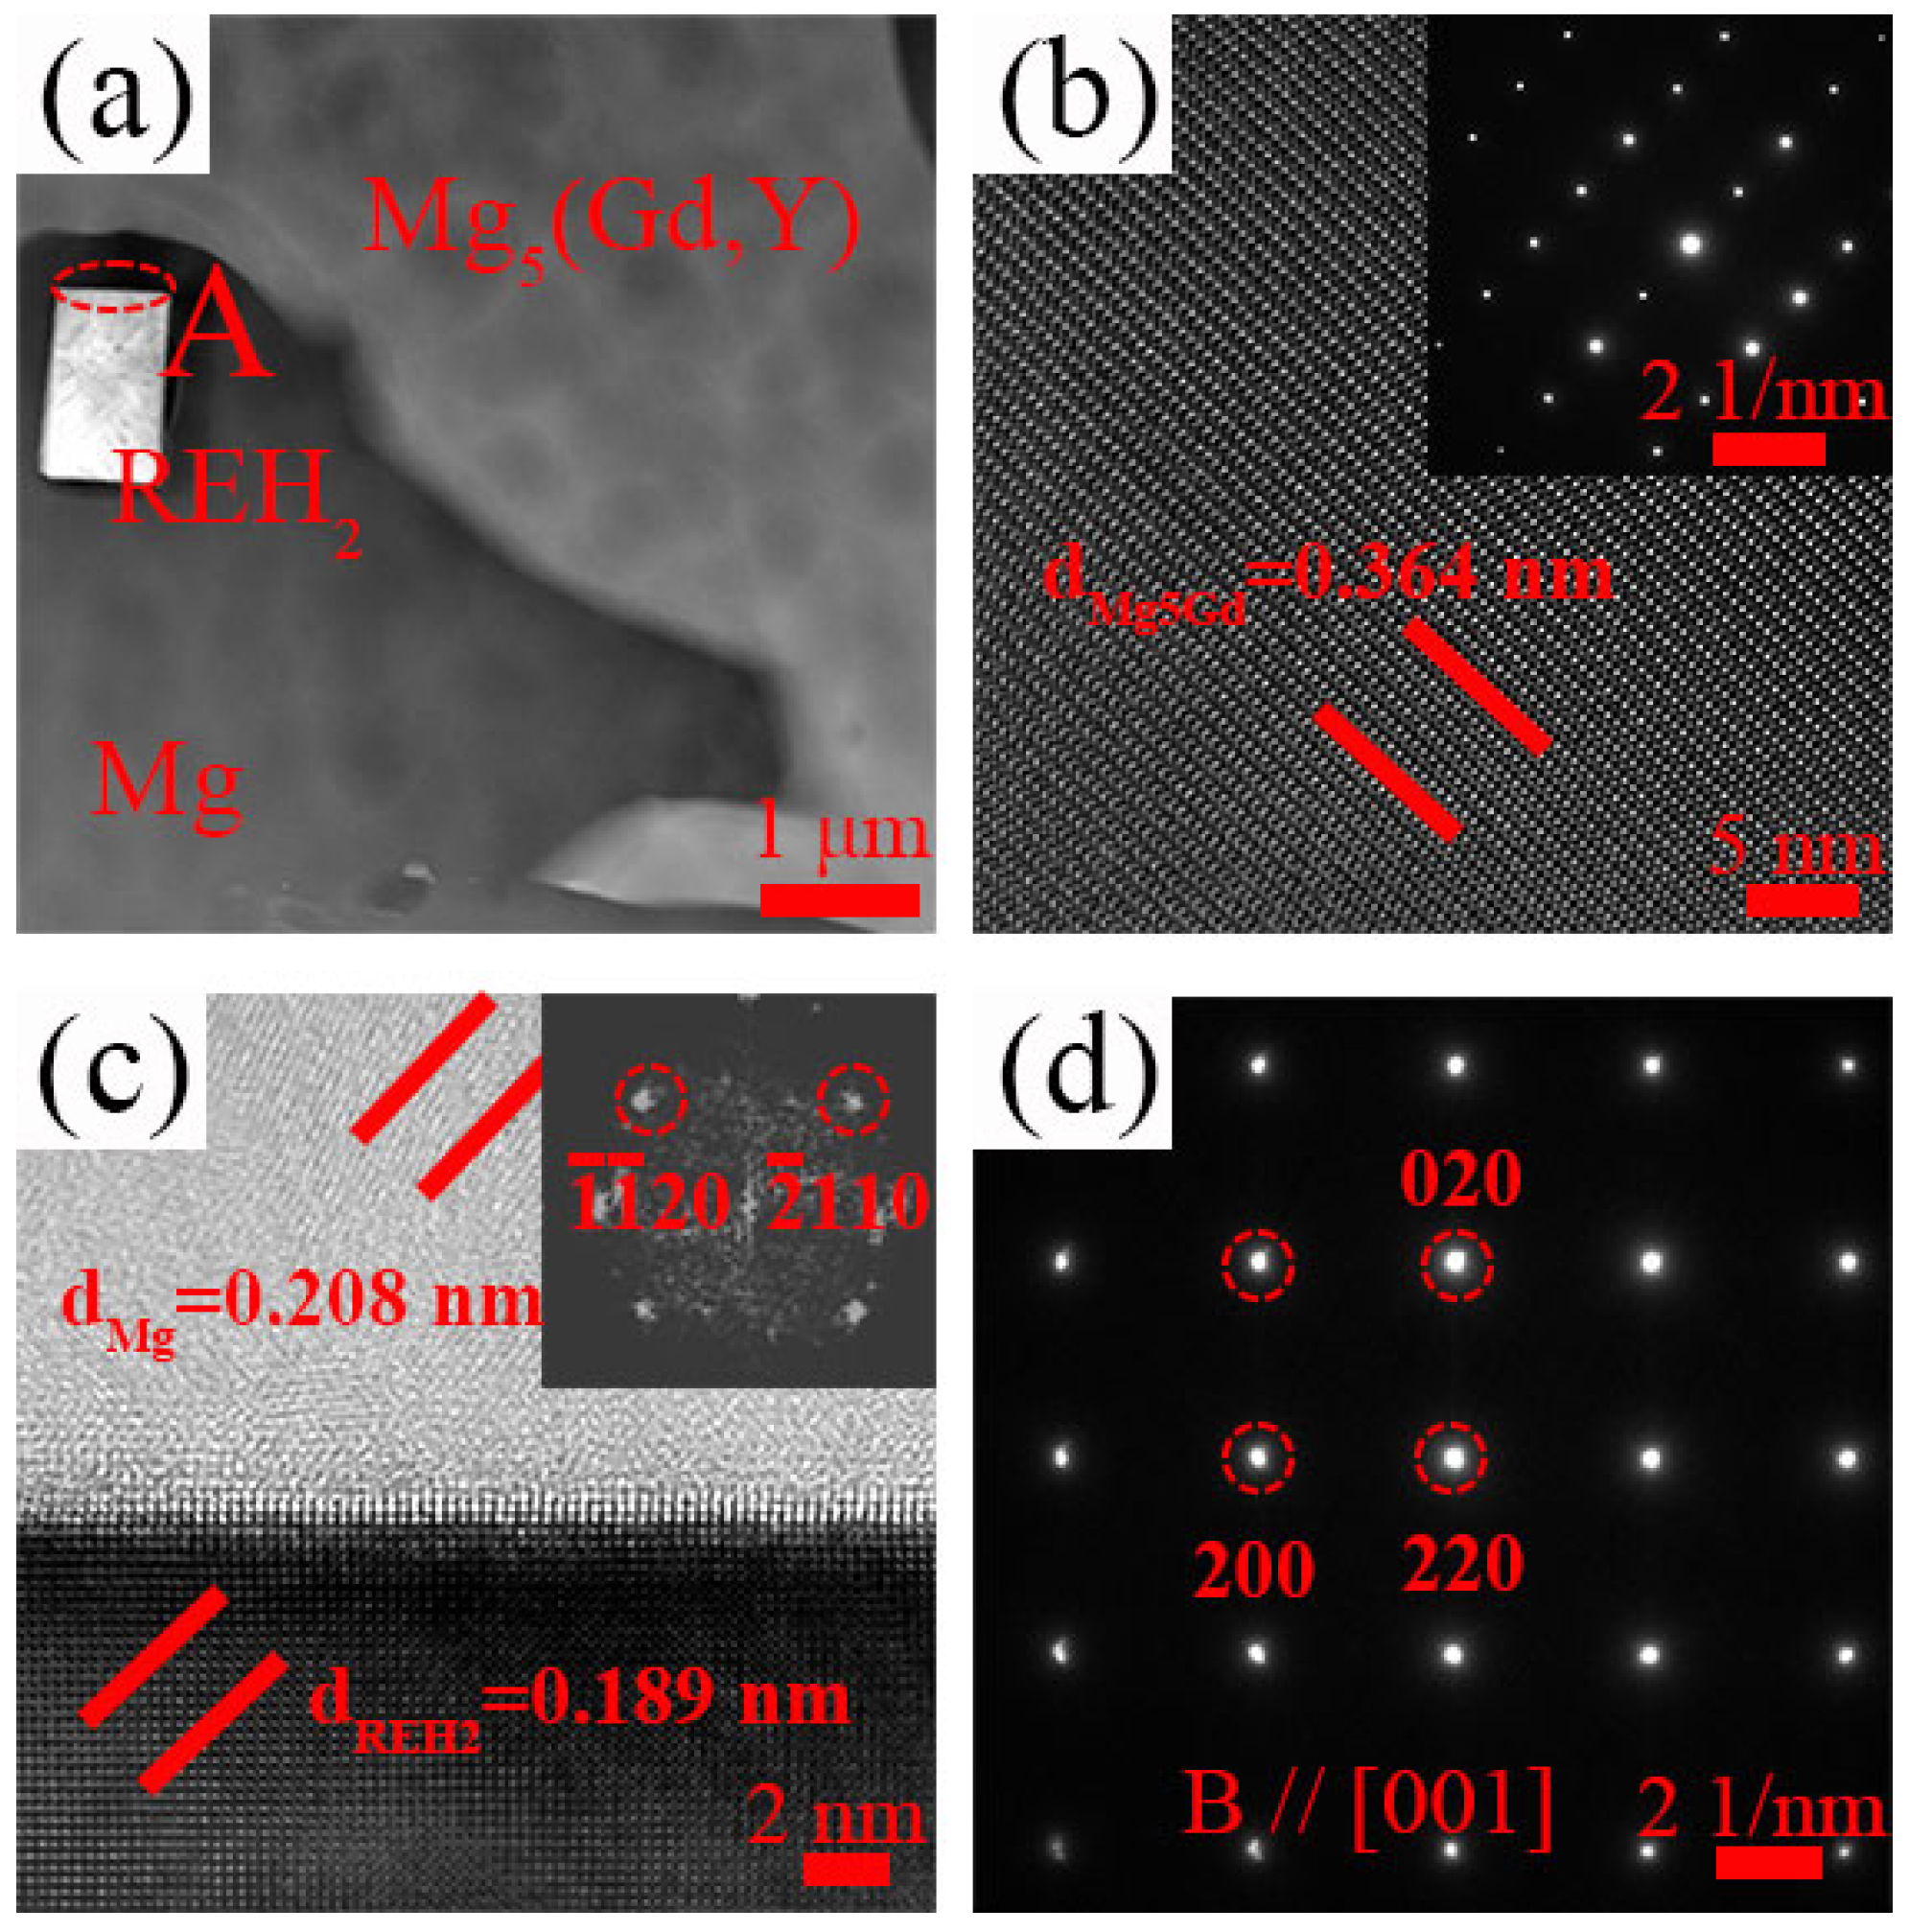
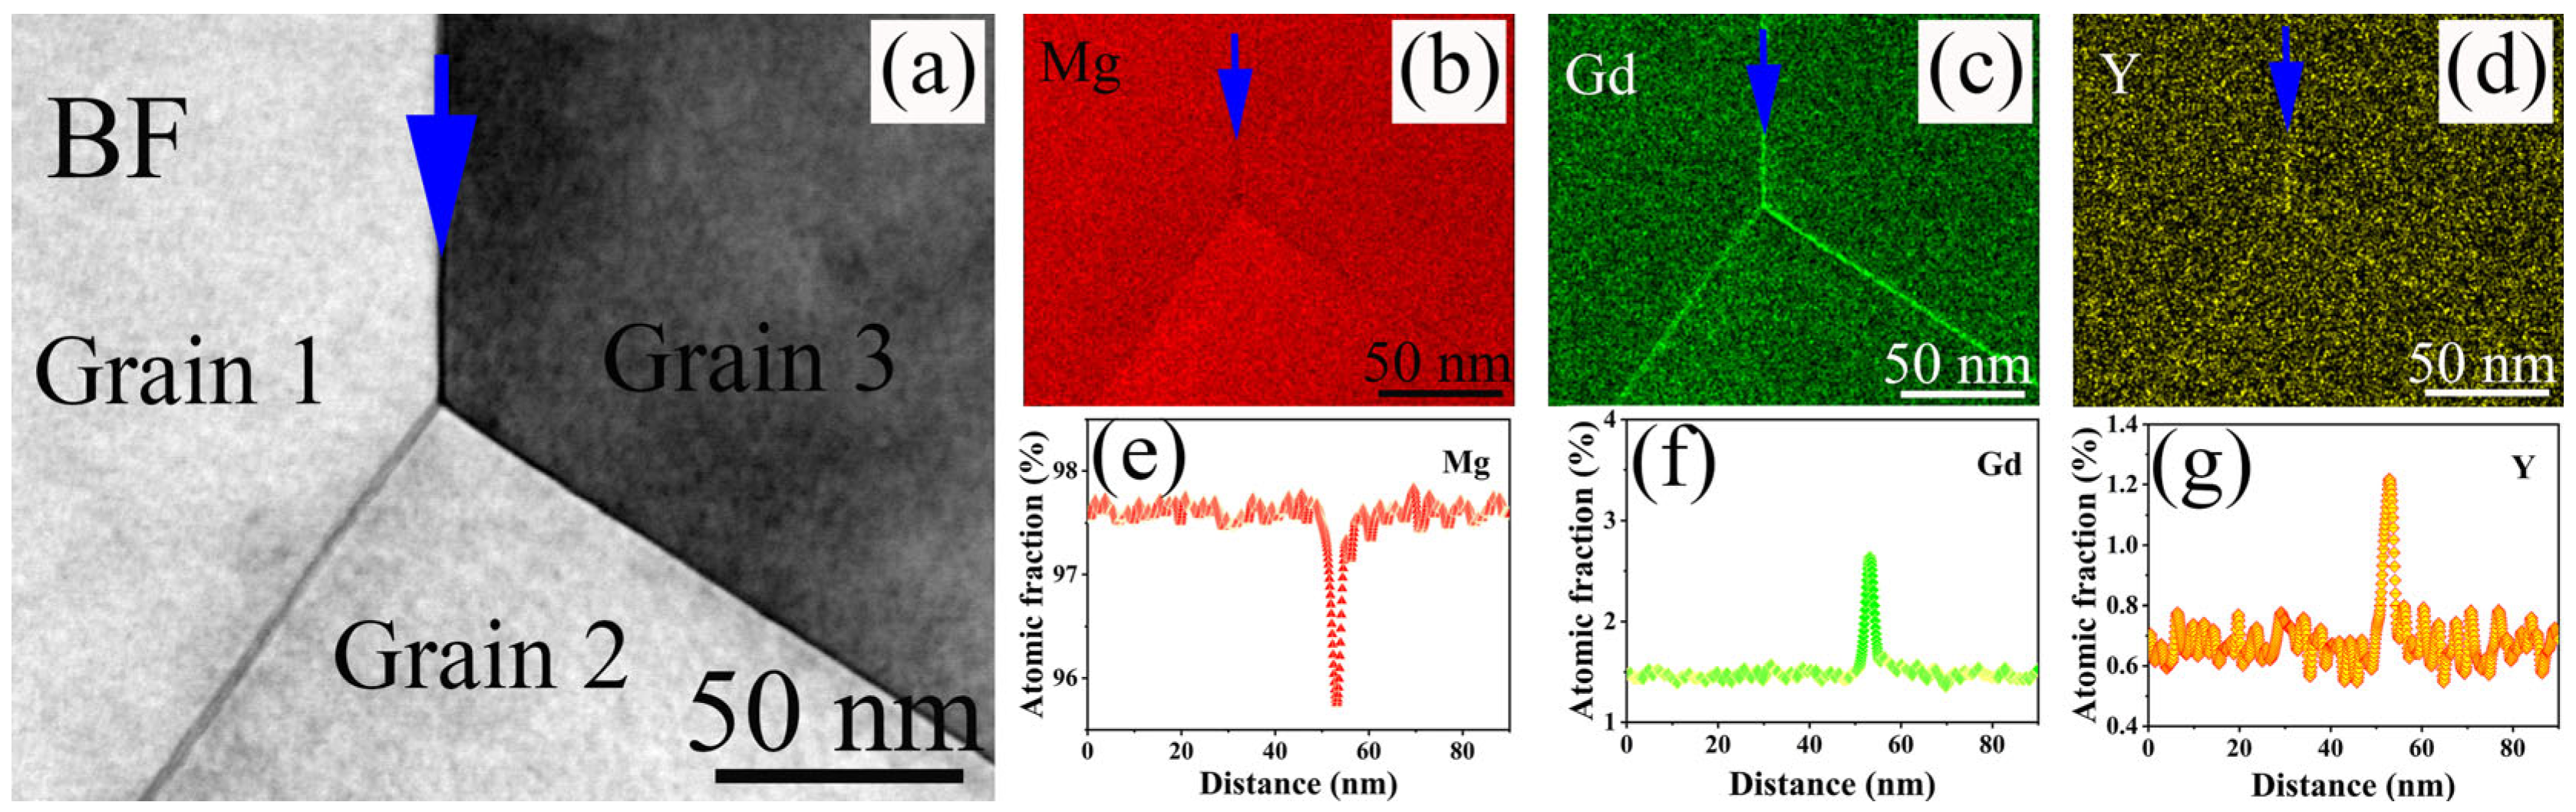
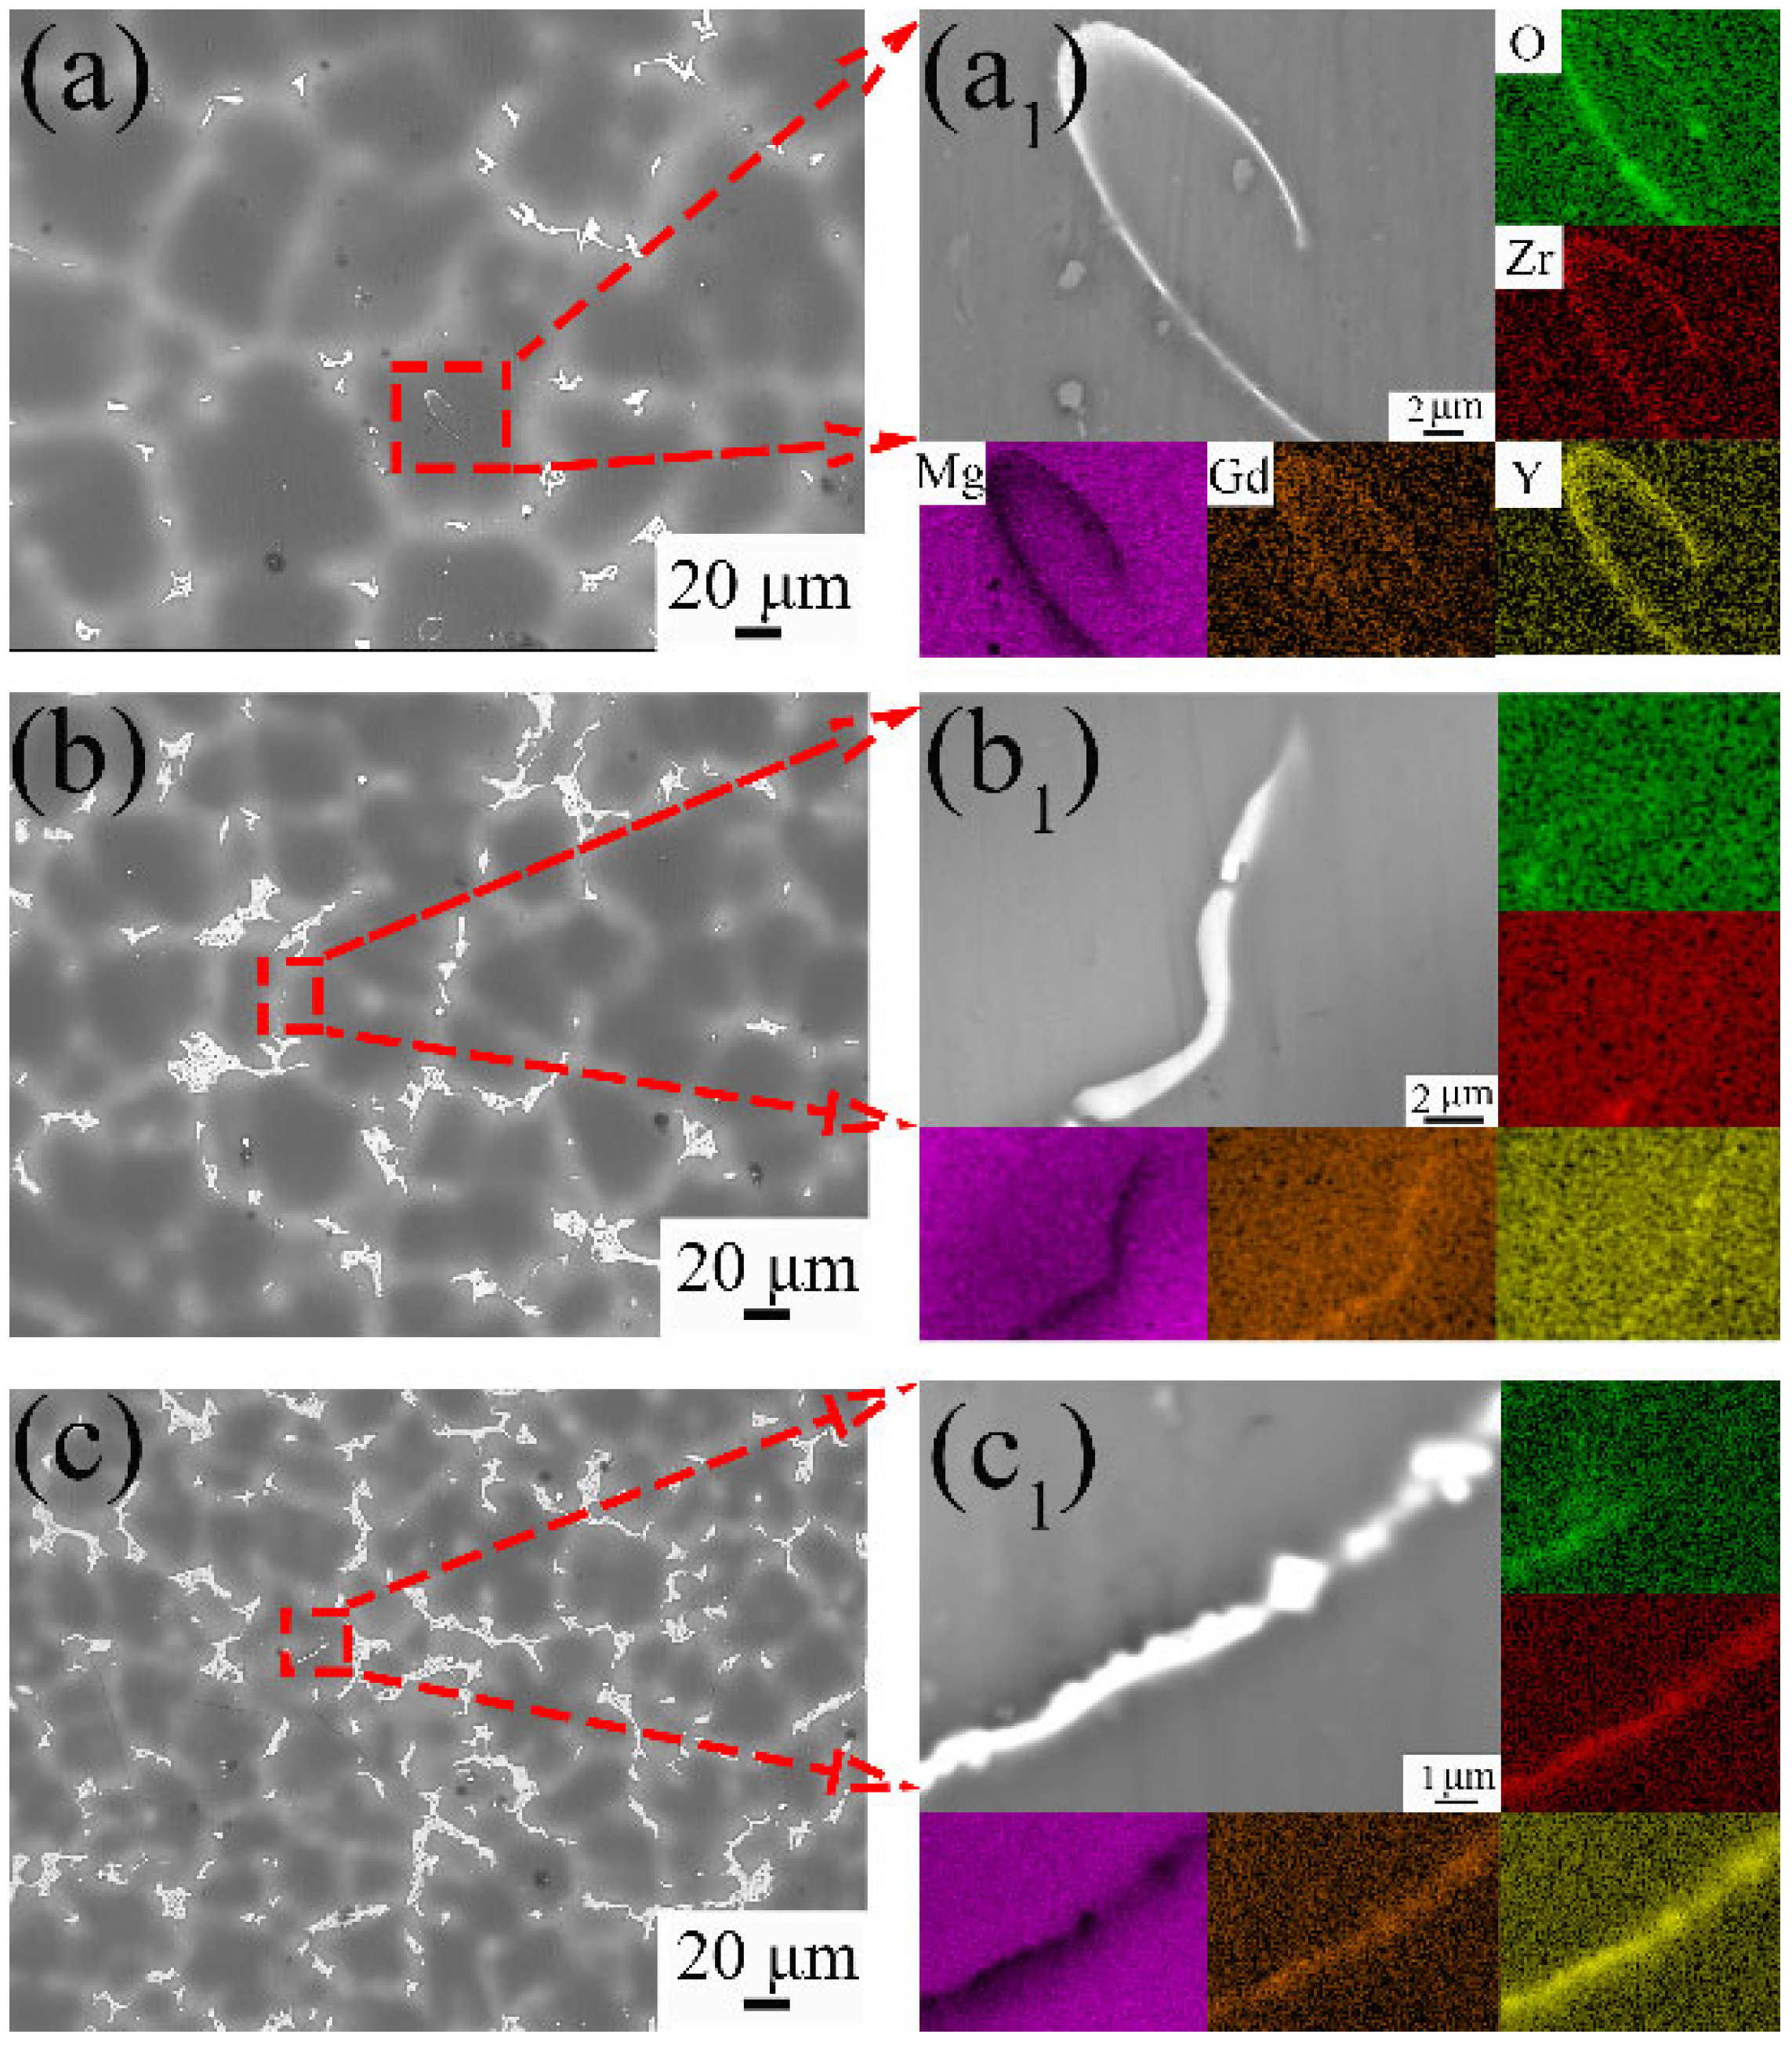
3.1. Microstructure Evolution

Figure 1b–d shows the BSE-SEM images of the 9Gd alloy at the edge, 1/2 radius, and center. The second phase is mainly Mg5Gd, which have various shapes and mainly appear as blocky and skeletal. The type of the second phase in different regions remains essentially unchanged. The area fraction of the Mg5Gd increases with the decrease in cooling rate, e.g., increasing from 0.6 ± 0.1% at the edge to 1.6 ± 0.2% at the center, indicating that the precipitation and growth of the Mg5Gd become easier. Figure 2 shows the HAADF-STEM images of the Mg5Gd with different shapes in the 9Gd alloy. Figure 2b,d shows the selected area electron diffraction (SAED) patterns of regions ‘A’ and ‘B’ in Figure 2a,c, and the HAADF-STEM images indicate that the second phases with different morphologies are both Mg5Gd.
Figure 3 shows the EBSD results with different Y contents at 1/2 radius. The grain size of α-Mg decreases from 48.17 ± 1.13 μm to 38.26 ± 1.05 μm as the Y content increases. The reasons for changes in grain size will be explained in detail in Section 4.1. Appropriate Y content reduces the grain size but does not change the distribution and shape. Figure 4 shows the XRD pattern of the alloys with different Y contents. The second phase in the 9Gd alloy is Mg5Gd, which is consistent with those observed in Figure 1 and Figure 2. The type of the second phase changes to Mg5(Gd, Y) with the addition of Y, and the peak intensity increases with the increase in Y content.
Figure 5 shows the HAADF-STEM images of the second phase with different shapes in the 9Gd-1Y alloy. Figure 5b,d are the SAED patterns of regions ‘A’ and ‘B’ in Figure 5a,c, respectively, with the crystal zone axes B//[01 1 ¯ ]. The HAADF-STEM image indicates that the second phases with different morphologies are both Mg5(Gd,Y). Figure 6 shows the BSE-SEM images of the alloy at 1/2 radius. The second phase area fractions of the alloys with different Y contents are 0.7 ± 0.1%, 1.5 ± 0.2%, 5.2 ± 0.4%, and 7.9 ± 0.5%, respectively. In the 9Gd alloy, blocky Mg5Gd is mainly distributed at the grain boundary. With the increase in Y content, a large amount of Mg5(Gd, Y) appears at the grain boundaries, and the discontinuous intermetallic phase Mg5(Gd, Y) connects and grows. Additionally, in Figure 6c,d, fine-sized cubic phases, different from the blocky Mg5(Gd,Y), appear in the α-Mg matrix of the 9Gd-3Y and 9Gd-5Y, and the cubic phases (marked by red arrows) are marked as A, B, C, D, E, and F.
To determine the element types in the cubic phase of Figure 6c (marked as A, B, and C), Figure 7a,b show the TEM BF and HAADF-STEM images of the 9Gd-3Y alloy, and Figure 7c–f show the mapping distribution of different elements. The Gd and Y are significantly enriched in the cubic phase, while Mg shows almost no enrichment. To further investigate the type of cubic phase, TEM is used to deeply characterize the microstructure of the 9Gd-3Y alloy. Figure 8a presents the HAADF-STEM characterization results of the Mg matrix and Mg5(Gd,Y). Figure 8b shows an HRTEM image of Mg5(Gd,Y) in Figure 8a. Figure 8c shows the HRTEM result of region ‘A’ in Figure 8a. Figure 8d is the SAED pattern of the cubic phase, where the crystal zone axis B is parallel to [001]. The results indicate that the cubic phase is REH2, in Figure 8c, dMg and dREH2 are 0.208 nm and 0.189 nm, respectively; the interface mismatch is 9.13%, and the crystallographic orientation relationship between REH2 and Mg is (220)REH2//(11 2 ¯ 0)Mg. The H atoms in the water vapor enter the alloy during the casting process; the electronegativity of Mg is higher than RE, resulting in a higher tendency for RE to bind with H and form REH2 [33,34,35].
The same phenomenon is also present in the 9Gd-5Y alloy. In Figure 9, the REH2 phase is densely distributed around the Mg5(Gd,Y), and the compositional mapping indicates that Gd and Y elements are enriched. In Figure 10, the Y element exhibits a strong tendency for segregation at grain boundaries, leading to the co-segregation of Gd and Y. This leads to a significant solute drag pressure (Pd) [36], which reduces the grain boundary mobility rate, refines the grain size, and enhances the strength of the alloy. Additionally, the segregation of elements at grain boundaries may decrease the grain boundary energy [37] and pin the dislocation segments emanating from the grain boundaries [38], contributing to an increase in the yield strength of the alloy.

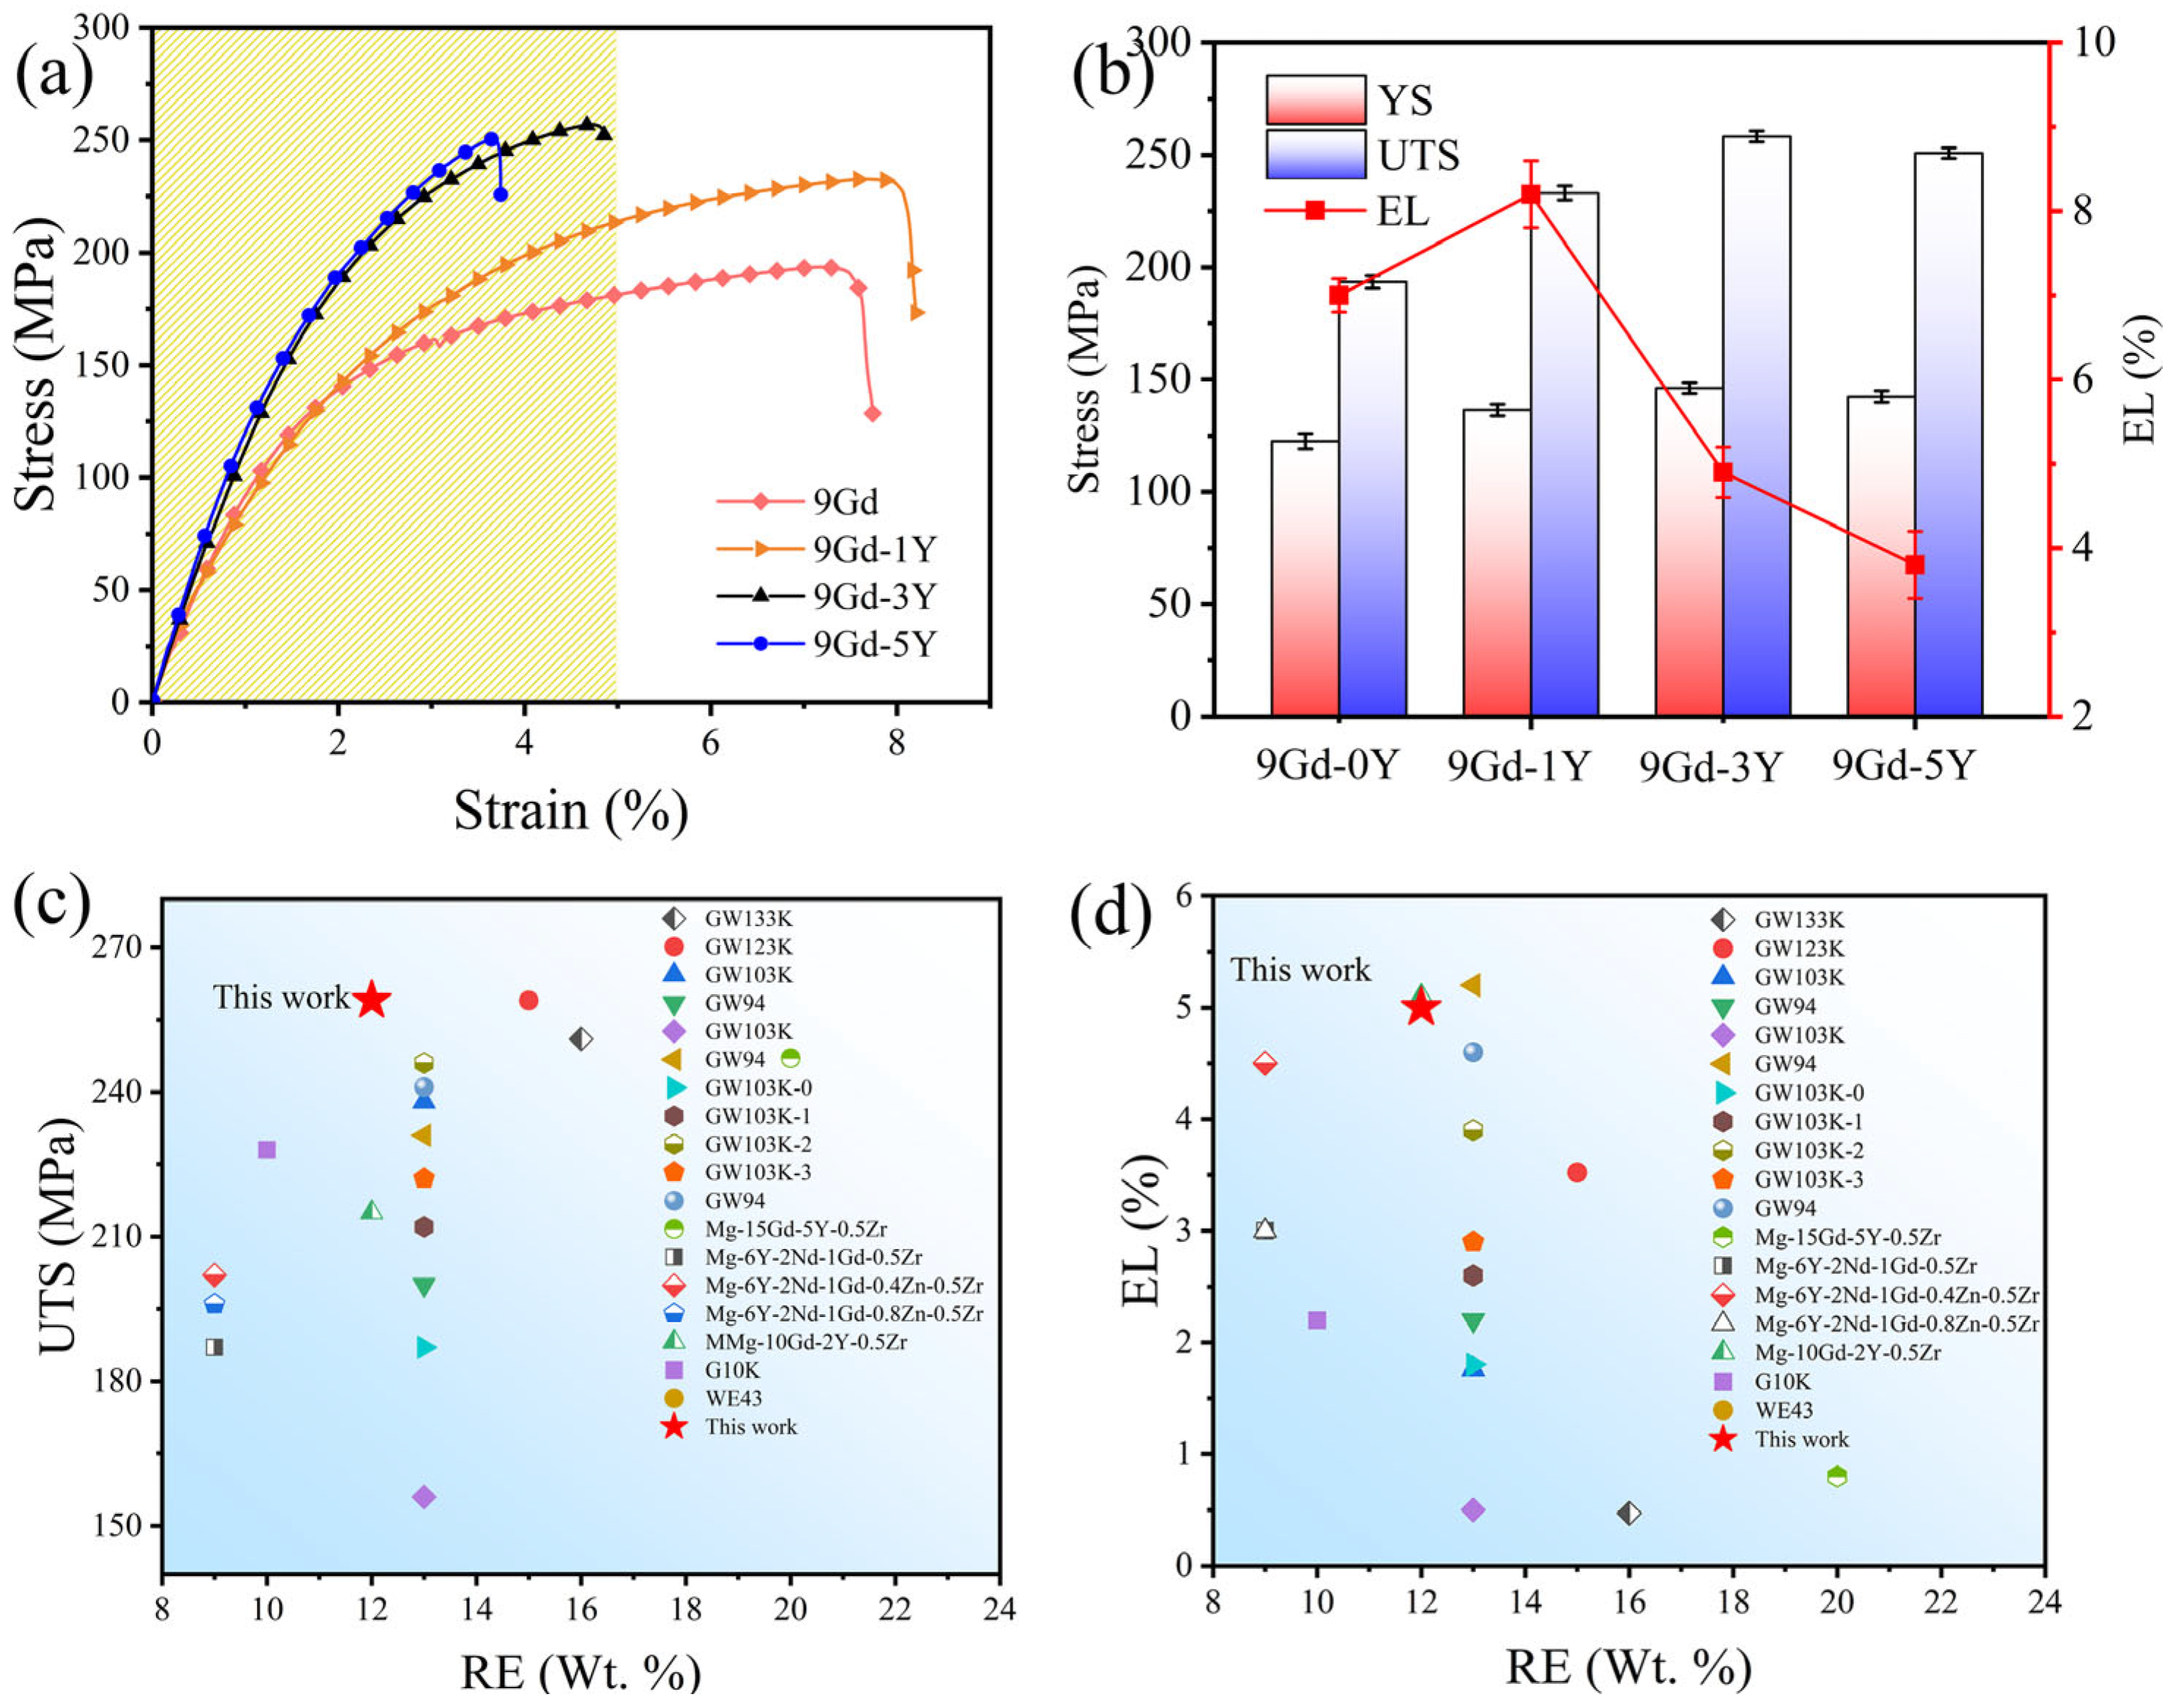
3.2. Tensile Mechanical Properties

Figure 11a,b show the stress-strain curves and the tensile properties. The UTS, YS, and elongation (EL) of the 9Gd alloy are 193.5 MPa, 122.6 MPa, and 7.0%, respectively. The strength of the alloy increases when the Y content is 1 wt.%, and the elongation does not decrease but instead increases to 8.2%. The optimal comprehensive performance is the 9Gd-3Y alloy, with the UTS and YS being 258.2 MPa (33.4%) and 146.2 MPa (19.2%), respectively. By comparing the properties of 9Gd-3Y with previously reported Mg-RE alloys, in Figure 11c,d, the 9Gd-3Y has high strength and good ductility. Specifically, compared to GW94 [32], Mg-6Y-2Nd-1Gd-0.5Zr [39], GW103K-2 [40], and Mg-15Gd-5Y-0.5Zr [30], UTS increased by 59 MPa, 72 MPa, 13 MPa, and 12 MPa, respectively, and EL increased by 2.7%, 1.9%, 1.0%, and 4.1%, respectively. The 9Gd-3Y exhibits low RE content and superior performance, presenting significant economic advantages. The tensile strength and elongation of the 9Gd-5Y both decrease compared to the 9Gd-3Y, and the reasons will be discussed in Section 4.1.
The fracture features of the alloys with different Y contents are shown in Figure 12. Table 2 shows the EDS analysis of the specially marked points on the fracture surface. The increase in Y content significantly affects the fracture behavior. In the 9Gd alloy, the fracture surface exhibits numerous dimples and tear ridges, along with bits of cleavage planes. Based on EDS results and previous studies [47], the phase denoted as ‘A’ is rich in Zr regions. In Figure 12b, when the Y content is 1 wt.%, the number of dimples and tear ridges on the fracture surface increases. The marked points ‘B’ and ‘C’ are both α-Mg, but they exhibit different morphological characteristics due to the decrease in ductility. In Figure 12d, the fracture surface becomes smoother and flatter, and the fracture mechanism changes from ductile fracture to brittle fracture, and the marked point ‘D’ is REH2. The area marked as the blue dashed ellipse indicates the pores.
The fracture morphology parallel to the tensile direction is shown in Figure 13. When the Y content increases to 1 wt.%, the cracks occur in both the grain interior and at grain boundaries, resulting in intergranular and transgranular fracture. On the fracture surface of the 9Gd-3Y, the cracks begin to appear in the Mg5(Gd,Y), with a small number of cracks appearing in the matrix. The fracture mode is mainly intergranular fracture, supplemented by transgranular fracture. As the Y content is 5 wt.%, excessive Y promotes the growth and interconnection of the Mg5(Gd,Y), and cracks are easily generated and propagated inside Mg5(Gd,Y). The Mg5(Gd,Y) connect to each other and act as crack nucleation points and crack propagation paths, resulting in brittle fracture and poor performance. This is the reason why the comprehensive performance of the 9Gd-5Y is lower than that of the 9Gd-3Y. In Figure 13, the presence of oxides and REH2 is observed; however, cracks did not grow and propagate along the oxides and REH2 due to the low content and thus will not cause damage to the ductility.
Figure 14 shows the SEM images and EDS mappings of the alloys with different Y contents. The oxidation of elements (Gd, Y, and Zr) occurs during the formation of Mg5(Gd,Y). To further evaluate the oxidation tendency, the reaction tendencies between different elements and oxygen atoms are calculated by HSC chemistry software, as shown in Figure 15. The Gibbs free energy for the Y reacting with oxygen atoms is the lowest, followed by Gd and Zr, and finally Mg, i.e., the reaction tendency is Y > Gd > Zr > Mg. The calculation results are consistent with the EDS mapping results.

4. Discussion

4.1. Effect of Y Content on Microstructure of the Mg-Gd-Y-Zr Alloys

As shown in Figure 1 and Figure 2, the shape and area fraction of the Mg5Gd will change at different positions. The decrease in the cooling rate leads to an increase in the area fraction of the Mg5Gd from 0.6 ± 0.1% to 1.6 ± 0.2% at different positions in the 9Gd alloy. As the Y content increases, the area fraction of the Mg5(Gd,Y) increases from 0.7 ± 0.1% to 7.9 ± 0.5%. In Figure 10, the co-segregation of Y elements reduces the grain boundary migration rate, which refines the grain size, and the grain size at 1/2 radius decreases from 48.17 μm to 38.26 μm. Additionally, the driving force for the formation of Mg5(Gd,Y) is enhanced with an increase in Y content; the increase in the area fraction of the Mg5(Gd,Y) at the grain boundaries also promotes a decrease in grain size. However, extensive Mg5(Gd,Y) is formed as the Y content exceeds the eutectic point. The separated intermetallic Mg5(Gd,Y) phases interconnect with each other, forming large skeletal Mg5(Gd,Y) in the 9Gd-5Y alloy, which will deteriorate the alloy properties. To avoid the formation of an excessively large second phase, an appropriate Y content is crucial. In addition, methods such as increasing the cooling rate, multi-process synergistic treatment (e.g., solution treatment + pre-deformation + aging treatment), friction stir processing (FSP), and extrusion deformation can break up the second phase and prevent excessive interconnection. In the 9Gd-5Y alloy, the Mg5(Gd,Y) phases grow along the grain boundaries, consuming the Y element, and there is no significant change in the width direction, so the change in grain size is not significant.
As shown in Figure 8 and Figure 9, the cubic phase REH2 is present in 9Gd-3Y and 9Gd-5Y. Nie et al. [40] suggested that the decomposition of Mg-RE phases by H during solidification may promote the formation of REH2, the REH2 phase has an fcc crystal structure with a = ~0.55 nm. The formation of REH2 will deteriorate the mechanical properties, especially EL [35]. However, as seen in Figure 13, the fracture of the as-cast alloy is primarily due to the extensive formation of cracks in the Mg5(Gd,Y), the REH2 phase is not the nucleation point for cracks. In Figure 8, dMg and dREH2 are 0.208 nm and 0.189 nm, respectively, with an interface mismatch of 9.13%, and there exists a crystallographic orientation relationship of (220)REH2//(11 2 ¯ 0)Mg. Therefore, REH2 in the as-cast Mg-Gd-Y-Zr alloy did not deteriorate the ductility, which is different from the conclusion in heat-treated alloys [34,35].

4.2. Effect of Y Content on Mechanical Properties of the Mg-Gd-Y-Zr Alloys

As shown in Figure 11, with the increase in Y content, the mechanical properties first increase and then decrease, i.e., obtaining the optimal mechanical properties in the 9Gd-3Y. When the Y content is low, the strengthening effect of Mg5(Gd,Y), with smaller grain size and area fraction, is inherently weaker. When the Y content is high, the excess Y promotes the growth and interconnection of the Mg5(Gd,Y). The strain incompatibility between the α-Mg matrix and the Mg5(Gd,Y) leads to stress concentration during the loading process, serving as crack nucleation points and propagation paths; thereby, the fracture mechanism of the 9Gd-5Y is transformed into intergranular fracture, deteriorating ductility and making the comprehensive performance of the 9Gd-5Y lower than that of the 9Gd-3Y. Additionally, the 9Gd-3Y alloy has the smallest grain size and can improve alloy properties through grain boundary strengthening.

4.3. Strengthening Mechanism of Mg-Gd-Y-Zr Alloy

The YS increased from 122.6 MPa in 9Gd to 146.2 MPa in 9Gd-3Y. The ∆σYS can be explained from the perspectives of grain boundary strengthening (σG), solid solution strengthening (σS), and precipitation strengthening (σP) [48,49], i.e.,
σ Y S = σ Y S ( 9 G d 3 Y ) σ Y S ( 9 G d ) = σ G + σ S + σ P
where ΔσG, ΔσS, and ΔσP represent the contributions of grain boundary strengthening, solid solution strengthening, and precipitation strengthening, respectively.
With the Y content increases, the grain size decreases from 48.17 μm to 38.26 μm. This phenomenon conforms to the Hall-Petch equation [50]:
σ G = σ 0 + k d 1 / 2
where σ0 and k are 11 MPa and 164 MPa μm1/2, respectively [7].
The contribution of adding Y to grain boundary strengthening can be expressed as:
σ G = k ( d ( 9 G d 3 Y ) 1 2 d ( 9 G d ) 1 2 )
The calculated value ΔσG is 3.3 MPa.
The solid solution strengthening of the 9Gd-3Y alloy can be approximated by the following relationship [51]:
σ S = k i c i n
where n is a constant, ki and ci are the relevant factor and solubility of solute i, respectively, and the solid solution strengthening contribution of adding Y can be assessed by the following relationship:
σ S = k 0.6 c 0.6 n
where n and k9Gd-3Y are 1/2 and 737 MPa (at%)−1/2, respectively [52]. According to the EDS results, the Y element content in different α-Mg matrixes is 0.13, 0.08, and 0.11 at. %, respectively, and the solubility of Y (c0.6) in the 9Gd-3Y alloy is approximately 0.11 at. %, and ΔσS is calculated as 24.4 MPa.
The strengthening effect of the equilibrium β (Mg5RE) phase is calculated using the following equation [53,54]:
σ P = 0.19 M G b λ l n 0.08 r b
where M, G, λ , r, and b represent the Taylor factor, shear modulus, the distance of the β phases, the diameter of the β phases, and the burgers vector, respectively. The values of M, G, and b are taken as 2.5, 16,600 MPa, and 0.32 nm, respectively. The r of the particles in alloys with Y content of 0 and 3 wt.% are 4.73 µm and 9.57 µm, with λ of 33.1 µm and 8.63 µm, respectively. Therefore, ΔσP is calculated to be approximately 1.8 MPa.
The combined strengthening calculation results are shown in Table 3, and the main strengthening mechanism of the 9Gd-3Y is solid solution strengthening. The increase in YS is 23.6 MPa as the Y content increases to 3 wt.%, while the calculated strength difference is 29.5 MPa. The main reasons why the calculated values are slightly higher than the actual values include experimental errors and defects such as pores.

5. Conclusions

The effect of Y content on the microstructure and mechanical properties of the as-cast Mg-9Gd-xY-0.5Zr alloys is investigated. A non-monotonous change in mechanical properties with the change in Y content and appropriate addition of Y can achieve the optimal comprehensive properties. The findings are summarized as follows:
(1) The 9Gd-3Y alloy exhibits the best mechanical properties with the increase in Y content. Compared with the 9Gd alloy, the UTS and YS increased approximately 33.4% and 19.2%, respectively, and the main strengthening mechanism is solid solution strengthening. The 9Gd-3Y alloy, with low RE content, high performance, and low cost, has significant economic advantages.
(2) REH2 phase appears in the 9Gd-3Y and 9Gd-5Y, the crystallographic orientation relationship between REH2 and Mg is (220)REH2//(11 2 ¯ 0)Mg, and the interface mismatch is 9.13%. Oxides and REH2 do not have a deteriorating impact on ductility, and the oxidation tendency of the elements in the alloy is Y > Gd > Zr > Mg.
(3) Excessive Y promotes the growth and interconnection of the Mg5(Gd,Y), becoming the nucleation point of cracks and paths of crack propagation, leading to the deterioration in the performance of the 9Gd-5Y alloy.

Author Contributions

Methodology, Y.L., Y.C., Z.D., T.L. and B.J.; Software, Y.L., C.L., H.H. and T.L.; Validation, Y.G. and B.J.; Formal analysis, A.Z.; Investigation, Y.L., C.L., H.X. and H.H.; Resources, Y.G., Y.C. and B.J.; Data curation, Y.L. and H.X.; Writing—original draft, Y.L.; Writing—review & editing, A.Z., Z.D. and B.J.; Visualization, A.Z.; Supervision, A.Z., Z.D. and B.J.; Funding acquisition, B.J. All authors have read and agreed to the published version of the manuscript.

Funding

This work is financially supported by the National Key Research and Development Program of China (grant number 2021YFB3701000), National Natural Science Foundation of China (grant numbers 52101125, U2037601, and U21A2048), and Natural Science Foundation of Chongqing China (grant number CSTB2022NSCQ-MSX1289), Zhejiang Province Leading Innovation and Entrepreneurship Team-Automotive Light Alloy Innovation Team (2022R01018).

Institutional Review Board Statement

Not applicable.

Informed Consent Statement

Not applicable.

Data Availability Statement

The original contributions presented in this study are included in the article. Further inquiries can be directed to the corresponding authors.

Acknowledgments

Thanks to the eceshi (www.eceshi.com) for the XRD support. This work was supported by Sinomate Institute of Materials Research (Guang Zhou) Co., Ltd. (SIMR), for assisting the TEM characterization.

Conflicts of Interest

Author Yuhong Cui was employed by Qinghai Salt Lake Teli Magnesium Co., Ltd. Author Tian Li was employed by Zhejiang Wanfeng Precision Casting Co., Ltd. The remaining authors declare that the research was conducted in the absence of any commercial or financial relationships that could be construed as a potential conflict of interest.

References

  1. Agnew, S.R.; Nie, J.F. Preface to the viewpoint set on: The current state of magnesium alloy science and technology. Scr. Mater. 2010, 63, 671–673. [Google Scholar] [CrossRef]
  2. Zeng, Z.; Stanford, N.; Davies, C.H.J.; Nie, J.-F.; Birbilis, N. Magnesium extrusion alloys: A review of developments and prospects. Int. Mater. Rev. 2019, 64, 27–62. [Google Scholar] [CrossRef]
  3. Peng, Z.Z.; Shao, X.H.; Liang, Z.M.; Wang, D.L.; Wang, L.W.; Ma, X.L. Synergetic deformation mechanisms in an Mg-Zn-Y-Zr alloy with intragranular LPSO structures. J. Magnes. Alloy 2023, 11, 1754–1768. [Google Scholar] [CrossRef]
  4. Wang, Q.; Huang, Z.; Zhu, Y.; Qin, L.; Zou, J.; Ma, L. Study of Corrosion Behavior of Mg–Gd-Based Soluble Magnesium Alloys. Metals 2025, 15, 35. [Google Scholar] [CrossRef]
  5. Chen, W.; Yang, J.; Yu, W.; Su, Y.; Zhang, A.; Ma, C.; Ma, Y. One developed finite element model used in nano-layered flaky Ti2AlC MAX ceramic particles reinforced magnesium composite. J. Magnes. Alloy 2024, 12, 4219–4228. [Google Scholar] [CrossRef]
  6. Caceres, C.H. Economical and Environmental Factors in Light Alloys Automotive Applications. Metall. Mater. Trans. A 2007, 38, 1649–1662. [Google Scholar] [CrossRef]
  7. Zhao, T.; Hu, Y.; He, B.; Zhang, C.; Zheng, T.; Pan, F. Effect of manganese on microstructure and properties of Mg-2Gd magnesium alloy. Mater. Sci. Eng., A 2019, 765, 138292. [Google Scholar] [CrossRef]
  8. Wang, G.G.; Weiler, J.P. Recent developments in high-pressure die-cast magnesium alloys for automotive and future applications. J. Magnes. Alloy 2023, 11, 78–87. [Google Scholar] [CrossRef]
  9. Zhu, Y.; Wang, N.; Chu, Z.; Niu, Y.; Ma, L.; Qin, L. Study of the corrosion mechanism of Mg–Gd based soluble magnesium alloys with different initial texture states. Corros. Rev. 2023, 41, 659–672. [Google Scholar] [CrossRef]
  10. Zhu, Y.; Hao, C.; Li, Z.; Zou, J.; Qin, L.; Niu, Y.; Ma, L.; Zhou, J. First-principles study of binary and ternary phases in Mg-Gd-Ni alloys. Phys. B Condens. Matter 2024, 685, 416065. [Google Scholar] [CrossRef]
  11. Zhu, Y.; Wang, Q.; Huang, Z.; Qin, L.; Li, Z.; Ma, L. Strain Hardening Exponent and Strain Rate Sensitivity Exponent of Cast AZ31B Magnesium Alloy. Metals 2022, 12, 1942. [Google Scholar] [CrossRef]
  12. Qin, L.; Du, W.; Cipiccia, S.; Bodey, A.J.; Rau, C.; Mi, J. Synchrotron X-ray operando study and multiphysics modelling of the solidification dynamics of intermetallic phases under electromagnetic pulses. Acta Mater. 2024, 265, 119593. [Google Scholar] [CrossRef]
  13. Guo, W.; Wang, Q.D.; Ye, B.; Liu, M.P.; Peng, T.; Liu, X.T.; Zhou, H. Enhanced microstructure homogeneity and mechanical properties of AZ31 magnesium alloy by repetitive upsetting. Mater. Sci. Eng. A 2012, 540, 115–122. [Google Scholar] [CrossRef]
  14. Zou, J.; Ma, L.; Zhu, Y.; Qin, L.; Yuan, Y. Gradient microstructure and superior strength–ductility synergy of AZ61 magnesium alloy bars processed by radial forging with different deformation temperatures. J. Mater. Sci. Technol. 2024, 170, 65–77. [Google Scholar] [CrossRef]
  15. Li, T.; Song, J.; Zhang, A.; You, G.; Yang, Y.; Jiang, B.; Qin, X.; Xu, C.; Pan, F. Progress and prospects in Mg-alloy super-sized high pressure die casting for automotive structural components. J. Magnes. Alloy 2023, 11, 4166–4180. [Google Scholar] [CrossRef]
  16. Xu, J.; Liu, W.; Jiang, B.; Yang, H.; Li, X.; Kang, Y.; Zhou, N.; Zhang, W.; Zheng, K.; Pan, F. Forming novel texture and enhancing the formability in Mg–3Al–Zn alloy sheets fabricated by transverse gradient extrusion. J. Mater. Res. Technol. 2022, 18, 3143–3149. [Google Scholar] [CrossRef]
  17. Zhang, Z.; Huo, Q.; Zhang, Y.; Zhao, G.; Nagaumi, H.; Yang, X. Enhanced creep resistance in Mg-Y-Nd alloy via regulating prior thermo-mechanical treatment. J. Magnes. Alloy 2023, 12, 2766–2782. [Google Scholar] [CrossRef]
  18. Wang, L.; Liu, D.-R.; Chen, T.; Wang, S.; Cao, Y. Grain refinement and high thermal stability in laser surface remelted Mg-4Y-3Nd-1.5Al alloy. Scr. Mater. 2023, 222, 115000. [Google Scholar] [CrossRef]
  19. Wei, K.; Xiao, L.; Gao, B.; Mao, Q.; Liu, Y.; Li, L.; Sun, W.; Sui, Y.; Zhou, H.; Zhao, Y. Effect of aging temperature on the hardening behavior and precipitation evolution of Mg-10Gd alloy. Mater. Charact. 2023, 196, 112580. [Google Scholar] [CrossRef]
  20. Li, Y.; Wang, J.; Ma, H.; Zhen, Z.; Liu, Y.; Zhang, H.; Jin, P. An investigation on the precipitates in T5 treated high vacuum die-casting AE44-2 magnesium alloy. Mater. Res. Express 2022, 9, 020005. [Google Scholar] [CrossRef]
  21. Fan, Y.; Xiang, Y.; Shen, H.-S. Temperature-Dependent Mechanical Properties of Graphene/Cu Nanocomposites with In-Plane Negative Poisson’s Ratios. Research 2020, 2020, 5618021. [Google Scholar] [CrossRef] [PubMed]
  22. Zhang, W.; Xie, H.; Ma, Z.; Zhao, H.; Ren, L. Graphene Oxide-Induced Substantial Strengthening of High-Entropy Alloy Revealed by Micropillar Compression and Molecular Dynamics Simulation. Research 2022, 2022, 9839403. [Google Scholar] [CrossRef]
  23. Jin, X.; Xu, W.; Yang, Z.; Yuan, C.; Shan, D.; Teng, B.; Jin, B.C. Analysis of abnormal texture formation and strengthening mechanism in an extruded Mg-Gd-Y-Zn-Zr alloy. J. Mater. Sci. Technol. 2020, 45, 133–145. [Google Scholar] [CrossRef]
  24. Jin, Z.-Z.; Zha, M.; Wang, S.-Q.; Wang, S.-C.; Wang, C.; Jia, H.-L.; Wang, H.-Y. Alloying design and microstructural control strategies towards developing Mg alloys with enhanced ductility. J. Magnes. Alloy 2022, 10, 1191–1206. [Google Scholar] [CrossRef]
  25. Sha, G.; Li, J.H.; Xu, W.; Xia, K.; Jie, W.Q.; Ringer, S.P. Hardening and microstructural reactions in high-temperature equal-channel angular pressed Mg–Nd–Gd–Zn–Zr alloy. Mater. Sci. Eng. A 2010, 527, 5092–5099. [Google Scholar] [CrossRef]
  26. Li, Y.; Zhang, A.; Li, C.; Xie, H.; Jiang, B.; Dong, Z.; Jin, P.; Pan, F. Recent advances of high strength Mg-RE alloys: Alloy development, forming and application. J. Mater. Res. Technol. 2023, 26, 2919–2940. [Google Scholar] [CrossRef]
  27. Hu, G.-s.; Zhang, D.-f.; Zhao, D.-z.; Shen, X.; Jiang, L.-y.; Pan, F.-s. Microstructures and mechanical properties of extruded and aged Mg–Zn–Mn–Sn–Y alloys. Trans. Nonferrous Met. Soc. China 2014, 24, 3070–3075. [Google Scholar] [CrossRef]
  28. Zhou, H.; Hou, R.; Yang, J.; Sheng, Y.; Li, Z.; Chen, L.; Li, W.; Wang, X. Influence of Zirconium (Zr) on the microstructure, mechanical properties and corrosion behavior of biodegradable zinc-magnesium alloys. J. Alloys Compd. 2020, 840, 155792. [Google Scholar] [CrossRef]
  29. Wei, X.; Jin, L.; Wang, F.; Li, J.; Ye, N.; Zhang, Z.; Dong, J. High strength and ductility Mg-8Gd-3Y-0.5Zr alloy with bimodal structure and nano-precipitates. J. Mater. Sci. Technol. 2020, 44, 19–23. [Google Scholar] [CrossRef]
  30. Gao, Y.; Wang, Q.; Gu, J.; Zhao, Y.; Tong, Y.; Kaneda, J. Effects of heat treatments on microstructure and mechanical properties of Mg-15Gd-5Y-0.5Zr alloy. J. Rare Earths 2008, 26, 298–302. [Google Scholar] [CrossRef]
  31. Jiang, R.; Qian, S.; Dong, C.; Qin, Y.; Wu, Y.; Zou, J.; Zeng, X. Composition optimization of high-strength Mg-Gd-Y-Zr alloys based on the structural unit of Mg-Gd solid solution. J. Mater. Sci. Technol. 2021, 72, 104–113. [Google Scholar] [CrossRef]
  32. Li, J.-L.; Zhang, N.; Wang, X.-X.; Wu, D.; Chen, R.-S. Effect of Solution Treatment on the Microstructure and Mechanical Properties of Sand-Cast Mg–9Gd–4Y–0.5Zr Alloy. Acta Metall. Sin. (Engl. Lett.) 2018, 31, 189–198. [Google Scholar] [CrossRef]
  33. Zhang, Z.; Peng, L.; Zeng, X.; Fu, P.; Ding, W. Characterization of phases in a Mg–6Gd–4Sm–0.4Zr (wt.%) alloy during solution treatment. Mater. Charact. 2009, 60, 555–559. [Google Scholar] [CrossRef]
  34. Deng, Q.; Chang, Z.; Su, N.; Luo, J.; Liang, Y.; Jin, Y.; Wu, Y.; Peng, L.; Ding, W. Developing a novel high-strength Mg-Gd-Y-Zn-Mn alloy for laser powder bed fusion additive manufacturing process. J. Magnes. Alloy, 2023; in press. [Google Scholar] [CrossRef]
  35. Deng, Q.; Wu, Y.; Zhu, W.; Chen, K.; Liu, D.; Peng, L.; Ding, W. Effect of heat treatment on microstructure evolution and mechanical properties of selective laser melted Mg-11Gd-2Zn-0.4Zr alloy. Mater. Sci. Eng. A 2022, 829, 142139. [Google Scholar] [CrossRef]
  36. Qian, X.; Dong, Z.; Jiang, B.; Lei, B.; Yang, H.; He, C.; Liu, L.; Wang, C.; Yuan, M.; Yang, H.; et al. Influence of alloying element segregation at grain boundary on the microstructure and mechanical properties of Mg-Zn alloy. Mater. Des. 2022, 224, 111322. [Google Scholar] [CrossRef]
  37. Vo, N.Q.; Schäfer, J.; Averback, R.S.; Albe, K.; Ashkenazy, Y.; Bellon, P. Reaching theoretical strengths in nanocrystalline Cu by grain boundary doping. Scr. Mater. 2011, 65, 660–663. [Google Scholar] [CrossRef]
  38. Chang, K.I.; Hong, S.I. Effect of sulphur on the strengthening of a Zr–Nb alloy. J. Nucl. Mater. 2008, 373, 16–21. [Google Scholar] [CrossRef]
  39. Tao, J.Q.; Huang, S.H.; Zhao, G.Z.; Huang, Z.W.; Wu, Y.; Wan, Y.Y.; Li, M. Effect of Zn on the Mechanical Properties and Microstructure of as-Cast and Solution-Treated Mg–6Y–2Nd–1Gd–0.5Zr Alloys. Strength. Mater. 2019, 51, 609–615. [Google Scholar] [CrossRef]
  40. Shen, Y.; Wang, K.; Li, H.; Zhen, Y.; Han, F.; Chen, X.; Jiang, H.; Wang, Q.; Ding, W. Effects of novel Mg-RE master alloys prepared via ultrasonic assisted cast on the microstructure and properties of Mg-Gd-Y alloy. Mater. Sci. Eng. A 2024, 895, 146222. [Google Scholar] [CrossRef]
  41. Deng, Q.; Wu, Y.; Su, N.; Chang, Z.; Chen, J.; Peng, L.; Ding, W. Influence of friction stir processing and aging heat treatment on microstructure and mechanical properties of selective laser melted Mg-Gd-Zr alloy. Addit. Manuf. 2021, 44, 102036. [Google Scholar] [CrossRef]
  42. Gao, L.; Chen, R.S.; Han, E.H. Microstructure and strengthening mechanisms of a cast Mg–1.48Gd–1.13Y–0.16Zr (at.%) alloy. J. Mater. Sci. 2009, 44, 4443–4454. [Google Scholar] [CrossRef]
  43. Gao, L.; Chen, R.-s.; Han, E.-h. Fracture behavior of high strength Mg-Gd-Y-Zr magnesium alloy. Trans. Nonferrous Met. Soc. China 2010, 20, 1217–1221. [Google Scholar] [CrossRef]
  44. He, S.M.; Zeng, X.Q.; Peng, L.M.; Gao, X.; Nie, J.F.; Ding, W.J. Microstructure and strengthening mechanism of high strength Mg–10Gd–2Y–0.5Zr alloy. J. Alloys Compd. 2007, 427, 316–323. [Google Scholar] [CrossRef]
  45. Hyer, H.; Zhou, L.; Benson, G.; McWilliams, B.; Cho, K.; Sohn, Y. Additive manufacturing of dense WE43 Mg alloy by laser powder bed fusion. Addit. Manuf. 2020, 33, 101123. [Google Scholar] [CrossRef]
  46. Wang, C.; Wu, G.; Lavernia, E.J.; Ding, W. Influences of heat treatment on microstructural evolution and tensile behavior of squeeze-cast Mg–Gd–Y–Zr alloy. J. Mater. Sci. 2017, 52, 1831–1846. [Google Scholar] [CrossRef]
  47. Guo, Y.; Li, J.; Li, J.; Yang, Z.; Zhao, J.; Xia, F.; Liang, M. Mg–Gd–Y system phase diagram calculation and experimental clarification. J. Alloys Compd. 2008, 450, 446–451. [Google Scholar] [CrossRef]
  48. Bai, Y.; Ye, B.; Guo, J.; Wang, L.; Kong, X.; Ding, W. Mechanical properties and yield asymmetry of Mg-Y-Zn alloys: Competitive behavior of second phases. Mater. Charact. 2020, 164, 110301. [Google Scholar] [CrossRef]
  49. Lei, B.; Wang, C.; Jiang, B.; Bai, S.; Dong, Z.; Qian, X.; He, C.; Xu, J.; Yang, H.; Wang, Q.; et al. Role of Y on the microstructure and mechanical properties of Mg-Gd-Zr alloy. Mater. Sci. Eng., A 2022, 861, 144371. [Google Scholar] [CrossRef]
  50. Wang, C.; Dong, Z.; Jiang, B.; Zheng, Z.; Wu, S.; Song, J.; Zhang, A.; Xu, J.; Yang, B.; Zheng, C.; et al. Lowering thermal expansion of Mg with the enhanced strength by Ca alloying. J. Mater. Res. Technol. 2023, 24, 1293–1303. [Google Scholar] [CrossRef]
  51. Gao, L.; Chen, R.S.; Han, E.H. Effects of rare-earth elements Gd and Y on the solid solution strengthening of Mg alloys. J. Alloys Compd. 2009, 481, 379–384. [Google Scholar] [CrossRef]
  52. Sun, W.T.; Qiao, X.G.; Zheng, M.Y.; Xu, C.; Gao, N.; Starink, M.J. Microstructure and mechanical properties of a nanostructured Mg-8.2Gd-3.8Y-1.0Zn-0.4Zr supersaturated solid solution prepared by high pressure torsion. Mater. Des. 2017, 135, 366–376. [Google Scholar] [CrossRef]
  53. Ning, J.; Gao, B.; Yuan, X.; Zhou, J.; Tang, G.; Chen, L. Strength and ductility improvement in a heterostructured Mg-Gd-Y alloy with inversely-gradient hardness distribution. J. Mater. Res. Technol. 2024, 28, 3781–3793. [Google Scholar] [CrossRef]
  54. Yu, Z.; Xu, X.; Shi, K.; Du, B.; Han, X.; Xiao, T.; Li, S.; Liu, K.; Du, W. Development and characteristics of a low rare-earth containing magnesium alloy with high strength-ductility synergy. J. Magnes. Alloy 2023, 11, 1629–1642. [Google Scholar] [CrossRef]
Figure 1. BSE-SEM images of the 9Gd alloy: (a) Schematic diagram of sampling location, (b) edge, (c) 1/2 radius, and (d), center.
Materials 18 02475 g001
Figure 2. Microstructure characterization of the 9Gd alloy: (a,c) HAADF-STEM images, (b,d) SAED patterns (B//[01 1 ¯ ]α) of regions ‘A’ and ‘B’ in (a,c), respectively.
Materials 18 02475 g002
Figure 3. IPF images of alloys with different Y content at 1/2 radius: (a,e) 9Gd, (b,f) 9Gd-1Y, (c,g) 9Gd-3Y, (d,h) 9Gd-5Y.
Materials 18 02475 g003
Figure 4. XRD patterns of the alloys with different Y content.
Materials 18 02475 g004
Figure 5. HAADF-STEM images and SAED patterns of the 9Gd-1Y alloy: (a,c) HAADF-STEM of second phases with different morphologies, (b,d) SAED patterns (B//[01 1 ¯ ]α) of regions ‘A’ and ‘B’ in (a,c), respectively.
Materials 18 02475 g005
Figure 6. Distribution and morphology of the second phases in alloys with different Y contents: (a) 9Gd, (b) 9Gd-1Y, (c) 9Gd-3Y, (d) 9Gd-5Y, blue dashed circles indicate the pores in alloys.
Materials 18 02475 g006
Figure 7. (a) TEM BF and (b) HAADF-STEM images of the 9Gd-3Y alloy: (c) mapping distribution of Mg, (d) mapping distribution of Gd, (e) mapping distribution of Y, (f) mapping distribution of Zr.
Materials 18 02475 g007
Figure 8. Microscopic characterization of the 9Gd-3Y alloy: (a) HAADF-STEM image, (b) HRTEM image of the Mg5(Gd,Y) phase, (c) HRTEM image of the Mg and REH2 phases in region ‘A’ of Figure 8a, (d) SAED pattern of the REH2 phase, with the zone axis B//[001].
Materials 18 02475 g008
Figure 9. (a) TEM BF and (b) HAADF-STEM images of the 9Gd-5Y alloy, (c) mapping distribution of Mg, (d) mapping distribution of Gd, (e) mapping distribution of Y, (f) mapping distribution of Zr.
Materials 18 02475 g009
Figure 10. TEM images of element segregation at the grain boundary: (a) BF image, (b,e) Mg segregation result, (c,f) Gd segregation result, (d,g) Y segregation result.
Materials 18 02475 g010
Figure 11. (a) Tensile strain-stress curves and (b) tensile properties of the alloys with different Y contents, (c,d) comparison of UTS and EL of between the 9Gd-3Y and previously reported Mg-RE alloys [30,31,32,39,40,41,42,43,44,45,46].
Materials 18 02475 g011
Figure 12. Tensile fracture surface morphologies of the alloys with different Y contents: (a) 9Gd, (b) 9Gd-1Y, (c) 9Gd-3Y, (d) 9Gd-5Y.
Materials 18 02475 g012
Figure 13. Fracture morphology of as-cast alloys with different Y contents on the longitudinal section (a) 9Gd, (b) 9Gd-1Y, (c) 9Gd-3Y, (d) 9Gd-5Y.
Materials 18 02475 g013
Figure 14. SEM images and EDS mappings of as-cast alloys with different Y contents: (a,a1) 9Gd-1Y, (b,b1) 9Gd-3Y, (c,c1) 9Gd-5Y.
Materials 18 02475 g014
Figure 15. Oxidation tendency of different elements.
Materials 18 02475 g015
Table 1. The actual chemical compositions of the Mg-9Gd-xY-0.5Zr alloys (wt.%).
AlloysGdYZrMg
Mg-9Gd-0.5Zr8.99-0.51Bal.
Mg-9Gd-1Y-0.5Zr8.971.030.49Bal.
Mg-9Gd-3Y-0.5Zr8.962.990.48Bal.
Mg-9Gd-5Y-0.5Zr9.045.030.51Bal.
Table 2. EDS results for all points in Figure 12 (at%).
PointsMg GdYZr
A75.39.0-15.7
B98.21.40.30.1
C94.03.91.50.6
D36.323.140.50.1
Table 3. Experimental values and calculated values of ∆σYS.
Experimental Value (MPa)Calculated Value (MPa)
σ Y S σ Y S σ G σ S σ P
23.629.53.324.41.8
Disclaimer/Publisher’s Note: The statements, opinions and data contained in all publications are solely those of the individual author(s) and contributor(s) and not of MDPI and/or the editor(s). MDPI and/or the editor(s) disclaim responsibility for any injury to people or property resulting from any ideas, methods, instructions or products referred to in the content.

