3.1. Microstructure Characterization
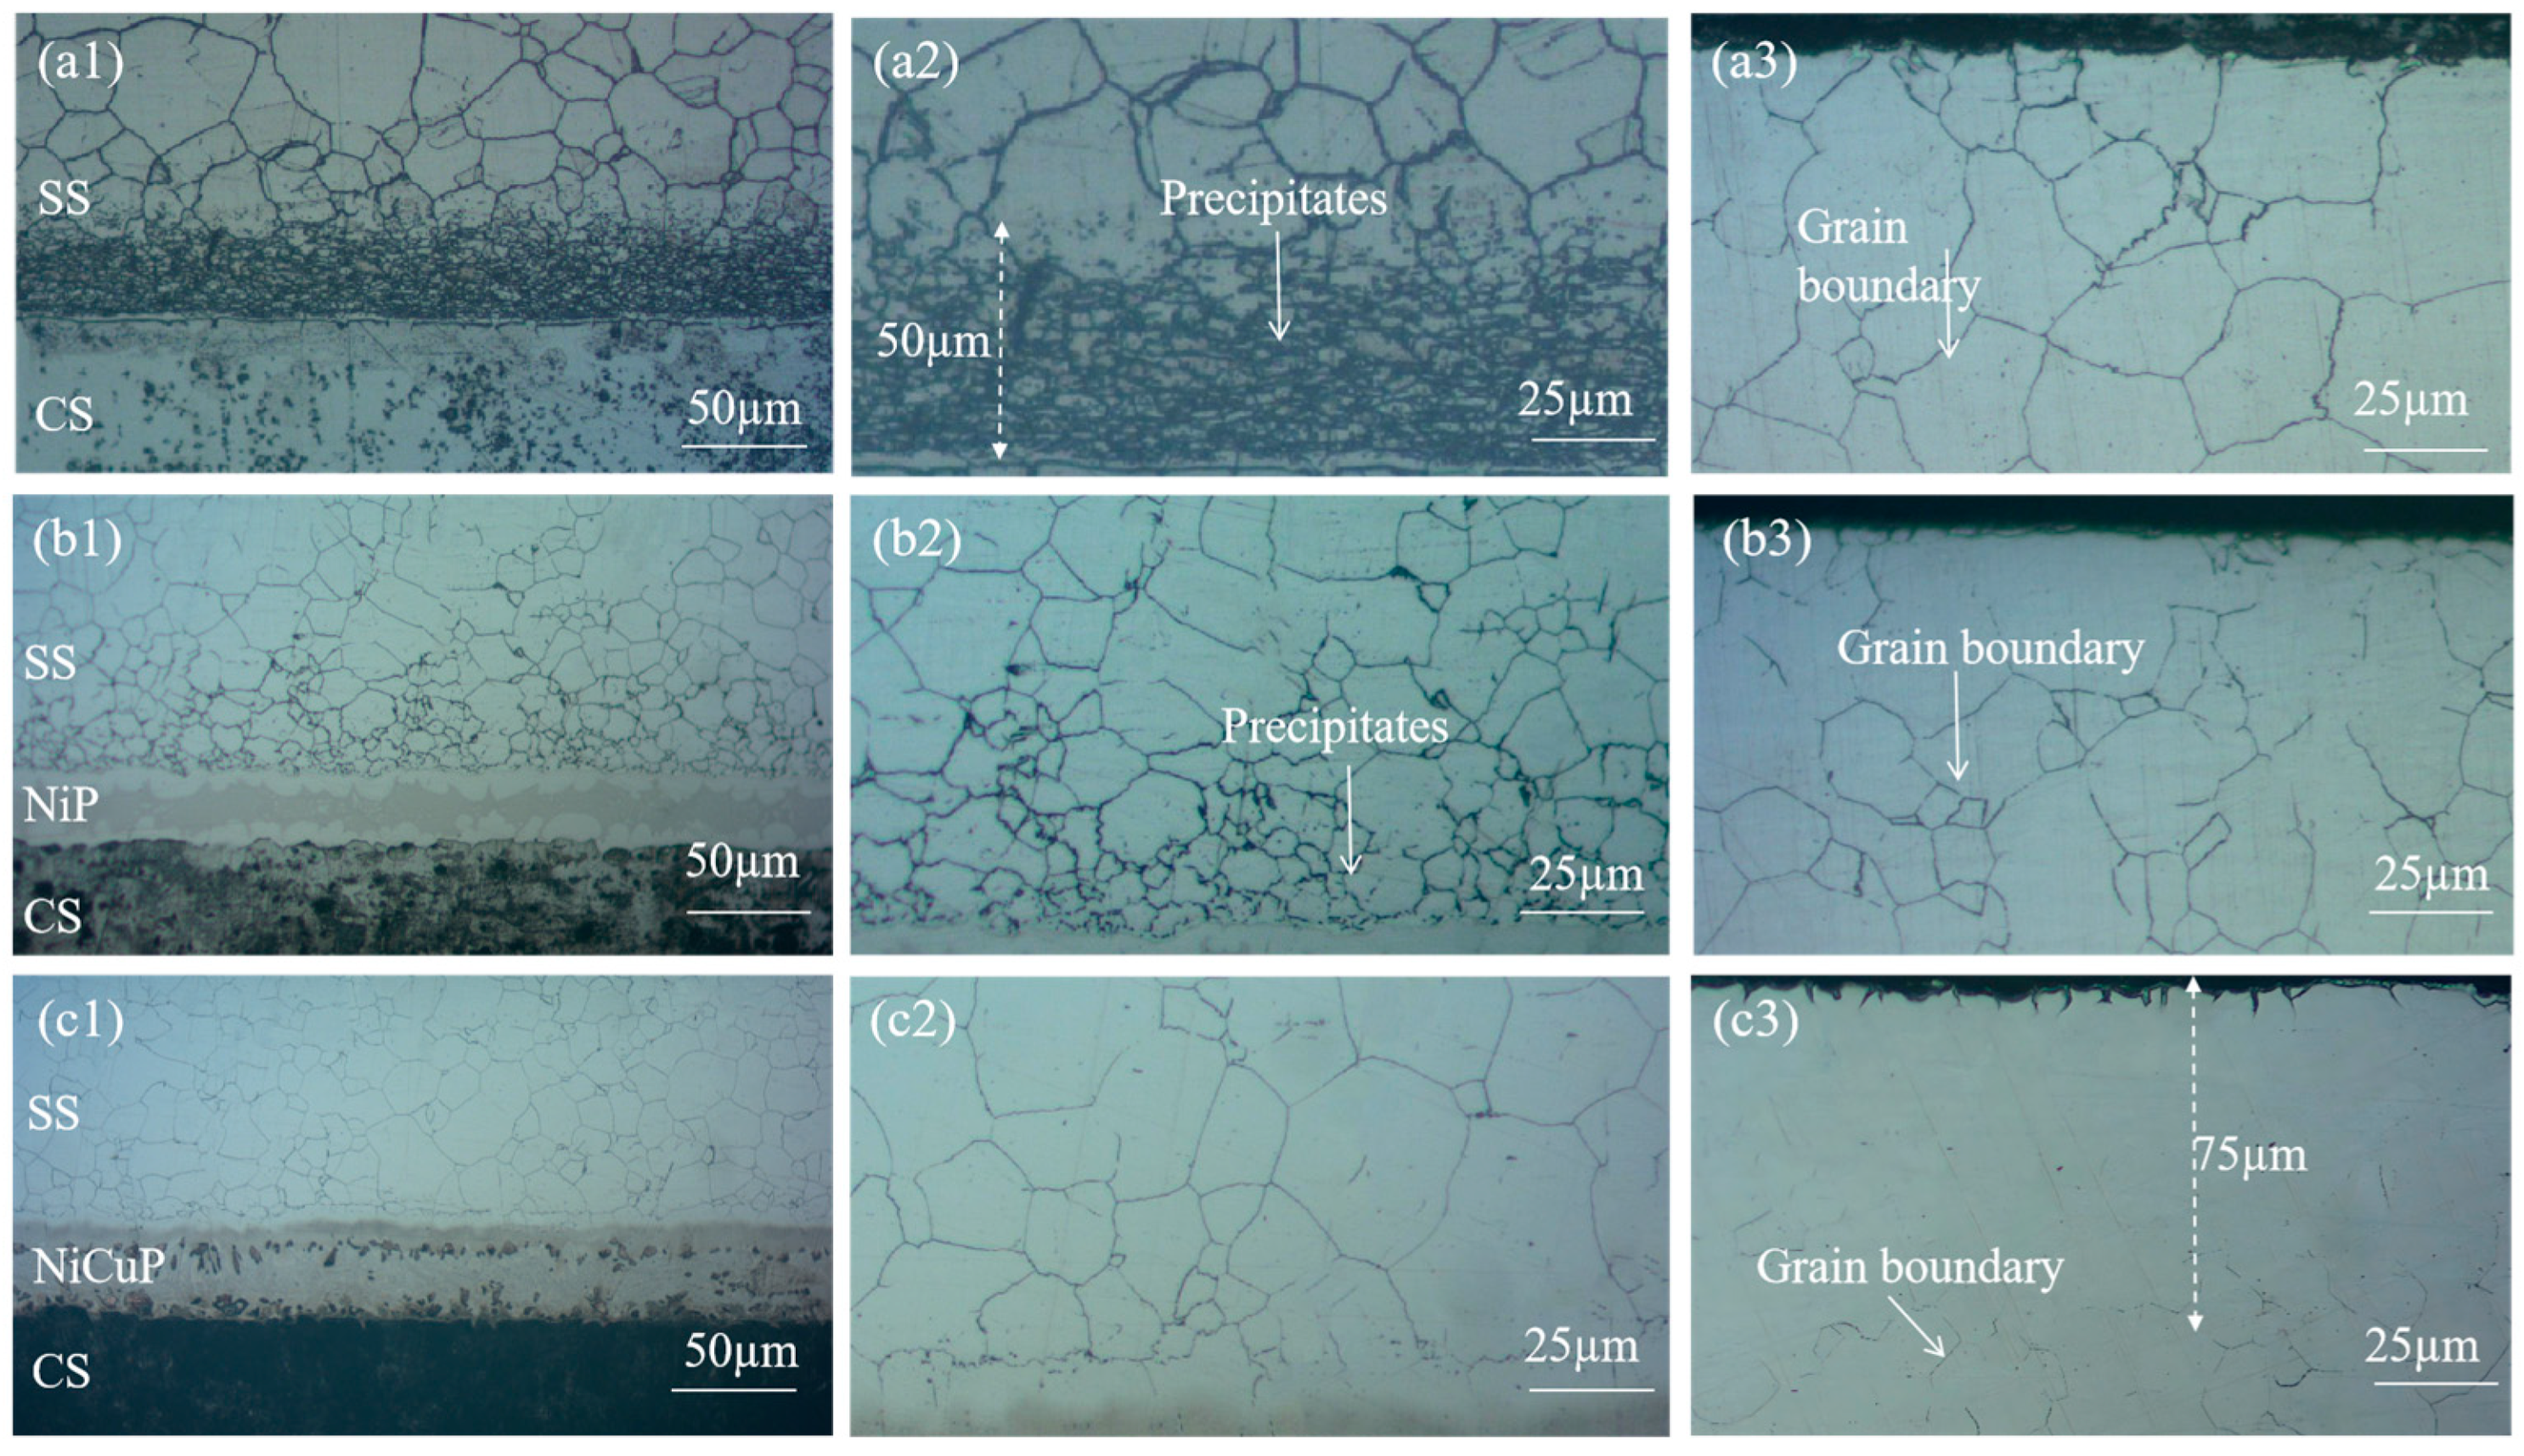
Figure 1 shows the metallographic microstructure of SSCP. The microstructure of the 304/45 specimen was shown in
Figure 1(a1–a3), where a distinct carburized layer with a network structure was observed throughout the SS cladding, accompanied by coarse grain boundaries. A 50 μm black precipitate layer was visible near the bonding interface of the SS cladding. Meanwhile, severe decarburization was observed on the CS side. These phenomena indicated significant C diffusion had occurred in the 304/45 specimen, with sufficient C diffusion reaching the SS cladding surface [
19]. The microstructure of the 304/NiP/45 specimen is depicted in
Figure 1(b1–b3). A network carburized layer was also observed throughout the SS cladding, but the amount of black precipitates was substantially reduced compared to the 304/45 specimen. Only minor decarburization was detected on the CS side. This was attributed to Ni, a non-carbide-forming element, which reduced the diffusion coefficient of C, thereby effectively slowing the diffusion of C within the interlayer and partially blocking C diffusion, though not completely [
20]. The microstructure of the 304/NiCuP/45 specimen is presented in
Figure 1(c1–c3). A carburized layer was observed near the bonding interface of the SS cladding, while no network grain boundaries were detected within a region approximately 75 μm from the SS cladding surface. Additionally, no decarburization was observed on the CS side. This demonstrates that the addition of NiCuP interlayer had blocked most C diffusion from the CS side to the SS side, allowing only a small amount of C to diffuse into the SS cladding without reaching its surface [
21].
The interlayer undergoes interdiffusion of elements with both bonded metals during the preparation process, and elemental segregation might occur during solidification, leading to compositional changes in the interlayer. Therefore, SEM and EDS analysis were employed to characterize the microstructure of NiP and NiCuP interlayers. The EDS results in
Figure 2 are listed in
Table 3.
Figure 2(a1) presents the SEM image of the NiP interlayer, revealing wave-like white solid solution phases and central eutectic structures. EDS results indicated that the white solid solution (1#) primarily consists of Ni (53.91 ± 0.54%) and Fe (40.32 ± 1.58%), with P content below 1%. This was attributed to Fe diffusion into the interlayer driven by concentration gradients during the preparation process. During solidification, the high-melting-point Fe-Ni phases preferentially precipitated at the interface [
22]. In contrast, the central eutectic structure (2#) was rich in P (14.96 ± 3.3%), forming a Ni-Fe-P eutectic phase.
Figure 2(b1) shows the SEM image of the NiCuP interlayer, featuring wave-like light-red solid solution phases, elliptical dark-red regions, and central eutectic structures. EDS analysis identified the light-red wave-like solid solution (3#) as a Fe-Ni-Cu solid solution, the elliptical dark-red regions (4#) as Cu-rich zones (up to 45.43 ± 0.79% Cu), and the central eutectic structure (5#) as a Ni-Fe-P eutectic phase.
During the preparation process of SSCP, elemental interdiffusion occurred. Line scanning characterization of the bonding interface is shown in
Figure 3. In the 304/45 specimen, Ni and Cr diffused from SS to CS, while Fe diffused from CS to SS. In the 304/NiP/45 specimen, Ni diffused from the interlayer to both bonded metals, and Cr diffused from SS through the entire interlayer into CS. Fe in CS diffused into the interlayer, while Fe from SS was also observed to migrate toward the interlayer, and Fe enrichment was observed at the interface on both sides of the interlayer. Notably, no diffusion of P into either bonded metal was detected. For the 304/NiCuP/45 specimen, both Ni and Cu diffused from the interlayer to the bonded metals, while Cr diffused from the SS into the interlayer and further into CS. Concurrently, Cu enrichment was observed at both interlayer interfaces. Similarly, no diffusion of P into the bonded metals occurred. As a non-carbide-forming element, Cu effectively blocked C diffusion. The enrichment of Cu at interlayer interfaces created two barrier layers, which may explain the superior C-blocking performance of the NiCuP interlayer compared to the NiP interlayer.
To investigate the elemental composition of precipitates in SS cladding of SSCP, mapping was used to analyze the elemental distribution at the grain boundaries of SS cladding.
Figure 4 shows the elemental mapping results of the grain boundaries in the SS cladding of the 304/45 specimen.
Figure 4(a1) showed coarse-grain boundaries, which indicated substantial precipitation and enrichment of precipitates along the grain boundaries. From
Figure 4(a2–a4), inhomogeneous distributions of C, Cr, and Fe across the grain boundaries were evident. Specifically, C and Cr were enriched at the grain boundaries, while Fe exhibited depletion in these regions.
The mapping results of the SS cladding grain boundaries of the 304/NiP/45 specimen are shown in
Figure 5(a1). Precipitates were mainly concentrated on the grain boundaries, but the significant reduction in grain boundary width indicated a substantial decrease in precipitate formation. Further observation of
Figure 5(a2–a4) revealed clear enrichment of C and Cr at the grain boundaries, while Fe exhibited depletion in these regions. For the 304/NiCuP/45 specimen,
Figure 5(b1) displays the elemental mapping of SS cladding, showing clean grain boundaries with further reduced width. From the elemental distribution in
Figure 5(b2–b4), C was uniformly distributed across and around the grain boundaries without enrichment or depletion. Although Cr showed slight enrichment at the grain boundaries, the extent was relatively minor. Similarly, Fe depletion at the grain boundaries was observed, but to a lesser degree compared to the 304/NiP/45 specimen.
The elemental composition of the marked precipitates in SEM images was analyzed by EDS, the results of which are listed in
Table 4. In the 304/45 specimen, grain boundary regions (1#) exhibited substantially higher chromium (66.7 ± 0.9%) contents compared to grain interior regions (2#), demonstrating that precipitates were predominantly Cr-rich carbides. Similar elemental segregation patterns were observed in the 304/NiP/45 specimens, where grain boundary precipitates (3#) maintained elevated Cr levels relative to adjacent grain interiors (4#). In contrast, the 304/NiCuP/45 specimen showed only minimal chromium enrichment observed at boundary regions. The intergranular corrosion susceptibility of austenitic SS fundamentally arises from carbide precipitation along grain boundaries and subsequent Cr-depleted zone formation [
23]. Thus, combined with the above EDS analysis results, it can be concluded that precipitates in SS cladding were mainly Cr-rich carbides, which preferentially precipitate along the grain boundaries.
3.3. Electrochemical Testing
The DL-EPR test was used to evaluate a DOS of SS cladding, aiming to investigate the effect of interlayer addition on the intergranular corrosion resistance of SS cladding in SSCP, as shown in
Figure 7. The electrochemical parameters obtained according to DL-EPR tests were summarized in
Table 5. The results indicated that 304/45 specimens exhibited an activation current density (I
a) of 6.27 × 10
−2 A/cm
2 during the forward scan and a reverse current density (I
r) of 2.04 × 10
−2 A/cm
2 during the reverse scan, resulting in a DOS of 32.5%. The highest DOS value indicated severe C diffusion in the 304/45 specimen, where extensive Cr-rich carbide precipitation at grain boundaries led to Cr-depleted zones adjacent to boundaries. During the reverse scan in the reactivation region, these Cr-depleted zones, which lacked protective passive films, underwent preferential corrosion, which elevated I
r and DOS [
26]. In contrast, the 304/NiP/45 specimen showed a DOS of 24.1%, significantly lower than 304/45. However, the reactivation current I
r remained relatively high, indicating substantial degradation of Cr-depleted zones during reverse scanning and incomplete passivation film formation [
27]. This suggested that while the NiP interlayer partially blocked C diffusion, significant C migration still occurred. For the 304/NiCuP/45 specimen, the reactivation current during the reverse scan was negligible, with no discernible reactivation peak in the curve, yielding an extremely low DOS of 0.25%. This minimal DOS confirmed that the NiCuP interlayer effectively suppressed C diffusion, preventing chromium depletion and enabling the formation of a continuous passivation film on SS cladding [
28]. Consequently, the 304/NiCuP/45 specimen exhibited optimal intergranular corrosion resistance.
As can be seen in
Figure 8, the corrosion morphology of specimens was shown after DL-EPR tests. The difference in corrosion morphology under SEM was basically consistent with the difference in DOS values. As observed in
Figure 8a, numerous holes were present at grain boundaries, forming a network trench structure. This phenomenon was attributed to 304/45 SSCP exhibiting a high DOS of 32.5%, which indicated severe intergranular sensitization. The corrosion of carbides at grain boundaries generated abundant holes, which subsequently coalesced into the observed trench network.
Figure 8b revealed that 304/NiP/45 SSCP also exhibited numerous holes at grain boundaries, though only localized regions developed network trenches, with its DOS reduced to 24.1%. In contrast,
Figure 8c demonstrated well-defined grain boundaries in 304/NiCuP/45 SSCP, where the DOS was significantly lowered to 0.25%, showing negligible intergranular corrosion.
Figure 9 shows the potentiodynamic polarization curves of SS cladding in SSCP immersed in 3.5 wt.% NaCl solution.
Table 6 lists the electrochemical parameters, including corrosion potential (E
corr), corrosion current density (I
corr), and pitting potential (E
pit). The results demonstrated that 304/45 specimens exhibited the lowest E
pit (0.178 V) and the highest I
corr(0.605 μA/cm
2), attributed to severe C diffusion in SSCP. Cr was the primary constituent of the passive film in SS cladding. The precipitation of Cr-rich carbides induced the formation of Cr-depleted zones adjacent to grain boundaries, thereby compromising the integrity of the passive film and resulting in diminished corrosion resistance [
29]. In contrast, the 304/NiP/45 specimen showed a higher E
pit (0.196 V) and lower I
corr (0.212 μA/cm
2). This was attributed to the NiP interlayer, which effectively blocked C diffusion, thereby partially suppressing the precipitation of Cr-rich carbides. Further comparative analysis revealed that the 304/NiCuP/45 specimen exhibited the highest E
pit (0.336 V) and the lowest I
corr (0.086 μA/cm
2). This was attributed to the NiCuP interlayer effectively blocking C diffusion, which suppressed Cr-rich carbide precipitation and thereby inhibited the formation of Cr-depleted zones [
30]. As a result, a continuous and dense passive film formed on the SS cladding, which effectively blocked the intrusion of corrosive species.
Figure 10 shows the corrosion morphology of SS cladding after potentiodynamic polarization test in 3.5 wt.% NaCl solution. As shown in
Figure 10a, honeycomb-shaped pits surrounded by numerous smaller pits were observed on the SS cladding surface of the 304/45 specimen. Next, EDS spectral analysis was conducted on the uncorroded location 1# at the edge of the corrosion pit. High contents of Fe (58.8 ± 1.12%), Cr (18.78 ± 1.83%), and O (8.16 ± 0.23%) were detected at location 1#. At location 2# inside the corrosion pit, up to 83.76% Fe element was detected, along with a small amount of Cr element (4.51 ± 0.38%), and Cl element (5.13 ± 0.69%) was additionally detected. Compared to location 1#, the Cr element content inside the corrosion pit significantly decreased, while the Fe element content significantly increased. This indicated that Cl
− in solution first attacked the defective sites of the passive film, then penetrated the passive film to come into contact with the metal substrate, thereby triggering pitting corrosion.
Figure 10b presents the corrosion morphology of the 304/NiP/45 specimen, where severe pitting corrosion was also evident on the SS cladding surface.
Figure 10c illustrates the corrosion morphology of the SS cladding in the 304/NiCuP/45 specimen. As shown in the figure, the surface of the SS cladding exhibited virtually no visible corrosion pits. This observation further confirmed that the 304/NiCuP/45 specimen exhibited the optimal corrosion resistance in 3.5 wt.% NaCl solution environment.
EIS results of SS cladding in 3.5 wt.% NaCl solution is shown in
Figure 11. The Nyquist plots were fitted using the equivalent circuit illustrated in
Figure 11b, which consists of three components: the combined solution resistance (R
s) of electrode and electrolyte, double layer capacitance (CPE), and charge transfer resistance (R
f) at the electrode/electrolyte interface. The fitting results of these parameters are summarized in
Table 7. As observed in
Figure 11a, all specimens exhibited a single semicircular capacitive arc. A larger capacitive arc radius corresponded to a denser passive film on the material surface. R
f, which reflected the kinetics of electrode reactions, was inversely related to corrosion rate−higher R
f values indicated better corrosion resistance [
31]. The results revealed that 304/45 specimens have the smallest capacitive arc radius and the lowest R
f (1.19 × 10
5 Ω·cm
2), indicating the incomplete passive film and the poorest corrosion resistance. In contrast, specimens with interlayers showed increased capacitive arc radius and R
f values, suggesting improved passive film integrity as carbide precipitation decreases. 304/NiCuP/45 specimen exhibited the largest capacitive arc radius and the highest R
f (8.51 × 10
5 Ω·cm
2). This maximum R
f signifies the strongest inhibition of charge transfer at the electrode/electrolyte interface, resulting in the slowest corrosion rate and optimal corrosion resistance.
The passive film formed on SS cladding in 3.5 wt.% NaCl solution typically exhibited semiconductor properties, and the semiconducting characteristics of this passive film directly influence the corrosion resistance of SS cladding [
32]. These semiconductor properties could be evaluated by using Mott–Schottky curves.
Figure 12 shows the M−S curves of SS cladding in 3.5 wt.% NaCl solution, with calculated carrier density (N
D) values derived from
Figure 12 listed in
Table 8. The figure reveals that within the potential range of −0.4 to 0.2 V, the positive slope of the curve indicates n−type semiconductor behavior in the passive film of SS cladding. According to the point defect model, oxygen vacancies dominate as the primary defect in n−type semiconducting passive films. When such passive films were exposed to Cl
−—containing environments, oxygen vacancies reacted with Cl
− ions to generate new oxygen vacancies. These newly formed vacancies further react with Cl
−, creating a self-accelerating cycle of vacancy generation. The accumulation of oxygen vacancies introduces structural defects that degrade the integrity of the passive film at the SS surface. As shown in
Table 8, the 304/45 specimen exhibits the highest N
D (46.85 × 10
18 cm
−3) in its SS cladding, indicating that the passive film formed in 3.5 wt.% NaCl solution contains the highest concentration of defects. Specimens with interlayers showed reduced N
D values to varying degrees. Notably, the 304/NiCuP/45 specimen achieved the lowest N
D (3.02 × 10
18 cm
−3), signifying the slowest charge transfer kinetics at the SS surface and formation of the passive film with minimal defects and optimal density in 3.5 wt.% NaCl solution [
33]. Mott–Schottky test results aligned with conclusions derived from EIS analysis.
Figure 13 shows a schematic diagram of corrosion of the SS side of SSCP with added NiCuP interlayer in 3.5 wt.% NaCl solution. The passive film of SS consists mainly of Cr
2O
3 [
34]. In the case of 304/45, substantial carbon diffusion from the CS side to the SS side led to the formation of Cr
23C
6 carbides through chromium segregation [
35]. This produced a large number of Cr-depleted zones along the grain boundaries of SS, which resulted in SS cladding not forming a complete passive film. Consequently, Cl
− could invade the passive film on the surface of SS cladding and corrode at defective locations on the film surface, which forms pitting pits in 3.5 wt.% NaCl solution. After the addition of the NiCuP interlayer, since Cu was a non-carbide forming element and enriched on both sides of the interlayer, the NiCuP interlayer blocked the diffusion of most C atoms. As a result, SS cladding hardly formed any Cr-depleted zones and could still develop a complete and dense passive film, resulting in significantly enhanced corrosion resistance.


